Embed Size (px)
Citation preview

Assessment of the Summer Sport Fishery for Walleye (Sander vitreus) and Northern
Pike (Esox lucius) at Orloff Lake,
CONSERVATIONCONSERVATION
REPORT REPORT
SERIESSERIES
Alberta, 2004

CONSERVATIONCONSERVATION
REPORT REPORT
SERIESSERIES 25% Post Consumer Fibre
When separated, both the binding and paper in this document are recyclable
The Alberta Conservation Association is a Delegated Administrative Organization under Alberta’s Wildlife Act.

Assessment of the Summer Sport Fishery for
Walleye (Sander vitreus) and Northern Pike
(Esox lucius) at Orloff Lake, Alberta, 2004
Bill Patterson
Alberta Conservation Association
#111, 4999-98 Avenue, Twin Atria Building
Edmonton, Alberta, Canada
T5R 2X3
Report Series Co-editors PETER K.M AKU GARRY J. SCRIMGEOUR
Alberta Conservation Association Alberta Conservation Twin Atria Building P.O. Box 40027 #111, 4999 – 98 Avenue Baker Centre Postal Outlet Edmonton, AB, T6B 2X3 Edmonton, AB, T5J 4M9 Conservation Report Series Types: Data & Technical
ISBN printed: 0-7785-4121-5 ISBN online: 0-7785-4122-3 ISSN printed: ISSN online: Publication Number: T/093
Disclaimer: This document is an independent report prepared by the Alberta Conservation Association. The authors are solely responsible for the interpretations of data and statements made within this report. Reproduction and Availability: This report and its contents may be reproduced in whole, or in part, provided that this title page is included with such reproduction and/or appropriate acknowledgements are provided to the authors and sponsors of this project.
Suggested citation: Patterson, B. 2005. Assessment of the summer sport fishery for walleye (Sander vitreus)
and northern pike (Esox lucius) at Orloff Lake, Alberta, 2004. Data Report (D-2005-007), produced by Alberta Conservation Association, Edmonton, Alberta, Canada. 27 pp. + App.
Cover photo credit: David Fairless
Digital copies of conservation reports can be obtained from: Alberta Conservation Association P.O. Box 40027, Baker Centre Postal Outlet Edmonton, AB, T5J 4M9 Toll Free: 1-877-969-9091 Tel: (780) 427-5192 Fax: (780) 422-6441 Email: [email protected] Website: www.ab-conservation.com
i

EXECUTIVE SUMMARY To maintain and recover Alberta's walleye and pike fisheries, Alberta Sustainable
Resource Development (ASRD) developed and implemented new management
strategies in 1996 for walleye and in 1999 for northern pike (hereafter pike). Orloff
Lake, located north of Athabasca, Alberta, was classified as having a vulnerable walleye
fishery between 1996 and 2004 (Alberta Guide to Sportfishing Regulations 1996 and
2004). This classification resulted in the implementation of a regulation that allowed
anglers to harvest three walleye (daily maximum bag limit) with a minimum size limit
of 50 cm total length (TL). From 1999 to 2004, the pike fishery was classified as a stable-
recreational fishery, allowing sport anglers to harvest three pike (daily maximum bag
limit) with a minimum size limit of 63 cm TL.
Alberta Conservation Association (ACA) creel surveys are conducted in support of the
management of Alberta’s sport fisheries. Creel surveys provide the field data that are
used by ASRD to manage sport fisheries and support management strategies. ASRD
walleye and pike management strategies are based on estimates of how harvest
pressure can alter the impact of management decisions (Berry 1995). Since the
inception of ASRD’s walleye and pike management strategies, the sport fishery at
Orloff Lake has not been assessed by neither ASRD nor ACA. Anecdotally, the lake
was reportedly receiving increased angling pressure over historic levels. Hence, ASRD
requested that ACA conduct a creel survey during the summer of 2004 to provide an
estimate of angler effort and stock yields for walleye and pike. Based on angler
interviews conducted between 23 May and 16 August 2004, an estimated 488 anglers
(95% CI = 361 - 663, n = 202) fished Orloff Lake for 1,749 h (95% CI = 1,285 - 2,404,
n = 684) for an angling pressure of 0.95 angler-hrs/ha (95% CI = 0.70 - 1.31).
Estimated angler harvest of walleye was 286 fish (95% CI = 186 - 429, n = 120), which
had an estimated mean weight of 1.544 kg (95% CI = 1.419 - 1.676 kg) per fish. This
produced an estimated yield of 0.24 kg/ha (95% CI = 0.16 - 0.37). Anglers released an
estimated 697 walleye (95% CI = 451 - 1,085, n = 257), for an estimated total yield
(harvest + hooking mortality) of 0.25 kg/ha (95% CI = 0.220 - 0.399).
ii

Estimated angler harvest of pike was 106 fish (95% CI = 67 - 170, n = 40), with a mean
weight of 1.980 kg (95% CI = 1.772 - 2.223 kg) per fish. This produced an estimated
yield of 0.12 kg/ha (95% CI = 0.07 - 0.18). Anglers reported a pike release rate of
0.367 fish/h, which translates to an estimated catch and release of 1,293 pike
(95% CI = 1,022 - 1,667, n = 322). The estimated total yield of pike was 0.15 kg/ha
(95% CI = 0.11 - 0.22).
iii
ACKNOWLEDGEMENTS
The Alberta Conservation Association (ACA) funded this creel survey. The creel clerks
made an essential contribution to this project: Tara Lantz, Michelle Wells and James
Witzke who creeled Orloff Lake. Seasonal staff members were challenged on more
than a few occasions by the ATV ride into Orloff Lake and numerous boat maintenance
issues. Thanks to Chris Davis and Daryl Watters (ASRD Fisheries Staff) for test angling
Orloff Lake.
The ACA would also like to acknowledge Alberta Sustainable Resource Development
(ASRD) for use of their cabin on Orloff Lake by the crewmembers, Human Resources
and Development Canada for seasonal staff funding, and The Fishin’ Hole store for
providing discounts on angling equipment.
iv


TABLE OF CONTENTS
EXECUTIVE SUMMARY.............................................................................................. ii
ACKNOWLEDGEMENTS...........................................................................................iv
LIST OF FIGURES.........................................................................................................iii
LIST OF TABLES............................................................................................................v
LISIT OF APPENDICES ...............................................................................................vi
1.0 INTRODUCTION ............................................................................................. 1
1.1 General introduction......................................................................................... 1 1.2 Study rationale .................................................................................................. 2
2.0 STUDY AREA.................................................................................................... 2
3.0 MATERIALS AND METHODS ...................................................................... 4
3.1 Survey design .................................................................................................... 4 3.2 Creel survey ....................................................................................................... 4 3.3 Lake activity surveys ........................................................................................ 5 3.4 Test angling........................................................................................................ 6 3.5 Biological fish data............................................................................................ 7 3.6 Data management and analysis ...................................................................... 7
4.0 RESULTS .......................................................................................................... 11
4.1 Angler survey .................................................................................................. 11 4.2 Walleye harvest and yield ............................................................................. 14 4.3 Northern pike harvest and yield................................................................... 16 4.4 Walleye sport fishery assessment ................................................................. 18 4.5 Northern pike sport fishery assessment ...................................................... 22 4.6 Stock status summary..................................................................................... 24
5.0 REFERENCES CITED..................................................................................... 26
6.0 APPENDIX....................................................................................................... 28
ii

LIST OF FIGURES Figure 1. Location of Orloff Lake and the 2004 creel survey site. ....................................3
Figure 2. Flow chart outlining the process used for estimating parameters from the sport fishery at Orloff Lake 2004. ................................................................10
Figure 3. Standardized probability density function of anglers at Orloff Lake in 2004.........................................................................................................................12
Figure 4. Standardized probability density function of angler-hours at Orloff Lake in 2004. ...................................................................................................................12
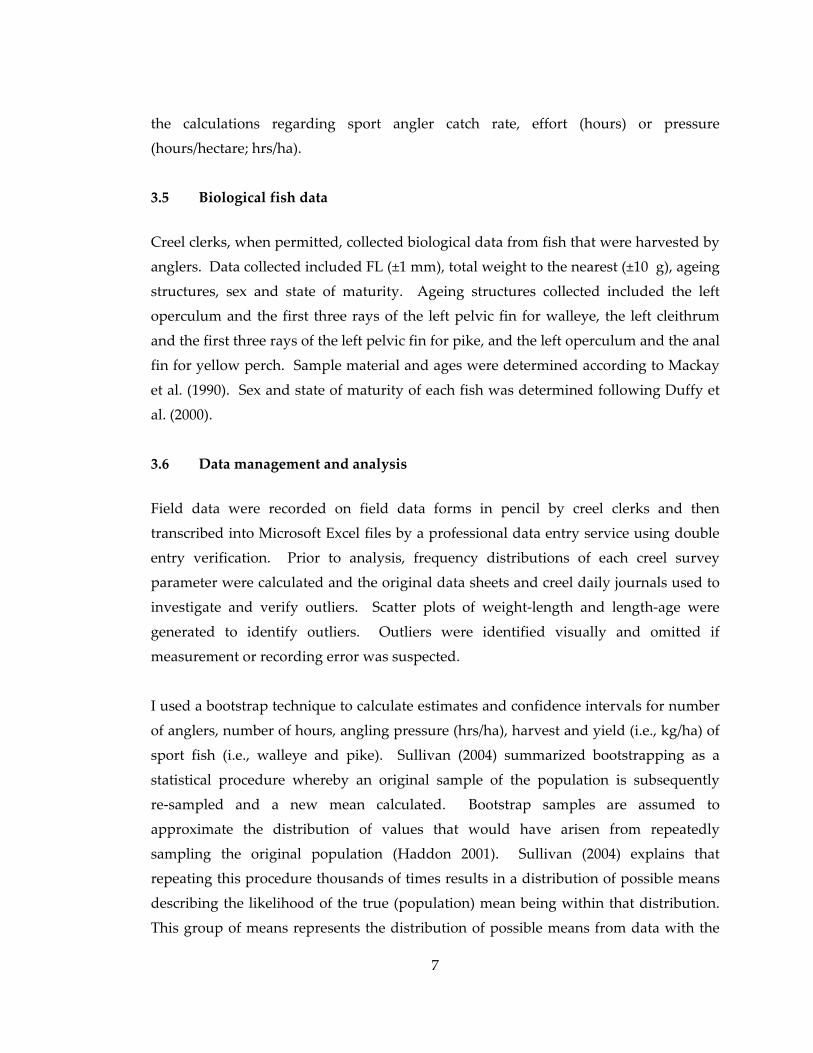
Figure 5. Standardized probability density function of angling pressure at Orloff Lake in 2004...........................................................................................................13
Figure 6. Lakes creel surveyed during the 1990’s and the number of anglers estimated during the survey periods.................................................................13
Figure 7. Standardized probability density function of the number of walleye harvested during the sport fishery at Orloff Lake in 2004 .............................14
Figure 8. Standardized probability density function of the yield of walleye harvested during the sport fishery at Orloff Lake in 2004. ............................15
Figure 9. Standardized probability density function of the number of reported released walleye during the sport fishery at Orloff Lake in 2004 and the corrected number of reported released walleye. .............................................16
Figure 10. Standardized probability density function of the number of northern pike harvested during the sport fishery at Orloff Lake in 2004.....................17
Figure 11. Standardized probability density function of the yield of northern pike harvested during the sport fishery at Orloff Lake in 2004. ............................18
Figure 12. Age-class distribution of walleye sampled from the sport harvest during the creel survey and test sampling during the summer of 2004 at Orloff Lake. ......................................................................................................................19
Figure 13. Length-at-age (logarithmic line-of-best-fit) of the 2004 sport harvest and test angling samples.............................................................................................20
Figure 14. Age-at-maturity of male walleye from Orloff Lake in 2004 ...........................21
Figure 15. Age-at-maturity of female walleye from Orloff Lake in 2004. .......................21
Figure 16. Age-class distribution of northern pike captured by sport anglers during the Orloff Lake creel survey and test angling. .................................................23
iii

Figure 17. Length-at-age (logarithmic line-of-best-fit) of the 2004 sport harvest and test angling samples.............................................................................................23
iv

LIST OF TABLES Table 1. Summary of the lake activity surveys during each temporal stratum
conducted at Orloff Lake 2004...............................................................................6 Table 2.. Summary of observed, reported, and estimated catch rates of anglers from
summer surveys conducted at Orloff Lake in 2004. .........................................11
v

LISIT OF APPENDICES
Appendix 6.1 An example of a creel survey field form..................................................28
Appendix 6.2 Orloff Lake 2004 angler survey daily summary data. .........................29
Appendix 6.3 Angling effort and catch data collected during lake activity surveys. ........................................................................................................................30
Appendix 6.4 Biological data collected from sport angler-harvested fish at Orloff Lake. ..............................................................................................................31
Appendix 6.5 Sample number, species, fork lengths and total lengths of fish captured during test angling at Orloff Lake (2004). ...............................35
vi


1.0 INTRODUCTION 1.1 General introduction Management strategies for walleye (Sander vitreus) and northern pike (Esox lucius,
hereafter pike) prior to 1996 and 1999, respectively, focused on province-wide
regulations designed to manage harvest at fisheries experiencing average exploitation
rates. Fisheries receiving heavier than average exploitation had not been adequately
protected with these regulations and many have declined or collapsed. Evidence
suggests heavier than average exploitation can be attributed to a disproportionately
high number of anglers exploiting fishing opportunities at relatively few lakes. Prior to
1995, high numbers of anglers per lake (312.5 anglers/ha, mid-1990s), combined with
high fish harvests, resulted in the over-harvest of many fish populations in Alberta
(Sullivan 2003a). To aid the recovery of these fisheries, two new management strategies
were implemented in 1996 (Alberta’s Walleye Management Recovery Plan) (Berry 1995)
and 1999 (Alberta’s Northern Pike Management and Recovery Plan) (Berry 1999).
Through the strategies identified in these two recovery plans, the fishery at each lake
was assessed and assigned a status category (i.e., collapsed, vulnerable, or stable),
based on estimates of angler pressure, yield, and population structure. The sport
fishing regulation (for walleye or pike) was then modified by Alberta Sustainable
Resource Development (ASRD) based on the status rating (Sullivan 1998).
In 1996, the Walleye Management and Recovery Plan (WMRP) was implemented and
Orloff Lake was subsequently classified as a vulnerable walleye fishery (Berry 1995).
This classification resulted in a regulation that permitted anglers to harvest three
walleye (daily maximum bag limit) each with a minimum size limit of 50 cm total
length (TL).
Based on the 1999 Northern Pike Management and Recovery Plan (NPMRP) a
province-wide sport fishing regulation was implemented thereby classifying the
majority of pike fisheries, including Orloff Lake, as stable-recreational fisheries (Berry
1999). A stable-recreational classification permitted sport anglers to harvest three pike
(daily maximum bag limit) each with a minimum size limit of 63 cm TL. In 2001,
Alberta Fisheries, based on public consultation (Daryl Watters, Alberta Sustainable
1

Resource Development, Edmonton, Alberta, pers. comm.), modified the sport fishing
regulation to a daily harvest of one pike >63 cm TL.
1.2 Study rationale
The 2004 creel survey at Orloff Lake was the first angler survey at this lake known to
the author. With Alberta’s increasing population and increasing accessibility into
remote fisheries, discussions between Alberta Conservation Association (ACA) and
ASRD suggested it was timely and important to survey the walleye and pike fisheries
at Orloff Lake. As a result, a project was jointly developed by the ACA and ASRD to
collect data to update the current walleye and pike classification at Orloff Lake. To that
end, the ACA conducted a summer creel survey at Orloff Lake during 2004. Creel
surveys are a non-invasive technique that can effectively estimate the parameters
required (e.g., angler use, sport fish yield and sport fishery structure) for management.
The purpose of the survey was to evaluate the status of walleye and pike fisheries at
Orloff Lake and provide ASRD with current data describing these fisheries for the
summer of 2004.
2.0 STUDY AREA
Orloff Lake is located in the Athabasca River drainage, approximately 90 km north of
Athabasca, Alberta (Figure 1). It has a surface area of 1,830 ha (ASRD and Alberta
Environment Unpublished data) and access is by all-terrain-vehicle (e.g., quad) along
cut lines. The major inlet, Drowned Horse Creek, flows into Orloff Lake from the
northeast. The lake is drained at the southwest end via Otter Creek, which flows into
Otter Lake. There is no anthropogenic development at the lake except for a few rustic
camping areas and a trappers cabin. An ASRD Fish and Wildlife Officers’ (FWO) cabin
is located on the south shore of Orloff Lake.
2

Edmonton
Calgary
Red Deer
Athabasca
Orloff Lake
Edmonton
Calgary
Red Deer
Athabasca
Orloff Lake
Edmonton
Calgary
Red Deer
Athabasca
Orloff Lake
2 km
Figure 1. Location of Orloff Lake, Alberta and the 2004 creel survey site. The location of the creel camp (FWO cabin) is indicated by the black dot. The majority of the access is along the cut lines directly south of the creel camp.
3

3.0 MATERIALS AND METHODS 3.1 Survey design From 23 May to 16 August 2004 an access site survey (Pollock et al. 1994) was
conducted at a single access point at Orloff Lake. The access point to the lake was a trail
head located near the ASRD Fish and Wildlife Officers (FWO) cabin. Two creel clerks
interviewed anglers as they returned from completed trips of angling. Eleven lake
activity surveys were also conducted throughout this survey period. Test angling was
conducted throughout the survey period to collect additional information on the size
distribution of walleye and pike populations.
3.2 Creel survey
3.2.1 Angler interviews
Upon returning to the survey access point, all angling parties were asked a series of
questions regarding the number of hours fished, number of each species kept and
released, the number of anglers, angling method, targeted species, use of electronics,
use of barbless hooks and residence. These data were recorded on a creel survey data
form (Appendix 6.1). Creel clerks made a subjective evaluation of each angler’s skill
level. Children and anglers that lacked equipment and knowledge regarding fishing
were classified as novices. Anglers that demonstrated clear superiority in equipment
and knowledge were classified as professionals. All other anglers were considered to
have moderate skill.
3.2.2 Spatial extent of survey
This access site creel survey was conducted at a trailhead located near the ASRD FWO
cabin at Orloff Lake, which is located on the south shore. Access points not surveyed
included trailheads and a few campgrounds located around the lake.
4

3.2.3 Temporal extent of sampling The creel survey was stratified into weekdays (Monday-Thursday) and weekend days
(Friday-Sunday and statutory holidays). Each day was surveyed from 0830 to 2300
hours. All anglers who returned from fishing to the trailhead located near the ASRD
FWO before 0830 or after 2300 were not interviewed. Survey dates and summary
information are listed in Appendix 6.2. Surveys were conducted for five consecutive
days during a 14-day rotation, repeating this schedule seven times throughout the
summer.
3.3 Lake activity surveys
Lake activity surveys provide a site-use ratio (e.g., 72 anglers out of 92 interviewed
used the access site surveyed as their landing site; Appendix 6.3) that is used to
extrapolate creel survey parameters (e.g., number of anglers, number of hours, number
of fish caught) to temporal and spatial strata that are not surveyed. Lake activity
surveys include interviewing anglers on the lake as they were randomly encountered
by boat. The lake activity interview was identical to the access site interview but
includes the location of angler party landing (i.e., where the boat is going to touch shore
at the end of the angling trip). The surveys had a temporal stratification of weekdays
and weekend days and two shifts (i.e., 0800 - 1530 and 1530 - 2300) that reflected angler
use. Table 1 summarizes the number of surveys per stratum. Eleven lake activity
surveys were conducted during the survey period. For safety, lake activity surveys
were completed by two crewmembers.
5

Table 1. Summary of the lake activity surveys during each temporal stratum conducted at Orloff Lake 2004. Survey day (i.e., weekday / weekend day), and survey shift (i.e., 08:00-15:30 / 15:30-23:00).
Day strata Shift strata Number of lake activity
surveys per strata Weekdays 0800 - 1530 1
1530 - 2300 2 Weekend day 0800 - 1530 3
1530 - 2300 5
3.4 Test angling
Since sport anglers were required to release walleye and pike that were shorter than the
minimum size limit (walleye 50 cm, pike 63 cm TL), creel clerks could not obtain any
information regarding these protected-length fish. Hence, test angling was conducted
throughout the survey period to collect additional information on the size frequency
distribution of walleye and pike populations. Test angling consisted of creel clerks as
well as ACA and ASRD fisheries staff, all with varying skill levels, fishing Orloff Lake
for walleye and pike using lures, baits, and adopting techniques that would normally
be used in the sport fishery. Test anglers recorded the number of hours fished, and the
fork length (FL, ±1mm), of all fish caught. Ageing structures collected included the first
three rays of the left pelvic fin for walleye and pike. All fish caught during the test
fishery were released. To reduce handling time, weights from test fishery-sampled fish
were not collected. Therefore, weight was estimated using a length-weight regression
(WT = (1E-05)(FL)(2.9941), r2 = 0.91, df = 8 97, P < 0.001) after applying a FL to TL
conversions. The ratio of legal-length fish to protected-length fish sampled during the
test fishery was assumed to be equal to the corresponding ratio from the sport fishery
(Sullivan 2003b). These ratios were compared to determine the angler exaggeration
rate, and to estimate the total catch rates for walleye and pike. Calculated weights of
fish caught during the test fishery were applied to incidental mortality and total yield
calculations. The catch rate calculated from the test fishery was not included in any of
6
the calculations regarding sport angler catch rate, effort (hours) or pressure
(hours/hectare; hrs/ha).
3.5 Biological fish data
Creel clerks, when permitted, collected biological data from fish that were harvested by
anglers. Data collected included FL (±1 mm), total weight to the nearest (±10 g), ageing
structures, sex and state of maturity. Ageing structures collected included the left
operculum and the first three rays of the left pelvic fin for walleye, the left cleithrum
and the first three rays of the left pelvic fin for pike, and the left operculum and the anal
fin for yellow perch. Sample material and ages were determined according to Mackay
et al. (1990). Sex and state of maturity of each fish was determined following Duffy et
al. (2000).
3.6 Data management and analysis
Field data were recorded on field data forms in pencil by creel clerks and then
transcribed into Microsoft Excel files by a professional data entry service using double
entry verification. Prior to analysis, frequency distributions of each creel survey
parameter were calculated and the original data sheets and creel daily journals used to
investigate and verify outliers. Scatter plots of weight-length and length-age were
generated to identify outliers. Outliers were identified visually and omitted if
measurement or recording error was suspected.
I used a bootstrap technique to calculate estimates and confidence intervals for number
of anglers, number of hours, angling pressure (hrs/ha), harvest and yield (i.e., kg/ha) of
sport fish (i.e., walleye and pike). Sullivan (2004) summarized bootstrapping as a
statistical procedure whereby an original sample of the population is subsequently
re-sampled and a new mean calculated. Bootstrap samples are assumed to
approximate the distribution of values that would have arisen from repeatedly
sampling the original population (Haddon 2001). Sullivan (2004) explains that
repeating this procedure thousands of times results in a distribution of possible means
describing the likelihood of the true (population) mean being within that distribution.
This group of means represents the distribution of possible means from data with the
7

same scale of variation as observed in the original data set. Frequentist parameter
estimates (e.g., means) are typically equal to maximum-likelihood estimates (MLE) for
the parameters of the specified probability density function (Gotelli 2004). Empirical
confidence intervals (95% CI) were calculated following Haddon (2001). The final
proportions (i.e., probability densities) were standardized to range between 0 and 1
(Paul et al. 2003).
Each site-use ratio (e.g., 72 anglers out of 92 interviewed used the access site being
surveyed as their landing site) collected from the lake activity surveys, as a binomial
probability, has a range of variation. I simulated this binomial (using Microsoft Excel’s
Random Number Generation), thereby creating a list of possible site-use ratios, with a
range of variation that is correlated to the size of the original data sample (Sullivan
2004).
Each parameter that was obtained from creel survey data (e.g., number of anglers,
number of hours, number of fish caught, kg/ha) was estimated to include spatial and
temporal strata that were not surveyed. Each parameter and estimate is presented as a
likelihood profile, using the simulation procedure described above and combined by
multiplying the likelihood profiles. A flow chart describing the steps for calculating
estimates for each creel site and for the survey is presented in Figure 2.
8

Site Estimate
Weekend meane.g., # hours +x
# Weekend days not surveyed
Sum of weekend days
hours observed
+
Site estimatee.g., # hours
Weekend days estimate e .g., # hours=
Weekday meane.g., # hours +x
# Weekdays not
surveyed
Sum of weekday hours
observed
Weekdays estimate e .g., # hours=
=
x
Survey Estimate
Site-use ratioSurvey estimate e.g., # hours
Figure 2. Flow chart outlining the process used for estimating parameters collected from the creel site and extrapolated to a survey estimate for Orloff Lake, 2004. Circles represent values with no variance (i.e., observed data) and rectangles represent data with variation (i.e., likelihood profiles).
Hooking mortality likely contributes to the overall yield of sport fish. Hooking
mortality, or incidental mortality, was determined for walleye at Orloff Lake following
a multivariate analysis (Reeves 2004). Reeves (2004) used a linear regression approach
that included the covariates; month of capture, hooking location (e.g., stomach, gill,
inner mouth), capture depth and water temperature, length category of walleye caught,
angling gear (e.g., bobber, crank bait), and hook type (e.g., jig, treble) as explanatory
variables. The total harvest estimate was determined by applying the resulting hooking
mortality estimate (fish released X 3.6%) to the angler harvest estimate.
9

To quantify catch inequality among anglers for pike, Gini coefficients and angler
success rates were calculated (Baccante 1995). A Gini coefficient of 0 indicates all
anglers caught an equal amount of fish while a 1 indicates one person captured all fish.
To quantify size-class for pike, proportional stock density (PSD) and relative stock
density (RSD) classifications were calculated (Gablehouse 1984). The PSD is the
number of pike harvested that are equal to or greater than 530 mm TL, as a proportion
of pike that are 350 – 529 mm TL. A high PSD value indicates a larger portion of
mature fish, and therefore can be interpreted as reflecting a more stable population.
The RSD (stock-quality) is the proportion of pike caught between 350 and 529 mm TL
relative to the total number of pike greater than or equal to 350 mm TL.
Sport anglers were required to release pike less than 63 cm TL (protected-length fish),
therefore pike caught and sampled during test angling were used for RSD calculations.
All data were stored in the Fisheries Management Information System (FMIS) of
Alberta Sustainable Resource Development (ASRD).
10

4.0 RESULTS 4.1 Angler survey
While anglers had access to Orloff Lake from many points, we focused angler
interviews at the access point identified as the highest use area by ASRD Fish and
Wildlife Officers, Athabasca district office. Based on lake activity counts during the
survey period, 78% of all angling effort was conducted from this access site
(Appendix 6.3). In 2004, 202 anglers were interviewed between 23 May and 16 August
(Table 2). During this period the estimated number or maximum likelihood estimate
(MLE) of anglers was 488 (95% CI = 361 - 663, n = 202; Figure 3), with an estimated
effort of 1749 angler-hrs (95% CI = 1,285 - 2,404, n = 684; Figure 4) and angling pressure
of 0.95 angler-hrs/ha (95% CI = 0.70 - 1.31; Figure 5). By comparison to other Alberta
lakes surveyed in the 1990s, Orloff Lake received very low angling pressure (Figure 6).
A summary result of angler interviews is provided in Appendix 6.2.
Table 2. Summary of observed, reported, and estimated catch rates of anglers from summer surveys conducted at Orloff Lake in 2004.
Creel Data 2004
Number of days surveyed 34 Number of anglers interviewed 202 Number of angling hours reported 684.00 Walleye Data Kept/ angler-hour 0.175 Released legal-size/angler-hour 0.032
Released protected-size/angler-hour 0.344 Total walleye/angler-hour 0.551 Northern Pike Data Kept/ angler-hour 0.058 Released legal-size/angler-hour 0.104
Released protected-size/angler-hour 0.367 Total northern pike/angler-hour 0.529 Yellow Perch Data Kept/angler-hour 0 fish Released/angler-hour 0.004 (3 fish)
11

0
0.2
0.4
0.6
0.8
1
1.2
0 1000 2000 3000 4000 5000Number of anglers
Stan
dard
ized
Pro
babi
lty D
ensit
y
Orloff Lake Creel 2004
Figure 3. Standardized probability density function of anglers at Orloff Lake in 2004 (MLE = 488 anglers; 95% CI = 361 - 663).
0
0.2
0.4
0.6
0.8
1
1.2
0 1000 2000 3000 4000 5000Total angler-hours (hours)
Stan
dard
ized
Pro
babi
lty D
ensit
y
Orloff Lake Creel 2004
Figure 4. Standardized probability density function of angler-hours at Orloff Lake in 2004 (MLE = 1,749 angler-hrs; 95% CI = 1,285 - 2,404).
12
0
0.2
0.4
0.6
0.8
1
1.2
0.0 0.5 1.0 1.5 2.0 2.5 3.0 3.5 4.0 4.5 5.0 5.5 6.0 6.5 7.0Angling pressure (hours/hectare)
Stan
dard
ized
Pro
babi
lty D
ensit
y Orloff Lake Creel 2004
Figure 5. Standardized probability density function of angling pressure at Orloff Lake in 2004 (MLE = 0.95 hrs/ha; 95% CI = 0.70 - 1.31).
05
101520253035
Mar
ie '96
Nor
th B
uck '
98Ke
hiw
in '9
5Vi
ncen
t '97
Pine
'99
Burn
t '98
Touc
hwoo
d '92
Garne
r '96
LSA '9
5Ch
ristin
a '96
Calli
ng '9
6Sk
eleto
n '97
Floa
tings
tone
'97
Spen
cer '
92Orlo
ff '04
Wol
f '92
Prim
rose
'90
Seib
ert '
92To
uchw
ood
'94Be
aver
'98
Ironw
ood
'96
Lake and year
Estim
ated
ang
ling
hour
s/he
ctar
e
Figure 6. Lakes creel surveyed during the 1990s and 2000s and the angling pressure estimated during those survey periods (on average Victoria Day long weekend, mid-May, to late August). The textured bar and arrow indicates Orloff Lake 2004.
13

4.2 Walleye harvest and yield
Anglers harvested an estimated 286 walleye (95% CI = 186- 429, n = 120; Figure 7) at
Orloff Lake during the 2004 survey. Harvested walleye had a mean weight MLE of
1.544 kg per fish (95% CI = 1.419 - 1.676 kg), which produces a yield MLE of 0.24 kg/ha
(95% CI = 0.16 - 0.37; Figure 8). Given the current classification of vulnerable and the
related sport fishery regulation, the level of risk associated with the present sport yield
of walleye is low. Biological data collected from harvested walleye is provided in
Appendix 6.4.
0
0.2
0.4
0.6
0.8
1
1.2
0 100 200 300 400 500 600 700 800 900 1000Number of walleye harvested
Stan
dard
ized
Pro
babi
lty D
ensit
y
Orloff Lake creel 2004
Figure 7. Standardized probability density function of the number of walleye harvested during the sport fishery at Orloff Lake in 2004 (MLE = 286 walleye; 95% CI = 186 - 429).
14

0
0.2
0.4
0.6
0.8
1
1.2
0.0 0.2 0.4 0.6 0.8 1.0
Yield of walleye harvest (kg/ha)
Stan
dard
ized
Prob
abilt
yD
ensit
yOrloff Lake creel 2004
Recovery Equilibrium Decline
0
0.2
0.4
0.6
0.8
1
1.2
0.0 0.2 0.4 0.6 0.8 1.0
Yield of walleye harvest (kg/ha)
Stan
dard
ized
Prob
abilt
yD
ensit
yOrloff Lake creel 2004
Recovery Equilibrium Decline
Figure 8. Standardized probability density function of the yield (kg/ha) of walleye
harvested during the sport fishery at Orloff Lake in 2004. The categories (recovery, equilibrium and decline) of total allowable catch (TAC) were based on bootstrapped distributions of equilibrium and recovery yields from Alberta walleye fisheries categorized as vulnerable stocks (Sullivan 2004). The MLE of yield of walleye for the survey period was 0.24 kg/ha; 95% CI = 0.16 - 0.37).
Anglers released an estimated 697 walleye (95% CI = 451 - 1,085, n = 257; Figure 9).
According to Sullivan (2003b), angler exaggeration of walleye catch rates at 20 Alberta
lakes were negatively correlated with release rates. Based on this relationship between
reported protected-length walleye and exaggeration (Sullivan 2003b; y = 1.09x-0.28,
r2 = 0.66, df = 19, P < 0.001), the exaggeration factor was 1.47. This assumes the equation
stated above applies to Orloff Lake, and suggests anglers exaggerated their catch rates
by 47%. Taking this correction factor into account, the estimate of walleye released by
anglers would be 471 fish (95% CI = 309 - 726).
15

0
0.2
0.4
0.6
0.8
1
1.2
0 200 400 600 800 1000 1200 1400 1600 1800 2000Number of protected-length walleye reported released
Stan
dard
ized
Pro
babi
lty D
ensit
y
Orloff Lake creel 2004
Corrected for exaggeration
Figure 9. Standardized probability density function of the number of reported
released walleye during the sport fishery at Orloff Lake in 2004 (MLE = 694 fish; 95% CI = 451 - 1085) and the corrected number of reported released walleye (MLE = 475; 95% CI = 306 - 718).
By applying an incidental mortality of 3.6% and a mean weight of 0.527 kg (based on
test fishery data) for released walleye, the incidental mortality of walleye released by
anglers was 17 or 0.005 kg/ha. Therefore, the total sport yield of walleye (harvest plus
incidental mortality) was 303 walleye (0.25 kg/ha, 95% CI = 0.17 - 0.38). Based on the scarcity relationship (y = 1.25x-0.84, r2 = 0.66, df = 19, P < 0.01) between illegal
harvest of protected size walleyes and catch rate of protected length walleyes (Sullivan
2002), I estimate an illegal harvest of 3.0% at Orloff Lake in 2004. This suggests a minor
increase in the estimated yield of walleye. In comparison, the average illegal harvest
from 20 walleye fisheries was 18.4% (Sullivan 2002).
4.3 Northern pike harvest and yield
During the 2004 survey, the estimated harvest of pike was 106 (95% CI = 67 - 170, n = 40;
Figure 10). The mean weight MLE of harvested pike was 1.980 kg per fish
(95% CI = 1.772 - 2.223 kg), resulting in an estimated yield of 0.12 kg/ha 16

(95% CI = 0.07 - 0.18; Figure 11). Biological data collected from harvested pike is
presented in Appendix 6.4.
The MLE for the number of pike released was 1,293 (95% CI = 1022 - 1667, n = 322). I
assumed that pike released by the sport fishery had the same incidental mortality rate
as walleye (3.6%). Based on the mean weight of 1.418 kg per fish (based on the test
fishery), the incidental mortality was 46 pike or 0.04 kg/ha. Therefore, the total sport
yield of pike during the 2004 survey was estimated to be 152 pike (0.15 kg/ha,
95% CI = 0.11 - 0.22).
0
0.2
0.4
0.6
0.8
1
1.2
0 50 100 150 200 250 300 350 400Number of northern pike harvested
Stan
dard
ized
Pro
babi
lty D
ensit
y
Orloff Lake creel 2004
Figure 10. Standardized probability density function of the number of northern pike
harvested during the sport fishery at Orloff Lake in 2004 (MLE = 106 pike; 95% CI = 67 - 170).
17

0
0.2
0.4
0.6
0.8
1
1.2
0.0 0.1 0.2 0.3 0.4 0.5 0.6 0.7 0.8 0.9 1.0Yield of pike harvest (kg/ha)
Stan
dard
ized
Pro
babi
lty D
ensit
y
Orloff Lake creel 2004
Figure 11. Standardized probability density function of the yield (kg/ha) of northern
pike harvested during the sport fishery at Orloff Lake in 2004 (MLE = 0.12 kg/ha; 95% CI = 0.107 - 0.220).
4.4 Walleye sport fishery assessment
The following subsections are listed according to biological characteristics used by
ASRD in the determination of management status categories (i.e., stable, vulnerable,
collapsed). These categories are described in ASRD's Walleye Management and
Recovery Plan (Berry 1995).
4.4.1 Age-class distribution and stability
In 2004 at Orloff Lake, walleye displayed a wide age-class distribution with 15
age-classes derived from test angling (Appendix 6.5) and sport fishery, with
a mean age of 7.8 y (test angling only; Figure 12). There was no evidence of
recruitment or year class failures in this fishery, and the fishery was supported by more
than 8 age-classes.
18

0.00
0.01
0.02
0.03
0.04
0.05
0.06
0.07
0 1 2 3 4 5 6 7 8 9 10 11 12 13 14 15 16 17 18 19 20Age (y)
Cat
ch ra
te (w
alle
ye/h
)
Sport harvest 2004
Test angling 2004
Figure 12. Age-class distribution of walleye sampled from the sport harvest during the
creel survey and test sampling during the summer of 2004 at Orloff Lake. The test angling mean age was 7.8, n = 75.
4.4.2 Length-at-age
The growth rate (length-at-age) of walleye at Orloff Lake in 2004 was moderate,
according to the WMRP. Walleye grew to 50 cm FL in approximately 8 to 10 years
(Figure 13).
19

0
100
200
300
400
500
600
700
800
0 1 2 3 4 5 6 7 8 9 10 11 12 13 14 15 16 17 18 19 20Age (years)
Fork
leng
th (m
m)
Sport harvest 2004
Test angling 2004
Figure 13. Length-at-age (logarithmic line-of-best-fit) of the 2004 sport harvest (r2 =
0.31, n = 72) and test angling (r2 = 0.81, n = 75) samples.
4.4.3 Catch rate
Catch rates for kept walleye and reported released walleye were 0.175/h and 0.376/h,
respectively. The catch rate of legal-length walleye was 0.163/h. The reported
protected-length and the legal-length release rates for walleye were 0.344/h and 0.032/h,
respectively. Following Sullivan (2003b) and using the protected-length:legal-length
ratio from test angling (33:42), an estimated release rate of 0.243 walleye/h was
calculated. Therefore, the estimated total catch rate for walleye was 0.306/h.
4.4.4 Age-at-maturity
Data used to estimate the age-at-maturity distribution from sport-harvested walleye
were biased since the regulation requires the release of protected-length walleye. Legal
length walleye were first harvested at age 4 and all were mature for both male
(Figure 14) and female (Figure 15). The mean age of mature male and female walleye
was 13 and 18 y, respectively.
20

0
1
2
3
4
5
0 1 2 3 4 5 6 7 8 9 10 11 12 13 14 15 16 17 18 19 20Age (years)
Num
ber o
f wal
leye
Mature males
Figure 14. Age-at-maturity of male walleye in 2004 from Orloff Lake, Alberta. Mean
age = 13, n = 10.
0
1
2
3
4
5
0 1 2 3 4 5 6 7 8 9 10 11 12 13 14 15 16 17 18 19 20Age (years)
Num
ber o
f wal
leye
Mature females
Figure 15. Age-at-maturity of female walleye in 2004 from Orloff Lake, Alberta. Mean
age = 8, n = 16.
21

4.5 Northern pike sport fishery assessment
The status of the pike sport fishery was evaluated using the stock classifications
described in the Northern Pike Management and Recovery Plan (NPMRP; Berry 1999)
and criteria listed in Sullivan (1998).
4.5.1 Catch rate
The total reported catch rate of pike during the creel survey in 2004 was 0.529 pike/h.
The observed catch rate of the 25 legal-length pike (>63 cm TL) harvested was 0.044
fish/h. The reported release rate was 0.367 pike/h. The catch rate of pike >63 cm that
were kept corresponds to a collapsed pike fishery, whereas the total reported catch rate
indicates a vulnerable (no risk) pike fishery, according to Berry (1999). Sullivan (2003b)
warns that very low catch rates reported by anglers are exaggerated. Following
Sullivan and using the protected-length to legal-length ratio from test angling, I
estimated a release rate of 0.040/h. Therefore, the estimated total catch rate for pike was
0.094/h.
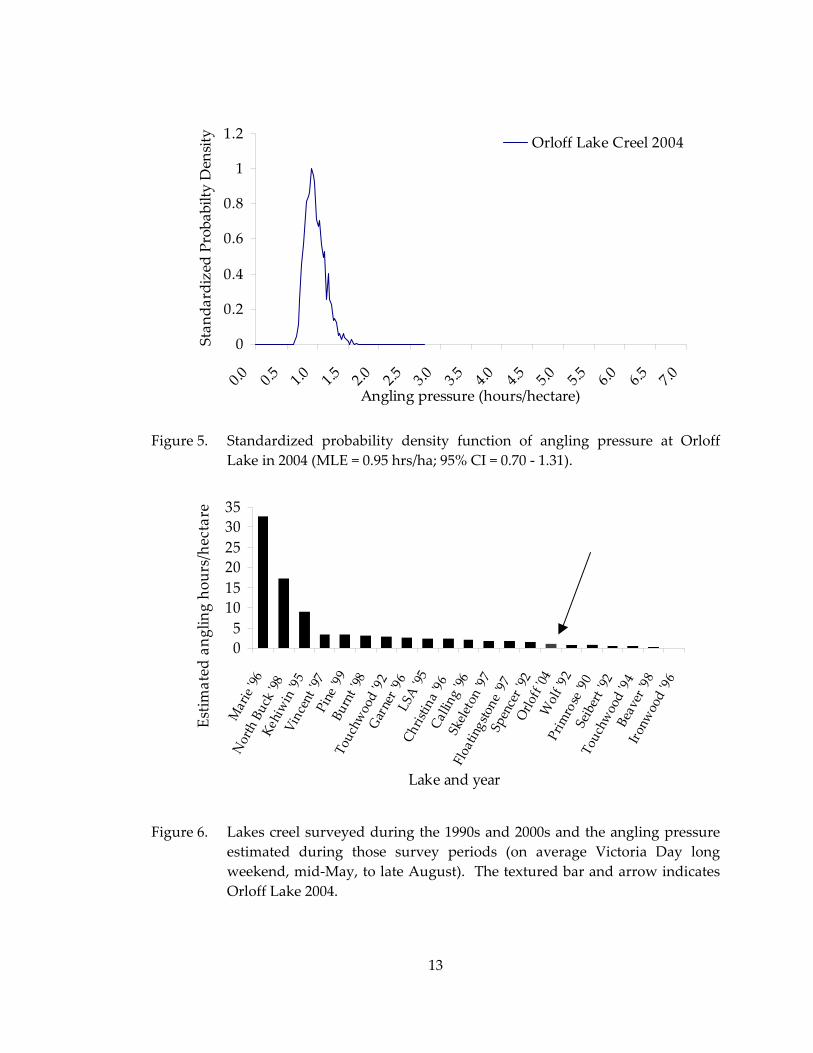
4.5.2 Age-class distribution
The age-class distribution of pike harvested during the sport fishery ranged from 1 to
9 y (Figure 16). Eight of 33 pike sampled during the creel survey were protected-length
fish. Year-classes 1995 and 1996 were only just measurable (catch rate >0.002 pike/h);
the other six year-classes were measurable, including the age-classes calculated for
protected-length pike.
4.5.3 Length-at-age
Based on the guidelines suggested by the NPMRP (Berry 1999), the growth rate (length-
at-age) of pike was relatively fast, reaching 630 mm TL (593 mm FL) by age 4
(Figure 17).
22
0.00
0.01
0.02
0.03
0 1 2 3 4 5 6 7 8 9 10 11 12 13 14 15 16 17 18 19 20Age-class (years)
Cat
ch ra
te (p
ike/
hour
)
Sport harvest 2004
Test angling 2004
Figure 16. Age-class distribution of northern pike captured by sport anglers during the
Orloff Lake creel survey (mean age = 5.1, n = 33) and test angling (mean age walleye = 4.5, n = 88).
0
100
200
300
400
500
600
700
800
0 1 2 3 4 5 6 7 8 9 10 11 12 13 14 15 16 17 18 19 20Age-class (years)
Fork
leng
th (m
m)
Sport harvest 2004
Test angling 2004
0
100
200
300
400
500
600
700
800
0 1 2 3 4 5 6 7 8 9 10 11 12 13 14 15 16 17 18 19 20Age-class (years)
Fork
leng
th (m
m)
Sport harvest 2004
Test angling 2004
Figure 17. Length-at-age (logarithmic line-of-best-fit) of the 2004 sport harvest (r2=
0.62, n = 33) and test angling (r2=0.71, n = 88) samples.
23

4.5.4 Mean weight
The mean weight of pike >63 cm TL observed during the 2004 creel survey and test
fishery was 2.0 kg per fish (n = 20) and 1.8 kg per fish (n = 49), respectively. Based on
guidelines outlined by Sullivan (1998), a mean weight >1.0 kg can indicate recruitment
overfishing.
4.5.6 Proportional and relative stock density
The PSD and RSD (stock-quality) associated with a very low catch rate, indicates an
exploited pike fishery: 76% of the pike captured were considered “quality” (53-70 cm)
and “preferred” (71 - 85 cm) fish (Gablehouse 1984). No pike >86 cm (considered
“memorable” or “trophy” [>120 cm]) were sampled.
4.5.7 Angler success rate and Gini coefficient
Forty-one percent of the anglers interviewed during the survey were successful in
catching one or more pike >63 cm TL (legal-length). The Gini coefficient was 0.65,
indicating a moderate level of inequality in the catch of northern pike (Baccante 1995).
Both % Success and Gini metrics include the anglers’ reported released pike. Since the
catch was likely exaggerated, % Success is likely lower than calculated and the Gini
coefficient is likely higher than calculated.
4.6 Stock status summary
4.6.1 Walleye stock classification
According to the ASRD WMRP (Berry 1995), there was some variation in the status of
the walleye fishery. Generally, Orloff Lake had moderate densities of walleye aged 3, 4,
6, 7, 9, 10, 11, and 12. The age-class distribution was stable except for the 1996 and 1999
year-classes. Hence, the walleye fishery was composed of moderately slow growing
fish, although the age-at-maturity was quite young for both male and female walleye.
All fish sampled were mature.
24
4.6.2 Pike stock classification
According to the ASRD NPMRP (Berry 1995), there was some variation in the
assessment of the pike fishery at Orloff Lake in 2004. Generally, the age-class
distribution was broad (ages 1 through 9) with very low densities. Growth was fast
and most pike caught were larger than 52 cm TL. Sport anglers reported catching legal-
size pike and they reported a catch that had a moderate level of inequality.
25
5.0 REFERENCES CITED
Baccante, D. 1995. Assessing catch inequality in walleye angling fisheries. North
American Journal of Fisheries Management 15:661-665.
Berry, D.K. 1999. Alberta’s northern pike management and recovery plan. Number
T/459, Alberta Environment Protection, Natural Resources Service, Edmonton,
Alberta, Canada. 22 pp.
Berry, D.K. 1995. Alberta’s walleye management and recovery plan. Number T/310,
Alberta Environment Protection, Natural Resources Service, Edmonton, Alberta,
Canada. 32 pp.
Gablehouse, D. 1984. A length-categorization system to assess fish stocks. North
American Journal of Fisheries Management 4:273-285.
Haddon, M. 2001. Modeling and quantitative methods in fisheries. Chapman and
Hall/CRC, Boca Raton, Florida, USA. 406 pp.
Mackay, W.C., G.R. Ash, and H.J. Norris (eds.). 1990. Fish ageing methods for Alberta.
R.L.&L. Environmental Services Ltd. in association with Alberta Fish and
Wildlife Division and University of Alberta, Edmonton, Alberta, Canada. 113
pp.
Pollock, K.H., C.M. Jones, and T.L. Brown. 1994. Angler survey methods and their
applications in fisheries management. American Fisheries Society Special
Publication 25. 371 pp.
Reeves, K.A. 2004. Hooking mortality of walleye caught by anglers on Mille Lacs Lake,
Minnesota in 2003. Minnesota Department of Natural Resources Section of
Fisheries, Aitkin, Minnesota, USA. 16 pp.
26

Sullivan, M.G. 2004. Computer simulation of sport fishery parameters. Alberta Fish
and Wildlife Division Unpublished Memorandum. Edmonton, Alberta,
Canada. 16 pp.
Sullivan, M.G. 2003a. Active management of walleye fisheries in Alberta: dilemmas of
managing recovering fisheries. North American Journal of Fisheries
Management 23:1343-1358.
Sullivan, M.G. 2003b. Exaggeration of walleye catches by Alberta anglers. North
American Journal of Fisheries Management 23:573-580.
Sullivan, M.G. 2002. Illegal Harvest of Walleyes Protected by Length Limits in
Alberta. North American Journal of Fisheries Management 22:1053-1063.
Sullivan, M.G. 1998. Northern management classification criteria for Alberta. Alberta
Fish and Wildlife Division Unpublished Memorandum. Edmonton, Alberta,
Canada.
27

6.0 APPENDIX
Appendix 6.1 An example of a creel survey field form.
28

Appendix 6.2 Orloff Lake 2004 angler survey daily summary data. Day codes: 1=Monday, 2=Tuesday, 3=Wednesday, 4=Wednesday, 5=Friday, 6=Saturday, 7=Sunday; Species codes: WALL=walleye, NRPK=northern pike, YLPR=yellow perch.
Date Day Anglers Angling WALL WALL NRPK NRPK YLPR YLPR
Code Hours Kept Released Kept Released Kept ReleasedMay 22 6 0 0 0 0 0 0 0 0May 23 7 11 53 3 4 4 8 0 0May 24 1 0 0 0 0 0 0 0 0May 25 2 0 0 0 0 0 0 0 0May 26 3 0 0 0 0 0 0 0 0May 27 4 0 0 0 0 0 0 0 0May 28 5 4 24 3 1 0 21 0 0May 29 6 0 0 0 0 0 0 0 0May 30 7 0 0 0 0 0 0 0 0June 5 6 5 17 0 0 1 18 0 0June 6 7 3 10.5 0 1 0 3 0 0June 7 1 5 21 1 0 0 3 0 0June 8 2 8 20.5 8 4 0 13 0 0June 18 5 6 30 5 20 3 11 0 0June 19 6 69 279 58 110 16 119 0 3June 20 7 26 58.5 8 15 1 20 0 0June 21 1 2 7 2 3 1 4 0 0June 22 2 0 0 0 0 0 0 0 0July 2 5 0 0 0 0 0 0 0 0July 3 6 20 44 18 27 4 27 0 0July 4 7 8 24 8 53 1 65 0 0July 5 1 0 0 0 0 0 0 0 0
July 16 5 4 16 4 9 0 2 0 0July 17 6 4 16 0 0 1 4 0 0July 18 7 0 0 0 0 0 0 0 0July 19 1 0 0 0 0 0 0 0 0July 20 2 0 0 0 0 0 0 0 0July 31 6 10 30.5 0 6 4 0 0 0
August 1 7 3 3 0 0 0 0 0 0August 2 1 0 0 0 0 0 0 0 0August 3 2 0 0 0 0 0 0 0 0August 13 5 2 7 0 0 0 0 0 0August 14 6 6 16 2 4 2 2 0 0August 15 7 6 7 0 0 2 2 0 0August 16 1 0 0 0 0 0 0 0 0
29
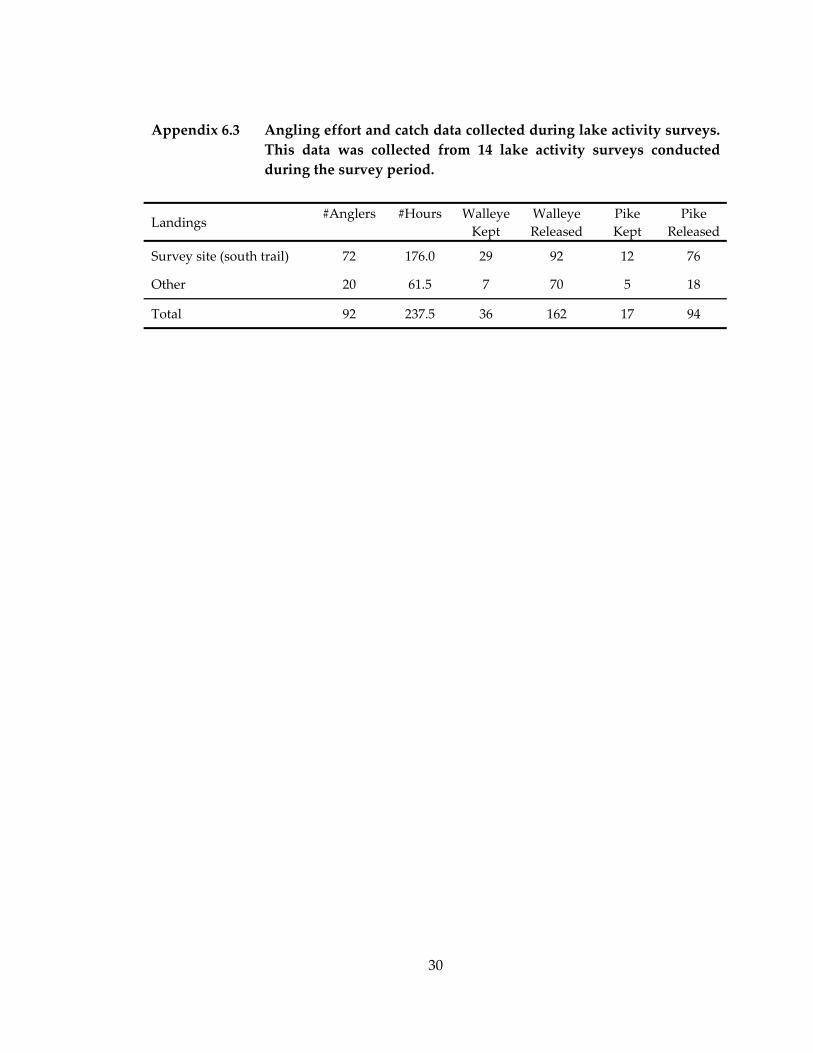
Appendix 6.3 Angling effort and catch data collected during lake activity surveys. This data was collected from 14 lake activity surveys conducted during the survey period.
Landings #Anglers #Hours Walleye Kept
Walleye Released
Pike Kept
Pike Released
Survey site (south trail) 72 176.0 29 92 12 76
Other 20 61.5 7 70 5 18
Total 92 237.5 36 162 17 94
30

Appendix 6.4 Biological data collected from sport angler-harvested fish at Orloff Lake in the summer of 2004. Species codes: WALL=walleye, NRPK=northern pike; Sex code: M=male, F=female.
Sample number Species
Fork length (mm)
Total length (mm)
Weight (g) Sex Maturity Age (yrs)
1 WALL 542 563 1600 M Mature 8 2 NRPK 639 676 1700 7 3 NRPK 613 652 1500 6 4 WALL 539 571 1400 M Mature 10 5 WALL 485 515 1300 M Mature 9 6 WALL 489 518 1200 M Mature 12 7 WALL 486 520 1480 12 8 NRPK 626 660 M Mature 7 9 NRPK 803 850 3500 F Mature 7
10 NRPK 711 754 2300 F Mature 6 11 NRPK 638 675 2100 M Mature 6 12 NRPK 555 594 3 13 WALL 633 665 2500 15 14 WALL 606 642 2200 F Mature 12 15 WALL 485 515 1200 11 16 NRPK 627 665 1820 F Mature 7 17 WALL 510 539 1400 M Mature 12 18 WALL 560 588 1700 F Mature 10 19 WALL 475 504 1120 M Mature 11 20 WALL 561 595 1720 F Mature 10 21 NRPK 630 661 1660 5 22 NRPK 679 715 2000 F Mature 6 23 NRPK 675 690 2100 F Mature 4 24 NRPK 697 735 2400 F Mature 8 25 NRPK 615 654 1700 M Mature 4 26 WALL 602 634 2300 12 27 WALL 525 557 1620 10 28 WALL 510 535 1460 7 29 WALL 515 542 1400 9 30 WALL 524 552 1380 M Mature 14 31 WALL 549 565 9 32 WALL 525 555 9
31

Appendix 6.4. Continued.
Sample number Species
Fork length (mm)
Total length (mm)
Weight (g) Sex Maturity Age (yrs)
33 WALL 543 571 9 34 WALL 503 531 8 35 WALL 591 651 12 36 WALL 533 565 9 37 WALL 490 522 M Mature 9 38 WALL 482 520 1240 10 39 WALL 497 530 1500 11 40 WALL 505 539 1500 11 41 WALL 482 510 F Mature 7 42 WALL 497 523 1340 F Mature 7 43 WALL 473 500 1020 M Mature 10 44 WALL 515 543 1580 M Mature 11 45 WALL 590 610 2300 F Mature 14 46 WALL 655 679 2500 14 47 WALL 478 510 1000 11 48 WALL 550 584 10 49 WALL 502 533 8 50 WALL 630 667 13 51 WALL 501 533 52 WALL 565 603 13 53 WALL 581 615 14 54 WALL 515 545 10 55 WALL 551 583 11 56 NRPK 650 690 1760 4 57 NRPK 638 680 1800 4 58 NRPK 609 645 1560 5 59 WALL 582 612 1940 13 60 WALL 520 551 1500 7 61 WALL 600 632 2200 12 62 WALL 481 508 1100 7 63 WALL 565 591 1760 10 64 WALL 470 496 1100 7 65 WALL 475 504 1240 7 66 WALL 548 580 9
32
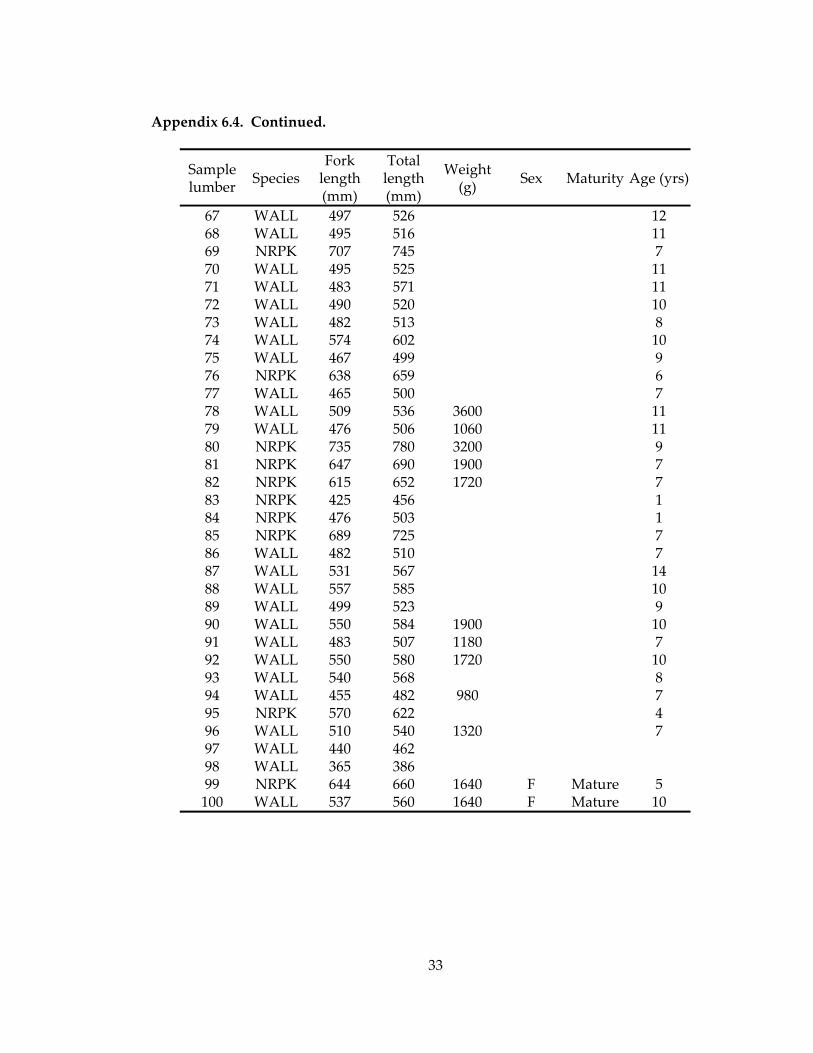
Appendix 6.4. Continued.
Sample lumber Species
Fork length (mm)
Total length (mm)
Weight (g) Sex Maturity Age (yrs)
67 WALL 497 526 12 68 WALL 495 516 11 69 NRPK 707 745 7 70 WALL 495 525 11 71 WALL 483 571 11 72 WALL 490 520 10 73 WALL 482 513 8 74 WALL 574 602 10 75 WALL 467 499 9 76 NRPK 638 659 6 77 WALL 465 500 7 78 WALL 509 536 3600 11 79 WALL 476 506 1060 11 80 NRPK 735 780 3200 9 81 NRPK 647 690 1900 7 82 NRPK 615 652 1720 7 83 NRPK 425 456 1 84 NRPK 476 503 1 85 NRPK 689 725 7 86 WALL 482 510 7 87 WALL 531 567 14 88 WALL 557 585 10 89 WALL 499 523 9 90 WALL 550 584 1900 10 91 WALL 483 507 1180 7 92 WALL 550 580 1720 10 93 WALL 540 568 8 94 WALL 455 482 980 7 95 NRPK 570 622 4 96 WALL 510 540 1320 7 97 WALL 440 462 98 WALL 365 386 99 NRPK 644 660 1640 F Mature 5
100 WALL 537 560 1640 F Mature 10
33

Appendix 6.4. Continued.
Sample number
Species Fork length (mm)
Total length (mm)
Weight (g)
Sex Maturity Age (yrs)
101 NRPK 687 739 2300 5 102 NRPK 637 674 1720 F Mature 6 103 NRPK 565 603 1180 3 104 WALL 540 577 1640 F Mature 10 105 NRPK 589 627 3 106 NRPK 700 736 3 107 NRPK 555 590 3 108 NRPK 547 582 3
34

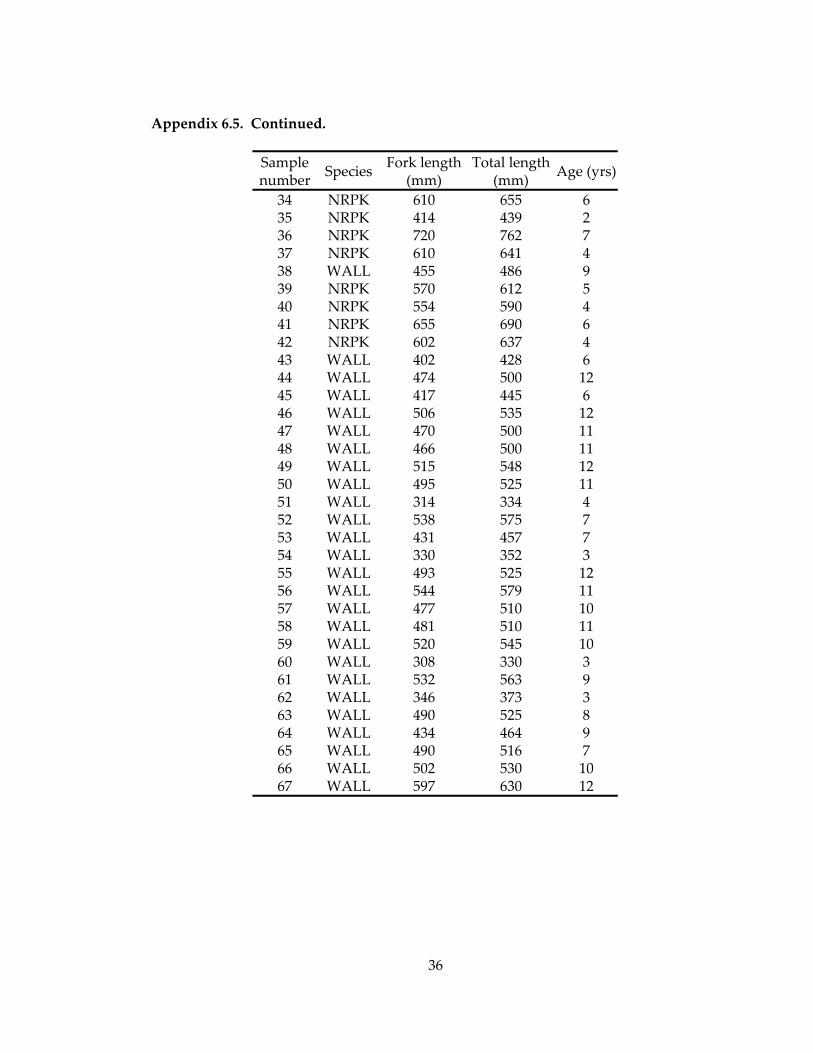
Appendix 6.5 Sample number, species, fork lengths and total lengths of fish captured during test angling at Orloff Lake (2004). Species codes: NRPK=northern pike, WALL=walleye.
Sample number Species Fork length
(mm) Total length
(mm) Age (yrs)
1 NRPK 454 480 2 2 NRPK 561 591 7 3 NRPK 554 588 5 4 NRPK 590 630 3 5 NRPK 703 740 7 6 NRPK 410 440 2 7 NRPK 441 468 2 8 NRPK 710 819 7 9 NRPK 566 593 4
10 NRPK 568 606 3 11 NRPK 555 594 4 12 NRPK 580 608 3 13 NRPK 635 670 6 14 NRPK 583 621 7 15 NRPK 580 615 5 16 NRPK 634 670 6 17 NRPK 664 710 7 18 NRPK 594 631 7 19 NRPK 604 653 7 20 NRPK 609 645 6 21 NRPK 628 669 6 22 NRPK 603 641 6 23 NRPK 620 651 6 24 NRPK 607 643 7 25 NRPK 570 604 3 26 NRPK 626 663 5 27 NRPK 595 635 6 28 NRPK 659 698 7 29 NRPK 593 626 7 30 NRPK 770 810 8 31 NRPK 600 642 6 32 NRPK 444 476 2
35
Appendix 6.5. Continued.
Sample number Species Fork length
(mm) Total length
(mm) Age (yrs)
34 NRPK 610 655 6 35 NRPK 414 439 2 36 NRPK 720 762 7 37 NRPK 610 641 4 38 WALL 455 486 9 39 NRPK 570 612 5 40 NRPK 554 590 4 41 NRPK 655 690 6 42 NRPK 602 637 4 43 WALL 402 428 6 44 WALL 474 500 12 45 WALL 417 445 6 46 WALL 506 535 12 47 WALL 470 500 11 48 WALL 466 500 11 49 WALL 515 548 12 50 WALL 495 525 11 51 WALL 314 334 4 52 WALL 538 575 7 53 WALL 431 457 7 54 WALL 330 352 3 55 WALL 493 525 12 56 WALL 544 579 11 57 WALL 477 510 10 58 WALL 481 510 11 59 WALL 520 545 10 60 WALL 308 330 3 61 WALL 532 563 9 62 WALL 346 373 3 63 WALL 490 525 8 64 WALL 434 464 9 65 WALL 490 516 7 66 WALL 502 530 10 67 WALL 597 630 12
36

Appendix 6.5. Continued.
Sample umber Species Fork length
(mm) Total length
(mm) Age (yrs)
68 WALL 501 533 10 69 WALL 572 607 12 70 WALL 336 357 3 71 WALL 503 537 10 72 NRPK 664 703 73 NRPK 687 730 74 NRPK 515 548 75 NRPK 572 604 76 NRPK 516 552 77 NRPK 598 640 78 NRPK 598 632 79 NRPK 631 671 80 NRPK 553 587 3 81 WALL 496 530 9 82 WALL 584 615 12 83 WALL 565 594 11 84 WALL 420 445 6 85 WALL 360 384 4 86 NRPK 560 599 4 87 NRPK 519 550 4 88 NRPK 511 543 3 89 NRPK 565 603 4 90 WALL 414 442 5 91 WALL 474 505 9 92 WALL 345 366 3 93 WALL 503 531 12 94 WALL 540 570 10 95 WALL 397 420 6 96 WALL 488 520 12 97 WALL 535 565 11 98 NRPK 530 570 4 99 NRPK 441 474 2
100 NRPK 599 636 4 101 NRPK 597 637 4
37

Appendix 6.5. Continued.
Sample number Species Fork length
(mm) Total length
(mm) Age (yrs)
102 NRPK 674 720 7 103 NRPK 615 655 5 104 NRPK 586 624 6 105 WALL 335 357 3 106 WALL 425 453 5 107 NRPK 560 590 3 108 NRPK 627 665 5 109 NRPK 601 635 5 110 NRPK 633 655 6 111 NRPK 625 655 7 112 NRPK 533 566 3 113 NRPK 468 503 2 114 WALL 469 500 9 115 WALL 465 495 6 116 WALL 407 433 6 117 WALL 335 356 3 118 WALL 210 226 1 119 WALL 497 528 6 120 NRPK 602 638 3 121 NRPK 650 689 5 122 YLPR 185 195 123 WALL 505 535 12 124 WALL 509 536 6 125 WALL 454 480 7 126 NRPK 642 681 4 127 NRPK 527 556 4 128 NRPK 465 500 2 129 WALL 350 373 3 130 WALL 454 485 9 131 WALL 472 500 8 132 WALL 590 625 12 133 WALL 465 498 6 134 WALL 231 244 1 135 WALL 562 594 9
38

Appendix 6.5. Continued.
Sample number Species Fork length
(mm) Total length
(mm) Age (yrs)
136 NRPK 475 503 2 137 NRPK 468 501 2 138 NRPK 538 572 3 139 NRPK 472 529 2 140 NRPK 610 644 6 141 YLPR 229 238 142 YLPR 191 201 143 WALL 454 482 9 144 WALL 614 648 12 145 WALL 505 536 9 146 WALL 348 369 4 147 WALL 490 522 10 148 NRPK 606 647 6 149 NRPK 556 593 3 150 NRPK 500 533 2 151 NRPK 663 705 4 152 NRPK 536 569 3 153 NRPK 454 485 2 154 NRPK 636 669 6 155 NRPK 634 674 6 156 NRPK 550 587 3 157 WALL 555 588 9 158 WALL 500 530 6 159 NRPK 484 516 2 160 WALL 575 610 12 161 WALL 372 394 4 162 WALL 464 493 6 163 WALL 290 313 2 164 NRPK 644 680 4 165 NRPK 591 629 3 166 NRPK 498 530 2 167 NRPK 720 756 7 168 NRPK 604 645 5 169 NRPK 703 746 5
39

Appendix 6.5. Continued.
Sample number Species Fork length
(mm) Total length
(mm) Age (yrs)
170 NRPK 520 554 2 171 NRPK 654 695 6 172 WALL 492 521 11 173 WALL 393 415 4 174 WALL 437 466 6
40


The Alberta Conservation Association acknowledges the following partner for their generous support of
this project