Embed Size (px)
Citation preview
materials
Article
Assessment of the Influence of Acetic Acid Residueon Type I Collagen during Isolationand Characterization
Seon Young Bak 1,2, Sang Woo Lee 3 , Chong Hyuk Choi 4,* and Hyun Woo Kim 1,4,*1 Graduate Program of Nano Science and Technology, Graduate School of Yonsei University,
Seoul 03722, Korea; [email protected] Center for Biomaterials, Biomedical Research Institute, Korea Institute of Science and Technology,
Seoul 02792, Korea3 Biomedical Engineering Research Center, Asan Institute for Life Sciences, Asan Medical Center,
Seoul 05505, Korea; [email protected] Department of Orthopaedic Surgery, Yonsei University College of Medicine, Seoul 03722, Korea* Correspondence: [email protected] (C.H.C.); [email protected] (H.W.K.);
Tel.: +82-2-2228-2180 (C.H.C. & H.W.K.)
Received: 4 November 2018; Accepted: 10 December 2018; Published: 11 December 2018 �����������������
Abstract: Various methods for isolation of type I collagen using acids, bases, enzymes, and theircombinations have been applied. However, a lack of standardization exists among type I collagensisolated by various approaches. Consequently, in this study, we assessed the influence of acetic acidresidue on type I collagen isolated by pepsin-acetic acid treatment, the fabrication of collagen-basedporous scaffolds, and the seeded cells on collagen scaffolds. Unlike the isolated collagen dialyzedby deionized water (DDW), collagen dialyzed by 0.5 M acetic acid (DAC) exhibited structural andthermal denaturation. Both DDW- and DAC-based porous scaffolds at all collagen concentrations(0.5, 1 and 2% w/v) showed the high degree of porosity (>98%), and their pore morphologieswere comparable at the same concentrations. However, the DDW- and DAC-based collagenscaffolds displayed significant differences in their physical properties (weight, thickness, and volume)and swelling behaviors. In particular, the weight losses induced by mechanical stimulation reflectedthe high degradation of DAC-collagen scaffolds. In cell culture experiments using adipose-derivedstem cells (ADSCs), the characteristics of mesenchymal stem cell (MSC) did not change in bothDDW- and DAC-collagen scaffolds for 10 days, although cells proliferated less in the DAC-collagenscaffolds. Our results suggest that the elimination of acetic acid residue from isolated collagen isrecommended to produce collagen scaffolds that provide a stable environment for cells and celltherapy-related applications.
Keywords: type I collagen; isolation; dialysis; acetic acid; porous scaffold; adipose-derived stem cells(ADSCs)
1. Introduction
Type I collagen is considered one of the most useful biomaterials and is used extensively in thefield of tissue engineering [1–4]. Accordingly, its isolation at both laboratory and commercial scalesis important [5,6] and various methods using acids, bases, enzymes, and their combinations havebeen applied to isolate type I collagen [7]. Among various methods, the treatment with pepsin-aceticacid solution is the most widely used approach and highly reliable for medical purposes [8–10];this treatment retains the triple-helical domain of collagen, but lowers its immunogenicity by cleavingits telopeptides [9,11].
Materials 2018, 11, 2518; doi:10.3390/ma11122518 www.mdpi.com/journal/materials

Materials 2018, 11, 2518 2 of 16
However, a lack of standardization exists among type I collagens isolated by variousapproaches [6]. Specifically, the variability is introduced in isolated collagens due to alterationsin the structural and thermal properties of collagen induced by acetic acid [12,13] and due to variationin the concentrations of acetic acid used in the isolation process. Moreover, the resulting influences onthe characteristics of the collagen-based scaffolds and the seeded cells cultured on the scaffolds havebeen not proved clearly. Despite the considerable numbers of studies that support the use of collagenas the primary material for the fabrication of scaffolds, the routine use of isolated collagen withoutprior characterization is controversial.
In this study, we aimed to determine the influence of acetic acid residue on the characteristicsof isolated collagen. Moreover, to elucidate the influence of acetic acid residue on collagen-basedporous scaffolds and the culturing cells on the scaffolds, we intended to demonstrate the relationshipsbetween the material used for scaffolds and the seeded cells.
For this purpose, we isolated type I collagen from porcine skin by pepsin-acetic acid treatmentand dialyzed it against deionized water (DDW) and 0.5 M acetic acid (DAC). The structural andthermal properties of both DDW- and DAC-collagens were confirmed by comparison to those ofcommercially available type I collagen. Three different concentrations of isolated collagen were usedto fabricate collagen-based porous scaffolds, and their morphological and physical characteristicsas well as swelling and degradation behaviors were analyzed. Adipose-derived stem cells (ADSCs)were seeded on the fabricated scaffolds, and the relationships between the collagen scaffolds and theseeded cells were evaluated by analyzing the genetic maintenance and proliferation of the seeded cells.
2. Materials and Methods
2.1. Materials
Porcine skin, used in food, was purchased from an open market (Seoul, Korea). It was chosenas the raw material for type I collagen isolation due to its high similarity to human skin [14,15].Glacial acetic acid was purchased from Duksan (Seoul, Korea), and ethanol, pepsin (EC 3.4.23.1, 1015units/mg protein) from porcine stomach mucosa, 1-ethyl-3-(3-dimethylaminopropyl) carbodiimide(EDC), ninhydrin solution, and sodium chloride (NaCl) were purchased from Sigma-Aldrich(St. Louis, MO, USA). All other chemicals used were of analytical grade, and water was deionizedbefore use.
2.2. Isolation and Characterization of Type I Collagen
2.2.1. Isolation of Type I Collagen from Porcine Skin
Type I collagen was isolated by acetic acid-pepsin treatment, as described previously [16].The isolation procedure was carried out at 4 ◦C. Porcine skin (10 g) was homogenized in 1 L of 0.5 Macetic acid, and 2 g of porcine pepsin was then added and stirred for 24 h. After centrifugation(all centrifugation was performed at 10,700× g for 10 min), the supernatant was salted out by640 mL of 5 M NaCl solution. The precipitate was suspended in 100 mL of ethanol with stirringfor 24 h, after which it was recovered by centrifugation and then re-suspended in 50 mL of ethanol.After centrifugation, the precipitate was suspended in 50 mL of 0.5 M acetic acid and then transferredto a dialysis tubing cellulose membrane (molecular weight cut-off: 14 kDa; Sigma-Aldrich) anddialyzed against 900 mL of 0.5 M acetic acid for 3 days by changing the solution every 12 h. The molarconcentration of acetic acid in the surrounding solution was measured by titration with 0.1 M sodiumhydroxide solution. When the molar concentration of acetic acid in the surrounding solution wasconstantly sustained at 0.5 M for 72 h, the final collagen was referred to as DAC. Collagen that wasdialyzed against deionized water (DW) was referred to as DDW when the molar concentration ofacetic acid in the surrounding solution was less than 0.0001 M at 72 h. The resulting collagen solutionswere frozen at −20 ◦C and then lyophilized.

Materials 2018, 11, 2518 3 of 16
2.2.2. Gel Electrophoresis
Sodium dodecyl sulfate-polyacrylamide gel electrophoresis (SDS-PAGE) was performed using thediscontinuous Tris-HCl/glycine buffer system, according to the method of Laemmli [17]. The proteinpatterns of the collagens isolated from porcine skin were compared against a commercially availableultrapure type I collagen (PC-001, Dalim Tissen, Seoul, Korea). Briefly, the collagen samples wereelectrophoresed using an 8% separating gel and a 5% stacking gel at a constant voltage of 120 Vand a maximum current of 400 mA for 1.5 h. The gel was then stained using 0.1% w/v Coomassiebrilliant blue R-250, containing 50% v/v methanol and 10% v/v acetic acid, and destained with 40% v/vmethanol and 10% v/v acetic acid. A high molecular weight protein marker (ThermoFisher Scientific,Waltham, MA, USA) was used to estimate the molecular weight of the proteins.
2.2.3. Raman Spectroscopy
Raman spectroscopy (LabRam ARAMIS, Horiba Jobin Yvon, Edison, NJ, USA) was carried outusing a 532-nm laser at a power of 50 mW with an exposure time of 10 s. The Raman spectra wereanalyzed after normalization of peak intensities to the amide I band at around 1660 cm−1.
2.2.4. X-ray Diffraction (XRD) Analysis
The spacing of the collagen fibers and phase identification of the two isolated collagens (DDW-and DAC-collagen) and the commercial collagen were determined using thin-film XRD. To fabricatethe thin films, 0.5 mL of 1% w/v collagen solution was poured over a cover glass (18 × 18 mm2)and placed in a refrigerator at 4 ◦C to dry. The high-resolution XRD system (Rigaku, Tokyo, Japan)was operated at 45 kV and 200 mA using CuKα radiation (λ = 0.15418 nm).
2.2.5. Simultaneous Thermal Analysis (STA)
The thermodynamic properties of DDW-, DAC-, and the commercial collagen pellets (23 mg,8 mm diameter) in the dehydrated state were evaluated by thermal gravimetric analysis (TGA) anddifferential scanning calorimetry (DSC), performed using a simultaneous thermal analyzer (STA8000,PerkinElmer, Waltham, MA, USA). The sample was heated from 20 to 500 ◦C at 1 ◦C/min in N2 gas.
2.3. Preparation and Characterization of Porous Scaffolds
2.3.1. Preparation of Porous Scaffolds
Collagen solutions (0.5, 1 and 2% w/v) were prepared from DDW and DAC and then homogenizedin 50-mL conical tubes by vortexing for 5 min at 4 ◦C. Air bubbles were removed from the solutions bycentrifugation at 3000× g for 3 min. Finally, 380 µL of each collagen solution was placed into one wellof a 24-well plate, frozen at −20 ◦C, and lyophilized for 1 day each. For cross-linking, the fabricatedporous scaffolds were immersed in 50 mM EDC solution in 95% v/v ethanol at room temperature for24 h [18]. The cross-linked scaffolds were then withdrawn and sonicated in 50 mL of DW for 20 s threetimes to remove residual EDC. The washed scaffolds were re-frozen at −20 ◦C and then lyophilizedfor 1 day each.
2.3.2. Morphology
The surface morphologies of the porous scaffolds were characterized by a field emission scanningelectron microscope (FE-SEM; JEOL-7001F, JEOL Ltd., Tokyo, Japan). Each sample was sputter-coatedwith Pt and visualized by SEM at 15 kV. The pore size was measured from the SEM images by ImageJsoftware (National Institutes of Health (NIH), Bethesda, MD, USA), and 40 pores were assessed.

Materials 2018, 11, 2518 4 of 16
2.3.3. Physical Characteristics
The weights of the scaffolds were measured by an electronic balance (Mettler-Toledo, Greifensee,Switzerland) with 0.1 mg readability. The porosity and volume of the final products were measured bya displacement method with ethanol [19]. The thickness was calculated after measuring the diameterusing a stainless-steel ruler with 0.5-mm increments. For all parameters, three individual scaffoldswere analyzed.
2.3.4. Free Amine Index
The free amine indices of the cross-linked scaffolds were determined using ninhydrin solution [20].Approximately 7–13 mg of each sample was immersed in 100 µL of 0.05% v/v acetic acid, and then300 µL of DW and 100 µL of ninhydrin solution were added sequentially. The solutions were mixedand placed in a boiling water bath for 10 min. After cooling to room temperature, 100 µL of 95% v/vethanol was added, and the solutions were re-mixed. A blank was established using DW instead of thesample solution. The absorbance of the solutions was measured at 570 nm using a spectrophotometer(VERSAmax tunable microplate reader, Molecular Devices, Sunnyvale, CA, USA), and the data wereanalyzed using SoftMax pro (version 6.2.2, Molecular Devices). The free amine index was calculatedby the following equation:
Free amine index =A570Wd
(1)
where A570 is the absorbance at 570 nm and Wd is the weight of the dry scaffold.
2.3.5. Swelling Test
The water absorption (swelling ratio) of the scaffolds was analyzed by immersing the dry scaffoldsin DW at room temperature for 1 day. The weights of the swollen scaffolds were measured afterremoving the excess surface solution with filter paper. The ratio of water absorption was calculated bythe following equation:
Water absorption (%) =Ws−Wd
Wd× 100 (2)
where Wd is the weight of the dry scaffold and Ws is the weight of the swollen scaffold.
2.3.6. In Vitro Degradation
The porous scaffolds were placed into individual wells of a 12-well plate containing 1.5 mL1× PBS (pH 7.4) and incubated at 37 ◦C with orbital shaking at 120 rpm achieved by a HeidolphRotamax 120 orbital shaker (Wolf Labs, York, UK). After 1, 4, 7 and 14 days of incubation, samples wereremoved from the well, rinsed five times with DW, and then lyophilized and weighed. The percentageof weight loss was calculated by the following equation:
Weight loss (%) =Wi−Wf
Wi× 100 (3)
where Wi and Wf are the initial and final weights of the dry scaffold, respectively.
2.4. Cell Culture Studies
2.4.1. Isolation and Cultivation of ADSCs
Human ADSCs were obtained from the Department of Surgery, Yonsei University College ofMedicine. The human tissue harvest protocols were approved by the Institutional Review Board(IRB, 4-2010-0236) of Severance Hospital. The ADSCs were incubated at 37 ◦C in 5% CO2 in conditionedmedium consisting of 60% Dulbecco’s Modified Eagle Medium-low glucose (DMEM-LG, GibcoBRL,Grand Island, NY, USA), 40% MCDB-201 medium (Sigma-Aldrich, St. Louis, MO, USA), 10−4 M

Materials 2018, 11, 2518 5 of 16
ascorbic acid 2-phosphate (Sigma-Aldrich, St. Louis, MO, USA), and 1% antibiotic/antimycoticsolution (GibcoBRL, Crewe, UK) with 10% fetal bovine serum (FBS, WelGENE, Daegu, Korea).
2.4.2. Cell Seeding on Porous Scaffolds
Each of the cross-linked scaffolds was sterilized with 70% v/v ethanol for 30 min and 40-Wultraviolet light for 20 min. Each scaffold was then washed with DW and 1× PBS (pH 7.4)and subsequently incubated in 1× PBS (pH 7.4) for 1 day. Before cell seeding, the scaffoldswere rinsed with conditioned medium consisting of 60% DMEM-LG (GibcoBRL), 40% MCDB-201medium (Sigma-Aldrich, St. Louis, MO, USA), 10−4 M ascorbic acid 2-phosphate (Sigma-Aldrich,St. Louis, MO, USA), and 1% antibiotic/antimycotic solution (GibcoBRL) with 10% fetal bovineserum (FBS, WelGENE, Daegu, Korea). For optical confirmation, ADSCs were stained with4′,6-diamidino-2-phenylindole (DAPI, Invitrogen, Carlsbad, CA, USA), seeded on scaffolds in 24-wellculture plates at a final concentration of 1.0 × 10⁵ cells, and allowed to attach for 1 day. Then,the ADSC-seeded scaffolds were transferred to another 24-well culture plate.
2.4.3. Cell Proliferation Study
For cell counting, 1.0 × 10⁵ ADSCs were seeded on DDW- and DAC-collagen scaffolds (6 mmdiameter, 2 mm thickness). The cell-seeded scaffolds were then transferred into individual wells ofa 96-well plate. Cell Counting Kit-8 (CCK-8) solution was added to each well, and the plate wasthen incubated for 3 h in a humidified incubator (37 ◦C, 5% CO2). Cell proliferation capacity wasmeasured by absorbance at 450 nm using a spectrophotometer (VERSAmax tunable microplate reader,Madison, NC, USA). The proliferation assay was performed at 1, 4, 7 and 14 days of cultivation perpassage until two sub-cultivations.
2.4.4. Reverse Transcriptase-Polymerase Chain Reaction (RT-PCR) Analysis
RT-PCR was performed at 10 days after seeding using RNA extracted from cells by the Trizol(Invitrogen, Seoul, Korea) isolation method. The primer sequences and conditions are listed in Table 1.
Table 1. Primer sequences for RT-PCR analysis of adipose-derived stem cells.
GeneName Primer Sequence Accession No. Amplicon
Size (bp)Annealing
Temperature (◦C) Cycle
OCT41 S 5′-cgt gaa gct gga gaa gga gaa gct g-3′AF268617 245 60 34A 5′-caa ggg ccg cag ctc aca cat gtt c-3′
NANOGS 5′-caa agg caa aca acc cac tt-3′
NM_024865 394 60 34A 5′-att gtt cca ggt ctg gtt gc-3′
SOX22 S 5′-aac ccc aag atg cac aac tc-3′NM_003106 100 60 34A 5′-gct tag cct cgt cga tga ac-3′
CXCR43 S 5′-ggt ggt cta tgt tgg cgt ct-3′BC020968.2 324 60 34A 5′-tcg atg ctg atc cca atg ta-3′
SNAIL1S 5′-ttt acc ttc cag cag ccc ta-3′
BC012910 415 54 34A 5′-cca ggc tga ggt att cct tg-3′
TWISTS 5′-agt ccg cag tct tac gag ga-3′
NM_000474.3 222 54 34A 5′-cat ctt gga gtc cag ctc gt-3′
N-cadherinS 5′-gac aat gcc cct caa gtg tt-3′
NM_001792.3 354 54 34A 5′-acc cac aat cct gtc cac at-3′
E-cadherinS 5′-tgg aca ggg agg att ttg ag-3′
NM_004360.3 458 60 34A 5′-agg ctg tgc ctt cct aca ga-3′
GAPDH4 S 5′-tcc atg aca act ttg gta tc-3′NM_002046 452 55 34A 5′-tgt agc caa att cgt tgt ta-3′
1 OCT4 octamer-binding transcription factor 4; 2 SOX2 SRY (sex determining region Y)-box 2; 3 CXCR4 Chemokine(C-X-C motif) receptor 4; 4 GAPDH glyceraldehyde 3-phosphate dehydrogenase.

Materials 2018, 11, 2518 6 of 16
2.5. Statistical Analysis
All quantitative data of porous scaffolds were presented as mean ± SD of three independentexperiments. Statistical analysis was performed using two-way ANOVA followed by Bonferronipost-hoc test using GraphPad Prism 5 (GraphPad Software Inc., San Diego, CA, USA). The level ofsignificance for all statistical analyses was set at p < 0.05.
3. Results
3.1. Isolated Type I Collagens
3.1.1. Gel Electrophoresis Patterns of Collagens
Gel electrophoretic analysis (Figure 1) showed that both two isolated collagens exhibited thetypical protein patterns for type I collagen [21]. Proportions of the β and γ chains for both DDW-and DAC-collagen were relatively higher than for the commercial collagen (C in Figure 1), while theproportions of α1, α2, β, and γ chains in DDW- and DAC-collagen were comparable.
Figure 1. Protein patterns of collagens. SDS-PAGE bands were visualized using Coomassie brilliantblue staining. M, marker.
3.1.2. Raman Spectra of Collagens
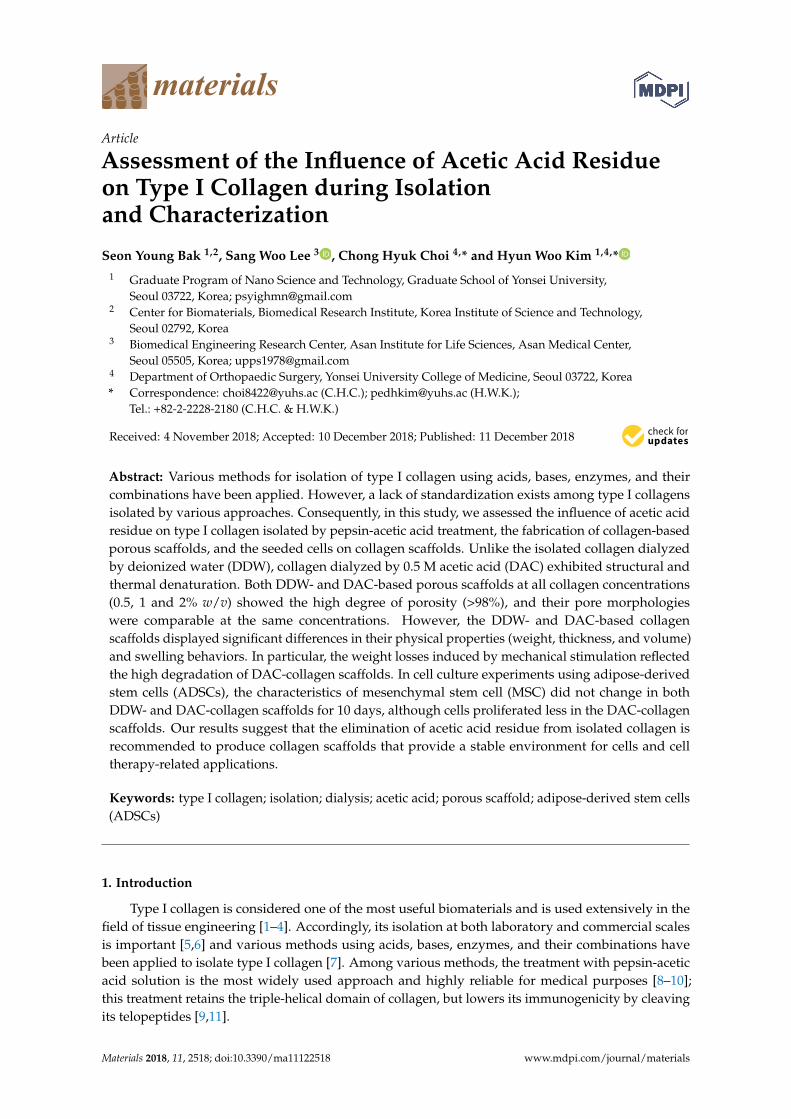
Results for the structural and conformational characteristics of the collagens were obtained byRaman spectroscopy (Figure 2). The typical bands for type I collagen, namely the amide III, I, and Abands appeared at about 1240–1280, 1660 and 3300 cm−1, respectively. The amide III band was foundin all three collagens, suggesting that they are all dermal collagens [22]. The peak intensity ratios of1240 cm−1 to 1445 cm−1 (assigned to amino acid side chains) [23] of DDW- and commercial collagenwere similar but higher than that of DAC-collagen. The amide I region indicates unordered randomcoils [24], which were evident as peaks at 1647 and 1649 cm−1 in DAC- and commercial collagen,respectively; this peak appeared at 1649 cm−1 in DDW-collagen but was less intense than in the othertwo collagens. The absorption peaks representing the α-helix structure of collagen also appearedin the amide I band as peaks at 1657 cm−1 in DDW- and commercial collagen and at 1659 cm−1
in DAC-collagen [25]. The amide A bands (stretching vibration of NH group) [13] of DAC- andcommercial collagen appeared at 3327 cm−1 and that of DDW-collagen appeared at 3312 cm−1.
Materials 2018, 11, 2518 7 of 16
Figure 2. Structural characteristics of collagens. Raman spectra of DDW-, DAC- and commercialcollagen (C) were normalized to the amide I band at around 1660 cm−1 (the peak marked as *).
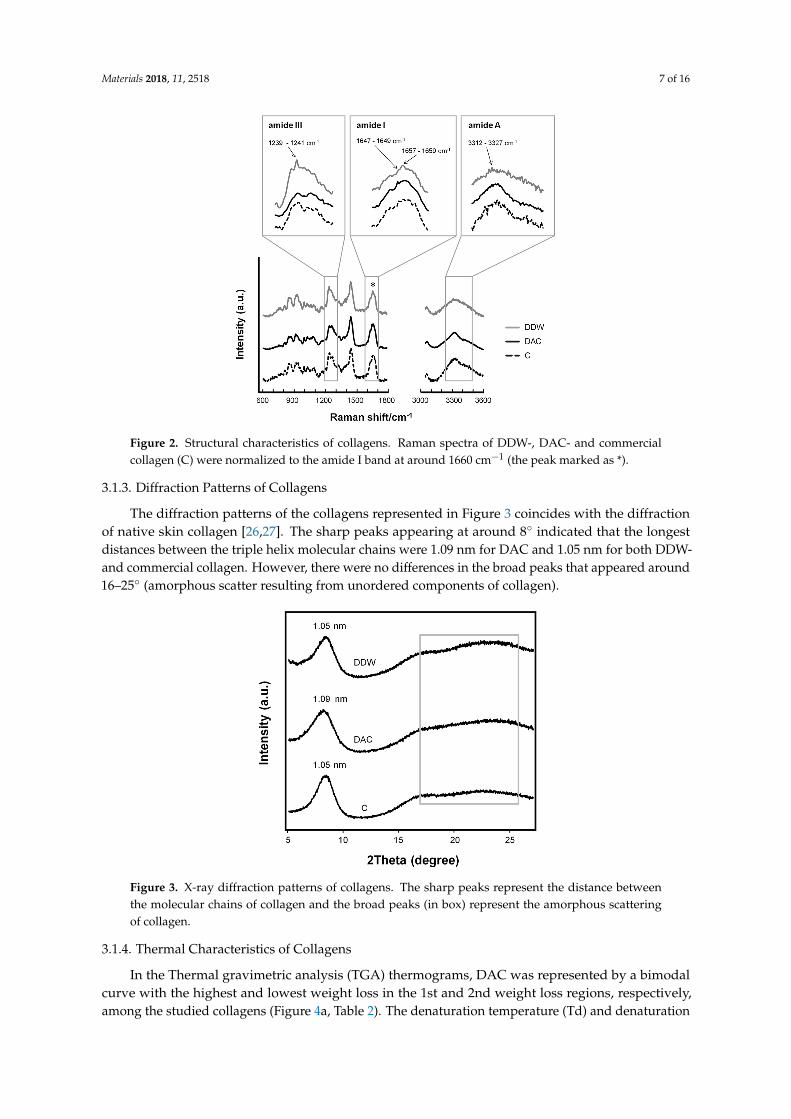
3.1.3. Diffraction Patterns of Collagens
The diffraction patterns of the collagens represented in Figure 3 coincides with the diffractionof native skin collagen [26,27]. The sharp peaks appearing at around 8◦ indicated that the longestdistances between the triple helix molecular chains were 1.09 nm for DAC and 1.05 nm for both DDW-and commercial collagen. However, there were no differences in the broad peaks that appeared around16–25◦ (amorphous scatter resulting from unordered components of collagen).
Figure 3. X-ray diffraction patterns of collagens. The sharp peaks represent the distance betweenthe molecular chains of collagen and the broad peaks (in box) represent the amorphous scatteringof collagen.
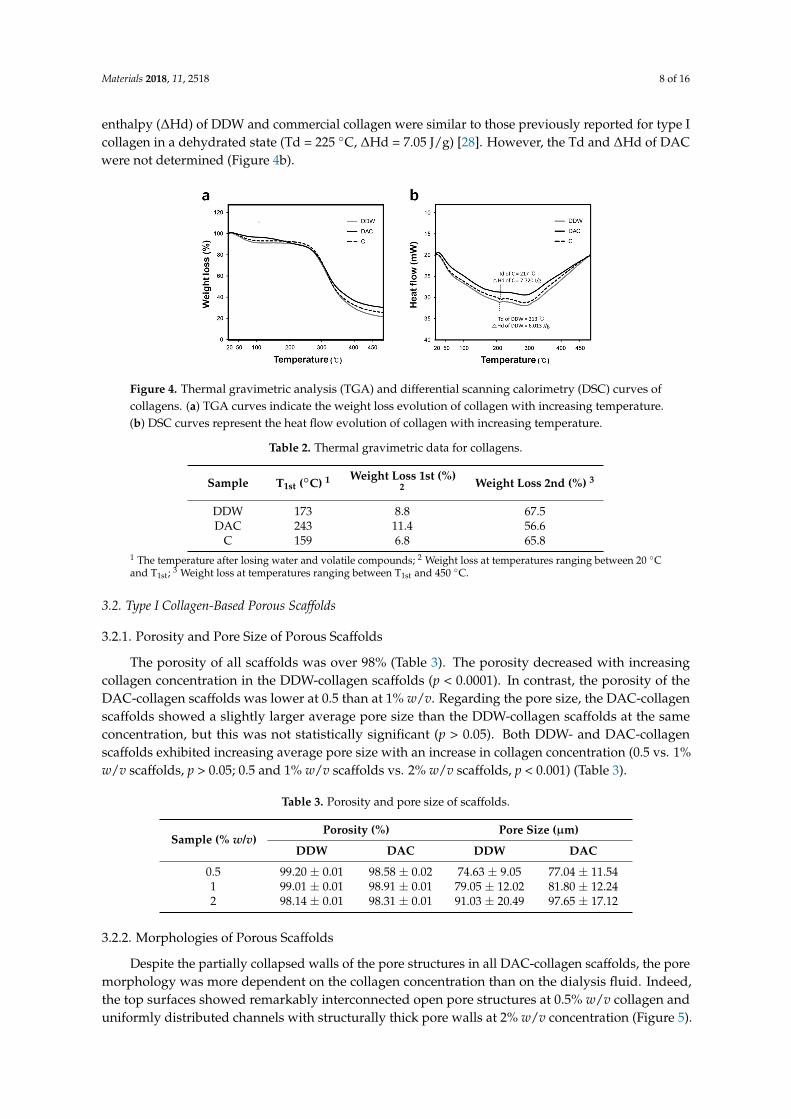
3.1.4. Thermal Characteristics of Collagens
In the Thermal gravimetric analysis (TGA) thermograms, DAC was represented by a bimodalcurve with the highest and lowest weight loss in the 1st and 2nd weight loss regions, respectively,among the studied collagens (Figure 4a, Table 2). The denaturation temperature (Td) and denaturation
Materials 2018, 11, 2518 8 of 16
enthalpy (∆Hd) of DDW and commercial collagen were similar to those previously reported for type Icollagen in a dehydrated state (Td = 225 ◦C, ∆Hd = 7.05 J/g) [28]. However, the Td and ∆Hd of DACwere not determined (Figure 4b).
Figure 4. Thermal gravimetric analysis (TGA) and differential scanning calorimetry (DSC) curves ofcollagens. (a) TGA curves indicate the weight loss evolution of collagen with increasing temperature.(b) DSC curves represent the heat flow evolution of collagen with increasing temperature.
Table 2. Thermal gravimetric data for collagens.
Sample T1st (◦C) 1 Weight Loss 1st (%)2 Weight Loss 2nd (%) 3
DDW 173 8.8 67.5DAC 243 11.4 56.6
C 159 6.8 65.81 The temperature after losing water and volatile compounds; 2 Weight loss at temperatures ranging between 20 ◦Cand T1st; 3 Weight loss at temperatures ranging between T1st and 450 ◦C.
3.2. Type I Collagen-Based Porous Scaffolds
3.2.1. Porosity and Pore Size of Porous Scaffolds
The porosity of all scaffolds was over 98% (Table 3). The porosity decreased with increasingcollagen concentration in the DDW-collagen scaffolds (p < 0.0001). In contrast, the porosity of theDAC-collagen scaffolds was lower at 0.5 than at 1% w/v. Regarding the pore size, the DAC-collagenscaffolds showed a slightly larger average pore size than the DDW-collagen scaffolds at the sameconcentration, but this was not statistically significant (p > 0.05). Both DDW- and DAC-collagenscaffolds exhibited increasing average pore size with an increase in collagen concentration (0.5 vs. 1%w/v scaffolds, p > 0.05; 0.5 and 1% w/v scaffolds vs. 2% w/v scaffolds, p < 0.001) (Table 3).
Table 3. Porosity and pore size of scaffolds.
Sample (% w/v)Porosity (%) Pore Size (µm)
DDW DAC DDW DAC
0.5 99.20 ± 0.01 98.58 ± 0.02 74.63 ± 9.05 77.04 ± 11.541 99.01 ± 0.01 98.91 ± 0.01 79.05 ± 12.02 81.80 ± 12.242 98.14 ± 0.01 98.31 ± 0.01 91.03 ± 20.49 97.65 ± 17.12
3.2.2. Morphologies of Porous Scaffolds
Despite the partially collapsed walls of the pore structures in all DAC-collagen scaffolds, the poremorphology was more dependent on the collagen concentration than on the dialysis fluid. Indeed,the top surfaces showed remarkably interconnected open pore structures at 0.5% w/v collagen anduniformly distributed channels with structurally thick pore walls at 2% w/v concentration (Figure 5).
Materials 2018, 11, 2518 9 of 16
Figure 5. Morphological characteristics of porous scaffolds. Scanning electron micrographs representthe pore morphology of the top surface of the scaffolds.
3.2.3. Physical Characteristics of Porous Scaffolds
For DDW- and DAC-collagen scaffolds, the weight difference increased with an increase incollagen concentration. At 0.5, 1, and 2% w/v collagen, the DAC-collagen scaffolds were 1.03-, 1.04-,and 1.06-fold lighter than the DDW-collagen scaffolds at the same concentration (0.5% w/v, p > 0.05;1% w/v, p < 0.01; 2% w/v, p < 0.001). At 0.5% w/v collagen, the DAC-collagen scaffolds exhibitedremarkably lower volume (1.85-fold) and thickness (2.33-fold) than the DDW-collagen scaffolds at thesame concentration (p < 0.001). At 1% w/v collagen, the DAC-collagen scaffolds were 1.14-fold smallerand 1.05-fold thinner than the DDW-collagen scaffolds (p < 0.001), while at 2% w/v collagen, theDAC-collagen scaffolds were 1.04-fold larger and 1.04-fold thinner than the DDW- scaffolds (p < 0.001)(Table 4).
Table 4. Weight, thickness and volume of porous scaffolds.
Sample(% w/v)
Weight (mg) Thickness (mm) Volume (µL)
DDW DAC DDW DAC DDW DAC
0.5 1.93 ± 0.06 1.87 ± 0.06 1.77 ± 0.03 0.76 ± 0.02 200.46 ± 3.90 108.34 ± 2.101 3.87 ± 0.06 3.73 ± 0.06 2.42 ± 0.03 2.30 ± 0.01 321.53 ± 4.50 282.09 ± 1.702 7.77 ± 0.06 7.30 ± 0.00 2.60 ± 0.02 2.49 ± 0.01 344.53 ± 2.38 356.60 ± 1.10
3.2.4. Cross-Linking of Porous Scaffolds
EDC was used as a protein cross-linking reagent by activating the carboxyl group and formingan amide with the amine groups of collagen (Figure 6) [29]. The remaining free amines wereused to determine the degree of cross-linking. A high free amine index indicates a low degreeof cross-linking [20]. The free amine indices of the DAC scaffolds were lower than those of theDDW-collagen scaffolds and decreased with increasing collagen concentration (p < 0.01). In contrast,there was no notable trend in the indices of the DDW-collagen scaffolds. At 2% w/v, the DDW-collagenscaffolds showed the lowest free amine index, whereas at 0.5 and 1% w/v, the free amine indices werecomparable (p > 0.05) (Figure 7).

Materials 2018, 11, 2518 10 of 16
Figure 6. Schematic representation of the reaction between 1-ethyl-3-(3-dimethylaminopropyl)carbodiimide (EDC) and collagens.
Figure 7. Free amine index of porous scaffolds. *** p < 0.001, ** p < 0.01, * p < 0.05, ns p > 0.05.
3.2.5. Water Absorbance Ability of Porous Scaffolds
The DDW-collagen scaffolds exhibited a 1.53-fold higher swelling ratio than the DAC-collagenscaffolds (107.15 ± 1.01 and 70.07 ± 1.29 gwater/gdry scaffold for DDW- and DAC-collagen scaffolds,respectively, p < 0.001) at 0.5% w/v collagen and a 1.03-fold higher swelling ratio at 1% w/v collagen(88.96 ± 0.88 and 86.18 ± 0.64 gwater/gdry scaffold for DDW- and DAC-collagen scaffolds, respectively,p < 0.01). In contrast, at 2% w/v collagen, the DDW-collagen scaffolds exhibited a 1.07-fold lowerswelling ratio than the DAC-collagen scaffolds (47.33 ± 0.45 and 50.62 ± 0.44 gwater/gdry scaffold forDDW- and DAC-collagen scaffolds, respectively, p < 0.01) (Figure 8).
Figure 8. Swelling ratios of porous scaffolds. The weight change of scaffolds after water absorptionwas measured. *** p < 0.001, ** p < 0.01.
Materials 2018, 11, 2518 11 of 16
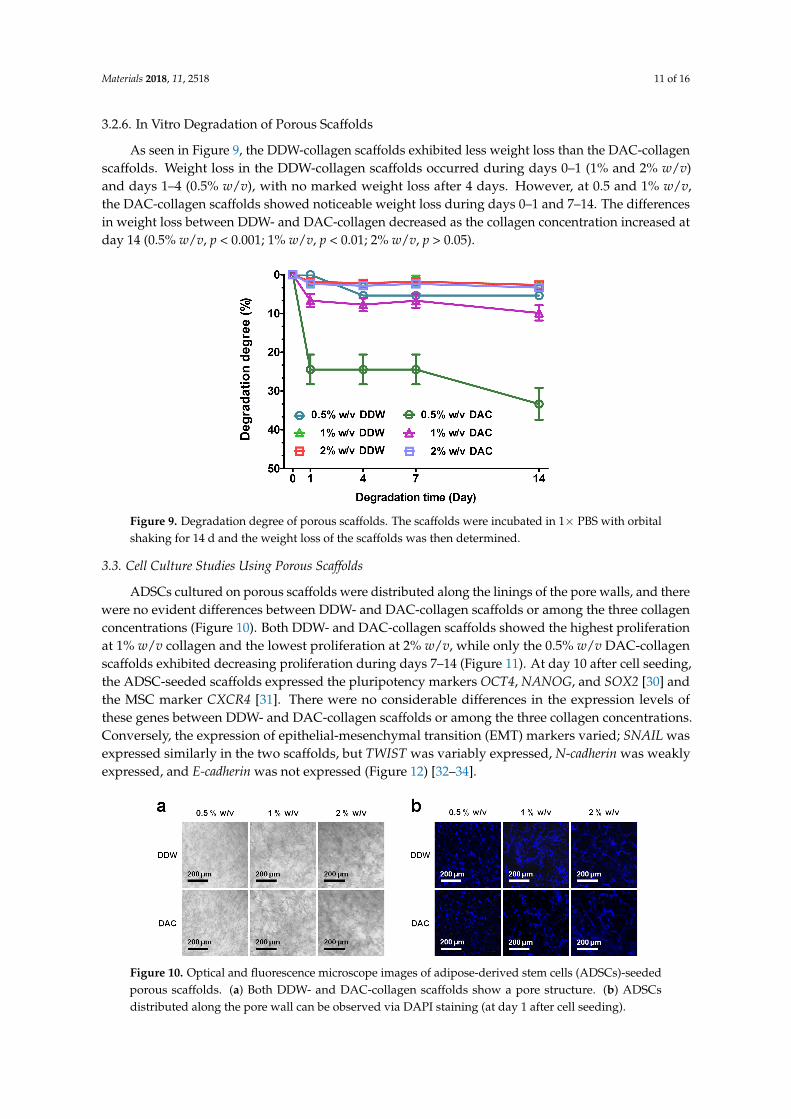
3.2.6. In Vitro Degradation of Porous Scaffolds
As seen in Figure 9, the DDW-collagen scaffolds exhibited less weight loss than the DAC-collagenscaffolds. Weight loss in the DDW-collagen scaffolds occurred during days 0–1 (1% and 2% w/v)and days 1–4 (0.5% w/v), with no marked weight loss after 4 days. However, at 0.5 and 1% w/v,the DAC-collagen scaffolds showed noticeable weight loss during days 0–1 and 7–14. The differencesin weight loss between DDW- and DAC-collagen decreased as the collagen concentration increased atday 14 (0.5% w/v, p < 0.001; 1% w/v, p < 0.01; 2% w/v, p > 0.05).
Figure 9. Degradation degree of porous scaffolds. The scaffolds were incubated in 1× PBS with orbitalshaking for 14 d and the weight loss of the scaffolds was then determined.
3.3. Cell Culture Studies Using Porous Scaffolds
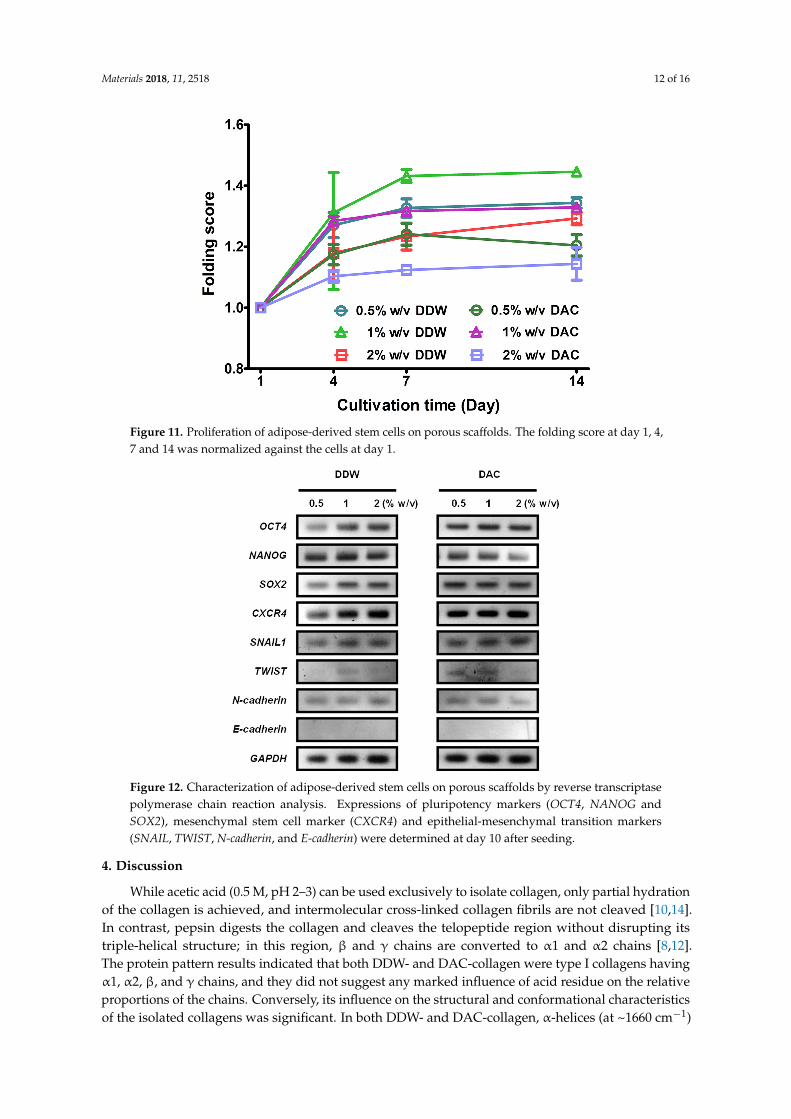
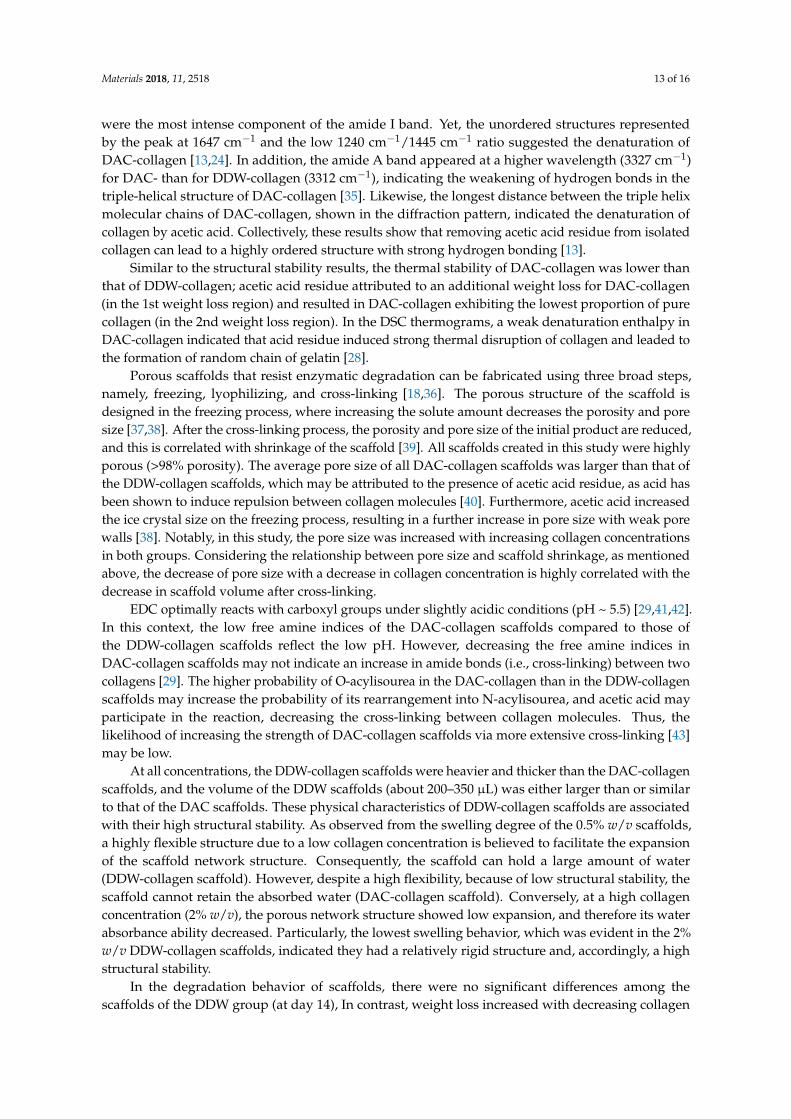
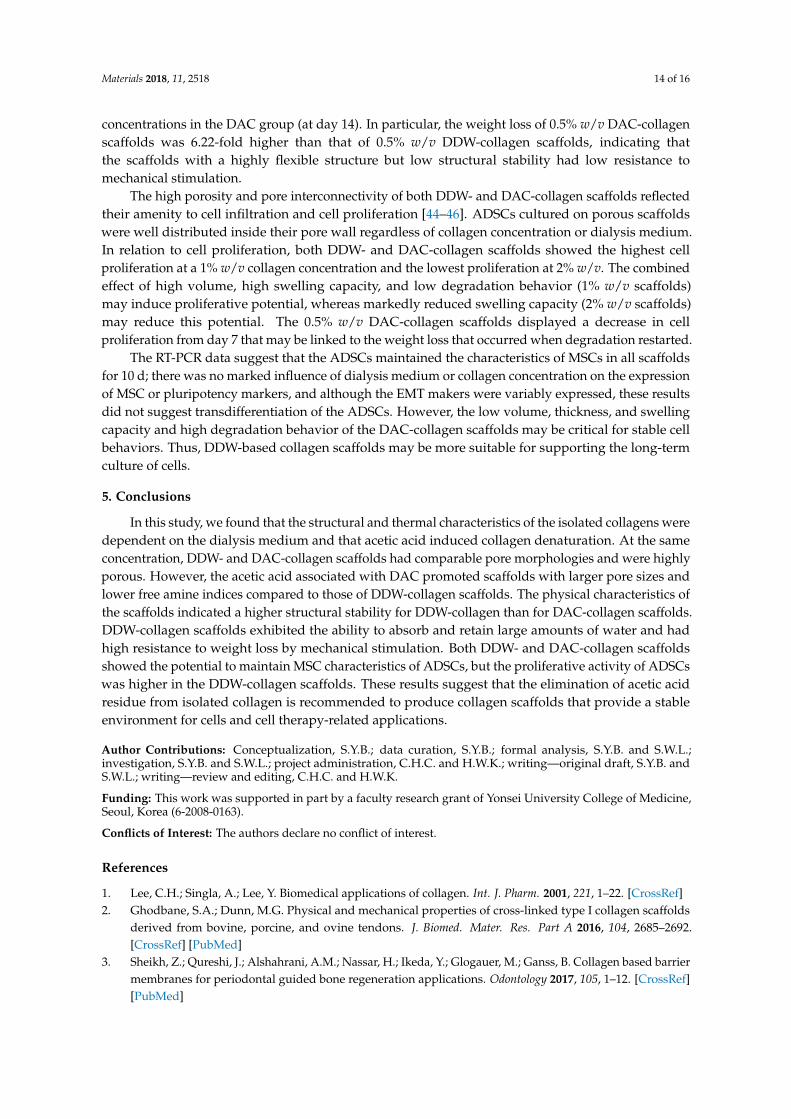
ADSCs cultured on porous scaffolds were distributed along the linings of the pore walls, and therewere no evident differences between DDW- and DAC-collagen scaffolds or among the three collagenconcentrations (Figure 10). Both DDW- and DAC-collagen scaffolds showed the highest proliferationat 1% w/v collagen and the lowest proliferation at 2% w/v, while only the 0.5% w/v DAC-collagenscaffolds exhibited decreasing proliferation during days 7–14 (Figure 11). At day 10 after cell seeding,the ADSC-seeded scaffolds expressed the pluripotency markers OCT4, NANOG, and SOX2 [30] andthe MSC marker CXCR4 [31]. There were no considerable differences in the expression levels ofthese genes between DDW- and DAC-collagen scaffolds or among the three collagen concentrations.Conversely, the expression of epithelial-mesenchymal transition (EMT) markers varied; SNAIL wasexpressed similarly in the two scaffolds, but TWIST was variably expressed, N-cadherin was weaklyexpressed, and E-cadherin was not expressed (Figure 12) [32–34].
Figure 10. Optical and fluorescence microscope images of adipose-derived stem cells (ADSCs)-seededporous scaffolds. (a) Both DDW- and DAC-collagen scaffolds show a pore structure. (b) ADSCsdistributed along the pore wall can be observed via DAPI staining (at day 1 after cell seeding).
Materials 2018, 11, 2518 12 of 16
Figure 11. Proliferation of adipose-derived stem cells on porous scaffolds. The folding score at day 1, 4,7 and 14 was normalized against the cells at day 1.
Figure 12. Characterization of adipose-derived stem cells on porous scaffolds by reverse transcriptasepolymerase chain reaction analysis. Expressions of pluripotency markers (OCT4, NANOG andSOX2), mesenchymal stem cell marker (CXCR4) and epithelial-mesenchymal transition markers(SNAIL, TWIST, N-cadherin, and E-cadherin) were determined at day 10 after seeding.
4. Discussion
While acetic acid (0.5 M, pH 2–3) can be used exclusively to isolate collagen, only partial hydrationof the collagen is achieved, and intermolecular cross-linked collagen fibrils are not cleaved [10,14].In contrast, pepsin digests the collagen and cleaves the telopeptide region without disrupting itstriple-helical structure; in this region, β and γ chains are converted to α1 and α2 chains [8,12].The protein pattern results indicated that both DDW- and DAC-collagen were type I collagens havingα1, α2, β, and γ chains, and they did not suggest any marked influence of acid residue on the relativeproportions of the chains. Conversely, its influence on the structural and conformational characteristicsof the isolated collagens was significant. In both DDW- and DAC-collagen, α-helices (at ~1660 cm−1)
Materials 2018, 11, 2518 13 of 16
were the most intense component of the amide I band. Yet, the unordered structures representedby the peak at 1647 cm−1 and the low 1240 cm−1/1445 cm−1 ratio suggested the denaturation ofDAC-collagen [13,24]. In addition, the amide A band appeared at a higher wavelength (3327 cm−1)for DAC- than for DDW-collagen (3312 cm−1), indicating the weakening of hydrogen bonds in thetriple-helical structure of DAC-collagen [35]. Likewise, the longest distance between the triple helixmolecular chains of DAC-collagen, shown in the diffraction pattern, indicated the denaturation ofcollagen by acetic acid. Collectively, these results show that removing acetic acid residue from isolatedcollagen can lead to a highly ordered structure with strong hydrogen bonding [13].
Similar to the structural stability results, the thermal stability of DAC-collagen was lower thanthat of DDW-collagen; acetic acid residue attributed to an additional weight loss for DAC-collagen(in the 1st weight loss region) and resulted in DAC-collagen exhibiting the lowest proportion of purecollagen (in the 2nd weight loss region). In the DSC thermograms, a weak denaturation enthalpy inDAC-collagen indicated that acid residue induced strong thermal disruption of collagen and leaded tothe formation of random chain of gelatin [28].
Porous scaffolds that resist enzymatic degradation can be fabricated using three broad steps,namely, freezing, lyophilizing, and cross-linking [18,36]. The porous structure of the scaffold isdesigned in the freezing process, where increasing the solute amount decreases the porosity and poresize [37,38]. After the cross-linking process, the porosity and pore size of the initial product are reduced,and this is correlated with shrinkage of the scaffold [39]. All scaffolds created in this study were highlyporous (>98% porosity). The average pore size of all DAC-collagen scaffolds was larger than that ofthe DDW-collagen scaffolds, which may be attributed to the presence of acetic acid residue, as acid hasbeen shown to induce repulsion between collagen molecules [40]. Furthermore, acetic acid increasedthe ice crystal size on the freezing process, resulting in a further increase in pore size with weak porewalls [38]. Notably, in this study, the pore size was increased with increasing collagen concentrationsin both groups. Considering the relationship between pore size and scaffold shrinkage, as mentionedabove, the decrease of pore size with a decrease in collagen concentration is highly correlated with thedecrease in scaffold volume after cross-linking.
EDC optimally reacts with carboxyl groups under slightly acidic conditions (pH ~ 5.5) [29,41,42].In this context, the low free amine indices of the DAC-collagen scaffolds compared to those ofthe DDW-collagen scaffolds reflect the low pH. However, decreasing the free amine indices inDAC-collagen scaffolds may not indicate an increase in amide bonds (i.e., cross-linking) between twocollagens [29]. The higher probability of O-acylisourea in the DAC-collagen than in the DDW-collagenscaffolds may increase the probability of its rearrangement into N-acylisourea, and acetic acid mayparticipate in the reaction, decreasing the cross-linking between collagen molecules. Thus, thelikelihood of increasing the strength of DAC-collagen scaffolds via more extensive cross-linking [43]may be low.
At all concentrations, the DDW-collagen scaffolds were heavier and thicker than the DAC-collagenscaffolds, and the volume of the DDW scaffolds (about 200–350 µL) was either larger than or similarto that of the DAC scaffolds. These physical characteristics of DDW-collagen scaffolds are associatedwith their high structural stability. As observed from the swelling degree of the 0.5% w/v scaffolds,a highly flexible structure due to a low collagen concentration is believed to facilitate the expansionof the scaffold network structure. Consequently, the scaffold can hold a large amount of water(DDW-collagen scaffold). However, despite a high flexibility, because of low structural stability, thescaffold cannot retain the absorbed water (DAC-collagen scaffold). Conversely, at a high collagenconcentration (2% w/v), the porous network structure showed low expansion, and therefore its waterabsorbance ability decreased. Particularly, the lowest swelling behavior, which was evident in the 2%w/v DDW-collagen scaffolds, indicated they had a relatively rigid structure and, accordingly, a highstructural stability.
In the degradation behavior of scaffolds, there were no significant differences among thescaffolds of the DDW group (at day 14), In contrast, weight loss increased with decreasing collagen
Materials 2018, 11, 2518 14 of 16
concentrations in the DAC group (at day 14). In particular, the weight loss of 0.5% w/v DAC-collagenscaffolds was 6.22-fold higher than that of 0.5% w/v DDW-collagen scaffolds, indicating thatthe scaffolds with a highly flexible structure but low structural stability had low resistance tomechanical stimulation.
The high porosity and pore interconnectivity of both DDW- and DAC-collagen scaffolds reflectedtheir amenity to cell infiltration and cell proliferation [44–46]. ADSCs cultured on porous scaffoldswere well distributed inside their pore wall regardless of collagen concentration or dialysis medium.In relation to cell proliferation, both DDW- and DAC-collagen scaffolds showed the highest cellproliferation at a 1% w/v collagen concentration and the lowest proliferation at 2% w/v. The combinedeffect of high volume, high swelling capacity, and low degradation behavior (1% w/v scaffolds)may induce proliferative potential, whereas markedly reduced swelling capacity (2% w/v scaffolds)may reduce this potential. The 0.5% w/v DAC-collagen scaffolds displayed a decrease in cellproliferation from day 7 that may be linked to the weight loss that occurred when degradation restarted.
The RT-PCR data suggest that the ADSCs maintained the characteristics of MSCs in all scaffoldsfor 10 d; there was no marked influence of dialysis medium or collagen concentration on the expressionof MSC or pluripotency markers, and although the EMT makers were variably expressed, these resultsdid not suggest transdifferentiation of the ADSCs. However, the low volume, thickness, and swellingcapacity and high degradation behavior of the DAC-collagen scaffolds may be critical for stable cellbehaviors. Thus, DDW-based collagen scaffolds may be more suitable for supporting the long-termculture of cells.
5. Conclusions
In this study, we found that the structural and thermal characteristics of the isolated collagens weredependent on the dialysis medium and that acetic acid induced collagen denaturation. At the sameconcentration, DDW- and DAC-collagen scaffolds had comparable pore morphologies and were highlyporous. However, the acetic acid associated with DAC promoted scaffolds with larger pore sizes andlower free amine indices compared to those of DDW-collagen scaffolds. The physical characteristics ofthe scaffolds indicated a higher structural stability for DDW-collagen than for DAC-collagen scaffolds.DDW-collagen scaffolds exhibited the ability to absorb and retain large amounts of water and hadhigh resistance to weight loss by mechanical stimulation. Both DDW- and DAC-collagen scaffoldsshowed the potential to maintain MSC characteristics of ADSCs, but the proliferative activity of ADSCswas higher in the DDW-collagen scaffolds. These results suggest that the elimination of acetic acidresidue from isolated collagen is recommended to produce collagen scaffolds that provide a stableenvironment for cells and cell therapy-related applications.
Author Contributions: Conceptualization, S.Y.B.; data curation, S.Y.B.; formal analysis, S.Y.B. and S.W.L.;investigation, S.Y.B. and S.W.L.; project administration, C.H.C. and H.W.K.; writing—original draft, S.Y.B. andS.W.L.; writing—review and editing, C.H.C. and H.W.K.
Funding: This work was supported in part by a faculty research grant of Yonsei University College of Medicine,Seoul, Korea (6-2008-0163).
Conflicts of Interest: The authors declare no conflict of interest.
References
1. Lee, C.H.; Singla, A.; Lee, Y. Biomedical applications of collagen. Int. J. Pharm. 2001, 221, 1–22. [CrossRef]2. Ghodbane, S.A.; Dunn, M.G. Physical and mechanical properties of cross-linked type I collagen scaffolds
derived from bovine, porcine, and ovine tendons. J. Biomed. Mater. Res. Part A 2016, 104, 2685–2692.[CrossRef] [PubMed]
3. Sheikh, Z.; Qureshi, J.; Alshahrani, A.M.; Nassar, H.; Ikeda, Y.; Glogauer, M.; Ganss, B. Collagen based barriermembranes for periodontal guided bone regeneration applications. Odontology 2017, 105, 1–12. [CrossRef][PubMed]
Materials 2018, 11, 2518 15 of 16
4. Ashworth, J.C.; Mehr, M.; Buxton, P.G.; Best, S.M.; Cameron, R.E. Optimising collagen scaffold architecturefor enhanced periodontal ligament fibroblast migration. J. Mater. Sci. Mater. Med. 2018, 29, 166. [CrossRef][PubMed]
5. Friess, W. Collagen-biomaterial for drug delivery. Eur. J. Pharm. Biopharm. 1998, 45, 113–136. [CrossRef]6. Kreger, S.T.; Bell, B.J.; Bailey, J.; Stites, E.; Kuske, J.; Waisner, B.; Voytik-Harbin, S.L. Polymerization and
matrix physical properties as important design considerations for soluble collagen formulations. Biopolymers2010, 93, 690–707. [CrossRef] [PubMed]
7. Delgado, L.M.; Shologu, N.; Fuller, K.; Zeugolis, D.I. Acetic acid and pepsin result in high yield, highpurity and low macrophage response collagen for biomedical applications. Biomed. Mater. 2017, 12, 065009.[CrossRef]
8. Sato, K.; Ebihara, T.; Adachi, E.; Kawashima, S.; Hattori, S.; Irie, S. Possible involvement of aminotelopeptidein self-assembly and thermal stability of collagen I as revealed by its removal with proteases. J. Biol. Chem.2000, 275, 25870–25875. [CrossRef]
9. Mocan, E.; Tagadiuc, O.; Nacu, V. Aspects of collagen isolation procedure. Curierul Med. 2011, 2, 3–5.10. Tan, C.C.; Karim, A.A.; Latiff, A.A.; Gan, C.Y.; Ghazali, F.C. Extraction and characterization of
pepsin-solubilized collagen from the body wall of crown-of-thorns starfish (Acanthaster planci). Int. FoodRes. J. 2013, 20, 3013–3020.
11. Stamov, D.R.; Pompe, T. Structure and function of ECM-inspired composite collagen type I scaffolds.Soft Matter. 2012, 8, 10200–10212. [CrossRef]
12. Matmaroh, K.; Benjakul, S.; Prodpran, T.; Encarnacion, A.B.; Kishimura, H. Characteristics of acid solublecollagen and pepsin soluble collagen from scale of spotted golden goatfish (Parupeneus heptacanthus).Food Chem. 2011, 129, 1179–1186. [CrossRef] [PubMed]
13. Skopinska-Wisniewska, J.; Olszewski, K.; Bajek, A.; Rynkiewicz, A.; Sionkowska, A. Dialysis as a method ofobtaining neutral collagen gels. Mater. Sci. Eng. C Mater. Biol. Appl. 2014, 40, 65–70. [CrossRef] [PubMed]
14. Yang, H.; Shu, Z. The extraction of collagen protein from pigskin. J. Chem. Pharm. Res. 2014, 6, 683–687.15. Silvipriya, K.S.; Kumar, K.K.; Bhat, A.R.; Kumar, B.D.; John, A.; Lakshmanan, P. Collagen: Animal sources
and biomedical application. J. Appl. Pharm. Sci. 2015, 5, 123–127. [CrossRef]16. Bak, S.Y.; Yoon, G.J.; Lee, S.W.; Kim, H.W. Effect of humidity and benign solvent composition on
electrospinning of collagen nanofibrous sheets. Mater. Lett. 2016, 181, 136–139. [CrossRef]17. Laemmli, U.K. Cleavage of structural proteins during the assembly of the head of bacteriophage T4. Nature
1970, 227, 680–685. [CrossRef] [PubMed]18. Park, S.N.; Park, J.C.; Kim, H.O.; Song, M.J.; Suh, H. Characterization of porous collagen/hyaluronic
acid scaffold modified by 1-ethyl-3-(3-dimethylaminopropyl)carbodiimide cross-linking. Biomaterials 2002,23, 1205–1212. [CrossRef]
19. Liu, Y.; Ma, L.; Gao, C. Facile fabrication of the glutaraldehyde cross-linked collagen/chitosan porousscaffold for skin tissue engineering. Mater. Sci. Eng. C 2012, 32, 2361–2366. [CrossRef]
20. Lin, Y.K.; Liu, D.C. Studies of novel hyaluronic acid-collagen sponge materials composed of two differentspecies of type I collagen. J. Biomater. Appl. 2007, 21, 265–281. [CrossRef]
21. Nagai, T.; Nobutaka, S.; Tanoue, Y.; Kai, N.; Nagashima, T. Characterization of acid-soluble collagen fromskins of surf smelt (Hypomesus pretiosus japonicus Brevoort). Food Nutr. Sci. 2010, 1, 59–66. [CrossRef]
22. Greve, T.M.; Andersen, K.B.; Nielsen, O.F. Atr-ftir, ft-nir and near-ft-raman spectroscopic studies of molecularcomposition in human skin in vivo and pig ear skin in vitro. Spectroscopy 2008, 22, 437–457. [CrossRef]
23. Gasior-Glogowska, M.; Komorowska, M.; Hanuza, J.; Ptak, M.; Kobielarz, M. Structural alteration of collagenfibres-spectroscopic and mechanical studies. Acta Bioeng. Biomech. 2010, 12, 55–62. [PubMed]
24. Chadefaux, C.; Hô, A.-S.L.; Bellot-Gurlet, L.; Reiche, I. Curve-fitting Micro-ATR-FTIR studies of the amide Iand II bands of type I collagen archaeological bone materials. e-Preserv. Sci. 2009, 6, 129–137.
25. Gullekson, C.; Lucas, L.; Hewitt, K.; Kreplak, L. Surface-sensitive raman spectroscopy of collagen I fibrils.Biophys. J. 2011, 100, 1837–1845. [CrossRef] [PubMed]
26. Meng, Z.; Zheng, X.; Tang, K.; Liu, J.; Ma, Z.; Zhao, Q. Dissolution and regeneration of collagen fibers usingionic liquid. Int. J. Biol. Macromol. 2012, 51, 440–448. [CrossRef]
27. Wu, B.; Mu, C.; Zhang, G.; Lin, W. Effects of cr3+ on the structure of collagen fiber. Langmuir 2009,25, 11905–11910. [CrossRef]
Materials 2018, 11, 2518 16 of 16
28. Samouillan, V.; Delaunay, F.; Dandurand, J.; Merbahi, N.; Gardou, J.-P.; Yousfi, M.; Gandaglia, A.; Spina, M.;Lacabanne, C. The use of thermal techniques for the characterization and selection of natural biomaterials.J. Funct. Biomater. 2011, 2, 230–248. [CrossRef]
29. Olde Damink, L.H.; Dijkstra, P.J.; van Luyn, M.J.; van Wachem, P.B.; Nieuwenhuis, P.; Feijen, J. Cross-linkingof dermal sheep collagen using a water-soluble carbodiimide. Biomaterials 1996, 17, 765–773. [CrossRef]
30. Riekstina, U.; Cakstina, I.; Parfejevs, V.; Hoogduijn, M.; Jankovskis, G.; Muiznieks, I.; Muceniece, R.;Ancans, J. Embryonic stem cell marker expression pattern in human mesenchymal stem cells derived frombone marrow, adipose tissue, heart and dermis. Stem Cell Rev. 2009, 5, 378–386. [CrossRef]
31. Kollar, K.; Cook, M.M.; Atkinson, K.; Brooke, G. Molecular mechanisms involved in mesenchymal stem cellmigration to the site of acute myocardial infarction. Int. J. Cell Biol. 2009, 2009, 904682. [CrossRef] [PubMed]
32. Lee, J.M.; Dedhar, S.; Kalluri, R.; Thompson, E.W. The epithelial-mesenchymal transition: New insights insignaling, development, and disease. J. Cell Biol. 2006, 172, 973–981. [CrossRef] [PubMed]
33. Li, L.; Bennett, S.A.; Wang, L. Role of e-cadherin and other cell adhesion molecules in survival anddifferentiation of human pluripotent stem cells. Cell Adhes. Migr. 2012, 6, 59–70. [CrossRef] [PubMed]
34. Yang, W.N.; Ai, Z.H.; Wang, J.; Xu, Y.L.; Teng, Y.C. Correlation between the overexpression of epidermalgrowth factor receptor and mesenchymal makers in endometrial carcinoma. J. Gynecol. Oncol. 2014, 25, 36–42.[CrossRef] [PubMed]
35. Kiew, P.L.; Don, M.M. The influence of acetic acid concentration on the extractability of collagen from theskin of hybrid Clarias sp. and its physicochemical properties: A preliminary study. Focus Mod. Food Ind. 2013,2, 123–128.
36. Maji, K.; Dasgupta, S.; Pramanik, K.; Bissoyi, A. Preparation and evaluation of gelatin-chitosan-nanobioglass3d porous scaffold for bone tissue engineering. Int. J. Biomater. 2016, 2016, 9825659. [CrossRef] [PubMed]
37. Kang, H.W.; Tabata, Y.; Ikada, Y. Fabrication of porous gelatin scaffolds for tissue engineering. Biomaterials1999, 20, 1339–1344. [CrossRef]
38. Pawelec, K.M.; Husmann, A.; Wardale, R.J.; Best, S.M.; Cameron, R.E. Ionic solutes impact collagen scaffoldbioactivity. J. Mater. Sci. Mater. Med. 2015, 26, 91. [CrossRef]
39. Grover, C.N.; Cameron, R.E.; Best, S.M. Investigating the morphological, mechanical and degradationproperties of scaffolds comprising collagen, gelatin and elastin for use in soft tissue engineering. J. Mech.Behav. Biomed. Mater. 2012, 10, 62–74. [CrossRef]
40. Singha, P.; Benjakula, S.; Maqsooda, S.; Kishimura, H. Isolation and characterisation of collagen extractedfrom the skin of striped catfish (Pangasianodon hypophthalmus). Food Chem. 2011, 124, 97–105. [CrossRef]
41. Ma, L.; Gao, C.; Mao, Z.; Zhou, J.; Shen, J. Enhanced biological stability of collagen porous scaffolds by usingamino acids as novel cross-linking bridges. Biomaterials 2004, 25, 2997–3004. [CrossRef] [PubMed]
42. Liu, Y.; Gan, L.; Carlsson, D.J.; Fagerholm, P.; Lagali, N.; Watsky, M.A.; Munger, R.; Hodge, W.G.; Priest, D.;Griffith, M. A simple, cross-linked collagen tissue substitute for corneal implantation. Investig. Ophthalmol.Vis. Sci. 2006, 47, 1869–1875. [CrossRef] [PubMed]
43. Davidenko, N.; Schuster, C.F.; Bax, D.V.; Raynal, N.; Farndale, R.W.; Best, S.M.; Cameron, R.E. Control ofcrosslinking for tailoring collagen-based scaffolds stability and mechanics. Acta Biomater. 2015, 25, 131–142.[CrossRef] [PubMed]
44. Leong, K.F.; Chua, C.K.; Sudarmadji, N.; Yeong, W.Y. Engineering functionally graded tissue engineeringscaffolds. J. Mech. Behav. Biomed. Mater. 2008, 1, 140–152. [CrossRef] [PubMed]
45. Loh, Q.L.; Choong, C. Three-dimensional scaffolds for tissue engineering applications: Role of porosity andpore size. Tissue Eng. Part B Rev. 2013, 19, 485–502. [CrossRef] [PubMed]
46. Xu, C.; Lu, W.; Bian, S.; Liang, J.; Fan, Y.; Zhang, X. Porous collagen scaffold reinforced with surfacedactivated PLLA nanoparticles. Sci. World J. 2012, 24, 695137. [CrossRef] [PubMed]
© 2018 by the authors. Licensee MDPI, Basel, Switzerland. This article is an open accessarticle distributed under the terms and conditions of the Creative Commons Attribution(CC BY) license (http://creativecommons.org/licenses/by/4.0/).