Embed Size (px)
Citation preview
ASSESSMENTOFTHEECONOMICIMPACTOFTELECOMMUNICATIONSINTHEMIDDLEEASTANDNORTHAFRICA
December2016
TelecomAdvisoryServices,LLC

2
ExecutiveSummary1
The telecommunications sector generates a significant direct contribution to the economy of thecountriesunderstudy,representing3.7%ofthetotal2014GrossDomesticProduct:• The telecommunications industrygross revenuescomprised3.2%ofTunisia’seconomy in2014,3.7% inMorocco
and4.3%inJordan.• Thesectorgeneratedapproximately0.5%oftheaggregateworkforceofthethreecountriesin2013:1%inJordan,
0.5%inMoroccoandinTunisia.Beyond the direct effects, telecommunications have a significant spill-over impact on the rest of theeconomy:• Theaveragecontributionforevery10%increaseofmobilepenetrationtotheannualGDPisestimatedat1.1%of
GDPgrowthforTunisia,to1.4%orMorocco,and1.2%inJordan.• Inparticular,theaveragecontributiontotheannualGDPgrowthforevery10%increaseinmobilebroadband
penetrationrangesbetweenanestimated0.4%forJordan,and0.5%forMorocco2.• Finally,theaveragecontributiontotheannualGDPgrowthforevery10%increaseinfixedbroadbandpenetration
isestimatedat0.7%forJordan,0.8%forMoroccoand1.0%forTunisia.Asaresult:• Mobile telecommunications indirectly contributed1.0%of the2014GDP in Jordan,1.5% inMorocco, and1.1% in
Tunisia.• Fixedbroadbandcontributed1.1%ofthe2014GDPinJordan,0.7%inMorocco,0.5%inTunisia.Therefore, thecombined indirectcontributionrepresentedapproximately2%of the threecountries’2014GDP:2.1%inJordan,1.5%inTunisia,and2.2%inMorocco,andtheaggregatedirectandindirecteffectsofthetelecommunicationssectorrepresented5.7%forthethreecountries’2014GDP:6.4%inJordan,5.9%inMorocco,and4.7%inTunisia.
Directandindirectcontributionsoftelecommunicationstotheeconomy(2014)
Jordan Morocco Tunisia Total
Directcontributiontotheeconomy
ParticipationintheGDP(2014) 4.3% 3.7% 3.2% 3.7%
Weightintheworkforce(2013) 1.0% 0.5% 0.5% 0.5%
Spill-overimpact:ContributiontoGDPgrowthforevery10%penetrationincrease
Mobiletelecommunications 1.2%* 1.4%* 1.1%**
Fixedbroadband 0.7%*** 0.8%*** 1.0%****
Spill-overimpact:WeightintheGDPin2014
Mobiletelecommunications 1.0% 1.5% 1.1% 1.3%
Fixedbroadband 1.1% 0.7% 0.5% 0.7%
DirectandIndirectimpactofannualGDP(2014estimate) 6.4% 5.9% 4.7% 5.7%
Source:TelecomAdvisoryServicesanalysisBasedonhistoricaltimeseries:*2001-2014**2003-2014***2006-2014****2009-2014
ImplicationsGiven theeconomic importanceof telecommunications,publicpolicies and regulatory frameworksneed tobedefined inordertomaximizeinvestmentinnetworkdeploymentandmodernization.
1Executive Summary of the study “Assessment of the Economic Impact of Telecommunications in the Middle East end North Africa”December 2016) conducted for Orange by Telecom Advisory Services, LCC [Raul Katz : Director of Business Strategy Research at theColumbiaInstituteforTele-Information,FernandoCallorda:ProfessorintheManagementDepartmentattheESEADE(Argentina),CatherinePatel.Forfullreports:http://www.citicolumbia.org/index.php/publications/published-papers/2016-papers/2Mobilebroadbandindirectcontributiontoeconomicgrowthisalreadycapturedwithintheimpactofmobiletelecommunications.ItsmorerecentlaunchinTunisiapreventsfromestimatingitscontribution.
AssessmentoftheEconomicImpactofTelecommunicationsintheMiddleEastandNorthAfrica:Jordan,Tunisia,andMorocco

Authors
¢ Raul Katz (Ph.D., Management Science and Political Science; MS, CommunicationsTechnology and Policy, Massachusetts Institute of Technology) is currently Director ofBusinessStrategyResearchattheColumbiaInstituteforTele-Information,andPresidentof Telecom Advisory Services, LLC. Before founding Telecom Advisory Services, heworked for twenty years at Booz Allen Hamilton, where he was the Head of theTelecommunicationsPractice inNorthandLatinAmericaandmemberof itsLeadershipTeam.
¢ Mr.FernandoCallorda(BA,MA,Economics,UniversidaddeSanAndres-Argentina)isan
Assistant Professor in the Management Department at the ESEADE (Argentina) and aconsultant with Telecom Advisory Services, LLC. Before joining Telecom AdvisoryServices,hewasastaffanalystinArgentina’sCongress.
¢ Ms.CatherinePatel(BA,Mathematics,UniversityofSt.Andrews-Scotland)isaresearch
assistantwithTelecomAdvisoryServices.
The following study was funded by the General Secretariat of Orange. The viewsexpressed in the report are those of the authors and do not necessarily reflect theopinionsofOrange.

4
TableofContents
SummaryofFindings
1. Introduction
2. Impactofmobiletelephonyandbroadbandontheeconomy:areviewoftheliterature
3. TheeconomiesofthreecountriesofMiddleEastandNorthAfrica
3.1 Jordan3.2 Tunisia3.3 Morocco
4. ThetelecommunicationsindustryintheMiddleEastandNorthAfrica
4.1 Telecommunicationsdemand4.2 Telecommunicationssupply
5. TheeconomicimpactoftelecommunicationsintheMiddleEastandNorthAfrica
5.1 Directeconomiccontribution5.2 Indirecteconomiccontribution
5.2.1 DataAvailability5.2.2 Mobiletelecommunicationseconomicimpact5.2.3 MobileBroadbandeconomicimpact5.2.4. FixedBroadbandeconomicimpact
5.3 TotalcontributionofthetelecommunicationsindustrytotheGDPoftheMiddleEastandNorthAfrica
6. Policyimplicationstomaximizetheeconomicimpactoftelecommunicationsin
theMiddleEastandNorthAfrica
7. ConclusionBibliographyAppendicesA. DataSources
5
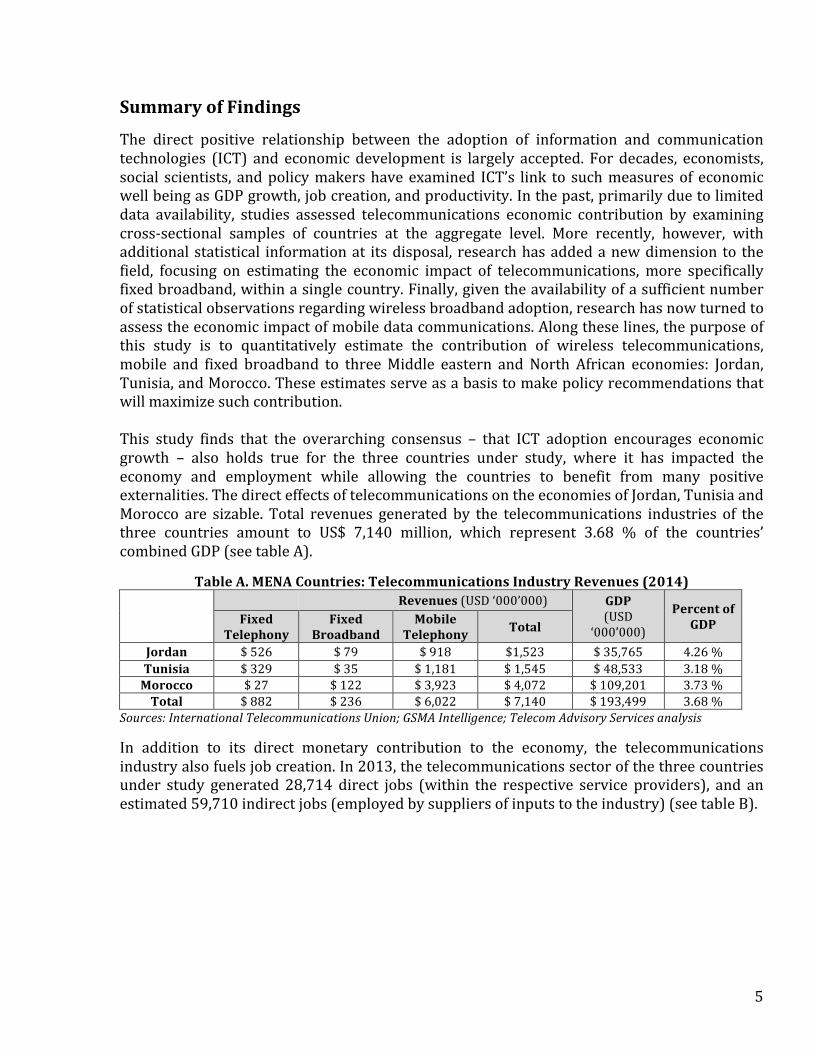
SummaryofFindings The direct positive relationship between the adoption of information and communicationtechnologies (ICT) and economic development is largely accepted. For decades, economists,social scientists, andpolicymakershaveexamined ICT’s link to suchmeasuresof economicwellbeingasGDPgrowth,jobcreation,andproductivity.Inthepast,primarilyduetolimiteddata availability, studies assessed telecommunications economic contribution by examiningcross-sectional samples of countries at the aggregate level. More recently, however, withadditionalstatistical informationat itsdisposal, researchhasaddedanewdimension to thefield, focusing on estimating the economic impact of telecommunications, more specificallyfixedbroadband,withinasinglecountry.Finally,giventheavailabilityofasufficientnumberofstatisticalobservationsregardingwirelessbroadbandadoption,researchhasnowturnedtoassesstheeconomicimpactofmobiledatacommunications.Alongtheselines,thepurposeofthis study is to quantitatively estimate the contribution of wireless telecommunications,mobile and fixed broadband to threeMiddle eastern and North African economies: Jordan,Tunisia,andMorocco.Theseestimatesserveasabasistomakepolicyrecommendationsthatwillmaximizesuchcontribution.This study finds that the overarching consensus – that ICT adoption encourages economicgrowth – also holds true for the three countries under study, where it has impacted theeconomy and employment while allowing the countries to benefit from many positiveexternalities.ThedirecteffectsoftelecommunicationsontheeconomiesofJordan,TunisiaandMorocco are sizable. Total revenues generated by the telecommunications industries of thethree countries amount to US$ 7,140 million, which represent 3.68 % of the countries’combinedGDP(seetableA).
TableA.MENACountries:TelecommunicationsIndustryRevenues(2014)
Revenues(USD‘000’000) GDP(USD
‘000’000)
PercentofGDPFixed
TelephonyFixed
BroadbandMobile
Telephony Total
Jordan $526 $79 $918 $1,523 $35,765 4.26%Tunisia $329 $35 $1,181 $1,545 $48,533 3.18%Morocco $27 $122 $3,923 $4,072 $109,201 3.73%Total $882 $236 $6,022 $7,140 $193,499 3.68%
Sources:InternationalTelecommunicationsUnion;GSMAIntelligence;TelecomAdvisoryServicesanalysis
In addition to its direct monetary contribution to the economy, the telecommunicationsindustryalsofuelsjobcreation.In2013,thetelecommunicationssectorofthethreecountriesunder study generated 28,714 direct jobs (within the respective service providers), and anestimated59,710indirectjobs(employedbysuppliersofinputstotheindustry)(seetableB).

6
TableB.MENACountries:TelecommunicationsIndustryEmployment(2013)
Directjobs IndirectJobs(*)
DirectandIndirectJobs(*)
CountryWorkforce
PercentofTotalWorkforce
Jordan 4,214 7,710 11,924 1,198,000 1.00%Tunisia 11,000 10,000 21,000 3,978,000 0.53%Morocco 13,500 42,000 55,000 12,255,000 0.45%Total 28,714 59,710 87,924 17,431,00 0.50%(*)Note:estimationbyTelecomAdvisoryServicesLLCbasedontheresearch-basedassumptionscontainedinthedigitizationmodelinKatz,R.,Koutroumpis,P.andCallorda,F.(2014).“Usingadigitizationindextomeasureeconomicandsocialimpactofdigitalagendas”,Info,January.InthecaseofJordan,theauthorsbelievethistobealowestimategiventhatthecountrycounts3,600pointsofsaleofSIMcardsand25,000pointstorefillcards.Sources:InternationalTelecommunicationsUnion;Telecommunicationsoperators;GSMAIntelligence;TelecomAdvisoryServicesanalysisFurthermore,beyondtheirdirecteconomiccontribution, thetelecommunications industries’spillover effects have positively impacted the economy in all three countries. Thus, thetelecommunications industry indirectly contributes appropriately 2.00% of the GDP of thethreecountries(seetableC).
TableC.MENACountries:Indirectcontributionofmobiletelecommunicationsandfixedbroadbandtotheeconomy(2014)
IndirectContribution(USD‘000’000)Total GDP(USD
‘000’000)Percentof
GDPMobileTelecommunications(*)
FixedBroadband
Jordan $375 $401 $776 $35,765 2.17%Tunisia $524 $225 $749 $48,533 1.54%Morocco $1,597 $750 $2,347 $109,201 2.15%Total 2,496 $1,376 $3,872 $193,499 2.00%(*) It should bementioned that themobile broadband impact is also included in the contribution of mobiletelecommunications.Sources:TelecomAdvisoryServicesanalysisThecombinationofdirectandindirecteffectsyieldsatotalcontributionof5.69%oftheGDP(seetableD).TableD.MENACountries:TelecommunicationsDirectandIndirectContributiontoGDP(inUS$
millionsunlessindicated) Jordan Tunisia Morocco Total
NationalGDP(2012) US$35,765 US$48,533 US$109,201 US$193,499DirectTelecommunicationsImpact US$1,523 US$1,545 US$4,072 US$7,140IndirectTelecommunicationsImpact US$776 US$749 US$2,347 US$3,872TotalTelecommunicationsImpact US$2,299 US$2,294 US$6,419 US$11,012PercentofNationalGDP 6.43% 4.72% 5.88% 5.69%Source:TASanalysisThestrongcontributionoftelecommunicationstotheeconomiesofthethreecountriesstudiedisafunctionoftwofactors:
• The sector dynamism: the telecommunications sector is growing, generating in turndirectandindirectjobs.Infact,telecommunicationsoperatorstriggertheemergenceof
7
a significantnumberof local suppliers,distributionsagents, andprovidersofvariousservices,whichenhancethelocalvalueaddedtotheeconomy.
• The positive externalities (“Spill-over effects”): telecommunications networks andservicesresultinamoreefficientfunctioningoftheeconomyparticularlyintermsof:
o Productivitygainsinexistingsectors(suchastourism,exports,manufacturing)aswellassocialservices,suchaseducationandpublicadministration;
o Innovation incentives, leading to the creation of newbusinesses in the digitaleconomy(applications,softwareplatforms,localcontent);
o Integration of isolated regions, leading to further development of economicactivities;
o Better coordination among economic agents through improved knowledge ofinputsmarket prices (agriculture), resulting in lower transaction costs amongindustries’ value chain firms, enhanced ability to negotiate selling prices,inventorymanagementanddeliverytracking;
o Improvementandextensionofdomesticeconomicexchanges,bothattheregionalandglobalscale.
Given the economic importance of telecommunications, public policies and regulatoryframeworksneedtobedefinedinordertomaximizeinvestmentinnetworkdeploymentandmodernization, particularly inmobile broadband. Policies should focus on two dimensions.First, the current level of competition resulting from the industry structure is sufficient togenerate enough static and dynamicwelfare benefits, aswitnessed by price reductions andintensiveproduct innovation. Along these lines, thegovernment shouldnot considerpolicyremedies oriented towards increasing the number of industry players. Second, current taxburdenimposedonthetelecommunicationssectorcontributesdirectlyandsignificantlytothetotalcostofmobileownershipforJordanianconsumersandcreatesbarrierstoaffordability.Researchhasshownthatareductionintaxationhasapositiveimpactontechnologyadoption,whichinturnmaximizestelecommunicationseconomicimpactcompensatingsignificantlyfortheforegoneshort-termrevenuestotheNationalTreasury.

8
1.Introduction The relationshipbetween information and communication technologies (ICT) andeconomicdevelopment has long interested social scientists and policy makers alike. Since the mid-1970s,developmentbanks,foundations,andacademicshaveworkednotonlytounderstand,butalsotomeasurequantitativelyICT’seconomiccontribution,focusingonsuchareasasGDPgrowth,jobcreation,andproductivity.Through these investigations, researchhas reliedon the studyof cross-sectional samplesofcountries,typicallylimitingthescopetodata-richOECDcountriesorworldwideanalysisdueto data availability restrictions. This methodology admittedly offered a great deal ofknowledgetothefieldandcurrentworkcontinuestoemploythisapproach.Thatsaid,enabledbyimproveddataavailability,researchhasstartedtoextenditsreach,shiftingfromaglobalview to hone in onmore country-specific data and findings. As an example, to understandbroadband’s economic impact, theauthorshave conducted studies forGermany (Katzet al.,2010), theUnited States (Katz and Suter, 2009;Katz et al, 2011), CostaRica (Katz, 2011b),Chile(Katz,2012),Colombia(Katzetal.,2011c),Philippines(Katzetal,2012),Ecuador(Katzetal.,2013),andFrancophoneAfrica(Katzetal.,2013).The following studyanalyzes the impactofwirelessandbroadbandcommunicationson theeconomies of three Middle East and North Africa (MENA) countries: Jordan, Morocco, andTunisia. Timing, existing adoption conditions, and market maturity all determine ICT’seconomiceffect.Assupportedbymultiplestudies(Hardy,1980;Jorgensonetal.,2006;Karnerand Onyeji, 2007), the introduction of a new technology does not immediately producesignificant economic effects. In this context, a comparison of three country-specific studiesprovides a perspective of the relationship between timing of technology adoption andeconomiceffects.Bytheendof2014mobiletelecommunicationsusedbythemajorityoftheMENA population (Jordan: 127% penetration; Morocco: 131%; Tunisia: 142%)3, reflect amature market that has demonstrably affected the economies of all three countries. Tomeasure this impact, this studyemploys a structuralmodel thatdependson four equationsmodellingthemarketoperationbetween2001and2014takingintoaccount:
• Endogenous growth from existing capital and labor together with thetelecommunicationsinfrastructuremetrics;
• Demand for telecommunications services depending on the price and adoptionpatterns;
• Supply and competition of telecommunications taking into account the regulatoryandinfrastructuralinvestmentsintelecommunications;and
• Revenuesandoutputsofthetelecommunicationsmarketasaproxyforthe‘health’andsustainabilityofthemarket.
To offer a context for its approach, this study first provides a brief literature review ofresearch conducted to assess the economic impact of telecommunications, introducing therecent empirical literature regarding the contribution ofmobile broadband (chapter 2). An3Source:GSMAIntelligence.

9
overview of theMENA countries’ economy follows (chapter 3) and is complemented by anexplanationof thekey characteristicsof the countries’ telecommunicationsmarket (chapter4).Telecommunications’directandindirecteconomiccontributionstothecountries’economyfollow(chapter5),alongwithadiscussionofthestudy’smethodologyandfindings.Thepolicyimplicationsderivedfromthesefindingsconcludethestudy(chapter6).2.ImpactofMobileTelephonyandBroadbandontheeconomy:areviewoftheliteratureWhetherdrivinginnovationinmoreadvancedeconomiesoraddressingthelackoftraditionalfixed-line services in emerging countries, mobile phones affect all economies regardless oftheir stage of development. As mobile infrastructure becomes permanent, so, too, does itseffect on the market and the economy. A review of the literature indicates that mobiletelecommunications and broadband access can lead to more informed markets, increasedemploymentopportunities,andGDPgrowth.Multiple micro-economic studies from emerging countries show that enhancedcommunicationresultsinmoreefficientmarkets,ultimatelyimprovingconsumerwelfare.Forinstance, inKerala(India), the introductionofmobile telephony ledtoamore informedanddemand-driven fisherymarket (Jensen, 2007). Similarly, in Niger, input prices in the grainmarket fell, resulting in increased profits for farmers and, ultimately, consumer welfareimprovements (Aker, 2008). Similarly, rural Ugandan banana farmers producing perishablecrops benefitted as the costs of crop marketing decreased as a result of enhanced mobilecoverage(Muto,2008).Mobilenetworkscanalsoaddresslackofaccesstotraditionalservices.InKenyaandTanzania,thelaunchoffinancialservicesandmicropaymentsviamobilephonesreducedboththecostofbanking services and the transactional burdens, leading to a reduction of the countries’“unbanked” population. Similarly, the introduction ofm-Healthmobile applications in suchcountriesasGhanaandCapeVerderesultedinmoreaccessible,affordable,andhigherqualityhealthcareservicesindevelopingcountries(KellyandMinges,2012).4Insome instances, the introductionofmobilenetworkscan lead to thedevelopmentofnewmarkets and services. When a particular region of South Africa benefitted from enhancedwirelessnetwork,employmentsignificantlyincreased(KlonnerandNolen,2010);inMalawi,female labor participation increased (Batziillis et al., 2010). On a related note, the mobileapplicationsthatassistwiththejobsearchandapplicationprocessareparticularlybeneficialin instances of low digital literacy or where the employment process is largely informal(Donner,Gitau,andMarsden,2011). Inmanycases, thehigher-quality jobsare listedonline,whereonlythosecitizenswithdigitalliteracyskillsandInternetaccesscanapplyforthem.
4Kelly,Tim,andMichaelMinges(eds.)(2012).MaximizingMobile.TheWorldBank.Web.<http://siteresources.worldbank.org/EXTINFORMATIONANDCOMMUNICATIONANDTECHNOLOGIES/Resources/IC4D-2012-Report.pdf>.

10
Additionally, it is important to note thatmultiple studies (seeWaverman,Meschi and Fuss,2005;ShiuandLam,2008;Kathuria,UppalandMamta,2009;AndrianaivoandKpodra,2011)find initial increasing returns to economic growth as a result of the “return to scale effect”whenitcomestomobiletelecommunications’effectsontheeconomy.Inotherwords,wirelesstelecommunications’economicimpactismaximizedoncetheinfrastructurereachesacriticalmass point. As Gruber and Koutroumpis (2011) show, mobile telephony’s effects on GDPgrowthcorrelatewithwirelesspenetrationgrowthupuntilpenetrationrates reach60%,atwhichpointeffectstendtosubside.Likemobilenetworks,broadbandcanalsoaffecteconomicgrowth.Throughtheintroductionof new services and applications, new forms of commerce,mass customization of products,reductionofexcessinventoriesandoptimizationofsupplychains,growthinbusinessrevenue(Varianetal.,2002;Gillettetal.,2006),andgrowthinserviceindustries(Crandalletal.,2007),broadbandcanpositivelyimpactoutputandemployment.Whilemany studies that examine the relationship between fixed broadband access and theeconomy focus on data from the United States, additional research has recently emergedconfirmingpositiveeffectsoffixedbroadbandpenetrationonGDPgrowthinGermany(Katzetal., 2010a) as well as in Brazil, Chile, India, Saudi Arabia, Indonesia, and the DominicanRepublic(Katz,2011),Senegal(Katzetal.,2013),andEcuador(Katzetal,2013).Ontheotherhand,whileallofthesecountrieswitnessedasignificantemploymentincreaseresultingfromfixedbroadbanddiffusion, the contribution toeconomicgrowthvariedwidely.Explanationsfor thevariancecould includemigratory trends (Crandall), localeffects (Gillettetal.,2006),andindustrysectordifferences(Shideleretal,2007).Forexample,thenewjobsthatopenedasaresultofbroadbandtendedtooccurintheserviceindustries,althoughsomestudiesalsofoundapositiveimpactonthemanufacturingsectoraswell(Crandalletal,2007).Onlyinthecase of labor intensive sectors such as the lodging and food services industry researchdetectedadeclineinemploymentopportunitiesasaresultofbroadbanddiffusion,likelydueto the strong capital / labor substitution process (Thompson andGarbacz, 2008). ThiswasalsoconfirmedinastudyoffixedbroadbandeffectsonUSregionaleconomiesconductedbyKatzetal.(2012).Thecontributionof fixedbroadband introductionontheeconomyalsomimics theeffectsofinfrastructure deployment. Beyond GDP growth, fixed broadband can impact infrastructureinvestment (Katz et al., 2009a;Katz et al, 2010a), productivity growth, and the elasticity ofsupply as well as household income. In the OECD countries, for instance, research hasdemonstrated that fixed broadband adoption led to a significant rise in per capita GDP(Czernichetal.,2009;Koutroumpis,2009;Katzetal.,2010a).Thecountrieswithhigherfixedbroadbandpenetrationrates sawhigherGDPgrowthrates (Koutroumpis,2009).A studyofASEANcountriesalsoconcludedthatbroadbanddeploymentpositively impactsGDPgrowth(Ng,Lye,andLim,2013),asdidanexaminationofIndonesiaandMalaysia(Katz,2012).5Thesameheldtrueatagloballevel,wherebroadbandadoptionhadlessofaneffectoneconomicgrowthincountrieswithlowerbroadbandpenetrationrates(Katz,2012).5Katz,R.(2012).Impact-of-Broadband-on-the-Economy:Researchtodateandpolicyissues.Geneva:InternationalTelecommunicationsUnion.

11
Inrecentyears,theexplosivegrowthofmobilebroadbandallowedforthestudyofitsspecificeconomiccontribution.Katzetal. (2013)estimatedthat, inthecaseofSenegal,astructuredmodel similar to the one used in this study indicated that every 1% increase in mobilebroadband penetration yielded 0.022% growth in GDP. Unfortunately, beyond the studymentionedabove,noresearchhasbeengeneratedsofarthatattemptstoreplicatetomobilebroadbandtheeconometricanalysisconductedforfixedbroadband.Forexample,ananalysisconductedbyAnalysisMason(2015)onthesocio-economicimpactofbroadbandinThailandblends broadband adoption statistics to include both mobile and fixed lines. Interestinglyenough,however,thestudy’scoefficientofeconomicimpactofbroadbandisfairlyclosetotheonederivedbyKatzetal. (2013) forSenegal:0.026%.Anotherstudyconducted toevaluatetheeconomic impactofmobilebroadband inAustralia (ACMA,2014) reliedonsurveydata,where firms were asked to estimate the impact of the technology of areas such as costreduction,andincreasedsales.ThoseresponseswerethenaggregatedtoestimatetheimpactofmobilebroadbandontheAustralianGDP.Finally,astudyrecentlycompletedfortheGSMA(Deloitte,2015)determinedthatmobilevoiceanddatacommunicationshasadirecteconomiccontributionof1.4%and2.5%indirectimpactonGDP.In sum, multiple studies looking at both advanced and emerging economies conclude thatmobile networks and broadband access (both fixed and mobile) have positive economiceffects.Wirelessaccess can result inamoreefficientmarket,withbenefits realizedbybothvendorsandconsumers.Wirelessservicescanalsoaddresslackofaccesstoothertraditionalservices,suchasbankingorhealthcare.Thesenewservicescanevencreatenewmarketsandincreased employment opportunities, further spurring economic activity. Broadband accesscan also lead to job creation. Lastly, broadband access can also result in a rise in GDP,productivitygrowth,supplyelasticity,andhouseholdincome.Whilemoststudiestendtofocusondevelopedeconomies,morerecentstudiesoffersevidenceofthesebenefitsinthecaseofemergingcountriesaswell.ThisstudywillprovideadditionalinsightsregardingtheeconomicimpactoftelecommunicationsontheeconomyofJordan.3. TheeconomiesofthreecountriesofMiddleEastandNorthAfricaThefollowingsectionreviewsthecurrentstateoftheeconomiesofthethreecountriesunderstudy. Its purpose is to provide a context to understand the extent of the impact oftelecommunications.3.1.JordanWithatotalGDPof US$35.8billion6, Jordan’seconomyisoneof thesmallest intheMiddleEast, depicting still some persistent income distribution imbalances. Out of Jordan’s totalpopulation of 7,930,491, 14.2% are below the poverty line7and 17.3% live in rural areas8.
6Source:InternationalMonetaryFund,WorldEconomicOutlookDatabase,April2015713%ofthepopulationlivesonlessthanUS$3aday.8CIAFactbook,<https://www.cia.gov/library/publications/the-world-factbook/geos/print/country/countrypdf_jo.pdf>.

12
However,since2010GDPpercapitahasrisenfromUS$4,370.7toUS$5,213.4in2013.Thisincrease can be attributed, in part, to the economic reforms implemented in 1999, whichincluded opening a trade regime, privatizing state-owned companies, and eliminating fuelsubsides.9 These reforms had a signficant impact on attracting foreign investment andincreasing jobcreation.Asaresult, theunemploymentratedropped from12.6%in2012to11.9%in2014.In2014,theUNrankedJordan77outof187countriesmeasuredintheHumanDevelopmentIndex, a metric that takes such factors as health, income, and education dimensions intoaccount.10The report classifies Jordan as “high human development”with, according to theWorld Bank, an upper middle-income economy. Jordan is also classified as the 38theconomicallyliberalcountry,worldwide,accordingtothe2015Index,rankingwellabovetheaveragescoresintheMENAregion.11Furthermore,Jordanranks64thontheWorldEconomicForum Global Competitiveness Score, being included in the top 10 countries in the MENAregion.12On the other hand, Jordan, has very limitednatural resources and faces numerousrisksincludingcontinueddisruptionsofgasflowsfromEgyptandtheescalationoftheSyrianconflict extending into Iraq, which causes an influx in refugees into the country. Thesepotentialthreatshavetriggeredaweaknessinconfidencefromforeigninvestors.Asaresult,ForeignDirectInvestmenthasdecreasedfrom6.2%in2010to5.3%in2013.In 2015, Jordan saw an estimated 3.4% of GDP growth in the economy, with a projectedgrowthof3.9%for2016(seetable1)13.
Table1.Jordan:EconomicGrowth
Source:WorldBankGlobalEconomicProspects(January2015)AsoneofthemostopeneconomiesintheMiddleEast,thisboostcanbepartlyattributedtotourism receipts, remittances, FDI (Foreign Direct Investment) flow, and external grants.14However, the country still relies heavily on imports of hydrocarbon products and grains,which triggered increased economic disruption during the 2011 oil crisis in Egypt.Nevertheless,theglobalrecessiondidnotaffectJordan’seconomyasmuchasitsneighboringGulf countries.GDPgrowth fell from7.2% in2008 to5.5% in2009and then2.3% in2010.This trend seems to be reversing and low positive growth has taken place since 2011 andprojectedthrough2016.Growthwasmainlyattributedtoanarrowertradedeficit(12.8%in2014) and increased public investments (23.8% in 2014).15On the demand side, public
9Jordan’sEconomyProfile2014.<http://www.indexmundi.com/jordan/economy_profile.html>.10UnitedNations.<http://hdr.undp.org/sites/default/files/hdr14-report-en-1.pdf>.11HeritageFoundationhttp://www.heritage.org/index/country/jordan12WEFGlobalCompetitivenessReport2014-2015.13InternationalMonetaryFund(IMF)WorldEconomicOutlook(WEO)database,Oct2014.14ArabCountriesinTransition,IMF.Oct9,2014,pg.11.15JordanEconomicMonitor:PersistingForwardDespiteChallenges,WorldBank.Spring2015,pg.6.
2011 2012 2013 2014 2015 2016Annual%ChangeGDPatMarketPrices($2005) 2.6 2.7 2.8 3.0 3.4 3.9CurrentAccountBalance/GDP(%) -10.2 -15.2 -10.0 -11.3 -9.4 -7.9
13
investment increased due to the higher capital expenditures financed mainly by GulfCooperationCouncil(GCC)grants.Overall, Jordan’s2014growthperformanceoutperformedtheaverage1.2%rateintheMENAregion.16Asaresultofliberalizationmeasures,thegrowthinGDPhasoccurredsimultaneouslywithadeclineofinflation(from19.9%in2008to2.8%in2009).Theslowdowninfoodpricescausedheadlineinflationtomoderate.Whiletherehavebeen slight fluctuations in the level of inflation at the end of 2014, inflation is expected todecline2.7%fromthe2013levelof5.5%.17Imports of goods and services as percent of the GDP has experienced a slow decreasethroughouttheyears;87.5%in2008to69.21%in2014.ExportsasapercentoftheGDPhaveremained relatively constant with a very slight decrease in 2013 and a rebound in 2014.Although there was slow credit growth of 6.3% in 2014, the Central Bank of Jordan (CBJ)decidedtoreducethe financial/bankingpolicyrate in Juneto2.75%whilenet internationalreservescontinued tooverperform18.High-energy importsdue to the2011oildisruption inEgypt and a rise in domestic imports driven by the increase use of mineral and chemicalfertilizers triggered a widening of trade in goods balance deficits. The disruption causedJordantocompensatebyimportingmoreexpensivefueloilanddiesel.BackedbyParliament,politicalreformofthecountryhasbegunandthegovernmentinitiatedanational restructuringprogram to addressdomestic and external impediments to growth.The implementation of the reforms such as fiscal consolidation, tax reform, administrationimprovements,publicfinancialmanagement,andenergysectorreformshavebeencriticaltomaintainthefiscalinternalandexternalbalances.Overall,deficitshavenarrowedin2014duetotheexpandingeconomyandcontinuedeffortsoffiscalconsolidation.Therehasalsobeenanoticed improvement in revenue collection and contained growth in spending attributed tothe decrease in deficits. Despite the financing of large utility companies, the government’scentral debt improved from11.4% to 9.2%of theGDP from2013 to 2014. These numbersincludeaidfromprimarilyUSandGulfCooperationCouncil(GCC)grants.19In the short term, Jordan’s economic growth is expected to increase to 3.9% due to strongprivateconsumptionaswellas loweroilpricesandinvestmentprojects;howeverthiscouldchangegiventhecontinuedregionalinstabilitygeopoliticalthreattonationalsecurityandtheinternational oil prices.20Weaknesses in inclusive growth (low scores on business climateindicators, high unemployment levels, low female participation) is being addressed by thegovernment with the passage of several laws to improve the business climate and theformation of the National Employment Strategy (NES)21. Diversifying the energy supply byadoptingnaturalgas,nuclearpower,andoilshade,enactinggrowthenhancingreforms,andimproving economic policies may help reduce deficits.22 Improved competitiveness andincreased private investment in the service sector may also help reduce employment and16WorldBank.http://www.worldbank.org/en/publication/global-economic-prospects/regional-outlooks/mena17WorldBank.http://data.worldbank.org/indicator/FP.CPI.TOTL.ZG/countries/JO?display=graph18ArabCountriesinTransition,IMF.Oct9,2014,pg.11.19WorldBank(2015).JordanEconomicMonitor,spring,pg.8. 20IMF(2014).ArabCountriesinTransition,Oct9,page11.21IMF(2014).ArabCountriesinTransition,Oct9,page12.22IMFWorkingPaper:NewEnergySourcesforJordan:MacroeconomicImpactandPolicyConsiderations2015

14
poverty levels in Jordan by creating a demand for jobs, especially for skilled and educatedworkers.3.2.TunisiaAs thenorthernmost country inAfrica, Tunisia exhibits a diverse export-oriented economy.The country’s key exports include textiles, food and petroleum products, chemicals, andphosphates,mostofwhichareexported to theEuropeanUnion.23Witha totalpopulationof10,937,521, 17.2% are unemployed and 33% live in rural areas.24 Also, 15.5% of thepopulation is recorded to live below the poverty level.25The GDP per capita in current USdollarsshowedaslightrise (2.8%) fromUS$4,197.5 in2012toUS$4,316.7 in2013.26Thispositivegrowthaswellasanimprovementinlivingstandardscanbeattributedtothecurrentgovernment’sliberalstrategyregardinginvestmentsininfrastructureandeducation.In2014,Tunisiawasclassifiedas“highhumandevelopment”accordingtotheUNHumanDevelopmentIndex(whichtakesintoaccounthealth,income,andeducationfactors)andwasranked90outof 187 countries.27Furthermore, the country ranked 83 out of 148 countries on the globalcompetitiveness scale according to the World Economic Forum. 28 In terms of thetelecommunications sector, Tunisia ranked top in the E-government Development Index inAfricaand75thglobally in2014.Additionally, theWEFNetworkReadinessScoreforTunisiawas81outof143countries.29Pre-2011,Tunisia facedhighunemployment rates and foodprices, andwidespreadpovertycoupledwithloweconomicperformance. CorruptionandcronyismduringPresidentZineelAbidine Ben Ali’s rule (1987-2011) discouraged market liberalization, which furtherexacerbatedtheeconomicsituation.CulminatingwiththeeventknownasthebeginningoftheArabSpring,BenAli’srulewasoverthrownanda technocraticgovernmentwastemporarilyset inplace.Duetothepolitical instabilityof thecountry,adramaticdecline in tourismandinvestments took place in 2011. In 2012, the new interim government focused on politicalissuesandadministrativereforms.Withtheelectionsin2014markingtheendtothepoliticaltransition, there isarenewedhoperesulting fromthereducedpoliticaluncertainty thathasbolsteredtheeconomyandthusstrengtheninvestorconfidence.Duetothedependenceofthedinartoeuroexchangerate,theTunisianeconomyisvulnerableto high commodity prices. Furthermore, Tunisia faces numerous risks to its economy,primarilysecurityinstabilityduethecrisisinLibyathatiscausingadecreaseintourismandinflux of refugees. Other risks include social unrest around elections possibly resulting instrikes and the current political environment that causes a threat toweaken the economicpolicies and reforms. Additionally, slow growth in emergingmarketsmay impact Tunisia’s23TunisiaEconomyProfile2014<http://www.indexmundi.com/tunisia/economy_profile.html>.24CIAWorldFactbook.<https://www.cia.gov/library/publications/the-world-factbook/geos/print/country/countrypdf_ts.pdf>.25WorldBankData.<http://data.worldbank.org/country/tunisia>.26Ibid.27UNHumanDevelopmentIndex.<http://hdr.undp.org/sites/all/themes/hdr_theme/country-notes/TUN.pdf>.28GlobalCompetitivenessReport2013-2014.WorldEconomicForum.29WEFNetworkReadinessIndex2014.

15
economy.Highunemployment,regionaldisparities, lowfemalelaborforceparticipation,andpoliticalinstabilityarechallengestoinclusivegrowth.30
Table2:Tunisia:EconomicGrowth(2010-2015)
Source: World Bank Global Economic Prospects (January 2015) Together,theindustry(31.2%)andservice(59.4%)sectorsaccountforapproximately91%ofTunisia’sgrossdomesticproduct(GDP).31Althoughagricultureonlycontributesto9.4%oftheGDP, the sector plays an important role in Tunisia’s foreign trade, especially from olive oilproduction. The Arab Spring in 2011 caused an immediate decrease in GDP growth, fallingfrom3.2%in2010to-0.5%in2011. Theglobalrecessionalsocausedadecreaseingrowthbetween2008-2011;however,thiswasnotasextremeastheimpactoftheArabSpringhadontheeconomy.In2012,thetrendreverseditselfandtherewasaboostingrowthreaching4.7%. Despite a diversified economy, there was a growth decline of 2.5% in 2013 due topolitical and social instability, euro stagnation, and a 3.3% reduction in agricultureproduction.32Slightly declining from the prior year, Tunisia saw an estimated 2.3% GDPgrowth in 2014, with upward economic projections into 2016. This boost can partly beattributedtoservicedemandinthepublicsector.Asseenbyfigure1,therehasbeenaslightincrease inGDPgrowth; this canbeprimarily accredited to resilience in the tourismsectorandexportindustries.Thepopulation growthhas increasedby1.11%over the last10years andaccording to theUnited Nations Economic and Social Commission for Western Africa the population isexpected to increase into 2050, reaching approximately 13.2 million people.334.5% of thepopulationlivesonlessthat$2USDaday.Unemploymentratesdroppedfrom16.7%in2013to 15.2% in 2014.34 In comparison with the world average, unemployment rates areparticularly highwith youth and females. As expected, there is a big disparity between thedistributionofwealthbetweenruralareasandcitiescausingunbalancedjobdistribution.35Inflationratesshowedperiodsofdeclineandrisethroughout2008to2013.Theleveldroppedfrom5.8%in2008to2.5%in2009.Afterrisingto5.0%in2010andfallingin2011to2.2%therehasbeenasteadyincreaseininflationrates,explainedtoalargedegreebytheunstablesocialandpoliticalsituationaftertheArabSpring.
30ArabCountriesinTransition,IMF.Oct9,2014,pg.17.31Tunisia2014,AfricanEconomicOutlook,pg.3.32TunisiaEconomicOutlook.AfricanDevelopmentBankGroup.<http://www.afdb.org/en/countries/north-africa/tunisia/tunisia-economic-outlook/>.33TheDemographicProfileofTunisia,UnitedNationsEconomicandSocialCommissionforWesternAfrica.<http://www.escwa.un.org/popin/members/tunisia.pdf>.34TradingEconomics.<http://www.tradingeconomics.com/tunisia/unemployment-rate>.35TheEconomist.<http://www.economist.com/node/17862305>.
2010 2011 2012 2013 2014 2015Annual%ChangeGDPatMarketPrices($2005) 3.2 -0.5 4.7 2.5 2.3 2.7CurrentAccountBalance/GDP(%) -4.7 -7.4 -8.2 -8.4 -9.1 -8.6

16
ImportsofgoodsandservicesasapercentofTunisianGDPhaveremainedstablewithslightvolatility. Therewas a recorded fall during the recession from 59.0% in 2008 to 49.0% in2009.TunisiaspendsapproximatelyUS$24,950billiononimportingtextiles,machineryandequipment,hydrocarbons,chemicals,andfoodrelatedgoods.ExportsasapercentofGDPhaveshownsimilarpatternswithslightlylowerpercentagepoints(seeFigure3).France,Italy,andGermany are themain importer/exporters to Tunisia, culminating to approximately 50%.36Therehasbeenacontinualdecline inForeignDirect Investments(FDI)since2008. In2013,therewasarecorded$1,096millionofFDIinflows.37Differing from neighboring countries, Tunisia is currently entering an improved economicstabilityzone.Thecurrentaccountdeficitreducedfrom-8.3%in2013toanestimated-7.9%in2014.38RecoveryintheEurozoneeconomy,phosphateexports,riseintourism,andlowerinternationalcommoditypricesaccountforthedecrease.However,thetradedeficitwidened36% from US $1.532 billion in 2013 to $2.083 billion in 2014.39The gap in trade waspredominately noticed in agriculture, manufacturing, agro-food industries, and engineeringindustries.Althoughexhibitingaslightlylower-than-averagepercentagefortheNorthAfricanregion,thetradedeficitisprojectedtoimprovefrom-7.7%to-6.6%in2015.AccordingtotheInternationalMonetary Fund, the budget deficitwill improve, approaching -6% in 2015. Inregardstoexternaltradebalances, there isan improvement inexports, tourism,andforeigndirect investment (FDI). An increase in foreign financing and recovery in FDIwill assist inreducingthecurrentdeficit.Toreduceexternalandfiscaldeficit,theimplementationofatightmonetarypolicywithwagefreezes,greaterexchangerate flexibility,andreducedexemptionsandsubsideswillhelp.Toaddressthechallengeslistedaboveregardinginclusivegrowth,thegovernmentisfocusingoncreating a competitive business climate, strengthening public tax policy and administrationreformsliketransparency,andimprovingthegovernanceofpublicenterprises.40TheCentralBankofTunisia(CBT)continuesa2012policyofneutralinterventionstrategyandraisedtheinterest rate from4% in 2012 to 4.5% in 2013.41Themarket rate at current level failed toimproveduetolowpressureontheexchangerate,weakcreditgrowth,negativeoutputgap,and level core inflation.42However, if there is a rapid rise in inflation or depreciationpressuresrisethentheCBTplanstofurthertightenmonetarypolicies.Sincetheeconomicsituationhasdeterioratedfrom2011,thebudgetbillof2013wasrevisedsinceGDPgrowthwasbelowtheprojected4.5%.Thiscanbeattributedtothedepreciationofthedinar,increasesinenergysubsidyexpenses,andadropintaxrevenues.Therevised2013budgetcalledfora50%cutinsubsidiesforindustrialconsumersofelectricityandgas,smallertax revenue, and 36% revenue fee drop from Tunisian section of the Algerian/Italian gas36GlobalFinance.<https://www.gfmag.com/global-data/country-data/tunisia-gdp-country-report>.37UnitedNationsConferenceonTradeandDevelopment:WorldInvestmentReport2014.38IMFCountryReport:Tunisia.IMF,page7.39Al-Monitor.<http://www.al-monitor.com/pulse/business/2014/04/tunisia-economy-trade-deficit-risks.html#>.40ArabCountriesinTransition,IMF.Oct9,2014,pg.18.41Tunisia2014,AfricanEconomicOutlook,pg.5.42CountryReport–Tunisia,IMF.April2014,pg.11-12.

17
pipeline that passes through the country.43Continuing these reforms, the 2014 Budget Actincludedacutincorporatetaxratesby5%andtaxingdividendsata5%ratewiththeaimatcreatingauniform20%taxrate.44Withthesereforms,thegovernmenthopestoseeariseinprivate employment, reduce external vulnerabilities, and improve price competitivenessleadingtocreatinganoverallsuccess inTunisia’songoingtransitiontoaproductivemarketeconomy.3.3.MoroccoMorocco’sdiversemarket-orientedeconomybenefitsinpartfromthecountry’sproximitytoEuropecombinedwithlowlaborcosts.AtUS$109billion,theMoroccaneconomyisprojectedtogrowat4%inthenearfuture(seetable3).
Table3.Morocco:EconomicGrowth(2011-2016)Source: World Bank Global
Economic Prospects (January 2015) The global recession of 2008 negatively affectedMorocco’s economy. GDP growth fell 14%from 5.6% in 2008 to 4.8% in 2009, and an additional 18% to 2.6% in 2010. In 2011, thedecline reversed and there was a boost of 92% in growth reaching 5.0% due to the newgovernment’s commitment to economic reform. The 4.8% decline in GDP per capita from$3,044.11in2011to$2,899.97in2012wasduetointernaleconomicdifficultiessuchasthepoor harvest. In 2013, the economy rebound, with GDP per capita reaching $3,092.61 in2013.45This positive growth can be attributed to a multitude of reforms initiated by thegovernment including industrial development strategies and infrastructure improvements(thenewportandfree-tradezonenearTangiers).46TheGDPdecelerationfrom2013to2014wasduetoadeclineintheagriculturesectorresultingfrominsufficientrainfall,coupledwithoverall slow economic growth in Europe.47However, growth is projected to accelerate into2015asexternaldemandrisesduetoincreasedEuropeanGDPgrowth,combinedwithstrongperformance in newer industries.48Since 2013, Morocco’s economic growth appears to betrackingthatoftheMENAregion.Combined,theindustry(24.9%)andservice(61.1%)sectorsaccount for 86% of Morocco’s gross domestic product (GDP).49Although agriculture onlycontributestoapproximately15%oftheGDP,thissectoremploys45%ofthelaborforce.
43Tunisia2014,AfricanEconomicOutlook,pg.5.44Ibid.45WorldBankData.<http://data.worldbank.org/country/morocco>.46MoroccoEconomyProfile2014.<http://www.indexmundi.com/morocco/economy_profile.html>.47WorldBank.<http://www.worldbank.org/en/country/morocco/overview>.48ArabCountriesinTransition,IMF.Oct9,2014,pg.15-16.49CIAFactbook
2011 2012 2013 2014 2015 2016Annual%ChangeGDPatMarketPrices($2005) 5 2.7 4.4 3 4.6 4
CurrentAccountBalance/GDP(%) -8 -9.7 -7.6 -5.9 -4.2 -3.6

18
Inflation declined rapidly from 5.9% in 2008 to 1.5% in 2009 due to a cautiousmonetarypolicy.Ithasremainedwithinthe1%rangesincethen.Thefallingtrendcontinuedreaching0.1% in 2011 paralleling the decline in international commodity prices. Although there hasbeenaslightincreaseininflationinrecentyearscausedbyariseinfoodpricesandadecreasein subsidy on fuels, the IMF projects the rate to remain at a low 1% for the country.50TheCentralBankofMorocco(CBM)supportsthis lowinflationwithacurrentsubsidiarysystemthatincludesreducedbudgetarycostsandmacro-economicmanagement.51ImportsofgoodsandservicesasapercentofGDPhaveremainedstablewithslightvolatility.Duringtheglobalrecession,therewasarecordedfallfrom50.9%in2008to39.7%in2009.Morocco’s main imports include petroleum, textile fabric, telecommunication equipment,wheat, gas, electricity, transistors, and plastics.52Exports as a percent of GDP show similarpatternswithslightlylowerpercentagepointsalsoasaresultoftheglobalrecessionin2008-2009. Spain(19.2%)andFrance(17.6%)aretheprimaryexporterstoMoroccocausingdependenceontheeurotodirhamexchangerate.Accordingtothe2015IndexofEconomicFreedom,therewasarecorded$3.4billionForeignDirectInflow(FDI).53Thecurrentaccountdeficitreducedfrom-10.0%in2013to-7.6%in2014.54Thisreduction,coupled with increased foreign exchange reserves can be attributed to economic reformpolicies,upcomingexportsectors,andadeclineininternationaloilprices.InNovember2014,anewOrganicBudgetLawandanewbankinglawwerepassedtohelpbroadentheregulatoryroleoftheCBM.TheOrganicBudgetLawisaimedtoimprovethegovernment’sbudgetdesignand implement an enhanced public service delivery.55Despite these successful measures,inequalities in income, gender, and regional disparities are present. Since the recession,MoroccohasacceptedtwoIMFPrecautionaryandLiquidityLines,onein2012andtheotherin 2014. However, the country has not used these funds and secured them only as aprecautionarymeasure.56Morocco places a restriction on the purchase of agricultural landand investments in certain sectors for foreign investors causing a strain regarding theopenness of their markets. Improvement in internal and external balances has led to thepreviously noted current account deficit decrease in addition to an overall shrinking of thebudgetdeficitin2011to4.9%oftheGDP.57In2012,thefiscaldeficitreached5.3%oftheGDPpromptingthegovernmenttoimplementmeasurestoimproverevenuecollections.58In2015,thegovernmentpassedabudgetlawaddressingreformsinthetaxandpensionsystem.50ArabCountriesinTransition,IMF.Oct9,2014,pg.16.51EulerHermes.<http://www.eulerhermes.com/economic-research/country-reports/Pages/Morocco.aspx>.52Ibid.53HeritageFoundation.54http://www.tradingeconomics.com/morocco/current-account-to-gdp55HeritageFoundation.56MoroccanEconomyontheRightTrack.<http://www.imf.org/external/pubs/ft/survey/so/2015/CAR022315A.html>.57HeritageFoundation.58MoroccoEconomicOutlook.<http://www.afdb.org/en/countries/north-africa/morocco/morocco-economic-outlook/>.

19
Despite unrest in the neighboring areas and Arab Spring protests, Morocco’s economy hasmainly remained largely unaffected. Nevertheless, countering recent economic prosperity,concerns regarding unemployment, poverty, and illiteracy rates remain high. With a totalpopulation of 32,987,206, 15% live below the poverty line.59Also, 43.3% of the populationlives in rural areas of the country.60Unemployment rates increased from 8.8% in 2013 to9.3%in2014withyouthemploymentremainingrelativelyhigh.61Moroccoalsofacesadditionalriskstoitseconomy:potentiallyslowgrowthintradingpartnersespecially in Europe, geopolitical instability impacting oil prices, and a “surge in globalfinancial market volatility.” 62 Other internal challenges impacting the economy includefightingcorruptionandthelackofreformintheeducationalsystem,judiciarybranch,andthegovernment’ssubsidiesprogram.To address someof these issues, theMoroccangovernment continues to implement reformprograms.Subsides, taxation,retirement,socialprotection,andthefiscalsystemarefocusedto improve the efficiency of public finances and support the development of inclusivegrowth.63Withreducedpublicinvestmentin2014,thefiscaldeficitisprojectedtodecreaseto3%oftheGDPby2016.In2014,Moroccoscored129outof187intheUNHumanDevelopmentIndexplacingitinthe“high human development” category. As reported by 2015 Index of Economic Freedom,Moroccoscored60.1,categorizingthenationas“moderately free,”ascorethat is justbelowtheworld average of 60.4.64 Furthermore, the country ranked averagewith 77 out of 148countriesontheglobalcompetitivenessscore.65Intermsofthetelecommunicationssector,in2014 Morocco ranked 82th globally in the E-government Development Index and theWEFNetworkReadinessScorewas78outof143countries.66
*****
In thecontextof thethreecountryeconomicconditions,andbasedontheexperience in theemerging world, telecommunications infrastructure can play an important role. On theeconomicside,telecommunicationscan:
• Increasetheinter-linkagesamongnationalenterprises;• Facilitateexports;• Improveproductivityofsmallfarmersbyenhancingtheiraccesstoinputswhile
facilitatingmarketreach;59CIAFactbook<https://www.cia.gov/library/publications/the-world-factbook/geos/mo.html>.60RuralPovertyPortal.<http://www.ruralpovertyportal.org/en/country/statistics/tags/morocco>.61TradingEconomics.<http://www.tradingeconomics.com/morocco/unemployment-rate>.62ArabCountriesinTransition,IMF.Oct9,2014,pg.16.63Ibid.642015IndexofEconomicFreedom.HeritageFoundation65WEFGlobalCompetitivenessReport2013-2014.66WEFNetworkReadinessIndex2014.

20
• Serveasanunderlyingnetworkthatwouldfosterfinancialinclusionofapopulationmarginalizedfrombankingservices;and
• Delivertrainingresources,therebysupplementingthepre-existingeducationalsystem.Fromasocialstandpoint,bothwirelesstelephonyandbroadbandshouldimprovesocialinclusionofruralpopulationsandenhancewelfareoftheurbanpoor.Let’snowturntoassessingthestateofdevelopmentoftherespectivetelecommunicationsindustries.3. TheTelecommunicationsIndustryintheMENAcountries4.1. TelecommunicationsdemandThedemandfor telecommunicationsservices inall threeMENAcountriesunderstudygrewrapidly over the last ten years, primarily driven by the adoption of mobile telephony. Forexample, driven by proactive government policies, the telecommunications sector in Jordanhasexhibitedrapidgrowthwithcontinuousexpansionover theyears. In thepast tenyears,the number of mobile subscriptions in the country has increased significantly; up from3,035,000 subscribers in 2005 to 10,213,000 in 2015 exhibiting over 12.90 % CAGR67.Similarly, driven by strong demand and competitive intensity, the Tunisiantelecommunications sector has exhibited rapid growth. Mobile connections experienced anannualincreaseof11.68%from2005to2015andareexpectedtoincreasefurtherduetothedeploymentofLTE/4Gservices.Overall,mobileconnectionshaveincreasedfrom5,442,000in2005to16,428,000in2015.Inaddition,mobileconnectionsinMoroccoexperiencedasteadyincreaseof13.25%from2005to2015.Overall,mobileconnectionsinMoroccohaveincreasedfrom 12,956,000 in 2005 to 44,960,000 in 2015. Table 4 compiles the penetration andaggregatesubscribershipofmobiletelephonyforallthreecountriesbetween2004and2015. Table4.MENAcountries:MobileTelephonyPenetration(inpercentageofpopulation)
(2004-2015) 2004 2005 2006 2007 2008 2009 2010 2011 2012 2013 2014 201568
Jordan Subscribers(‘000) 1,604 3,035 3,976 4,405 5,425 6,113 6,666 7,771 9,056 9,895 9,686 10,213Penetration 31% 57% 72% 76% 90% 97% 101% 113% 127% 134% 127% 133%
Tunisia Subscribers(‘000) 3,405 5,442 7,081 7,843 8,602 9,796 11,214 12,637 13,628 13,872 15,888 16,428Penetration 34% 54% 69% 76% 82% 93% 105% 117% 125% 125% 142% 146%
Morocco Subscribers(‘000) 9,431 12,956 16,005 20,029 22,816 25,310 31,982 36,554 39,016 42,439 44,115 44,960Penetration 31% 43% 52% 65% 73% 80% 100% 113% 119% 128% 131% 132%
MENAaveragepenetration 23% 36% 47% 63% 74% 88% 100% 110% 115% 118% 119% 121%Source: GSMA Intelligence Tunisia’smobilepenetrationrateof146%in2015placesthecountrywellabovetheaveragelevelfortheMENAregion(121%).WhilelowerthanTunisia’s,mobilepenetrationinMoroccoandJordanisstillhigherthantheregionalaverage.
67Source:GSMAIntelligence(2015).68Datafor3Q15.

21
On theotherhand,wirelineservicesare inaconsistentdecline inall threecountries.WhileJordanianwirelessexperiencedasteadyannualincreaseof18.33%insubscriptionsbetween2004 and2015, fixed lineshave shownan annual decrease of 4.86% throughout the sameperiodwith638,000subscriptionsin2004fallingto369,000in2015.InMorocco,whilefixed-line subscriptions showed a significant boost - 177% increase - between 2006 and 2010,creditedtotheintroductionofnewmarketoperators,theyhavebeendecliningeversince.Asaresult,accesslinesfell9.93%annuallyfrom3,749,364in2010to2,222,000in2015.Finally,fixedtelephonyaccesslinesinTunisiahavefallenfrom1,273,332in2007to944,000in2015.Thewirelineaccesslinesforallthreecountriesarepresentedintable5.
Table5.MENAcountries:FixedTelephonyAccessLines(‘000)(2004-2015) 2004 2005 2006 2007 2008 2009 2010 2011 2012 2013 2014 2015 CAGRJordan 638 628 614 559 519 501 486 465 434 378 375 369 -4.86%Tunisia 1,204 1,257 1,268 1,273 1,239 1,279 1,290 1,218 1,099 1,022 949 944 -2.19%Morocco 1,309 1,341 1,266 2,394 2,991 3,516 3,749 3,566 3,279 2,924 2,488 2,222 4.93%
Source:ITUWorldTelecommunication/ICTIndicators2016
At this point, because of strong fixed-mobile substitution, Jordan has the lowest fixed-linepenetration rate per 100 inhabitants in the Middle East at 4.80%, significantly below theregionalaverageof22%69.While28%ofhouseholdsinJordanhaveonemaintelephoneline,withtheincreasinguseofmobiletelephony,thegovernmentpredictsthecontinueddeclineinthenumberoffixed-linesubscriptions.Consistent with the trend toward fixed-mobile telephony substitution, fixed broadbandremainsconsiderablyunderdevelopedacrossallthreecountries(seetable6).
69 Embassy Of Sweden, Amman: Delegation Pre-Study – Sector Briefs, Jordan: Telecom Sector. <http://www.swedenabroad.com/SelectImageX/30230/JordanSectorAnalysis.pdf>.

22
Table6.MENACountries:FixedBroadbandConnections(‘000)(2004-2015) 2004 2005 2006 2007 2008 2009 2010 2011 2012 2013 2014 2015 CAGRJordan Subscribers(‘000) 10 24 49 89 146 238 293 297 300 328 352 320 36,53%
Penetration 1.1% 2.4% 4.7% 8.4% 13.2% 20.9% 25.2% 24.9% 24.7% 26.0% 27.0% 24.0% 32.32%Tunisia Subscribers(‘000) 3 18 44 96 227 373 510 559 527 520 499 488 59.66%
Penetration 0.1% 0.8% 1.9% 2.9% 6.8% 11.0% 14.0% 16.1% 15.0% 14.7% 13.9% 13.5% 52.71%Morocco Subscribers(‘000) 65 249 392 477 493 480 504 595 690 844 993 1,148 29.88%
Penetration 1.1% 4.0% 6.2% 7.5% 7.6% 7.3% 7.6% 8.9% 10.2% 12.3% 14.3% 16.3% 27.81%MENAaveragepenetration 3.0% 4.5% 6.3% 8.4% 11.3% 14.3% 16.4% 19.0% 21.8% 24.1% 27.4% 31.4% 23.91%
Source:ITUWorldTelecommunication/ICTIndicators2016Ontheotherhand,3Gand4Gserviceshaveplayedaroleindrivinganemergingbroadbandmarketinallthreecountries.2010markedtheintroductionof3Gand4GservicesinJordan.The subscription rate showed a dramatic increase in the past five years from 185,126subscriptions in2010 to4,372,354 in1Q2015 (aCAGRover110%)70. The introductionofLTE services and the increasing 3G coverage from 50% in 2010 to 90% in 2012 hascontributedtothecontinuingriseinthesubscriptions fortheseservices.71InTunisia,thereisanotedexponentialgrowthofwirelessbroadbandsubscriptionsfrom2011to2015.In2015,therewere5,142,610mobilebroadbandsubscriptionswhereasfixed-broadbandsubscriberswere only 488,000. Similarly, wireless broadband subscriptions have been growingexponentiallyinMoroccosince2010-36%annualincreasefrom2010to1Q2015-whereasfixedbroadbandsubscriptionsonlyshowedmoderategrowth(18%)forthesameperiod.Asthe emphasis on thewireless sector grows, fixedbroadband lines showeda slower growth,onlydoublingbetween2010and2015,thereforereaching1,148,000.
Table7.MENAcountries:WirelessBroadbandConnections(2008-2015) 2008 2009 2010 2011 2012 2013 2014 201572 CAGR
2010/15Jordan 4,602 15,053 185,126 1,620,061 2,425,762 3,378,652 4,203,995 4,372,354 110%Tunisia 0 0 97,367 269,198 1,433,955 2,640,666 5,000,436 5,142,610 154%Morocco 716,340 1,595,471 2,893,355 5,527,626 6,860,666 7,944,555 10,543,897 10,833,684 36%
Source:GSMAIntelligence TheconsequenceoftheriseinwirelessbroadbandadoptionhasbeenanincreaseinInternetusage across the threeMENA countries under study. For example, the Internet penetrationrate in Jordan in 2008 was 23%. However, with the government’s Information andCommunication Technology (ICT) strategy, the penetration rate increased to 86% or 5.7millionusers in2015 (274% in sevenyears)73.Themajorityof Internet subscriptions (4.99million)aremobilebroadbandsubscribers.4.2. TelecommunicationssupplyAs market competition, mobile adoption, and mobile usage in the three MENA countriesdeveloped, so did industry revenues. Further, operators have expanded their reachwith an70Source:GSMAIntelligence(2015).71Ibid.72Datafor1Q1573Source:ITUWorldTelecommunication/ICTIndicators2015&InternetWorldStatsin2015

23
increasedfocusonpreviouslyunderservedsegmentsofthepopulation,offeringlessexpensiveservices, plans, and handsets. At the same time,while these factors contributed to revenuegrowth,theyalsoledtothedeclineinmobileARPUthatresultedinitsstabilization.Asmobilebroadband gained momentum, however, revenues could likely follow another ascent (seetable8).
Table8.MENACountries:TelecommunicationsIndustryRevenues(inUS$million)Country 2008 2009 2010 2011 2012 2013 2014Jordan 1,420 1,497 1,614 1,669 1,685 1,580 1,523Tunisia 1,614 1,778 1,956 1,848 1,828 1,697 1,545Morocco 4,190 4,208 4,255 4,612 4,137 3,915 4,072
Source:InternationalTelecommunicationsUnion Totalindustryrevenuesinallthreecountrieshaveremainedrelativelystable.Thismeanstheexponentialgrowthintechnologyadoptionhasbeendrivenbysignificantpricedecline,whichhasimprovedoverallaffordabilityoftelecommunications. Ingeneralterms,thecompetitivedynamicsofthewirelesstelecommunicationsindustryintheregionismoderatetohigh.AllthreeMENAcountriesunderstudyhavethreewirelessplayers,while Jordan and Tunisia have approximately six fixed broadband operators. As aconsequence,theHerfindahl-Firschmanindexofindustryconcentrationrangesbetween3,551and3,406 forwireless. In thecaseof fixedbroadband, JordanandTunisiaexhibitmoderatecompetition,whileMorocco’sfixedbroadbandindustryismoreconcentrated(seetable9).
Table9.MENACountries:TelecommunicationsIndustryMarketStructureCountry MarketStructureMetrics 2008 2009 2010 2011 2012 2013 2014 2015
Jordan
NumberofWirelessTelephonyPlayers 5 5 5 4 4 3 3 3WirelessTelephonyHerfindahlHirshmanIndex 3,442 3,377 3,341 3,336 3,413 3,402 3,406 3,406NumberofFixedBroadbandPlayers 2 2 3 3 4 5 6 ---FixedbroadbandHerfindahlHirshmanIndex 6,628 5,748 3,828 4,156 3,960 3,778 3,683 ---
Tunisia
NumberofWirelessTelephonyPlayers 2 2 3 3 3 3 3 3WirelessTelephonyHerfindahlHirshmanIndex 5,001 5,020 4,477 4,208 4,090 4,073 3,687 3,541NumberofFixedBroadbandPlayers --- --- --- --- --- --- 7 ---FixedbroadbandHerfindahlHirshmanIndex 2,697 3,614 3,516 3,439 4,653 4,643 4,647 ---
Morocco
NumberofWirelessTelephonyPlayers 3 3 3 3 3 3 3 3WirelessTelephonyHerfindahlHirshmanIndex 5,224 5,036 4,108 3,687 3,576 3,470 3,433 3,445NumberofFixedBroadbandPlayers 3 3 3 2 2 2 2 ---FixedbroadbandHerfindahlHirshmanIndex 7,725 7,794 7,878 8,067 8,003 8,135 8,663 ---
Source: GSMA Intelligence; Ovum; Country Regulators; Telecom Advisory Services analysis TheJordaniantelecommunicationsindustryexhibitsmoderatecompetitiveintensity.Beyondactive competition in themobile segment, fixed broadband depicts intermodal competitionbetweenADSLandWimax(seetable10).

24
Table10.Jordan:TelecommunicationsIndustryStructure(2014)(linesin‘000) Fixed
telephony WirelessTelephony WirelessBroadband FixedBroadband
Lines Share Connections Share Connections Share Subscribers ShareJordanTelecomGroup 375 100% 3,137 32.4% 1,592 37.8% 207 59.1%Zain 3,849 39.7% 2,083 49.4% 36 10.2%Umniah(Batelco) 2,700 27.9% 537 12.7% 29 8.4%MadaCommunications 9 2.7%KulacomJordan 14 3.9%Other 55 15.7%Total 375 9,686 4,212 350
Sources:ITU;GSMAIntelligence;OVUM ThefixedtelephonymarketisrelativelyconcentratedwithJordanTelecomhavingawirelinemonopoly but facing competition from VoIP operators. The Jordan Telecom Group, with amajority ownership by Orange (51%), offers fixed-line telephony (local, domestic longdistance, international),data, Internet,mobile,and IPTVservices.Thegroupoperatesunderfour arms, JordanTelecom (fixed line),Orange Jordan (wireless),Wanadoo (Internet, data),and e-Dimension (content, wholesale), with revenues of US$ 522 million in 2013.74 Thenumber of main telephone lines operated by Jordan Telecom has decreased by -25.09%between2009and2014(seeTable11).
Table11:JordanTelecom:FixedTelephoneLines(2009-2014) 2009 2010 2011 2012 2013 2014 CAGR
Maintelephonelines 501,238 485,529 465,388 434,437 378,411 375,483 -5.6%Source:ITUWorldTelecommunication/ICTIndicators2015Attheendof2014,therewere375,483fixedlinesrecordedrepresentinga5.6%CAGRdeclinefrom501,238in2009.75Fixedtomobilesubstitutioniscreditedtobethemainreasonforthedecline of fixed-line subscriptions.76In addition, the development of WiMAX technologycontributed to the fixed linedecline.Thedecrease in thenumberof fixed lines isnegativelyimplicating ADSL services. Furthermore, the introduction of local loop unbundling hasreducedthedependenceonotheroperatorsandtheintroductionofnakedDSL.77The decline in fixed lines was mirrored by a decrease in wireless telephony subscriptionsbetween2013and2014.Zainshowedadeclineof0.6%from4,001,520in2013to3,976,235in 2014 and Orange had a 2.9% decline from 3,323,369 in 2013 to 3,227,180 in 2014.Umniah’s wireless telephony subscriptions have remained relatively stable. That said, thenumberofconnectionshasbeengrowingagainin2015forallthreeoperators(seeTable12).
Table12.Jordan:WirelessTelephonyConnections(2010-2015)
74Reuters75Ibid.,pg.26.76Ibid.77Ibid.

25
Source: GSMA Intelligence (2015) Asdepictedintable5,thewirelesstelephonymarketissplitacrossthreeoperators.However,Zainholdsalargersharebothintermsofsubscribersandrevenues(seetable13).Table13.Jordan:Wirelesssubscriberandrevenuemarketshares(2010-2015)
2010 2011 2012 2013 2014 Subscriber Revenue Subscriber Revenue Subscriber Revenue Subscriber Revenue Subscriber Revenue Subscriber
Zain 39.3% 50.3% 35.6% 48.2% 37.3% 49.1% 39.1% 51.8% 39.7% 45.8% 39.1%Orange 32.3% 25.8% 33.6% 29.0% 35.4% 28.2% 34.2% 24.7% 32.4% 21.0% 32.9%Umniah 27.6% 22.8% 30.5% 22.8% 27.1% 22.8% 26.4% 23.6% 27.9% 22.9% 27.9%
Source:GSMAIntelligence(2015)
Between 2013 and 2014, Zain recorded a 1.5% rise in subscribers and a decline inmarketshareofrevenuesfrom51.8%to45.8%.In2014,Orangeheld32.4%oftotalconnectionsand21.0% of aggregated sector revenues. The company has lost share of both subscribers andrevenuesfrom2013.Thecompanyisrecordedtohave3.4millionsubscribersasofNovember2015.Unmiah’smobile subscriptionmarket share stands at 27.9% in 2015. The company’srevenueshare isreportedtobe22.9%in2014,holdingthe leastamountofsubscribersandrevenue in themarketcomparedtoOrangeandZain.Withmarketpenetrationatsaturationrates (133%), the industry has been undergoing intense price competition, resulting in adeclineinpricerealization.Since2010,theblendedARPU(AverageRevenuePerUser)forallthreeplayershasbeendeclining.TheTunisiantelecommunicationsindustryexhibitshighcompetitiveintensity.Beyondactivecompetitioninthemobilesegment,fixedbroadbanddepictsservice-basedcompetitionbasedonlocalloopunbundling(seetable14).
Table14.Tunisia:TelecommunicationsIndustryStructure(2014)(linesin‘000) Fixed
telephonyMobileTelephony MobileBroadband FixedBroadband
Lines Share Connections Share Connections Share Subscribers ShareTunisieTelecom 857 90.3% 5,050 31.8% 1,056 19.5% 5 1.0%Ooredoo(NMTC) 6 0.6% 7,523 47.3% 1,837 36.6% 21 4.3%Orange 86 9.1% 3,314 20.9% 2,107 43.9% 87 17.5%Globalnet 89 17.8%Hexabyte 43 8.6%Topnet 241 48.5%FSIPublics 11 2.3%Total 949 15,887 5,000 498
Sources:ITUWorldTelecommunication/ICTIndicators2015;GSMAIntelligence;InstanceNationaledesTélécommunicationsThe recorded number of fixed telephone lines in 2014 was 949 million. Key centers forcommunications in Tunisia include Sfax, Sousse, Bizerte, and Tunis. Tunisie Telecom is the
2010 2011 2012 2013 2014 2015Zain 2,530,537 2,810,072 3,567,511 4,001,520 3,976,235 4,092,580
Orange 2,167,296 2,723,903 3,232,846 3,323,369 3,227,180 3,433,749 Umniah 2,010,440 2,320,313 2,408,440 2,761,301 2,760,487 2,895,021

26
incumbent fixed operator in the Tunisian market. Orange Tunisie was the second fixedoperator to launch in themarket.OoredooTunisie, the third entrant to themarket, startedoperationsinNovember2013.Tunisia is considered to be middle-low tier of fixed broadband penetration (13.91% ofhouseholdsin2014)intheemergingworld.Asviewedinthesectionbefore,fixedbroadbandsubscriptionrateshaveleveledoffatanaverageof498,515lines.Topnet,themainoperatorinthissector,reported241,000ADSLlinesbyyear-end2014.Recentlytheunbundlingof localexchangesforbroadbandhasleadtocompetitioninthemarketbyOrange.Theoperatoroffersbroadband services over a 400km fiber backbone. There are 11 Internet Service Providers(ISP)inTunisia.Ofthese,sixaregovernment-owned(ATI,INBM,CCK,CIMSP,IRESA,andFSI)and five are privately held (Orange, Globalnet, Hexabyte, Topnet, and Tunet). The rapiddevelopmentinInternetallowsTunisiatoholdthehighestFacebookpenetrationrate(31%)inAfrica.78As fixed line subscribers continue todecrease,mobile lineshave steadily increased. Witha142%penetration rate, there are a total of 15.88millionmobile telephones,way above the949 thousand recorded fixed lines. The competition between the different mobile serviceprovidersresultedinloweractivationchargesandusagechargescontributingtothesurgeinmobile subscriptions in the past ten years. Three main companies offer mobile services:TunisieTelecom,Ooredoo,andOrange(seetable15).
Table15:Tunisia:Mobiletelecommunicationsmarketshare(2009-2015) 2009 2010 2011 2012 2013 2014 2015TunisieTelecom 46.6% 40.4% 36.7% 33.4% 31.4% 31.8% 30.4%Ooredoo 53.2% 52.9% 52.4% 52.7% 53.5% 47.3% 44.6%Orange 6.7% 10.9% 13.8% 15.1% 20.9% 24.9%
Source:GSMAIntelligence In 2015, Tunisie Telecom held 30.4% of themarket share, while Ooredoo held 44.6% andOrangecontrolled24.9%of themarket.TunisieTelecom2Gcoverage is100%of theurbanpopulation and 85% of the rural population.79The carrier offers SMS voicemessaging andothervalue services. The secondmobile entrant in2002,Ooredoo, coversover99%of thetotalpopulationandalsoofferssimilarvalueaddedservices.Orange,thelastentrant,wasthefirst mobile provider to offer 3G services (in May 2010). Their services include videotelephony,mobileTVviaWAP,andvideo surveillance systems.80TunisieTelecomshowedaslightdecrease(6.0%)insubscriptionsfrom2013-2014.OoredooandOrange’ssubscriptionsforwirelesstelephonyalsodeclinedby4.4%and19.7%respectivelyinthesameperiod.Tunisie Telecom andOrange entered a partnershipwith Interroute (UK based) to extend afiber-optic cable fromTunisia toSicily.81InFebruary2014,TunisieTelecomembarkedona78“Tunisia’sTelecommunicationTroubles,”GoodGovernanceAfrica.<http://gga.org/stories/editions/aif-16-bridge-the-gaps/tunisia2019s-telecommunications-troubles>.79“InformationInsights:Tunisia,”MicrosoftCommunicationsandMediaSector,14July2012.80Ibid.81<http://gga.org/stories/editions/aif-16-bridge-the-gaps/tunisia2019s-telecommunications-troubles>.

27
threeyeardealwiththeFrench-USvendorAlcatel-Lucenttoupgradetheirnetwork;TunisieTelecomaims todevelopvoiceanddatanetwork intoasingle IP infrastructure.Toupgradetheprovider’sbroadband,ADSL/VDSL/GPONtechnologieswillbeimplemented.Thecompanyintroducedarolloutof2G/3GservicestotheruralSaharanareasofTunisiainMay2014.82Finally, the Moroccan telecommunications industry exhibits high competitive intensity.Beyond active competition in the mobile segment, fixed broadband depicts service-basedcompetitionbasedonlocalloopunbundling(seetable16).
Table16.Morocco:TelecommunicationsIndustryStructure(2014)(linesin‘000) Fixed
telephony MobileTelephony MobileBroadband FixedBroadband
Lines Share Connections Share Connections Share Subscribers ShareMeditel(Orange) 13,592 30.8% 2,716 25.4% MarocTelecom(Etisalat) 2,488 100% 18,230 41.3% 4,771 44.6% 983 100%Inwi(Wana) 12,293 27.9% 3,199 29.9% Total 2,488 44,115 10,688 983
Sources:ITU;GSMAIntelligence;ANRT MarocTelecomhad amonopoly over the fixed infrastructure network. In June2014,ANRTestablished rules governing local loop unbundling (LLU) with the aim to level the fixedbroadband playing field.83With the new regulations,Maroc Telecom is required to providecolocation, third party operators equipment, install multi-operator cabinets, and establishactivewholesaleofferforthird-partyoperatorsundertheVULAmodel.84TheANRTorderedMarocTelecomtochangetheconditionsoftheirwholesaleleasedlineaccessofferinordertoensureaprofitmarginof50%forotheroperators.85AfterANRTposedthenewregulations,InwiandMeditelaccusedMarocTelecomoffailuretopublishawholesaleofferforaccesstoitsfixedlocalloop.Ofthe46millionmobileconnectionsmarketattheendof2015,MarocTelecomheld41.1%sharewhileMeditelcontrolled32.8%andWana(Inwi)heldtheleast(26.1%)(seeTable17).
82TeleGeography,23May2014.83TeleGeography,23Jun2014.84Ibid.85TeleGeography,16Jul2014.

28
Table17.Morocco:Mobilemarketshares(%)(2010-2015)
2010 2011 2012 2013 2014 2015MarocTelecom(Etisalat) 52.8% 46.8% 45.8% 42.9% 41.3% 41.1%Meditel(Orange) 33.7% 32.9% 29.5% 29.2% 30.8% 32.8%Inwi(Wana) 13.4% 20.2% 24.7% 28.0% 27.9% 26.1%
Source:GSMAIntelligence AstheregionfastestmultinationaltelecomoperatorwithpursuitsinnorthwestAfrica,MarocTelecomsawanincreaseinbothmobileandbroadbandsubscriptions,16,890,000in2010to18,230,000in2014formobileand681,673in2012to983,000in2014infixedbroadband86.The secondmobile entrant in 2000,Meditel, broke themonopoly thatMaroc held over thesector. Meditel offers mobile telephony, fixed broadband, and fixed-line telephony throughlocal loop unbundling. Despite intense competition within the sector, Meditel’s mobilesubscriptions increased from 11,523,000 in 2012 to 13,592,000 in 2014. 94% of Meditel’scustomersareprepaid.Themostrecentmobileentrant,Inwi(Wana),offersmobiletelephony,Internet, andmobile services. From2012 to 2013, Inwi sawa surge ofmore than400% inconnections.3GisthedominantInternetaccessmodeinMorocco(accountingfor89%ofthetotalInternetmarket at end-September 2014)87.With 5.44millionmobile broadband customers88,MarocTelecomleadsthemarketbysubscribers.
Table18.Morocco:WirelessBroadbandMarketShares(%)(2010-2015) 2010 2011 2012 2013 2014 2015MarocTelecom(Etisalat) 39.5 36.3 34.4 32.8 44.6 49.6Meditel(Orange) 28.9 32.7 33.6 33.0 25.4 22.0Inwi(Wana) 31.6 29.0 32.0 34.2 29.9 28.3
Source:GSMAIntelligence2015 During2014, thewirelessoperatorsstarted trialingLTEservices inpreparation forabidofLTE/4G spectrum auction, which took place in November 2014.Maroc Telecom’s LTE trialprovedasuccessinRabatwithdownloadspeedsupto140Mbps.Thecarrierhasupgradeditsmobile network in additional locations: Tangier, Kenitra, El Jadida, and Laayoune.89Theoperator also aims to expand the coverage and quality of 3G networks as it rolls LTEinfrastructure. Inwi additionally conducted LTE tests in theMohammedia region. InMarch2015,ANRTgranteda20-yearLTEconcessiontoallthreeofthecountriesmobileoperators.The concession includes operation of trunked radio networks (3RP), satellitetelecommunication services with GMPCS technologies, and telecom satellite services withVSATtechnology.90
86Source:ITUWorldTelecommunication/ICTIndicators201587Source:ANRT88Source:GSMAIntelligence2015.89TeleGeography,14Nov2014.90TeleGeography,4Mar2014.

29
TheADSLsector,dominatedbyMarocTelecom,decreaseddramaticallyrelativeto3Ginthepast year; in 2013, ADSL only represented 15% of Internet subscriptions whereas 3Grepresented85%.91Aspartof theMoroccangovernment’s10yearnationalBroadbandPlan,fixed-lineinfrastructureisbeingupgraded.Theaimofthisplanistoprovidefixedandmobilebroadbandaccesstotheentirepopulationby2022.49%ofthepopulationrecordedusingtheInternet in2010witha3Ghandsetpenetrationof17.21%in2011with figuresexpected togrow.92Maroc,Meditel,andInwiarethemainInternetServiceProvidersinthecountry.TheANRTgainedthepowertoimposepenaltiesupto20%ofcompanyturnover(pre-tax)ininfringementcasesthroughlegislativeamendments.93Additionally,theamendmentaddressesconsumerprotection,infrastructureshaving,andintegrationofopticalfiberinbuildings.94In2014,thetelecommunicationsmarketinMoroccosawasignificantpricereduction(23%)formobileservicesfortheaverageoutgoingvoicecall,whichsignificantlyboosted(15%)averageusage volume per user95 . Telecommunications sector revenues fell sharply due to theaccelerationofcompetitioninthemobilemarket(seeFigure1).
Figure1:AnnualchangeinrealGDPandTelecomMarket2001-2012
Sources:WorldDevelopmentIndicators(2015);ITUWorldTelecommunication/ICTIndicators2015 During this time frame, the blendedARPU (Average Rate PerUser) forMaroc Telecomhasshowngradualdecreaseleadingto$6.51inthefirstquarterof2015.Ontheotherhand,theblendedARPU forMeditel and Inwialsonotedadecline;MeditelARPUratesdropped from$5.41in2010to$5.05in2014andInwiARPUratesdroppedfrom$16.89to$7.92inthesameperiod.
91<http://www.budde.com.au/Research/Morocco-Telecoms-Mobile-and-Broadband.html>.92“InformationInsights:Morocco,”MicrosoftCommunicationsandMediaSector.May26,2012.93TeleGeography,3Jan2014.94Ibid.95Source:ANRT,3rdquarterof2014.
16.11%%
10.84%%
19.76%%
16.04%%
0.41%% 1.14%%
8.38%%
,10.29%%
,5.37%%
4.00%%2.98%%
7.76%%
2.71%%
5.59%%4.76%%
3.64%%4.99%%
2.67%%4.38%%
6.31%%
,15%%
,10%%
,5%%
0%%
5%%
10%%
15%%
20%%
25%%
2005% 2006% 2007% 2008% 2009% 2010% 2011% 2012% 2013% 2014%
Telecommunica9ons%
Real%GDP%

30
4. TheeconomicimpactoftelecommunicationsinMENAcountriesTheimpactoftelecommunicationsontheeconomiesofMENAcountriesneedstobeassessedfirstintermsofthesector’sdirectimpact,asmeasuredbytheircontributiontotheGDPandthe employment opportunities generated by its operators and their local suppliers. On theother hand, telecommunications must also be viewed as a general purpose technology,meaningthatithasanadditionalimpactresultingfromthepositiveexternalitiesasreviewedin chapter 2. This chapter will assess the direct and indirect contribution thattelecommunicationshashadthusfaroneconomicdevelopmentinthethreeMENAcountriesunderstudy.
5.1. DirecteconomiccontributionThe direct economic effects of telecommunicationswitnessed in the threeMENA countriesunder study are sizable. Total revenues generated by the telecommunications industriesamounttoUS$7,140million,whichrepresents3.68%ofthethreecountries’GDP(seetable19).
Table19.MENAcountries:TelecommunicationsIndustryRevenues(2014) Revenues GDP PercentofGDPJordan $1,523 $35,765 4.26%Tunisia $1,545 $48,533 3.18%Morocco $4,072 $109,201 3.73%Total $7,140 $193,499 3.68%
Sources:InternationalTelecommunicationsUnion;GSMAIntelligence;TelecomAdvisoryServicesanalysis
InthecaseofJordan,thetelecommunicationsindustryrevenueshaverangedbetween3.63%and5.02%ofthecountryGDPsince2002.

31
Figure2:Jordan:TelecommunicationsSectorRevenues(aspercentageofGDP)(2002-2014)
Source: World Development Indicators (2015); ITU World Telecommunication/ICT Indicators 2015 Ontheotherhand,theTunisiantelecommunicationsindustryrevenuescomprised3.18%ofthecountry’sGDPin201496.Thesectorrepresentedahighpointof4.27%oftheGDPin2010,butitsweighthassloweddownrelativetotheGDP,somewhatreducingitsdirectcontribution(seefigure3). Figure3.Tunisia:TelecommunicationsSectorRevenues(aspercentageofGDP)(2002-
2014)
Source:WorldDevelopmentIndicators(2015);ITUWorldTelecommunication/ICTIndicators2015
96Source:ITUWorldTelecommunication/ICTIndicators2015.
3.63%3.91%4.12%4.36%
4.69%5.01% 4.74%4.74%5.02%
5.07% 4.98%4.55%4.26%
5.79%
4.16%
8.56%8.16%8.09%8.18%
7.23%
5.48%
2.34%2.56%2.65%2.83%3.10%
0%
1%
2%
3%
4%
5%
6%
7%
8%
9%
10%
2002 2003 2004 2005 2006 2007 2008 2009 2010 2011 2012 2013 2014
Telecommunica8onsSectorRevenue(aspercentageofGDP)RealGDPGrowth
1.21%1.75%
3.08% 3.24% 3.19%3.48%
4.07%
3.80%4.27%
4.24%3.90%
3.59%
3.18%1.72%
5.38%5.62%
3.82%
5.65%6.23%
4.74%
3.61%3.25%
-0.51%
4.66%
2.52%
2.30%
-1%
0%
1%
2%
3%
4%
5%
6%
7%
8%
2002 2003 2004 2005 2006 2007 2008 2009 2010 2011 2012 2013 2014
Telecommunica9onsSectorRevenue(aspercentageofGDP)RealGDPGrowth

32
Finally, in the case of Morocco, the telecommunications industry revenues in 2014represented3.73%ofthecountry’sGDP97.Afterreachingahighpointof4.76%oftheGDPin2008,itsoverallimportancehasdecreasedonepercentagepoint(seefigure4). Figure4.Morocco:TelecommunicationsSectorRevenues(aspercentageofGDP)(2002-
2014)
Source:WorldDevelopmentIndicators(2015);ITUWorldTelecommunication/ICTIndicators2015 In addition to its direct monetary contribution to the economy, the telecommunicationsindustryalsofuelledjobcreation.In2013,thetelecommunicationsindustrygenerated28,714directjobs(bytherespectiveoperators)andanestimated59,710indirectjobs(byprovidersofinputstotheindustry)withinthethreecountries(seetable20).
Table20.MENACountries:TelecommunicationsIndustryEmployment(2013)
Directjobs IndirectJobs98
DirectandIndirectJobs(*)
CountryWorkforce
PercentofTotalWorkforce
Jordan 4,214 7,710(*) 11,924 1,198,000 1.00%Tunisia 11,000 10,000 21,000 3,978,000 0.53%Morocco 13,500 42,000 55,000 12,255,000 0.45%Total 28,714 59,710 87,924 17,431,00 0.50%Note:(*)WebelievethistobealowestimategiventhatJordancounts3600pointsofsaleofSIMcardand25,000pointstorefillcards.Sources:InternationalTelecommunicationsUnion;Telecommunicationsoperators;GSMAIntelligence;TelecomAdvisoryServicesanalysis Therefore,thesumofalljobscreatedbythetelecommunicationsindustryrepresents0.50%ofthetotalworkforceofallfourcountries.97Sources:InternationalTelecommunicationsUnion. 98Source:estimationbyTelecomAdvisoryServicesLLCbasedontheresearch-basedassumptionscontainedinthedigitizationmodelinKatz,R.,Koutroumpis,P.andCallorda,F.(2014).“Usingadigitizationindextomeasureeconomicandsocialimpactofdigitalagendas”,Info,January.
2.01%&2.46%&
3.03%&3.50%& 3.62%&
4.39%&4.94%& 4.72%& 4.60%& 4.77%&
4.21%&3.82%& 3.73%&
3.32%&
6.32%&
4.80%&
2.98%&
7.76%&
2.71%&
5.59%&
4.76%&
3.64%&
4.99%&
2.67%&
4.38%&
6.31%&
0%&
1%&
2%&
3%&
4%&
5%&
6%&
7%&
8%&
9%&
10%&
2002& 2003& 2004& 2005& 2006& 2007& 2008& 2009& 2010& 2011& 2012& 2013& 2014&
Telecommunica8ons&Sector&Revenue&(as&percentage&of&GDP)&Real&GDP&Growth&

33
Beyonditsdirectcontribution,thetelecommunicationsindustryalsohasanindirecteffectoneconomicgrowth.ThenextsectionassessesthepositiveexternalitiesoftelecommunicationsinallthreeMENAcountryeconomies. 5.2. IndirecteconomiccontributionAs shown in the literature reviewed above, beyond its direct economic contribution,telecommunicationscanhaveapositiveeffectoneconomicgrowth.ThissectionassessesthepositiveexternalitiesoftelecommunicationsinallthreeMENAcountries.Asanticipatedintheintroduction, given the differingmobile telephony versus broadband penetration rates, theanalysis of economic impact of both technologies will be conducted through differenteconometricmodels.Regionalandcountry-levelstatisticalstudiesof ICT’s impactonemergingeconomiesusuallysuffer froma lackofdataas the institutionsand technical committeesdonotalwayscollectinformationinarelativelyfrequentandconsistentmanner.Thissituationintroducesadegreeofcomplexity in thedataminingphase.Thisstudyreliedonseveraldatabases includingthelocalregulatoraswellasGSMAIntelligence,andtheInternationalTelecommunicationsUnion.In-countryoperatorscompiledadditionaldata.Theoperatorsprovided telecommunications’costs and, in the case of mobile telephony, they were disagregated in pre- and post-paidARPUs. Othermacroeconomicmetrics (GDP, fixed capital formation, education, labor force,etc.) are available from the World Bank and IMF. Market performance metrics (capex,revenues, etc.) are also available from local operators. A description of data sources isincludedinAppendixA.5.2.1.MobiletelecommunicationseconomicimpactTomeasuretheindirecteconomicimpactofmobiletelephonyontheGDP,astructuralmodelconsistingoffourequationswasconstructed:anaggregateproductionfunctionmodelingtheeconomy and, subsequently, three functions: demand, supply and output. The last threefunctionsmodel the wireless market operation and, controlling for the reverse effects, theactualimpactoftheinfrastructuresisestimated.Intheproductionfunction,GDPislinkedtothefixedstockofcapital, laborandthemobileinfrastructureproxiedbymobilepenetration.Inaddition,acontrolvariableaccountingforoilpricesandadummyvariablerepresentingthesocio-political shock of the Arab Spring were included. The demand function links mobilepenetrationtotheaverageconsumptionpropensityofindividualsproxiedbyGDPpercapita,thecostofabasicmobileserviceandthecompetitioninthemobilemarket,measuredbytheHHI(HerfindahlHirschman)index.ThesupplyfunctionlinkstheaggregatemobilerevenuetomobilepricelevelsproxiedbyARPU(AverageRevenueperUser),theindustryconcentrationindex of the mobile market (HHI), and GDP per capita. The infrastructure equation linksannual change in mobile penetration to mobile revenues, used as a proxy of the capitalinvestedinacountryduringoneyear.
Theeconometricspecificationofthemodelisasfollows:

34
AggregateProductionfunction: GDPit=a1Kit+a2Lit+a3Mob_Penit+a4OilPriceit+a5Shockit+eit(1)
Demandfunction: Mob_Penit=b1Ruralit+b2Fixedit+b3Mob_Priceit+b4GDPCit+b5HHIit+eit(2)
Supplyfunction:Mob_Revit=c1MobPrit+c2GDPCit+c3HHIit+ε3it(3)Outputfunction:
(4)
These models found that mobile telephony (through 2G and 3G networks) has indirectlycontributed the MENA countries’ economies significantly during the last 13 years (2001-2014).TheannualizedaveragecontributiontotheGrossDomesticProductrangesbetweenanestimated0.124%ofGDPgrowth(forJordan)to1.43%(forMorocco)forevery1%increaseofmobilepenetration.Eachmodelwillbereviewedinturn.TheresultsofJordan’smobiletelecommunicationsmodelarepresentedintable21.
ΔMob_Penit = d1Mob_ Revit + ε4 it

35
lnrural lnfixed lgdpc1 lmobcost hhi_mobile yr_4 yr_5 yr_6 yr_7 yr_8 yr_9 yr_10 yr_11 yr_12 yr_13 yr_14 yr_15 Exogenous variables: lfcapital_3 llabedu_1 lnoil primavera2 yr_1 yr_2 yr_3 Endogenous variables: lgdp1 lmobusers lrevenuemobile mobgrowth _cons 29.18191 3.992632 7.31 0.000 21.3565 37.00732lrevenuemo~e -1.517594 .2107247 -7.20 0.000 -1.930607 -1.104582mobgrowth _cons 31.06297 2.081509 14.92 0.000 26.98329 35.14266 hhi_mobile -1.20187 .139146 -8.64 0.000 -1.474591 -.929149 lmobcost -.1619883 .1142528 -1.42 0.156 -.3859196 .061943 lgdpc1 -.2015332 .1599081 -1.26 0.208 -.5149474 .1118809lrevenuemo~e _cons 42.68361 5.097892 8.37 0.000 32.69192 52.6753 hhi_mobile -.7116089 .1358069 -5.24 0.000 -.9777855 -.4454323 lmobcost -.763087 .0985955 -7.74 0.000 -.9563305 -.5698434 lgdpc1 .0023603 .2084703 0.01 0.991 -.4062339 .4109546 lnfixed 1.809357 .1785271 10.13 0.000 1.45945 2.159264 lnrural -11.94281 1.29964 -9.19 0.000 -14.49006 -9.39556lmobusers _cons -.4783899 .5337441 -0.90 0.370 -1.524509 .5677293 yr_15 (omitted) yr_14 -.0085673 .0166775 -0.51 0.607 -.0412546 .02412 yr_13 -.0257143 .0219331 -1.17 0.241 -.0687025 .0172738 yr_12 -.0396814 .0288945 -1.37 0.170 -.0963135 .0169507 yr_11 -.0706626 .0310764 -2.27 0.023 -.1315713 -.0097539 yr_10 -.1497286 .0339035 -4.42 0.000 -.2161781 -.083279 yr_9 -.2426455 .0366411 -6.62 0.000 -.3144607 -.1708302 yr_8 -.3386734 .0491304 -6.89 0.000 -.4349673 -.2423795 yr_7 -.4179018 .0562343 -7.43 0.000 -.5281191 -.3076845 yr_6 -.4516534 .0628244 -7.19 0.000 -.574787 -.3285198 yr_5 -.382221 .080602 -4.74 0.000 -.540198 -.2242441 yr_4 -.3605213 .0909407 -3.96 0.000 -.5387618 -.1822808 yr_3 -.369367 .0963915 -3.83 0.000 -.5582909 -.1804431 yr_2 -.3706046 .1006657 -3.68 0.000 -.5679057 -.1733035 yr_1 (omitted) primavera2 -.0046642 .016606 -0.28 0.779 -.0372113 .0278828 lnoil -.0050288 .0194928 -0.26 0.796 -.043234 .0331764 lmobusers .1244647 .0418222 2.98 0.003 .0424948 .2064347 llabedu_1 -.1194211 .1761961 -0.68 0.498 -.4647592 .2259169 lfcapital_3 .4572255 .079413 5.76 0.000 .301579 .6128721lgdp1 Coef. Std. Err. z P>|z| [95% Conf. Interval]
mobgrowth 56 1 .619227 0.5476 51.87 0.0000lrevenuemo~e 56 3 .1337734 0.8659 417.81 0.0000lmobusers 56 5 .0660929 0.9920 8188.34 0.0000lgdp1 56 18 .020342 0.9982 32047.10 0.0000 Equation Obs Parms RMSE "R-sq" chi2 P Three-stage least-squares regression
> bile)> ed lgdpc1 lmobcost hhi_mobile) (lrevenuemobile lgdpc1 lmobcost hhi_mobile) (mobgrowth lrevenuemo. reg3 (lgdp1 lfcapital_3 llabedu_1 lmobusers lnoil primavera2 yr_1-yr_15 ) (lmobusers lnrural lnfix
Table21.Jordan:ResultsofMobileTelecommunicationsModel
Source:TASanalysis
ThemodelresultsconfirmtheeconomicspilloverofmobiletelecommunicationsinJordan.Inaddition,thestructuralmodelyieldsotherinterestingfindings:
• Wireless prices affect both the demand (coefficient: -0.76) although the
coefficient of impact of prices on the supply of services is not statisticallysignificant
• Competition has positively affected pricing, yielding lower revenue streams(coefficient:-1.202)
• Incomesdonotappeartobestatisticallysignificantintheirimpactonrevenuesandadoption (see secondand thirdequation); this isbecause the inclusionofthe rural population variable results in lower penetration with higher ruralpopulation(coefficient:-11.94)
Likewise,econometricmodels foundthatmobilevoice telecommunications(through2Gand3Gnetworks)hassignificantlyaffectedtheeconomyofTunisiabetween2001and2014.The

36
annualizedaveragecontributiontotheGrossDomesticProductisequaltoanestimated0.108%ofGDPgrowthforevery1%increaseofmobilepenetration(seeTable22).
Table22.Tunisia:ResultsofMobileTelecommunicationsModel
Source:TASanalysis
ThemodelresultsconfirmtheeconomicspilloverofmobiletelecommunicationsinTunisia.Inaddition,thestructuralmodelyieldsotherinterestingfindings:
• Wirelesspricesaffectwirelesssupply(coefficient:0.804),while thecoefficient
ofimpactofpricesonthedemandofservicesisnotstatisticallysignificant• Income, as measured by GDP per capita, seems to affect positively wireless
penetration(coefficient:3.020)andwirelessrevenues(coefficient:3.024)Finally,theeconometricmodelsalsofoundthatmobilevoicetelecommunications(through2Gand 3G networks) have significantly affected the economy of Morocco between 2001 and2014.TheannualizedaveragecontributiontotheGrossDomesticProductinthiscaseisequal
lmobcost hhi_mobile yr_7 yr_8 yr_9 yr_10 yr_11 yr_12 yr_13 yr_14 yr_15 lnrural lgdpc1 Exogenous variables: lfcapital_3 llabedu_1 lnoil yr_2 yr_3 yr_4 yr_5 yr_6 Endogenous variables: lgdp1 lmobusers lrevenuemobile mobgrowth _cons 2.733492 .2801069 9.76 0.000 2.184492 3.282491lrevenuemo~e -.1358309 .0144349 -9.41 0.000 -.1641228 -.1075391mobgrowth _cons 59.94693 6.816433 8.79 0.000 46.58697 73.30689 hhi_mobile -2.66219 .2710937 -9.82 0.000 -3.193524 -2.130856 lmobcost .8046495 .3517575 2.29 0.022 .1152176 1.494082 lgdpc1 3.024828 1.185246 2.55 0.011 .7017878 5.347868lrevenuemo~e _cons 39.39915 6.483287 6.08 0.000 26.69215 52.10616 hhi_mobile -2.663461 .2525595 -10.55 0.000 -3.158469 -2.168454 lmobcost -.1118245 .3283777 -0.34 0.733 -.755433 .531784 lgdpc1 3.020386 1.10634 2.73 0.006 .8519997 5.188773 lnrural 2.170195 .4461435 4.86 0.000 1.29577 3.04462lmobusers _cons 9.380778 .6159412 15.23 0.000 8.173556 10.588 yr_15 .0709852 .0480626 1.48 0.140 -.0232158 .1651861 yr_14 .050135 .0470192 1.07 0.286 -.0420208 .1422909 yr_13 .0270517 .0463486 0.58 0.559 -.0637899 .1178933 yr_12 .005356 .0439213 0.12 0.903 -.0807281 .0914402 yr_11 .0337888 .0427182 0.79 0.429 -.0499373 .1175149 yr_10 .0191241 .0411598 0.46 0.642 -.0615477 .0997959 yr_9 -.0108324 .0421276 -0.26 0.797 -.0934011 .0717362 yr_8 -.0366587 .043999 -0.83 0.405 -.1228952 .0495777 yr_7 -.0823749 .0419626 -1.96 0.050 -.1646202 -.0001296 yr_6 -.0995876 .0385312 -2.58 0.010 -.1751074 -.0240679 yr_5 -.0852786 .0328091 -2.60 0.009 -.1495834 -.0209739 yr_4 -.0951818 .0289987 -3.28 0.001 -.1520183 -.0383454 yr_3 -.0888612 .025598 -3.47 0.001 -.1390325 -.03869 yr_2 -.0552041 .018177 -3.04 0.002 -.0908304 -.0195779 lnoil .0182185 .009224 1.98 0.048 .0001397 .0362973 lmobusers .1077474 .0370625 2.91 0.004 .0351062 .1803886 llabedu_1 -.1961728 .2125332 -0.92 0.356 -.6127302 .2203847 lfcapital_3 .0631113 .0336854 1.87 0.061 -.0029108 .1291335lgdp1 Coef. Std. Err. z P>|z| [95% Conf. Interval]
mobgrowth 57 1 .0962772 0.6396 88.55 0.0000lrevenuemo~e 57 3 .2663906 0.9004 610.42 0.0000lmobusers 57 4 .2423241 0.9537 1365.93 0.0000lgdp1 57 18 .0088718 0.9966 19240.52 0.0000 Equation Obs Parms RMSE "R-sq" chi2 P Three-stage least-squares regression
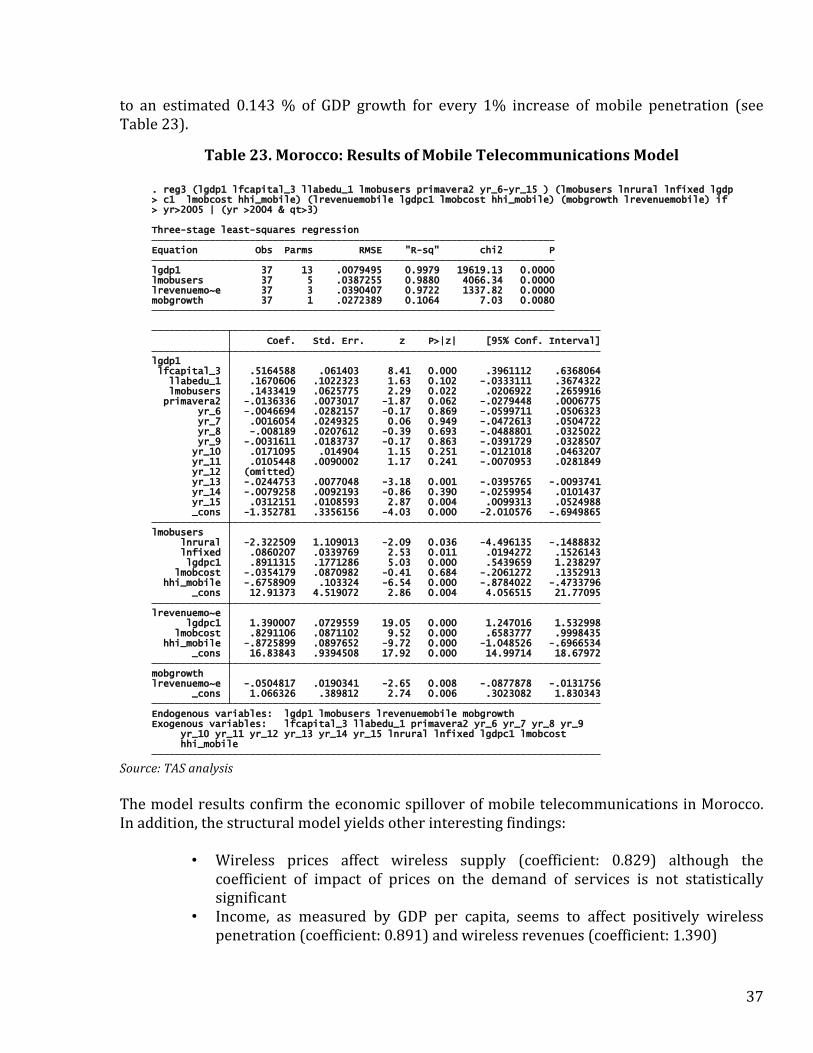
37
to an estimated 0.143% of GDP growth for every 1% increase ofmobile penetration (seeTable23).
Table23.Morocco:ResultsofMobileTelecommunicationsModel
Source:TASanalysis
ThemodelresultsconfirmtheeconomicspilloverofmobiletelecommunicationsinMorocco.Inaddition,thestructuralmodelyieldsotherinterestingfindings:
• Wireless prices affect wireless supply (coefficient: 0.829) although the
coefficient of impact of prices on the demand of services is not statisticallysignificant
• Income, as measured by GDP per capita, seems to affect positively wirelesspenetration(coefficient:0.891)andwirelessrevenues(coefficient:1.390)
hhi_mobile yr_10 yr_11 yr_12 yr_13 yr_14 yr_15 lnrural lnfixed lgdpc1 lmobcost Exogenous variables: lfcapital_3 llabedu_1 primavera2 yr_6 yr_7 yr_8 yr_9 Endogenous variables: lgdp1 lmobusers lrevenuemobile mobgrowth _cons 1.066326 .389812 2.74 0.006 .3023082 1.830343lrevenuemo~e -.0504817 .0190341 -2.65 0.008 -.0877878 -.0131756mobgrowth _cons 16.83843 .9394508 17.92 0.000 14.99714 18.67972 hhi_mobile -.8725899 .0897652 -9.72 0.000 -1.048526 -.6966534 lmobcost .8291106 .0871102 9.52 0.000 .6583777 .9998435 lgdpc1 1.390007 .0729559 19.05 0.000 1.247016 1.532998lrevenuemo~e _cons 12.91373 4.519072 2.86 0.004 4.056515 21.77095 hhi_mobile -.6758909 .103324 -6.54 0.000 -.8784022 -.4733796 lmobcost -.0354179 .0870982 -0.41 0.684 -.2061272 .1352913 lgdpc1 .8911315 .1771286 5.03 0.000 .5439659 1.238297 lnfixed .0860207 .0339769 2.53 0.011 .0194272 .1526143 lnrural -2.322509 1.109013 -2.09 0.036 -4.496135 -.1488832lmobusers _cons -1.352781 .3356156 -4.03 0.000 -2.010576 -.6949865 yr_15 .0312151 .0108593 2.87 0.004 .0099313 .0524988 yr_14 -.0079258 .0092193 -0.86 0.390 -.0259954 .0101437 yr_13 -.0244753 .0077048 -3.18 0.001 -.0395765 -.0093741 yr_12 (omitted) yr_11 .0105448 .0090002 1.17 0.241 -.0070953 .0281849 yr_10 .0171095 .014904 1.15 0.251 -.0121018 .0463207 yr_9 -.0031611 .0183737 -0.17 0.863 -.0391729 .0328507 yr_8 -.008189 .0207612 -0.39 0.693 -.0488801 .0325022 yr_7 .0016054 .0249325 0.06 0.949 -.0472613 .0504722 yr_6 -.0046694 .0282157 -0.17 0.869 -.0599711 .0506323 primavera2 -.0136336 .0073017 -1.87 0.062 -.0279448 .0006775 lmobusers .1433419 .0625775 2.29 0.022 .0206922 .2659916 llabedu_1 .1670606 .1022323 1.63 0.102 -.0333111 .3674322 lfcapital_3 .5164588 .061403 8.41 0.000 .3961112 .6368064lgdp1 Coef. Std. Err. z P>|z| [95% Conf. Interval]
mobgrowth 37 1 .0272389 0.1064 7.03 0.0080lrevenuemo~e 37 3 .0390407 0.9722 1337.82 0.0000lmobusers 37 5 .0387255 0.9880 4066.34 0.0000lgdp1 37 13 .0079495 0.9979 19619.13 0.0000 Equation Obs Parms RMSE "R-sq" chi2 P Three-stage least-squares regression
> yr>2005 | (yr >2004 & qt>3)> c1 lmobcost hhi_mobile) (lrevenuemobile lgdpc1 lmobcost hhi_mobile) (mobgrowth lrevenuemobile) if . reg3 (lgdp1 lfcapital_3 llabedu_1 lmobusers primavera2 yr_6-yr_15 ) (lmobusers lnrural lnfixed lgdp

38
Looking at the results in light of the specification of similarmodels implemented for othercountries indicates that the economic impact of wireless telephony in Morocco is fairlyconsistentwith anexponential growth impact curveand return to scale asdrawnbasedonothercountries(seeFigure5).
Figure5.ComparativeMobileTelecomunicationsEconomicImpactvs.WirelessPenetration
Source:TASanalysisAllthreeMENAcountries–Morocco,Tunisia,andJordan-exhibitfairlyconsistentGDPimpactofmobiletelecommunications.GiventhatmobilepenetrationinMENAishigherthantheoneregistered in 2012 in Francophone Africa, the results confirm the postulate that economicimpactincreaseswithadoptionofthetechnology.
By relying on the country specific coefficients, the actual contribution of wirelesstelecommunications to each of the countries’ GDPs was estimated. For this purpose, thecompoundannual growth rateofwirelesspenetrationbetween2001and2014 (formula5)wasmultiplied by the coefficient of economic impact derived from the econometric modelpresentedinTables21,22,and23: CAGR=(Wirelesspenetration4Q2014-Wirelesspenetration4Q2001)^(1/13)-1(5)99 ImpactofwirelessonGDP(2001-2014)=CAGR*CoefficientofImpact(6)Followingthis,theannualimpactofwirelessonacountry’sGDPwasdividedbytheCAGRofGDP(formula7)andmultipliedbytheincrementalGDPbetween2001and2014(formula8).
%impactofwirelesstoGDPgrowth=AnnualimpactofwirelessonGDP/CAGRGDP(2001-20124)(7)99ForTunisia,thestartingpointwas4Q2013.
0%
2%
4%
6%
8%
10%
12%
14%
16%
0% 20% 40% 60% 80% 100% 120% 140% 160%
GD
P Im
pact
Penetration
Senegal (2012)
Cote D´Ivoire (2012)
Tunisia (2014)
Mali(2012)
Jordan (2014)
Morocco (2014)
Niger (2012)

39
ImpactofWirelessonIncrementalGDP=IncrementalGDP(2014-2001)*%impactofwirelesstoGDPgrowth(8)BydividingthetotalimpactofwirelessonincrementalGDPgrowthbetween2014and2001bythenumberofyears,theannualimpactwasestimatedforeachcountry(seetable24).
Table24.MENAcountries:AnnualMobileTelecommunicationsImpactonGDP
Item Component Jordan Tunisia Morocco Sourceand/orestimationformula
1
AnnualcontributionofwirelesstelephonytoGDPgrowth(forevery10%increaseinwirelesspenetration)
1.24% 1.08% 1.43% Coefficientresultingfromstructuralmodel
2 Mobiletelecommunicationspenetration4Q2014 127.49% 57.77% 130.81% GSMAIntelligence
3 Mobilepenetration4Q2001 17.67% 14.36%(*) 16.50% GSMAIntelligence
4
CompoundAnnualGrowthRate(CAGR)ofmobiletelecommunicationspenetration
16.42% 13.49% 17.26%
(Mobiletelecommunicationspenetration
4Q2014/4Q2001)^(1/13years)-1(**)
5 AnnualimpactofmobiletelecommunicationsonGDP 2.04% 1.45% 2.47% (Annualimpact)/10*(CAGRMobile
telecommunicationspenetration)
6 CAGRGDP(2001-2014) 11.22% 5.32%(***) 8.52% (GDP4Q2014/GDP4Q2001)^(1/13years)-1
7PercentcontributionofwirelesstelephonytoGDPgrowth
18.21% 27.26%(****) 29.05%Annualimpactofmobile
telecommunicationsonGDP/CAGRGDP(2001-2014)
8 IncrementalGDPgrowth(4Q2014/4Q2001) US$26,790M US$21,099M
(*****)US$
71,476M GDP4Q2014-GDP4Q2001
9TotalImpactofWirelessTelephonyonIncrementalGDPgrowth
US$4,879M US$5,764M(******)
US$20,761M
IncrementalGDP(4Q2014/4Q2001)*%contributionofmobile
telecommunicationstoGDPgrowth
10 AnnualimpactofmobiletelecommunicationsonGDP US$375M US$524M
(*******)US$1,597
M Totalimpact/13years
(*)Startingpoint4Q2003(**)ForTunisia,(Mobileuniquesubscriberspenetration4Q2014/4Q2003)^(1/11years)-1(***)ForTunisia,(GDP4Q2014/GDP4Q2003)^(1/11years)-1(****)ForTunisia,AnnualimpactofmobiletelecommunicationsonGDP/CAGRGDP(2003-2014)(*****)ForTunisia,GDP4Q2014-GDP4Q2003(******)ForTunisia,IncrementalGDP(4Q2014/4Q2003)*%contributionofmobiletelecommunicationstoGDPgrowth(*******)ForTunisia,Totalimpact/11yearsSource:TASanalysisAccordingtotheformulaepresentedintable24,theindirectannualcontributionofwirelesstelephony to theGDPwasUS$375million for Jordan,US$524million forTunisia, andUS$1,597millionforMorocco. 5.2.3MobileBroadbandeconomicimpact

40
Toanalyzemobilebroadband’simpactontheMENAcountries’economy,weutilizedamodelsimilartothemobiletelecommunicationsstructuralmodelpresentedabove.Themodelalsoconsists of four equations: an aggregate production functionmodeling the operation of theeconomy and subsequently three demand, supply and output functions. In the productionfunction,GDPislinkedtothefixedstockofcapital,laborandthemobileinfrastructureproxiedbymobilebroadbandpenetration.The latter functionsmodel themobilebroadbandmarketoperation and estimate the economic impact ofmobile broadbandwhile controlling for thereverseeffects.Thedemandfunctionlinksmobilebroadbandpenetrationtofixedbroadbandpenetration (to understand substitution dynamics), the average consumption propensity ofindividualsproxiedbyGDPpercapita,thepriceofabasicmobilebroadbandservice(priceofamonthlysubscription),andthelevelofcompetitiveintensityinthemobilebroadbandsector,measured by the HHI index. The supply function links the aggregate mobile broadbandrevenuetotherelevantpricelevels,levelofcompetitiveintensity,andtheGDPpercapita.Theinfrastructureequation linksannual change inmobilebroadbandpenetration to themarketrevenues,usedasaproxyofthecapitalinvestedinacountryduringoneyear.
Theeconometricspecificationofthemodelisasfollows:
AggregateProductionfunction:GDPit=a1Kit+a2Lit+a3Mob_Bob_Penit+eit(6)
Demandfunction:
Mob_Bob_Penit=b1FBB_Penit+b2Mob_Penit+b3Mob_Bob_Priceit+b4GDPCit+b5HHI_MBBit+eit(7)
Supplyfunction:Mob_Bob_Revit=c1Mob_Bob_Prit+c2GDPCit+c3HHI_MBBit+ε3it(8)
Outputfunction:
VariationinMBB_Penit=d1MBB_Revit+ε3it(9)ThemodelsfoundthatmobilebroadbandhasaffectedtheeconomyofJordanbetween2011and2014.TheannualizedaveragecontributiontotheGrossDomesticProductisequaltoanestimated 0.039% of GDP growth for every 1% increase ofmobile broadband penetration(seeTable25).

41
yr_12 yr_13 yr_14 yr_15 lnrural lmobusers lgdpc1 lmbbcost hhi_mb Exogenous variables: lfcapital_3 llabedu_1 lnoil primavera2 yr_10 yr_11 Endogenous variables: lgdp1 lmbbusers lrevenuembb mbbgrowth _cons 1.714387 .7636923 2.24 0.025 .217578 3.211197 lrevenuembb -.0820195 .0464399 -1.77 0.077 -.17304 .009001mbbgrowth _cons -403.1933 108.6826 -3.71 0.000 -616.2073 -190.1793 hhi_mb -2.86353 .7158797 -4.00 0.000 -4.266629 -1.460432 lmbbcost 15.48514 4.279883 3.62 0.000 7.096724 23.87356 lgdpc1 48.90461 11.55968 4.23 0.000 26.24805 71.56116lrevenuembb _cons -1155.859 119.9516 -9.64 0.000 -1390.96 -920.7583 hhi_mb -1.66111 .3526017 -4.71 0.000 -2.352196 -.9700229 lmbbcost 2.378411 4.211616 0.56 0.572 -5.876205 10.63303 lgdpc1 69.46864 5.917436 11.74 0.000 57.87068 81.0666 lmobusers -.2876481 2.192606 -0.13 0.896 -4.585077 4.009781 lnrural 205.752 36.81618 5.59 0.000 133.5937 277.9104lmbbusers _cons .1105626 .3044989 0.36 0.717 -.4862443 .7073696 yr_15 (omitted) yr_14 -.0077203 .0068132 -1.13 0.257 -.021074 .0056333 yr_13 -.0116568 .0115384 -1.01 0.312 -.0342717 .010958 yr_12 -.0131287 .0157971 -0.83 0.406 -.0440905 .0178331 yr_11 .0321317 .0188947 1.70 0.089 -.0049013 .0691646 yr_10 .0476769 .0222135 2.15 0.032 .0041393 .0912145 primavera2 -.0269233 .0050067 -5.38 0.000 -.0367362 -.0171103 lnoil .0471987 .0123373 3.83 0.000 .0230179 .0713794 lmbbusers .0387972 .0053984 7.19 0.000 .0282165 .049378 llabedu_1 -.2228202 .0753224 -2.96 0.003 -.3704494 -.075191 lfcapital_3 .4627932 .0608062 7.61 0.000 .3436153 .5819711lgdp1 Coef. Std. Err. z P>|z| [95% Conf. Interval]
mbbgrowth 24 1 .4457181 0.1295 3.12 0.0774lrevenuembb 24 3 .4523575 0.9466 431.37 0.0000lmbbusers 24 5 .2172135 0.9898 2624.70 0.0000lgdp1 24 10 .0054849 0.9985 16895.20 0.0000 Equation Obs Parms RMSE "R-sq" chi2 P Three-stage least-squares regression
> bb) if yr>2008> sers lgdpc1 lmbbcost hhi_mb) (lrevenuembb lgdpc1 lmbbcost hhi_mb) (mbbgrowth lrevenuem. reg3 (lgdp1 lfcapital_3 llabedu_1 lmbbusers lnoil primavera2 yr_10-yr_15 ) (lmbbusers lnrural lmobu
Table25.Jordan:ResultsofMobileBroadbandModelSource:
TASanalysis
Themodelresultsconfirm
the
economic spillover ofmobile broadband in Jordan. In addition, the structuralmodel yieldsotherinterestingfindings:
• Mobilebroadbandpriceshaspositivelyaffected revenues (coefficient:15.485)
buthasnotstaticallysignificanteffectonmobilebroadbandpenetration• Competitionhaspositively affectedmobile broadbandpenetration (a negative
relationbetweenHHIandpenetrationof-1.661)• Incomes seem to affect positively mobile broadband penetration (coefficient:
69.468)andmobilebroadbandrevenues(coefficient:48.904)• OilpriceshasapositiveeffectonGDPgrowth(coefficient:0.047)andtheArab
springanegativeeffect(coefficient:-0.026)
ThemodelsfoundthatmobilebroadbandhaspositivelycontributedtotheeconomyofTunisiabetween2010and2014.TheannualizedaveragecontributiontotheGrossDomesticProductisequaltoanestimated0.020%ofGDPgrowthforevery1%increaseofmobilepenetration(seeTable26).
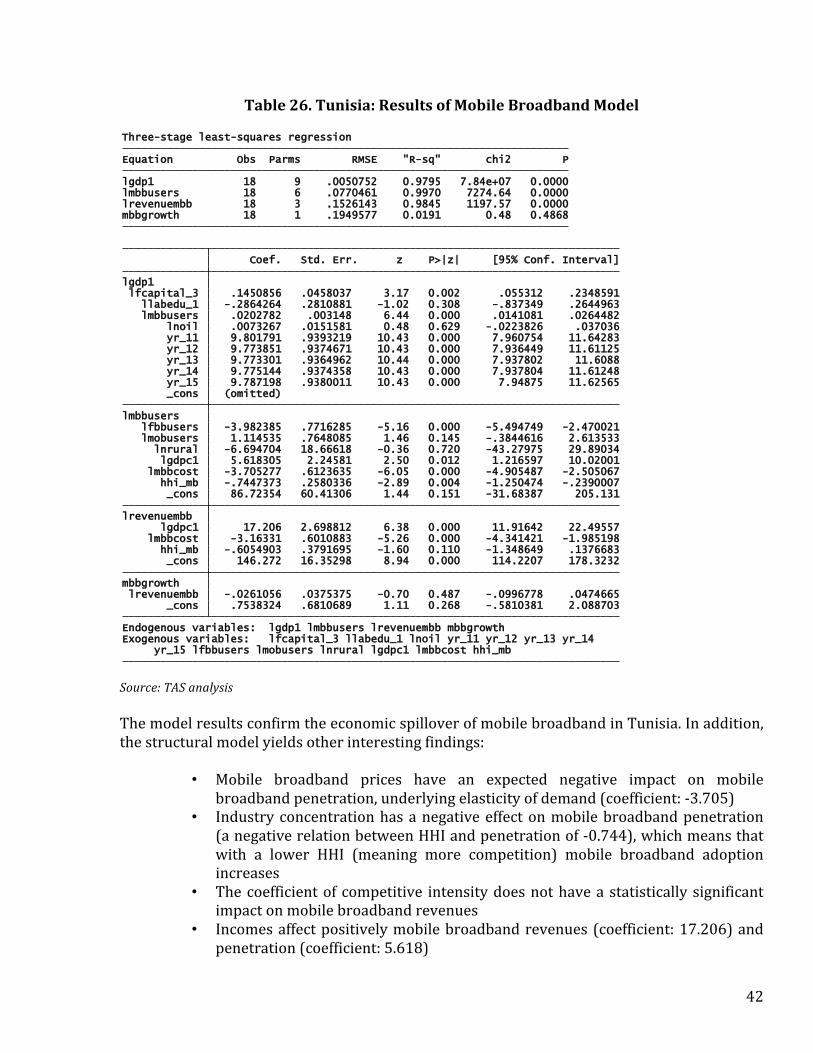
42
Table26.Tunisia:ResultsofMobileBroadbandModel
Source:TASanalysisThemodelresultsconfirmtheeconomicspilloverofmobilebroadbandinTunisia.Inaddition,thestructuralmodelyieldsotherinterestingfindings:
• Mobile broadband prices have an expected negative impact on mobile
broadbandpenetration,underlyingelasticityofdemand(coefficient:-3.705)• Industryconcentrationhasanegativeeffectonmobilebroadbandpenetration
(anegativerelationbetweenHHIandpenetrationof-0.744),whichmeansthatwith a lower HHI (meaning more competition) mobile broadband adoptionincreases
• Thecoefficientof competitive intensitydoesnothaveastatisticallysignificantimpactonmobilebroadbandrevenues
• Incomesaffectpositivelymobilebroadbandrevenues(coefficient:17.206)andpenetration(coefficient:5.618)
yr_15 lfbbusers lmobusers lnrural lgdpc1 lmbbcost hhi_mb Exogenous variables: lfcapital_3 llabedu_1 lnoil yr_11 yr_12 yr_13 yr_14 Endogenous variables: lgdp1 lmbbusers lrevenuembb mbbgrowth _cons .7538324 .6810689 1.11 0.268 -.5810381 2.088703 lrevenuembb -.0261056 .0375375 -0.70 0.487 -.0996778 .0474665mbbgrowth _cons 146.272 16.35298 8.94 0.000 114.2207 178.3232 hhi_mb -.6054903 .3791695 -1.60 0.110 -1.348649 .1376683 lmbbcost -3.16331 .6010883 -5.26 0.000 -4.341421 -1.985198 lgdpc1 17.206 2.698812 6.38 0.000 11.91642 22.49557lrevenuembb _cons 86.72354 60.41306 1.44 0.151 -31.68387 205.131 hhi_mb -.7447373 .2580336 -2.89 0.004 -1.250474 -.2390007 lmbbcost -3.705277 .6123635 -6.05 0.000 -4.905487 -2.505067 lgdpc1 5.618305 2.24581 2.50 0.012 1.216597 10.02001 lnrural -6.694704 18.66618 -0.36 0.720 -43.27975 29.89034 lmobusers 1.114535 .7648085 1.46 0.145 -.3844616 2.613533 lfbbusers -3.982385 .7716285 -5.16 0.000 -5.494749 -2.470021lmbbusers _cons (omitted) yr_15 9.787198 .9380011 10.43 0.000 7.94875 11.62565 yr_14 9.775144 .9374358 10.43 0.000 7.937804 11.61248 yr_13 9.773301 .9364962 10.44 0.000 7.937802 11.6088 yr_12 9.773851 .9374671 10.43 0.000 7.936449 11.61125 yr_11 9.801791 .9393219 10.43 0.000 7.960754 11.64283 lnoil .0073267 .0151581 0.48 0.629 -.0223826 .037036 lmbbusers .0202782 .003148 6.44 0.000 .0141081 .0264482 llabedu_1 -.2864264 .2810881 -1.02 0.308 -.837349 .2644963 lfcapital_3 .1450856 .0458037 3.17 0.002 .055312 .2348591lgdp1 Coef. Std. Err. z P>|z| [95% Conf. Interval]
mbbgrowth 18 1 .1949577 0.0191 0.48 0.4868lrevenuembb 18 3 .1526143 0.9845 1197.57 0.0000lmbbusers 18 6 .0770461 0.9970 7274.64 0.0000lgdp1 18 9 .0050752 0.9795 7.84e+07 0.0000 Equation Obs Parms RMSE "R-sq" chi2 P Three-stage least-squares regression

43
Despite mobile broadband impact on Tunisia’s GDP, its recent launch prevents fromestimatingitscontribution.Nevertheless,webelievethiseffectisalreadycapturedwithintheimpactofmobiletelecommunications.Finally, the econometricmodels found thatmobile broadband has affected the economy ofMoroccobetween2011and2014.TheannualizedaveragecontributiontotheGrossDomesticProduct is equal to an estimated 0.054% of GDP growth for every 1% increase ofmobilepenetration(seeTable27).
Table27.Morocco:ResultsofMobileBroadbandModel
Source:TASanalysisThe model results confirm the economic spillover of mobile broadband in Morocco. Inaddition,thestructuralmodelyieldsotherinterestingfindings:
• Mobilebroadbandpriceshaveanexpectednegative(crosselastic)relationshipwith
mobilebroadbandpenetration(coefficient:-0.449);
lmobusers lfbbusers lgdpc1 lmbbcost hhi_mb Exogenous variables: lfcapital_3 llabedu_1 yr_11 yr_12 yr_13 yr_14 yr_15 Endogenous variables: lgdp1 lmbbusers lrevenuembb mbbgrowth _cons .9331593 .8444628 1.11 0.269 -.7219574 2.588276 lrevenuembb -.0480837 .0482382 -1.00 0.319 -.1426288 .0464614mbbgrowth _cons -90.63119 12.41478 -7.30 0.000 -114.9637 -66.29866 hhi_mb 10.78122 1.786293 6.04 0.000 7.280146 14.28229 lmbbcost -.212624 .1395278 -1.52 0.128 -.4860935 .0608454 lgdpc1 3.132327 1.638031 1.91 0.056 -.0781541 6.342808lrevenuembb _cons -26.65321 9.386776 -2.84 0.005 -45.05096 -8.255468 hhi_mb 1.145904 1.273565 0.90 0.368 -1.350238 3.642045 lmbbcost -.4494617 .189812 -2.37 0.018 -.8214863 -.0774371 lgdpc1 .2238495 1.190083 0.19 0.851 -2.108671 2.55637 lfbbusers -1.10417 .3821251 -2.89 0.004 -1.853122 -.3552187 lmobusers 4.234589 .6043939 7.01 0.000 3.049999 5.41918lmbbusers _cons (omitted) yr_15 -6.433555 .5719983 -11.25 0.000 -7.554651 -5.312459 yr_14 -6.438692 .571374 -11.27 0.000 -7.558564 -5.318819 yr_13 -6.430542 .5704631 -11.27 0.000 -7.548629 -5.312455 yr_12 -6.41873 .5716253 -11.23 0.000 -7.539095 -5.298365 yr_11 -6.416927 .5719322 -11.22 0.000 -7.537894 -5.295961 lmbbusers .0541444 .0127535 4.25 0.000 .029148 .0791408 llabedu_1 -.839823 .0856092 -9.81 0.000 -1.007614 -.6720321 lfcapital_3 1.78021 .1030613 17.27 0.000 1.578213 1.982206lgdp1 Coef. Std. Err. z P>|z| [95% Conf. Interval]
mbbgrowth 18 1 .0683231 0.0074 0.99 0.3189lrevenuembb 18 3 .1132402 0.8906 148.13 0.0000lmbbusers 18 5 .079871 0.9572 449.01 0.0000lgdp1 18 8 .0030597 0.9968 2.10e+07 0.0000 Equation Obs Parms RMSE "R-sq" chi2 P Three-stage least-squares regression
> lmbbcost hhi_mb) (lrevenuembb lgdpc1 lmbbcost hhi_mb) (mbbgrowth lrevenuembb) . reg3 (lgdp1 lfcapital_3 llabedu_1 lmbbusers yr_11-yr_15) (lmbbusers lmobusers lfbbusers lgdpc1

44
• Competition has negatively affect mobile broadband revenues (a positive relationbetweenHHIandpenetrationof10.781)buthasnotstatisticallysignificantimpactonmobilebroadbandpenetration;
• Incomesseemtoaffectpositivelymobilebroadbandrevenues(coefficient:3.132)butdoesnothaveastatisticallysignificantimpactonmobilebroadbandpenetration.
The mobile broadband GDP impact coefficient of Jordan, Tunisia, and Morocco can becomparedwithestimatescalculatedusingsimilarstructuralmodels(Katzetal,2012;Katzetal, 2013). These estimates indicate that, similar to the wireless telecommunicationscontributiondiscussedabove,mobilebroadbandexhibitsareturntoscale(inotherwords,thehigher the penetration, the larger the economic effect). However, in the case of mobilebroadband, the shapeof the curvemight indicate lower returns to scale than in the caseofwirelesstelephony(seefigure6).
Figure6.EstimatesComparativeMobileBroadbandEconomicImpactvs.MobileBroadbandPenetration100
Source: TAS analysisThis lowerreturntoscalecouldbedueto two factors.First, initialmobilebroadbandusagecouldbeconcentratedonapplicationsthatmighthavesomeeconomicimpact.Forexample,atinitialstagesofdiffusion,mobilebroadbandusage isconcentratedonsocialnetworkaccess,whichdrivesprimarilythecreationofadigitaladvertisingindustry.Alongtheselines,anotherpotentialexplanation-aboutwhichweremaincautious-isthattheeconomiccontributionofmobilebroadbandshouldbeacceleratingovertimeduetothelaunchofnewservices,suchasfinancialservices,thatrelyontelecommunicationstoreachconsumers.
The actual contribution of mobile technology to the economiesof all three countries wascalculatedbymultiplyingthecompoundannualgrowthrateofmobilebroadbandpenetration100Coefficientsplottedat10%penetration.
0%
1%
2%
3%
4%
5%
6%
0% 10% 20% 30% 40% 50% 60%
GD
P Im
pact
Penetration
Jordan (2014)
Senegal (2012)
Tunisia (2014)
Philippines (2011)
Morocco (2014)

45
between 4Q2011 and 4Q2014101by the coefficient of economic impact derived from theeconometricmodelpresentedintables25,26,and27(Formula6):
CAGR=(Mobilebroadbandpenetration4Q2014(31.27%)-Mobilebroadbandpenetration4Q2011(17.12%))^(1/3years)-1(5)
The CAGR for mobile broadband in Morocco for the period 4Q2011 - 4Q2014 is 22.24%.
ImpactofmobilebroadbandonGDP(4Q2011-4Q2014)=CAGR(22.24%)*CoefficientofImpact(0.054)(6)
Table28.EstimationofmobilebroadbandindirectcontributiontoMENAcountries
economicgrowthbetween2011and2014
Item Factor Jordan Morocco Sourceand/orestimationformula
1AnnualcontributionofmobilebroadbandtoGDPgrowth(fora10%increaseinadditionalpenetration)
0.39% 0.54% Coefficientresultingfromstructuralmodel
2 Mobilebroadbandpenetration4Q2014 55.34% 31.27% GSMAIntelligence
3 Mobilebroadbandpenetration4Q2011 23.58% 17.12% GSMAIntelligence
4 CompoundAnnualGrowthRate(CAGR)ofmobilebroadbandpenetration
32.89% 22.24% (Mobilebroadbandpenetration4Q2014/4Q2011)^(1/3years)-1
5 AnnualimpactofmobilebroadbandonGDP
1.28% 1.20% (Annualimpact)/10*(CAGRMobilebroadbandpenetration)
6 CAGRGDP(2011-2014) 7.39% 3.25% (GDP4Q2014/GDP4Q2011)^(1/3years)-1
7 PercentcontributionofmobilebroadbandtoGDPgrowth 17.28% 37.05%
AnnualimpactofmobilebroadbandonGDP/CAGRGDP(2011-2014)
8 IncrementalGDPgrowth(2011-2014) US$6,884M
US$9,990M GDP4Q2014-GDP4Q2011
9 TotalimpactofmobilebroadbandonincrementalGDPgrowth
US$1,189M
US$3,701M
IncrementalGDP(4Q2014/4Q2011)*%contributionofmobilebroadbandtoGDPgrowth
10 AnnualimpactofmobilebroadbandonGDP
US$396M
US$1,234M Totalimpact/3years
Source:TelecomAdvisoryServicesanalysisAccording to the formula in table 28, the annual contribution on the Jordanian GDP frommobilebroadbandamounts to1.28%ofGDP.Basedon thedifferencebetween2011GDPofUS$28,881millionand2014GDPofUS$35,765million,whichyieldsaCAGRof7.39%102,the
101Consideringthatbetweenthesecondandfourthquarterof2011,mobilebroadbandpenetrationincreasedsignificantly(from12.68%to17.12%),thatperiodwasexcludedfromtheimpactanalysis.Thus,mobiletelecommunicationscontributionwasestimatedbetween4Q2011and4Q2014.102GiventhatthefinalestimationwasmadeoverthetotalGDP(ratherthanGDPpercapita),impactanalysisinthisstepreliedontotalGDPCAGR.

46
indirectannualcontributionofmobilebroadbandto theGDPof Jordanamounts toUS$396million.In the case of Tunisia, the annual contribution on GDP frommobile broadband amounts to1.72%ofGDP.Based on the difference between2012GDPofUS$45,239million and2014GDPofUS$48,553million,whichyieldsaCAGRof3.60%103,theindirectannualcontributionof mobile broadband to the GDP of Tunisia amounts to US$ 791million. However, mobilebroadband more recent deployment prevents estimating this effect with statisticalsignificance.Finally,forMorocco,accordingtotheformulae,theannualcontributiononGDPfrommobilebroadband amounts to 1.20% of GDP. Based on the difference between 2011 GDP of US$99,211millionand2014GDPofUS$109,201million,whichyields aCAGRof 3.25%104,theindirect annual contribution of mobile broadband to the GDP of Morocco amounts to US$1,234million.It shouldbementioned,however, that forpurposesofassessing total indirect contribution,mobilebroadbandimpactisalsoincludedinthecontributionofmobiletelecommunications. 5.2.4 FixedBroadbandeconomicimpactToanalyze fixedbroadband’s impacton theMENAcountries’ economy,weutilizedamodelsimilar to the mobile telecommunications structural one. The model also consists of fourequations: an aggregate production function modeling the operation of the economy andsubsequentlythreedemand,supplyandoutputfunctions.Thelatterfunctionsmodelthefixedbroadband market operation and estimate the economic impact of fixed broadband whilecontrollingforthereverseeffects.Thedemandfunctionlinksfixedbroadbandpenetrationtothe average consumptionpropensityof individualsproxiedbyGDPper capita, the cost of abasicfixedbroadbandservice(priceofamonthlysubscription),thepercentofindividualsthatfulfill secondary education, and thepercentof thepopulation residing indenselypopulatedurbanareas.ThesupplyfunctionlinkstheaggregatefixedbroadbandrevenuetotherelevantpricelevelsandtheGDPpercapita.Theinfrastructureequationlinksannualchangeinfixedbroadbandpenetration to themarket revenues, used as aproxyof the capital invested in acountryduringoneyear.
Theeconometricspecificationofthemodelisasfollows:AggregateProductionfunction:
GDPit=a1Kit+a2Lit+a3Fix_Bob_Penit+a4OilPriceit+a5Shockit+eit (6)
Demandfunction:Fix_Bob_Penit=b1Ruralit+b2Fixed_Tel_Penit+b3FBB_Priceit+b4GDPCit+b5HHI_FBBit+eit(7)
103GiventhatthefinalestimationwasmadeoverthetotalGDP(ratherthanGDPpercapita),impactanalysisinthisstepreliedontotalGDPCAGR.104GiventhatthefinalestimationwasmadeoverthetotalGDP(ratherthanGDPpercapita),impactanalysisinthisstepreliedontotalGDPCAGR.

47
Supplyfunction:
FBB_Revit=c1FBB_Prit+c2GDPCit+c3HHI_FBBit+ε3it(8)
Outputfunction:VariationinFBB_Penit=d1FBB_Revit+ε3it(9)
ThemodelfoundthatfixedbroadbandhasaffectedtheeconomyofJordanbetween2006and2014. The annualized average contribution to the Gross Domestic Product is equal to anestimated0.073%ofGDPgrowthforevery1%increaseoffixedpenetration(seeTable29).
Table29.Jordan:ResultsofFixedBroadbandModel
Source:TASanalysisInaddition,themodelresultsconfirmtheeconomicspilloveroffixedbroadbandinJordan.Inaddition,thestructuralmodelyieldsotherinterestingfindings:
• Fixedbroadbandpriceshaspositivelyaffectedrevenues(coefficient:1.270)• Competition has not statistically significant effect on fixed broadband
penetration

48
• Incomes seem to affect positively fixed broadband penetration (coefficient:0.420)andfixedbroadbandrevenues(coefficient:0.597)
• OilpriceshasapositiveeffectonGDPgrowth(coefficient:0.05)In addition, the model found that fixed broadband has affected the economy of Tunisiabetween2005and2014.TheannualizedaveragecontributiontotheGrossDomesticProductis equal to an estimated 0.101%of GDP growth for every 1% increase of fixed broadbandpenetration(seeTable30).
Table30.Tunisia:ResultsofFixedBroadbandModel
Source:TASanalysisThemodelresultsconfirmtheeconomicspilloverof fixedbroadbandinTunisia. Inaddition,thestructuralmodelyieldsotherinterestingfindings:
• Fixed broadband prices do not have a statistically significant impact on
penetration(thisisconsistentwithcountrieswithlowpenetration,whereearlyadoptersarelesspricesensitive)
yr_12 yr_13 yr_14 yr_15 lnrural lnfixed lgdpc1 lfbbcost hhi_fbb Exogenous variables: lfcapital_3 llabedu_1 lnoil yr_7 yr_8 yr_9 yr_10 yr_11 Endogenous variables: lgdp1 lfbbusers lrevenuefbb fbbgrowth _cons 2.054796 .2243884 9.16 0.000 1.615003 2.49459 lrevenuefbb -.1224333 .0140397 -8.72 0.000 -.1499507 -.0949159fbbgrowth _cons 123.3708 9.489112 13.00 0.000 104.7724 141.9691 hhi_fbb -1.10916 .3217764 -3.45 0.001 -1.739831 -.4784903 lfbbcost -1.495357 .3715832 -4.02 0.000 -2.223646 -.7670672 lgdpc1 14.51933 1.404453 10.34 0.000 11.76665 17.272lrevenuefbb _cons 352.4417 24.66657 14.29 0.000 304.0961 400.7873 hhi_fbb -.2678582 .2029911 -1.32 0.187 -.6657135 .1299971 lfbbcost -.2420463 .2619467 -0.92 0.355 -.7554523 .2713598 lgdpc1 5.889652 .9029712 6.52 0.000 4.119861 7.659443 lnfixed 6.294286 .6318014 9.96 0.000 5.055978 7.532594 lnrural -92.01957 8.555878 -10.76 0.000 -108.7888 -75.25036lfbbusers _cons 11.7643 1.051399 11.19 0.000 9.703598 13.82501 yr_15 .0827906 .0317604 2.61 0.009 .0205414 .1450398 yr_14 .0562481 .0323026 1.74 0.082 -.0070638 .1195599 yr_13 .0258332 .0329826 0.78 0.433 -.0388115 .0904779 yr_12 -.0078756 .0325915 -0.24 0.809 -.0717536 .0560025 yr_11 .0174078 .0307853 0.57 0.572 -.0429302 .0777458 yr_10 .0040161 .028021 0.14 0.886 -.050904 .0589363 yr_9 .0096738 .023094 0.42 0.675 -.0355897 .0549373 yr_8 .0005061 .0188984 0.03 0.979 -.036534 .0375461 yr_7 -.009757 .0111622 -0.87 0.382 -.0316345 .0121205 lnoil -.0020311 .0111004 -0.18 0.855 -.0237875 .0197254 lfbbusers .1013892 .0234446 4.32 0.000 .0554386 .1473397 llabedu_1 -.7114725 .2993209 -2.38 0.017 -1.298131 -.1248143 lfcapital_3 .0274233 .0417489 0.66 0.511 -.0544031 .1092496lgdp1 Coef. Std. Err. z P>|z| [95% Conf. Interval]
fbbgrowth 37 1 .0762928 0.6312 76.05 0.0000lrevenuefbb 37 3 .2598174 0.9141 401.09 0.0000lfbbusers 37 5 .1149318 0.9851 2828.02 0.0000lgdp1 37 13 .0081931 0.9890 3585.30 0.0000 Equation Obs Parms RMSE "R-sq" chi2 P Three-stage least-squares regression

49
• Income levels have a positive impact on fixed broadband penetration(coefficient:5.889)andonfixedbroadbandrevenues(coefficient:14.519)
• Acomplementaryeffectexistbetweenfixedlinetelephonepenetrationandfixedbroadbandpenetration(coefficient:6.294)
Themodel also found that fixed broadband has affected the economy ofMorocco between2006and2014.TheannualizedaveragecontributiontotheGrossDomesticProductisequaltoanestimated0.084%ofGDPgrowthforevery1%increaseoffixedbroadbandpenetration(seeTable31).
Table31.Morocco:ResultsofFixedBroadbandModel
Source:TASanalysisThemodelresultsconfirmtheeconomicspilloveroffixedbroadbandinMorocco.Inaddition,thestructuralmodelyieldsotherinterestingfindings:
• Fixedbroadbandpriceshasnotasignificantimpactinprices,norinrevenues• Competition has positively affected fixed broadband penetration (a negative
relationbetweenHHIandpenetrationof-1.347)
yr_15 lmbbusers lnrural lnfixed lgdpc1 lfbbcost hhi_fbb Exogenous variables: lfcapital_3 llabedu_1 yr_10 yr_11 yr_12 yr_13 yr_14 Endogenous variables: lgdp1 lfbbusers lrevenuefbb fbbgrowth _cons -1.554156 .8702949 -1.79 0.074 -3.259902 .151591 lrevenuefbb .0927377 .050847 1.82 0.068 -.0069206 .192396fbbgrowth _cons 6.657234 6.516 1.02 0.307 -6.11389 19.42836 hhi_fbb .0108446 1.011025 0.01 0.991 -1.970729 1.992418 lfbbcost -.0146431 .1096959 -0.13 0.894 -.2296432 .200357 lgdpc1 1.568325 .6883007 2.28 0.023 .2192801 2.917369lrevenuefbb _cons 31.2544 6.560955 4.76 0.000 18.39516 44.11363 hhi_fbb -1.34772 .2932718 -4.60 0.000 -1.922522 -.7729177 lfbbcost -.0765007 .0554237 -1.38 0.167 -.1851291 .0321277 lgdpc1 .6945729 .1592029 4.36 0.000 .382541 1.006605 lnfixed -.718536 .1541008 -4.66 0.000 -1.020568 -.416504 lnrural -5.698085 2.167674 -2.63 0.009 -9.946649 -1.449521 lmbbusers .0168601 .038111 0.44 0.658 -.0578361 .0915563lfbbusers _cons -4.517016 .9135615 -4.94 0.000 -6.307564 -2.726468 yr_15 (omitted) yr_14 -.014658 .007098 -2.07 0.039 -.0285698 -.0007462 yr_13 -.0110266 .0127643 -0.86 0.388 -.0360442 .013991 yr_12 .0088832 .016553 0.54 0.592 -.0235601 .0413265 yr_11 .0075135 .0184933 0.41 0.685 -.0287328 .0437597 yr_10 (omitted) lfbbusers .0840642 .0425875 1.97 0.048 .0005943 .1675342 llabedu_1 -.2071316 .1012369 -2.05 0.041 -.4055522 -.008711 lfcapital_3 1.243297 .1633139 7.61 0.000 .923208 1.563387lgdp1 Coef. Std. Err. z P>|z| [95% Conf. Interval]
fbbgrowth 20 1 .0191042 0.0132 3.33 0.0682lrevenuefbb 20 3 .0449892 0.6837 54.72 0.0000lfbbusers 20 6 .0092147 0.9982 12131.17 0.0000lgdp1 20 7 .0053624 0.9913 2372.19 0.0000 Equation Obs Parms RMSE "R-sq" chi2 P Three-stage least-squares regression
> r>2009 > dpc1 lfbbcost hhi_fbb) (lrevenuefbb lgdpc1 lfbbcost hhi_fbb) (fbbgrowth lrevenuefbb) if y. reg3 (lgdp1 lfcapital_3 llabedu_1 lfbbusers yr_10-yr_15 ) (lfbbusers lmbbusers lnrural lnfixed lg

50
• Incomes seem to affect positively fixed broadband penetration (coefficient:0.694)andfixedbroadbandrevenues(coefficient:1.568)
ThecoefficientoffixedbroadbandGDPimpactestimatedbythestructuralmodelabovecanbecomparedwiththosederivedfromapplyingsimilarmodelstoothercountries(seeFigure7).
Figure7:ComparativeFixedBroadbandEconomicImpactvs.FixedBroadbandPenetration
Source:TASanalysisConsideringJordan’srelatively lowfixedbroadbandpenetration, it isnotsurprisingthattheeconomic impact of the technology is fairly limited (0.073% of GDP growth for every 1%increase of mobile penetration) compared to the estimates calculated for industrializedcountries(suchasGermanywithanimpactcoefficientof0.23%).Ontheotherhand,asshownin figure 14, Jordan’s coefficient is fairly consistent with those estimated for other MENAcountries and other emerging nations. Considering that mobile broadband is assuming thepreeminent role in meeting Jordan’s demand, it is doubtful that the GDP impact of fixedbroadbandwilleverreachhighervalues.The actual contribution of fixed broadband was calculated by multiplying the compoundannual growth rate of fixed broadband penetration between 4Q2006 and 4Q2014 by thecoefficient of economic impact derived from the econometricmodel presented in Table 11(Formula6):
CAGR=(Fixedbroadbandpenetration4Q2014(26.87%)-Fixedbroadbandpenetration1Q2001(4.69%))^(1/8years)-1(5)
TheCAGRforfixedbroadbandinJordanfortheperiod4Q2006-4Q2014is24.39%.
ImpactoffixedbroadbandonGDP(4Q2006-4Q2014)=CAGR(24.39%)*CoefficientofImpact(0.073)(6)
0%
5%
10%
15%
20%
25%
30%
35%
0% 5% 10% 15% 20% 25% 30% 35% 40%
GD
P Im
pact
Penetration
Morocco (2014)
Jordan (2014)
Tunisia (2014)
Germany High
Germany Low
LATAM
Brazil
Chile
Panama

51
(seetable32).Table32.MENACountries:CalculationofFixedBroadbandIndirectContributiontoGDP
Item Factor Jordan Tunisia Morocco Sourceand/orestimationformula
1AnnualcontributionoffixedbroadbandtoGDPgrowth(fora10%increaseinadditionalpenetration)
0.73% 1.01% 0.84%Coefficientresultingfromstructuralmodel
2 Fixedbroadbandpenetration4Q2014 26.87% 13.91% 14.15% ANRT
3 Fixedbroadbandpenetration4Q2006 4.69% 10.97%(*) 6.25% UIT
4 CompoundAnnualGrowthRate(CAGR)offixedbroadbandpenetration 24.39% 4.87%(**) 10.76%
(Fixedbroadbandpenetration4Q2014/1Q2006)^(1/8years)-1
5 AnnualimpactoffixedbroadbandonGDP 1.77% 0.49% 0.90% (Annualimpact)/10*(CAGR
fixedbroadbandpenetration)
6 CAGRGDP(2006-2014) 11.42% 2.17%(***) 6.57% (GDP4Q2014/GDP
4Q2006)^(1/8years)-1
7 PercentcontributionoffixedbroadbandtoGDPgrowth
15.50% 22.75%(****) 13.77%
AnnualimpactoffixedbroadbandonGDP/CAGRGDP(2006-2014)
8 IncrementalGDPgrowth(2014-2006) US$20,708M
US$4,939M(*****)
US$43,561M
GDP4Q2014-GDP4Q2006
9 TotalimpactoffixedbroadbandonincrementalGDPgrowth
US$3,211M
US$1,124M(*******)
US$6,000M
IncrementalGDP(4Q2014/1Q2006)*%contributionoffixedbroadbandtoGDPgrowth
10 AnnualimpactoffixedbroadbandonGDP
US$401M
US$225M(********) US$750M Totalimpact/8years
(*)InTunisia,thestartingpointis4Q2009(**)InTunisia,(Fixedbroadbandpenetration4Q2014/4Q2009)^(1/5years)-1(***)InTunisia,(GDP4Q2014/GDP4Q2009)^(1/5years)-1(****)AnnualimpactoffixedbroadbandonGDP/CAGRGDP(2009-2014)(*****)InTunisia,GDP4Q2014-GDP4Q2009(******)InTunisia,IncrementalGDP(4Q2014/4Q2009)*%contributionoffixedbroadbandtoGDPgrowth(*******)Totalimpact/5yearsSource:TelecomAdvisoryServicesanalysisInthecaseofJordan,theannualcontributiononGDPfromfixedbroadbandamountsto1.77%ofGDP.Basedonthedifferencebetween2006GDPofUS$15,057millionand2014GDPofUS$35,765million,whichyieldsaCAGRof 11.42%105, the indirectannual contributionof fixedbroadbandtotheGDPofJordanamountstoUS$401million.
105GiventhatthefinalestimationwasmadeoverthetotalGDP(ratherthanGDPpercapita),impactanalysisinthisstepreliedontotalGDPCAGR.

52
ForTunisianfixedbroadband,theannualcontributiononGDPfromfixedbroadbandamountsto0.49%ofGDP.Basedonthedifferencebetween2009GDPofUS$43,614millionand2014GDPofUS$48,553million,whichyieldsaCAGRof2.17%106,theindirectannualcontributionoffixedbroadbandtotheGDPofTunisiaamountstoUS$225million.Finally,inthecaseofMorocco,theannualcontributiononGDPfromfixedbroadbandamountsto0.90%ofGDP.Basedonthedifferencebetween2006GDPofUS$65,640millionand2014GDPofUS$109,201million,whichyieldsaCAGRof6.57%107,theindirectannualcontributionoffixedbroadbandtotheGDPofMoroccoamountstoUS$750million.5.3TotalcontributionofthetelecommunicationsindustrytoMENAcountries’GDPWhenconsidering theaggregate industry revenuesand thespill-over indirecteffectson therestoftheMENAcountries’economies,telecommunicationshaveatotalGDPimpactrangingfromof6.43%inJordanto4.72%inthecaseofTunisia(seetable33).Table33.MENACountries:Directandindirectcontributionoftelecommunicationsto
theeconomy(2014) Jordan Tunisia Morocco
MillionUS$
In%ofGDP
MillionUS$
In%ofGDP
MillionUS$
In%ofGDP
IndustryGross
revenues
Fixedtelephony $526 1.47% $329 0.68% $27 0.03%Fixedbroadband $79 0.22% $35 0.07% $122 0.11%Mobiletelecommunications $918 2.57% $1,181 2.43% $3,923 3.59%Total $1,523 4.26% $1,545 3.18% $4,072 3.73%
Indirectcontribution
Mobiletelecommunications $375 1.05% $524 1.08% $1,597 1.46%Fixedbroadband $401 1.12% $225 0.46% $750 0.69%Subtotal $776 2.17% $749 1.54% $2,347 2.15%
Total $2,299 6.43% $2,294 4.72% $6,419 5.88%CountryGDP $35,765 100% $48,533 100% $109,201 100%
Source:TelecomAdvisoryServicesanalysis ThestrongcontributionoftelecommunicationstotheMENAcountries’economiesisafunctionoftwofactors:1. Thesectordynamism:thetelecommunicationssectorisgrowing,generatinginturndirect
andindirectjobs.Infact,theoperatorstriggerasignificantnumberoflocalsuppliers,distributionsagents,andprovidersofvariousservices,whichenhancethelocalvalueaddedtotheeconomy.
106GiventhatthefinalestimationwasmadeoverthetotalGDP(ratherthanGDPpercapita),impactanalysisinthisstepreliedontotalGDPCAGR.107GiventhatthefinalestimationwasmadeoverthetotalGDP(ratherthanGDPpercapita),impactanalysisinthisstepreliedontotalGDPCAGR.

53
2. Thepositiveexternalities(«Spill-overeffects»):telecommunicationsnetworksandservicesresultinamoreefficientfunctioningoftheeconomyparticularlyintermsof:• Productivitygainsinexistingsectors(suchastourism,exports,manufacturing)aswell
associalservices,suchaseducationandpublicadministration;• Innovationincentives,leadingtothecreationofnewbusinessesinthedigitaleconomy
(applications,softwareplatforms,localcontent);• Integrationofisolatedregions,leadingtofurtherdevelopmentofeconomicactivities;• Bettercoordinationamongeconomicagentsthroughimprovedknowledgeofinputs
marketprices(agriculture),bettercoordinationbetweeneconomicagentsresultinginlowtransactioncosts,enhancedabilitytonegotiatesellingprices;inventorymanagementanddeliverytracking;
• Improvementandextensionofdomesticeconomicexchanges,aswellasattheregionalandglobalscale.
5. PolicyImplicationstofacilitatetelecommunicationadoptionand
welfare Ultimately, this study finds that the overarching consensus – that ICT adoption encourageseconomicgrowth–holdstruefortheMENAcountriesunderstudy,whereICThasimpactedtheeconomyandemploymentwhileallowingthecountrytobenefitfrommanyofitspositiveexternalities.IntermsofGDPimpact,theresultsarefairlyconclusive(seetable34).Table34.MENACountries:TelecommunicationsDirectandIndirectContributionto
GDP(inUS$millionsunlessindicated)(2014) Jordan Tunisia Morocco Total
NationalGDP(2012) US$35,765 US$48,533 US$109,201 US$193,499DirectTelecommunicationsImpact US$1,523 US$1,545 US$4,072 US$7,140IndirectTelecommunicationsImpact US$776 US$749 US$2,347 US$3,872TotalTelecommunicationsImpact US$2,299 US$2,294 US$6,419 US$11,012PercentofNationalGDP 6.43% 4.72% 5.88% 5.69%Source:TASanalysis This study concluded that increased adoption of mobile and broadband technologyencourages economic activity by enhancing market access, fostering financial inclusion,delivering training resources, and even developing new sectors. Given the positiverelationshipbetween ICTandeconomic growth, these countriesmustpromotepolicies thatfoster adoption while also increasing regulatory stability and promoting local content andservicesdevelopment.Inaddition,thestudywasabletoformalizethestrengthoftelecommunicationscontributionvis-à-visthepenetrationoftechnology(seefigure8).
Figure8.ComparativeImpactofTelecommunicationsonGDPgrowth
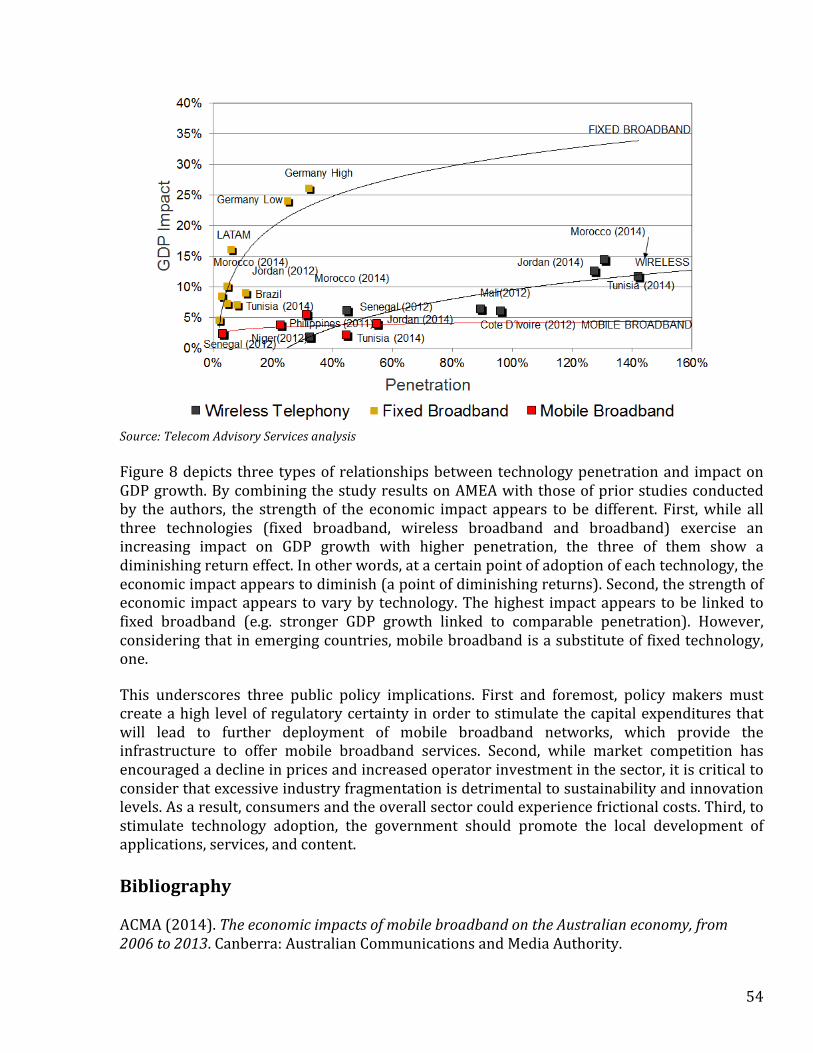
54
Source:TelecomAdvisoryServicesanalysis Figure8depicts threetypesofrelationshipsbetweentechnologypenetrationand impactonGDPgrowth.BycombiningthestudyresultsonAMEAwiththoseofpriorstudiesconductedby the authors, the strength of the economic impact appears to be different. First,while allthree technologies (fixed broadband, wireless broadband and broadband) exercise anincreasing impact on GDP growth with higher penetration, the three of them show adiminishingreturneffect.Inotherwords,atacertainpointofadoptionofeachtechnology,theeconomicimpactappearstodiminish(apointofdiminishingreturns).Second,thestrengthofeconomic impactappears tovaryby technology.Thehighest impactappears tobe linked tofixed broadband (e.g. stronger GDP growth linked to comparable penetration). However,consideringthatinemergingcountries,mobilebroadbandisasubstituteoffixedtechnology,one.This underscores three public policy implications. First and foremost, policy makers mustcreateahigh levelofregulatorycertainty inordertostimulatethecapitalexpendituresthatwill lead to further deployment of mobile broadband networks, which provide theinfrastructure to offer mobile broadband services. Second, while market competition hasencouragedadeclineinpricesandincreasedoperatorinvestmentinthesector,itiscriticaltoconsiderthatexcessiveindustryfragmentationisdetrimentaltosustainabilityandinnovationlevels.Asaresult,consumersandtheoverallsectorcouldexperiencefrictionalcosts.Third,tostimulate technology adoption, the government should promote the local development ofapplications,services,andcontent. Bibliography ACMA(2014).TheeconomicimpactsofmobilebroadbandontheAustralianeconomy,from2006to2013.Canberra:AustralianCommunicationsandMediaAuthority.

55
Aker, J. C. (2010). Information from Markets Near and Far: Mobile Phones and Agricultural Markets in Niger. American Economic Journal: Applied Economics, 2(3), 46-59. AnalysisMason(2015).Socio-economicimpactofmobilebroadbandinThailandandcontributiontothedigitaleconomy.London:GSMA. Andrianaivo, M. and Kpodar, K. (2001). ICT, Financial Inclusion and Growth: Evidence from African Countries. IMF Working Paper WP/11/73. Batzilis, D., Dinkelman, T., Oster, E., Thornton, R., and Zanera, D. (2010). “New cellular networks in Malawi: Correlates of service rollout and network performance”. National Bureau of Economic Research Working Paper 16616. Crandall, R., Lehr, W., & Litan, R. (2007). The Effects of Broadband Deployment on Output and Employment: A Cross-sectional Analysis of U.S. Data. Issues in Economic Policy, 6, 1-35. Czernich, N., Falck, O., Kretschmer T., & Woessman, L. (2009, December). Broadband infrastructure and economic growth (CESifo Working Paper No. 2861). Retrieved from www.ifo.de/DocCIDL/cesifo1_wp2861.pdf Donner, J., Gitau, S., & Marsden, G. (2011). Exploring Mobile-only Internet Use: Results of a Training Study in Urban South Africa. International Journal of Communication, 5, 574-597. Gillett, S., Lehr, W., and Osorio, C., & Sirbu, M. A. (2006). Measuring Broadband's Economic Impact. Technical Report 99-07-13829, National Technical Assistance, Training, Research, and Evaluation Project. Gruber, H., & Koutroumpis, P. (2011). Mobile Telecommunications and the impact on Economic Development. Telecommunications Policy, 67, 278-286. Deloitte(2015).TheMobileeconomy.London:GSMA Hardy, (1980). “The role of the telephone in Economic Development”, Telecommunications Policy, 4 (4), pp.278-286. Jensen, R. (2007). The Digital Provide: Information (Technology), Market Performance, and Welfare in the South Indian Fisheries Sector*. Quarterly Journal of Economics, 122(3), 879-924. Jorgenson, D., Ho, M, Samuels, J., Stiroh, K. (2007). Productivity growth in the new millennium and its industry origins. Paper presented at Sloan Industry Studies Conference, Boston. Karner, J and Onyeji, R. (2007). Telecom Private Investment and Economic Growth: the case of African and Central & East European Countries. Jonkoping International Business School

56
Kathuria, R., Uppal, M., Mamta (2009). An Econometric Analysis of the Impact of Mobile, The Vodafone Policy Paper Series (9), pp. 5-20. Katz, R. (2010). The contribution of broadband to economic development, Jordan, V., Galperin, H., Peres, W. Fast-Tracking the digital revolution: Broadband for Latin America and the Caribbean, Santiago, Chile: UN Economic Commission for Latin America. Katz, R. (2011a). "The impact of broadband on the economy: research to date and policy issues", Trends in Telecommunication reform 2010-11. Geneva: International Telecommunication Union. Katz, R. (2011b). Costa Rica National Broadband Plan. Rectoría de Telecomunicaciones. San Jose. Katz, R. (2011c). The economic impact of Vive Digital. CINTEL: Bogota. Katz, R. (2012). The Impact of Broadband on the Economy: Research to date and Policy Issues. Geneva: International Telecommunications Union. Katz, R. (2015). The impact of taxation on the Digital Economy. Geneva: International Telecommunications Union. Katz, R. and Suter, S. (2009). Estimating the economic impact of the broadband stimulus plan. Columbia Institute for Tele-Information Working Paper. Retrieved from www.elinoam.com/raulkatz/Dr_Raul_Katz_-_BB_Stimulus_Working_Paper.pdf Katz, R., Vaterlaus, S., Zenhäusern, P. & Suter, S. (2010). The Impact of Broadband on Jobs and the German Economy. Intereconomics, 45 (1), 26-34. Katz, R., Avila, J., Meille, G. (2011). The impact of wireless broadband in rural America. Washington, D.C.: Rural Cellular Association. Katz, R. and Koutroumpis, P. (2012). The economic impact of broadband on the Philippines. Geneva: International Broadband Commission. Katz,R.andCallorda,F.(2013).ElImpactoeconómicodelabandaanchaenEcuador.DIRSI.Katz,R.andKoutroumpis,P.(2013).AssessmentoftheEconomicImpactofTelecommunicationsinSenegal.NewYork:TelecomAdvisoryServicesLLCKatz,R.andKoutroumpis,P.(2014).AssessmentoftheEconomicImpactofTelecommunicationsinFrancophoneWestAfrica.NewYork:TelecomAdvisoryServicesLLCKatz,R.,Koutroumpis,P.andCallorda,F.(2014).Usingadigitizationindextomeasureeconomicandsocialimpactofdigitalagendas,Info,January.

57
Kelly, T., & Minges, M. (Eds.). (2012). Maximizing Mobile (Rep.). Retrieved http://siteresources.worldbank.org/EXTINFORMATIONANDCOMMUNICATIONANDTECHNOLOGIES/Resources/IC4D-2012-Report.pdf Klonner, S. and Nolen, P. (2010) “Cell Phones and Rural Labor Markets: Evidence from South Africa.” Proceedings of the German development Economics Conference, Hannover, 2010 56, Verein für Socialpolitik, Research Committee Development Economics Koutroumpis, P. (2009). The economic impact of broadband on growth: A simultaneous approach. Telecommunications Policy, 33(9), 471-485. Muto, M., & Yamano, T. (2008). The Impact of Mobile Phone Coverage Expansion on Market Participation: Panel Data Evidence from Uganda. World Development, 37(12), 1887-1896. Ng, T. H., Lye, C. T., & Lim, Y. S. (2013). Broadband penetration and economic growth in ASEAN countries: A generalized method of moments approach. Applied Economics Letters, 20(9), 857-862. Retrieved from http://www.tandfonline.com/doi/abs/10.1080/13504851.2012.754538?journalCode=rael20#preview Shideler, D., Badasyan, N., & Taylor, L. (2007, September 28-30). The economic impact of broadband deployment in Kentucky. Telecommunication Policy Research Conference, Washington D.C. Shiu, A., & Lam, P. (2008, June 25). 1 Relationships between Economic Growth, Telecommunications Development and Productivity Growth: Evidence around the World. In Africa-Asia-Australasia Regional Conference of the International Telecommunications Society. Retrieved from http://www.apeaweb.org/confer/hk10/papers/shiu_alice.pdf Thompson, H., & Garbacz, C. (2008). Broadband Impacts on State GDP: Direct and Indirect Impacts. Paper presented at the International Telecommunications Society 17th Biennial Conference, Canada. Varian (2002) Varian, H., Litan, R., Elder, A. & Shutter, J. (2002). The net impact study: the projected economic benefits of the Internet in the United States, United Kingdom, France and Germany, Available from: www.cisco.com, also available at www.itu.int/wsis/stocktaking/docs/activities/1288617396/NetImpact_Study_Report_Brookings.pdf Waverman, L., Meschi, M., Fuss, M. (2005). “The impact of telecoms on economic growth in developing countries”, The Vodafone Policy paper Series (2), pp. 10-23. Zenghelis, D. (2011, January). The Economics of Network-Driven Growth (Rep.). Retrieved http://www.cisco.com/web/about/ac79/docs/Economics_NPG_FINALFINAL.pdf
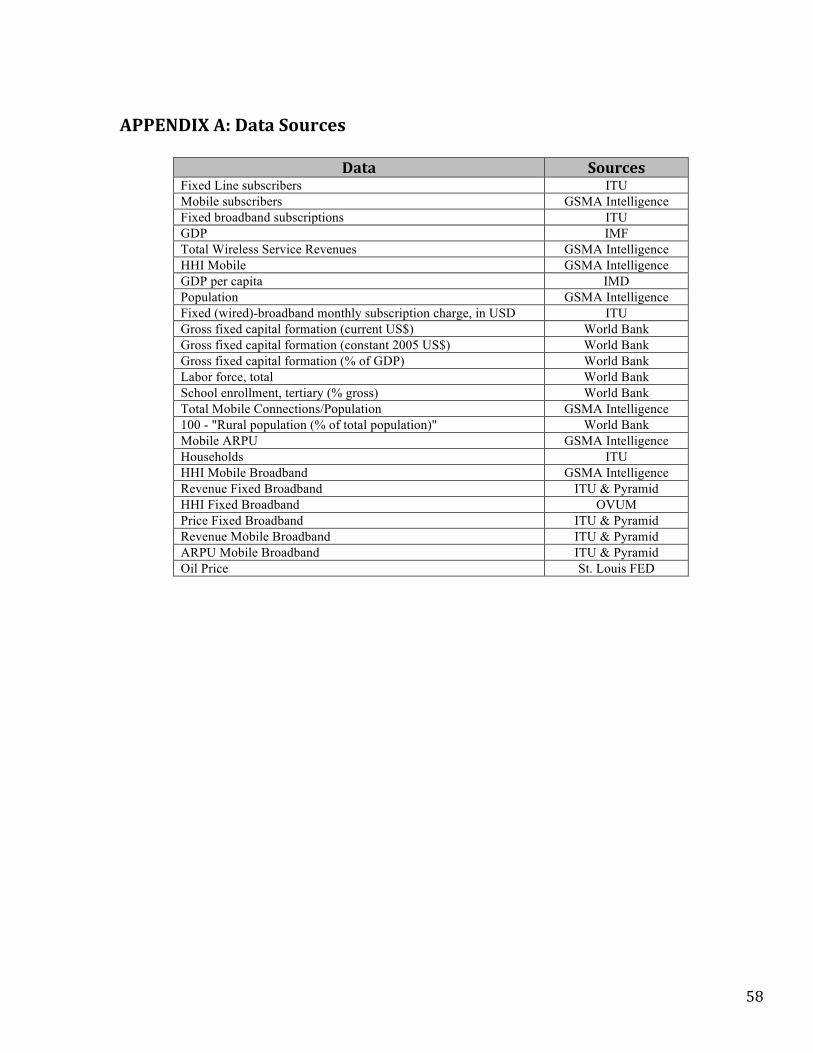
58
APPENDIXA:DataSources
Data SourcesFixed Line subscribers ITU Mobile subscribers GSMA Intelligence Fixed broadband subscriptions ITU GDP IMF Total Wireless Service Revenues GSMA Intelligence HHI Mobile GSMA Intelligence GDP per capita IMD Population GSMA Intelligence Fixed (wired)-broadband monthly subscription charge, in USD ITU Gross fixed capital formation (current US$) World Bank Gross fixed capital formation (constant 2005 US$) World Bank Gross fixed capital formation (% of GDP) World Bank Labor force, total World Bank School enrollment, tertiary (% gross) World Bank Total Mobile Connections/Population GSMA Intelligence 100 - "Rural population (% of total population)" World Bank Mobile ARPU GSMA Intelligence Households ITU HHI Mobile Broadband GSMA Intelligence Revenue Fixed Broadband ITU & Pyramid HHI Fixed Broadband OVUM Price Fixed Broadband ITU & Pyramid Revenue Mobile Broadband ITU & Pyramid ARPU Mobile Broadband ITU & Pyramid Oil Price St. Louis FED