Embed Size (px)
Citation preview

Research
Report number: 2018:17 ISSN: 2000-0456Available at www.stralsakerhetsmyndigheten.se
Assessment of structures subject to concrete pathologies (ASCET), phase 2
2018:17
Author: Björn ThunellScanscot Technology AB, Lund

SSM 2018:17

SSM 2018:17
SSM perspective
Background ASCET is an international research project initiated by WGIAGE1 OECD2 / NEA3. WGIAGE4 Concrete subgroup is a working group within the OECD / NEA whose task is to address issues concerning
• the maintenance of the integrity of concrete structures,
• proposals for general principles to optimally handle the challenges of integrity, especially with regard to aging of concrete structures.
The aim of the ASCET project is to create a basis for general recommen-dations regarding management of ageing related concrete degradation in nuclear facilities.
ResultsPhase 2 of the ASCET project consisted of a blind numerical simulation benchmark of a shear wall structure affected by concrete degradation, in this case ASR , tested under cyclic loading up to structural failure. The numerical simulations have been compared with experimental results. The numerical result revealed for example that the shear friction capac-ity, calculated as per section 6.2.5 in EC2, exceeds the experimentally derived capacity of the studied wall. The numerical simulation con-firmed that structures effected by ASR can have a higher ultimate shear capacity despite having nominally weaker material properties. That is because the concrete expansion caused by ASR is prevented due to the concrete reinforcement.
The results from this phase is important in order to create a basis for general recommendations regarding management of ageing related con-crete degradation in nuclear facilities.
Objectives Degradation of concrete structures important to safety has been identi-fied by SSM as a potential problem area as the Swedish nuclear facilities are getting older. The results from this research project together with the next phase are therefore valuable when it comes to ageing manage-ment and radiation safety assessments of degraded concrete structures in nuclear facilities.
Need for further researchFurther research is performed in ASCET phase 3 where numerical simu-lations will be performed with access to previous experimental results. The aim of ASCET is to provide comprehensive recommendations for numerical simulations of concrete degradation mechanisms.
1 Working Group on Integrity and Ageing of Components and Structures2 Organization for Economic Co-operation and Development3 Nuclear Energy Agency4 Alkali-silica reactions

SSM 2018:17
Project informationContact person SSM: Sofia LillhökReference: SSM 2015-1013 / 7030051-00

2018:17
Author:
Date: Juni 2018Report number: 2018:17 ISSN: 2000-0456Available at www.stralsakerhetsmyndigheten.se
Björn ThunellScanscot Technology AB, Lund
Assessment of structures subject to concrete pathologies (ASCET), phase 2

SSM 2018:17
This report concerns a study which has been conducted for the Swedish Radiation Safety Authority, SSM. The conclusions and view-points presented in the report are those of the author/authors and do not necessarily coincide with those of the SSM.

Executive summary This report summarizes the work carried out by the independent consultancy
company Scanscot Technology within the framework of Phase 2 of the
OECD/NEA/CSNI CAPS called ASCET.
The ASCET (Assessment of Nuclear Structures Subject to Concrete
Pathologies) initiative aims to create a basis for general recommendations
regarding management of ageing related issues in nuclear facilities exposed
to concrete pathologies (material degradation mechanisms). This subject is
of great interest for the nuclear industry internationally, as concrete
degradation mechanisms (e.g. alkali-aggregate reaction, delayed ettringite
formation, irradiated concrete, sulfate attack, rebar steel corrosion, freezing
and thawing cycles) have been detected in nuclear facilities in several OECD
member states [1], and might very likely affect structural performance and
residual lifetime in the future. The content of the ASCET Phase 2 benchmark
is a blind numerical simulation benchmark of a shear wall structure affected
by alkali-silica reactions (ASR), tested under cyclic loading, up to structural
failure [2]. Several specimens with different levels of advanced ASR, as well
as reference specimens with sound aggregate, were experimentally tested to
compare the ultimate capacity, displacements and failure modes.
The final purpose of the work documented in this report aim at ensuring safe
Long Term Operation of Nuclear Power Plants. The focus area is primarily
safety-related issues regarding nuclear reactor containments, and the work is
based on national research needs in Sweden [3]. The main incentive to
involve in projects like this is in the end for the purpose of structural
assessments. The objective being to maintain stipulated safety criteria, taking
eventual ageing effects, and actual conditions into account. In practice, this
transfers to a need to evaluate the structural capacity compared to safety
criteria for accidental design, and beyond design, loading conditions. The
question of how margins change when ageing effects are considered, or if
some sort of anomaly or defect is found, is therefore pursued.
The general-purpose finite element program ABAQUS [4] was used for the
numerical simulations summarized in this report. Simulation results were
compared against available experimental results from shear wall specimens
loaded primarily in shear. In summary, numerical results from the blind
phase of the benchmark revealed that:
1. The concrete damaged plasticity material model in ABAQUS
proved reasonably appropriate for numerical simulation of the
studied squat reinforced concrete wall loaded in shear, for
monotonic loads, as experimentally determined shear capacity
compare well to simulation results.
2. Numerical simulation results confirm the experimental observation
that the ASR affected specimen, although having nominally weaker
material properties, may possess a higher ultimate shear capacity
than a regular structure, due to confining effects resulting from the
concrete material expansion.
3. For the studied reinforced concrete wall, it is concluded that shear
friction code equation capacity, calculated per section 6.2.5 in EC2,

ii
exceeds the experimentally derived shear capacity of the studied
wall.

iii
Sammanfattning Allt fler kärnkraftverk runt om i världen närmar sig just nu skedet
långtidsdrift av sin operativa fas. Som ett resultat har hantering av
åldersrelaterade fenomen blivit en viktig fråga i kärnkraftsindustrin.
Programmet ASCET (Assessment of Nuclear Structures Subject to Concrete
Pathologies) initierades av WGIAGE OECD/NEA/CSNI under 2013 och är
ett internationellt forskningsprogram inriktat på nedbrytningsmekanismer av
kompositen armerad betong i kärntekniska anläggningar. Programmet syftar
till att skapa en grund för allmänna råd för hantering av åldrandefrågor för
betongkonstruktioner i kärntekniska anläggningar som utsätts för
nedbrytningsmekanismer av materialet. Forskningsprogrammet fokuserar
speciellt på frågeställningar kring alkali-silika reaktioner (ASR). Målet är att
på sikt kunna ge rekommendationer för degraderingarnas
kapacitetsförändring av materialet. Den typ av utredningar som krävs för att
förstå och utvärdera betongens förhållanden bestäms av varje medlemsland
baserad på forskningsbehov och identifierad känslighet för skador.
Denna rapport sammanfattar det oberoende konsultföretaget Scanscots
bidrag till ASCET-programmets fas 2, vilken utgörs av ett internationellt
benchmarkprojekt som innefattar numeriska simuleringar av en
skjuvväggskonstruktion belastad med cyklisk last.
Det officiella syftet med programmet är att studera degraderade (ASR/AAR)
betongkonstruktioners beteende under starkt olinjär och cyklisk last
(jordbävning). Detta område bedöms mindre intressant för svenska
förhållanden, eftersom svenska kärnkraftverk inte rapporterats skadade av
ASR [5]. Vinklingen undersöks, men tonvikten inom projektet ligger på att
undersöka förmåga att simulera oskadade (normala) betongkonstruktioner
som utsätts för cyklisk skjuvande belastning och svarar med olinjär respons i
materialet. Detta för att kunna tillgodose de behov svensk myndighet och
anläggningsägare kan komma att ha.
Sammanfattningsvis visade numeriska resultat att:
1. Använd materialmodell (Concrete Damage Plasticity) i programmet
ABAQUS visade sig vara relativt väl lämpad för simulering av de
studerade skjuvbelastade betongväggarna, för monotoniska
belastningar.
2. Numeriska simuleringsresultat bekräftar experimentella
observationer som visar att struktur påverkad av ASR kan, trots
nominellt svagare materialegenskaper, kan ha en högre skjuvkrafts-
överförande kapacitet än en normal struktur. Detta tillskrivs de
omslutningseffekter på grund av materialets expansion som uppstår
då expansionen förhindras (här genom armeringen).
3. För den studerade betongväggen överskattas skjuvkapaciteten,
beräknad enligt avsnitt 6.2.5 i Eurocode 2, jämfört med resultat från
experimentella tester.

iv

v
Content 1. INTRODUCTION .................................................................................. 1
1.1. BACKGROUND OF THE ASCET CAPS ............................................................ 1
1.2. AIM AND SCOPE OF ASCET PHASE 2 ............................................................ 2
1.3. AIM AND SCOPE OF THIS REPORT ................................................................. 3
1.4. NUMERICAL MODELLING OF SQUAT CONCRETE WALLS ..................................... 3
1.5. AAR FROM A SWEDISH NUCLEAR SAFETY PERSPECTIVE .................................... 4
2. LABORATORY SHEAR WALL EXPERIMENTS ........................................... 5
2.1. INTRODUCTION ......................................................................................... 5
2.2. SHEAR WALL SPECIMENS............................................................................. 5
2.3. CONCRETE MATERIAL PROPERTIES ................................................................ 7
2.4. REINFORCEMENT STEEL PROPERTIES ........................................................... 10
2.5. EXPERIMENTAL SHEAR WALL TEST SETUP ..................................................... 12
2.6. EXPERIMENTAL RESULTS ........................................................................... 13
2.7. ASPECTS OF THE EXPERIMENTAL TESTS COMPARED TO ACTUAL STRUCTURES ...... 18
3. NUMERICAL MODEL ...........................................................................21
3.1. GENERAL ............................................................................................... 21
3.2. INTRODUCTION, CONTEXT AND PREVIOUS WORK .......................................... 21
3.3. USED NUMERICAL SIMULATION SOFTWARE .................................................. 22
3.4. CONSTITUTIVE CONCRETE MODEL .............................................................. 22
3.5. USED MATERIAL MODEL INPUT .................................................................. 30
3.6. BASE NUMERICAL MODEL OVERVIEW .......................................................... 34
3.7. MODEL OF STEEL REINFORCEMENT BARS ..................................................... 35
3.8. BOUNDARY CONDITIONS .......................................................................... 36
3.9. EXTERNAL LOADS APPLIED ......................................................................... 37
3.10. SIMULATION TYPES AND PROCEDURES ...................................................... 38
3.11. MODELLING OF ASR EFFECTS .................................................................. 38
4. RESULTS AND COMPARISONS ............................................................41
4.1. COMPARISONS FOR REGULAR CONCRETE SPECIMEN REG A ............................ 43
4.2. BLIND PREDICTIONS FOR REGULAR CONCRETE SPECIMEN REG B ...................... 50
4.3. COMPARISONS FOR SPECIMEN ASR A1 ....................................................... 52
4.4. BLIND PREDICTIONS FOR SPECIMEN ASR B2 ................................................ 59
4.5. SENSITIVITY ANALYSES .............................................................................. 60
4.6. COMPARISONS TO CONVENTIONAL DESIGN .................................................. 77
5. DISCUSSIONS .....................................................................................83
5.1. OVERVIEW COMPARISONS BETWEEN EXPERIMENTAL AND NUMERICAL RESULTS . 83
5.2. RELEVANCE FOR ASSESSMENTS OF AN ACTUAL NPP STRUCTURE ...................... 84
5.3. COMPARISONS TO DESIGN CODE SHEAR CAPACITY ......................................... 84
5.4. COMPARISONS BETWEEN REGULAR AND ASR AFFECTED STRUCTURE ................ 84

vi
5.5. NUMERICAL SHEAR WALL RESULT VARIABILITY .............................................. 85
5.6. EXPERIMENTAL RESULT VARIABILITY ............................................................ 85
5.7. WALL ULTIMATE DUCTILITY CAPACITY ......................................................... 85
5.8. BOUNDARY CONDITIONS .......................................................................... 85
5.9. SENSITIVITY ANALYSIS .............................................................................. 85
5.10. CDP MATERIAL MODEL USED .................................................................. 86
5.11. REQUIREMENTS ON MATERIAL MODEL INPUT DATA ..................................... 86
5.12. REINFORCEMENT STEEL MODELLING ......................................................... 86
6. CONCLUSIONS ...................................................................................87 7. ACKNOWLEDGEMENT ........................................................................91 8. REFERENCES ......................................................................................93

vii
Nomenclature
𝑑𝑡 concrete tension damage [-]
E modulus of elasticity [MPa]
𝐸0 initial modulus of elasticity used in ABAQUS [MPa]
𝑓𝑐 compressive cylinder strength of concrete [MPa]
𝑓𝑐𝑘 characteristic compressive cylinder strength of concrete [MPa]
𝑓𝑐𝑚 mean value of concrete cylinder compressive strength [MPa]
𝑓𝑐,𝑐𝑢𝑏𝑒 compressive cube strength of concrete [MPa]
𝑓𝑐𝑘,𝑐𝑢𝑏𝑒 characteristic compressive cube strength of concrete [MPa]
𝑓𝑐𝑚,𝑐𝑢𝑏𝑒 mean value of concrete cube compressive strength [MPa]
𝑓𝑐𝑡 tensile strength of concrete [MPa]
𝑓𝑐𝑡𝑘 characteristic tensile strength of concrete [MPa]
𝑓𝑐𝑡𝑚 mean value of tensile strength of concrete [MPa]
𝐺𝐹 fracture energy [N/m]
𝑢𝑡𝑐𝑘 cracking displacement [m]
𝑢𝑡0𝑐𝑘 cracking displacement at which complete loss of strength takes place [m]
𝜖 flow potential eccentricity used in ABAQUS
𝜀𝑐 total strain [-]
𝜀0𝑐𝑒𝑙 elastic strain corresponding to undamaged material [-]
𝜀𝑐𝑖𝑛 inelastic strain [-]
𝜀𝑚𝑎𝑥 maximum strain [-]
viscosity parameter or coefficient of friction [-]
Poisson’s ratio [-]
dilation angle [deg]
density [kg/m3]
𝜎𝑐𝑢 ultimate compressive stress used in ABAQUS [MPa]
𝜎𝑐0 uniaxial initial compressive yield stress used in ABAQUS [MPa]

viii
𝜎𝑏0 initial equibiaxial compressive yield stress used in ABAQUS [MPa]
𝜎𝑡0 failure stress in tension used in ABAQUS [MPa]

ix
List of acronyms AAR Alkali Aggregate Reaction
ASCET Assessment of Nuclear Structures Subject to Concrete Pathologies
ASR Alkali Silica Reaction
CAPS CSNI Activity Proposal Sheet (OECD)
CDP Concrete Damaged Plasticity (ABAQUS)
CEA Alternative Energies and Atomic Energy Commission (France)
CNSC Canadian Nuclear Safety Commission
CRP Co-ordinated Research Programme/Projects
CSNI Committee on the Safety of Nuclear Installations (OECD)
DEF Delayed Ettringite Formation
EDF Electricity of France
IAEA International Atomic Energy Agency
IRSN Radioprotection and Nuclear Safety Institute (France)
LTO Long Term Operation
NEA Nuclear Energy Agency (OECD)
NPP Nuclear Power Plant
OECD Organization for Economic Co-operation and Development
ORNL Oak Ridge National Lab (USA)
RC Reinforced Concrete
SSC Systems, Structures and Components
SSM Swedish Radiation Safety Authority (Sweden)
STUK Radiation and Nuclear Safety Authority (Finland)
VTT Technical Research Centre of Finland
WGIAGE Working Group on Integrity and Ageing of Components and Structures

x
1
1. Introduction
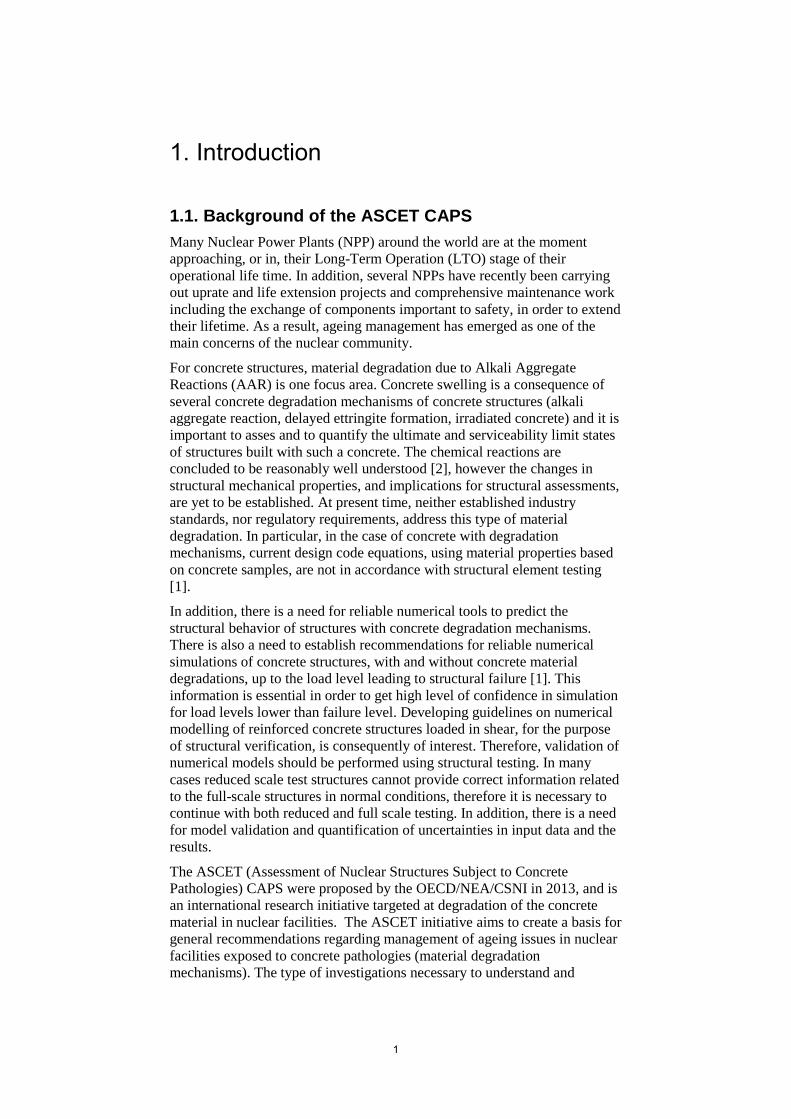
1.1. Background of the ASCET CAPS
Many Nuclear Power Plants (NPP) around the world are at the moment
approaching, or in, their Long-Term Operation (LTO) stage of their
operational life time. In addition, several NPPs have recently been carrying
out uprate and life extension projects and comprehensive maintenance work
including the exchange of components important to safety, in order to extend
their lifetime. As a result, ageing management has emerged as one of the
main concerns of the nuclear community.
For concrete structures, material degradation due to Alkali Aggregate
Reactions (AAR) is one focus area. Concrete swelling is a consequence of
several concrete degradation mechanisms of concrete structures (alkali
aggregate reaction, delayed ettringite formation, irradiated concrete) and it is
important to asses and to quantify the ultimate and serviceability limit states
of structures built with such a concrete. The chemical reactions are
concluded to be reasonably well understood [2], however the changes in
structural mechanical properties, and implications for structural assessments,
are yet to be established. At present time, neither established industry
standards, nor regulatory requirements, address this type of material
degradation. In particular, in the case of concrete with degradation
mechanisms, current design code equations, using material properties based
on concrete samples, are not in accordance with structural element testing
[1].
In addition, there is a need for reliable numerical tools to predict the
structural behavior of structures with concrete degradation mechanisms.
There is also a need to establish recommendations for reliable numerical
simulations of concrete structures, with and without concrete material
degradations, up to the load level leading to structural failure [1]. This
information is essential in order to get high level of confidence in simulation
for load levels lower than failure level. Developing guidelines on numerical
modelling of reinforced concrete structures loaded in shear, for the purpose
of structural verification, is consequently of interest. Therefore, validation of
numerical models should be performed using structural testing. In many
cases reduced scale test structures cannot provide correct information related
to the full-scale structures in normal conditions, therefore it is necessary to
continue with both reduced and full scale testing. In addition, there is a need
for model validation and quantification of uncertainties in input data and the
results.
The ASCET (Assessment of Nuclear Structures Subject to Concrete
Pathologies) CAPS were proposed by the OECD/NEA/CSNI in 2013, and is
an international research initiative targeted at degradation of the concrete
material in nuclear facilities. The ASCET initiative aims to create a basis for
general recommendations regarding management of ageing issues in nuclear
facilities exposed to concrete pathologies (material degradation
mechanisms). The type of investigations necessary to understand and
2
evaluate relevant concrete degradations are determined by each member
country, based on research needs and damage sensitivity. To survey member
status and needs in the area of concrete pathologies, an initial phase of the
ASCET initiative were dedicated to summarize current situation [1]. The
safety significance of the CAPS is described as: “Determination of the
impact of concrete degradation on serviceability and ultimate limit state of
nuclear facilities taking into account long term operation, especially
containment structures and interim storage buildings.” The ASCET lead and
coordination organizations are the Canadian Nuclear Safety Commission
(CNSC) and the United States Nuclear Regulatory Commission (US NRC).
The CSNI technical goals covered are; to promote the safe operation of
current nuclear installations; to understand and quantify the mechanisms of
ageing of components and structures; to assess and predict their impact on
the safety of nuclear installations and; to identify the corresponding means of
detection and control.
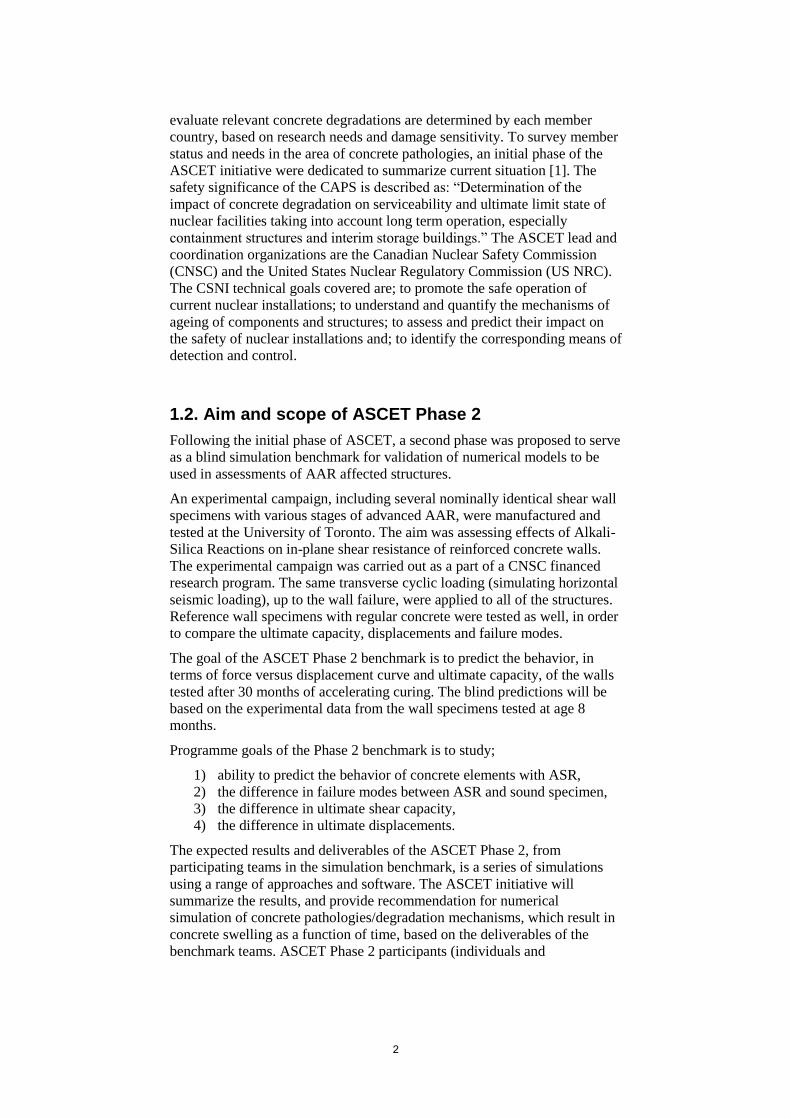
1.2. Aim and scope of ASCET Phase 2
Following the initial phase of ASCET, a second phase was proposed to serve
as a blind simulation benchmark for validation of numerical models to be
used in assessments of AAR affected structures.
An experimental campaign, including several nominally identical shear wall
specimens with various stages of advanced AAR, were manufactured and
tested at the University of Toronto. The aim was assessing effects of Alkali-
Silica Reactions on in-plane shear resistance of reinforced concrete walls.
The experimental campaign was carried out as a part of a CNSC financed
research program. The same transverse cyclic loading (simulating horizontal
seismic loading), up to the wall failure, were applied to all of the structures.
Reference wall specimens with regular concrete were tested as well, in order
to compare the ultimate capacity, displacements and failure modes.
The goal of the ASCET Phase 2 benchmark is to predict the behavior, in
terms of force versus displacement curve and ultimate capacity, of the walls
tested after 30 months of accelerating curing. The blind predictions will be
based on the experimental data from the wall specimens tested at age 8
months.
Programme goals of the Phase 2 benchmark is to study;
1) ability to predict the behavior of concrete elements with ASR,
2) the difference in failure modes between ASR and sound specimen,
3) the difference in ultimate shear capacity,
4) the difference in ultimate displacements.
The expected results and deliverables of the ASCET Phase 2, from
participating teams in the simulation benchmark, is a series of simulations
using a range of approaches and software. The ASCET initiative will
summarize the results, and provide recommendation for numerical
simulation of concrete pathologies/degradation mechanisms, which result in
concrete swelling as a function of time, based on the deliverables of the
benchmark teams. ASCET Phase 2 participants (individuals and

3
organizations) include IAGE member/organizations including CNSC, US
NRC, IRSN, EDF, CEA, STUK, VTT, ORNL, and Scanscot Technology.
1.3. Aim and scope of this report
The primary aim of the work summarized in this report is to, from a Swedish
nuclear industry need perspective, study the behavior of a reinforced
concrete squat wall affected by shear load. The term squat is here used as the
studied walls has low height to width ratio. A secondary aim is to do this for
concrete having degraded mechanical material properties, which here means
ASR reactive concrete. The motivation for decreased interest of the official
ASCET aim, given in section 1.2, is given in section 1.5. A third aim of this
work is to increase the understanding of how structural assessment of the
ultimate capacity of squat reinforced concrete walls can be performed, using
the chosen example structure. Issues of particular interest are major
contributing circumstances to the structural capacity. An additional outcome
of this work is comparisons of experimental results to selected relevant
design codes.
Main activities within the participation of the ASCET Phase 2 benchmark
have included;
1. Material issues concerning degraded concrete, including
relationships of structural capacity compared to regular concrete.
2. Structural issues including evaluation of structural performance
compared to regular concrete.
3. Summarize the experimental data given to the benchmark
participants, and estimate of actual conditions at the experimental
tests.
4. Numerical simulations of the experiments carried out.
The main purpose of the simulations performed is to study how well the used
numerical method may simulate and predict the example shear wall problem
chosen for the University of Toronto experiments. Comparisons and
sensitivity studies related to existing design codes, for regular concrete, are
also considered important.
The scope of the numerical simulations in this report are limited to macro
scale finite element analyses. The term macro scale is used here to describe
that concrete material properties are set as static input, and not derived in the
simulations through an evolution of chemical changes over time, due to the
environmental conditions. The reason for this approach is due to the fact that
treating material properties as more or less predefined values is the standard
procedure used by engineers in a design or requalification process. The
numerical tool used within this work is the explicit ABAQUS solver [4].
1.4. Numerical modelling of squat concrete walls
For safety related concrete structures, ultimate capacity predictions of shear
loaded walls may be of interest in assessments of severe earthquakes with
low probability of occurrence. The structural response of squat reinforced
concrete walls is complex, and numerical modelling of such structures
4
subjected to primary shear loading is still an open research area.
Experimental research in this area have been active for several decades,
often in combination with cyclic (seismic) loading. Numerical simulations of
nonlinear responses of shear wall structures are still partly without
established consensus, mainly due to a combination of very little structural
ductility, in combination with nonlinear concrete material modeling
challenges, and important and complex interactions between the concrete
and the reinforcement.
A large part of this report is dedicated to sensitivity studies, and comparisons
between numerical simulations and experimental data, with the final purpose
to aid in developing guidelines for use of the numerical engineering tools in
structural assessments.
1.5. AAR from a Swedish nuclear safety perspective
The effects of AAR on the concrete material, as well as structural capacity
effects, are currently active research areas, and have been so for many years
for large scale structures as roads, bridges and dams. Very few documented
applications on safety significant nuclear type of structures [6], experimental
structures [7], numerical studies [8], and summary reports [9] on the effects
from this material degradation are however publicly available. The focus
area of the work presented within this report is ultimate structural capacity,
however in real structures effects on durability may be very important.
For Swedish conditions, compiled operational experiences [5] for nuclear
reactor containments include only one instance of confirmed ASR, which
was found at the decommissioned Barsebäck NPP. As a consequence, with
current knowledge, AAR related problems are likely of no practical concern
for nuclear reactor containments in Sweden. However, LTO programs
aiming at concrete material assessments are currently being implemented,
and historically reported instances of degraded concrete material to the
regulator are few. In addition, concrete material property changes over time
are natural processes, and degradation processes may exist or develop. The
studies carried out on degradations of the concrete material, and the
reinforced concrete composite, within the ASCET program are therefore
interesting from a Swedish nuclear industry safety perspective. A continued
observation of international activity and development within this field is
therefore relevant for nuclear safety.

5
2. Laboratory shear wall experiments
2.1. Introduction
In this chapter information given to the ASCET Phase 2 benchmark
participants concerning the experimental tests, carried out at the University
of Toronto, are compiled. The official ASCET documents describing the
tests were originally limited to [10], [11], and [12]. In addition,
complementary information, from other referenced sources, and SMiRT-23
Transactions [2], [13], [14] and [15], are also included.
The laboratory test program conducted at the University of Toronto, aiming
at assessing ASR effects on in-plane shear resistance of squat reinforced
concrete (RC) walls, were financed by the Canadian Nuclear Safety
Commission (CNSC), according to [7]. The test program included three
main components; The material aspect of ASR, the structural aspect, and
non-destructive testing possibilities. Squat RC shear walls are a typical
structural element in nuclear facilities. Focus areas for the test program
included destructive and non-destructive testing. The wall design, with
barbells as boundary elements, were chosen based on previously performed
tests in order to obtain a known failure mechanism. The walls are designed
using code equations for shear-friction to obtain the failure through the wall,
and to avoid failure on the wall and beam interface. The aim of the
destructive testing was to determine mechanical characteristics such as;
1) ultimate resistance,
2) ultimate displacement,
3) ductility,
4) residual strength of walls with AAR (compared to sound walls), and
5) to correlate the level of damage in terms of crack spacing and crack
width with the structural drift.
2.2. Shear wall specimens
Within the test program conducted at the University of Toronto, six
nominally identical concrete walls were constructed [2]. The wall was
designed using the French BAEL design code, and the experimental test
specimens used are in reduced geometric scale. Two walls were originally to
be tested at each of the three different points in time selected. Three of the
walls were made from normal concrete, in order to be reference walls, and
three were designed to study the effects of ASR, to be tested at three
different reaction stages, see Table 2-1. The information in the table is
compiled from the available sources of information, and may be different
from the actual chain of events. For 5 specimens only have test time
specifications been found.
The initial tests, named A-tests, were carried out after approximately 8
months after casting. The last two tests, named B-tests, were performed at

6
the expected time of the ASR reaction to be exhausted, after approximately
31 months of accelerated ageing. The damaged walls with exhausted
reaction were then planned to be retrofitted using carbon fibers, and tested
again using destructive and non-destructive examinations to assess the
effectiveness of the retrofit measures. Retrofit measures are outside the
scope of the ASCET Phase 2 benchmark.
Table 2-1 Test series and age of 5 of the 6 test specimens according
to [2], and informal information. Testing times mentioned
in [2] seem to have been revised.
Test Description Time (after casting) tested
A REG A; Control specimen 240 days (in 2014)
ASR A1; ASR reactive concrete specimen (Initial damage)
260 days (in 2014)
B ASR B1; ASR reactive concrete specimen (Moderate damage)
615 days (in 2016)
ASR B2; ASR reactive concrete specimen (Severe damage, exhausted reaction)
985 days (in 2017)
REG B; Control specimen 985 days (in 2017)
Test specimens consist of the central wall of primary interest, stabilizing end
columns, and bottom and top massive beams for anchoring of floor support
and jack equipment. The central wall is 100 mm thick. Geometric
dimensions of the test specimen are visualized in Figure 2-1. Construction
sequence, if any, and division into casting parts, is unknown.
Figure 2-1 Shear wall test specimen geometry [10].

7
2.3. Concrete material properties
According to [10] and [7], small size concrete test specimens cast at the
same time as the larger test wall specimens included; concrete cylinders
(42), bending prisms (6), dog bone specimens (12), and expansion prisms
(6). Mechanical properties of the concrete are shown in Table 2-2. The
regular concrete material is concluded to, in all measured aspects (stiffness,
and compressive and tensile strength), have superior mechanical properties
to the ASR reactive concrete in these material tests. Figure 2-2 show
concrete properties evolution of time.
Mix design for concrete walls are described in [12]. Concrete mix design
was required to be based at ASTM C1293, with maximum aggregate size 19
mm. However, no actual aggregate curves are available from the concrete
supplier [12]. Cement content for all concretes were 420 kg/m3, with a w/c
ratio of 0.44 and 0.46 for the ASR and regular concrete.
In using the material properties of the ASR concrete from the small test
specimens listed here for the purpose of numerical simulations, it must be
remembered that properties of the concrete are affected by the level of
confinement, which is not included in Table 2-2Table nor Figure 2-2.
Table 2-2 Measured mechanical properties of small size concrete
specimens [11], casted simultaneously as the REG A and
ASR A1 shear wall specimens1).
Specimen / Type of test
Type of test specimen REG A ASR A1
Age (Days)
- 240 260
Compressive strength (MPa)
100 x 200 mm cylinder 79.0 63.7
Tensile strength (MPa)
Dog bone 4.76 3.24
Fracture energy (N/m)
Dog bone 179.3 120.2
Modulus of rupture (MPa)
150 x 150 x 520 mm According to ASTM-C78
7.26 4.64
Modulus of elasticity (GPa)
100 x 200 mm cylinder 47.15 35.75
Expansion (Length change in %)
75 x 75 x 285 mm According to ASTM-C1260
0.0332 0.185
1) Information obtained after the final benchmark workshop via [16] include the
measured compressive strength for the REG B specimen (80.1 MPa), the ASR B1
specimen (67.1 MPa), and the ASR B2 specimen (63.0 MPa).

8
Figure 2-2 Concrete properties evolution over time [17].
2.3.1. Environmental curing conditions Up to 28 days after casting the walls were assumed to be exposed to
temperature 20 °C and relative humidity 100 % [17]. After that ASR walls
were subjected to accelerated conditions in a specially built environmental
chamber with temperature 50 °C and 95 % - 100 % relative humidity, see
Figure 2-3. Figure 2-4 and Table 2-3 show delivered data of measured free
swelling for small, unconfined, concrete samples. Table 2-1 list testing
times, after casting, for the different specimens.

9
Figure 2-3 ASR test specimens in the acceleration chamber with
increased temperature and humidity [16].
Table 2-3 Measured free swelling of small concrete samples [10].
Days Free swelling of reactive (ASR) concrete (%)
Free swelling of regular (control) concrete (%)
0 0 0
7 0.0099 0.0181
28 0.0332 0.0249
90 0.1115 0.0264
150 0.1399 0.0309
180 0.1519 0.0329
250 (Day of testing for REG A and ASR A1)
0.1850 0.0332
610 (Day of testing for ASR B1 specimen)
0.2151) N/A
995 (Day of testing for REG B and ASR B2)
0.2231) 0.03311)
1) Information obtained after final benchmark workshop [16].

10
Figure 2-4 Measured free swelling of small concrete samples [17].
Reactive in the figure legend refer to ASR samples, and
control to regular concrete samples.
2.4. Reinforcement steel properties
Steel reinforcement in the shear wall test specimen central wall include one,
centered, layer of M10 grid reinforcement [10], spaced at 140 mm both
vertically and horizontally. No type of additional shear reinforcement is
present in the structure. Table 2-4 list nominal Canadian standard
reinforcement bar cross section properties, and Table 2-5 list measured
reinforcement steel mechanical properties.
The massive top and bottom beam elements were designed with high
reinforcement ratios to ensure primarily elastic behavior in these regions.
Figure 2-5 show the derived steel reinforcement work curve for 10M bars.
Specimen steel reinforcement layout, and reinforcement ratios, are shown in
Figure 2-6.
Table 2-4 Nominal Canadian standard reinforcement bar cross
section properties.
Rebar type 10M 20M
Area (mm2) 100 300
Diameter (mm) 11.3 19.5

11
Table 2-5 Measured reinforcement steel mechanical properties [10].
Rebar type 10M 20M
Yield strength (MPa) 430 465
Ultimate strength (MPa) 638 550
Strain hardening (%) 0.8 1.5
Ultimate strain (%) 15 20
Elastic modulus (GPa) 182 190
Figure 2-5 Steel reinforcement stress-strain relationship for 10M bars
[17].
Figure 2-6 Steel reinforcement layout [10].

12
2.5. Experimental shear wall test setup
The experimental program was initiated to investigate the structural effects
of ASR [7]. The test experimental setup information is visualized in Figure
2-7, showing horizontal and vertical hydraulic jacks used for the tests. The
two horizontal actuators had a nominal capacity of 1000 kN each, as a shear
capacity of 1200 kN were predicted prior to testing. A constant vertical force
of 800 kN were aimed at during testing, using a hydraulic jack. The bottom
beams of the test specimens were fixed by two large bolts to the “strong
floor”, and in addition restrained on both ends to prevent slippage.
Displacement measurements during the testing were limited to horizontal
displacements at 7 positions, see Figure 2-8.
The intended lateral loading scheme, used for all the tests, is expressed in
displacements, rather than force, and visualized in Figure 2-9. According to
[7], the loading rate applied were initially 0.005 mm/second, and at some
point increased to 0.15 mm/second. The intended loading scheme, according
to [17] were; +/- 0.4, +/- 0.8, +/- 1.0, +/-1.4, +/- 1.8, +/- 2.0, +/- 2.5, etc., in
steps of 0.5 mm increase until structural failure. The loading schemes
described in the two references above are however not entirely identical. The
failure point was defined as failure to maintain 40 % of the vertical load
applied.
Additional information concerning the test setup, actual loading scheme,
eventual rotations of top beam during tests, etc., are not available at present
time.
Figure 2-7 Overview visualization of the experimental shear wall test
setup [17].

13
Figure 2-8 Experimental lateral displacement measurements [16].
Figure 2-9 Experimental lateral loading scheme, according to [7].
2.6. Experimental results
The ASCET Phase 2 consist of blind numerical simulations of the
experimental B-tests, in the form of a benchmark. The initial intentions were
that benchmark participants should get access to the results from the
experimental A-tests, in order to make informed decisions for the required
numerical model input. However, in the end only a very limited amount of
experimental results was released prior to the final workshop. The full set of
results released to benchmark participants at this stage are presented in the
two sub sections 2.6.1 and 2.6.2.
Crack patterns and progress during the tests were not documented, and is
consequently not available for comparisons between experimental and
numerical results. The second item of the ASCET Phase 2 goals, difference
in failure modes as listed in section 1.2, is therefore not possible to, in detail,
compare between experimental and numerical results.
From the test data presented below, and the tested mechanical material
properties shown in section 2.3, it can be concluded that even though the
material properties of the ASR reactive concrete seem negatively affected by

14
the reactions, the ASR A1 wall test specimen showed a higher structural
capacity (approximately 15 %) than the control specimen with regular
concrete, REG A. This observation is discussed later in this report.
In addition, the initial whole structure elastic stiffness of the ASR reactive
concrete specimen, were also higher than the specimen with regular
concrete. This is contradictory to the material properties specified shown in
Table 2-2. The reason for this is without explanation at present time.
2.6.1. REG A specimen – Regular concrete after 240 days The control specimen REG A (regular concrete) were tested 240 days after
casting [10]. The lateral force as function of displacement during testing of
wall specimen REG A is shown in Figure 2-10. Visual observations from the
figure include a strong non-symmetrical behavior of the REG A specimen
Figure 2-10. The reason for this behavior is however not known at present
time. That this single test is truly representative of an ensemble of similar
shear walls must be regarded as highly questionable, until further
information is available.
A picture of wall specimen REG A at post failure, partly showing crack
patterns, is shown in Figure 2-11. This information origin from [7], and is
not part of the officially released ASCET Phase 2 experimental data.
Figure 2-10 Lateral force as function of displacement during testing of
wall specimen REG A (control specimen with normal
concrete) [10].

15
Figure 2-11 Picture of wall specimen REG A (control specimen with
normal concrete) at failure [7].
2.6.2. ASR A1 specimen – ASR reactive concrete after 260 days The concrete specimen ASR A1 were tested 260 days after casting [10]. The
lateral force as function of displacement during testing of wall specimen
ASR A1 is shown in Figure 2-12.
A picture of wall specimen ASR A1 at failure, partly showing crack patterns
in the wall, is shown in Figure 2-13. This information origin from [7], and is
not part of the officially released ASCET Phase 2 experimental data.

16
Figure 2-12 Lateral force as function of displacement during testing of
wall specimen ASR A1 (specimen with ASR reactive
concrete) [10].
Figure 2-13 Picture of wall specimen ASR A1 (specimen with ASR
reactive concrete) at failure [7].

17
2.6.3. Additional information Additional information released after the ASCET Phase 2 final benchmark
workshop is here included in Table 2 6. It is noted that the final failure
modes defined in [16] for regular concrete specimens are not visually
confirmed in (for instance) Figure 2-11, and this require further
investigation. It was also observed that the failures in the ASR specimen
seemed more sudden than that of the regular concrete walls.
It was concluded in [16] that the ultimate shear capacity did not vary much
between the walls.
Table 2-6 Experimental results released after the benchmark final
workshop [16]. It is noted that the final failure modes
defined in [16] are not visually confirmed in (for instance)
Figure 2-11, and this require further investigation.
Test specimen
Peak force (kN)
Max. displ. (mm)
Final failure mode
REG A 1180 8.2 Sliding between wall panel and bottom beam
REG B 1187 7.3 Sliding between wall panel and bottom beam
ASR A1 1355 7.1 Diagonal
ASR B1 1240 4.9 Diagonal
ASR B2 1243 2.6 Diagonal
2.6.4. Experimental result discussion To clarify differences in the experimental data between the different
concrete configurations, in Figure 2-14 a comparison of enveloped
experimental results for lateral load versus displacement relationship of both
the Regular A and ASR A1 shear wall specimen are made. The experimental
data in the figure is envelope force-displacement relations graphically
interpreted from [7].
According to [18], it is common for ASR-affected reinforced concrete
structures to have un-affected load bearing capacity, despite large
expansions, extensive cracking, and decreased stiffness and strength. The
effect is accredited the confinement effect of the structure as the concrete
material expands, and the steel reinforcement act as a post tensioning
system. However, the fact that the ASR affected wall in these particular
experiments otherwise nominally identical to the wall with regular concrete,
had stiffer structural behavior for the initial primarily elastic responses,
despite the lower elastic material stiffness as shown in Table 2-2, raise the
question of statistically determined results; Would this relation persist in
case an ensemble of specimens of each type had been tested? Variations in
de facto construction, as a result of workmanship and methods used, type of
aggregates, material variability, and actual experimental conditions, are
outside the scope of this experiment, as only one specimen of each kind

18
(regular concrete, ASR concrete, and three different points in time) were
fabricated and tested. Such variations may however be important and are not
captured in idealized numerical models created using nominal data. Testing
of concrete specimens, particularly when loaded in shear, may result in a
large result scatter, and statistical experimental aspects should not be
neglected. In addition, the unexpected strong non-symmetrical behavior of
the REG A specimen shown in Figure 2-10 may indicate experimental
problems. This may possibly be the result of some form of boundary
condition problem, or data acquisition, issue. No additional information
concerning this is however available at present time, and further
investigation of this is therefore not possible.
Figure 2-14 Comparison of experimental results for lateral load versus
displacement relationship of Regular A and ASR A1 shear
wall specimen. Envelope data from [7].
2.7. Aspects of the experimental tests compared to actual structures
The aim of the experimental campaign is, in the end, to study the structural
effect of ASR with respect to actual structures in the nuclear industry. In this
perspective, it should be mentioned that the studied scale models, 100 mm
thick shear walls, used in the experiments include only a single layer of
orthogonal web reinforcement, located at the wall center surface. No shear
reinforcement, stirrups, are included in the test specimen structure due to this
thin (scaled) wall thickness. For the ASR affected concrete walls in the
experiments this may mean no, or very little, confining pressure in the wall
thickness direction. This may differ from conventional concrete shear wall
design in nuclear power plants.
It should also be noted that the laboratory experiments conducted do not
include any environment or combined effects related to durability issues, as
for example ASR in combination with repeated cycles of freeze-thaw. The
experimental results may consequently be valid as indicators on the
structural capacity due to material degradation due to ASR only, which is
indeed already complex. However, this note is included to draw attention to
the fact that concrete structures residing outside (PWR containments) may

19
experience important combined effects, and conclusions based on the
experimental results, directly applied and valid to actual structures, may not
be possible.

20

21
3. Numerical model
3.1. General
This chapter describe the numerical models used in the simulations of the
reinforced concrete shear wall experiments presented in the previous
chapter. The intentions are to present reasonable transparent modelling
assumptions.
Numerical simulations within this work are performed using the Finite
Element (FE) solver ABAQUS/Explicit, which is a well-known and, for
many types of problems, thoroughly tested general purpose finite element
program [4]. The concrete material model used in the numerical simulations
is called Concrete Damaged Plasticity (CDP). A brief presentation of this
constitutive model is given in section 3.4. Section 3.5 discuss general
implementation of values necessary for defining the CDP material model.
Both concrete (specimen central wall) and reinforcement are modelled using
non-linear behavior.
Unfortunately, too little experimental results from the laboratory tests
described in the previous chapter have been released to, in any way, assure
that the numerical models simulate the actual experimental structures and
setup in a satisfactory way. As a result, the numerical models used in this
work are based on delivered nominal data only. This is an identified
uncertainty which naturally, to an unknown extent, will affect the results and
conclusions.
3.2. Introduction, context and previous work
Non-linear response of reinforced concrete shear walls subjected to cyclic
loads is currently still an open and active research area internationally.
However, despite much effort, no universally applicable constitutive model
has been developed for numerical simulation of reinforced concrete. Instead,
many different material models exist, and an appropriate model are to be
chosen for each type of load scenario.
The type of numerical models normally developed and used for numerical
assessments of laboratory experiment tests, often differ in level of details
compared to the models used in assessments of actual nuclear structures.
Depending on simulation purpose, and for practical reasons, models of
actual nuclear structures often have less structural details included. Figure 3-
1 show two such examples of numerical models of nuclear safety related
concrete structures used in the post Fukushima structural stress test
assessments. The aspect of numerical model refinement levels required to
capture the studied shear failure mechanism, and ultimate load, is therefore
also included as a separate study, presented in section 4.5.7 of this report.

22
Figure 3-1 Visualization examples of numerical models of safety
related concrete structures used in the post Fukushima
structural stress test assessments.
3.3. Used numerical simulation software
The Finite Element software used for the numerical simulations are limited
to the explicit wave front solver ABAQUS/Explicit [4]. The software is
widely used, and well proven and validated, for a wide range of problems in
many different industries.
The explicit solver is here favored, instead of the implicit solver, due to the
large deformations, and non-linear material response. The implicit solver is
concluded to give similar results for low level deformations, up to a certain
limit where numerical convergence difficulties interrupt calculations.
3.4. Constitutive concrete model
Numerical simulations presented in this report has been carried out using the
Concrete Damaged Plasticity (CDP) material model implementation in
ABAQUS. The CDP model provides a general capability for modelling
concrete (quasi-brittle) materials in all types of structure elements, e.g.
beams, trusses, shells, and solids. The material model is described in detail
in the software documentation [4]. The basic properties of the model are
briefly discussed here, for the purpose of the simulations carried out.
The CDP material model is based on work carried out by [19] and [20], and
is available in both the implicit and the explicit integration solver
23
(ABAQUS/Standard and ABAQUS/Explicit). The material model uses the
concept of isotropic damaged elasticity in combination with isotropic tensile
and compressive plasticity to represent the inelastic behavior of concrete.
The model consists of the combination of non-associated multi-hardening
plasticity and scalar (isotropic) damaged elasticity to describe the
irreversible damage that occurs during the fracturing process. The model
allows the definition of strain hardening in compression and can be defined
to be sensitive to the straining rate, which resembles the behavior of concrete
somewhat realistically.
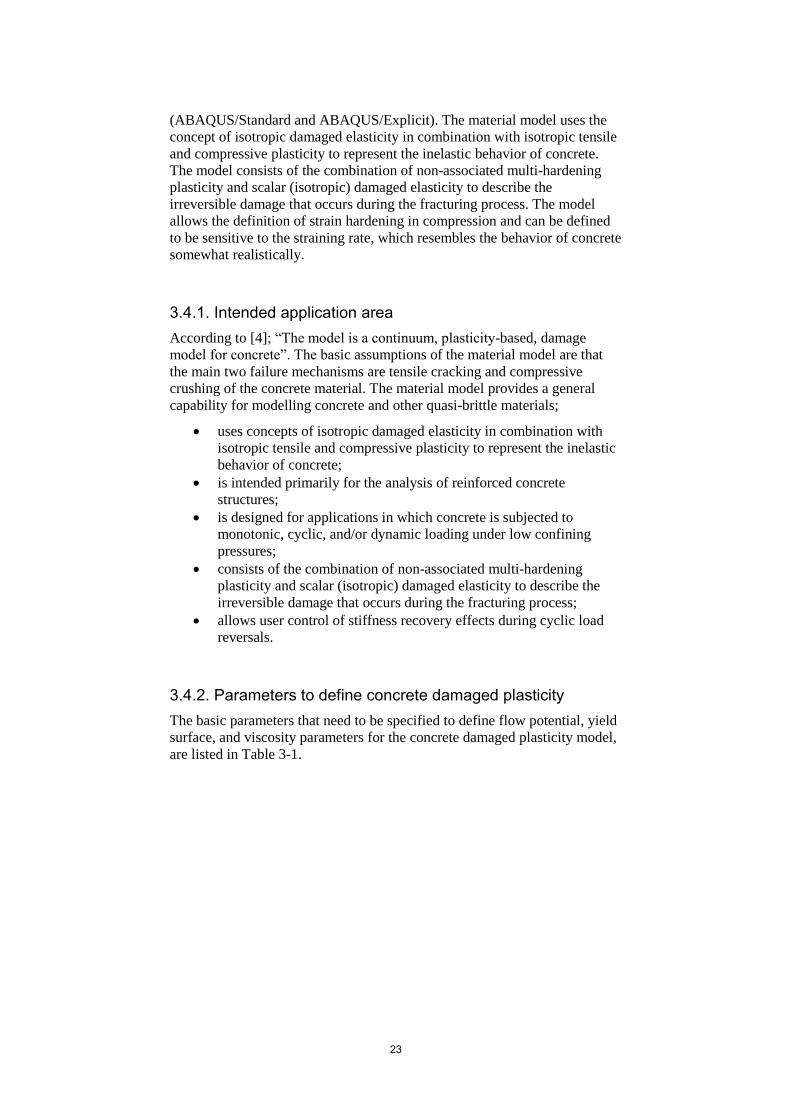
3.4.1. Intended application area According to [4]; “The model is a continuum, plasticity-based, damage
model for concrete”. The basic assumptions of the material model are that
the main two failure mechanisms are tensile cracking and compressive
crushing of the concrete material. The material model provides a general
capability for modelling concrete and other quasi-brittle materials;
uses concepts of isotropic damaged elasticity in combination with
isotropic tensile and compressive plasticity to represent the inelastic
behavior of concrete;
is intended primarily for the analysis of reinforced concrete
structures;
is designed for applications in which concrete is subjected to
monotonic, cyclic, and/or dynamic loading under low confining
pressures;
consists of the combination of non-associated multi-hardening
plasticity and scalar (isotropic) damaged elasticity to describe the
irreversible damage that occurs during the fracturing process;
allows user control of stiffness recovery effects during cyclic load
reversals.
3.4.2. Parameters to define concrete damaged plasticity The basic parameters that need to be specified to define flow potential, yield
surface, and viscosity parameters for the concrete damaged plasticity model,
are listed in Table 3-1.

24
Table 3-1 Concrete damaged plasticity material model input
parameters.
Parameter Description Default value
ψ Dilation angle (in degrees) User defined
𝜖 Flow potential eccentricity (defines the rate at which the hyperbolic flow potential approaches its asymptote)
0.1
σb0/σc0 Ratio of initial equibiaxial compressive yield stress to initial uniaxial compressive yield stress
1.16
Kc Ratio of the second stress invariant on the tensile meridian to that on the compressive meridian at initial yield for any given value of the pressure invariant such that the maximum principal stress is negative
0.6667
μ Viscosity parameter 0.0 in Standard
N/A in Explicit
The CDP material model assumes non-associated potential plastic flow in
which the Drucker-Prager hyperbolic function describes the flow potential G
[4].
𝐺 = √(∈∙ 𝜎𝑡0 ∙ 𝑡𝑎𝑛𝜓)2 + �̅�2 − �̅� ∙ 𝑡𝑎𝑛𝜓 (Eq. 3-1)
In equation 3-1, �̅� denotes effective von Mises stress, and �̅� the effective
stress caused by hydrostatic pressure. The dilation angle ψ is measured in the
p-q plane at high confining pressure and indicates the ratio between the
volume change and the shear strain. The dilation angle value for concrete is
commonly specified in the range of 30° to 40° [4]. The flow potential
eccentricity 𝜖 defines the rate at which the function approaches the
asymptote. With the default value of 𝜖 = 0.1 the dilation angle is almost the
same over a wide range of confining pressure stress values. The uniaxial
failure tensile stress σt0 is via the tension stiffening definition specified by
the user [4]. The model provides the possibility to specify a non-circular
yield surface in the deviatoric plane, see Figure 3-2.

25
Figure 3-2 Yield surfaces in the deviatoric plane, corresponding to
different values of Kc [4].
Figure 3-3 Yield surface in plane stress [4].
The third and fourth parameter stated in Table 3-1 is included in the yield
function used in the CDP model, which in terms of effective stresses has the
form:
𝐹 =1
1 − 𝛼(�̅� − 3𝛼�̅� + 𝛽(𝜀̃𝑝𝑙)⟨�̂�𝑚𝑎𝑥⟩ − 𝛾⟨−�̂�𝑚𝑎𝑥⟩) − 𝜎𝑐(𝜀�̃�
𝑝𝑙) = 0 (Eq. 3-2)
with

26
𝛼 =(𝜎𝑏0 𝜎𝑐0⁄ ) − 1
2(𝜎𝑏0 𝜎𝑐0⁄ ) − 1 (Eq. 3-3)
𝛽 =𝜎𝑐(𝜀�̃�
𝑝𝑙)
𝜎𝑡(𝜀�̃�𝑝𝑙)(1 − 𝛼) − (1 + 𝛼) (Eq. 3-4)
𝛾 =3(1 − 𝐾𝑐)
2𝐾𝑐 − 1 (Eq. 3-5)
3.4.3. Model behavior in compression The concrete material behavior in compression outside of the elastic regime
is defined by the relation of yield stress 𝜎𝑐0 and inelastic strain, 𝜀�̃�𝑖𝑛. The
inelastic strain is defined as the total strain minus the elastic strain
corresponding to the undamaged material, see equation 3-6 and [4].
𝜀�̃�𝑖𝑛 = 𝜀𝑐 − 𝜀0𝑐
𝑒𝑙 (Eq. 3-6)
Figure 3-4 Model material response in uniaxial compressive loading
[4].
The uniaxial initial yield stress value σc0 is according to Eurocode 2 [21]
defined as 40 % of the mean value of the cylinder ultimate compressive
stress (fcm), denoted σcu in the figure above. Corresponding strain is then
calculated according to Hooke’s law, i.e. 𝜀0𝑐𝑒𝑙 =
𝜎𝑐0
𝐸0 and the maximum strain
is taken as 𝜀𝑚𝑎𝑥 = 𝜀0𝑐𝑒𝑙 ∙ 20. The inelastic stress curve is defined according to
[20] in the following manner:
𝜎𝑐 = 𝜎𝑐0 [(1 + 𝑎) ∙ 𝑒−𝑏∙�̃�𝑐𝑝𝑙
− 𝑎 ∙ 𝑒−2∙𝑏∙�̃�𝑐𝑝𝑙
] (Eq. 3-7)
with

27
𝑎 = 2 ∙𝑓𝑐𝑚𝜎𝑐0
− 1 + 2√(𝑓𝑐𝑚𝜎𝑐0
)2
−𝑓𝑐𝑚𝜎𝑐0
(Eq. 3-8)
𝑏 =
(𝑑𝜎
𝑑𝜀�̃�𝑝𝑙)
𝜎𝑐0(𝑎 − 1)
(Eq. 3-9)
The numerator in equation 3-9 describe the inclination of the curve at the
initial yield stress value.
3.4.4. Model behavior in tension In general, when using the CDP material model, the concrete behavior in
uniaxial tension is defined as the relation between post failure stress and
either of cracking strain, 𝜀�̃�𝑐𝑘, crack displacement, 𝑢𝑡
𝑐𝑘, or fracture energy, Gf.
In the work carried out within current project the uniaxial tension behavior is
given as the relation between post failure stress and cracking displacement as
seen in Figure 3-5. This is due to the fact that models of non-reinforced
structures are mesh sensitive when using the cracking strain definition. This
mesh sensitivity is for most practical applications eliminated through the
implementation of a characteristic element length associated with each
integration point, when using cracking displacement input definition
methods (*CONCRETE TENSION DAMAGE, TYPE=GFI and
TYPE=DISPLACEMENT) [4].
Figure 3-5 Model material response in uniaxial tension [4].
The relation between post failure stress and cracking displacement is
calculated according to equation 3-10.

28
𝜎𝑡
𝑓𝑐𝑡𝑚= 𝑓(𝑢𝑡
𝑐𝑘) −𝑢𝑡𝑐𝑘
𝑢𝑡0𝑐𝑘 ∙ 𝑓(𝑢𝑡
𝑐𝑘 = 𝑢𝑡0𝑐𝑘) (Eq.3-10)
where
𝑓(𝑢𝑡𝑐𝑘) = (1 + (
𝐶1 ∙ 𝑢𝑡𝑐𝑘
𝑢𝑡0𝑐𝑘
)
3
) ∙ 𝑒−𝐶2∙𝑢𝑡𝑐𝑘 𝑢𝑡0
𝑐𝑘⁄ (Eq. 3-11)
For a normal weight concrete the constants C1 and C2 given in equation 3-
11 are 3 and 6.93 respectively. The concrete fracture energy is defined as the
area underneath the graph seen in Figure 3-6. The cracking displacement at
which complete loss of strength takes place 𝑢𝑡0𝑐𝑘, may be determined by first
establish a reasonable concrete fracture energy GF and then integrate the
combined expression of equation 3-10 and 3-11. For a normal weight
concrete this gives following relation:
𝑢𝑡0𝑐𝑘 =
𝐺𝐹0.195 ∙ 𝑓𝑐𝑡𝑚
(Eq. 3-12)
When using the CDP material model, the damage caused by strains is
measured with a damage tension parameter denoted “concrete tension
damage” dt. The parameter may be visualized during post processing and
indicates the status of the concrete after cracking has occurred, i.e. grade of
impaired stiffness. In the work carried out within current project the concrete
tension damage is linearly defined with a maximum of 0.9. This means that
an element gets inactive when the cracking displacement 𝑢𝑡0𝑐𝑘 is reached and
at this point the damage tension parameter has the value of 0.9.
Figure3-6 Defining material model behavior in concrete tension
stiffening, using definition type GFI, [4].
3.4.5. Material damage The material point damage in tension and compression, dt or dc, are defined
in tabular form. If damage relations are not defined, the model behaves as a
plasticity model with 𝜀�̃�𝑝𝑙= 𝜀�̃�
𝑐𝑘 and 𝜀�̃�𝑝𝑙= 𝜀�̃�
𝑖𝑛. Damage variables are each
treated as non-repairable, always increasing, quantities.

29
3.4.6. Uniaxial cyclic loading model behavior A user control of stiffness recovery effects during load reversals are
available in the model. Stiffness recovery on crack closure is an important
feature of the material model under cyclic loading conditions. This is
implemented as a compressive stiffness recovery possibility as a crack is
closed, as material response changes from tension to compression. The
tensile stiffness is however not recovered as compression change to tension,
after crushing cracking has occurred. The implementation is facilitated using
the stiffness recovery factors, wt and wc. The behavior described above
correspond to wt=0 and wc=1, which are the default stiffness recovery factor
values. See Figure 3-7 for an illustration at uniaxial cyclic conditions.
Figure 3-7 Uniaxial load cycle of the concrete damaged plasticity
model when material response shifts signs [4].
3.4.7. Comparisons to actual concrete material behavior The CDP material model has successfully been used in several application
areas. It can be concluded that the material model has some features
sometimes not entirely replicating, in some broad sense of the expression,
“characteristic concrete behavior”. For one, the model is a modified
plasticity model, meaning that once inelastic in one material direction, all
other material directions are also inelastic. This differ from that of a crack
region in concrete and should, possibly more so for complex shear
dominated response situations, result in a softer behavior than real concrete
has.
The CDP material model differs from conventional von Mises plasticity by
having, among other features, dis-similar definitions for tension and
compression behavior. As tension behavior is much weaker than the
compressional behavior, the cyclic response will in practice induce an

30
unphysical and artificial swelling of damaged material at load reversals. This
effect is noticeable even for some monotonic loading conditions, and fairly
pronounced for some cyclic loading conditions. One-element shear load tests
performed has confirmed this unwanted feature.
3.5. Used material model input
Measured material strength values and properties derived within the
experimental campaign are presented in sections 2.3 and 2.4. The following
two sections present and discuss used input material parameters for the
numerical models.
3.5.1. Concrete Concrete material parameters for the base model used in simulations of the
normal concrete test specimen, REG A (see Table 2-1), are summarized in
Table 3-2. Some input parameters listed in the table are more or less to be
considered as standard concrete material parameters, here either taken from
the Eurocode 2 design standard [21], or experimentally measured values
(presented in sections 2.3), whereas some of the input parameters are related
to the specific implementation of the constitutive model. General
motivations for each parameter are therefore included in the table. Since the
analyses are performed with the ABAQUS/Explicit solver, the viscosity
parameter μ is not in effect.
As a best estimate response is targeted in the numerical simulations carried
out, the experimentally derived concrete material properties presented in
section 2.3 are used as model input. Although it should be noted, for best
estimate response, compression strength material model input from tests
using cylinder specimens should not be used. Instead, compression strength
measured from cube tests should preferably be used as input to the concrete
material model in numerical simulations, because of their inherent
characteristics coming to a higher degree from primarily material
compression failure [22]. For compression tests of cylinder specimens,
combined effects of both the material characteristics, and type of structure
tested (and boundary conditions, friction), dictate the type of failure and the
ultimate compression strength. Typically, the compression strength of a
standard cylinder compression test is approximately 80 % of the value
obtained using a standard cube test. See illustration of plausible cylinder
compression test failure mode, for an idealized cylinder specimen
numerically simulated, in Figure 3-8. It has not been possible, within the
work presented in this report, to in detail investigate requirements on test
data and relevant test methods for all the material input parameters needed.
However, it is concluded that well informed decisions need to be made and
justified for all material model input parameters. Using experimentally
derived material parameters, it is important to be aware of what is an actual
material parameter, appropriate as material model input, and what is merely
considered to be a material property by force of conventional practice.

31
Figure 3-8 Cylinder compression test simulation, showing crack
formation and failure mode, as a mean to study the type of
concrete material data to be used as input for numerical
simulations. Isosurfaces of compressive damage
visualized in the figure at different displacements.
The concrete uniaxial behavior is specified in compression and tension
according to Figure 3-9 and Figure 3-11. For tension behavior two options
are pursued; the Two-parameter option, and tabular definition. Both options
respect the same material parameters, ultimate tensional strength and (mode
I) fracture energy. Figure 3-6 visualize the two-parameter option. This
option is often used for problems where the shape of the function play a
minor role, and the ultimate uniaxial tensional stress or the fracture energy is
more important, as usually in pure tension or bending problems. For shear
type of problems, the tabular definition may also need to be studied.
Properties for closed tensional cracks include the ability to transfer
compressive stress on load reversal and crack closure. However, cracks due
to compression load will not transfer the full original tensional stress on load
reversal, once cracking due to compression have occurred.

32
Table 3-2 Concrete material model input used in simulations of the
intended normal (regular) concrete test specimen, REG A.
Parameter Description Value (@ T=20°C)
E Initial, undamaged, modulus of elasticity (experimentally measured)
47.15 GPa
ʋ Poisson’s ratio (standard value) 0.2
ρ Density (standard value without reinforcement steel) 2250 kg/m3
ψ Dilation angle, in degrees (chosen based on previous studies and [4])
38
𝜖 Flow potential eccentricity (default program value) 0.1
σb0/σc0 Ratio of initial equibiaxial compressive yield stress to initial uniaxial compressive yield stress (default program value)
1.16
Kc Ratio of the second stress invariant on the tensile meridian to that on the compressive meridian at initial yield for any given value of the pressure invariant such that the maximum principal stress is negative (default program value)
0.667
σcu Ultimate compressive stress, here set to stress at concrete crushing strain, 3.5‰ (experimentally measured)
79.0 MPa
σt0 Failure tensile stress (experimentally measured) 4.76 MPa
GF Fracture energy (experimentally measured) 179.3 N/m
dc Concrete compression damage Figure 3-10
wt Recovery of tension after concrete compression damage (0 mean that after compressive failure, no matter the size, no tensional forces are transmitted through the crack)
0.0
- Maximum value of concrete tension damage (default program value)
0.9 (linear variation from 0)
𝑢𝑡0𝑐𝑘 Crack displacement at maximum value of concrete
tension damage 0.18 mm
wc Recovery of compression capability after concrete tension damage (1 mean that after failure initiation in tension, compressive forces are still transmitted through the crack)
1.0

33
Figure 3-9 Concrete model behavior in uniaxial compression. The
function is defined linear up to 40 % of the ultimate
compression value, according to EC2 [21].
Figure 3-10 Concrete model compression damage definition (dc).

34
Figure 3-11 Concrete model behavior in uniaxial tension for the two
different options; Two parameter (TYPE=GFI) definition,
and Tabular definition. Ultimate tension stress and
fracture energy are here identical for the two definition
options shown in the figure.
3.5.2. Reinforcement steel The steel constituting reinforcement is modelled using material values
according to Table 3-3. For the plastic region, a simple ideal plastic material
is assumed, in order to be able to obtain a rough estimate of the ultimate
capacity of the shear wall.
Table 3-3 Reinforcement steel nominal material parameters used.
Parameter Description Value (20°C)
E Modulus of elasticity 182 GPa
ʋ Poisson’s ratio 0.3
ρ Density 7800 kg/m3
σy Yield stress 430 MPa
σu Ultimate stress 638 MPa
εu Ultimate elongation 14 %
3.6. Base numerical model overview
The base model used in the majority of the simulations presented in this
report is visualized in Figure 3-12 below. The upper and lower beams are
modeled using 8-node hexagonal reduced integration elements, C3D8R [4],
with default hourglass stiffness. These elements have linear only material
properties. The wall part, and stabilizing vertical end columns, are modeled
using 10-node modified tetrahedron elements, type C3D10M [4]. The model
of the wall is tied to the model of the lower and upper beams, to couple not
only the end nodes of the C3D10M elements, but also the mid-point nodes.

35
The characteristic element side length is 25 mm for all elements in the base
model.
The actual specimen construction sequence, and whether a division into
different casting parts were made during construction, is unknown. It is
therefore assumed that the specimens each were casted at one time, and no
casting joints are present in the specimens. In the numerical model, no weak
sections are included between the lower and upper beam and the wall
section, and the concrete model is considered homogenous without
considering differential casting effects.
Additional masses from equipment are assumed to weigh half a metric ton
(500 kg). This mass is applied and evenly distributed at the top surface of the
upper beam.
Figure 3-12 Visualization of concrete solid element model, created
using the nominal measures in [10].
3.7. Model of steel reinforcement bars
The steel reinforcement described in [10] is implemented into the numerical
models as discrete elements, separate from the elements representing the
concrete material. The reinforcement bars are modeled using beam elements
of type B31 [4], see section 4.5.8 for motivation of this choice. Element
length are coordinated with the characteristic element side length of the solid
elements used to model the concrete. The reinforcement is visualized in
Figure 3-13.
The coupling between concrete and reinforcement elements are modeled as
direct connections, using the embedded element option in ABAQUS,
without any coupling interface describing non-linear effects between
reinforcement and concrete in areas experiencing concrete cracking. This is
an identified limitation of the used numerical model.

36
Figure 3-13 Steel reinforcement visualization, Left; reinforcement only,
from 3 different orthogonal directions. Right; On place in
the concrete model.
3.8. Boundary conditions
To allow for the simulation of expansion of the ASR affected concrete
specimen, contact surfaces representing the floor, and hold-down system
(bolt and steel plate) of the lower beam, are used. Identical models are used
for the simulations of both regular and ASR affected concrete, apart from
material properties and prescribed expansions discussed in section 3.11.
Surface friction are kept at a zero level for the initial analysis step to allow
for a stress-free expansion, see section 3.10, and ramped up to a large value
in the very beginning of the second analysis step to obtain a slip-free surface
contact. This possibly differ from the actual experimental setup, and is
assumed to create a stiffer model than what was the case for the actual
experimental test specimens. No information concerning the actual
conditions during experimental tests are available at present time.
In the simulations of the ASR affected specimen the first analysis step
includes the simulation of the ASR expansion, which is then free (not
constrained). Contact surface definitions allow for separation after contact.
The effective boundary conditions of the numerical model of the lower beam
are then constrained in all directions, including rotations. The model,
including visualization of contact surfaces, is illustrated in Figure 3-14. The
top beam is left without constrains. In the vertical direction both gravity
loads and the prescribed additional vertical load from hydraulic jacks will be
applied. The horizontal directions of the top beam are left free to allow for
horizontal jack imposed displacements. The wall in-plane rotation of the top
beam is left without constrains. This to allow for free rotations, which
appears to likely have been the case in the physical experiments. A small
study of this is included in section 4.5.1.
It should be noted that the applied restraints of the lower beam are
considered overly rigid compared to actual experimentally conditions, but

37
still used, as no experimental data, nor other information from the specimen
interactions to its surroundings during the tests are available.
Figure 3-14 Visualization of model. Contact surfaces used for the
bottom beam are marked light red. Nodes used for
application of prescribed horizontal displacement are
highlighted in dark red color.
3.8.1. Prescribed in-plane movements The horizontal movements of the top beam, by the two horizontal jacks,
having each a nominal capacity of 1000 kN [7], are modeled using
displacement controlled boundary conditions of the top beam geometric
center position in the x-y plane. See Figure 3-14 for model orientation with
coordinate system, and the row of nodes used for application of prescribed
horizontal displacement (highlighted in dark red color).
3.9. External loads applied
External loads applied are limited to the vertical actuator load, and gravity
loads. These external loads are applied at an initial analysis step.
In the vertical direction, experimental force data from actuators has not been
applied, as it was not available. Instead, a constant total vertical force of 800
kN [10], in the model negative Y-direction according to Figure 3-14, has
been applied at the top beam, as a distributed surface load over the entire top
beam surface.
In addition, gravity loading in this direction has also been applied on all
elements, including an assumed additional equivalent equipment mass of
500 kg to account for steel equipment at the top beam. The actual mass of
equipment on top of the top beam is not known.

38
3.10. Simulation types and procedures
The actual physical experiments did not include dynamic effects (inertia),
but were very slow processes. See section 2.5 for load rates applied. The
numerical simulations of the actual experimental events are consequently
simulated using the explicit wave front ABAQUS/Explicit solver [4], as
quasi-static events, including only a minimal amount of kinetic energy.
The simulations were divided into two subsequent simulation steps. An
initial step, which include application of gravity load and the vertical force,
and a subsequent step of the actual event of interest (monotonic push-over or
cyclic event). For the ASR simulations, the expansion was also included in
the first simulation step.
As complements to simulating the actual experimental events, in order to
save time and evaluation efforts, monotonic static nonlinear pushover
simulations have been used for the bulk of the simulations. Typical wall
clock simulation times for such a monotonic pushover event is
approximately 10 hours, when parallelized on 20 cores on a Linux server.
The total number of variables in the numerical model is almost 500 000.
3.11. Modelling of ASR effects
Chemical processes in concrete due to alkali-aggregate reactions lead to a
change of the material properties (at a macro level), which in turn cause
progressive material expansion (swelling) and cracking [9]. The process is
slow, and may take many years to cause substantial material and structural
changes, if ever. Typically affected structures exposed to outdoor climate
may experience durability issues, and combined effects from, for instance,
concrete freeze-thaw [23] or reinforcement corrosion may occur. Only very
few studies on the impact of ASR on safety related functions for safety
significant nuclear structures are available [8]. The effects of ASR on a
structural level are complex, as the changed (nominally decreased) material
properties in some configurations may, on a structural level, be
counterbalanced by positive confinement effects from material swelling.
This may lead to non-intuitive structural shear capacity changes due to ASR,
both increase and decrease, according to [8]. Most studies of ASR-affected
reinforced concrete structures have indicated that the load-bearing capacity
of the structures are not compromised [18].
In Sweden, no instances of ASR have been reported to the nuclear regulatory
body, for NPP reactors still in production (see section 1.5). In addition, the
structural effects of the ASR chemical process seem complex, and yet not
fully understood. There are currently no engineering guidelines in design
codes for capacity changes of structures affected, and different structural
configurations may result in large, non-intuitive, variations in structural
effects [8]. As a consequence, also taking into consideration the open
questions regarding experimental results discussed in section 2.6.4, this
phenomenon is treated using a simplistic macro-scale method in this current
study.
Using numerical tools to simulate, understand and predict the structural
effects of ASR may be an important part in structural verifications of

39
affected structures. The macro-scale modelling technique used in this study
prioritize simplicity before accuracy, and results are used as conceptual
indicators on the structural phenomenon of concrete material swelling. The
material expansion, as well as material property degradations, are considered
in this simplified approach. The method is justified based on both the
uncertainty in the degradations, in terms of spatial distribution and reaction
progress, for an actual nuclear structure. In the assessment of actual
structures, both engineering judgement, and simplified conservative
modelling approaches, are believed to be important parts, although they may
not be entirely correct in a scientific perspective. For further information on
some selected refined methods of modelling ASR effects, see for instance
references [7] and [8].
3.11.1. Material expansion Material expansion in the concrete is modelled using an equivalent isotropic
thermal expansion. The expansion is modelled uniform in the entire test
specimen, as a simplification and in absence of other information, which
likely is not the case for any real structure. Conceptual explanations of
material expansion due to ASR are described further in [7].
Experimentally measured free swelling of small concrete samples related to
the shear wall studied here are presented in [10], and accounted for in Table
2-3. Based on this the free expansion at the ASR A1 test 250 days after
casting is assumed to be 0.185 %, and a graphically roughly estimated value
of 0.30 % (from Figure 2-4) is used for the ASR B2 test simulations. See
Table 2-1 for information concerning the different experimental tests to be
numerically simulated.
Although not explicitly stated in any of the ASCET reference documents, the
entire test specimen, including upper and lower beam elements, are assumed
to be of the same reactive concrete type in the numerical models.
3.11.2. Material property changes According to [6] and [7], the tensile strength and stiffness of the concrete is
more affected by AAR than the compressive material strength, which is
consistent with the conclusions in the literature study [9], and in [18].
Material property changes due to ASR include stiffness and strength
parameter reductions, which in the numerical simulations of the ASR A1 test
specimen are selected according to the given values, specified in Table 2-2.
For the numerical simulations of the ASR B2 test specimen (tested after
approximately 1000 days at exhausted chemical reactions), material property
changes are intended to be estimated by benchmark participants. However,
as regular code equations for estimation of material parameters do not apply
to ASR affected material, the same values as used for the numerical
simulations of the ASR A1 tests are used. This mean that expansion effects
only will be evaluated.

40
3.11.3. Concrete and steel reinforcement interface The effect of ASR on the concrete and reinforcement steel interface (bond)
is not considered in this work, although this is likely an important issue for
the ductile behavior, and shear capacity, in some situations.

41
4. Results and comparisons In this chapter, some selected results from the numerical work performed
within the benchmark participation are presented. For test specimens REG A
and ASR A1, numerical simulation output is compared to experimental
results available, and result comparisons are discussed based on the official
ASCET program goals. The official ASCET program goals of the numerical
simulation benchmark is to study;
1) The ability to predict the behavior of concrete elements with ASR,
2) the difference in failure modes between ASR and sound specimen,
3) the difference in ultimate capacity,
4) the difference in ultimate displacements.
The first item in the list above is here interpreted as being able to
characterize the noticeable differences observed in the experimental results
between the REG A test specimen and the ASR A1 specimen. These
differences include differences in ultimate capacity, and possibly different
crack patterns and failure modes. It should in this context be noted that the
experimental tests consist of two different individual tests, not being
statistically ensured, which indicate that some caution should be used when
interpreting results. The ultimate capacity is simply interpreted as the
maximum whole wall shear force during the event, which make this
parameter simple to evaluate. The ultimate displacement (ductility measure)
is however not simple to define, and no guidance, nor criteria, for evaluating
this parameter is given. In the evaluations of this parameter a subjective
approach, based on visual determination of when the ultimate diagonal crack
is formed, is therefore used in this chapter.
Ultimate capacity and displacement for A and B series of specimen are
summarized in Table 4-1. Experimental values for the B-series of tests used
in the table are from the University of Toronto presentation at the concluding
ASCET Phase 2 workshop [16], which were presented after the numerical
work in this report were finalized. In general, experimental and numerical
ultimate capacity agree reasonably well for the regular concrete walls.
Concerning the specimen having an advanced state of ASR (ASR B2),
whole wall ductility has been dramatically reduced, and simplified numerical
method adjustments does naturally not capture this reduction.

42
Table 4-1 Ultimate capacity and displacement summary table.
Numerical simulation capacity presented are calculated
using best estimate material parameter input and
monotonic load application.
Specimen Method used for deriving structural shear capacity
Ultimate capacity (kN)
Ultimate displacement (mm)
Regular A Experimental (Section 2.6) 1180 8.2
Numerical (Section 4.1) 1040 Approx. 8-102)
Regular B Experimental (Section 2.6) 1187 7.3
Numerical (Section 4.2) 1090 Approx. 8-102)
ASR A1 Experimental (Section 2.6) 1355 7.1
Numerical (Section 4.3) 1080 Approx. 8-102)
ASR B2 Experimental (Section 2.6) 1243 2.6
Numerical (Section 4.4) 1120 Approx. 8-102)
1) Ductility based on crack formation of ultimate failure mode.
The general philosophy for the numerical simulations carried out is based on
combining best estimate input, with a simplified engineering approach to the
physics behind the ASR effects on the concrete specimen, as the actual
physics of the reactive processes are considered too complex to incorporate
in detail. The engineering approach used for describing the ASR effects
consist of isotropic material expansion and reducing concrete material
properties. This is described in more detail in section 3.11.
In this chapter, numerical results and predictions for the different test
specimens (REG A, ASR A1, REG B and ASR B2) are also presented. The
tests REG B and ASR B2 are completely blind predictions, as experimental
data for these tests were not available. As such, little effort has been put into
the work with these, as both input and output from the experimental
campaign are unknown. In addition to results for the best estimate numerical
models, several sensitivity analyses have been carried out for a selected set
of model input parameters. These are considered to contribute with valuable
information, and are presented later in this chapter. In the last part of this
chapter a brief comparison to design code capacity are made for both
numerical and experimental results.
Due to the used material model inability to successfully simulate the
inelastic responses during the complete cyclic shear load event, discussed in
section 4.1.2, quasi-static monotonic loading is used for the majority of the
numerical studies presented in this report.
Result figures visualizing the predicted crack patterns in the numerical
models in this chapter are mainly contour plots of resulting material damage
in tension, output variable DAMAGET [4]. Displacements are magnified a
factor of 20 in result figures throughout this chapter, unless stated otherwise.
The comparative experimental force-displacement curves shown in the

43
horizontal capacity figures (named Experimental REG A, and Experimental
ASR A1), is the enveloped experimental data shown in Figure 2-14.
4.1. Comparisons for regular concrete specimen REG A
In this section results from the numerical simulation of the regular concrete
specimen, REG A, are presented. The experimental tests were carried out at
specimen age 240 days, see section 2.2.
4.1.1. Monotonic push over simulation results Figure 4-1 show a comparison of horizontal whole wall push over capacity
functions for the REG A numerical simulation, compared to experimental
data. In comparison to the experimental data, the numerical model is
observed slightly too stiff in the initial elastic response. This may be due to
either the seemingly large value of the concrete elastic stiffness, poor
interaction or coupling modelling of adjacent structures, some result of
issues related to the experimental data acquisition, or a combination of these.
Boundary conditions for the model are set to entirely restrained translations
and rotations at the bottom beam (see section 3.8), which normally should
result in a too stiff behavior compared to an actual structure. The reason for
this is that this type of absolute restraint never exists in the physical world,
and likely were not the case for the experimental situation at the tests
compared to. However, no information is available concerning the details for
the actual concrete specimen anchoring, and this modeling approach is
therefore used, although it is believed to result in an overly stiff global
behavior.
As discussed in section 2.6, the experimental non-symmetrical force-
displacement response of test specimen REG A does not have the expected
characteristics of a structure having the given nominal data, as the idealized
numerical model does. In addition, the test specimen ASR A1 has an initially
stiffer response than the regular concrete specimen, despite lower elastic
stiffness. This is not expected, and an explanation for this is still missing at
present time.

44
Figure 4-1 Comparison of whole wall horizontal push over capacity
functions for the REG A specimen experimental test and
numerical simulations.
Visualizations of crack patterns and development for the REG A numerical
model are shown in Figure 4-2 and Figure 4-3. For the input used, numerical
simulation output responses are initially purely elastic, up to a point where
horizontal tension cracks are initiated at the interface between the wall and
the lower beam at the tension side (lower left side in Figure 4-2). In-plane
rotations at the upper beam is here not restrained, see section 4.5.1. As
prescribed horizontal displacements increase, a shear crack form in the wall.
Further displacement increase result in the development and progress of
multiple cracks, parallel to the initial shear crack. The ultimate failure mode
seems to be a combined shear mode, where the compression struts finally
sequentially join (forming a diagonal crack) and collapse. The approximate
maximum shear capacity for this loading situation is here predicted to be at a
prescribed horizontal displacement of 5.4 mm, and the shear force is then
1.04 MN. The ultimate failure is estimated to begin at approximately 8.2 mm
prescribed horizontal displacement, as the ultimate capacity of the right-hand
side barbell side wall is reached. After that the remaining capacity is quickly
reached, as one diagonal crack joins the multiple cracks previously formed
in the wall. See Figure 4-4.

45
Figure 4-2 Principal response at the point of maximum shear force
capacity (at 5.4 mm horizontal displacement), for the REG
A specimen numerical simulations.
Figure 4-3 Monotonic horizontal push over response after crack
initiation (at 1 mm) and at the point of maximum shear
force capacity (at 5.4 mm horizontal displacement), for the
REG A specimen numerical simulations.
Figure 4-4 Visualization of (close to) ultimate crack pattern and
failure mode for the REG A specimen, to be compared to
experimental results shown in Figure 2-11. Left figure
show tension damage, and right figure show compression
damage, at 8.2 mm horizontal displacement.
Reinforcement stresses are shown at initial yield in Figure 4-5, and at 10 mm
prescribed horizontal displacement in Figure 4-6. The yield stress is defined
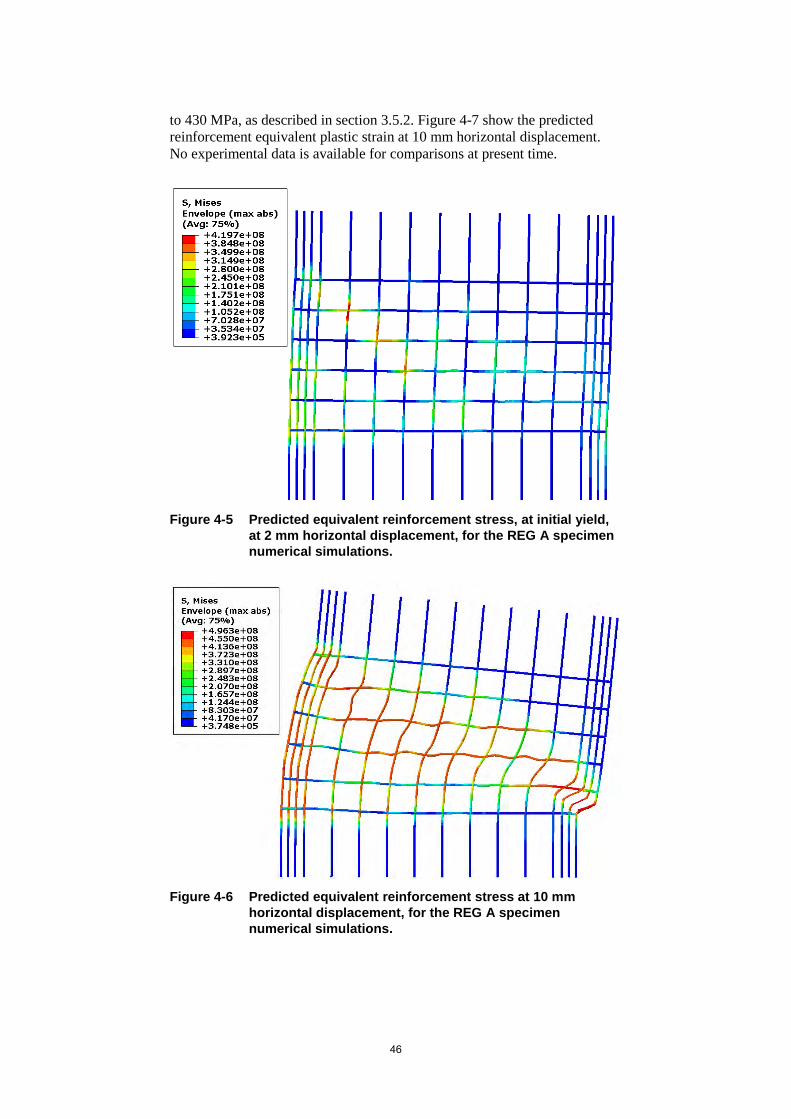
46
to 430 MPa, as described in section 3.5.2. Figure 4-7 show the predicted
reinforcement equivalent plastic strain at 10 mm horizontal displacement.
No experimental data is available for comparisons at present time.
Figure 4-5 Predicted equivalent reinforcement stress, at initial yield,
at 2 mm horizontal displacement, for the REG A specimen
numerical simulations.
Figure 4-6 Predicted equivalent reinforcement stress at 10 mm
horizontal displacement, for the REG A specimen
numerical simulations.

47
Figure 4-7 Predicted reinforcement equivalent plastic strain at 10 mm
horizontal displacement, for the REG A specimen
numerical simulations.
4.1.2. Cyclic loading simulation results Attempts to simulate the actual cyclic load event described in section 2.5 are
described in this section for the REG A specimen. The numerical model used
is identical to the model used for the simulation of monotonic loading,
described in the previous section. The prescribed cyclic horizontal
displacement sequence used for numerical simulations is shown in Figure 4-
8.
In conclusion, cyclic loading event simulations including advanced inelastic
material responses, are less successfully simulated using the CDP material
model in ABAQUS, for the studied shear loaded wall. The plastic damage
material model exhibit an unphysical swelling effect when for exposed to
repeated reversed inelastic stress states. This effect has been confirmed for
1-element numerical test cases, and the material model is believed to
insufficiently represent a quasi-brittle material for the studied cyclic shear
loading conditions.
Cyclic time history and push over loading (whole wall force-displacement)
response for the REG A specimen numerical simulations are shown together
with available experimental results in Figure 4-9. The figure show an
initially fair comparison for the cyclic time history simulation, up to almost 2
mm prescribed horizontal displacement of the top beam, and then a
premature and rapid loss of strength.

48
Figure 4-8 Used prescribed cyclic horizontal displacement sequence
for numerical simulations.
Figure 4-9 Comparison of whole wall horizontal push over capacity
functions for the REG A specimen experimental test and
cyclic loading numerical simulation.
In terms of crack development and pattern, Figure 4-10 and Figure 4-11
show the predictions during the first couple of load cycles. Initial crack
initiation occurs as a horizontal crack plane at the lower tension side of the
wall-bottom beam interface. Some of the early crack development may be
termed micro-cracking, which may not be experimentally (visually) easy to
detect. As crack development progress, the spurious material model swelling
response induce artificial internal stress, which affect the response.

49
The ultimate failure mode predicted for the REG A numerical model (see
Figure 4-12) is a failure mode in the shape of an inverted flat U-shape across
the wall, as the last vertical load carrying capacity of the outer barbell wall
sides is exhausted. Despite the apparent inability to simulate the complete
cyclic event, the predicted ultimate failure mode shown in Figure 4-12
visually compare to a certain degree to the experimental results shown in
picture Figure 2-11. Both tension and compression damage are shown in
Figure 4-12, as the predicted ultimate failure mode is a mixed mode failure.
Full access to the experimental data is however not available, which result in
an incomplete comparison. Due to the observed inability of the material
model to simulate the response in full, crack patterns and ultimate failure
mode predictions shown here for the cyclic loading event may be of limited
value, depending on the degree to which the real-world physics are violated.
This is however unknown at present time.
Figure 4-10 Cyclic loading response at 0.8 mm (second cycle) and -0.8
mm (second cycle reverse direction) horizontal
displacement, for the REG A specimen numerical
simulations.
Figure 4-11 Cyclic loading response at 1 mm (third cycle) and 1.4 mm
(fourth cycle) horizontal displacement, for the REG A
specimen numerical simulations.

50
Figure 4-12 Visualization of ultimate crack pattern and failure mode for
the REG A specimen numerical simulations, to be
compared to experimental results shown in Figure 2-11.
Left figure show tension damage, and right figure show
compression damage, at 2.5 mm total displacement (load
cycle number 7).
4.1.3. Numerical simulation energy levels Whole model energy quantities are good simulation health indicators for the
explicit numerical method used, and it’s considered good practice to analyze
these for each numerical simulation.
Checks for kinematic versus strain energy relations, i.e. high levels of kinetic
energy indicating non static conditions, has been performed. As simulations
are intended to be essentially static, the kinetic energy and viscous damping
energy levels are verified to be negligible in the simulations.
The artificial (hourglass) strain energy has been notably high in some of the
simulations carried out, indicating that this numerical feature has been highly
activated. This is an undesirable effect, and artificial energy levels should
ideally be low.
4.2. Blind predictions for regular concrete specimen REG B
In this section results from the numerical simulation of the regular concrete
specimen, REG B, are presented. The test specimen was tested at an
approximate age of 1000 days, see section 2.2. To account for the evolution
of material properties (ultimate compression, ultimate tension, and elastic
stiffness) for wall specimen REG B, some guidance from Eurocode 2 [21]
may be used. However, due to the unknown concrete quality class,
adjustments are here limited to increased ultimate compressive strength,
corresponding to the use of the ultimate cube compressive strength. The
ultimate cube compressive strength is here simply taken as the
experimentally determined ultimate cylinder compression divided by the
factor 0.8.

51
Due to the similarities between the numerical simulations of specimen REG
A and REG B, the results are at large similar. The REG B specimen, having
slightly higher concrete compression specified,
Figure 4-13 show a comparison of whole wall horizontal push over capacity
functions for the REG B specimen experimental test and numerical
simulations. Figure 4-14 show the monotonic horizontal push over response
in terms of crack patterns, at crack initiation (around 1 mm) and maximum
shear force capacity (at 7.4 mm horizontal displacement), for the REG B
specimen numerical simulations. As differences from the REG A numerical
simulation include an increased concrete compression only, differences
between results from these simulations are expected to be fairly small for the
loading situation studied, as only a moderate increase in capacity is
predicted. The approximate maximum shear capacity for this loading
situation is predicted to be 1.09 MN at 7.4 mm horizontal displacement.
Figure 4-13 Comparison of whole wall horizontal push over capacity
functions for the REG B specimen experimental test and
numerical simulations.
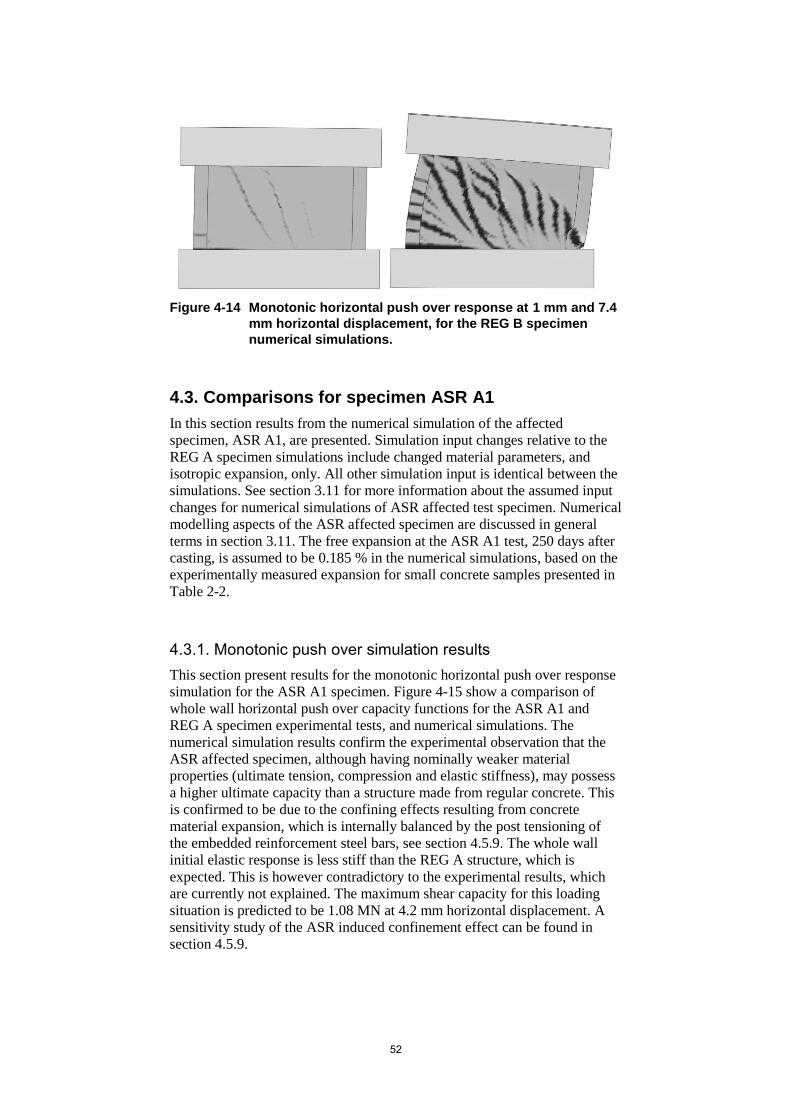
52
Figure 4-14 Monotonic horizontal push over response at 1 mm and 7.4
mm horizontal displacement, for the REG B specimen
numerical simulations.
4.3. Comparisons for specimen ASR A1
In this section results from the numerical simulation of the affected
specimen, ASR A1, are presented. Simulation input changes relative to the
REG A specimen simulations include changed material parameters, and
isotropic expansion, only. All other simulation input is identical between the
simulations. See section 3.11 for more information about the assumed input
changes for numerical simulations of ASR affected test specimen. Numerical
modelling aspects of the ASR affected specimen are discussed in general
terms in section 3.11. The free expansion at the ASR A1 test, 250 days after
casting, is assumed to be 0.185 % in the numerical simulations, based on the
experimentally measured expansion for small concrete samples presented in
Table 2-2.
4.3.1. Monotonic push over simulation results This section present results for the monotonic horizontal push over response
simulation for the ASR A1 specimen. Figure 4-15 show a comparison of
whole wall horizontal push over capacity functions for the ASR A1 and
REG A specimen experimental tests, and numerical simulations. The
numerical simulation results confirm the experimental observation that the
ASR affected specimen, although having nominally weaker material
properties (ultimate tension, compression and elastic stiffness), may possess
a higher ultimate capacity than a structure made from regular concrete. This
is confirmed to be due to the confining effects resulting from concrete
material expansion, which is internally balanced by the post tensioning of
the embedded reinforcement steel bars, see section 4.5.9. The whole wall
initial elastic response is less stiff than the REG A structure, which is
expected. This is however contradictory to the experimental results, which
are currently not explained. The maximum shear capacity for this loading
situation is predicted to be 1.08 MN at 4.2 mm horizontal displacement. A
sensitivity study of the ASR induced confinement effect can be found in
section 4.5.9.

53
Figure 4-15 Comparison of whole wall horizontal push over capacity
functions for the ASR A1 and REG A specimen
experimental tests and numerical simulations.
Visualizations of crack patterns and development are shown in Figure 4-16.
Horizontal tension cracks are initiated at the interface between the wall and
the lower beam at the tension side (lower left side in Figure 4-16), but at a
later stage and less pronounced than for specimen REG A. This is due to the
confining effects of the concrete, caused by the material expansion in
combination with the reinforcement. As prescribed horizontal displacements
increase, a pattern of parallel shear crack form in the wall. Further
displacement increase result in the development and progress of multiple
cracks, parallel to the initial shear crack. The crack pattern appears to be
more regular than for the REG A simulation. The ultimate failure mode
seems to be a combined shear and tension mode. The visualization in Figure
4-17 is believed to compare fair to experimental crack patterns in the wall,
shown in Figure 2-13. The maximum shear capacity for this loading
situation is here predicted to be at a prescribed horizontal displacement of
4.8 mm, which is slightly earlier than for the REG A specimen, and the shear
force is then 1.08 MN. The ultimate failure is here estimated to be slightly
more ductile than the REG A specimen, beginning at approximately 10 mm
prescribed horizontal displacement.

54
Figure 4-16 Monotonic horizontal push over response at crack
initiation (1.2 mm) and maximum capacity around 4.8 mm
horizontal displacement, for the ASR A1 specimen
numerical simulations.
Figure 4-17 Visualization of (close to) ultimate crack pattern and
failure mode for the ASR A1 specimen, to be compared to
experimental results shown in Figure 2-11. Left figure
show tension damage, and right figure show compression
damage, at 10 mm horizontal displacement.
Figure 4-18 show the predicted equivalent reinforcement stress after
isotropic concrete expansion (0.00185), and before initiation of the
horizontal displacement push over event, for the ASR A1 specimen
numerical simulations. Reinforcement stresses are shown at initial yield in
Figure 4-19, and at 10 mm prescribed horizontal displacement in Figure 4-
20. The yield stress is defined to 430 MPa, as described in section 3.5.2.
Initial yield occurs at an earlier stage in the ASR affected structure,
compared to the regular concrete test specimen. This is due to the
prestressing effect induced by the concrete expansion, causing the initial
stress state in the reinforcement. Figure 4-21 show the predicted
reinforcement equivalent plastic strain at 10 mm horizontal displacement.
No experimental data is available for comparisons and verification of these
predictions at present time.

55
Figure 4-18 Predicted equivalent reinforcement stress after isotropic
concrete expansion (1.85 mm/m), before initiation of the
horizontal displacement, for the ASR A1 specimen
numerical simulations.
Figure 4-19 Predicted equivalent reinforcement stress, at initial yield,
at 0.8 mm horizontal displacement, for the ASR A1
specimen numerical simulations.

56
Figure 4-20 Predicted equivalent reinforcement stress at 10 mm
horizontal displacement, for the ASR A1 specimen
numerical simulations.
Figure 4-21 Predicted reinforcement equivalent plastic strain at 10 mm
horizontal displacement, for the ASR A1 specimen
numerical simulations.
4.3.2. Cyclic loading simulation results Attempts at simulating the actual cyclic load event described in section 2.5
are described in this section for the ASR A1 specimen, analogue to the REG
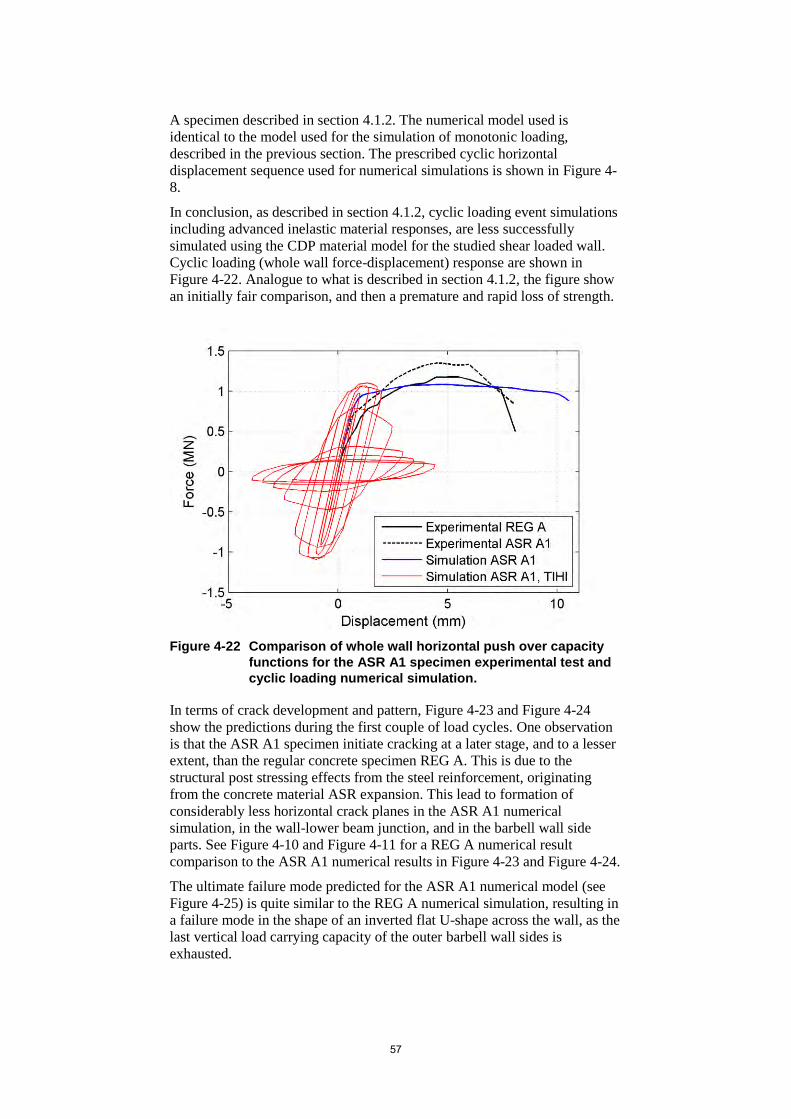
57
A specimen described in section 4.1.2. The numerical model used is
identical to the model used for the simulation of monotonic loading,
described in the previous section. The prescribed cyclic horizontal
displacement sequence used for numerical simulations is shown in Figure 4-
8.
In conclusion, as described in section 4.1.2, cyclic loading event simulations
including advanced inelastic material responses, are less successfully
simulated using the CDP material model for the studied shear loaded wall.
Cyclic loading (whole wall force-displacement) response are shown in
Figure 4-22. Analogue to what is described in section 4.1.2, the figure show
an initially fair comparison, and then a premature and rapid loss of strength.
Figure 4-22 Comparison of whole wall horizontal push over capacity
functions for the ASR A1 specimen experimental test and
cyclic loading numerical simulation.
In terms of crack development and pattern, Figure 4-23 and Figure 4-24
show the predictions during the first couple of load cycles. One observation
is that the ASR A1 specimen initiate cracking at a later stage, and to a lesser
extent, than the regular concrete specimen REG A. This is due to the
structural post stressing effects from the steel reinforcement, originating
from the concrete material ASR expansion. This lead to formation of
considerably less horizontal crack planes in the ASR A1 numerical
simulation, in the wall-lower beam junction, and in the barbell wall side
parts. See Figure 4-10 and Figure 4-11 for a REG A numerical result
comparison to the ASR A1 numerical results in Figure 4-23 and Figure 4-24.
The ultimate failure mode predicted for the ASR A1 numerical model (see
Figure 4-25) is quite similar to the REG A numerical simulation, resulting in
a failure mode in the shape of an inverted flat U-shape across the wall, as the
last vertical load carrying capacity of the outer barbell wall sides is
exhausted.

58
Figure 4-23 Cyclic loading response at -0.8 mm (second cycle reverse
direction) and 1 mm (third cycle) horizontal displacement,
for the ASR A1 specimen numerical simulations.
Figure 4-24 Cyclic loading response at 1.4 mm (fourth cycle) and 1.8
mm (fifth cycle) horizontal displacement, for the ASR A1
specimen numerical simulations.
Figure 4-25 Visualization of ultimate crack pattern and failure mode for
the ASR A1 specimen numerical simulations, to be
compared to experimental results shown in Figure 2-11.
Left figure show tension damage, and right figure show
compression damage, at 2.5 mm total displacement (load
cycle number 7).
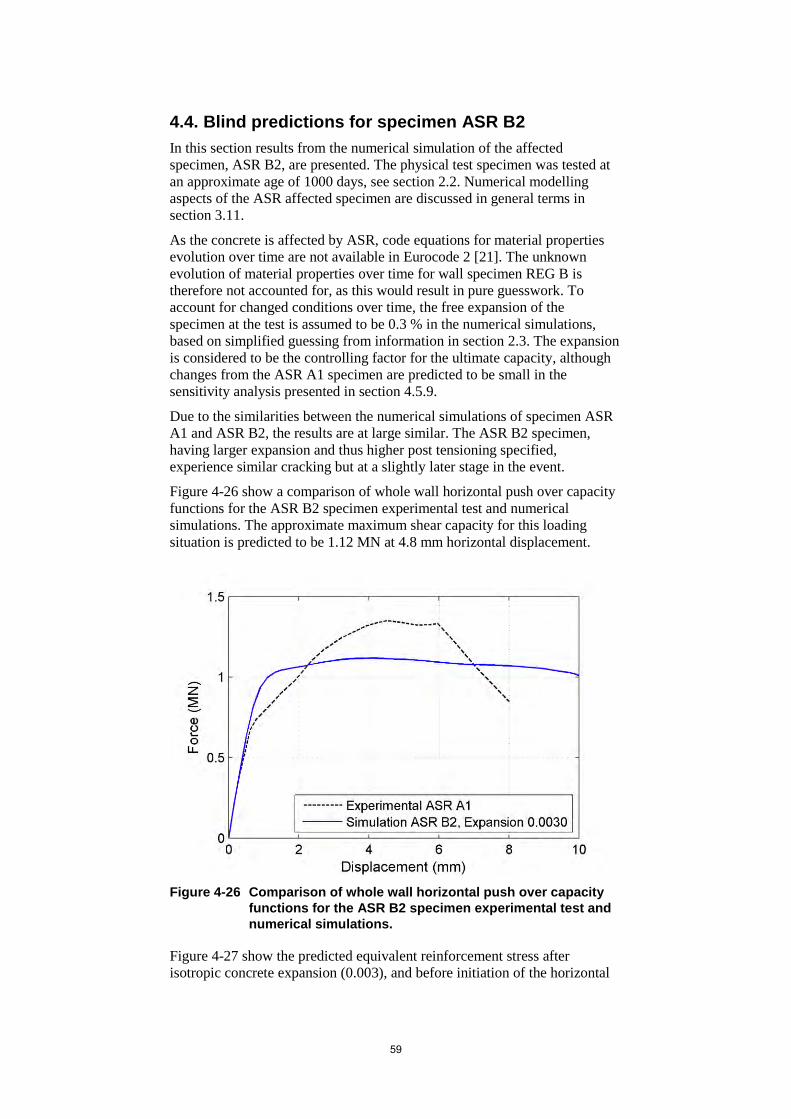
59
4.4. Blind predictions for specimen ASR B2
In this section results from the numerical simulation of the affected
specimen, ASR B2, are presented. The physical test specimen was tested at
an approximate age of 1000 days, see section 2.2. Numerical modelling
aspects of the ASR affected specimen are discussed in general terms in
section 3.11.
As the concrete is affected by ASR, code equations for material properties
evolution over time are not available in Eurocode 2 [21]. The unknown
evolution of material properties over time for wall specimen REG B is
therefore not accounted for, as this would result in pure guesswork. To
account for changed conditions over time, the free expansion of the
specimen at the test is assumed to be 0.3 % in the numerical simulations,
based on simplified guessing from information in section 2.3. The expansion
is considered to be the controlling factor for the ultimate capacity, although
changes from the ASR A1 specimen are predicted to be small in the
sensitivity analysis presented in section 4.5.9.
Due to the similarities between the numerical simulations of specimen ASR
A1 and ASR B2, the results are at large similar. The ASR B2 specimen,
having larger expansion and thus higher post tensioning specified,
experience similar cracking but at a slightly later stage in the event.
Figure 4-26 show a comparison of whole wall horizontal push over capacity
functions for the ASR B2 specimen experimental test and numerical
simulations. The approximate maximum shear capacity for this loading
situation is predicted to be 1.12 MN at 4.8 mm horizontal displacement.
Figure 4-26 Comparison of whole wall horizontal push over capacity
functions for the ASR B2 specimen experimental test and
numerical simulations.
Figure 4-27 show the predicted equivalent reinforcement stress after
isotropic concrete expansion (0.003), and before initiation of the horizontal

60
displacement push over event, for the ASR A1 specimen numerical
simulations. The reinforcement in the wall is at this point in non-linear
material response. The yield stress is defined to 430 MPa, as described in
section 3.5.2. No experimental data is available for comparisons and
verification of the predictions made at present time.
Figure 4-27 Predicted equivalent reinforcement stress after isotropic
concrete expansion (3 mm/m), before initiation of the
horizontal displacement, for the ASR A1 specimen
numerical simulations.
4.5. Sensitivity analyses
One major benefit of using numerical simulations is the possibility to quite
easily vary input parameters to study what-if-cases, something often called
sensitivity analysis. Results and conclusions from selected cases of such
sensitivity analyses will be presented here. Unless otherwise explicitly
specified, the base state model compared to the regular concrete (REG A)
model presented in section 3.6.
The general results show that numerical predictions for the studied shear
wall problem in some situations may vary quite much for varied simulation
input data. This result variability seems to arise due to differences in the
load-path, which are here most apparent as graphical interpretations of the
tensional damage parameter (here used as crack patterns). Initially stiffer
whole wall response, which is not always intuitive, sometimes result in less
ductile behavior.

61
4.5.1. Boundary conditions Numerical model boundary conditions most often have a significant impact
on simulation results, and are typically important model input parameters. In
the real world however, boundary conditions are rarely as straight forward as
what often is conveniently assumed in numerical simulations. To illustrate
the impact of two different cases of boundary condition assumptions for the
structure used within this report, this section is included. Another reason to
include this particular study is because no information, data acquired
concerning actual conditions at the experimental situations, are available.
Two extreme cases of rotational boundary conditions for the test specimen
upper beam are selected, and presented, here. The two cases are; fully
restrained in-plane rotations, and free rotation capability, as the base model
described in section 3.6.
The monotonic horizontal push over response for the two different boundary
conditions, and crack pattern, at 2.8 mm horizontal displacement, can be
seen in Figure 4-28. It is apparent from this figure that the restrained
rotational motion of the upper beam strongly governs the crack pattern
developed during the event. Instead of the combined effects of both shear
and in-plane moment, resulting in an inclined crack pattern and extensive
horizontal cracking at the base beam, for the unrestrained rotation (to the left
in Figure 4-28), the development of multiple shear cracks can be noticed for
the wall responding in shear only (to the right in Figure 4-28).
Figure 4-29 is included to show the gradual increased response at 1.6 and 5.2
mm horizontal displacement, for the wall having restrained in-plane rotation
at the top beam.
Figure 4-30 show a comparison of horizontal push over capacity functions
for the two different extreme cases of upper beam rotation restraints models.
Allowing in-plane rotations will result in a mixed mode shear and bending
failure. A significant increase in whole structure ultimate capacity can be
seen for the wall having restrained in-plane rotations at the top beam. This
effect is valid for both elastic and in-elastic structural response. Just as for
other parameters which increase the ultimate shear capacity, restrained
rotations may cause a more brittle and less ductile whole wall response.
It should be noted that the two selected cases are extreme cases, and the
actual behavior of the structures are likely somewhere in between this
behavior, but fairly close to the top beam free rotation condition. The applied
vertical load also governs this response, to some extent. Unfortunately, no
experimental data to confirm the actual experimental setup in this
perspective are at present time available.

62
Figure 4-28 Monotonic horizontal push over response and crack
pattern at 2.8 mm horizontal displacements for the free top
beam rotation (left figure), and restrained in-plane rotation
(right figure). Displacements are magnified 40x.
Figure 4-29 Monotonic horizontal push over response at 1.6 and 5.2
mm horizontal displacement, for the wall having restrained
rotation at the top beam.
Figure 4-30 Comparison of whole wall horizontal push over capacity
functions for the two different upper beam rotation
capabilities.

63
4.5.2. Solid element selection issues Within the work presented in this report, several types of solid element types
available in the ABAQUS/Explicit solver have been tested; C3D8R (8-node
brick element), C3D4 (4-node tetrahedron), and C3D10M (modified 10-node
tetrahedron). These element types are described in more detail in the
ABAQUS manual [4]. The reason for testing a variety of different element
types were originally observed deviations in non-linear response, compared
to the experimental results. The brick element model use element side
lengths of 25 mm, and the tetra mesh models are split mesh from that model.
Figure 4-31 show a comparison of whole wall horizontal push over capacity
functions for the various tested element types. The top beam was free to
rotate in-plane in all simulations, as this is expected to reflect actual
conditions well.
Solid and shell elements in the ABAQUS/Explicit solver use first order
(linear) reduced integration elements. For first-order elements including
reduced integration, hourglass control is required to avoid hourglass modes.
The reduced integration 8-node brick element, of type C3D8R, suffers from
such hourglass effects for the simulated shear problem, which normally may
indicate that a mesh refinement is required. In combination with the CDP
material model used, this result in a substantial swelling effect in the
thickness direction of the non-linear regions of the wall. This also result in a
much too soft response for the wall after crack initiation. As a result, these
brick elements are not selected for use for the final model.
Regular 4-node tetrahedron (type C3D4) elements are for many applications
considered to result in an overly stiff structure. In addition, the resulting
crack pattern formed a single diagonal band across the wall structure, which
did not reflect experimental experience. The elements were not used further.
Using modified tetrahedron (type C3D10M) elements as host elements for
the embedded reinforcement bars, only the corner nodes of the elements are
tied to the embedded elements, by software implementation. This may result
in a softer behavior than if all nodes of the element were used to tie the
embedded reinforcement elements. The importance of this feature is not
investigated. In the simulations carried out, the artificial strain energy was
kept at a moderate level. Together with a reasonable ultimate capacity, and a
realistic crack pattern, this element type was selected for further use.

64
Figure 4-31 Comparison of whole wall horizontal push over capacity
functions for tested element types.
4.5.3. Concrete fracture energy Numerical simulations carried out as part of the sensitivity analyses predict
that the concrete material Mode I fracture energy (GFI) influence the
ductility, and crack pattern, of the studied shear wall. The ultimate shear
capacity is not affected to the same degree, for the studied configurations.
The tabular definition method of the concrete uniaxial tension as a function
of crack width has been used in this work, as the two-parameter definition
(ultimate uniaxial tension and fracture energy) include a linear decay shape
of the tension stress. The inclusion of an exponential-type decay shape has
for some conditions been observed to be important, whereas for other
situations this has not been an important parameter.
Figure 4-32 show a comparison of horizontal push over capacity functions
for varied Mode I fracture energy of the concrete material. In the figure, it
appears as defining too high fracture energy cause an excessive ductility
capacity. The results may indicate that the used Mode I fracture energy,
supplied from experimental data (see section 2.3), are over estimated. This
may be one reason for the noted excess in ductility capacity in the REG A
base numerical model used in this report. However, altering other material
input simultaneously (not done here) may yield different results, which show
the importance of having well defined physical material model input
parameters, that are possible to determine experimentally. See discussion in
section 3.5.1. The comparison in the figure also show something seen
several times during the work within this project, that a seemingly logically
“weaker” model (here lower GFI) may during some stage exhibit a stiffer
behavior than a model that nominally should be “stronger”. This is here seen
as increasing GFI not consequently result in a higher capacity of the shear

65
wall, but the load paths, and crack pattern and propagation, may vary as a
result of the evolution of the wall response.
Numerical predictions of the different crack patterns, crack initiation and
crack propagation, for the studied cases are included below. The data shown
origin entirely from numerical simulations, and how much of the response
that are artefacts of the numerical implementation and material model, and
how much correspond to actual physical response is not possible to
determine currently. Experimental data to support, or reject, the predicted
behaviors are not available at present time. However, the numerical results
show that the shear loaded squat wall phenomena studied result in complex
stress/strain patterns, which may be quite sensitive to input variations.
Figure 4-32 Comparison of whole wall horizontal push over capacity
functions for varied Mode I fracture energy.
Figure 4-33 show visualizations of the monotonic horizontal push over
response at 0.8 and 5.0 mm prescribed horizontal displacement, for the wall
with a specified Mode I fracture energy of 60 N/m. Crack initiation start at
the lower left junction between the bottom beam and the wall, as for all the
other simulations. A 45-degree angle crack then form early in the event,
reaching from the lower right side of the wall, and up to the junction with the
top beam. This result in a triangle (base is upward) with primarily
compression stress at the upper right side of the wall. Tensional crack
progression then occurs along the lower left side of the wall, the left end
barbell wall, and along the diagonal of the main wall. The final crack opens
parallel to the initial 45-degree angle crack, crushing the lower base of the
right barbell side wall.

66
Figure 4-33 Numerically predicted crack patterns at 0.8 and 5.0 mm
horizontal monotonic displacement, for concrete having
Mode I fracture energy (GFI) 60 N/m.
Figure 4-34 show visualizations at 0.8 and 5.0 mm prescribed horizontal
displacement, for the wall with a specified Mode I fracture energy of 120
N/m. Crack initiation and progression is here somewhat different from the
case described above, in that the crack pattern consist of major cracks
primarily running along, or parallel to, the wall diagonal.
Figure 4-34 Numerically predicted crack patterns at 1.0 and 8.0 mm
horizontal monotonic displacement, for concrete having
Mode I fracture energy (GFI) 120 N/m.
Figure 4-35 show numerically predicted crack patterns at for the REG A test
specimen base model, having Mode I concrete fracture energy of 179 N/m.
The predicted crack pattern is here in general oriented at a larger angle than
the other models predict. Multiple parallel cracks progressively form at the
right (compressive) side of the wall. Ultimately, a band of cracks form along
the wall diagonal.

67
Figure 4-35 Numerically predicted crack patterns at 1.0 and 8.0 mm
horizontal monotonic displacement, for concrete having
Mode I fracture energy (GFI) 179 N/m.
4.5.4. Concrete compression side Experimentally derived data for the concrete materials indicate very high
ultimate compression capacity for the concrete materials used. A limited
study of the influence of the ultimate compression is included. Figure 4-36
show a comparison of horizontal push over capacity functions for varied
material ultimate compression in the numerical model.
The base numerical model has a specified ultimate compression of 79 MPa
(see experimental data in section 2.3), and the material assigned a low
compression have a specified ultimate compression of half of that. This is a
very big material parameter change, and the sensitivity study is carried out
on a conceptual level, not indicating that the lower ultimate compression
value must necessarily represent an actual concrete material, but more to
illustrate the importance of the compression side in terms of entire wall
capacity.
Simulation results for ultimate compression specified from an equivalent
cube test is also included. Here a rough assumption that the ultimate
compression from a cylinder test is approximately 80 % of that of a cube
test, has been used. Differences to the specified ultimate compression value
from cylinder tests are seemingly small, for the configuration in this
example, but may be important for other configurations. See section 3.5.1 for
further discussion on material model input.

68
Figure 4-36 Comparison of horizontal whole wall push over capacity
functions for varied material ultimate compression in the
numerical model.
4.5.5. Concrete elastic stiffness Experimentally derived data for the concrete materials indicate very high
elastic stiffness for the concrete materials used. A limited study of the
influence of the elastic stiffness is therefore also included. Figure 4-37 show
a comparison of whole wall horizontal push over capacity functions for
varied concrete material elastic stiffness in the numerical model.
The base numerical model has a specified elastic stiffness of 47 GPa (see
experimental data in section 2.3), and a model using a lower elastic stiffness
of 40 GPa has been included. This is a realistic material parameter change,
and illustrate the (low) importance of the elastic material stiffness in terms of
entire wall capacity.

69
Figure 4-37 Comparison of horizontal whole wall push over capacity
functions for varied concrete material elastic stiffness in
the numerical model.
4.5.6. Influence of vertical load The external vertical load has an influence on the ultimate shear capacity for
the studied shear problem. Figure 4-38 and Figure 4-39 show a limited
comparison of predicted horizontal push over capacity functions and crack
patterns for varied vertical load. The base simulation has an external vertical
load of 800 kN, and in the sensitivity analyses this load have been varied
with a value of ±200 kN, to show example result differences.
The most note-worthy result change is for the numerical simulations of the
decreased vertical load. The ductile behavior has here reached a threshold
value (cliff-edge effect) as the normal force were lowered. The resulting
failure mode is here predicted to be in the form of a distinct diagonal crack,
parting the wall in two relatively equal triangle shaped parts. The increased
vertical load seems to result in more evenly spaced crack pattern than the
case for the base simulation configuration, REG A. The predicted resulting
crack patterns are shown in Figure 4-39.

70
Figure 4-38 Comparison of horizontal whole wall push over capacity
functions for varied vertical load.
Figure 4-39 Numerically predicted crack patterns at 4 mm horizontal
monotonic displacement. Left figure show simulation
result for decreased vertical load, and right figure
increased load results.
4.5.7. Shell element model For engineering simulations of entire nuclear structures, practical aspects, as
for instance model size, and convenient concrete cross section output
availability, sometimes make shell element models an attractive option. To
consider this practical aspect of numerical model refinement level, shell
element models has been created to compare results, in terms of shear failure
mechanism and ultimate capacity, to the solid element model otherwise used
and presented in this report. The shell models are not described in much
detail here, but are created to be equivalent to the solid element base model
otherwise used in this chapter. To illustrate the effects of FE mesh
refinement, three different spatial discretizations are selected, using the S4R
71
4-node general purpose shell element with reduced integration and hourglass
control [4]. Element side lengths selected are; 100 mm, 50 mm, and 25 mm.
The upper beam is free to rotate, as the base model described in section 3.6
and 4.5.1. This free rotation result in a mixed bending and shear structural
response where the prescribed horizontal motion, translating the upper beam
to the right in the figures below, give tension on the left side and
compression at the right side in the figures.
The implementation of steel reinforcement modelling differs in the shell
model, from the solid element model. In the solid element model, discrete
bar elements are embedded into the solid elements, whereas in the shell
element model this approach is not supported. Instead, smeared rebar layers
are used. This result in a model in which reinforcement is available in every
concrete element, and localized effects from cracking are less pronounced.
Results from this study include the observation that even a fairly course
spatial discretization for the shell element model, to some degree, capture the
overall structural response, compared to models using short element sides.
Responses in the walls are initially elastic, until crack initiation at the tension
side (left in Figure 4-40) at the wall and lower beam junction. After that, a
diagonal crack area propagates from the wall upper left side to the lower
right (compression side), dividing the rectangular shaped wall into two
triangles, as the horizontal movement of the upper beam progress. In the
models using short element sides, an initial diagonal crack with an angle of
more than 45° form, but as the horizontal force increase an entire band of
such cracks develop, and the final horizontal crack span over the entire wall
width. This final diagonal crack then has a much more slanted angle. As the
lower end of the right end wall break in compression, the whole wall
structural capacity is rapidly decreasing. For course element discretization,
crack patterns are naturally smeared over a larger geometric area. As
element size decrease, crack patterns tend to be more localized, which can be
seen in Figure 4-40.
Figure 4-41 show a comparison of horizontal whole wall push over capacity
functions for the different tested spatial discretizations of the shell element
numerical model. For the studied load case, the in-plane shear motion
activates a considerable amount of artificial strain energy in the model due to
the element formulation of the 4-node reduced integration shell elements.
This result in unphysical non-linear responses in the numerical model for the
load situation, which is the major contributing factor to the discrepancy
between the observed numerical response and the experimental results. A
typical indication of this problem, coarse element discretization give a softer
structural behavior than fine element discretization, can be seen in the figure.
In addition, for the coarse 100 mm element side model, the whole structure
stiffness increase as damage progress, which is also an (un-physical)
indication of this effect. The effect of dominating artificial strain energy for
the problem may also result in an insensitivity to material parameter
changes, not seen when using the C3D10M elements to model the wall. In
conclusion, for the studied shear wall case, the used shell element modelling
technique result in the prediction of a low ultimate nominal shear capacity
for all the different spatial discretizations used, compared to the
experimentally measured capacity. However, structural ductility may be
overestimated, and a suitable ultimate shear deformation criterion should be

72
used to avoid this. As a consequence of the above, great care should be taken
when using the studied reduced integration shell elements result in non-
linear material response, for structural assessments of in-plane shear
dominated problems for squat concrete walls.
As a practical note, for the three-dimensional shell elements available in
ABAQUS/Explicit, transverse confining effects from ASR expansion are not
possible to model.
Figure 4-40 Monotonic horizontal push over response at 1 and 3 mm
horizontal displacement, for a wall shell model using
element side length 25 mm.
Figure 4-41 Comparison of horizontal whole wall push over capacity
functions for the different spatial discretizations of the
shell element numerical model.
4.5.8. Type of reinforcement modelling For the solid element model, two types of elements have been tested for the
steel reinforcement model of the concrete structure; truss elements (type

73
T3D2 [4]), and beam elements (type B31 [4]). The truss element of type
T3D2 is essentially equivalent to a spring element.
Normally truss elements, having the capability to transfer forces in tension
or compression only, are often used to model reinforcement in structural
assessments. For most applications, this is an appropriate approximation of
the steel reinforcement intended load transfer capability. Beam elements,
being computationally somewhat more expensive but capable to transfer
moment, are often not used because they are unnecessarily complex for the
task. However, in the case of a shear dominated load situation for a relatively
slender wall segment, and ultimate capacity evaluation, the beam element is
here considered a more appropriate element selection due to differences in
both ultimate capacity and crack patterns between the two modelling
alternatives. This difference has been noted to be small, or large, depending
on the specific problem conditions.
Figure 4-42 show an example comparison of horizontal push over capacity
functions for the two different reinforcement models. The models here
compare well until the damaged volume in the wall is unable to transfer
forces across the concrete material alone. For situations where this effect
becomes important, most likely localized concrete-reinforcement interaction
effects may also be of interest. The used numerical model does not include
any interface nor bond-effects.
Figure 4-42 Example comparison of horizontal whole wall push over
capacity functions for the two different reinforcement
model alternatives.
4.5.9. Confining effects - ASR concrete expansion General conditions for the used numerical modelling of ASR effects are
discussed in section 3.11. In the used numerical model, all concrete volumes
including the elastically modelled upper and lower beams, are assumed to be

74
of the same reactive concrete type concerning the expansion. Uniform and
isotropic material expansion is used in this study.
The effects of including the ASR concrete expansion, to capture confinement
effects, has been studied for the shear wall configuration under investigation.
The over-all effects on structural shear resistance of ASR affected structures
are not straight forward for the general case, but determined by material
strength losses, combined with the possible positive effects of structural
element confinement from material swelling in combination with structural
element restraints. The structural element restraints are here limited to the
reinforcement, as no external boundary conditions are applied (model free to
uniformly expand during expansion phase).
A few different uniform and isotropic material expansion ratios have been
simulated, ranging from 0.05 %, to 0.3 % (see section 3.11), using the
experimentally derived material parameters of the ASR A1 test specimen
(see Table 2-1). In addition, expansion up to a very large value of 1 % has
been simulated, to study the potential effects for the wall of this extreme.
Figure 4-43 show a comparison of horizontal whole wall push over capacity
functions for different ASR expansions. Expansion up to around 0.3 %
increase the ultimate capacity of the shear wall in this limited study. Around
that level of expansion, the reinforcement steel utilization become a limiting
factor for the wall, and further expansion become negative for the wall
ductility, and to a lesser extent for the ultimate capacity. This seem natural,
as the yield stress often is related to the 0.2 % strain value. It appears as very
large expansion is needed for the reinforcement to become a limiting factor.
For practical applications, the long-term confining effect may decrease due
to relaxation of the reinforcement steel. Note that no material parameters
have been adjusted in this numerical study.

75
Figure 4-43 Comparison of horizontal whole wall push over capacity
functions for the different ASR expansions.
4.5.10. Influence of dilatation angle The dilation angle of the material model alters the volumetric behavior of the
material model, and has an influence on the studied shear wall problem. The
dilation angle ψ is measured in the p-q plane at high confining pressure, and
indicates the ratio between the volume change and the shear strain. The
dilation angle value for concrete is commonly specified in the range of 30°
to 40°, according to [4]. This material model input parameter is considered
difficult to experimentally determine, and is not by any means a usual
material parameter to determine for concrete. See sections 3.4.2 and 3.5.1 for
further discussions.
The angle is chosen to be 38° for the base simulation otherwise used in this
report, based on the work in [4]. In the sensitivity analyses carried out this
value have been varied between 10° and 56°, to show example result
differences. Figure 4-43 show a limited comparison of predicted horizontal
push over capacity functions for varied input values of the dilation angle. It
is concluded that the maximum shear force capacity of the wall seems to be
less sensitive for variations of the dilation angle input parameter than the
evolution of whole wall force-displacement function.
The most note-worthy result change is for numerical simulations of chosen
dilation angles between a range below and above around 34°. The resulting
crack pattern and failure mode is in this range predicted to be substantially
different for small changes of this parameter. Numerically predicted
resulting crack patterns are shown in Figure 4-44. The two very different

76
responses of the shear wall seem to develop already in the earliest states of
non-linear response, and the initial stress field is believed to have a great
influence on the yield surface and this behavior. Whether this is purely a
numerical feature, significant to the used material model, or if it may also be
experimentally confirmed, is not known at present time. This issue is noted
for this studied shear wall problem, and considered a great concern, but not
pursued further within the work presented in this report.
Figure 4-44 Comparison of horizontal whole wall push over capacity
functions for selected input values of the dilation angle.
Figure 4-45 Numerically predicted crack patterns for horizontal
monotonic displacement. Left figure show simulation
result for dilation angle set to 35°, and right figure 33°.

77
4.6. Comparisons to conventional design
4.6.1. Introduction To assess design code margins for the studied case, experimental and
numerical results are compared to a limited set of conventional design code
shear capacity. For Swedish conditions design code is selected according to
recommendations in the design guide DNB [24]. The studied wall was
designed using code equations for shear friction, according to [2]. However,
the studied experimental test specimens were constructed (cast) in one piece
with no division into different casting parts during construction.
There are no specific design code provisions for squat reinforced concrete
shear walls included in the Eurocode EC2 [21], nor EC8 [25], design codes
[26]. It should also, in this context, be mentioned that Eurocode for seismic
design, EC8 [25], explicitly does not apply to nuclear structures.
Code calculations in this section include regular, e.g. non-ASR affected,
structures only, as no code equations for ASR degraded nuclear structure are
currently available. Concrete material properties used in the calculations
reflect equivalent design values estimated based on the 28-day experimental
material data presented in section 2.3. The favorable compressive vertical
force of 800 kN is accounted for in the calculations.
4.6.2. Result summary The design code shear capacity according to section 6.2.5 in EC2 is
calculated to 1360 kN for the wall as a whole (see section 4.6.3).
Conservatisms lowering the capacity include the decrease of the parameter c
by a factor of 2 (dynamic loads), and a conservative assumption of active
wall reinforcement in the barbell end walls, see section 4.6.3. The fact that
this value still exceeds the experimentally measured shear force capacity
(see Table 4-1) may come from the actual load situation in the experiments,
and the resulting fracture mode, as this appears to have been a combination
of shear and a bending moment. This due to the unrestrained in-plane
rotation of the top beam as discussed in section 4.5.1 and visualized in
Figure 4-2. This load situation is quite different from an assumed uniform
shear stress in the capacity calculations. Nevertheless, this loading situation
may be realistic for a shear wall as the one studied, and the code equation
capacity here exceed the experimentally derived capacity of the studied wall.
Using the shear friction design option is consequently non-conservative, and
not recommended for the studied design situation.
The beam shear capacity for a compressed section, VRd,c is calculated to 230
kN for the studied case (see section 4.6.4). This value is considerably lower
than the value obtained using the formula for shear friction, partly due to the
uncertainty in the shear fracture mode, and considered a lower bound value
for the shear capacity. This calculated shear capacity is also considerably
less than the experimentally derived shear capacity.

78
4.6.3. Shear friction in SS-EN 1992-1-1 No explicit design code provisions for shear capacity of reinforced concrete
squat shear walls are included in the Eurocode 2 (EC2) [21]. However, in
line with the work presented in [26], section 6.2.5 of EC2, “Shear at the
interface between concrete cast at different times”, may provide an
approximation of the design shear capacity between the wall and base beam
part of the specimen. This EC2 design provision showed the highest
sensitivity to the wall normal stress (vertical load) of the design equations
studied in [26], and the highest shear capacity, regardless of concrete
strength or reinforcement content in the wall. The fracture mode considered
is an even shear fracture along the entire casting interface.
To derive a conventional design shear capacity per EC2, a concrete quality
class of a fairly high strength concrete, corresponding to C45/55 according
to Table 3.1 in EC2, is assumed here for the calculations. This choice is
based on the 33-day test results presented in [13], where the cylinder
strength is given to 53 MPa. Calculations of the shear capacity using the
shear stress at the interface between concrete cast at different times, section
6.2.5 of EC2, are included below.
vRdi is the design shear resistance at the interface, given by equation 6.25 in
EC2:
vRdi = c fctd + μ σn + ρ fyd (μ sin α + cos α) ≤ 0.5 ν fcd
The design shear resistance in this equation consist of three parts, governed
by; 1) the design concrete tensile strength (c fctd), 2) the normal stress at the
interface (μ σn), and 3) the reinforcement crossing the interface (ρ fyd). With
values discussed below, vRdi is calculated to 8.85 MPa for the studied case.
This in turn give a whole wall design shear force capacity of (V = vRdi x Ai)
1360 kN. Design shear resistance per equation 6.25 in EC2, divided into the
different parts of the equation are shown in Table 4-2. Values used in
equation 6.25 in EC2 are presented below. It is noted from the values in the
table that the vertical load and the reinforcement content have large impacts
on the wall capacity, and the tensile strength influence less.
Table 4-2 Design shear resistance per equation 6.25 in EC2, divided
into the different parts of the equation.
Shear resistance part of equation 6.25 in EC2 [21]
Shear stress at interface (MPa)
Shear force at interface (kN)
Design tensile strength dependent part 0.56 87
Normal stress dependent part 4.77 734
Reinforcement dependent part 3.52 542
Summary 8.85 1360
Calculation input variables
The two factors depending on the roughness of the interface, c is set to 0.5,
and μ to 0.9, to obtain the maximum allowable shear transfer capacity, as the
section considered is not an actual construction joint, but rather cast at one

79
time. Under fatigue or dynamic loads, the values for c in should be divided
by a factor of 2 (i.e., c = 0.5 / 2 = 0.25). The used reduction of c reduces the
wall shear capacity.
The design compressive strength, fcd = αcc fck / γC = 37.5 MPa (equation 3.15
in EC2), is calculated as defined in section 3.1.6 (1)P, where fct is 45 MPa.
αcc is a coefficient taking account of long term effects on the compressive
strength and of unfavorable effects, resulting from the way the load is
applied. The recommended value in the National Annex is 1.0. The partial
factor for the reinforced concrete material for ultimate limit state in an
accidental design situation, γC, is 1.2, according to Table 2.1N.
The design tensile strength, fctd = αct fctk,0.05 / γC = 2.25 MPa (equation 3.16 in
EC2), is calculated as defined in section 3.1.6 (2)P, where fctk,0.05 is 2.7 MPa.
αct is a coefficient taking account of long term effects on the tensile strength
and of unfavorable effects, resulting from the way the load is applied. The
recommended value in the National Annex is 1.0.
Ai is the area of the joint/interface (0.154 m2), here calculated as the wall
section width (bi = 0.1 m) times the wall length (1.3 m), and including the
thickness of the barbell end walls (2 x 0.12 m). The wall length lw, is then
1.54 m. Barbell sections outside of the wall thickness is disregarded from
here, although this material does contribute slightly to the structural
capacity. Geometric dimensions of the test specimen are visualized in Figure
2-1.
σn is stress per unit area caused by the minimum external normal force
across the interface that can act simultaneously with the shear force, positive
for compressive forces. The normal stress is calculated as the total vertical
force divided by the interface area. The vertical forces at the lower wall-
beam interface are the external vertical force (800 kN) plus the weight from
the wall and the top beam (16 kN), in all 816 kN. σn is then calculated as 816
/ Ai = 5.3 MPa. This stress is considered relatively high, and at the end
contribute considerably to the final shear capacity of the wall.
As is the area of reinforcement steel crossing the interface. In all, 20
vertically oriented M10 reinforcement bars exist in the wall, 12 bars in the
actual wall element, and 4 bars in each of the two barbell end walls. The
reinforcement here considered is the reinforcement of the wall element only,
as this reinforcement is evenly distributed over the wall length. However, in
practice, the vertical reinforcement of the barbell sections interacts with the
wall and do increase the capacity to some extent. The radius of each M10 bar
is 5.65 mm. As is then 12 cm2. In case all 20 bars are considered, As would
increase to 20 cm2, and the shear capacity of the structure would increase.
The reinforcement ratio, ratio between steel and concrete cross section area,
ρ, is calculated as: ρ = As / Ai = 0.0012 / 0.154 = 0.0078
The reinforcement steel design yield stress, fyd, is defined as fyd = fyk / γS. fyk
is here set to 500 MPa. The partial factor for the reinforcing steel material
for ultimate limit state in an accidental design situation, γS, is 1.0, according
to Table 2.1N in EC2. fyd, is then 500 MPa.
The condition that vRdi ≤ 0.5 ν fcd (11.1 MPa) is fulfilled. ν is a strength
reduction factor for concrete including shear cracks (see section 6.2.2 (6) in
EC2), calculated as (equation 6.6N) ν = 0.6 (1 – fck / 250) = 0.59.

80
The angle of reinforcement, α, is 90 degrees relative to the interface surface.
4.6.4. Beam shear capacity SS-EN 1992-1-1 As a lower bound of the design shear capacity, section 6.2.2 of EC2 [21],
“Members not requiring design shear reinforcement”, is used as a
complement to the calculations above. This expression is valid for beam type
of structural members, which this wall not fulfill the geometric properties of.
In addition, the expression does not consider the capacity increase due to
shear reinforcement.
The shear resistance of regions cracked in bending, of prestressed single
span members without shear reinforcement, may be calculated using the
expression (6.2a in EC2):
VRd,c = [CRd,c k (100 ρI fck)1/3 + k1 σcp] bw d
With values discussed below, VRd,c is calculated to 230 kN for the studied
case.
The calculation input variables used in the formula above (expression 6.2a in
section 6.2.2 of EC2) are specified in section 4.6.3 above and therefore nor
repeated here.
4.6.5. Numerical simulation capacity comparison To compare the design code equation shear capacity to the predicted shear
capacity using numerical simulation, a simulation using 28-day material
parameters corresponding to the EC2 C45/55 concrete was carried out. This
information is given as a compliment to the result otherwise given in this
report, where best estimate material input are used for the numerical
simulations.
Concrete strength values used are given above. The elastic stiffness was set
to 36 GPa, according to EC2. The concrete material was assigned a mode I
fracture energy of 107 N/m for the used material model in the numerical
simulation. Guidance for this material model parameter is not available in
EC2.
Figure 4-37 show a comparison of horizontal whole wall push over capacity
functions between the experimental results, numerical results for the best
estimate material, and the EC2 design code based C45/55 concrete material
in the numerical model. The ultimate shear capacity of the studied wall is
here 860 kN, using EC2 code based material input values for the numerical
simulation. This value is concluded to result in a conservative estimate
compared to code equations and experimental results.

81
Figure 4-46 Comparison of horizontal whole wall push over capacity
functions between the experimental results and numerical
results for the best estimate material and the EC2 design
code based C45/55 concrete in the numerical model.

82

83
5. Discussions
5.1. Overview comparisons between experimental and numerical results
Shear response of reinforced concrete structures include complex stress
states, and a combination of experimental testing and numerical simulations
may significantly increase the understanding of the phenomenon involved.
In this report, presented results indicate a capability of the used numerical
tool (ABAQUS/Explicit and CDP material model) to simulate the
experimentally observed effects of advanced non-linear material behavior
for a monotonic shear load event, see section 4.1. For a cyclic load event, the
numerical prediction capability of the studied shear problem seems to be less
satisfactory, depending on spurious features of the used material model.
The intentions for the numerical simulations have been to accept
experimentally derived and delivered material properties as is, and to
consider these values best estimate material properties, without modifying
these. Some questions related to experimentally derived material properties
do however remain, and possibly the preformed sensitivity analyses indicate
that different material property input would result in better correlation
between experimental and numerical results. This path has however not been
pursued, as experimental data and results are not statistically assured, and the
experimental data has been considered as indicative results. This non-
adjustment of the material model input to some extent explains the ductile
behavior seen in many the numerical simulations, when compared to
experimental results.
In addition, the use and acceptance of the commonly accepted material
parameters as input for numerical simulations is also an open question,
which is perhaps mostly interesting in the case of best-estimate numerical
simulations (as opposed to a design situation, where conservative
assumption are targeted). The only parameter investigated in some depth is
here the use of the ultimate compressive stress from cylinder test specimens
(see section 3.5.1). This is concluded not to be a material parameter, but a
combined value from both material and specimen geometric shape, which
can never be considered a material parameter to be used in a constitutive
model. Instead, the compressive strength from cube specimen tests appear to
be close to a true material parameter. For a design situation, the lower
ultimate compression value produced by using cylinder specimen tests,
instead of cube tests, may for most situations be considered a reasonable
conservative approach for structural assessments. The same type of material
model input assessments must however be made for all other input material
parameters used, to provide the possibility to make informed decisions when
selecting model input.
Another very important, and not resolved issue, is the question of the exact
interactions with surrounding structures and loading equipment during
physical testing. This issue has been proven to affect numerical simulation
output to a certain degree, and need to be understood quite well. This is an

84
observed factor of uncertainty in the comparisons between experimental and
numerical results.
5.2. Relevance for assessments of an actual NPP structure
The studied, reduced scale, 100 mm thick shear wall specimens used in the
experiments include a single layer of orthogonal web reinforcement, located
at the wall center surface. For the ASR affected concrete walls in the
experiments this mean no, or very little, confining pressure in the wall
thickness direction. This reinforcement design differs from current design
practice of reinforced concrete walls in safety related structures at nuclear
power plants, but may agree better with the design of structures at some
existing plants.
The purpose of this numerical work is however to study to what extent the
results produced by the used numerical tool compare to experimental results,
to evaluate the suitability of the used numerical method for shear wall
problems. In doing this, the limited amount of experimental results, not
being statistically assured, should also be kept in mind. At a whole, it
appears as the ultimate capacity in this shear wall problem may be predicted
satisfactory, and crack patterns and the failure mode compare reasonably
well in visual comparisons. The ductility of the wall for some input choices
have been overestimated, which is a concern, and in practical cases some
strain limitation criteria may be used to prevent this.
5.3. Comparisons to design code shear capacity
A limited study, including EC2 only, to assess conventional design code
margins compared to experimental and numerical results for the studied
case, were included in this work (section 4.6). It is concluded that the design
shear friction code equation capacity exceeds the experimentally derived
shear capacity of the studied wall. The reason for this is different load and
fracture mode assumptions. It is recommended that further work along this
direction is pursued, preferably including also nuclear codes ASCE 43-05
[27] and ACI 349 [28].
5.4. Comparisons between regular and ASR affected structure
The experimental observations of the ASR affected structures, here meaning
the increase in shear capacity although having a weakened material (see
sections 2.3 and 2.6), were numerically confirmed, even for the simplified
engineering approach used. Conceptual differences were studied and
explained as mainly resulting from confinement effects due to the internal
swelling induced by the chemical reactions. See sensitivity analysis in
sections 4.5.9 and 4.3. The confinement effect origin from the post stressing
of the embedded reinforcement steel, not from boundary concrete elements.

85
5.5. Numerical shear wall result variability
It is noted in the numerical sensitivity analysis (section 4.5) simulations that
sometimes fairly small input changes result in noticeable changes in output
(wall response primarily in terms of crack pattern and wall ductility). An
increase in shear capacity have for some situations been noted to
simultaneously result in a decrease in whole wall ductility, which for some
situations may be unfavorable. The working hypothesis for this result
variability is that for this quasi-brittle material, the load path and progression
over the event is dependent on the formation of initial crack pattern and
crack propagation. This variability effect has been noticed on several
occasions before, both for experimental and numerical work [8].
5.6. Experimental result variability
Variability in experimental results are not investigated in the test campaign,
as only one test specimen of each configuration was tested (see section 2.2).
This situation is noted, and experimental data are regarded as indicative
only.
5.7. Wall ultimate ductility capacity
The precise determination of the ultimate displacement (ductility measure) is
non-trivial, and some criteria should ideally be used for evaluating this
parameter. In the evaluations of this parameter within this report, a
subjective approach is used, based on when the ultimate diagonal crack is
formed. It should be noted that for implicit FE methods, the ultimate
displacement capacity is not the same as non-convergence of the solver.
5.8. Boundary conditions
Because of what seems to be a free, almost unrestrained, rotation of the top
beam during the experiments, pure shear response of the wall is not achieved
at the physical tests. Instead, an in-plane bending motion develop, and a
mixed mode failure is obtained. This phenomenon is clear from the
boundary condition sensitivity analysis presented in section 4.5.1. The
effects from this can easily be implemented in a numerical model, but
choosing the correct design code equations to adjust for this response may
not be as straight forward.
5.9. Sensitivity analysis
The studied shear load problem is a good example of the benefits of using
sensitivity analysis for practical engineering problems. The variability of the
problem results has shown that important cliff-edge effects may be
discovered using varied input, and using sensitivity analysis are considered
to be of good engineering practice.

86
5.10. CDP material model used
The CDP material model seems to capture the monotonic loading well for
this type of shear wall problems. Responses for cyclic loading of this squat
wall is however less satisfactory for this shear dominated problem.
The used CDP material model is quite complex, as virtually all other existing
non-linear material models, and include several non-intuitive input
parameters. When using such a model for practical cases, specialist
knowledge is required. In addition, sensitivity analyses may help in
understanding the implications of various input options chosen for the
specific situation. This may however not be entirely sufficient, and
comparative validation examples for the load situations analyzed should
preferably be available.
5.11. Requirements on material model input data
It has not been possible, within the work presented in this report, to in detail
investigate requirements on experimentally derived material test data and
relevant test methods for the material input parameters needed for the used
material model. However, it is concluded that well informed decisions need
to be made and justified for all material model input parameters. Using
experimentally derived material parameters, it is important to be aware of
what is an actual material parameter, appropriate as material model input,
and what is merely considered to be a material property by force of
conventional practice.
5.12. Reinforcement steel modelling
The non-linear response of the reinforcement steel material is modelled in a
rough fashion here, using an idealized plastic behavior. This may have a
slight effect of the ultimate capacity, and more so on the ultimate ductility.
The effects of this is not pursued within the scope of the work presented in
this report.
Reinforcement bars are here modelled using bar elements (including bending
stiffness), instead of using truss elements (transfer force along element only),
as this for some configurations proved to be an important factor for both the
crack pattern and ultimate ductility in the numerical wall simulations. Using
truss elements consistently resulted in lower ductile capacity for the affected
configurations, which is then considered to result in a conservative ductile
prediction.
It should also be noted that the bond interaction between the concrete
volume and the reinforcement bar model is completely tied together. This
may be important for the numerical results, and maybe primarily so for the
ASR affected models. The incorporation of bond-slip effects into a
numerical model is non-trivial, and not regarded as current common
engineering practice.

87
6. Conclusions The ability of the Concrete Damaged Plasticity material model in ABAQUS
to simulate the behavior of the studied shear wall were investigated, and
found to be reasonably adequate in the case of monotonic pushover loading,
for the studied shear dominated problem. For a simulation of the reverse
loading cyclic event, numerical result comparison to experimental results is
however concluded to be less satisfactory. The reason is mainly due to the
basic nature of the used material model, which does not mimic the behavior
of real-world reinforced concrete well for this type of loading condition,
although this approximation has been proven to work well for other loading
situations.
It should be noted that only a limited amount of information concerning the
experimental test results are known to the ASCET Phase 2 benchmark
participants. In addition, due to both the unresolved questions regarding the
given experimental results for the reference shear wall specimen (discussed
in section 2.6), and unknown interactions and boundary conditions as well as
used material model input, it is considered not possible to in full validate that
the used numerical model satisfactory reflect the actual experimental test
setup.
The research project participation has however resulted in the following
observations and conclusions, mainly concerning numerical simulations of
the studied squat shear wall:
1. General: Not ignoring the statements concerning validation of
models in [29], it appears as if the general structural behavior of the
numerical model monotonic push over load simulations of the
studied shear wall compare well to the limited experimental results
available. The maximum shear force capacity of the wall seems to
be predicted with better accuracy than the evolution of whole wall
force-displacement function. The general response and failure of
reinforced concrete shear walls may consequently be simulated with
some level of confidence, using similar configurations of finite
element analyses. It should be noted that the non-linear shear
response of the squat wall studied appear to be quite complex, and
sensitive to several of the model input parameters, both material,
loads and restraints.
2. Experimental result comparison: Numerical simulation results
confirm the experimental observation that ASR affected wall
specimens, although having nominally weaker material properties,
may possess a higher ultimate capacity than a structure with regular
concrete material. This appear to be the result of confining effects
resulting from the concrete ASR material expansion. Numerical
sensitivity studies, based on evenly distributed isotropic material
expansion and limited to the studied structure, indicate that the
positive confining effects may increase the shear capacity up to
material expansion levels beyond the reinforcement steel yield

88
strain. Experimental validation of this is yet to be confirmed.
3. Material input: Due to the very complex structural response of the
wall for the shear load, quite different crack patterns, and failure
modes, may develop for seemingly small variations in structural or
material input. In addition, all of the required material input
parameters needed for advanced numerical models are seldom
experimentally derived. To further complicate the situation, material
tests conventionally used and normally considered to produce
material specific parameters, including the characteristics of the
material only, must be challenged and investigated if appropriate as
numerical material model input. For example, the use of concrete
compressive strength from tests on cube specimens in the concrete
damaged plasticity constitutive model seems to be most appropriate,
for a best estimate simulation of the physical response of concrete
structures. This as compressive strength derived from testing of
standard cylinder specimen are the combined result of the material
and the geometry of the specimen tested. For design code based
simulations of actual structures, the conservatively lower cylinder
specimen derived values given in the codes should be used. For the
example problem studied here, unresolved questions regarding the
suitability as numerical model input of the given material properties
from material tests, remain. Shear load situations seem to be more
sensitive to material input than situations dominated by bending
moments. The use of sensitivity studies when numerical simulation
tools are used in design situations are recommended.
4. Ultimate shear capacity: The wall ultimate shear capacity was
consistently underestimated in the numerical monotonic push over
simulations, compared to available experimental data. This means
that the wall structural capacity may be predicted in a conservative
way, as the predicted shear capacity is less than in the experiments.
However, using this numerical technique and the concrete damage
plasticity material model for dynamic events, where high
accelerations are capacity limiting, meaning to derive floor response
spectrum for systems and components in nuclear structures, the used
technique may result in non-conservative results.
5. Design code margins: It is concluded that shear capacity,
calculated as per section 6.2.5 in EC2, exceeds the experimentally
derived shear capacity of the studied wall.
6. Boundary conditions: The global boundary conditions and
interactions, as restraints on the top specimen beam, are important to
model correctly. Restrained in-plane rotation of the top beam
significantly increase structural maximum shear stiffness for the
specimen. Allowing in-plane rotations will result in a mixed mode
shear and bending failure. Just as for several other parameters which
increase the nominal value of the maximum shear capacity,
restrained rotations (which increase the maximum shear capacity)
cause a more brittle and less ductile whole wall response. No

89
information concerning the actual experimental conditions are
currently available.
7. For Swedish conditions, compiled operational experiences [5] for
nuclear reactor containments include no instances of suspected or
confirmed ASR at units still in operation. Consequently, with current
knowledge, AAR related problems should be of no practical concern
for nuclear reactor containments in Sweden.
8. Material model: The concrete damaged plasticity (CDP)
constitutive model in ABAQUS is found to work reasonably
adequate for the simulation of the failure modes investigated, for a
monotonic pushover load. However, careful specification of the
material model input parameters is essential for this shear load
situation, to a higher degree than for other types of loading
conditions. For reversed load cycles, in combination with
progressive non-linear material response, the response and
associated plasticity induced swelling of elements appear to produce
unphysical results.
9. Reinforcement modelling: The sensitivity analysis show that
reinforcement modeled using beam elements, as an alternative to
truss elements, for some configurations proved to be an important
factor for both the crack pattern and ultimate ductility in the
numerical wall simulations. Using truss elements consistently
resulted in lower ductile capacity for the affected configurations,
which is then considered to result in a conservative, less ductile,
prediction.
10. Element type selection: This section may be particularly specific to
element implementations in ABAQUS software. Sensitivity analyses
show that 8-node reduced integration brick elements (C3D8R) were
inappropriate for the studied in-plane shear dominated problem. This
was also concluded to be the case for the 4-node reduced integration
shell element (S4R). For these element types, excessive amounts of
artificial strain energy resulted from the imposed in-plane shear
deformation in the wall. First order four-node tetrahedron elements
(C3D4) are usually considered to result in overly stiff structural
response, which were confirmed in the elastic range. The 10-node
modified tetrahedron element (C3D10M) performed well both in the
elastic range, and resulted in conceivable crack patterns, although
this has not been possible to in detail confirm with experimental
data. The element type was finally considered the better element
choice for the simulations. The used characteristic element length
was approximately 25 mm for this 100 mm thick wall.

90

91
7. Acknowledgement Our participation in the OECD/NEA/CSNI ASCET CAPS is financially
supported by the Swedish Radiation Safety Authority (SSM). This support is
much appreciated.

92

93
8. References
[1] OECD/NEA/CSNI, Final Report of ASCET Phase 1, 2016.
[2] N. Orbovic, D. Panesar, S. Sheikh, F. Vecchio, C. Lamarche and A.
Blahoianu, "Alkali Aggregate Reaction in Nuclear Concrete Structures,
Part 1: A Holistic Approach," Transactions SMiRT-23, Division I,
Paper ID 202, Manchester, United Kingdom, August 10-14, 2015.
[3] B. Thunell, "Bedömning av degraderade betongkonstruktioner,
Assessment of structures subject to concrete pathologies (ASCET),"
SSM publikation 2015:50, Report number: 2015:50 ISSN: 2000-0456,
http://www.stralsakerhetsmyndigheten.se/, 2015.
[4] Dassault Systémes, "Abaqus Documentation, Version 6.14," 3DS
Simulia, 2015.
[5] B. Thunell, "CONSAFESYS - Barsebäck NPP, Main Project Summary
Report," Report SCTE/09416/B1:R-06, Revision 0, 2015-10-20.
[6] J. Tcherner and T. S. Aziz (Atomic Energy of Canada Limited), Effects
of AAR on Seismic Assessments of Nuclear Power Plants for Life
Extensions, Division 7, Paper 1789, SMiRT 20, Augist 9-14 2009.
[7] Anca-Cristina Jurcut, "Modelling of alkali-aggregate reaction effects in
reinforced concrete structures (Master thesis)," University of Toronto,
Department of Civil Engineering, 2015.
[8] Saouma, V.E., et al., Effect of alkali–silica reaction on the shear
strength of reinforced concrete structural members. A numerical and
statistical study, Nucl. Eng. Des. (2016),
http://dx.doi.org/10.1016/j.nucengdes.2016.10.012.
[9] A. Farhang, Inverkan av ASR på betongens bärförmåga En
litteraturstudie, Energiforsk rapport 2016:256, 2016.
[10] D. Panesar, S. A. Sheikh and F. J Vecchio, "Details of two walls tested
under axial load and lateral cyclic excursion," E-DOCS-#5015738-v1-
ASCET_Phase_II_Input_Data.pdf, SAS20160605.
[11] D. Panesar, S. A. Sheikh and F. J Vecchio, "Addendum to Report
SAS20160605 related to sizes of specimens for material properties,"
June 26, 2016.
[12] D. Panesar, S. A. Sheikh and F. J. Vecchio, "Mix Design for concrete
shear walls," SAS20160609.

94
[13] B.P. Gautam, D.K. Panesar, S.A. Sheikh, F. J. Vecchio, and N. Orbovic,
"Alkali Aggregate Reaction In Nuclear Concrete Structures: Part 2:
Concrete Materials Aspects," Transactions, SMiRT-23, Division I,
Paper ID 043, Manchester, United Kingdom, August 10-14, 2015.
[14] F. Habibi, S. A. Sheikh, N. Orbovic, D. K. Panesar, and F. J. Vecchio,
"Alkali Aggregate Reaction In Nuclear Concrete Structures: Part 3:
Structural Shear Wall Elements," Transactions, SMiRT-23 Division I,
Paper ID 044, Manchester, United Kingdom, August 10-14, 2015.
[15] A. C. Jurcut, F. J. Vecchio, S. A. Sheikh, D. K. Panesar, and N.
Orbovic, "Alkali Aggregate Reaction In Nuclear Concrete Structures:
Part 4: Modelling And Analysis," Transactions, SMiRT-23, Division I,
Paper ID 045, Manchester, United Kingdom, August 10-14, 2015.
[16] S.A.Sheikh (University of Toronto), Shear Wall Elements (Presentation
at ASCET Phase 2 Workshop in Ottawa), May 8 2017.
[17] A. Sellier (Université de Toulouse), V. Saouma (University of
Colorado, Boulder), S. Multon (Université de Toulouse), Y. Le Pape
(Oak Ridge National Laboratory), N. Orbovic (Canadian Nuclear Safety
Commission), "RILEM Technical Committee 259-ISR, ASR Prognosis
of deterioration and loss of serviceability in structures affected by
alkali-silica reactions, WG 2 Benchmark/Round Robin Analyses," v. 1,
January 2016.
[18] Center for Transportation Research at the University of Texas at Austin,
Non-Destructive Evaluation of In-Service Concrete Structures Affected
by Alkali-Silika Reaction (ASR, or Delayed Ettringite Formation (DEF)
- Final Report , Part I, Report FHWA/TX-13/0-6491-1, 2012.
[19] J. Lee and G. L. Fenves, "Plastic-Damage Model for Cyclic Loading of
Concrete Structures," Journal of Engineering Mechanics, vol. 124, no.8,
pp. 892–900, 1998.
[20] J. Lubliner, J. Oliver, S. Oller and E. Oñate, "A Plastic-Damage Model
for Concrete," International Journal of Solids and Structures, vol. 25,
pp. 299–329, 1989.
[21] Swedish Standards Institute, SS-EN 1992-1-1:2005, Eurocode 2:
Design of concrete structures - Part 1-1: General rules and rules for
buildings, 2005 with corrections and national amendments.
[22] M.R.A van Vliet and J.G.M van Mier, Softening behaviour of concrete
under uniaxial compression (Proceedings FRAMCOS-2), Stevin
Laboratory, Delft University of Technology, 1995.
[23] B. Lagerblad, J. Trägårdh, Alkalisilikareaktioner i svensk betong, ISSN

95
0346-8340, CBI rapport 4:92.
[24] Swedish Radiation Safety Authority (SSM), "2015:25 Design Guide for
Nuclear Civil Structures (DNB)," 2015.
[25] Swedish Standards Institute, SS-EN 1998-1:2004/AC:2009, Eurocode
8: Design of structures for earthquake resistance – Part 1: General rules,
seismic actions and rules for buildings, 2013-02-27.
[26] N. Orbovic, et. al., The Capacity of Reinforced Concrete Squat Shear
Walls Under Seismic Loading for the Design of the ACR-1000 NPP,
Transactions, SMiRT 19, Toronto, August 2007.
[27] ASCE 43-05, "Seismic Design Criteria for structures, Systems and
Components in Nuclear Facilities," American Society of Civil
Engineers, 2005.
[28] American Concrete Institute, Code Requirements for Nuclear Safety-
Related Concrete Structures (ACI 349-13) and Commentary, 2014.
[29] N. Oreskes, K. Shrader-Frechette, K. Belitz, "Verification, Validation,
and Confirmation of Numerical Models in the Earth Sciences," Sciense,
New Series, Volume 263, Issue 5147 (Februari 4, 1994), 641-646.

SSM 2018:17

StrålsäkerhetsmyndighetenSwedish Radiation Safety Authority
SE-171 16 Stockholm Tel: +46 8 799 40 00 E-mail: [email protected] strandväg 96 Fax: +46 8 799 40 10 Web: stralsakerhetsmyndigheten.se
2018:17 The Swedish Radiation Safety Authority has a comprehensive responsibility to ensure that society is safe from the effects of radiation. The Authority works to achieve radiation safety in a number of areas: nuclear power, medical care as well as commercial products and services. The Authority also works to achieve protection from natural radiation and to increase the level of radiation safety internationally.
The Swedish Radiation Safety Authority works proactively and preventively to protect people and the environment from the harmful effects of radiation, now and in the future. The Authority issues regulations and supervises compliance, while also supporting research, providing training and information, and issuing advice. Often, activities involving radiation require licences issued by the Authority. The Swedish Radiation Safety Authority maintains emergency preparedness around the clock with the aim of limiting the aftermath of radiation accidents and the unintentional spreading of radioactive substances. The Authority participates in international co-operation in order to promote radiation safety and finances projects aiming to raise the level of radiation safety in certain Eastern European countries.
The Authority reports to the Ministry of the Environment and has around 300 employees with competencies in the fields of engineering, natural and behavioural sciences, law, economics and communications. We have received quality, environmental and working environment certification.
Ale
Try
ckte
am A
B, B
ohus
, 201
8