Embed Size (px)
Citation preview

J. Renewable Sustainable Energy 11, 013502 (2019); https://doi.org/10.1063/1.5059335 11, 013502
© 2019 Author(s).
Assessment of solar PV power potentialover Asia Pacific region with remote sensingconsidering meteorological factorsCite as: J. Renewable Sustainable Energy 11, 013502 (2019); https://doi.org/10.1063/1.5059335Submitted: 20 September 2018 . Accepted: 24 December 2018 . Published Online: 14 January 2019
Jeark Principe, and Wataru Takeuchi

Assessment of solar PV power potential over AsiaPacific region with remote sensing consideringmeteorological factors
Cite as: J. Renewable Sustainable Energy 11, 013502 (2019); doi: 10.1063/1.5059335Submitted: 20 September 2018 . Accepted: 24 December 2018 . Published Online:14 January 2019
Jeark Principe1,2,a) and Wataru Takeuchi1
AFFILIATIONS1 Institute of Industrial Science, The University of Tokyo, Meguro-ku, Tokyo 153-8505, Japan2 Department of Geodetic Engineering, University of the Philippines Diliman, Quezon City 1101, Philippines
a) Author to whom correspondence should be addressed: [email protected]. Tel.: þ81-03-5452-6409. Fax: þ81-03-5452-6410
ABSTRACT
The intensity of solar radiation (SR) is one of the most important required inputs for the estimation of photovoltaic (PV) powerstation output. Meanwhile, the efficiency of solar PV systems is affected by meteorological factors such as temperature, dust,precipitation, and snow. Meteorological data from satellites provide a viable way for estimating PV potential due to its advantagein spatial coverage and temporal resolution. This paper presents a new approach to adjust SR data from satellites based on thecloud optical thickness (CLOT) before evaluating the solar PV power (PPV) potential, with the effective efficiency of solar cellscomputed based on temperature, dust, precipitation, and snow. The objective of this study is to evaluate the over-all spatiotem-poral solar PV potential in the Asia Pacific region which will holistically include limiting meteorological factors and identify whichfactor contributes most significantly to the decrease in solar PV potential in selected cities in the region. First, SR and CLOT datafrom Advanced Himawari Imager 8 and a SKYNET station were processed to derive the correction factor for solar radiation data.Second, satellite data for temperature (MOD11), precipitation (global satellite mapping of precipitation), dust (MOD04), and snowcover (MOD10) were processed to derive the effective solar PV efficiency. Finally, maps showing the seasonal PV power potentialover the Asia Pacific region were generated, with selected cities zoomed in for detailed analysis using mean monthly values fromMarch 2016 to February 2017. The results showed that the maximum theoretical PPV in the region was estimated to be 1.9GW per17.5 km2 effective pixel area. Moreover, PPV decreased by maximum values of 180 MW, 550 MW, and 225MW due to temperature,dust, and snow, respectively. For Beijing, Tokyo, and Jakarta, the major contributor to the decrease in PPV is dust, whileKhabarovsk is consistently affected by snow effects. Initial validation of the model shows over- and underestimation of solar PVoutput compared to the actual values by as high as 30%. However, very high values of coefficient of determination (>0.90) showpromising results of the model. The contribution of this study is two-fold: regional-scale assessment of PPV potential and investi-gation of the collective effect and individual contributions of dust, temperature, and snow to the decrease in PPV potential.
Published under license by AIP Publishing. https://doi.org/10.1063/1.5059335
NOMENCLATURE
Variables
Acell total aggregated pixel area allocated forthe installation of solar PV panels
Dust_Decr contribution of dust to the decrease intheoretical solar PV power
Egen equivalent generated output energy inkWh
LST_Decr contribution of temperature to thedecrease in theoretical solar PV power
PPV solar photovoltaic powerP0PV total effective solar photovoltaic power
outputP0PV, X effective solar PV power output consid-
ering X individual meteorological factorsR0 adjusted solar radiation data from AHI8sc snow cover
J. Renewable Sustainable Energy 11, 013502 (2019); doi: 10.1063/1.5059335 11, 013502-1
Published under license by AIP Publishing
Journal of Renewable and Sustainable Energy ARTICLE scitation.org/journal/rse
Snow_Decr contribution of snow to the decrease intheoretical solar PV power
VP and VM predicted (estimated) and measured(actual) values, respectively
xd and xr variables for dust masking using AOD andprecipitation rate values, respectively
Dgt, Dgd, and Dgs decrease in solar cell efficiency due totemperature, dust, and snow, respectively
g conversion efficiency of the solar cell
Acronyms
AHI Advanced Himawari ImagerAOD Aerosol Optical DepthAPR Asia Pacific Region
CLOT Cloud Optical ThicknessEPA Effective Pixel Area
GSMaP Global Satellite Mapping of PrecipitationJAXA Japan Aerospace Exploration AgencyLST Land Surface TemperatureMFG Meteosat First Generation
MODIS Moderate Resolution Imaging SpectroradiometerMOD04 MODIS Aerosol ProductMOD10 MODIS Snow Cover ProductMOD11 MODIS Land Surface Temperature and Emissivity
ProductNOCT Nominal Operative Cell Temperature
PPE Percentage Prediction ErrorSKYNET An observation network dedicated for aerosol-
cloud-radiation interaction research studiesSRTM Shuttle Radar Topography MissionSWR Shortwave RadiationTSH Total Sunshine HoursTSPA Total Solar Panel Area (used in the actual
installation)
Units
kWh kilowatt-hour, a unit of energyMW megawatts, a unit of power
I. INTRODUCTION
Energy is an indisputable necessity for the modern society.As the world’s population increases, the demand for energy alsorises since the population growth rate is recognized as animportant driver of energy (US EIA, 2017) to ensure a better lifeenvironment and technological and economic development(Sampaio and Gonzalez, 2017). However, the annual total green-house gas (GHG) emissions from the global energy supply sectorcontinue to increase as well. It was reported that the combus-tion of fossil fuels continues to dominate the global energy mar-ket that is striving to meet the ever-increasing demand for heat,electricity, and transport fuels (Sims et al., 2007). In Asia alone,the reliance on fossil fuels is 86% in the energy mix which is 5%higher than the global average in 2014 (AIIB, 2017). For sustain-able development, however, there is a need for an efficient wayof extracting energy from renewable sources. One such
alternative is solar—a low carbon resource with both scalabilityand technological maturity to meet the fast-growing globaldemand for electricity (Chander et al., 2015). Solar photovoltaic(PV) contributed to an annual market increase in about 50%,making it the world’s leading source of additional power gener-ating capacity of at least 75GW in 2016 (REN21, 2017).
Meteorological data from satellites provide a viable way forestimating the PV potential due to its advantage in spatial cover-age and temporal resolution. For instance, the SolarGIS databasethat was used to determine the potential of selected renewableenergy sources in the Greater Mekong Subregion contains irra-diance values in the 30-min time-step calculated from theMeteosat first generation (MFG) satellite and elevation fromShuttle Radar Topography Mission (SRTM) (ADB, 2015).Moreover, Higurashi and Nakajima (1999) acknowledged that theuse of data from satellites was very effective while performing alarge-scale study of aerosol optical properties.
The theoretical solar PV potential is not reached due to sev-eral limiting meteorological factors including the effects of dust,temperature, precipitation, snow, and clouds. Both the increasein temperature (Menes-Rodr�ıguez et al., 2005) and dust deposi-tion (Goossens et al., 1993) contribute to the decrease in the PVsolar efficiency. Meanwhile, insolation is directly related to thecloud cover (Kim et al., 2017). Moreover, it has also beenobserved that the snow cover reduces the overall performanceof solar modules mounted at different tilt angles (NAIT, 2016).The objective of this study is to evaluate the over-all spatiotem-poral solar PV potential in the Asia Pacific region (APR) usingremote sensing that will holistically include such limiting factorsand identify which contributes most significantly to thedecrease in the solar PV potential in selected cities in the region.The approach used in this study utilized various remote sensingsatellite products for solar radiation, cloud optical thickness(CLOT), land surface temperature (LST), precipitation, dust,and snow.
Previous studies on solar PV power potential investigatedthe effects of the above-mentioned meteorological factorsseparately and their methods applied in local settings or verysmall areas. For instance, such experiments were done on theroof of a building (Paudyal and Shree, 2016 and NAIT, 2016) andin a laboratory environment under controlled conditions(Beattie et al., 2012; Chander et al., 2015; El-Shobokshy andHussein, 1993; and Goossens et al., 1993). As such, this study con-tributes to the body of knowledge by providing a method forregional-scale assessment of PPV potential and investigating thecollective effect and individual contributions of dust, tempera-ture, and snow to the decrease in PPV potential.
II. METHODOLOGYA. Data description
Derived products from Advanced Himawari Imager 8 (AHI8)are downloaded via the Japan Aerospace Exploration Agency(JAXA) Himawari Monitor (eorc.jaxa.jp/ptree/index.html). Thesetwo products are the Shortwave Radiation (SWR) and the CloudProperty (CLOT) both at spatial and temporal resolutions of5km and 10min, respectively. The daily Aerosol Optical Depth(AOD) from the MODIS aerosol product (MOD04 L2) at a
Journal of Renewable and Sustainable Energy ARTICLE scitation.org/journal/rse
J. Renewable Sustainable Energy 11, 013502 (2019); doi: 10.1063/1.5059335 11, 013502-2
Published under license by AIP Publishing

resolution of 10km was used to extract dust information (Levyet al., 2013). For LST data, the MODIS Land Surface Temperatureand the Emissivity 8-day global product (MOD11 L3) at a resolu-tion of 1 km were used (Wan, 1999). To extract precipitation ratedata, the daily average rainfall estimates from global satellitemapping of precipitation (GSMaP) at a resolution of 0.1� � 0.1�
were used (Okamoto et al., 2005). Finally, the monthly snowcover was extracted from the monthly Global 0.05� CMG(version 6) MOD10 L3 dataset (Hall et al., 2001). The period ana-lyzed for this study is one complete year, starting from March2016 to February 2017 since the SWR data from AHI8 are onlyavailable from March 2016. The seasons defined in this studywere MAM (March to May), JJA (June to August), SON(September to November), and DJF (December to February).
B. Methods
The general methodology adopted in this study is shown inFig. 1. First, the SWR data from AHI8 were adjusted to generateR0. The adjustment process entailed the use of CLOT data to fitthe original SWR data with the ground data observations(http://atmos2.cr.chiba-u.jp/skynet/chiba/chiba.html) andderive the correction factor for solar radiation data (CFSR) via anon-linear regression technique by Principe and Takeuchi(2018). SWR data were then adjusted using CFSR to generateR0. The technique of adjusting the solar radiation valuesderived from AHI-8 using CLOT data worked well during thesummer and winter seasons since R0 has a smaller absolutedifference to the SKYNET data (Table I). It performed unsatis-factorily, however, during spring and autumn seasons when,most probably, the cloud cover is not a major factor affectingSWR. Nonetheless, the technique’s effectiveness to adjust thesolar radiation values during the summer (JJA) is worth noting
since the peak of solar intensity is expected and the discrep-ancy between the ground- and satellite-based values is at amaximum during this season compared to other seasons ofthe year.
1. Computation of solar PV power output and decreasein solar cell efficiency
The theoretical solar PV power (PPV) output in megawatts(MW) is computed using Eq. (1), where Acell is the total aggre-gated pixel area allocated for the installation of solar PV panels,g is the conversion efficiency of the solar cell, and R0 is theadjusted solar radiation data from AHI8
PPV ¼ Acell gR0: (1)
Equation (1) is adapted from the original model equation in thestudy by Liu et al. (2017) where the modifications include themerging of two separate variables for the number of PV cells (N)and the area of a single PV cell (SA) to a single variable Acell.Moreover, in Eq. (1), we considered the adjusted solar radiation(R0) instead of the actual intensity of solar radiation (RT) sincethis study did not use the ground-observed values of solar radia-tion but used instead the satellite-derived values as adjusted tofit with the actual ground data.
The decrease in solar cell efficiency due to temperature(Dgt), dust (Dgd), and snow (Dgs) is computed using Eqs. (2), (3),and (4), respectively. The over-bar in these equations indicatesthe computation of mean values over the evaluation period. Dgtis computed using the typical nominal operative cell tempera-ture (NOCT) with NOCTmax set at 45 �C and the temperaturecoefficient of efficiency (dg/dT¼0.094) (Chander et al., 2015) atevery ith day for each season with n being the total number ofdays
FIG. 1. The general methodology used in this study. The theoretical solar PV power potential (PPV) was derived using the adjusted shortwave radiation (SWR). The effect oftemperature (Dgt) was derived using the LST product from MOD11, while the effect of dust (Dgd) was derived from a binary technique considering rainfall (cleaning agent)and non-rainfall (the dust effect is not eliminated) events using GSMaP rainfall rate data and AOD data (representing dust) from MOD04. Moreover, the effect of snow (Dgs)was derived from snow cover percentage data of MOD10. Such effects of meteorological factors on the efficiency of solar PV cells were then used to compute for the effectivesolar PV power potential (P0PV). The computed P0PV was in turn validated against the outputs from actual solar PV installations. Finally, maps of solar PV potential weregenerated.
Journal of Renewable and Sustainable Energy ARTICLE scitation.org/journal/rse
J. Renewable Sustainable Energy 11, 013502 (2019); doi: 10.1063/1.5059335 11, 013502-3
Published under license by AIP Publishing

Dgt ¼ 0:094
Pn
i¼1LST�NOCTmax
n: (2)
Dgd is computed using Eq. (3) where the constant 0.3 is thereported decrease in solar cell efficiency due to dust by Sayigh(1978). xd is either 0 (AOD � 0) or 1 (AOD>0) for the non-dust ordust day, respectively. xr is either 1 or 0 for the no rain or rainyday, respectively. This approach therefore considers the clean-ing effect of rain on solar panels and cancels the effect of duston days with rainfall (i.e.,when xd¼ 1 and xr¼ 0).
Dgd ¼ 0:3
Pn
i¼1xdixri
n: (3)
Dgs is computed using the snow cover (sc) from MOD10 (valuesare 0–100) assuming a snow coefficient of efficiency (dg/ds¼0.16) (NAIT, 2016) at every ith month for each season with nbeing the total number of months
Dgs ¼ 0:0016
Pn
i¼1sci
n: (4)
The effective solar PV power output considering the individualmeteorological factors (P0PV, X) in MWwas computed as
P0PV;X ¼ Acell gR0ð1� DgXÞ; (5)
where subscript X denotes the meteorological components (e.g.,d¼ dust, s¼ snow, and t¼ temperature).
The total effective solar photovoltaic power output (P0PV) inMWwas computed as
P0PV ¼ Acell gR0ð1� Dgt � Dgd � Dgs Þ: (6)
In this study, the final spatial resolution of the raster data usedwas 5km and it was assumed that only 70% of the pixel area willbe utilized for solar PV installation with a PV cell efficiency of13% (for thin-film cells) according to Sampaio and Gonzalez
(2017). The type of solar cell based on thin film silicon wasselected since it offers a promising value of significantly lower-ing the costs of producing energy from solar PV, therebyattracting future investors and users of this technology (Chenand Sopori, 1999).
2. Comparison of computed solar PV power with actualreported outputs
The computed seasonal solar PV power was compared withthe actual generated PV output data from the installations pub-lished in the website of PVOutput.org (https://pvoutput.org).The website offers a free service platform to share, compare,and monitor live solar photovoltaic (PV) and energy consump-tion data (PVOutput.org, 2018). Since the reported actual out-puts were in energy units (kWh), the computed P0PV in MWmustbe converted to kWh using the following equation:
EgenðkWhÞ ¼ P0PV � TSH� TSPA� 1000=EPA; (7)
where Egen is the equivalent generated output energy in kWh;P0PV is the total effective solar photovoltaic power output inMW; TSH is the average total sunshine hours; TSPA is the totalsolar panel area used in the actual installation in m2; and EPA isthe effective pixel area (for this study, EPA ¼ 5000 m � 5000 m� 0.7¼ 1.75� 107 m2 or 17.5km2).
The description of the two solar PV installations used inthis study for validation purposes is shown in Table II. Only thislimited number of actual solar PV systems was used becausethere were only a few installations in the Asia Pacific regionwith data in PVOutput.org and most of them did not have datafor periods covered in this study. Meanwhile, the TSH data wereobtained from different sources including the AustralianGovernment Bureau of Meteorology for Signal Hill (2005),and the Thai Meteorological Department for Bangkok Soladin(2014).
The estimated values of solar PV output were assessedusing the percentage prediction error (PPE) as given by Kimet al. (2017) in the following equation:
PPE ¼ jVP � VMj � 100VM
; (8)
where VP and VM are the predicted (estimated) and measured(actual) values, respectively. Equation (8) implies that the lowerthe value for PPE is the better the estimation is.
III. RESULTS AND DISCUSSION
Satellite data were processed to produce three sets of PVsolar potential products for the Asia Pacific region: theoretical,effective (considering individual meteorological factors), and
TABLE I. Absolute differences in solar radiation between SKYNET and AHI8 original(AHI8) and adjusted (AHI8Cor) SWR data.
Season
Absolute difference in solar radiation (W/m2)
AHI8—SKYNET AHI8Cor—SKYNET
Spring 21.29 30.87Summer 61.99 15.85Autumn 12.69 42.56Winter 9.80 7.85
TABLE II. Actual solar PV installations in PVOutput.org used in this study for validation.
Name Location System size (kW) Number of panels Orientation Tilt (deg)
Signal Hill Perth, Australia 3.36 16 NE 18Bangkok Soladin Bangkok, Thailand 0.65 5 S 15
Journal of Renewable and Sustainable Energy ARTICLE scitation.org/journal/rse
J. Renewable Sustainable Energy 11, 013502 (2019); doi: 10.1063/1.5059335 11, 013502-4
Published under license by AIP Publishing

total effective. Moreover, zoomed in analysis for selected citiesin the region was performed to determine which among thefactors are significantly affecting the PV solar potential. Theequivalent generated output energy (Egen) is also compared withthe actual output of solar PV installations in two locations withinthe Asia Pacific region. Finally, the limitations and possiblesources of error of the technique used in this study for the esti-mation of PPV are also presented.
A. Theoretical solar PV power potential
The satellite-derived mean theoretical seasonal solar pho-tovoltaic output power maps for the Asia Pacific Region are gen-erated using Eq. (1). Meanwhile, Fig. 2 shows the solar PV poweroutput in selected cities in the Asia Pacific region. Among these20 cities examined, Brunei and Muara, Sydney, Manila, andTaipei, have the highest estimated solar PV power during SON(1204.73 MW), DJF (1487.3 MW), MAM (1473.57 MW), and JJA(1243.94MW) seasons, respectively.
The corresponding spatial distribution maps in the AsiaPacific region during the different seasons are shown in Fig. 3.The theoretical solar PV potential is high during the JJA seasonin most of the region, except in Southern Australia and moun-tainous areas in India, Nepal, Myanmar, and Bhutan. Since Acell
and g are assigned with fixed values, the variation of PPV issolely dependent on R0 the value of which varies according tothe surface topology, zenith angle, atmospheric gases, andclouds, among others (Gokmen et al., 2016; Lee et al., 2018;Gupta et al., 2016; and Frouin and Murakami). Since the effectsof clouds and the clear atmosphere were already accounted inthe algorithm to estimate SWR from AHI8 (Frouin andMurakami, 2007), topographic shading and short sunshinehours (in the case of Australia) are possible reasons for the lowPPV potential during the said season. Meanwhile, Australia hasvery high potential during DJF and SON with a potential ofabout 1.6GW for both seasons, the highest among the AsiaPacific countries. Australia experiences an average sunshinehour of up to 11 h during these seasons (AustralianGovernment Bureau of Meteorology, 2005) which translates
to more solar irradiance available for solar energy conversionby PV systems.
B. Decrease in solar PV power potential due totemperature
The satellite-derived seasonal decrease in solar photovol-taic output power due to temperature for the Asia PacificRegion was generated using Eqs. (1), (2), and (5). The corre-sponding spatial distribution maps during the different sea-sons are shown in Fig. 4. The maximum decrease in PPV was180MW, about 9.4% of the theoretical potential. During theDJF season, most of the area in Australia experiences adecrease in solar PV potential due to the high temperature,with some portions in the northwest area affected during theMAM season. It can also be observed from Fig. 4 that duringthe JJA season, areas in northern China and southern Mongoliain the Gobi Desert have a notable decrease in solar PV poten-tial. The reason was that in these areas, LST can reach up to50 �C during the summer season. Some parts of India,Thailand, Myanmar, and Cambodia experience a decrease inPPV potential during the MAM season.
As can be seen in Fig. 4, the effect of the temperature onsolar PV performance was very negligible in many parts of theregion. This can be attributed to the use of LST to estimate theactual temperature of the solar cells (Tcell). Thermal radiancecoming from the land surface is retrieved by the satelliteswhich are then used to estimate LST on the theoretical basisthat the total radiance emitted by the ground increases rapidlywith temperature (Mildrexler et al., 2011). As such, the directuse of LST in place of Tcell may result in an error in the estima-tion of temperature effects on PPV potential. LST was used inthis study since actual long-term Tcell data were not availablefor the whole Asia Pacific Region. For future work, the conver-sion of LST to Tcell can be done by first linking the LST to airtemperature (Tair) and Tair to Tcell following the studies of Liet al. (2008), Jin and Dickinson (2010), Mildrexler et al. (2011),and Gokmen et al. (2016). Finally, wind can also affect PPV
FIG. 2. Theoretical mean seasonal solarPV power output for selected cities in theAsia Pacific region.
Journal of Renewable and Sustainable Energy ARTICLE scitation.org/journal/rse
J. Renewable Sustainable Energy 11, 013502 (2019); doi: 10.1063/1.5059335 11, 013502-5
Published under license by AIP Publishing

potential in terms of its cooling effect on PV systems (Gokmenet al., 2016). In the current model, the effect of temperatureseemed to be very negligible, but if Tcell is used instead of LST,it is expected to get very high temperature values which willdegrade the solar cell efficiency down to 0. As such, windspeed will be considered in the future model update. Rainfallmay also help in cooling down solar panels, but the solar-driven rainwater cooling device is not efficient and cost-effective especially for solar PV installations for domestic
houses (Wu and Xiong, 2014). For this reason, rainfall was notconsidered as a cooling agent for solar PV systems.
C. Decrease in solar PV power potential due to dust
Using Eqs. (1), (3), and (5), maps for the satellite-derived sea-sonal decrease in solar photovoltaic output power due to dustfor the Asia Pacific Region were generated. The correspondingspatial distribution maps during the different seasons are shown
FIG. 3. Theoretical mean seasonal solar PV power (in megawatts) in the Asia Pacific region: (a) DJF; (b) MAM; (c) JJA; and (d) SON.
Journal of Renewable and Sustainable Energy ARTICLE scitation.org/journal/rse
J. Renewable Sustainable Energy 11, 013502 (2019); doi: 10.1063/1.5059335 11, 013502-6
Published under license by AIP Publishing

FIG. 4. Decrease in mean seasonal solar PV power (in megawatts) due to temperature in the Asia Pacific region: (a) DJF; (b) MAM; (c) JJA; and (d) SON. The areas in circlesare where the temperature has a relatively high impact on the decrease in solar PV output compared to other areas in the region for that season.
Journal of Renewable and Sustainable Energy ARTICLE scitation.org/journal/rse
J. Renewable Sustainable Energy 11, 013502 (2019); doi: 10.1063/1.5059335 11, 013502-7
Published under license by AIP Publishing

FIG. 5. Decrease in mean seasonal solar PV power (in megawatts) due to dust in the Asia Pacific region: (a) DJF; (b) MAM; (c) JJA; and (d) SON. The areas in circles arewhere dust have a relatively high impact on the decrease in solar PV output compared to other areas in the region.
Journal of Renewable and Sustainable Energy ARTICLE scitation.org/journal/rse
J. Renewable Sustainable Energy 11, 013502 (2019); doi: 10.1063/1.5059335 11, 013502-8
Published under license by AIP Publishing

FIG. 6. Decrease in mean seasonal solar PV power (in megawatts) due to snow in the Asia Pacific region: (a) DJF; (b) MAM; (c) JJA; and (d) SON. The areas in the latitudesabove �30�N and below �30�S are where snow have an impact on the decrease in solar PV output.
Journal of Renewable and Sustainable Energy ARTICLE scitation.org/journal/rse
J. Renewable Sustainable Energy 11, 013502 (2019); doi: 10.1063/1.5059335 11, 013502-9
Published under license by AIP Publishing
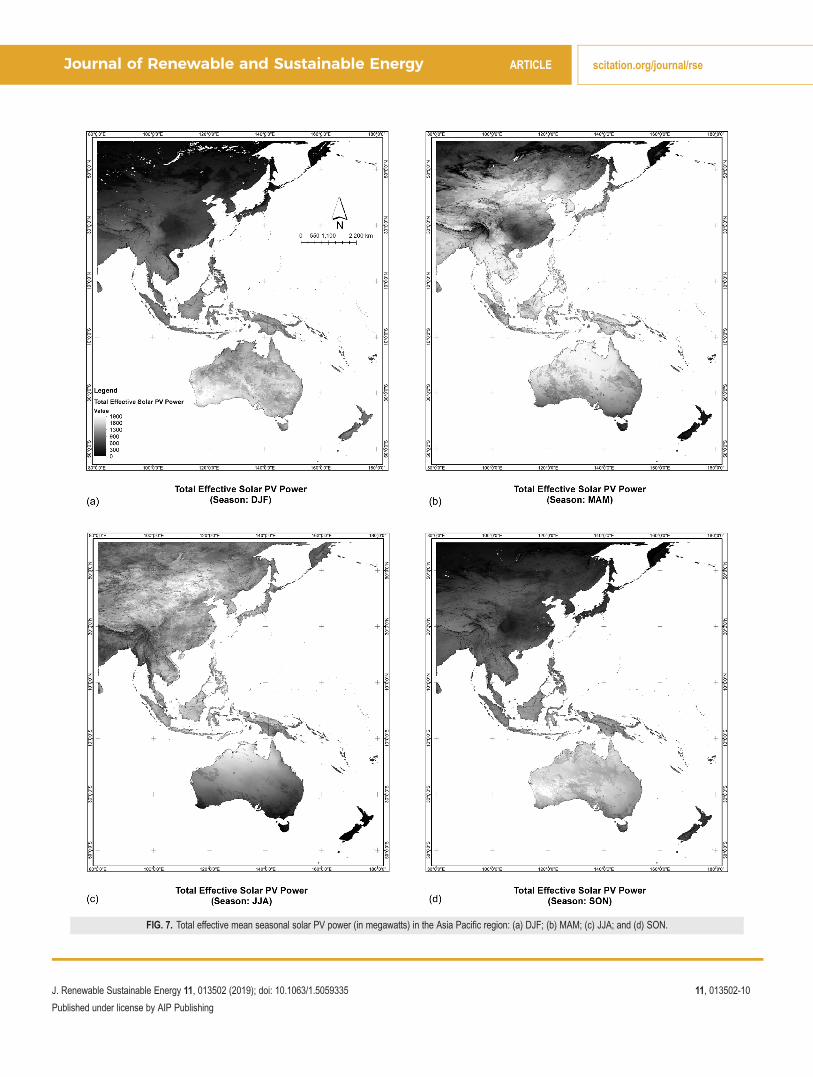
FIG. 7. Total effective mean seasonal solar PV power (in megawatts) in the Asia Pacific region: (a) DJF; (b) MAM; (c) JJA; and (d) SON.
Journal of Renewable and Sustainable Energy ARTICLE scitation.org/journal/rse
J. Renewable Sustainable Energy 11, 013502 (2019); doi: 10.1063/1.5059335 11, 013502-10
Published under license by AIP Publishing

in Fig. 5 which reveals that almost all countries in the region suf-fer from the effects of dust. The effects are severe in East Asia(except in Japan and Korea) during the JJA season. Australia isconsistently affected by dust especially during DJF and MAMseasons. The southern part of Australia also experienced severeeffects from dust during the SON season. Finally, the maximumdecrease in solar PV power potential due to dust was 550MW. Itseems that the precipitation rate in the region is not enough toserve as a cleaning agent for solar cell installations. Manualscheduled cleaning of the solar PV systems is therefore sug-gested for these areas.
The interaction between rainfall and dust affects the outputpower of solar cells. Depending on its intensity, rainfall caneither promote or impede the accumulation of dusts on a PVmodule. Kimber et al. (2006) suggested a minimum of 20mm/day of rain to clean a PV system from dusts. Meanwhile, even thesize of dust particles affects PV power output. Dust of finer par-ticles is distributed in a more uniform manner than that for thecoarser ones, thus minimizing the voids between particlesthrough which light can pass (El-Shohokshy and Hussein, 1993).Such dust and rainfall characterization will therefore be consid-ered in updating the current model.
D. Decrease in solar PV power potential due to snow
Using Eqs. (1), (4), and (5), maps for the satellite-derived sea-sonal decrease in solar photovoltaic output power due to snowfor the Asia Pacific Region were generated. The correspondingspatial distribution maps during the different seasons are shownin Fig. 6 which shows that areas with latitudes above�30�N andbelow �30�S were affected by this limiting factor. Areas inNorth East and North West China, Mongolia, Russia, Japan, andKorea were significantly affected compared to other areas in theregion during DJF and MAM seasons. The same is true for NewZealand during JJA and SON seasons. The maximum decrease inthe solar PV potential was computed at 225MW, which is about12% of the theoretical PPV which is below the maximum snoweffect set in the model (i.e., 16%). As such, there is a possibleunderestimation of snow effects. For future work, we plan to
vary the threshold level to efficiently model the snow dynamicsin the region.
For an optically thick layer, the Bouguer-Lambert law pre-dicts an exponential decrease in solar irradiance with the depth(Perovich, 2007) which will yield lower PPV. Due to its better spa-tial resolution and temporal coverage, the snow cover productfrom MODIS (MOD10) was used instead of the snow depth withthe assumption that the two are highly correlated. However, inthe model update, we plan to derive the snow depth from thesnow water equivalent (SWE) product of the AdvancedMicrowave Scanning Radiometer for Earth Observing System(AMSR-E) (Chang and Rango, 2000).
E. Total effective solar PV power
Combining the effects of temperature, dust, and snow givesthe total effective PPV as facilitated by Eq. (6). Maps for thesatellite-derived total effective seasonal solar photovoltaic out-put power for the Asia Pacific Region were generated and areshown in Fig. 7. Moreover, Fig. 8 shows the percent decrease inPPV during different seasons at selected cities in APR. The citiesof Ulaanbaatar (�12%), Khabarovsk (�16%), Dhaka (�9%), andBeijing (�13%) have the highest percentage decrease in PPVduring the SON, DJF, MAM, and JJA seasons, respectively.
As snow and temperature cannot be controlled, significantefforts should be devoted to reducing dust emission. Such areduction in dust effects will result in a saving of at most 167MWof energy during the JJA season in Beijing.This amount of energycan support about 6 families of 6 in China for a month based onthe reported electric power consumption according to TheWorld Bank (2014).
F. Effects of temperature, dust, and snow on thedecrease in solar PV potential in selected cities in theAsia Pacific region
The cities of Beijing (China), Tokyo (Japan), Khabarovsk(Russia), and Jakarta (Indonesia) were selected to see the percentcontribution of the three meteorological factors considered in
FIG. 8. Decrease in mean seasonal solarPV power potential for selected cities inthe Asia Pacific region.
Journal of Renewable and Sustainable Energy ARTICLE scitation.org/journal/rse
J. Renewable Sustainable Energy 11, 013502 (2019); doi: 10.1063/1.5059335 11, 013502-11
Published under license by AIP Publishing

this study to the overall decrease in solar PV potential withrespect to the theoretical values.
Figure 9(a) shows that in Beijing’s case, dust is a major con-tributor to the decrease in PPV for all seasons except in DJF
where snow cover is the only factor affecting the said decrease.In Tokyo’s case [Fig. 9(b)], the major contributor varies with theseason. Snow is the major factor during SON; snow and dusthave equal contributions during DJF; dust is the major
FIG. 9. Contribution of dust (Dust_Decr), snow (Snow_Decr), and temperature (LST_Decr) to the decrease in theoretical solar PV power (PPV) in (a) Beijing and China, (b)Tokyo and Japan, (c) Khabarovsk and Russia, and (d) Jakarta and Indonesia. The first value in the data labels is the output power in MW, while the second is the percentagecontribution to the total in %.
Journal of Renewable and Sustainable Energy ARTICLE scitation.org/journal/rse
J. Renewable Sustainable Energy 11, 013502 (2019); doi: 10.1063/1.5059335 11, 013502-12
Published under license by AIP Publishing

FIG. 9. (Continued).
Journal of Renewable and Sustainable Energy ARTICLE scitation.org/journal/rse
J. Renewable Sustainable Energy 11, 013502 (2019); doi: 10.1063/1.5059335 11, 013502-13
Published under license by AIP Publishing

contributor during MAM; during JJA, there is no significantdecrease in PPV (snow’s impact is very small at 0.01% and ishighly unlikely to be present during this season).
Khabarovsk is consistently affected by snow effects exceptin JJA when dust is the only contributing factor to the decreasein PPV [Fig. 9(c)]. Finally, in the case of Jakarta [Fig. 9(d)], the onlycontributing factor is the dust. The case of Jakarta is the samefor the other cities in the region with tropical climate. It can beseen in Figs. 9(a)–9(d) that temperature has no effect on thedecrease in PPV for the four cities that were examined. In fact,except in extreme cases such as in desert areas, Dgt is very
negligible for most cities in the Asia Pacific region. As statedpreviously, this result may change if an actual Tcell is computedand reflected in the model instead of LST.
G. Comparison of estimated and actual solar PVoutputs
Table III shows the summary of the estimated and actualsolar PV outputs for the two installations in Australia andThailand with their corresponding PPE values. Moreover, Fig. 10shows the bar charts for Table III. The model underestimated
TABLE III. Validation results for solar PV outputs.
Solar PV site
Actual generation (kWh) Estimated generation (kWh) PPE (%)a
MAM JJA SON DJF MAM JJA SON DJF MAM JJA SON DJF
Signal Hill 1209 976 1670 1854 750 749 1883 2080 (�) 38.0 (�) 23.3 (þ) 12.7 (þ) 12.2Bangkok Soladin 205b 63c 86d 145e 269.3 48.8 76.2 160.7 (þ) 31.4 (�) 22.5 (�) 11.4 (þ) 10.8
a(�) and (þ) denote the model under- and overestimation, respectively.bNumber of days with no output: 3.cNumber of days with no output: 60.dNumber of days with no output: 44.eNumber of days with no output: 26.
FIG. 10. Comparison of estimated and actual energies in: (a) Signal Hill (SH) and (b) Bangkok Soladin (BS) solar PV installations. It can be seen here that the model underes-timates the actual generated energy in JJA and SON seasons at BS and during MAM and JJA for SH but shows promising results in terms of the coefficient of determination.
Journal of Renewable and Sustainable Energy ARTICLE scitation.org/journal/rse
J. Renewable Sustainable Energy 11, 013502 (2019); doi: 10.1063/1.5059335 11, 013502-14
Published under license by AIP Publishing

the generated energy MAM and JJA in Signal Hill and JJA andSON seasons in Bangkok Soladin.
The values of PPE range from 10% to 38% with an averagevalue of 22% for Signal Hill and 19% for Bangkok Soladin. Thisresult is close to but better than the reported monthly averagedPPE value (23.6%) by Kim et al. (2017) who considered a “practicalmodel” (similar in some respect to our model) for daily predic-tion of solar PV power generation in South Korea. Moreover, itcan be seen in Fig. 10 that there is a good linear correlationbetween the estimated and actual values as indicated by thevery high values (0.94, 0.99) of R2. The values, however, are quitefar from the 1:1 line signifying a very low agreement in the abso-lute values of the two sets of data. This can be an indication that“rotation” factors should be introduced in the model equationsto fit these data points to the 1:1 line. Such a rotation factor canbe derived from the solar PV cell efficiency and coefficients ofefficiencies both of which were set to fixed values. The conver-sion from power (MW) to energy (kWh) units can also be asource of error; specifically, it is assumed that sunshine hoursare equivalent to the actual number of hours that the solar cellsare producing power. The assumption was done since no infor-mation on the actual operating hours is available inPVOutput.org.
The model needs more refinement as indicated by unsatis-factory values of PPE. The sources of error can be attributed tothe fixed values set for the solar PV cell efficiency (13%) andcoefficients of efficiency (0.094, 0.3, and 0.16 for temperature,dust, and snow, respectively). For instance, the published peakefficiencies for the solar cells used in Signal Hill and BangkokSoladin are 16.9% and 13.1%, respectively. Such an efficiency rateis a possible reason why the estimated values relatively agreedwell with the actual values in Bangkok Soladin. Using thesatellite-derived LST to estimate the actual solar cell tempera-ture may also introduce significant error since LST itself haslimitations due to mixed-pixel issues, complicated surfacestructures, and topographic effects (Wan, 1999). It is thereforerecommended to convert LST to solar panel temperature.Several studies have used explicit equations to derive the oper-ating temperature of a PV module (Tcell) from ambient air tem-perature such as the studies of Alsayed et al. (2013) and Gokmenet al. (2016), but as far as we know, there has been no study yetthat dealt with the derivation of Tcell directly from LST. This istherefore a subject of our future work. The binary maskingscheme used for dust analysis also has its limitations since AODcan also represent other aerosol particles aside from fine andcoarse dusts (e.g., water vapor, etc.). As a future work, we willuse the Angstrom coefficient data to determine AOD valueswhich are useful for the analysis of dust effects on solar panels.Finally, the coefficient of efficiency for snow needs to be care-fully considered and adjusted if needed since snow types varyfor different locations.
IV. CONCLUSIONS
This paper presented a method for incorporating differentremote sensing satellite data to investigate the limiting effectsof temperature, dust, and snow on the total effective efficiencyof the solar PV cells and the corresponding output power
potential. The theoretical mean seasonal solar PV power wasalso derived for the Asia Pacific region with the maximum valueat �1.9GW per EPA of 17.5km2. The results of this study show anoticeable significant decrease in PPV in Australia for DJF andMAM seasons and a slight decrease during SON. The same canbe observed during JJA in China, Mongolia, and Russia.
Different cities are affected differently by temperature,dust, and snow. For Beijing, the major contributor to thedecrease in PPV is dust, except in DJF when snow is the majorcontributor. For Tokyo, the effect varies with the season butmainly dust during MAM. Khabarovsk is consistently affected bysnow effects except in JJA when dust is the only contributingfactor. Finally, in the case of Jakarta, the only contributing factoris the dust.
The maximum decrease in PPV due to the three meteoro-logical parameters was reached except for snow (the thresholdis 16%, but the computed is 12%). It is therefore necessary toinvestigate this underestimation by considering a more compre-hensive analysis of snow dynamics in the region and how it canbe incorporated in the model. Although model improvementsare still needed, this paper has demonstrated how differentremote sensing data can be used to assess the solar PV powerpotential in a regional scale. The excellent temporal resolutionof AHI8 should also be maximized to produce the estimatedsolar PV power output for every hour at the least. After refiningthe model, the next step for this study is to include the geomor-phological and building/roof type factors in the computation ofPPV to consider the tilt and shadow effects.
Globally, it is apparent that there is a strong movement,from government and non-government institutions, pushing forclean energy alternatives. Solar power from PV cells is one ofsuch alternative that is now becoming a more popular choice.This technology is continually progressing to provide a moreaffordable and more efficient system for the advantage of boththe electricity producers and consumers, leading tomore stake-holders participating in this industry. Therefore, the output ofthis study can be useful in planning for small-scale (e.g., solarrooftop) or large-scale solar PV projects (e.g., solar farms) in asolar-rich region of Asia Pacific.
ACKNOWLEDGMENTS
SWR, CLOT, and GSMaP products were supplied by theP-tree System, Japan Aerospace Exploration Agency (JAXA).The authors would like to thank the Hitachi Global Foundationfor their support in this research endeavor.
REFERENCESADB, Renewable Energy Developments and Potential in the Greater MekongSubregion (Asian Development Bank, Mandaluyong, 2015).
AIIB, Energy Sector Strategy: Sustainable Energy for Asia (AsianInfrastructure Investment Bank, Beijing, 2017).
Alsayed, M., Cacciato, M., Scarcella, G., and Scelba, G., “Multicriteria optimalsizing of photovoltaic-wind turbine grid connected systems,” IEEE Trans.Energy Convers. 28, 370–379 (2013).
Australian Government Bureau of Meteorology, http://www.bom.gov.au/watl/sunshine/ for Sunshine: Average Daily Sunshine Hours; accessed 24April 2018 (2005).
Journal of Renewable and Sustainable Energy ARTICLE scitation.org/journal/rse
J. Renewable Sustainable Energy 11, 013502 (2019); doi: 10.1063/1.5059335 11, 013502-15
Published under license by AIP Publishing

Beattie, N. S., Moir, R. S., Chacko, C., Buffoni, G., Roberts, S. H., and Pearsall,N. M., “Understanding the effects of sand and dust accumulation on pho-tovoltaic modules,” Renewable Energy 48, 448–452 (2012).
Chander, S., Purohit, A., Sharma, A., Nehra Arvind, S. P., and Dhaka, M. S., “Astudy on photovoltaic parameters of mono-crystalline silicon solar cellwith temperature,” Energy Rep. 1, 104–109 (2015).
Chang, A. T. C. and Rango, A., https://nsidc.org/sites/nsidc.org/files/tech-nical-references/amsr_atbd_snow.pdf for Algorithm Theoretical BasisDocument (ATBD) for the AMSR-E Snow Water Equivalent Algorithm;accessed 10 September 2018 (2000).
Chen, W. and Sopori, B., “A thin silicon solar cell on glass: Cell design and pro-cess physics,” in Electrochemical Society’99 (NREL, Seattle, 1999), pp. 1–8.
El-Shobokshy, M. S. and Hussein, F. M., “Degradation of photovoltaic cellperformance due to dust deposition on its surface,” Renewable Energy 3,585–590 (1993).
FrouinR., Murakami H., “Estimating photosynthetically available radiation atthe ocean surface from adeos-ii global imager data,” J. Oceanogr. 63(3),493 (2007).
Gokmen, N., Hu,W., Hou, P., Zhe, C., Sera, D., and Spataru, S., “Investigationof wind speed cooling effect on PV panels in windy locations,” RenewableEnergy 90, 283–290 (2016).
Goossens, D., Offer, Z. Y., and Zangvil, A., “Wind tunnel experiments andfield investigations of eolian dust deposition on photovoltaic solarcollectors,” Sol. Energy 50, 75–84 (1993).
Gupta, P., Joiner, J., Vasilkov, A., and Bhartia, P. K., “Top-of-the-atmosphereshortwave flux estimation from satellite observations: An empirical neuralnetwork approach applied with data from the A-train constellation,”Atmos. Meas. Tech. 9, 2813–2826 (2016).
Hall, D. K., Riggs, G. A., and Salomonson, V. V., Algorithm Theoretical BasisDocument (ATBD) for the MODIS Snow and Sea Ice-Mapping Algorithms(NASA, Greenbelt, 2001).
Higurashi, A. and Nakajima, T., “Development of a two-channel aerosolretrieval algorithm on a global scale using NOAA AVHRR,” J. Atmos. Sci.56, 924–941 (1999).
Jin, M. and Dickinson, R. E., “Land surface skin temperature climatology:Benefitting from the strength of satellite observations,” Environ. Res.Lett. 5, 041002 (2010).
Kim, J.-G., Kim, D.-H., Yoo, W.-S., Lee, J.-Y., and Kim, Y. B., “Dailyprediction of solar power generation based on weather forecastinformation in Korea,” IET Renewable Power Gener. 11(10),1268–1273 (2017).
Kimber, A., Mitchell, L., Nogradi, S., and Wenger, H., “The effect of soiling onlarge grid-connected photovoltaic systems in California and theSouthwest region of the United States,” in Proceedings of the 2006 IEEE4th World Conference on Photovoltaic Energy Conference, Waikoloa (2006),pp. 2391–2395.
Lee, S., Kim, B., Lee, K., Zo, I., Jung, H., and Rim, S., “Retrieval of reflectedshortwave radiation at the top of the atmosphere using Himawari-8/AHIdata,” Remote Sens. 10(2), 1–25 (2018).
Levy, R. C., Mattoo, S., Munchak, L. A., Remer, L. A., Sayer, A. M., Patadia, F.,and Hsu, N. C., “The collection 6 MODIS aerosol products over land andocean,” Atmos. Meas. Tech. 6, 2989–3034 (2013).
Li, Z., Guo, X., Dixon, P., and He, Y., “Applicability of land surface tempera-ture (LST) estimates from AVHRR satellite image composites in northernCanada,” Prairie Perspect. 11, 119–130 (2008).
Liu, B., Li, K., Niu, D. D., Jin, Y. A., and Liu, Y., “The characteristic analysis ofthe solar energy photovoltaic power generation system,” IOP Conf. Ser.:Mater. Sci. Eng. 164, 1–6 (2017).
Menes-Rodr�ıguez, D., Horley, P. P., Gonz�alez-Hern�andez, J., Vorobiev, Y. V.,and Gorley, P. N., “Photovoltaic solar cell performance at elevated tem-peratures,” Sol. Energy 78, 243–250 (2005).
Mildrexler, D. J., Zhao, M., and Running, S. W., “A global comparisonbetween station air temperatures and MODIS land surface temperaturesreveals the cooling role of forests,” J. Geophys. Res. 116, G03025, https://doi.org/10.1029/2010JG001486 (2011).
NAIT, Alternative Energy Program: Solar Photovoltaic Reference Array Report(Northern Alberta Institute of Technology, Edmonton, 2016).
Okamoto, K., Iguchi, T., Takahashi, N., Iwanami, K., and Ushio, T., “The globalsatellite mapping of precipitation (GSMaP) project,” in 25th IGARSS, Seoul(2005).
Paudyal, B. R. and Shree, R. S., “Dust accumulation effects on efficiency ofsolar PV modules for off grid purpose: A case study of Kathmandu,” Sol.Energy 135, 103–110 (2016).
Perovich, D. K., “Light reflection and transmission by a temperate snowcover,” J. Glaciol. 53(181), 201–210 (2007).
Principe, J. and Takeuchi, W., “Assessment of solar PV power potential overAsia Pacific region with AHI8,” in 26th Institute of Industrial Science (IIS)Forum, Tokyo (2018).
PVOutput.org, https://pvoutput.org/ for PVOutput. PVOutput.org;accessed 23 April 2018.
REN21, Renewables 2017 Global Status Report (REN21 Secretariat, Paris, 2017).Sampaio, P. G. V. and Gonzalez, M. O. A., “Photovoltaic solar energy: Conceptualframework,” Renewable Sustainable Energy Rev. 74, 590–601 (2017).
Sayigh, A. A. M., “Effect of dust on flat plate collectors. Sun, mankind’sfuture source of energy,” in Proceedings of the International Solar EnergySociety Congress, New Delhi (1978), pp. 960–964.
Sims, R. E. H., Schock, R. N., Adegbululgbe, A., Fenhann, J., Konstantinaviciute,I., Moomaw,W., Nimir, H. B., et al., “Energy supply,” in Climate Change 2007:Mitigation. Contribution of Working Group III to the Fourth AssessmentReport of the Intergovernmental Panel on Climate Change, edited by B. Metz,O. R. Davidson, P. R. Bosch, R. Dave, and L. A. Meyer (Cambridge UniversityPress, Cambridge, UK/New York, USA, 2007).
Thai Meteorological Department, https://www.tmd.go.th/agromet.php for“Agrometeorology,” accessed 24 April 2018 (2014).
The World Bank, https://data.worldbank.org/indicator/EG.USE.ELEC.KH.PC for “Electric power consumption (kWh per capita),”TheWorld Bank Data; accessed 23 April 2018 (2014).
US EIA, https://www.eia.gov/outlooks/ieo/ for “International EnergyOutlook 2017,” Independent Statistics and Analysis: US EnergyInformation Administration, accessed 23 March 2018 (2017).
Wan, Z., MODIS Land-Surface Temperature Algorithm Theoretical BasisDocument (LST ATBD) (Institute for Computational Earth System Science,Santa Barbara, 1999).
Wu, S. and Xiong, C., “Passive cooling technology for photovoltaic panelsfor domestic houses,” Int. J. Low-Carbon Technol. 9(2), 118–126 (2014).
Journal of Renewable and Sustainable Energy ARTICLE scitation.org/journal/rse
J. Renewable Sustainable Energy 11, 013502 (2019); doi: 10.1063/1.5059335 11, 013502-16
Published under license by AIP Publishing


![Asia Pacific Youth to Business (Y2B) Forum Proposal [for Asia Pacific]](https://img.dokumen.tips/doc/110x75/568c4db71a28ab4916a50cbd/asia-pacific-youth-to-business-y2b-forum-proposal-for-asia-pacific.jpg)