Embed Size (px)
Citation preview
ISEM2016, 3rd International Symposium on Environment and Morality, 4-6 November 2016, Alanya –Turkey
*Mabvuto MWANZA: Address: Solar Energy Institute, Department of Energy Technology, Ege University, 35100, Izmir TURKEY. E-mail address: [email protected], Phone: +905060584392
Assessment of Solar Energy Source Distribution and Potential in Zambia
Mabvuto MWANZA, Jamel CHAKCHAK, Numan S.ÇETIN, Koray ÜLGEN, Solar Energy Institute, Department of Energy Technology Ege University, Turkey
Abstract Zambia is vastly endowed with a wide range of energy resources. Yet, to date, Zambia has not fully exploited its potential in solar energy utilisation for electricity generation due to various reasons such as lack of understanding of the distribution of solar energy potential in the country and limitation of access to solar energy resource information. This paper assess the solar energy distribution and potential in Zambia. Nine provinces with different geographical and climatic regions that makes up Zambia were assesed. The distribution of solar radiation within the country were assessed using spatial analysis in ArcGIS Software. The 22year period solar datasets were considered for assessment. These datasets were obtained from NASA Atmospheric Science Data Center using Surface Meteorology and Solar Energy. The analyzed results indicate that Zambia has approximately 20,442TWh/year technical solar energy potential and receives 2109.97kWh/m2 of solar energy per year with 4403.12hours of sunshine. The country has 186,121km2 available and suitable land area for RETs implementations. This study is important as it present an overview of the technical solar energy potential for Zambia which is vital for decision making, energy mix and sustainable deployment of solar energy technologies in the country Key words: Solar energy potential, Zambia, Solar Radiation, renewable energy technology (RET), photovoltaic (PV)
1. Introduction
Energy is one of the necessities for the survival of human race. It is also important for the progress of the
nation and essential factor for economic development. In other words, the absence of access to energy has
a negative impact on human race and any country’s economic development. The use of solar energy
technologies nowadays is increasing in the world and most of the countries are trying to follow the move
[1]. It has resulted in studies, in order to assess the energy potentials and show the need to use renewable
energies to protect our planet and the environment around us [1,2]. Nevertheless, sustainable deployment
and implementations of any energy projects and diversification of energy mix within any country, the fırst
step involves identifying and assessing the energy source potential [1,3,4]. However, in most developing
countries like Zambia the availability of solar energy resource information is limited due to lack of wide
distribution of meteorological stations for collecting weather data across the country [1]. It has resulted in
less research and challenges in thorough assessment of solar energy potential in the country. As such,
satellite solar datasets are the best alternative to use for assessing solar energy potential for most developing
countries [3,4,5]. Satellite datasets have been used in many researches and have showed that there was
good correlation with the local measured datasets [4,6].
The paper aims at studying and assessing the solar energy source distribution and potential in Zambia. For
this purpose, the paper focuses on assessing the solar energy potential for nine provinces that makes up
Zambia. As the country is targeting to reach sustainable development goals with the target of increasing
625 www.i-sem.info
M. MWANZA et al./ ISEM2016 Alanya – Turkey
access to energy for rural and urban areas in Zambia [7], therefore, this study is a must and very important
for decision making, generation mix, and deployment of various solar energy technologies in the country.
1.1 The Study Area
1.1.1 Geographic Description
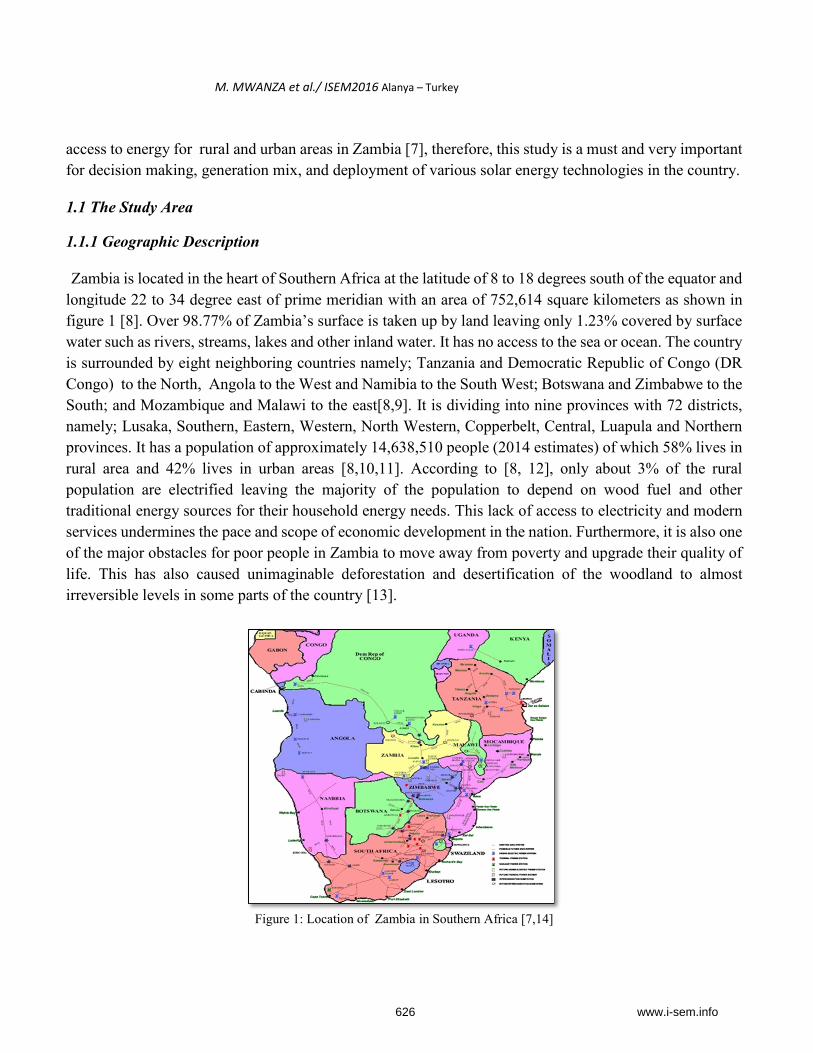
Zambia is located in the heart of Southern Africa at the latitude of 8 to 18 degrees south of the equator and
longitude 22 to 34 degree east of prime meridian with an area of 752,614 square kilometers as shown in
figure 1 [8]. Over 98.77% of Zambia’s surface is taken up by land leaving only 1.23% covered by surface
water such as rivers, streams, lakes and other inland water. It has no access to the sea or ocean. The country
is surrounded by eight neighboring countries namely; Tanzania and Democratic Republic of Congo (DR
Congo) to the North, Angola to the West and Namibia to the South West; Botswana and Zimbabwe to the
South; and Mozambique and Malawi to the east[8,9]. It is dividing into nine provinces with 72 districts,
namely; Lusaka, Southern, Eastern, Western, North Western, Copperbelt, Central, Luapula and Northern
provinces. It has a population of approximately 14,638,510 people (2014 estimates) of which 58% lives in
rural area and 42% lives in urban areas [8,10,11]. According to [8, 12], only about 3% of the rural
population are electrified leaving the majority of the population to depend on wood fuel and other
traditional energy sources for their household energy needs. This lack of access to electricity and modern
services undermines the pace and scope of economic development in the nation. Furthermore, it is also one
of the major obstacles for poor people in Zambia to move away from poverty and upgrade their quality of
life. This has also caused unimaginable deforestation and desertification of the woodland to almost
irreversible levels in some parts of the country [13].
Figure 1: Location of Zambia in Southern Africa [7,14]
626 www.i-sem.info
M. MWANZA et al./ ISEM2016 Alanya – Turkey
1.1.2 Solar Energy Source in Zambia
According to the previous studies and data undertaken by Meteorological Department of Zambia, the
country has a significant potential of solar energy for both power production and thermal from solar energy
technologies. The country is situated at the latitude of 8 to 18 degrees south of the equator and longitude
22 to 34 degrees east of prime meridian with an average sunshine of about 6-8hours per day and monthly
average solar radiation incident rate of 5.5kWh/m2-day throughout the year [7, 13].
To show its commitment in increasing access to energy, the Government of Zambia through Rural
Electrification Authority (REA) has embanked in PV projects such as installation of a 60 kW solar Off-
min grid in Mpanta, Samfya district of Luapula Province, which is supplying about 50 households [14-19].
Furthermore, REA has installed about 250 solar PV systems in schools and buildings of traditional
authorities as well as 400 solar home systems under the Energy Service Companies (ESCO) pilot project
[7, 16, 19].
However, a thoroughly assessment of the solar energy potential in terms of distribution and extractable
potential for energy generation throughout the country has not been done. For this reason, this study is
important to undertake a thorough assessment of solar energy potential in Zambia in order to help the
decision makers and accelerate RETs deployment in the country [7].
2. Materials and Methodology
There are four main types of solar energy potential assessment, namely: resource potential, technical
potential, economic potential and market potential as shown in figure 1[20]. However, currently the
assessment of solar energy potential in many countries including Zambia often results only in theoretical
resource potential (resource potential) which only indicate the amount of radiation at the country’s surface.
Nevertheless, for decision-making and sustainable deployment of solar energy technologies, it is extremely
important to know how much of the available resource potential is extractable for use i.e. technically in
terms of capacity and generation [1, 21, 22].
Thus, based on the previous works done in various countries the methodology used in this study was build
[1-6, 20-30]. The methodology aimed at assessing the solar energy potential that is extractable for future
energy mix in Zambia. The approach considers solar radiation, sunshine hours and available suitable land
areas for PV implementation as the basic input for analysis. The procedure involved four main steps.
Firstly, ArcGIS was used to create small zones for the study area. The study area was then divided into 130
zones, then several satellite datasets i.e. solar datasets has been extracted within each zones from several
points (square) which is made up of latitude and longitude . Thereafter, data has been prepared in excel
for use in ArcGIS for spatial analysis. The restricted areas for RET implementation have been also extracted
from various literatures. For simulation, both ArcGIS and analytical approach (excel) have been used to
generate the solar energy source distribution maps for Zambia.
627 www.i-sem.info
M. MWANZA et al./ ISEM2016 Alanya – Turkey
The outcome of this study is the solar energy potential and its distribution within Zambia. Based on solar
energy indicators used in previous studies for different countries and regions [1-6, 20-30] the following
indicators have been chosen; Monthly average daily solar radiation, total annual solar energy, solar power
density, sunshine hours, theoretical and technical power and energy generation. These indicators have been
used to quantify the solar energy potential and its distribution within Zambia. The final step involved
analysis of the results to form the conclusion on the solar energy potential and its distribution in Zambia.
2.1 Theory/ Mathematical Models
2.1.1 Array Model
The technical solar energy potential is the energy produced by the arrays taking into consideration the
efficiency of the PV technology and some other factors such as losses due to weather condition i.e
temperature and dirt covering the module, and the losses due to power conditioning[29]. Therefore, the
energy available for consumption is given as:
.11.. CppRPVAC HAE (1)
Where EA is energy output of PV system (kWh/year), APV is array Area (m2), HR is solar radiation on the
module (kWh/m2-year), p is module efficiency, λp is miscellaneous module losses(i.e due to dirt covering
assumed at 10%), and λC is power conditioning losses, assumed at 5%.
Module efficiency is a function of its nomial efficiency, r which is measured at a reference temperature
Tr=250C [29]. İt is calculated as:
TT rcrp 1
.. (2)
Where is temperature coefficient for module efficiency, Tc is module temperature, and
Tr is reference temperature. Module temperature is related to the average monthly ambient temperature Ta
[29,30] as given below:
)25(1.1)300(0175.030 ..; TaGtT C
(3)
Where Gt is solar irradiance (W/m2) and Ta is ambient Temperature (0C)
2.1.2 Capacity Factor Model
The capacity factor is a model used to show the amount of energy delivered by an electric power generation
system [4]. It is defined as the ratio of the output actual annual energy generated by PV system to the
amount of energy the PV system would generate if it is operated continuously at full rated power for 8760
hours in a year and it is expressed as[4]
PE
CFPV
AC
8760.
(4)
628 www.i-sem.info
M. MWANZA et al./ ISEM2016 Alanya – Turkey
Where CF is capacity factor (%), EAC is actual annual energy output [kWh/year], and PPV is full rated PV
power [kWp]
2.1.3 Solar Energy Potential Model
A. Theoretical Potential Model
Theoretical solar enrgy potential involves the assessment of the solar energy that is received on the surface
of the study area. This potential involves identifying the study area boundary and the size of the study land
area, including annual average daily solar radiation magnitude. Thus, the theoretical potential has been
calculated using the eq. 5;
THAE TSHPSTH.. (5)
Where EG is theoretical Solar energy potential (MWh/year), AADS is active Surface Area (km2), HR is Solar
Irradiance (MW/km2), and TT is Yearly total Sunshine hours (hours/year)
B. Geographical Potential Model
Geographical solar energy potential involves assessing the solar energy that is received on the available
and suitable land area[23]. Thus, the process of assessing this potential involved firstly excluding the
restricted land areas for solar energy technologies deployment such as agriculture areas, roads, surface
water bodies areas, protected national parks, game reserves and forest reserves, areas under the
transmission and distribution line and unsuitable land area for solar energy technologies deployment and
development such as lands with bad slopes of more than 3% slopes[20, 23]. Therefore, the remaining land
area has been taken as the most suitable land area for solar energy technologies deployment, which was
estimated at 24.73% of the total surface area of Zambia. Thus, the geographical solar energy potential has
been estimated as.
..HAE RAOSG (6)
Where EG is Geographical Solar energy potential (kWh/year), AADS is Available Suitable Area (m2), and
HR is Total average yearly solar radiation (kWh/m2-year).
C. Technical Potential Model
Utility-scale photovoltaic is define as a large-scale PV power plant that can be deployed within the
boundaries of the country on an open space [20]. The process of assessing the extractable energy potential
from the sun for any country involves firstly by excluding areas not suitable for utility-scale PV systems
within the defined boundaries[20, 23]. Considering technical characteristics of PV systems to convert the
solar energy to electrical energy, the technical solar energy potential has been estimated using eq. 7 [20,
23]:
629 www.i-sem.info
M. MWANZA et al./ ISEM2016 Alanya – Turkey
TCFpAE TSHPDAOST .... (7)
Where ET is Solar Energy Potential (MWh/year), AADS is Study Area Available Suitable Area (km2 ), PPD
is Study Area Power density (MW/km2), CF is Study Area Capacity factor (%), and TTSH is
8760(hours/year).
3.Results And Discussion
3.1 Solar Data Analysis
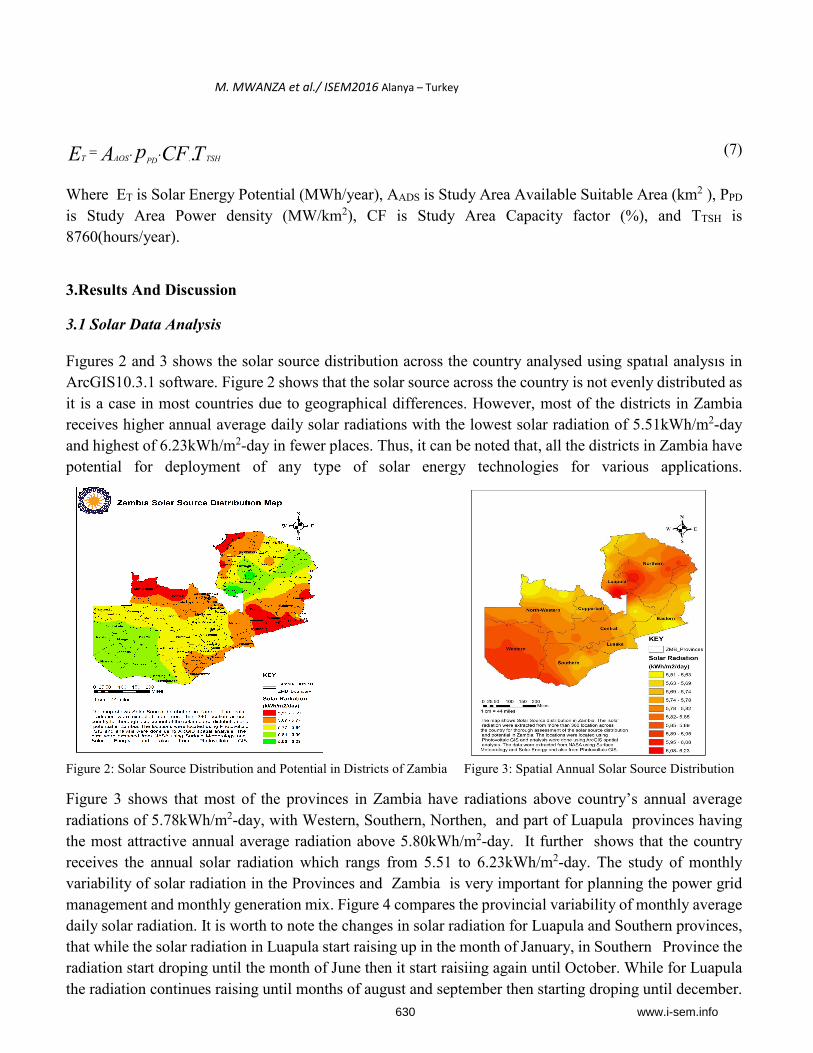
Fıgures 2 and 3 shows the solar source distribution across the country analysed using spatıal analysıs in
ArcGIS10.3.1 software. Figure 2 shows that the solar source across the country is not evenly distributed as
it is a case in most countries due to geographical differences. However, most of the districts in Zambia
receives higher annual average daily solar radiations with the lowest solar radiation of 5.51kWh/m2-day
and highest of 6.23kWh/m2-day in fewer places. Thus, it can be noted that, all the districts in Zambia have
potential for deployment of any type of solar energy technologies for various applications.
Figure 2: Solar Source Distribution and Potential in Districts of Zambia Figure 3: Spatial Annual Solar Source Distribution
Figure 3 shows that most of the provinces in Zambia have radiations above country’s annual average
radiations of 5.78kWh/m2-day, with Western, Southern, Northen, and part of Luapula provinces having
the most attractive annual average radiation above 5.80kWh/m2-day. It further shows that the country
receives the annual solar radiation which rangs from 5.51 to 6.23kWh/m2-day. The study of monthly
variability of solar radiation in the Provinces and Zambia is very important for planning the power grid
management and monthly generation mix. Figure 4 compares the provincial variability of monthly average
daily solar radiation. It is worth to note the changes in solar radiation for Luapula and Southern provinces,
that while the solar radiation in Luapula start raising up in the month of January, in Southern Province the
radiation start droping until the month of June then it start raisiing again until October. While for Luapula
the radiation continues raising until months of august and september then starting droping until december.
630 www.i-sem.info
M. MWANZA et al./ ISEM2016 Alanya – Turkey
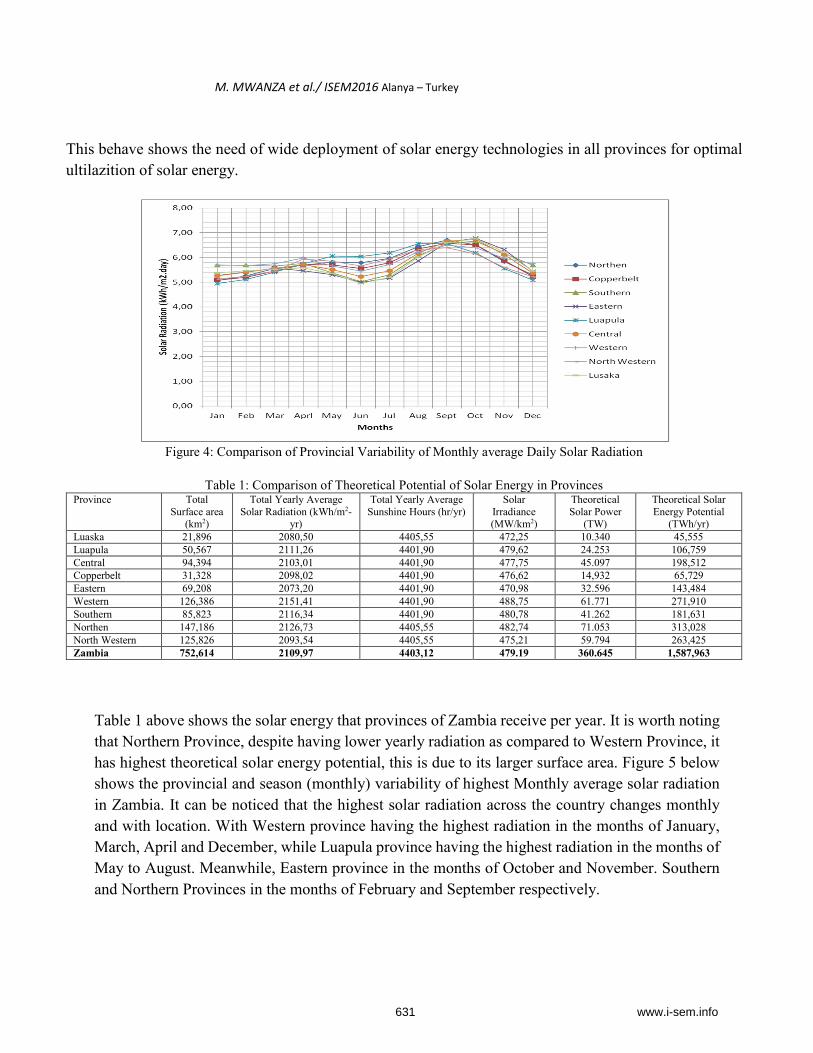
This behave shows the need of wide deployment of solar energy technologies in all provinces for optimal
ultilazition of solar energy.
Figure 4: Comparison of Provincial Variability of Monthly average Daily Solar Radiation
Table 1: Comparison of Theoretical Potential of Solar Energy in Provinces Province Total
Surface area (km2)
Total Yearly Average Solar Radiation (kWh/m2-
yr)
Total Yearly Average Sunshine Hours (hr/yr)
Solar Irradiance (MW/km2)
Theoretical Solar Power
(TW)
Theoretical Solar Energy Potential
(TWh/yr) Luaska 21,896 2080,50 4405,55 472,25 10.340 45,555
Luapula 50,567 2111,26 4401,90 479,62 24.253 106,759
Central 94,394 2103,01 4401,90 477,75 45.097 198,512
Copperbelt 31,328 2098,02 4401,90 476,62 14,932 65,729
Eastern 69,208 2073,20 4401,90 470,98 32.596 143,484
Western 126,386 2151,41 4401,90 488,75 61.771 271,910
Southern 85,823 2116,34 4401,90 480,78 41.262 181,631
Northen 147,186 2126,73 4405,55 482,74 71.053 313,028
North Western 125,826 2093,54 4405,55 475,21 59.794 263,425
Zambia 752,614 2109,97 4403,12 479.19 360.645 1,587,963
Table 1 above shows the solar energy that provinces of Zambia receive per year. It is worth noting
that Northern Province, despite having lower yearly radiation as compared to Western Province, it
has highest theoretical solar energy potential, this is due to its larger surface area. Figure 5 below
shows the provincial and season (monthly) variability of highest Monthly average solar radiation
in Zambia. It can be noticed that the highest solar radiation across the country changes monthly
and with location. With Western province having the highest radiation in the months of January,
March, April and December, while Luapula province having the highest radiation in the months of
May to August. Meanwhile, Eastern province in the months of October and November. Southern
and Northern Provinces in the months of February and September respectively.
631 www.i-sem.info
M. MWANZA et al./ ISEM2016 Alanya – Turkey
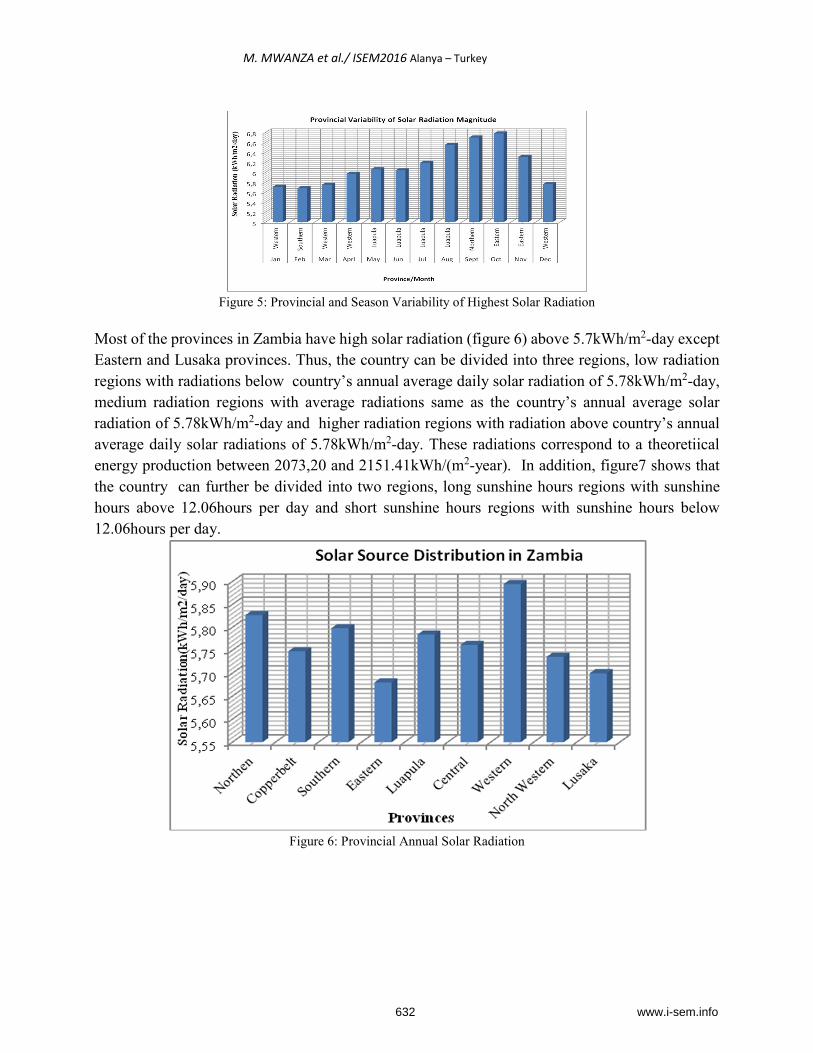
Figure 5: Provincial and Season Variability of Highest Solar Radiation
Most of the provinces in Zambia have high solar radiation (figure 6) above 5.7kWh/m2-day except
Eastern and Lusaka provinces. Thus, the country can be divided into three regions, low radiation
regions with radiations below country’s annual average daily solar radiation of 5.78kWh/m2-day,
medium radiation regions with average radiations same as the country’s annual average solar
radiation of 5.78kWh/m2-day and higher radiation regions with radiation above country’s annual
average daily solar radiations of 5.78kWh/m2-day. These radiations correspond to a theoretiical
energy production between 2073,20 and 2151.41kWh/(m2-year). In addition, figure7 shows that
the country can further be divided into two regions, long sunshine hours regions with sunshine
hours above 12.06hours per day and short sunshine hours regions with sunshine hours below
12.06hours per day.
Figure 6: Provincial Annual Solar Radiation
632 www.i-sem.info
M. MWANZA et al./ ISEM2016 Alanya – Turkey
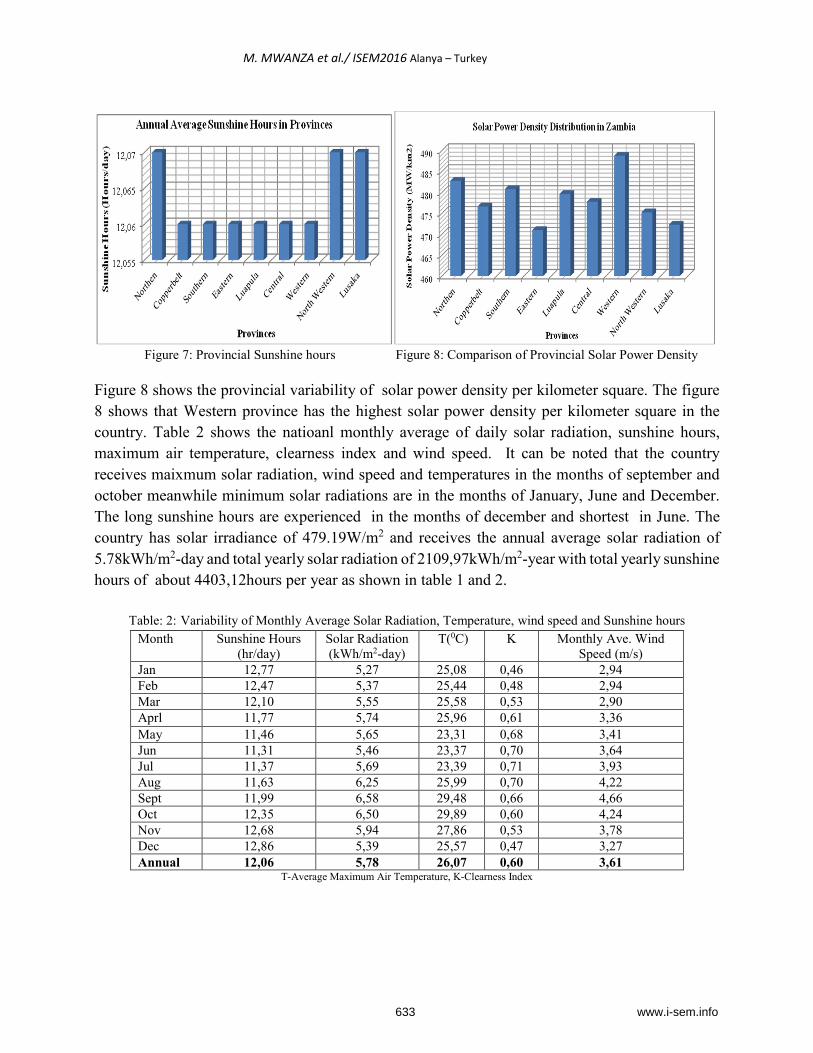
Figure 7: Provincial Sunshine hours Figure 8: Comparison of Provincial Solar Power Density
Figure 8 shows the provincial variability of solar power density per kilometer square. The figure
8 shows that Western province has the highest solar power density per kilometer square in the
country. Table 2 shows the natioanl monthly average of daily solar radiation, sunshine hours,
maximum air temperature, clearness index and wind speed. It can be noted that the country
receives maixmum solar radiation, wind speed and temperatures in the months of september and
october meanwhile minimum solar radiations are in the months of January, June and December.
The long sunshine hours are experienced in the months of december and shortest in June. The
country has solar irradiance of 479.19W/m2 and receives the annual average solar radiation of
5.78kWh/m2-day and total yearly solar radiation of 2109,97kWh/m2-year with total yearly sunshine
hours of about 4403,12hours per year as shown in table 1 and 2.
Table: 2: Variability of Monthly Average Solar Radiation, Temperature, wind speed and Sunshine hours
Month Sunshine Hours (hr/day)
Solar Radiation (kWh/m2-day)
T(0C) K Monthly Ave. Wind Speed (m/s)
Jan 12,77 5,27 25,08 0,46 2,94 Feb 12,47 5,37 25,44 0,48 2,94 Mar 12,10 5,55 25,58 0,53 2,90 Aprl 11,77 5,74 25,96 0,61 3,36
May 11,46 5,65 23,31 0,68 3,41 Jun 11,31 5,46 23,37 0,70 3,64 Jul 11,37 5,69 23,39 0,71 3,93 Aug 11,63 6,25 25,99 0,70 4,22 Sept 11,99 6,58 29,48 0,66 4,66 Oct 12,35 6,50 29,89 0,60 4,24 Nov 12,68 5,94 27,86 0,53 3,78 Dec 12,86 5,39 25,57 0,47 3,27 Annual 12,06 5,78 26,07 0,60 3,61
T-Average Maximum Air Temperature, K-Clearness Index
633 www.i-sem.info
M. MWANZA et al./ ISEM2016 Alanya – Turkey
The polycrystalline sillicon module with the following parameters: temperature coefficient of -
0.47%/0C, efficiency of 15.24%, area of 1.64m2 and power rating of 250Wp has been used to
analyze the technical potential [31]. Table 3 below summarizes the results of the study. Zambia on
average has solar energy potential of 2109,97kWh/m2-year with average sunshine of 4403,12hours
per year. It has a total suitable land area for utility-scale PV implementation of about 186,121km2
which accounts for 24.73% of the Zambia’s total surface area. This area corresponds to
geographical solar energy potential of 392,701TWh per year. Taking into consideration capacity
factor which was estimated at 22.55% using Polycrystalline PV technologies, power density of
55.6MW/km2 and the monthly temperature effect on the PV module, the country has technical solar
energy potential of about 20,442TWh/year.
Table 3: Solar Energy Potential in Zambia
Total Surface Area
Suitable Area Annual Average
Solar Energy Potential
Sunshine Hours
Solar Power Density
km2 km2 kWh/m2-day kWh/m2-year hrs/year MW/km2 752,614 186,121 5,78 2109,97 4403,12 55,6
Solar Energy Potentials
Theoretical Potential Geographical Potential Technical Potential
TW TWh/year TW TWh/year TW TWh/year
360.645 1.6million 89.187 392,701 10.348 20,442
4. Conclusion
The study has presented the overview of the theoretical, geographical and technical potentials of
solar energy and its distribution in Zambia. The study has shown that, the country have high
technical potential of solar energy for PV electricity generation and various applications. It has also
presented variability and ranges of magnitude of monthly average daily solar radiation in Zambia.
From the results presented in the study, it shows that the daily solar radiation in Zambia varies
depending on season. The analyzed results further indicate that Western province has the highest
annual average solar radiation of 5.89kWh/m2-day while the Eastern province has the lowest
radiation of 5.68kWh/m2-day. It is can be concluded that, almost all the provinces in Zambia
experience a good solar radiation ranges. The Western province has an annual average solar
radiation range of 5.44-6.50kWh/m2-day, while Eastern province experiences the range of 4.99-
6.78kWh/m2-day. On the other hand, the Southern and Northern provinces have an annual average
solar radiation ranges of 5.03-6.66kWh/m2-day and 5.07-6.70kWh/m2-day respectively.
Meanwhile, the Northwestern province experiences an annual average solar radiation range of
5.13-6.40kWh/m2-day and Central province receives an annual average solar radiation range of
5.23-6.74kWh/m2-day. Furthermore, the Copperbelt province and Luapula province experiences
an annual average solar radiation of ranges 5.08-6.57kWh/m2-day and 4.95-6.55kWh/m2-day
respectively. The country generally, receives annual average daily solar radiation of 5.78kWh/m2-
634 www.i-sem.info
M. MWANZA et al./ ISEM2016 Alanya – Turkey
day at ambient temperature of 26.070C with clearness index of 0.60 and wind speed of 3.61m/s. In
same vain, the country experiences a total yearly average solar energy of 2109.97kWh/m2-year
with yearly total avarage sunshine of 4403.12 hours. Having the total surface area of 752,614km2,
the country receives solar energy of 1.59million TWh per year on the horizontal surface. The total
estimated solar energy geographical and technical potential for utility-scale photovoltaic
technology are 392,701TWh/year and 20,442TWh/year respectively. Zambia has higher estimated
technical potential due to relatively high solar radiation, sunshine hours, good temperatures and
the availability of large suitable flat land areas for PV technology deployment. Therefore, with an
ever-increasing population, deforestation, energy demand, and droughts which is affecting the
hydropower systems, which is the main source for electrical energy in the country, solar energy
appears to be one of the best effective solution for production of sustainable and clean energy in
energy generation mix in Zambia.
References
[1] LIU Guangxu, WU Wenxıang, GE Quansheng, DAI Erfu, WAN Zhıweı, ZHOU Yang, 2011,’GIS-based assessment of roof-mounted solar energy potential in Jiangsu, China’,2011 Second International Conference on Digital Manufacturing and Automation.
[2] Ahmed Belhamadia, Muhamad Mansor, Mahmoud A.Younis, 2013, ‘’Assessment of Wind and Solar Energy Potentials in Malaysia’’, 2013 IEEE Conference on Clean Energy and Technology (CEAT).
[3] L.M. Ayompe, A.Duffy, 2014, An assessment of the energy generation potential of photovoltaic systems in Cameroon using satellite-derived solar radiation datasets, Sustainable Energy Technologies and Assessments 7 (2014) 257-264, ScienceDirect.
[4] M.Pendieu Kwaye, J.Bendfeld, N.Anglani, 2015, ‘Assessment of Renewable Energy Resources in Cameroon and Special Regards on Energy Supply’.
[5] Chumnong Sorapipatana, 2010, An assessment of solar energy potential in Kampuchea’, Renewable and Sustainable Energy Review 14(2010) 2174-2178 ScienceDirect.
[6] Njomo D, Wald L, 2006, ‘’Solar radiation retrieval in Cameroon from Meteosat satellite imagery using the Heliosat_2 method’’, Sci Technol Vis 2006; 2(1): 19-24.
[7] Gauri Singh, Safiatou Alzouma Nouhou, Mohamed Youba Sokana, 2013, ‘’Zambıa Renewable Readıness Assessment’’ International Renewable Energy Agency (IRENA) 2013 report..
[8] Likonge Makai, Marta Molinas (2013). Biogas-An Alternative Household Cooking Technique for Zambia”, IEEE Conference, 2013.
[9] Prof. Dr. Imasiku A. Nyambe, Miriam Feilberg, ‘’ Zambia- National Water Resources Report for WWDR3; Theme-Water in a Changing World’’, Repubulic of Zambia, Ministry of Energy and Water Development. Pp 6-50
[10] Index Mundi, www.indexmundi.com [11] NWASCO, 2014,’Urban and Peri-Urban Water Supply and Sanitation Sector Report 2014’’,
pp 2
635 www.i-sem.info
M. MWANZA et al./ ISEM2016 Alanya – Turkey
[12] Africa-EU Energy Partnership (2013). Zambia Power Sector Market Brief: Zambia. http://www.ruralelec.org/fileadmin/DATA/Documents/06_Publications/Market_intelligence/AEEP_Zambia_Power_Sector_Market_Brief_EN.pdf
[13] Ministry of Mines, Energy and Water Development of Zambia[MEWD] (2008). National Energy Policy. http://www.mewd.gov.zm/
[14] ZESCO (2013b) , ‘Electricity Infrastructure Development for Economic Growth’’, North CPD presentation. pg12
[15] Energy Regulation Board (ERB), 2010b, ‘’State of Infrastructure report’’, Lusaka. [16] H.Walimwipi, Snow Systems Zambia, 2012,’’Investment Incentives for Renewable Energy
in Southern Afirca: Case Study of Zambia’’, International Institute for Sustainable Development (IISD) December 2012.
[17] Department of Energy (DoE), 2010, ‘’Draft Renewable Energy Strategy for Zambia’’, Department of Energy.
[18] United Nations Industrial Development Organization, 2009, ’UNIDO and Renewable Energy; Greening the Industrial Agenda’ Vienna, 2009.
[19] Mwansa Kaoma, Shadreck Mpanga, Mabvuto Mwanza, Mundia Muya, Donat Ngendo, Ackim Zulu, et al, 2015,’State of Renewavble Energy Technologies in Southern African’’International Conference on Clean Energy for Sustainable Growth in Developing Countries, September 16-18 2015, Palapye, Botswana
[20] Anthony Lopez, Billy Roberts, Donna heimiller, Nate Blair, Gian Porro, 2012,’’U.S Renewable Energy Technical Potentials: A GIS-Based Analysis’’ Technical Report NREL/TP-6A20-5146, July 2012.
[21] Ottmar Edenhofer, Ramon Pichs-Madruga, Youba Sokona, 2012‘’Renewable Energy Sources and Climate Change Mitigation: Summary for Policymakers and Technical Summary’’. Special report of the Intergovernmental Panel on Climate Change IPCC, 2011, Intergovernmental Panel on Climate Change, ISBN 978-92-9169-131-9.
[22] DOE Office of Energy Efficiency and Renewable Energy (EERE). (October 2006 updated January 2011).’’Report to Congress on Renewable Energy Resource Assessment Information for the United States.’’ January 2011 (EPACT) Prepared by the National Renewable Energy Laboratory.
[23] Yan-wei Sun, Angela Hof, Run Wang, Jian Liu, Yan-jie Lin, De-wei Yang, 2013‘’GIS-based approach for potential analysis of solar PV generation at the regional scale: A case study of Fujian Province’’ Energy Policy 58 (2013) 248-259, ScienceDirect.
[24] Doug Dahle, Dennis Elliott, Donna Heimiller, Mark Mehos, Robi Robichaud, Marc Schwartz, Byron Stafford, Andy Walker, 2008,’’Assessing the Potential for Renewable Energy Development on DOE Legacy Management Lands’’. NREL, DOE/GO-102 008-2435, February 2008
[25] Pourian Alamdari, Omid Nematollahi, Ali Akbar Alemrajabi, 2013,’ Solar energy potentials in Iran: A review’ Renewable and sustainable energy reviews 21 (2013) 778-788, ScienceDirect.
[26] Serhat Sensoy, Yusuf Ulupinar, Mesut Demircan, Ilker Alan, Zuhal Akyurek, Pinar A.Bostan, 2010, ‘Modeling Solar Energy Potential in Turkey’.
[27] Rodrigo A. Escobar,Alberto Ortega, Cristian Cortes, Alan Pinot, Enio Bueno Pereira, Fernando Ramos Martins, et al 2014’’ Solar Energy Resource Assessment in Chile: Satellite
636 www.i-sem.info
M. MWANZA et al./ ISEM2016 Alanya – Turkey
estimation and ground station measurement’’, Energy Procedia 57 (2014) 1257-1265, ScienceDirect.
[28] Anwar Mustefa Mahmud, Mulu Bayray Kahsay, Asfafaw Hailesilasie, Ftwi Yohanness Hagos, Petros Gebray, Hailay Kiros Kelele, et al, 2014’’ Solar Energy Resource Assessment of the Geba Catchment, Northern Ethiopia’’, Energy Procedia 57 (2014) 1266-1274, ScienceDirect.
[29] Didler Thevenard, Gregory leng, Sylvain Martel,’’The RETScreen model for assessing potential of PV projects’’.
[30] Evans DL. 1981 ‘’Simplified method for predicting photovoltaic array output’’. Solar Energy 27,6(1981)555-560.
[31] http://www.alibaba.com/product-detail/High-efficiency-good-price-pv solar
637 www.i-sem.info