Embed Size (px)
Citation preview

ASSESSMENT OF THE POTENTIAL UTILIZATION OF
SUGARCANE DERIVED PRESS MUD FOR ELECTRICITY
GENERATION IN SOUTH NYANZA SUGAR ZONES, KENYA
EVANS OCHIENG NYONJE
MASTER OF SCIENCE
(Energy Technology)
JOMO KENYATTA UNIVERSITY OF
AGRICULTURE AND TECHNOLOGY
2018

Assessment of the Potential Utilization of Sugarcane Derived Press
Mud for Electricity Generation in South Nyanza Sugar Zones,
Kenya
Evans Ochieng Nyonje
A Thesis Submitted in partial Fulfilment of the Requirements for
the Award of the Degree of Master of Science in Energy Technology
of Jomo Kenyatta University of Agriculture and Technology
2018

ii
DECLARATION
This thesis is my original work and has not been presented for the award of degree in
any other University.
Signature______________________________ Date __________________________
Evans Ochieng Nyonje
This thesis has been submitted for examination with our approval as University
Supervisors.
Signature________________________________Date________________________
Dr Paul Njogu, PhD
JKUAT, Kenya
Signature___________________________ Date_____________________________
Prof. Robert Kinyua, PhD
JKUAT, Kenya

iii
DEDICATION
This thesis is especially dedicated to my loving family for the love and care you have
given me throughout the period of my studies. The support and endurance they have
shown, making this thesis much easier to be completed cannot pass unmentioned. Our
journey together has not only given me success in this work but has also strengthened
my love for all of you. Thank you and the Almighty God repay your generosity
abundantly.

iv
ACKNOWLEDGEMENT
This thesis has become a reality due to the assistance and support of many individuals
and Institutions. First and foremost, I would like to express my greatest gratitude to
my supervisors, Dr. Paul Njogu, and Professor Robert Kinyua. Their guidance and
knowledge have been critical to the achievements and success of the thesis. I am also
thankful to the Mr. Karanja Chief Technologist Food Science Department JKUAT,
and his staff for their support particularly while I was carrying out my experimental
work. I greatly acknowledge the co-operation by the following analysts, Mr. Ima
Olum, Mr Maina, Mr. Githinji all from IEET JKUAT and Mr. Patrice Mulama from
KESREF for their input while working in various laboratories.
I am also indebted to the Collins Nyonje and Flerea Nyaugo who funded the whole
thesis.

v
TABLE OF CONTENTS
DECLARATION ....................................................................................................... ii
DEDICATION .......................................................................................................... iii
ACKNOWLEDGEMENT .......................................................................................iv
TABLE OF CONTENTS .......................................................................................... v
LIST OF TABLES .................................................................................................. vii
LIST OF FIGURES ............................................................................................... viii
LIST OF PLATES.....................................................................................................ix
LIST OF ABBREVIATIONS AND ACRONYMS ..............................................xi
ABSTRACT.............................................................................................................. xii
CHAPTER ONE............................................................................................................. 1
INTRODUCTION .......................................................................................................... 1
1.1 Background of the Study ................................................................................... 1
1.2 Problem Statement ............................................................................................. 5
1.3 Objectives of the Study ...................................................................................... 5
1.4 Hypothesis .......................................................................................................... 5
1.5 Justification ......................................................................................................... 6
CHAPTER TWO ........................................................................................................... 7
LITERATURE REVIEW ............................................................................................. 7
2.1 Overview ............................................................................................................. 7
2.2 Anaerobic digestion process ............................................................................ 12
2.3 Important AD operating parameters................................................................ 13
2.4 Chemistry of Biogas ......................................................................................... 15
2.5 Biogas quality ................................................................................................... 16
2.6 Biogas upgrading .............................................................................................. 17
2.7 Conversion of Biogas to Electricity ................................................................ 19

vi
CHAPTER THREE ..................................................................................................... 22
MATERIALS AND METHODS ............................................................................... 22
3.0 Introduction ................................................................................................. 22
3.1 Experimental design ......................................................................................... 22
3.2 Area of the Study .............................................................................................. 22
3.3 Step 1: Feed stock Characterization ................................................................ 24
3.4 Step 2: Production and analysis of raw biogas ............................................... 28
3.5 Step 3: Biogas composition analysis ............................................................... 34
3.6 Step 4: Biogas Upgrading and Electricity generation .................................... 37
3.7 Data management and analysis ....................................................................... 38
CHAPTER FOUR ........................................................................................................ 39
RESULTS AND DISCUSSION ................................................................................. 39
4.1 Feed stock characterization.............................................................................. 39
4.2 Design and Fabrication of laboratory scale bioreactor .................................. 41
4.3 Biogas production and Process Study ............................................................. 42
4.4 Biogas composition analysis............................................................................ 47
4.5 Electricity Generation using SDPM biogas .................................................... 50
CHAPTER FIVE .......................................................................................................... 56
CONCLUSION AND RECOMMENDATIONS ..................................................... 56
5.1 Conclusion ........................................................................................................ 56
5.2 Recommendations ............................................................................................ 57
5.3 Further research is recommended in the following areas: ............................. 57
REFERENCES ............................................................................................................. 58
APPENDICES .............................................................................................................. 64

vii
LIST OF TABLES
Table 2.1 Gas yield from press mud............................................................................... 9
Table 2.2: Characteristics of the sugar press mud ....................................................... 10
Table 3.1: GPS coordinates .......................................................................................... 23
Table 3.2: GC Operating Parameters ........................................................................... 35
Table 4.1: Characteristics of the sugar press mud (source: Author) .......................... 39
Table 4.2: Composition Data for SDPM Raw biogas ................................................. 48
Table 4.3: Composition analysis for raw biogas from other feed stock .................... 48
Table 4.4: Composition Analysis for cleaned SDPM biogas ..................................... 49
Table 4.5 : Composition analysis for clean biogas from water hyacinth ................... 49
Table 4.6: Gas elemental composition based on percentage of elements by weight 51
Table 4.7: Output percentage composition of Biogas ................................................. 51
viii
LIST OF FIGURES
Figure 1.1: A schematic diagram of formation of press mud waste in sugar ............. 2
Figure 2.1: Schematic of a biogas plant used for power generation. ........................ 20
Figure 3.1: Map of the Research Study (Google Earth 18/5/2018) ....................... 23
Figure 3.2: Design of the bioreactor ........................................................................... 29
Figure 4.1: The schematic diagram represents the whole production process of Biogas
................................................................................................................................ 42
Figure 4.2: Biogas production against Time .............................................................. 44
Figure 4.3: Cumulative biogas Volume against Time ............................................... 45
Figure 4.4: Comparative cumulative gas yield from different feedstock ................. 46
Figure 4.5: Voltage Levels during electricity conversion ......................................... 55

ix
LIST OF PLATES
Plate 1.1: Collected press mud ...................................................................................... 3
Plate 1.2: Press mud from the vacuum rotary ............................................................... 4
Plate 2.1: A rotary vacuum filter for removal of press mud in Transmara Sugar
Factory ...................................................................................................................... 9
Plate 2.2: Wet scrubber ................................................................................................ 18
Plate 3.1: Laboratory Furnace .................................................................................... 24
Plate 3.2: Laboratory Oven and Weighing Machine................................................. 25
Plate 3.3: Samples for Pol analysis and Sccharimeter machine ................................ 26
Plate 3.4: Analysis of Nitrogen by use of Kjeldahl instrument and Titration .......... 27
Plate 3.5: pH Analysis .................................................................................................. 28
Plate 3.6: Fabrication process ...................................................................................... 30
Plate 3.7: setting up of digester ................................................................................... 30
Plate 3.8: Weighing of the raw material ..................................................................... 31
Plate 3.9: Mixing of feed stock.................................................................................... 32
Plate 3.10: Loading of bioreactor (plate a.) ................................................................ 33
Plate 3.11: Biogas production plate a and b, meter reading plate c. and burner d. .. 34
Plate 3.12: Show the process of gas collection and lab analysis process ................. 36
Plate 3.13: Electricity generation ................................................................................ 38
Plate 4.1 : Bioreactor set up ......................................................................................... 42

x
LIST OF APPENDICES
Appendix 1: Published paper and Proceedings ........................................................... 64
Appendix 2: Individual Sugar industry SDPM results ............................................... 65

xi
LIST OF ABBREVIATIONS AND ACRONYMS
AD Anaerobic Digestion
CH4 Methane
CO2 Carbon Dioxide
CV Calorific Value
GC Gas Chromatography
MoE Ministry of Energy
JKUAT Jomo Kenyatta University of Agriculture and Technology
LPG Liquefied Petroleum Gas
PVC Polyvinyl chloride
TS Total Solid
VS Volatile Solid
SONY South Nyanza Sugar Company
KESREF Kenya Sugar Research Foundation
IEET Institute of Energy and Environmental Technology
C/N Carbon to Nitrogen ratio
SDPM Sugar Derived Press Mud
CHP Combined Heat and Power
OLR Organic Loading Rate

xii
ABSTRACT
Sugarcane derived press mud (SDPM) is among the 3 major by-products found in the
process of raw sugar production; these are Bagasse, Press Mud and Molasses. A
precipitate, which is called press mud weighs about 4-5% of the cane weight. The aim
of this study was to assess the potential for utilization of sugarcane derived press mud
as a renewable energy resource for biogas production and generation of electricity.
Sugar derived press mud samples were collected from South Nyanza Sugar zones
(SONY, Sukari industries and Transmara Sugar Companies). Chemical treatment and
characterization analysis of its parameters were carried out at Kenya Sugar Research
Foundation laboratories in Kisumu City. Production of biogas and biogas composition
analysis was carried at JKUAT. Samples taken to JKUAT were blended with cow
dung at a ratio of 3:1 as inoculum. The gas compositions, upgrading and gas yields
were studied. The result of the compositional analysis of the sugarcane press mud
from the three sugar factories had variations of (p≤0.05) in all parameters analysed.
Average values were: Moisture content 63.1 ±1.0%, ash content 16.1 ±1.0%, C/N
ratio 19.6 ±1.0% and pH 7.3-7.6. Biogas was found to contain 40% - 52% methane
(CH4), 30% - 32% carbon dioxide (CO2), 13% - 15% nitrogen (N2) and 1%-2%
hydrogen sulphide (H2S).The raw biogas was upgraded using solid adsorbents and
wet scrubbers increasing the methane content up to 70% - 71% this was good
concentration compared to the upgraded biogas from water hyacinth of 70%-76%.
From theoretical calculations using Buswell equation, it was found that for every 1kg
of mixed SDPM and cow Dung (inoculant) we can generate 72.0 kWh. When a small
generator was used to produce electric power with the clean biogas 1M3 produced
3.54kWh. And when the annual potential of SDPM biogas converted to electric power
it was found that it could produce 453.5MWh per annum. The study concludes that
sugarcane press mud is a potential feedstock for biogas production. For 1kg of SDPM
produced 2.341/kg and the annual potential of SDPM biogas converted to electric
power was approximated at 453.5MWh per annum

1
CHAPTER ONE
INTRODUCTION
1.1 Background of the Study
The ever increasing global energy demand has necessitated research in new renewable
energy technologies that aim at producing clean power. Biogas being a clean, cheap
and environmentally friendly fuel stands out as one of them. For Kenya to achieve its
target of becoming industrialized nation by 2030, a reliable supply of quality energy
is crucial (GOK, 2008). Interest in bio-fuels has been increasing, motivated on one
hand by the need for reducing greenhouse gases (GHG) emission and on the other
hand by the desire to improve energy security by reducing dependence on largely
imported fossil fuels. The government has enacted a policy (GOK, 2004) and
legislation (GOK, 2006) which seeks to ensure sufficient biomass supplies to meet
demand on a sustainable basis while minimizing the associated impacts. Majority of
people living in the rural areas use biomass, mainly “wood-derived-fuel” as the source
of energy for cooking and lighting. However, the potential of biogas has not been
effectively utilized in the provision of energy. Continued over-dependence on the
unsustainable “wood-derived-fuel” and other forms of biomass to meet household
energy needs has contributed to deforestation with negative impacts on the
environment.
From the 19thcentury, the main reason for growing sugarcane in different countries in
the world was for production of sugar (Rolz et al, 2010). Due to energy crises,
scientists and researchers have realized the value of sugarcane, it-s by-products
(bagasse, sugar press mud and Molases) and co-products (fibre and Ethanol).
Sugarcane is processed to sugar and biomass. This biomass contains many
components like lignin, fibre, pith and pentosans, which have plenty of applications
in biochemical and microbial field (Yadav & Solomon, 2006).
Horecky and Saska (2004) reports that the sugar industry produces a number of by-
products during the process of sugar production including bagasse, mill mud or filter
cake, ash, mill effluent, and trash. Most of these wastes contain biodegradable matter.

2
This could be potentially resourceful for biotechnology processes, which can produce
extra by-products for the sugar industry. One possibility is using anaerobic technology
for biogas production.
1.1.1 Sugar Production Process
During the process of raw sugar juice clarification, dissolved and suspended solid
substances are removed to get the clear juice, a precipitate settles at the bottom of the
clarifier which is called sugar cane press mud, also known as filter cake or filter mud.
In sugar factories, during sugarcane juice clarification, press mud is produced as a by-
product, and weighs about 4-5% of the cane weight (Jadhav, 2011). Figure 1.1 shows
the flow chart of Sugar Industry processing to produce Sugarcane Derived press Mud
Figure 1.1: A schematic diagram of formation of press mud waste in sugar
(Source: Neha et al. 2011)
Sugar derived-press mud also known as filter-cake which is rich in organic matter, is
the major source of biogas. The organic matter in the press mud can be tapped through
the anaerobic digestion technology and be used as a source of biogas energy.
Currently, this press-mud is usually dumped as garbage. Some sugar industries make
use of it by converting it into compost. But this compost, along with its advantages,

3
has some disadvantages too: it increases the wax content in the soil. The increase in
wax reduces the porosity of the soil causing reduced penetration and permeability
which is not desirable (Rouf et al., 2010).
Plate 1.1 and 1.2 represent fresh sugar press mud in the conveyer belt and when the
sugar press mud still on the rotary vacuum pan respectively.
Plate 1.1: Collected press mud
Collected Sugar Derived Press Mud

4
Plate 1.2: Press mud from the vacuum rotary
Much work has been carried out in obtaining biogas from various sources such as
kitchen wastes, human wastes, animal wastes and agricultural wastes. The plants
constructed for these purpose are working successfully too. Such biogas plants are
presently used by many people locally for obtaining biogas. As biogas is a non-
polluting with less greenhouse gas emission and renewable energy resource, it is
efficiently replacing the liquefy petroleum gas (Karan et al., 2011)
GTZ-HERA (2010), reported that theoretically, biogas can be converted directly into
electricity using a fuel cell. However, very clean gas and expensive fuel cells are
necessary for this process. This is therefore currently not a practical option. In most
cases, biogas is used as fuel for internal combustion engines, which convert it to
mechanical energy for powering an electric generator to produce electricity.
The work in this thesis was to obtain biogas, from sugarcane derived press-mud which
was anaerobically digested to produce biogas. Biogas produced was used as fuel for
generation of electricity.
Vacuum Rotary

5
1.2 Problem Statement
According to Rouf et al., (2010), press-mud is usually dumped as garbage. Some sugar
industries make use of it by converting it into compost. But this compost, along with
its disadvantages, that is: it increases the wax content in the soil, the increase in wax
reduces the porosity of the soil causing clogging which is not desirable. This does not
in any way benefit the factories economically.
Therefore, making use of sugarcane press-mud for the production of biogas through
the anaerobic digestion is a better option for the benefits of both farmers and Sugar
companies. The biogas obtained can be used for many purposes like fuel in kitchen to
complement liquefy petroleum gas and save the factories in the electricity used by
employees in cooking in their kitchen and also the production of electricity which can
be used in the process. The sludge remaining after production of biogas from press-
mud can be used as a fertilizer as well. This will save the company in its power
expenses and energy balancing.
1.3 Objectives of the Study
1.3.1 Main objective
The main objective of this study was to assess the potential for utilization of sugarcane
derived press mud for electricity production in South Nyanza Sugar zone, Kenya.
1.3.2 Specific objectives
I. To determine Moisture %, Solids %, Volatile matters, Ash %, Fibre %, Sugar
%, C/N ratio and pH value of Sugar Derived Press Mud from South Nyanza
sugar zone.
II. To produce, analyse and compare the composition of raw biogas from the
sugarcane derived press mud.
III. To upgrade biogas using locally available material and study electricity
production using biogas.
1.4 Hypothesis
H0- Biogas produced from Sugar cane derived press mud has no difference from cow
dung derived biogas.

6
1.5 Justification
Kenya’s current effective electricity supply is predominantly sourced from hydro and
fossil fuel (thermal) sources. MoE, 2011, reported that generation energy mix
comprises 52.1% from hydro, 32.5% from fossil fuels, 13.2% from geothermal, 1.8%
from bagasse cogeneration and 0.4% from wind, respectively. Current electricity
demand is 1,191 MW and is projected to grow to about 15,000 MW by 2030. To meet
this demand, Kenya’s installed capacity should increase gradually to 19,200 MW by
2030.
For the government of Kenya to achieve 19,200 MW by 2030, more energy resources
have to be earnest (MoE, 2011). Biomass is renewable energy resource that is
abundant, less environmental pollution and locally available, can be used to gap the
energy scarcity level in Kenya

7
CHAPTER TWO
LITERATURE REVIEW
2.1 Overview
During sugar processing the cane is crushed and juice is separated, bagasse is removed
and sugar press mud which is the solid material left after clarification of cane juice.
These by-products may be used as source of energy but also as a source of nutrients
and as soil ameliorates. The re-use of mill by-products has been mutually beneficial
to the farming community and the milling sectors as well as supporting the industry’s
endeavours (Barry et al., 2000). Sugar mills generate between 20 and 60 kg of mud
per ton of cane crushed (Chapman, 1996). Harvesting conditions affect the extraneous
matter and soil content of the cane supply, which, in turn, affects the quantity of mud.
In Kenya, there are presently 8 sugar mills crushing 20,000 tonnes of cane per day
generating 400 tonnes of sugar press mud, which average about 50 tonnes per mill
(www.kenyasugar.co.ke).
2.1.1 Press mud in sugar industry
Sugarcane press mud is among the 3 major by-products (bagasse, press mud and
molasses) found in the process of raw sugar production process. It is the second by-
product removed as a residue of the filtration of sugarcane juice. The clarification
process separates the juice into a clear juice that rises to the top and goes for
manufacture of sugar and mud that collects at the bottom. The mud is then filtered to
separate the suspended matter, which includes insoluble salts and fine bagasse. There
are 3 types of filters: the press filters (used in carbonation factories), mechanical filters
and rotary vacuum filters (Hugot, 1986).
Karan (2011), reports that, press mud contains 77% volatile solids, lignin, lipids,
cellulose, hemicelluloses, which favours biogas production. It also has good
proportion of nitrogen. This makes it a very good material for generation of bioenergy
(methane) by anaerobic bio-methanation. The advantage of using press mud is that
the sludge coming out from the digester is a good fertilizer and press mud can be used
in combination with other raw materials such as molasses and bagasse to increase the

8
efficiency. Other advantages are:-it is pollution free, waste reduction, flexible use of
biogas etc.
Biogas can be used for all applications designed for natural gas, subject to some
further upgrading, as not all gas appliances require gas of the same quality standards
(www.novaenergie.ch/iea-bioenergy-task37). Biogas can be used for heating using
boilers; the heat has many applications such as being used in the plant or producing
water vapour for sugar processes. Boilers do not have a high gas quality requirement.
Biogas is also used in Combined Heat and Power (CHP) units. CHP units are a good
way to produce efficiently both electricity and heat for the Anaerobic Digester (AD)
plant.
The sugar industry will benefit financially through installing biogas generators, as the
economic analysis reveals that the production of biogas and bio-fertilizer from press
mud is economically feasible. Furthermore, there is triple benefit associated with the
waste bio-methanation as we get clean fuel biogas, enriched manure bio-fertilizer and
also hygienic environment. (Rouf et al., 2013)
The plate 2:1 shows a rotary vacuum during recovery and drying of sugarcane derived
press mud at Transmara Sugar Company.

9
Plate 2.1: A rotary vacuum filter for removal of press mud in Transmara Sugar
Factory
Source: www.transmarasugar.co.ke (2014).
2.1.2 Gas yield from press mud and other waste
The biogas gas yield from sugarcane derived press mud only and when mixed with
other waste is as presented in Table 2:1 below.
Table 2.1 Gas yield from press mud
Substrate Gas yield (L/g)
Press mud 0.241
Press Mud: cow dung (2:1) 0.202
Press mud: cow dung (1:1) 0.167
Press mud: bagasse (2:1) 0.263
Press mud: bagasse (1:1) 0.273
Press mud: cane pith (2:1) 0.290
Press mud: cane pith (1:1) 0.381
(Source: Rouf et al., 2010)
Rotary Vacuum
10
2.1.3 Composition of the sugar press mud
Karan et al (2011), reports that press mud is mainly used as manure in India and other
raw sugar producing countries. It is a soft, spongy, lightweight, amorphous, dark
brown to black coloured material. It generally contains 60-85% moisture; the
chemical composition depends on cane variety, soil condition, nutrients applied in the
field, process of clarification adopted and other environmental factors (Rouf et al,
2010). Press mud from sugar factory typically contains 71% moisture, 9% ash, 20%
volatile solids, with 74-75% organic matter on solids (Karan et al 2011).
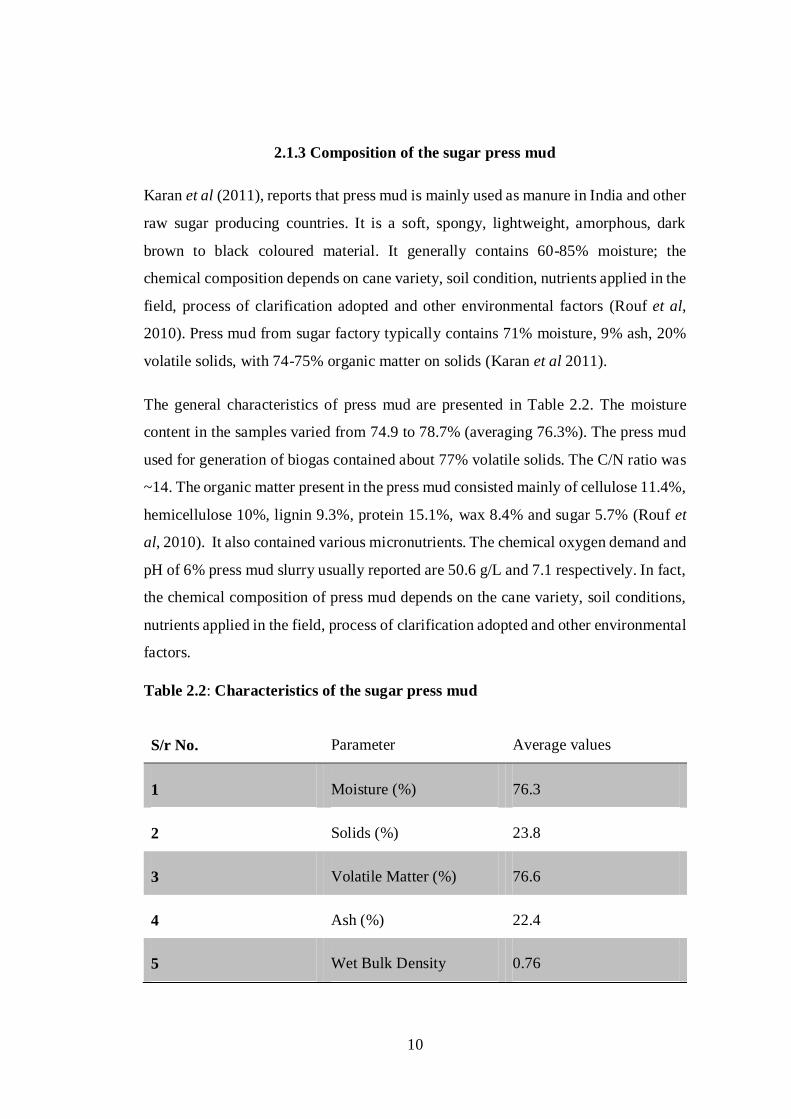
The general characteristics of press mud are presented in Table 2.2. The moisture
content in the samples varied from 74.9 to 78.7% (averaging 76.3%). The press mud
used for generation of biogas contained about 77% volatile solids. The C/N ratio was
~14. The organic matter present in the press mud consisted mainly of cellulose 11.4%,
hemicellulose 10%, lignin 9.3%, protein 15.1%, wax 8.4% and sugar 5.7% (Rouf et
al, 2010). It also contained various micronutrients. The chemical oxygen demand and
pH of 6% press mud slurry usually reported are 50.6 g/L and 7.1 respectively. In fact,
the chemical composition of press mud depends on the cane variety, soil conditions,
nutrients applied in the field, process of clarification adopted and other environmental
factors.
Table 2.2: Characteristics of the sugar press mud
S/r No. Parameter Average values
1 Moisture (%) 76.3
2 Solids (%) 23.8
3 Volatile Matter (%) 76.6
4 Ash (%) 22.4
5 Wet Bulk Density 0.76

11
6 Fibre (%) 23.6
7 Sugars (%) 6.4
8 Wax (%) 7.2
9 Protein (%) 15.8
10 Calorific Value (kcal/kg) 3861
11 C/N Ratio 14.0
12 pH of 10% solids 7.5
13 COD of 10% solids (g/L) 86.9
Source: www.banglajol.info (2014)
2.1.4 Current use of sugar press mud
In Kenya, this industrial waste is mainly used as soil fertilizer in the sugarcane
plantation in nuclear estate and out-grower. Other industrial applications are reported
(cement and paint manufacturing, foaming agent, composting aid for bagasse etc.) and
it has been used as human food in poor families. In animal production, it has been
used as feed ingredient, notably in ruminants, for its sugar and mineral content, and
as a compacting agent for ensiling (Van der Poel et al., 1998).
This has saved the sugarcane farmers in time when cost of chemical fertilizer is
skyrocketing and not affordable by farmers. Press mud has been used as a source of
plant nutrient and as medium for raising sugarcane seedlings and leguminous
inoculants. The advantages of using sugarcane press mud for soil application is its low
cost, slower release of nutrients, presence of trace element, high water holding
capacity and mulching properties (Bhosale et al, 2012).
2.1.5 Environmental impacts
The present methods used by sugar factories in Kenya for disposal of press mud are
not economical and pollute the environment (Rouf et al, 2010). Because of the

12
presence of sugar and other organic constituents, the press mud emits obnoxious smell
to environment.
2.2 Anaerobic digestion process
Anaerobic digestion is a naturally occurring process of decomposition and decay, by
which organic matter is broken down to simpler chemicals components under
anaerobic conditions. Anaerobic microorganisms digest the organic materials, in the
absence of oxygen, to produce methane and carbon dioxide as end-products under
ideal conditions. The biogas produced in AD-plant usually contains small amount of
hydrogen sulphide (H2S) and ammonia (NH3), as well as trace amounts of other gases
(Fabien, 2003).
The processes underlying AD can be complex and the process is best understood if
split into the three main stages: hydrolysis, acidogenesis and methanogenesis.
2.2.1 Hydrolysis
During hydrolysis, the fermentative bacteria convert the insoluble complex organic
matter, such as cellulose, into soluble molecules such as fatty acids, amino acids and
sugars. The complex polymeric matter is hydrolysed to monomers, e.g. cellulose to
sugars or alcohols. The hydrolytic activity is of significant importance in wastes with
high organic content and may become rate limiting. Chemicals can be added during
this step in order to decrease the digestion time and provide a higher methane yield.
2.2.2 Acidogenesis
In the second stage, acetogenic bacteria, also known as acid formers, convert the
products from the first stage into simple organic acids, carbon dioxide and hydrogen.
The principal acids produced are acetic acid, butyric acid, propionic acid and ethanol.
2.2.3Methanogenesis
Finally, methane is produced during methanogenesis by bacteria called methane
formers in two ways: by means of cleavage of two acetic acid molecules to generate
carbon dioxide and methane, or by reduction of carbon dioxide with hydrogen. The
acetate reaction is the primary producer of methane because of the limited amount of
hydrogen available (Fabien, 2003).

13
2.3 Important AD operating parameters
There are several conditions and variables that must be applied in order to obtain a
proper breakdown of the organic compounds. The operating parameters of the digester
must be controlled so as to enhance the microbial activity and thus increase the AD
efficiency.
2.3.1 Total Solid content
There are three different ranges of solid content: low solid (LS) AD systems contain
less than 10% Total Solid (TS), medium solid (MS) from 15-20% and high solid
systems (HS) range from 22-40%. When increasing the total solid content, the volume
of the digester decreases, due to lower water requirements (Fabien, 2003).
2.3.2 Temperature
Anaerobic digestion can occur under three main temperature ranges:
Psychrophilic condition, between 5-15°C, usually 12°C.
Mesophilic conditions, between 20-45°C, usually 35°C.
Thermophilic conditions, between 50-65° C, usually 55°C.
The optimum temperature of digestion may vary depending on feedstock composition
and type of digester, but in most AD processes it should be maintained relatively
constant to sustain the gas production rate.
Thermophilic digesters are more efficient in terms of retention time, loading rate and
nominally gas production, but they need a higher heat input and have a greater
sensitivity to operating and environmental variables, which make the process more
problematic than mesophilic digestion.
The sterilization of the waste is also linked to the temperature. The higher it is the
more effective it is in eliminating pathogens, viruses and seeds (Fabien, 2003).
2.3.3 Retention time
Retention time is the time needed to achieve the complete degradation of the organic
matter. The retention time varies with process parameters, such as process temperature
and waste composition. The retention time for waste treated in a mesophilic digester

14
ranges from 15 to 30 days and 12-14 days for thermophilic digester
(www.britishbiogen.co.uk, 2011).
2.3.4 pH
The optimal pH values for the acidogenesis and methanogenesis stages are different.
During acidogenesis, acetic, lactic and propionic acids are formed and, thus the pH
falls. Low pH can inhibit acidogenesis and pH below 6.4 can be toxic for methane-
forming bacteria (the optimal range for methanogenesis is between 6.6 and 7). An
optimal pH range is between 6.4 and 7.2 (http://www.biogasworks.com).
2.3.5 Carbon to Nitrogen ratio (C: N)
The relationship between the amount of carbon and nitrogen present in organic
materials is represented by the C/N ratio. Optimum C/N ratios in anaerobic digesters
are between 20 and 30. A high C/N ration is an indication of a rapid consumption of
nitrogen by the methanogens and results in a lower gas production. On the other hand,
a lower C/N ratio causes ammonia accumulation and pH values exceeding 8.5, which
is toxic to methanogenic bacteria. Optimum C/N ratio of the feedstock materials can
be achieved by mixing waste of low and high C/N ratio, such as organic solid waste
mixed with sewage or animal manure (Fabien, 2003).
2.3.6 Organic loading rate (OLR)/ Volatile Solids (VS)
OLR is a measure of the biological conversion capacity of the AD system. Feeding
the system above its sustainable OLR, results in low biogas yield due to accumulation
of inhibiting substances in the digester slurry (i.e. fatty acids). Under such
circumstances, the feeding rate of the system must be reduced. OLR is a particularly
important control parameter in continuous systems. Many plants have reported system
failure due to overloading. OLR is expressed in kg Chemical Oxygen Demand (COD)
or Volatile Solids (VS) per cubic meter of reactor. It is linked with retention time for
any particular feedstock and anaerobic reactor volume
(http://www.biogasworks.com)
Volatile Solids (VS) represents the organic matter in a sample which is measured as
solid content minus ash content, as obtained by complete combustion of the feed

15
wastes. VS comprise the biodegradable VS (BVS) fraction and the refractory VS
(RVS). High VS content with low RVS is more suitable for AD.
2.4 Chemistry of Biogas
Biogas is a gaseous mixture generated during anaerobic digestion processes using
waste water, solid waste (e.g. at landfills), organic waste, e.g. animal manure, and
other sources of biomass (Welink et al., 2007). In the absence of oxygen, anaerobic
bacteria will ferment biodegradable matter into methane (40-70%), carbon dioxide
(30-60%), hydrogen (0-2%) and hydrogen sulphide (0-3%), a mixture called biogas
(Fabien, 2003). Biogas is formed solely through the activity of bacteria. Although the
process itself generates heat, additional heat is required to maintain the ideal process
temperature of at least 35°C. In comparison, the methane component of natural gas
could amount to over 80%. In nature, biogas is generated at the bottom of stagnated
ponds, lakes, swamps or in the digestive system of animals (Jepma & Nakicenovic,
2006).
The composition of biogas is different from the one of natural biogas but it is quite
similar to landfill gas. Landfill gas often contains significant amounts of halogenated
compounds and occasionally the oxygen content is high when too much air is suck
during the collection on the landfill. The calorific value is 36.14 MJ/m3 for natural gas
and 21.48 MJ/m3 for biogas. The composition of biogas is naturally linked to the
waste composition and can thus vary (Fabien, 2003).
Biogas can be used for all applications designed for natural gas, subject to some
further upgrading, as not all gas appliances require gas of with the same quality
standards (http://www.novaenergie.ch/iea-bioenergytask 2014).
Biogas can be used for heating using boilers. The heat has many applications such as
being used in the plant or producing water vapour for industrial processes. Boilers do
not have a high gas quality requirement. It is preferable to remove the hydrogen
sulphide because it forms sulphurous acid in the condensate which is highly corrosive.
It is also recommended to condense the water vapour in the raw gas. Water vapour
can cause problems in the gas nozzles. Removal of water will also remove a large
proportion of H2S.

16
Biogas is also used in Combined Heat and Power (CHP) units. Gas engines do have
the same quality requirements as boilers, except that the H2S content should be lower.
In biogas engines the NOx emissions are usually low because of the CO2 in the gas.
CO concentration is often more a problem. However, from an environmental point of
view, CO is less of an issue than NOx because it is rapidly oxidized to CO2. CHP units
are a good way to produce efficiently both electricity and heat for the AD plant. For
instance, heating of the digester and sterilization of the digestate can be done using
this heat. The remaining electricity can be sold to the national grid. This is actually
the most popular way of using the landfill gas in the UK (Fabien, 2003).
2.5 Biogas quality
Biogas is mainly composed of methane (CH4), carbon dioxide (CO2) and low amount
of other gases (Yadava & Hcssc, 1981). GTZ, (1999) reports that, biogas is a mixture
of gases that is composed chiefly of methane 40-70 vol.%, carbon dioxide 30-60
vol.% and other gases 1-5 vol.% including hydrogen (H2) 0-1 vol.% and hydrogen
sulphide (H2S) 0-3 vol.%. (Tjalfe, 2003) reported the same per cent of methane and
carbon dioxide while the other gases 0 - 3 vol. %.
The quality of biogas generated by organic waste materials does not remain constant
but varies with the period of digestion (Khandewal & Mahdi, 1986). The ratio of CH4
to CO2 is normally stable in the reactor and a change of the ratio can be due to process
imbalance. However, the methane ratio also depends on substrate composition,
temperature, pH and pressure (Liu, 2003). Since the dissolution of CO2 is strongly
dependent on pH, fluctuation of pH can also change gas composition.
The quality of biogas depends mainly on the presence of methane in it. A good quality
of biogas has high percentage of methane. The percentage of methane in biogas is
generally determined by the Orsat apparatus, gaschromatograph etc. (Holman, 1995).
Savery and Cruzon (1972) suggested that, the three agents KOH, NaOH and Ca(OH)2
can be used in chemical scrubbing of biogas. The absorption of CO2 in alkaline
solution is assisted by agitation. The turbulence in the liquid aids to diffusion of the
molecule in the body of liquid and extends the contact time between the liquid and
gas. Another factor governing the rate of absorption is concentration of the solution.

17
A solution of potassium hydroxide (KOH), sodium hydroxide (NaOH) and water has
enhanced scrubbing capabilities for CO2 removal because the physical absorption
capacity of the water is increased by the chemical reaction of the KOH and NaOH.
Konstandt (1976) mentioned that the percentage of methane CH4 can be estimated
through recognition of CO2 percentage from this equation:
CH4 = 100% - [CO2% + 0.2% H2S] vol.
2.6 Biogas upgrading
According to Hansson et al (2002) and Liu (2003), the corrosive nature of H2S alone
is enough to destroy the internals of a plant. The solution is the use of biogas
upgrading or purification processes whereby contaminants in the raw biogas stream
are absorbed or scrubbed, leaving more methane per unit volume of gas.
2.6.1 Water washing/wet scrubbing
The main method of biogas upgrading includes water washing. The most prevalent
method is water washing where high pressure gas flows into a column where the
carbon dioxide and other trace elements are scrubbed by cascading water running
counter-flow to the gas. This arrangement could deliver 98% methane with
manufacturers guaranteeing maximum 2% methane loss in the system. It takes
roughly between 3-6% of the total energy output in gas to run a biogas upgrading
system. Removal of sulphur can be carried out using wet scrubbers. Plate 2.2 present
the cross sectional diagram for the wet scrubber from the end elevation view.

18
Plate 2.2: Wet scrubber
Source: http:/www.mikropul.com/products/ wscrubber/mikrovane.html.
2.6.2 Pressure swing adsorption
Carbon dioxide can be removed from the biogas by adsorption on a surface, normally
activated carbon, molecular sieves or zeolites. In pressure swing adsorption,
adsorption takes place at elevated pressure of light vacuum. However, this process
requires a pre-treatment step in order to remove water vapour and hydrogen sulphide
present in the inlet stream i.e. biogas. Hydrogen sulphide pose a severe operation
problem during adsorption at elevated pressure as its adsorption is irreversible in these
types of materials. The presence of water can destroy the structure of the adsorbent.
In order to solve this, a pre-treatment step, normally adsorption onto impregnated
active carbon followed by an increase in the temperature between 60 °C and 90 °C
can easily remove gas-phase hydrogen sulphide from biogas. After desulphurization
step, water is removed by condensation (Schulte-Schulze Berndt 2005).
2.6.3 Absorption
In absorption techniques for biogas purification, the raw gas is put in contact with a
non-volatile liquid phase, the purpose being the mass transfer of the contaminant from
the gas-phase to the liquid phase (Kennes & Viega 2001). The main idea of cleaning
biogas through absorption is to transfer carbon dioxide from the gas phase to the
stationary liquid phase, for example water, in which that pollutant is more soluble than
19
methane. The different absorption technologies use different types of absorbents like
water scrubbing, organic physical scrubbing and chemical scrubbing.
2.6.4 Cryogenic Technique
Cryogenic technique is based on the differences of boiling and sublimation points
between methane and its impurities, particularly for the separation of carbon dioxide
and methane. Methane has a boiling point of -160°C at atmospheric pressure whereas
carbon dioxide has a boiling point of -78°C (Persson et al., 2006). This implies that
carbon dioxide can be separated from the biogas as liquid by cooling the gas mixture
at elevated pressure. Methane can be taken out in gas or liquid phase, depending on
the system configuration. The basis of cryogenic separation techniques is that biogas
is compressed and then cooled followed by some expansion steps. These phenomena
make the carbon dioxide be removed as a liquid, the gas can be cooled further to
condensate the methane. The separated carbon dioxide is clean and can be used
elsewhere or sold.
To avoid freezing and other problems during the cryogenic compression expansion
process, water and hydrogen sulphide need to be removed from the raw biogas. Water
and siloxanes are also removed during cooling of the gas. Cooling usually takes place
in several steps in order to remove the different gases in the biogas individually and
to optimize the energy recovery.
Cryogenization is an emerging technique and is still under experimentation. De Hullu
et al., 2008 reported simulated data from Aspen plus software package, operating at -
90°C and 40 bars. The simulation showed removal efficiencies of 91%.
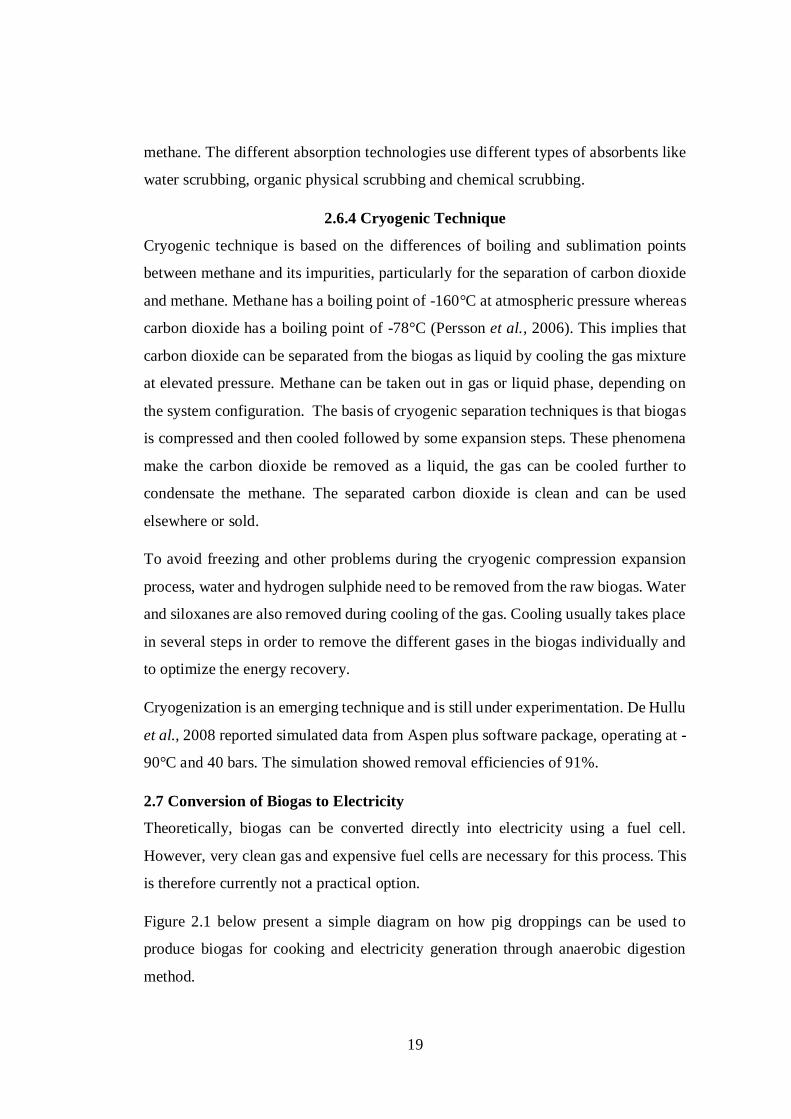
2.7 Conversion of Biogas to Electricity
Theoretically, biogas can be converted directly into electricity using a fuel cell.
However, very clean gas and expensive fuel cells are necessary for this process. This
is therefore currently not a practical option.
Figure 2.1 below present a simple diagram on how pig droppings can be used to
produce biogas for cooking and electricity generation through anaerobic digestion
method.

20
Source: www.Greenpower.cn (2014).
Figure 2.1: Schematic of a biogas plant used for power generation.
In most cases, biogas is used as fuel for combustion engines, which convert it to
mechanical energy, powering an electric generator to produce electricity.
Appropriate electric generators are available in virtually all countries and in all sizes.
The technology is well known and maintenance is simple. In most cases, even
universally available 3-phase electric motors can be converted into generators.
Technologically far more challenging is the first stage of the generator set: the
combustion engine using the biogas as fuel. In theory, biogas can be used as fuel in
nearly all types of combustion engines, such as gas engines (Otto motor), diesel
engines, gas turbines and Stirling motors etc.
GTZ (2010), reports that gas turbines are occasionally used as biogas engines,
especially in the US. They are very small and can meet strict exhaust emissions
requirements. Small biogas turbines with power outputs of 30-75 kW are available on
the market, but are rarely used for small scale applications in developing countries as
they are expensive. Furthermore, due to their spinning at very high speeds and the
high operating temperatures, the design and manufacturing of gas turbines is
challenging and maintenance requires specific skills.

21
External combustion engines such as Stirling motors have the advantage of being
tolerant of fuel composition and quality. They are, however, relatively expensive and
characterized by low efficiency. Their use is therefore limited to a number of very
specific applications.
In most commercially run biogas power plants today, internal combustion motors
have become the standard technology either as gas or diesel motors (GTZ, 2010).

22
CHAPTER THREE
MATERIALS AND METHODS
3.0 Introduction
This chapter describes and explains the research instruments that were used in the
study. Which included the experimental design, area of the study, feed stock charac-
terization, production and analysis of SDPM biogas and data management.
3.1 Experimental design
The study was divided into steps areas namely;
I. Feed stock characterization,
II. Production and analysis composition of raw biogas
III. Comparison of composition analysis of biogas production from sugarcane
derived press mud with biogas from cow dung.
IV. Upgrade of raw sugar press mud biogas using locally available material and
study electricity production using biogas.
3.2 Area of the Study
The study was carried in three different regions in Kenya: three sugar factories (SONY
sugar, Transmara sugar and Sukari International) in Kenya from same sugarcane
ecological zones, Kenya Sugar Research Foundation and Jommo Kenyatta University
of Agriculture and Technology. The press mud samples were collected from South
Nyanza Sugar, Transmara Sugar and Sukari International Sugar Companies as
selected area of study.
The composition analysis was done at Kenya Sugar Research Foundation situated at
Kibos, Kisumu. The sugar derived press mud was then transported from the South
Nyanza sugar zone to Jommo Kenyatta University of Agriculture and Technology
(JKUAT). A biogas digester bag was repaired and made at JKUAT, IEET site and
the small digester was then set up. Feeding of feedstock (sugar derived press mud)
was done and biogas was collected. The biogas analysis was carried out at Food
science laboratory JKUAT.

23
Figure 3.1 shows sampling areas and table 3.1 shows the GPS coordinates for the sites
as generated from Google Earth. From the figure, the yellow markings represent the
sugar factories where samplings of sugar press mud were collected. The main
economic activity in the region is sugarcane growing supplemented by maize and
tobacco.
Table 3.1: GPS coordinates
Sugar Company GPS Coordinates
Latitude Longitude
Sukari Industries Ltd 0°49'16.71"S 34°23'5.89"E
Sony Sugar Company 0°53'28.84"S 34°31'45.93"E
Transmara Sugar
Company
1° 1'6.14"S 34°44'16.46"E
Figure 3.1: Map of the Research Study (Google Earth 18/5/2018)

24
3.3 Step 1: Feed stock Characterization
During the characterization of the sugar-derived press mud, the following aspects
were investigated: Moisture (%), Solids (%), Volatile Matter (%), Ash (%), Sugars
(%),Organic Carbon, fibre content, Nitrogen, C/N Ratio, and pH of 10% solids of dry
sugar-derived press mud.
3.3.1 Organic Carbon
Organic Carbon was determined by the loss-on-ignition (LOI) method which involved
the heating destruction of all organic matter in the soil or sediment. Triplicate of 5g
weight of sample were placed in a ceramic crucible which was then heated to 400°C
overnight (Blume et al., 1990, Nelson & Sommers 1996, ASTM. 2000). The sample
was then cooled in a desiccator and weighed. Plate 3.1 illustrates heating of the SDPM
inside a furnace in the KESREF laboratory.
Plate 3.1: Laboratory Furnace
3.3.2 Moisture and Ash Content
Moisture and ash contents were estimated by gravimetric methods by drying at 105oC
overnight and by complete combustion at 800oC in the laboratory furnace for
15minutes, respectively.3 portions of 5g of SDPM were weighed, put in crucibles and
heated inside the Furnace until temperatures of 800°C attained and then left for 15
Samples inside the Furnace

25
minutes. The samples were then transferred to a desiccator for cooling before
reweighing was done (Skoog, D et al., 1996). Weight loss was used to express VM
and remaining weight was used to calculate the Ash content. The picture in plate 3.2
shows the samples being dry in the oven and during weighing in the laboratory
a) Laboratory oven
b) Weighing Machine
Plate 3.2: Laboratory Oven and Weighing Machine
3.3.3 Fibre Content
To determine fibre content for SDPM, 5gms of press mud was weighed accurately
and washed over a tarred 100 mesh sieve until the water run clear. Excess water was
drained off and the sieve along with its contents was dried in an oven at 105oC to
constant weight. Fibre content was calculated from the increase in weight of the tarred
sieve (Mathur, 1997).
3.3.4 Sugar content (Pol.)
Sugar content (pol/sucrose) in the press mud sample was determined by measuring
the optical rotation in a Polarimeter machine where 10g of the samples were weighed
in triplicates in plastic beakers, water was then added up to 50g, Pb(NO3)2 was added
and stirred. The solution was filtered and the clear solution injected in the
Saccharimeter/polarimeter machine and the sucrose values read. Plate 3.3 gives an
illustration of the process of pol analysis and use of polarimeter machine.

26
a. Filtration processes
b. Saccharimeter machine
Plate 3.3: Samples for Pol analysis and Sccharimeter machine
3.3.5 Nitrogen Determination
Nitrogen was analysed through Kjeldahl method. Where 5g of the samples were
weighed and 1g CuSO4, 10g K2SO4 and 30 mL Con. H2SO4 and then digested in
Kjeldahl until a green colour appeared. The solutions were decanted and 40% NaOH
solution was added and afterwards titrated against HCl. From titrate, multi
equivalence of acid for NH3 absorbed was calculated and used to get nitrogen %
present in the sugar press mud. (Jackson, 1956; Jaber et al 2009).
The above method is illustrated in the form of diagram in plate 3.4 below, showing
the titration and digestion processes in progress at the Kenya Sugar Research
foundation lab.

27
a. Loading of the samples in the
Kjeldahl
b. During titration process
c. Kjeldalh Machine
d. Titration in progress
Plate 3.4: Analysis of Nitrogen by use of Kjeldahl instrument and Titration
3.3.5 pH value
pH value was determined by weighing 10g of sample and was toped up with water up
to 50g, shaken for 10 minutes in laboratory shaker and then reading were done using
pH meter (ASTM, 2000). The plate 3.5 below present the equipment used in taking
the pH values of the samples in the lab.

28
a. pH meter
b. pH reading in progress
Plate 3.5: pH Analysis
3.3.6 Total Organic Carbon
Organic Carbon was determined by the loss-on-ignition (LOI) method for the
determination of organic matter which involved the heating destruction of all organic
matter in the SDPM. 5g weight of samples were placed in a crucible which were then
heated to 400°C overnight (Blume et al., 1990; Nelson & Sommers, 1996; ASTM,
2000).The sample were then be cooled in a desiccator and weighed. The procedure
was repeated 3 times. Organic matter content was calculated as the difference between
the initial and final sample weights divided by the initial sample weight times 100%.
The ratio was calculated by dividing total organic carbon with the Nitrogen all present
in the samples.
C/N ratio = 𝑇𝑜𝑡𝑎𝑙 𝑂𝑟𝑔𝑎𝑛𝑖𝑐 𝐶𝑎𝑟𝑏𝑜𝑛
𝑁𝑖𝑡𝑟𝑜𝑔𝑒𝑛
3.4 Step 2: Production and analysis of raw biogas
3.4.1 Design of the biogas digester
The design of the digester was made to allow continues gas production by having an
inlet and outlet for feedstock and sludge respectively. The design also included the

29
water trap part to remove water vapour, saw dust for removal of the Hydrogen
sulphide and Concentrated Sodium Hydroxide as in the figure 3.2 below
Figure 3.2: Design of the bioreactor
3.4.2 Fabrication of the biogas digester
The digester was made from gas balloon which had been used and abandoned. The
gas balloon was of 3 M3 of capacity and was reduced to 1.18 M3 capacity. The sizing
of the digester was done with the help of the tent makers and a plumber within Juja
community.
The digester was made in such that the inlet was 0.45m with 45° elbow and outlet was
about 0.3m both of 0.1m pipe and connecting beds and biogas gasholder valve of PVC
pipe of diameter 0.032m for gas collection. The below Plate 3.6 illustrate fabrication
of the digester from the gas balloon.

30
a. During fabrication
b. Inflated Bioreactor
Plate 3.6: Fabrication process
3.4.3 Setting up of the digester
The fabricated digester was set up in JKUAT, IEET site. Digging was done to about
300mm deep to create a good bed to lay the digester. The digester was then laid on
the bed carefully ready for loading with the feed stalk (Sugar Derived press mud).
Plate 3.7 show the installation process of the bioreactor on the ground.
a. Laying of the digester
b. Fixing of Gas valve
Plate 3.7: setting up of digester

31
3.4.4 Loading/feeding of the digester
a) Weighing of feeding stalk
Sugar press mud collected from the three Sugar Company was weighed using a beam
balance scale of accuracy of ±1kg. The beam balance maximum weight was 10kg so
the weighing was done in beats. 60 kg of sugar press mud was weighed and transferred
into a big bucket of larger capacity ready for mixing with water. Plate 3.8 is an
illustration on how the SDPM was weighed ready for mixing with cow dung in the
ration of 3:1 respectively (Rouf et al., 2010).
a. Weighing of SDPM on balance
b. Weighing of Press Water
Plate 3.8: Weighing of the raw material
b) Water addition and mixing
Equal amount of water to sugar press mud was also weighed using the beam balance
60kg and mixing was done in mixing bucket which acted as mixing tank before
loading. Mixing was done thoroughly all the press mud uniformly dissolved to form
mud solution. This was done as presented below in the plate 3.9.

32
a. Addition of water
b. During mixing
Plate 3.9: Mixing of feed stock
c) Inoculation
During clarification of sugar juice to remove sugar press mud, juice being subjected
to high temperatures of 132°C ( Hugot E. 1986), and at that temperature bacteria
presence are minimal. This called for inoculation to be done. Cow dung was used as
an inoculant in the ratio of 1:3 only on the first feeding to provide bacteria. Cow dung
weight was 20 kg to arrive at mixing ratio of 1:3:3 for cow dung, sugar press mud and
water respectively (Njogu et al, 2015).
d) Loading
After mixing of the three components, manual load/feeding of the digester was in
portions. Second loading was done after 20 days when the production rate of the gas
had reduced. Plate 3.10 shows the loading of the bioreactor.

33
a. During Feeding
b. After Feeding
Plate 3.10: Loading of bioreactor (plate a.)
3.4.5 Production Biogas
Biogas yield realisation started on the third day after feed. This was seen as the
swelling of the digester began. The production rate was captured through connection
to a biogas flow meter which was calibrated in Litres. The flow meter was read every
day for 3 weeks and the new volumes were recorded to help in determination of the
flow rate of the gas and also to calculate the production rate compared to mass loaded.
The gas after passing through the flow meter was collected in a balloon which was
locally modelled as a biogas collector. The excess gas was burnt in air to avoid air
pollution and emission.
Biogas collection was done at two points. One collection point was at next to the
digester before cleaning and two after passing through cleaning process. The collected
biogas was taken to the laboratory for analysis. Plate 3.11 show different process
during biogas production as illustrated in individual plates.

34
a. Biogas in the digesture
b. Release of gas
c. Biogas meter for Daily readings
d. Burning of biogas produced
Plate 3.11: Biogas production plate a and b, meter reading plate c. and burner d.
3.5 Step 3: Biogas composition analysis
The raw biogas was analysed using gas chromatography analyser (GC-8A Shimadzu
model) under operating conditions. The gas was sampled using gas sampling balloons
and injected into the detector without any pre-treatment. The samples were run in

35
triplicates for raw biogas and upgraded gas. The peak areas were determined and gas
composition derived in percentages.
3.5.1 Determination of CH4, CO2, N2 and H2S
The GC-8A (Shimadzu) Gas Chromatograph in the Food Science Laboratory at
JKUAT was used to perform the biogas chromatography in the sample raw biogas.
The main components of the GC included: carrier gas, flow controls, sample inlet and
sampling devices, columns, controlled temperature zone or ovens, detectors and data
acquisition systems.
The GC was equipped with a thermal conductivity detector (TCD) and measured the
difference in the thermal conductivity of each of the compound in the biogas. The
carrier gas used in this application was helium. The output stream of the carrier gas
was regulated at 2 bar pressure into the GC. In order to detect CH4 and CO2 gases the
GC was calibrated with 99.999% standard of the two gases at the start of the study.
The biogas stream for GC analysis was supplied from the digester plants using
plastic storage bags. A sample containing 0.2 ml of this gas was sucked from the bags
using a syringe and injected into the GC. The separated components were recorded
as peaks on the data processor. The operating parameters used for the GC-8A are
given in Table 3.1
Table 3.2: GC Operating Parameters
Parameter Value
Detector temperature 150°C
Oven temperature 150°C
Carrier gas Helium
Carrier gas pressure 2.2kg/cm2
TCD amplifier 100mA
Column type Stainless steel/Porapak porous polymer
Column length 3m or 10ft

36
a. During filling of compressed
gas into balloons
b. Collection of the gas after
Upgrade in the storage ballon
c. Filled balloons with Biogas
for lab analysis
d. Biogas filled balloons in the lab
e. Injection of biogas in GC
machine
f. Gas chromatography machine
Plate 3.12: Show the process of gas collection and lab analysis process

37
3.5.2 Retention time
Retention time of the feedstock (sugar derived press mud) was determined by rate of
production of gas in a graph.
3.6 Step 4: Biogas Upgrading and Electricity generation
3.6.1 Biogas cleaning /Upgrade
Apart from methane and carbon dioxide, biogas can also contain water, hydrogen
sulphide, nitrogen, oxygen, ammonia, siloxanes and particles. The concentrations of
these impurities are dependent on the composition of the substrate from which the gas
was produced.
Cleaning/upgrading of the gas was done using saw dust as active carbon for the
removal of hydrogen Sulphide and carbon dioxide. To activate the carbon in saw dust,
the saw dust undergone pyrolysis in a burning furnace at JKUAT energy workshop at
a temperature of 400°C for half an hours. The char produced was mixed with water
and used as an active carbon
3.6.2 Electricity generation
This was done using two Methods: Theoretical Methods and Combustion through
small biogas turbine
3.6.2.1 Theoretical Methods
Since the volume of gas produced was little to run the generator for full quantification,
we decided to theoretically quantify the electricity that can be produced using the
equation below.
A formula to predict on theoretical yields of component products from digestion based
on chemical composition by use of Buswell and Boyle scientific formula describing
the composition of biogas developed in 1952 (Mark, 2009).
𝐼𝑛𝑝𝑢𝑡 = 𝑜𝑢𝑡𝑝𝑢𝑡
𝐶𝑐 𝐻ℎ 𝑂𝑜 𝑁𝑛 𝑆𝑠 + ¼ (4𝑐 – ℎ – 2𝑜 + 3𝑛 + 2𝑠)𝐻2𝑂
→ 1/8 (4𝑐 – ℎ + 2𝑜 + 3𝑛 + 2𝑠) 𝐶𝑂2 + 1/8 (4𝑐 + ℎ
− 2𝑜 – 3𝑛 − 2𝑠) 𝐶𝐻4 + 𝑛 𝑁𝐻3 + 𝑠 𝐻2𝑆

38
Energy value of methane:
1 𝑚3 𝑚𝑒𝑡ℎ𝑎𝑛𝑒 = 36𝑀𝐽
1 𝑘𝑊ℎ = 3.6 𝑀𝐽
1 𝑚3 𝑚𝑒𝑡ℎ𝑎𝑛𝑒 = 10 𝑘𝑊ℎ
3.6.2.2 Combustion through small biogas turbine
A small generator of rating 50kVA and of power factor 0.8. The generator was used
to run on the SDPM biogas as in the Plate 3.13
a. Genset Rating
b. Gensent during Burning
Plate 3.13: Electricity generation
3.7 Data management and analysis
Statistical analysis of data was done using analysis of variance (ANOVA)

39
CHAPTER FOUR
RESULTS AND DISCUSSION
4.1 Feed stock characterization
Characteristics of press mud are given in Table 4.1 which shows the averages of
parameters from the three sugar industries where the samples were collected.
Table 4.1: Characteristics of the sugar press mud (source: Author)
Parameter Sony sugar
company
Transmara
sugar
company
Sukari
industry
Mean ±SD
Moisture (%) 67.7 63.7 60.1 63.1±3.1
Solids (%) 32.3 36.3 39.9 36.2±3.1
Volatile
Matter (%)
87.0 83.2 79.9 83.4±2.9
Ash (%) 13.0 16.8 20.1 16.6±2.9
Fibre (%) 15.5 23 18.7 19.0±3.8
Sugars (%) 5.4 6.7 6.8 6.3±0.61
Nitrogen (%) 4.8 3.7 4.3 4.3±0.3
Organic
Carbon (%)
85.8 83.0 82.2 83.7±1.9
C/N Ratio 17.8 22.4 19.1 19.8±2.4
pH of 10%
solids
7.4 7.6 7.5 7.5±0.01
N=3 (triplicate sampling tests)
From the test statistic, the two tailed test was ±0.49 this showed that no major
significant differences as the deviation was ±5% from the mean as seen from all the
three sugar industries parameters. This meant that the weather conditions, cane variety
planted, soil content and milling methods are almost/similar in South Nyanza sugar
zone. See appendix for more data.

40
4.1.1 Moisture Content
The moisture content in the samples varied from 60.1 to 67.1% (x̄±SD =63.1% ±3.1%)
which is within the range of 60-85% by Desdin et al. (1995). However, the moisture
contents of press mud from some South African sugar mills in the range of 60-69.6%
and from an American sugar mill 57.6% (Dasgupta and Nemerow, 1988) have been
reported. This shows a variation (P≤0.05) compared to other countries. This showed
that sugar derived press mud moisture content is within the range conforming to the
literature
4.1.2 pH Value
For Biogas generation from press mud, pH values of 6.5-8.5 and maximum in the pH
range of 7.0-7.5 is required for high production yield. The samples mean pH value
was 7.5 which are good because it falls within the required range of 6.5-8.5. From the
literature, pH varies during the processes of biodegradation, having a neutral value
was a good indicator.
4.1.3 C/N Ratio
The C/N ratio of the press mud sample varied from 17.8 to 22.4 and the average C/N
ratio was found to be19.8±2.4. The value of C/N ratio reported by other investigators
was at 17 (Dasgupta and Nemerow 1988) which is just below the research value.
The C/N ratio of the substrate is another important parameter for the biogas
production. On the one hand, biodegradation of nitrogenous compounds contributes
to the neutral pH stability. The nitrogen is also important for bacterial cell growth,
which is an important phenomenon in the whole process of bio-methanation. At low
C/N ratio, carbon addition stimulates methane production by reducing ammonia
inhibition.
At high C/N ratio, carbon addition decreases the methane yield as nitrogen becomes
a limiting nutrient and bacteria suffer a nutrient deficiency. The methane content of
biogas also depends on the C/N ratio. At higher C/N ratio, the percentage of methane
decreases in the biogas.

41
4.1.4 Volatile Solids
The press mud used for characterization contained about 79.9-87.0% volatile solids
of average 83.4%. VS of cow dung and other feed stocks in the literature was about
80-89% which qualified the samples from the three sugar industries.
4.1.5 Organic Matter
The organic matter present in the press mud consisted mainly of organic carbon (82.2-
85.8%), Nitrogen which was between 3.7-4.8%. Sugar which was found to be of
average 6.3±0.61%sucrose content showed potentiality as high sucrose content leads
to high biodegradation. This is because the chemical composition of press mud
depends on the cane variety, soil conditions, nutrients applied in the field, process of
clarification adopted and other environmental factors.
The three sugar Companies (SONY, Transmara and Sukari Industiries) where samples
were collected from had very minimal variations on the parameters since the cane
variety type, soil conditions and climate in the regions where they are located are
similar and categorized as one sugar zone.
4.2 Design and Fabrication of laboratory scale bioreactor
The laboratory bioreactor which was fabricated is represented in the Plate 4.1. The
reactor was sized in such a form to be cylindrical. The bioreactor had a diameter of
1m and a height of 1.5m. These parameters were used to calculate the volume of the
bioreactor as below.
Formula for find the area of a cylinder
𝑉 = 𝐴 × 𝐻
And 𝐴 = 𝜋𝑅2
So the volume will = 𝜋𝑅2ℎ
𝑉 = 3.142 × 0.5 × 0.5 × 1.5
𝑉 = 1.18𝑚3
The capacity of the bioreactor was 1.18M3

42
Plate 4.1 : Bioreactor set up
From the bioreactor, the connecting pipe was channelled to the filters and connected
to gas collecting balloon which was designed for storage purposes.
4.3 Biogas production and Process Study
The anaerobic digester plant system used for the production of biogas consisted of
digester, vapour collecting bottle with water inside, gas transport pipes, control valves,
biogas flow meter, saw dust adsorbent, gas burner, gas storage balloon and coarse and
fine fabric filters as represented in Figure 4.1.
Figure 4.1: The schematic diagram represents the whole production process of
Biogas
4.3.1 Daily Gas Production
The figure 4.2 represents the volumes of daily gas present on graph and it shows a
cone shape trend. It was observed that gas generation started on the 3rd day of feeding

43
the digesters with the slurry. The rate of gas generation gradually increased with
increasing the digestion period. The graph also indicates that during the digestion
period, most of the daily gas production range was 1-33 liters of volume. In this
reactor, the peak gas production of 33 liters was observed on the 8 th day. It was
observed that gas production rate declined after 13th day.
RAW BIOGAS TO STORAGE
UPGRADED GAS
BIOREACTOR
Conc.
NaOH
SAW DUST WATER
TRAP
GENSET
Gas Bag

44
Figure 4.2: Biogas production against Time
This peak production day was established to be related to the growth of bacteria within
the digester and after that the bacteria start to starve and competition for food lead to
elimination of the bacteria. The reduction in population of the microbes lead to a
significant drop in gas production. This can be adjusted by constant production of gas
through periodic loading of the digester with fresh feedstock.
4.3.2 Cumulative Gas Production
The cumulative gas production from the test reactor operating in the laboratory shows
that the lag phase prevailed up to 2 to 6 days of digestion period (Figure 4.3). This
was due to microbe limiting at the initial stage of fermentation. The longer the lag
phase, the longer the time delay of peak gas generation. After the lag period, the
cumulative volume of biogas increased sharply and continued up to 20th day of
fermentation period. After which the rate of gas generation decreased and declination
continued until the biogas production appeared to be zero.
0
5
10
15
20
25
30
35
1 2 3 4 5 6 7 8 9 10 11 12 13 14 15 16 17 18 19 20
Dai
ly B
ioga
s p
rod
uct
ion
(lit
res)
Time (days)

45
Figure 4.3: Cumulative biogas Volume against Time
When biogas generated from SDPM was compared with other feed stocks such as
cow dung and water hyacinth values as reported by Njogu et al, (2015), the results
were as presented in the figure 4.4.
The cow dung feedstock was found to produce biogas from the 4th day rising to
gradually up to 8th day and remained constant reaching maximum between the 28 -
36th days.
The biogas production from the water hyacinth/cow dung mixture showed a different
trend; biogas production remained low than that from cow dung between the fourth
and the 18th day but rose steadily to reach a maximum at the 32nd day and increased
steadily from 32nd to 36th day due to new feeding.
When sugar derived press mud was mixed with cow dung, the production of biogas
started in the 4th day increasing rapidly compared to the other two above and quickly
reached at the 32nd day.
The trends show a rather similar trend but the delay during the first few days for water
hyacinth/cow dung mixture could be attributed to the low bacteria population or
dominant activities in the matrix. And for the fast production in the sugar derived
0
50
100
150
200
250
300
1 2 3 4 5 6 7 8 9 10 11 12 13 14 15 16 17 18 19 20
Cu
mu
lati
ve V
olu
me (
litr
es)
Time (days)
Cummulative Gas Yield

46
press mud and cow dung showed high rate of bacteria multiplication in the early days
of degradation. The study shows a greater yield of biogas from the hyacinth/cow dung
mixture compared to cow dung and sugar derived press mud being the least.
The results of the study findings was similar with those reported by other researchers
using Sugar press mud as a feed stock (Rouf et al., 2013)
Figure 4.4: Comparative cumulative gas yield from different feedstock
4.3.3Retention time
Retention time is the time needed to achieve the complete degradation of the organic
matter. The retention time varies with process parameters, such as process temperature
and waste composition. The retention time for waste treated in a mesophilic digester
ranges from 15 to 30 days and 12-14 days for thermophilic digester (Fabien, 2003)
The retention time for the set up was between 30 to 33 days where there were no gas
being produced and degradation of the feedstock was estimated to be completely done.
SDP Mud+ cow
Dung, 438
Cow Dung, 550
Water Hyacinth+
Cow Dung, 767
0
100
200
300
400
500
600
700
800
900
0 4 8 12 16 20 24 28 32 36
Gas
Vo
lum
es
Time (Days)
Cumulative biogas volume

47
4.3.4 Weather conditions during the production Period
The table below show the conditions during the production period.
Table 4.2: Weather conditions
Day Description High /
Low
Precipita-
tion
Wind Hu-
midity
Wed AUG 15 Partly Cloudy 78°54° 10% SE 10mph 55%
Thu AUG 16 Partly Cloudy 78°55° 10% SSE 9mph 57%
Fri AUG 17 Partly Cloudy 77°56° 10% SSE 8mph 60%
Sat AUG 18 Cloudy 77°57° 10% SSE 9mph 63%
Sun AUG 19 Cloudy 77°58° 10% SSE 8mph 61%
Mon AUG 20 Mostly Cloudy 77°58° 10% SSE 9mph 59%
Tue AUG 21 Cloudy 77°58° 10% SSE 9mph 60%
Wed AUG 22 Mostly Cloudy 77°58° 20% SSE 8mph 60%
Thu AUG 23 Mostly Cloudy 77°58° 10% SSE 8mph 61%
Fri AUG 24 Mostly Cloudy 77°59° 20% SE 8 mph 62%
Sat AUG 25 Partly Cloudy 78°59° 20% SE 8 mph 61%
Sun AUG 26 Partly Cloudy 79°59° 20% SE 8 mph 58%
Mon AUG 27 Mostly Cloudy 79°58° 20% SE 8 mph 59%
Tue AUG 28 Partly Cloudy 80°58° 20% SE 8 mph 56%
Wed AUG 29 Partly Cloudy 80°59° 20% SE 8 mph 54%
Source: Weather Channel.
https://weather.com/weather/tenday/l/Juja+Kenya+KEXX1743:1:KE
4.4 Biogas composition analysis
4.4.1 Composition of raw biogas
Biogas produced during anaerobic digestion is primarily composed of methane (CH4)
and carbon dioxide (CO2), with smaller amounts of hydrogen sulphide (H2S) and
ammonia (NH3) (Fabien, 2003).
Compositional data analysed from GC machine for the SDPM raw biogas was as
presented in Table 4.2. The gas was found to contain a mixture of gases. On average

48
range, Methane (CH4) 50- 52%, 30-32% Carbon dioxide (CO2), Nitrogen (N) 13-15%
and traces of Hydrogen Sulphide (H2S) 1-4%.
Table 4.3: Composition Data for SDPM Raw biogas
Gas Retention Time
(Seconds)
Percentage composition
(%)
Carbon dioxide 0.812 30-32
Nitrogen 1.006 13-15
Methane 1.304 50-52
Hydrogen sulphide 4.688 1-4
Njogu et al, (2015) and Chege, (2015) reported that the composition of the biogas
depend on the feed stock used. Table 4.3 shows composition of raw biogas from water
hyacinth inoculated with cow dung and from cow dung as the only raw material.
Table 4.4: Composition analysis for raw biogas from other feed stock
Element Water Hyacinth+ Cow Dung
(Njogu et al, 2015) in %
Cow Dung (Chege, 2015)
in %
Carbon dioxide 21-29 25-36
Nitrogen 17-19 15-18
Methane 49-53 46-53
From the above results, there was a deviation of ±4% of biogas composition from
different feedstock used. These results show that there is not much difference among
the digesters regarding the CH4 and CO2 content. However the difference in the
feedstock explains that some materials are more easily degradable breaks fast in
comparison with complex materials and this being the reason for the slight variations
of the composition percentages. The findings also showed that the comparisons of

49
CH4 yields reported in the introduction cannot be precise because of possible
differences in the feedstock and the experimental conditions.
The data obtained from the GC analysis in terms of the composition agreed with the
literature review although the concentration of the CH4 is low while that of CO2 is
high this might have been as a result of feedstock composition.
4.4.2 Composition of cleaned biogas
Compositional data for the cleaned biogas was presented in Table 4.4. The gas was
found to contain a mixture of gases. The average range are Methane (CH4) 70- 72%,
6-9% Carbon dioxide (CO2), Nitrogen (N2) 15-19% and traces of Hydrogen Sulphide
(H2S) 1-2%.
Table 4.5: Composition Analysis for cleaned SDPM biogas
Element Time Percentage composition
Carbon dioxide 0.812 6-9
Nitrogen 1.006 15-19
Methane 1.304 70-72
Hydrogen sulphide 4.688 1-2
According to Njogu et al 2015, below is result of the composition analysis for the
biogas after upgrading from the feed stock water hyacinth plus cow dung as in Table
4.5.
Table 4.6 : Composition analysis for clean biogas from water hyacinth
Element Time Percentage composition
Carbon dioxide 1.62 4-8
Nitrogen 1.02 19-27
Methane 1.12 65-73

50
From the above results, it depicted that although different feedstock were used and
methods of cleaning biogas were employed. The deviation was ±4% when compared
with other upgraded biogas composition.
When the results for raw SDPM biogas on Table 4.2 and upgraded SDPM biogas on
Table 4.4 were compared, there was increase in the percentages of Methane (CH4)
and Nitrogen N2. This may be because their volumes were not interfered during
cleaning of the biogas process hence their concentration in the composition increase.
For the values of hydrogen sulphide (H2S) and Carbon (IV) Oxide (CO2) decreased
significantly by a bigger margin. This shows that the aim of cleaning process was to
efficient enough to clean other unwanted gas compounds in the mixture.
4.5 Electricity Generation using SDPM biogas
This was done using theoretical formula and small turbine wo methods:
4.5.1 Theoretical Electricity Generation
Buswell and Boyle scientific formula describing the composition of biogas developed
in 1952 was used to calculate theoretical electricity yields of component products
from digestion based on chemical composition.
𝐼𝑛𝑝𝑢𝑡 = 𝑜𝑢𝑡𝑝𝑢𝑡
𝐶𝑐 𝐻ℎ 𝑂𝑜 𝑁𝑛 𝑆𝑠 + ¼ (4𝑐 – ℎ – 2𝑜 + 3𝑛 + 2𝑠)𝐻2𝑂
→ 1/8 (4𝑐 – ℎ + 2𝑜 + 3𝑛 + 2𝑠) 𝐶𝑂2 + 1/8 (4𝑐 + ℎ
− 2𝑜 – 3𝑛 − 2𝑠) 𝐶𝐻4 + 𝑛 𝑁𝐻3 + 𝑠 𝐻2𝑆
Gas composition based on percentage of elements by weight:
( 𝐶𝑐 𝐻ℎ 𝑂𝑜 𝑁𝑛 𝑆𝑠) ∶ 𝐶𝑐 = (12 ∗ 4.17), 𝐻ℎ = (1 ∗ 7.90),
𝑂𝑜 = (16 ∗ 2.44), 𝑁𝑛 = (14 ∗ 0.44), 𝑆 𝑠 = (32 ∗ 0.04)
[ ¼ (4𝑐 – ℎ – 2𝑜 + 3𝑛 + 2𝑠) 𝐻2𝑂] = 1.32

51
Table 4.7: Gas elemental composition based on percentage of elements by weight
Input elemental
composition
Atomic
weight
Empirical
formula
Percentage input elemental
composition
C 12 4.17 50.4
H 1 7.9 7.9
O 16 2.44 39.4
N 14 0.44 6.16
S 32 0.04 1.28
H2O 1.32
Output percentage composition from Buswell equation:
1/8 (4𝑐 – ℎ + 2𝑜 + 3𝑛 + 2𝑠) 𝐶𝑂2 + 1/8 (4𝑐 + ℎ − 2𝑜 – 3𝑛 − 2𝑠) 𝐶𝐻4
+ 𝑛 𝑁𝐻3 + 𝑠 𝐻2𝑆
1/8{ (4 ∗ 4.17) − (7.90) + (2 ∗ 2.44) + (3 ∗ 0.44) + (2 ∗ 0.04) = 1.88 𝐶𝑂2
1/8{ (4 ∗ 4.17) + (7.90) − (2 ∗ 2.44) − (3 ∗ 0.44) − (2 ∗ 0.04) = 2.29 𝐶𝐻4
0.44 𝑁𝐻3
0.04 𝐻2𝑆
Table 4.8: Output percentage composition of Biogas
Output Empirical
formula
Gas composition based on % of
elements by weight
Percentage composition
for CO2 and CH4 only
CO2 1.88 40.5 45.1
CH4 2.29 49.3 54.9
NH3 0.44 9.5
H2S 0.04 0.8

52
From Buswell equation, 45% is CO2 and 55% is CH4. Therefore to estimate the biogas
and energy yield:
Calculate the carbon content of the wet boiwaste.
140 kg of bio-waste:
Solid content =80 kg (57.14%)
Water content = 60 kg (42.86%)
Organic Dry Matter (ODM) = 23.2 kg (16.59%)
Residue non degradable solids = 4.76 kg (3.40 %)
Residue organic solids = 23.2*60/100 = 13.92 kg
Thus the digester solids will be 4.76 kg + 13.92 kg = 18.68 kg
From Buswell and Boyle’s equation: ODM in 23.2 kg wet boiwaste has 50.4 % carbon
content
(23.2 ∗ 50.4/100) = 11.69𝑘𝑔 𝐶
If carbon (C) biodegraded is 60%, then
(60 /100 ∗ 11.69) = 7.01 𝑘𝑔 𝐶 Was converted to biogas
Form Buswell equation, 55% is CH4 and 45 % is CO2
Thus the weight of methane-carbon:
(𝐶𝐻4 − 𝐶) = (7.01 ∗ 55/100) = 3.86 𝑘𝑔 𝐶
Weight of methane (CH4)
(3.86 𝑘𝑔 ∗ 16/12) = 5.144 𝑘𝑔 𝐶𝐻4
Energy equivalents:
1 𝑚𝑜𝑙 𝑔𝑎𝑠 𝑎𝑡 𝑆𝑇𝑃
= 22.4 𝑙𝑖𝑡𝑒𝑟𝑠
16 𝑔 𝐶𝐻4 = 22.4 𝑙𝑖𝑡𝑒𝑟𝑠

53
Thus: 5143.6 𝑔 𝐶𝐻4 = 5143.6/16 𝑚𝑜𝑙𝑒𝑠
= 321.475 𝑚𝑜𝑙𝑒𝑠 𝐶𝐻4
321.475 ∗ 22.4 = 7201.04 𝑙𝑖𝑡𝑒𝑟𝑠 𝐶𝐻4
= 7.20 𝑚3 𝐶𝐻4
Therefore:
140 kg biowaste of Sugarcane derive press mud and cow dung produced:
7.20 𝑚3 𝐶𝐻4 + 5.89 𝑚3 𝐶𝑂2 = 13.09 𝑚3 𝑏𝑖𝑜𝑔𝑎𝑠
Energy value of methane:
1 𝑚3 𝑚𝑒𝑡ℎ𝑎𝑛𝑒 = 36𝑀𝐽
1 𝑘𝑊ℎ = 3.6 𝑀𝐽
1 𝑚3 𝑚𝑒𝑡ℎ𝑎𝑛𝑒 = 10 𝑘𝑊ℎ
𝑇ℎ𝑢𝑠 ∶ 140 𝑘𝑔 𝑤𝑒𝑡 𝑏𝑖𝑜𝑤𝑎𝑠𝑡𝑒 𝑒𝑛𝑒𝑟𝑔𝑦 𝑣𝑎𝑙𝑢𝑒
= 7.20 𝑚3 𝐶𝐻4 ∗ 10 𝑘𝑊ℎ / 𝑚3 𝐶𝐻4
= 𝟕𝟐. 𝟎 𝒌𝑾𝒉
4.5.2 Use of Small Turbine for Combustion
4.5.2.1 Clean Biogas Produced
From page 48 Figure 4.4 from the mixing ratio of SDPM to Cow dung 3:1 (140kgs)
stored biogas 438 litres of biogas. When cleaning was done 25% of Carbon Dioxide
and other gases was lost.
Therefore the remaining gas volume was: 𝑽 = 𝟒𝟑𝟖𝒍 × (𝟏𝟎𝟎% − 𝟐𝟓%)= 𝟑𝟐𝟖. 𝟓

54
In the mixture of SDPM and Cow dung of 140kgs produced 328.5litres of clean
biogas. Hence 1kg for the mixture: = 𝟏×𝟑𝟐𝟖.𝟓
𝟏𝟒𝟎=2.34l/kg
Gas yield per ton from the above equation is:
= 𝟏𝟎𝟎𝟎𝒌𝒈 × 𝟐. 𝟑𝟒𝒍/𝒌𝒈
= 2340L
From the literature review, SDPM is produced in Kenyan Sugar Factory per day is
averagely 50 tons (www.kenyasugar.co.ke) and from the South Nyanza Sugar Zone
having three Sugar factories of a total capacity 150tons/day.
So when all the SDPM were all converted to biogas, the potential of the gas would
be:
𝟐𝟑𝟒𝟎𝒍 × 𝟏𝟓𝟎 = 𝟑𝟓𝟏𝟎𝟎𝟎𝒍 ≈ 𝟑𝟓𝟏𝑴𝟑Per day.
For the annual potential of SDPM = Volume produced per day multiplied by 365 day
in a year.
𝟑𝟓𝟏𝑴𝟑 × 𝟑𝟔𝟓 = 𝟏𝟐𝟖𝟏𝟏𝟓𝑴𝟑/𝒂𝒏𝒏𝒖𝒎
4.5.2.2 Power Generation from the Genera-
tor
The rating of the small biogas generator used for combustion had the following
ratings:
Rated Output: 2.8kW
Maximum Output: 3.1kW
Power factor: 1.0
kW=kilowatt.
The Genset burns 0.9M3 of Biogas in 1 hour

55
438 liters volume of the biogas used to run the small biogas generator. From the rating
of the generator, the gas of 0.438M3 run the generator for 30 minutes. Therefore power
produced against time is
kWh= kW X h
= 3.1 X .5
= 1.55kWh
So 438L = 0.438 m3 of produced 1.55kWh
Therefore 1 m3 = 1.55/0.438
=3.54 kWh
So, the potential per annum for the power produced within the South Nyanza Sugar
Zone would be:
Volume produced Per annum= 𝟏𝟐𝟖𝟏𝟏𝟓𝑴𝟑
So power which can be generated from SDPM per year
= 𝟏𝟐𝟖𝟏𝟏𝟓𝑴𝟑𝑿 𝟑. 𝟓𝟒𝒌𝑾𝒉/𝑴𝟑
= 𝟒𝟓𝟑𝟓𝟐𝟕𝒌𝑾𝒉 ≈ 𝟒𝟓𝟑. 𝟓𝑴𝑾𝒉
a. Voltmeter during
electricity Gen
b. Ac/dc slots
Figure 4.5: Voltage Levels during electricity conversion

56
CHAPTER FIVE
CONCLUSION AND RECOMMENDATIONS
5.1 Conclusion
The study aimed at assessment of the sugar derived press mud potential to produce
biogas which can be used in production of electricity.
The characterization of sugar derived press mud done, showed that SDPM met the
thresh hold values for the biogas production and qualified as a feedstock in biogas
production. This also answered the research hypothesis question: does biogas
produced from Sugar cane derived press mud has no difference from cow dung
derived biogas.
Compositional data for the raw biogas on average was; Methane (CH4) 50- 52%, 30-
32% Carbon dioxide (CO2), Nitrogen (N) 13-15% and traces of Hydrogen Sulphide
(H2S) 1-4%. And when upgraded/cleaned, the average range were Methane (CH4) 70-
72%, 6-9% Carbon dioxide (CO2), Nitrogen (N2) 15-19% and traces of Hydrogen
Sulphide (H2S) 1-2%. This improved the concentration of methane to high level
suitable for heating and fuel for electricity generation.
From theoretical calculations using Buswell equation, it was found that for every 1 kg
of mixed SDPM and cow Dung (inoculant) we can generate 72.0 kWh. When a small
generator was used to convert the clean biogas of 1M3, 3.54kWh was produced. And
when the annual potential of SDPM biogas converted to electric power it was found
that it could produce 453.5MWh per annum. These results have proven to be one of
the feedstock which can be used well in production of biogas and electricity as the
production profiles compares well with those of conventional feed stocks such as cow
dung and water hyacinth.
The present methods for disposal of sugar press mud from sugar industry are not
environmentally sound. Its disposal is a problem and creates environmental nuisance.
But generation of biogas from the substrate will reduce environmental problem.

57
5.2 Recommendations
Sugar industry is one of the heavy electricity power consumer in the country and by
producing the power will reduce their expenditure in power hence low cost of
production.
The sugar industry will financially benefit from installation biogas generators, as the
economic analysis reveals that the production of biogas and bio-fertilizer from press
mud is economically feasible. Furthermore, there is triple benefit associated with the
waste bio-methanation as we get clean fuel biogas, enriched manure bio-fertilizer and
also hygienic environment.
5.3 Further research is recommended in the following areas:
I. Doing analysis on the characterization of sludge as the degradation and
digestion takes place to check and compare with the sugar derived press mud
before loading.
II. Production of biogas on large scale by sugar industry and other uses a part from
production of electricity.
III. Doing an assessment on the impact of using sugar press mud in production of
the biogas to farmers before utilization as fertilizer and how that impact cane
yields in their farms and the economic analysis.

58
REFERENCES
ASTM. (2000). Standard test methods for moisture, ash, and organic matter of peat and
other organic soils. Method D 2974-00. American Society for Testing and
Materials. West Conshohocken, PA:US
Baez-Smith, C. (2008). Production of bioenergy using filter cake mud in sugar cane
mill factories. Herausgegeben von Sugar Processing Research Institute Inc.
Abstracts from the SPRI 2008. Conference: Diversifying Research in Sugar
Processing, Bd. S. 9
Barry G.A, Rayment G.E., Bloesch P.M and Price A. (2000). Recycling sugar industry
by-products and municipal bio-solids on cane-lands. Environmental Short
Course for Sustainable Sugar production: Course Manual. Working Paper,
Cooperative Research Centre for Sustainable Sugar Production, Townsville
Bhosale PR, Chonde SG, Nakade DB, Raut PD. Studies on Physico-Chemical Charac-
teristics of Waxed and Dewaxed Pressmud and its effect on Water Holding
Capacity of Soil. ISCA Journal of Biological Sciences. 2012; 1(1).
britishbiogen.co.uk [Internet]. [Cited 2014Jan.23]. Retrieved from:
http://britishbiogen.co.uk
Biogas upgrading and utilisation Retrieved from http://www.novaenergie.ch/iea-
bioenergy-task37/dokumente/biogas%20upgrading.pdf [cited 2014Jan.13].
Blume, L.J., B.A. Schumacher, P.W. Shaffer 1990. Handbook of Methods for Acid
Deposition Studies Laboratory Analyses for Soil Chemistry. EPA/600/4-90/023.
Las Vegas, NV: U.S. Environmental Protection Agency.
Chapman L.S (1996): Australian sugar industry by-products recycle plant nutrients. In:
Hunter, H.M., Eyles, A.G. Rayment, G.E. (Eds.), Downstream Effects of Land
Use. Brisbane: Department of Natural Resources,
Chege, J. Maina, 2015. Design, Fabrication and Optimization of a Small Scale
Adsorption Process Reactor for Biogas Purification, JKUAT, IEET

59
Dasgupta A and Nemerow NL (1988), anaerobic digestion of lingo cellulosic residue
from sugarcane processing, Energy Biomass Waste, 11: 613.
De Hullu j, Maassen JIW, van Meel PA, Shazad S, Vaessen JMP, Bini L, Reijenga JC
(2008). Comparing different biogas upgrading techniques. Project report
commissioned by Dirkse Milieutechniek BV and submitted to the Technical
University of Eindhoven.
Elkader A. A and Yassin A. A (1989): Filter Mud as Fuel for Steam Generation in
Egypt, Proc. Of Congress of ISSCT, P, 326
Fabien M. (2003). An Introduction to Anaerobic Digestion of Organic Wastes,
2003Oct.22.
Feldmann L. (2010). Gasifying of Wood:1–23
Gas Technology, I. (2003). HIMET-A Two-Stage Anaerobic Digestion Process for
Converting Waste to Energy. Institute of Gas technology, Chicago IL.
GoK, (2004). Sessional Paper No. 4 on Energy, Nairobi: Government Printer, 34 – 45.
GoK, (2006). The Energy Act. Nairobi: Government Printer, 14 – 16.
GoK. (2008).‘Science, Technology and innovation policy and Strategy’, [pdf] Republic
of Kenya, Ministry of Science and Technology, 12
GREENPOWER [Internet]. greenpower.cn. [cited 2014Jan.23]. Available from:
http://www.greenpower.cn/en/index-home.htm
GTZ-GATE (1999). Biogas Digest (Volume I. Biogas Basics) GTZGATE.Eschborn,
Germany. Retrieved from http://www2.gtz.de/dokumente/bib/04-5364.pdf
GTZ-HERA (2010). Small-scale Electricity Generation from Biomass.
Gupta N, Tripathi S, Balomajumder C. (2011). Characterization of pressmud: A sugar
industry waste. Fuel: 90(1).

60
Hansson, M., A. Nordberg, I. Sundh and B. Mathisen (2002). Early warning of
disturbances in a laboratory-scale MSW biogas process. Water Science and
Technology, 5(10).
Holman, J. P. (1995). Experimental methods for engineers, 6th ed. New Delhi: Tata
McGraw-Hill.
Horecky P and Saska M (2004). Thermophilic Anaerobic digestion of filter cake from
sugarcane factory, Audubon Sugar institute, Louisiana state University
Agricultural Centre.
http://www.biogasworks.com
http://www.britishbiogen.co.uk/gpg/adgpg/adgpg.pdf
http://www.seas.columbia.edu/earth/vermathesis.pdf
http:/www.mikropul.com/products/ wscrubber/mikrovane.html
Hugot E. (1986). Hand Book for Cane Sugar Engineering 3rd Completely Revised Ed.
New York: Elsevier Publishing Company,.
Jaber A.M.Y.; Mehanna N.A.; Sultan S.M. (2009). "Determination of ammonium and
organic bound nitrogen by inductively coupled plasma emission spectroscopy".
Talanta. 78:. doi:10.1016/j.talanta.
Jackson M. L, (1956). "Soil Chemical Analysis", Prentice-Hall, Inc.
Jadhav R. T (2011). Environmentally Safe Renewable Energy Technology using Sugar
Cane. Universal Journal of environment Research and Technology, 1(2)
Jepma C. J and Nakicenovic N. (2006). Sustainable Development and the Role of Gas,
EDReC/IIASA/IGU.
Karan M. A, Barve B. R & Khan S.S (2011). Biogas from press mud... IOSR Journal
of mechanical and civil engineering. 46(2).

61
Kennes C, and Viega MC (2001). Conventional biofilters. In: Kenness C, Viega MC
(eds) Bioreactor for waste gas treatment. Kluwer Academic Publisher,
Dordrecht, pp 47-98.
Kenya Sugar board website: Sugar Factories in Kenya and their Crushing capacities.
Available from: http://www.kenyasugar.co.ke kenyasugar.co.ke [Internet].
[cited 2014Jan.23].
Khandewal, K. C. and S. S. Mahdi, (1986). Biogas technology: practical handbook.
New Delhi: Tata McGraw-Hill, p. 51-2.
Konstandt, H. G. (1976). Engineering’s operation and economics of methane gas
production. Seminar on Microbial Energy Conversion, Gottingen, Erich Goetze
Verlag, Germany
Liu, J. (2003). Instrumentation, Control and Automation in Anaerobic Digestion, Ph.D.
dissertation, Department of Biotechnology, Lund University, Sweden
Mark Walker, (2009). Renewable Energy Sustainable biogas production from wastes
and energy crops, University of Southampton Anaerobic digestion and energy.
Mathur R.B.L. (1997). Handbook of Cane Sugar Technology, New Delhi: IBH
Publishing Co.
Ministry of Energy (2011). National Energy Policy First Draft.
Ministry of Energy, Kenya, (2008). Feed-in-tariffs policy on wind, biomass and small-
hydro resource generated electricity.
Neha G, Sumit T & Chandrajit B (2011). Characterization of press mud: A sugar
industry waste, Fuel, 90 (1): 389-394.
Nelson, D.W. and Sommers L.E. (1996). Total carbon, organic carbon, and organic
matter. In: Methods of Soil Analysis, Part 2, 2nd ed., A.L. Page et al., Ed.
Agronomy. 9. Am. Madison, WI:Soc. of Agron, Inc.

62
Njogu, P., Kinyua, R., Muthoni, P. & Nemoto, Y. (2015). “Biogas Production Using
Water Hyacinth (Eicchornia crassipes) for Electricity Generation in Kenya”. J.
of Energy and Power Eng., 7: http://dx.doi.org/10.4236/epe.2015.75021.
Paul Kirai (2009). Energy systems: Vulnerability-Adaptation-Resilience (VAR), Focus:
sub-Saharan Africa, (Kenya) Helio International.
Persson M, Jonsson O, wellinger A (2006). Biogas upgrading to vehicle fuel standards
and grid injection. In: Task 37- Energy from biogas and landfill gas. IEA
Bioenergy.
Purity Muthoni Njeru and Paul Njogu (2014). Conversion of Water Hyacinth Derived
Biogas to Biomethane for Electricity Generation in Kenya: A Waste to Energy
(WtE) Approach. Proceedings of 2014 International Conference on Sustainable
Research and Innovation, Volume 5, 7th-9th May 2014
Qureshi ME, Wegener MK, and Mallawaarachchi T (2001). The economics of sugar
mill waste management in the Australian Sugar Industry, Mill mud case study.
Australian Agri-cultural and Resource Economics Society, 2001.
Rajput R. K, (2009). Dry and wet scrubbers, power plant engineering, New Delhi Laxmi
Publications Pvt Limited.
Rolz C., De León R., Cifuentes R. and C. Porres (2010). Sugar Tech 12(1): 15-20,
Windrow composting of sugarcane and coffee by-products,
Rouf M. A, Bajpai P. K and Jotshi C. K (2010). Optimization of Biogas Generation,
Bangladesh journal of Sci. Ind. Res. 45(4).
Rouf M. A, Bajpai P. K and Jotshi C. K (2013). Techno-economic assessment of biogas
production from press mud in Bangladesh. Bangladesh J. Sci. Ind. Res. 48(1),
51-58, 2013
Sanchez E., Borja R and Lopet M (1996). Determination of Kinetic Constant of
Anaerobic Digestion of Sugar Mill Mud Waste, Bio-resource Technol. 56(2&3).
Savery, W. C. and D. C. Cruzon (1972). Methane recovery from chicken manure. J
Water Pollut Control Fed 44.

63
Schulte-Schulze Berndt A (2005). Biogas upgrading with pressure swing adsorption
versus biogas reforming. In: Biofuels for fuel cells. London: IWA Publishing,.
Skoog, D.; West, D. M; Holler, F James (1996). "5: Gravimetric Analysis".
Fundamentals of Analytical Chemistry (7th ed.). Fort Worth: Saunders College
Publishing Harcourt Brace. LCCN 95-067683.
Tjalfe G. Poulsen (2003). Solid waste management. Chapter 5 Anaerobic digestion,
Denmark: Aalborg University.
United Tech, I. (2003). Anaerobic Digestion, UTI Web Design.
Van der Poel P. W, Schiweck H, and Schwartz, T. (1998): Sugar technology, Beet and
cane sugar manufacture. Verlag Dr. Albert Martens KG, Berlin, 1005 p.
Welink, J. H, Dumont, M and Kwant, K, (2007). Groen gas: gas van aardgaskwaliteit
uit biomassa: update van de studie uit 2004, SenterNovem.
www.banglajol.info.com [cited 2014Jan.21].
www.helio-international.org/varkenya.en.pdf [Internet]. Helio-international.org.
Available from: http://www.helio-international.org/varkenya.en.pdf
www.suscon.org/cowpower/biomethanesourcebook/references.pdf
[Internet].Suscon.org. Retrieved from:
http://www.suscon.org/cowpower/biomethanesourcebook/references.pdf
Yadav R.L And Solomon S (2006). Potential of Developing Sugarcane By-product
Based Industries in India…Indian Institute of Sugarcane Research, P.O.
Dilkusha, Rae Bareli Road, Lucknow-226 002, India Pp. 104-111.
Yadava, L. S. and P. R. Hcssc (1981). The Development and Use of Biogas Technology
in Rural Areas of Asia (A Status Report 1981). Improving Soil Fertility through
Organic Recycling. FAO/UNDP Regional Project RAS/75/004, Project Field
Document No. 10.

64
APPENDICES
Appendix 1: Published paper and Proceedings
Paper
Nyonje E.O, Njogu P and Kinyua R. (2015): “Assessment of the potential for
utilization of sugarcane derived press mud for Biogas generation in South Nyanza
sugarcane zones, Kenya”. Journal of Sustainable Research in Engineering 1(4) 2014,
30-33. http://www.jkuat-sri.com/ojs/index.php/sri/issue/view/13
Proceedings
Nyonje E. O, Njogu P. and Kinyua R. (2014) Assessment of the potential for
utilization of sugarcane derived press mud for Biogas generation in South Nyanza
sugarcane zones, Kenya. Proceedings of 2014 International Conference on
Sustainable Research and Innovation, Volume 5, 7th-9th May 2014.
Nyonje E. O, Njogu P. and Kinyua R. (2014) Characterization and Utilization of
Sugarcane derived press mud for Electricity generation in Sugar industries, Kenya.
Proceedings of 2014 International Conference on Sustainable Research and
Innovation, Volume 9, 13th-9th November 2014.

65
Appendix 2: Individual Sugar industry SDPM results
SUGA
R
INDU
STRY
CRU
CIBL
E
WEI
GHT
(g)
SAMPLE
+
CRUCIB
LE(g)
SAMPLE
(g)
ASH
+CRUI
CIBLE(
g)
ASH(
g)
ASH
%(g)
SUKA
RI 1
42.49
33
45.0617 2.5684 42.8625 0.369
2
12.97
4707
99
SUKA
RI 2
36.33
5
39.1483 2.8133 36.7028 0.367
8
13.07
3614
62
TRAN
SMAR
A 1
45.66
44
49.1979 3.5335 46.3229 0.658
5
18.63
5913
4
TRAN
SMAR
A 2
34.94
65
38.0946 3.1481 35.5392 0.592
7
18.82
7229
12
SONY
1
36.89
08
39.0357 2.1449 37.3317 0.440
9
20.55
5736
86
SONY
2
41.58
32
44.24383 2.66063 42.2784 0.695
2
20.12
9149
86

66
SUGA
R
INDU
STRY
POL
%
AVERAG
E
SUKA
RI 1
6.82 6.875
SUKA
RI 2
6.93
TRAN
SMAR
A 1
6.69 6.69
TRAN
SMAR
A 2
6.79
SONY
1
5.68 5.425
SONY
2
5.27
SUGA
R
INDU
STRY
DIS
H +
LID
DISH+LI
D+SAMP
LE
SA
MP
LE
DISH+LI
D+SAMP
LE
(AFTER)
MOIST
URE
MOI
STU
RE %
SUKA
RI 1
28.29
58
40.0025 11.7
067
32.0356 7.9669 68.05
4191
19

67
SUKA
RI 2
38.01
5
49.1164 11.1
014
41.6308 7.4856 67.42
9333
24
TRAN
SMAR
A 1
35.44
2
46.7067 11.2
647
39.5635 7.1432 63.41
2252
43
TRAN
SMAR
A 2
38.44
77
49.7242 11.2
765
42.5126 7.2116 63.95
2467
52
SONY
1
35.14
09
46.01 10.8
691
39.5036 6.5064 59.86
1442
07
SONY
2
37.40
88
48.1342 10.7
254
41.657 6.4772 60.39
1220
84
SUGA
R
INDU
STRY
CRU
CIBL
E
WEI
GHT
SAMPLE
+
CRUCIB
LE
SA
MP
LE
ASH
+CRUICI
BLE
(AFTER
HEATIN
G)
ORGA
RNIC
CARB
ON
O C
%
SUKA
RI 1
38.29
21
43.4449 5.15
28
39.0189 4.426 85.89
5047
35

68
SUKA
RI 2
39.11
4
44.2605 5.14
65
39.849 4.4115 85.71
8449
43
TRAN
SMAR
A 1
47.02
6
52.4756 5.44
96
47.9895 4.4861 82.31
9803
29
TRAN
SMAR
A 2
46.57
63
51.6116 5.03
53
47.3957 4.2159 83.72
6888
17
SONY
1
48.10
76
53.1247 5.01
71
49.1753 3.9494 78.71
8781
77
SONY
2
42.70
68
47.7419 5.03
51
43.432 4.3099 85.59
7108
3
ASH
+CRUICIBLE
(AFTER
HEATING)
SUGA
R
INDU
STRY
CRU
CIBL
E
WEI
GHT
SAMPLE
+
CRUCIB
LE
SA
MP
LE
AFTER
HEATIN
G
VOLA
TILE
MATT
ER
VM
%
SUKA
RI 1
38.29
21
43.4449 5.15
28
39.0089 4.436 86.08
9116
6

69
SUKA
RI 2
39.11
4
44.2605 5.14
65
39.7314 4.5291 88.00
3497
52
TRAN
SMAR
A 1
47.02
6
52.4756 5.44
96
47.9773 4.4983 82.54
3672
93
TRAN
SMAR
A 2
46.57
63
51.6116 5.03
53
47.3877 4.2239 83.88
5766
49
SONY
1
48.10
76
53.1247 5.01
71
49.143 3.9817 79.36
2579
98
SONY
2
42.70
68
47.7419 5.03
51
43.6965 4.0454 80.34
3985
22
PROT
EIN
SUGA
R
INDU
STRY
FIN
AL
VOL
UME
INITIAL
VOLUM
E
VO
LU
ME
USE
D
AVERAG
E
%NITR
OGEN
BLAN
K
0.7 0 0.7 0.7
SUKA
RI 1
6.8 0.7 6.1 5.55 48.5077
6

70
SUKA
RI 2
11.8 6.8 5
TRAN
SMAR
A 1
14.3 11.8 2.5 2.7 3.70043
2
TRAN
SMAR
A 2
17.2 14.3 2.9
SONY
1
21.2 17.2 4 4.3 43.0068
8
SONY
2
25.8 21.2 4.6
C.O.D
SUGA
R
INDU
STRY
Ferrous
Ammonium
Sulphate used=
0.1M
SAMP
LE
10%(0
.5mls)
STA
RT
MLS
END
MLS
TIT
RE
ML
S
BLANK
TITRE
Molarit
y of
FAS
mls
Samp
le
used
COD
as mg
O2/L

71
BLAN
K 1
3.1 7 3.9 3.9 0.1 0.5 0
BLAN
K 2
0 3.9 3.9 3.9 0.1 0.5 0
SUKA
RI 1
0 3.1 3.1 3.9 0.1 0.5 1280
SUKA
RI 2
3.1 4.1 3 3.9 0.1 0.5 1440
TRAN
SMAR
A 1
4.1 6.4 2.3 3.9 0.1 0.5 2560
TRAN
SMAR
A 2
6.4 8.9 2.5 3.9 0.1 0.5 2240
SONY
1
8.9 12 3.1 3.9 0.1 0.5 1280
SONY
2
12 15.1 3.1 3.9 0.1 0.5 1280
FIBRE % (100GM SAMPLE)
SUGA
R
INDU
STRY
WEI
GHT
OF
THE
SIEV
E
WEIGHT SIEVE
PLUS SAMPLE
WEIGHT OF DRY
SAMPLE PLUS
SIEVE
WEIGHT OF
DRY
SAMPLE
FIB
RE
%

72
SUKA
RI
174.7
3
274.73 190.23 15.5 15.
5
SONY 174.6
6
274.66 197.63 22.97 22.
97
TRAS
MAR
A
174.6
8
274.68 193.33 18.65 18.
65
PH ANALYSIS
SUGAR
COMPANIES
SAMLPE 1 SAMPLE 2 AVERAGES
TRANSMARA 7.58 7.77 7.675
SONY 7.67 7.03 7.35
SUKARI 7.61 7.57 7.34