Embed Size (px)
Citation preview
DRO Deakin Research Online, Deakin University’s Research Repository Deakin University CRICOS Provider Code: 00113B
Assessment of population genetic structure in the arbovirus vector midge, Culicoides brevitarsis (Diptera: Ceratopogonidae), using multi-locus DNA microsatellites
Citation: Onyango, Maria G., Beebe, Nigel W., Gopurenko, David, Bellis, Glenn, Nicholas, Adrian, Ogugo, Moses, Djikeng, Appolinaire, Kemp, Steve, Walker, Peter J. and Duchemin, Jean-Bernard 2015, Assessment of population genetic structure in the arbovirus vector midge, Culicoides brevitarsis (Diptera: Ceratopogonidae), using multi-locus DNA microsatellites, Veterinary research, vol. 46:108, pp. 1-9.
DOI: http://www.dx.doi.org/10.1186/s13567-015-0250-8
© 2015, The Authors
Reproduced by Deakin University under the terms of the Creative Commons Attribution Licence
Downloaded from DRO: http://hdl.handle.net/10536/DRO/DU:30113363
VETERINARY RESEARCHOnyango et al. Veterinary Research (2015) 46:108 DOI 10.1186/s13567-015-0250-8
RESEARCH ARTICLE Open Access
Assessment of population genetic structurein the arbovirus vector midge, Culicoidesbrevitarsis (Diptera: Ceratopogonidae), usingmulti-locus DNA microsatellites
Maria G Onyango1,2, Nigel W Beebe3,4, David Gopurenko5,6, Glenn Bellis7, Adrian Nicholas6, Moses Ogugo8,Appolinaire Djikeng8,9, Steve Kemp8, Peter J Walker1 and Jean-Bernard Duchemin1*Abstract
Bluetongue virus (BTV) is a major pathogen of ruminants that is transmitted by biting midges (Culicoides spp.).Australian BTV serotypes have origins in Asia and are distributed across the continent into two distinct episystems, onein the north and another in the east. Culicoides brevitarsis is the major vector of BTV in Australia and is distributed acrossthe entire geographic range of the virus. Here, we describe the isolation and use of DNA microsatellites andgauge their ability to determine population genetic connectivity of C. brevitarsis within Australia and withcountries to the north. Eleven DNA microsatellite markers were isolated using a novel genomic enrichmentmethod and identified as useful for genetic analyses of sampled populations in Australia, northern Papua NewGuinea (PNG) and Timor-Leste. Significant (P < 0.05) population genetic subdivision was observed between allpaired regions, though the highest levels of genetic sub-division involved pair-wise tests with PNG (PNG vs.Australia (FST = 0.120) and PNG vs. Timor-Leste (FST = 0.095)). Analysis of multi-locus allelic distributions usingSTRUCTURE identified a most probable two-cluster population model, which separated PNG specimens from acluster containing specimens from Timor-Leste and Australia. The source of incursions of this species in Australia ismore likely to be Timor-Leste than PNG. Future incursions of BTV positive C. brevitarsis into Australia may be geneticallyidentified to their source populations using these microsatellite loci. The vector’s panmictic genetic structure withinAustralia cannot explain the differential geographic distribution of BTV serotypes.
IntroductionBluetongue (BT) is an economically important viral dis-ease throughout tropical and temperate regions of theworld, posing a threat to the livestock industries, throughproduction losses and negative impacts on trade [1]. Thedisease affects primarily sheep and goats. Cattle can alsobe infected but rarely show signs of disease [2]. Bitingmidges (Culicoides spp.) are vectors of bluetongue virus(BTV). In Australia, C. actoni Smith, C. brevitarsis Kieffer,C. fulvus Sen and Das Gupta are proven vectors of BTVand several others including C. brevipalpis Delfinado, C.dumdumi Sen and Das Gupta C. oxystoma Kieffer, C.
* Correspondence: [email protected] Health & Biosecurity Australian Animal Health Laboratory, 5Portalington Road, Geelong, Victoria 3220, AustraliaFull list of author information is available at the end of the article
© 2015 Onyango et al. Open Access This artiInternational License (http://creativecommonsreproduction in any medium, provided you gthe Creative Commons license, and indicate if(http://creativecommons.org/publicdomain/ze
peregrinus Kieffer and C. wadai Kitaoka are regarded aspotential vectors [3,4]. Of these species, C. brevitarsis isthe most widely distributed throughout northern and east-ern parts of the continent [5,6], and is considered to bethe major vector, employing cattle and buffalo dung asbreeding sites [4,7].BTV appears to have been introduced to Australia
from Southeast Asia on multiple occasions by infectedwind-borne vectors [8,9]. Indeed, 10 of the 26 knownBTV serotypes have been detected in Australia throughintensive surveillance during the past 30 years and thereis evidence that at least four of these serotypes were in-troduced since the surveillance programme commenced[10]. The absence of clinical bluetongue disease inAustralia, despite evidence of widespread infection incattle, has been attributed to the limited distribution of
cle is distributed under the terms of the Creative Commons Attribution 4.0.org/licenses/by/4.0/), which permits unrestricted use, distribution, andive appropriate credit to the original author(s) and the source, provide a link tochanges were made. The Creative Commons Public Domain Dedication waiverro/1.0/) applies to the data made available in this article, unless otherwise stated.
Onyango et al. Veterinary Research (2015) 46:108 Page 2 of 9
C. brevitarsis to non-sheep breeding regions, primarilyin the south of the continent and the relatively lowpathogenicity of Australian BTV serotypes. Surveillancehas indicated that the distribution of BTV serotypes inAustralia is asymmetric with all 10 serotypes detected inthe far northern region and only two serotypes (BTV-1and BTV-21) enzootic in the southern portions of theeastern states. The factors influencing the distribution ofserotypes are unknown and there is concern that intro-ductions of exotic BTV strains from Southeast Asia viawindborne Culicoides could destabilize the current situ-ation [9]. A recent study of long-distance dispersal ofCulicoides midges using an aerial migration model, indi-cated that migration of Culicoides into northernAustralia from Timor-Leste (TL) and Papua New Guinea(PNG) is possible with Timor considered the most likelysource of incursions [11]. Recent phylogeographic ana-lyses [12,13] generally support those contentions andfurther indicate C. brevitarsis likely entered Australiaand PNG separately from independent southeast Asiansources, in recent historical times [13]. Results of thoseprior genetic studies were based on analyses of a singlematernally inherited gene and are potentially biased by avariety of evolutionary, demographic and sampling pro-cesses [14,15]. Additional population genetic analysesusing multiple independent loci are needed to test hy-potheses concerning the origins of recent arrivals ofmidge species in Australia.The first aim of this study was to develop a technical
workflow for identifying DNA microsatellite markers denovo from small organisms such as Culicoides fromwhich limited quantities of genomic DNA can be ex-tracted. The second aim was to identify and compareallelic diversity of microsatellite loci among C. brevitar-sis in Australia and neighbouring countries (PNG andTL) that are suspected sources of Culicoides spp. enter-ing Australia. In this latter aim, we also sought to deter-mine the levels of population genetic connectivityamong the regions and infer the likely source(s) ofmidges in Australia during historical and current times.
Materials and methodsInsect sampling and DNA preparationA total of 141 samples were collected using light trapor sweep net, preserved in 70% ethanol and identifiedfrom sites in the Northern Territory (NT), Queens-land (QLD), New South Wales (NSW), PNG and TL(Figure 1A) as described by Gopurenko et al. [13].Species identification was verified using genetic methodsreported in [16,17] to ensure morphologically related spe-cies of Culicoides were not included in analyses. After spe-cies identification, total genomic DNA was extracted fromsingle specimens of C. brevitarsis using the DNeasy bloodand tissue kit (Qiagen) according to the manufacturer’s
protocol and by a non-destructive genomic DNA extrac-tion method [16]. The genomic DNA was quantified usinga Qubit fluorometer (Life Technologies, Invitrogen).
Whole genome amplification of C. brevitarsisTo improve the amount of genomic DNA yield fromsingleton Culicoides for downstream manipulations,multiple displacement amplification-based (MDA) wholegenome amplification (WGA) using Repli-g ultrafastmini kit (QIAGEN) was conducted on specimen DNAaccording to the manufacturers’ protocol. To assess thedifferences in yield of amplification from a range ofstarting amounts of genomic DNA and according to twodifferent denaturing procedures, 10.7 ng and 0.215 ng ofDNA were denatured either by heat (95 °C for 3 min) andor by adding denaturing solution (buffer D1; QIAGEN)and then amplified using the REPLI-g ultrafast mini kitat 30 °C for 1.5 h followed by polymerase inactivationat 65 °C for 3 min. Water was used as a negative con-trol. The resulting DNA was quantified using a Qubitfluorometer and qualitatively assessed by electrophor-esis (1% agarose gel (Invitrogen) at 7.40 V/cm) in the pres-ence of 1 kb DNA ladder and staining/UV visualisation.
Quality check of whole genome amplified DNATo evaluate the quality of the whole genome ampli-fied DNA, the products of the previous amplification(together with the negative control) were used astemplates to PCR amplify a 600 bp housekeeper gene(actin). Each 20 μL reaction included 1 μL templateDNA (approximately 20 ng), BSA (400 ng/μL), 5 μmeach forward and reverse primer (Act-2 F and Act-8R)[18] and 15 μL Platinum PCR supermix high fidelity (LifeTechnologies). The cycling profile was 94 °C for 2 min,35 cycles of 94 °C for 30 s, 58 °C for 30 s, 72 °C for 30 sand a final elongation at 72 °C for 5 min [18]. The PCRproducts were assessed for size by electrophoresis as de-scribed earlier.
Isolation and screening of microsatellite repeats andprimer designTo isolate DNA microsatellite markers, 1 μL of a pooledspecimen DNA (n = 7 New South Wales, n = 8 NorthernTerritory) was whole genome-amplified. The amplifiedwhole genomic DNA was sequenced on 1/8 plate Roche454 Genome Sequencer FLX plus by an external contrac-tor (Macrogen, Geumchun-gu, Seoul). The raw sequencereads of amplified whole genomic DNA were screeneddirectly for di-, tri- and tetranucleotides using MSAT-COMMANDER v0.8.2 [19]. Primers were designed to theflanking regions of the microsatellite repeats using thePrimer 3 program [20]. The primers were checked forsimilarities amongst each other and were blasted againstthe NCBI database using BLASTN to determine if the

Figure 1 Sites of collections of C. brevitarsis and plot of the genetic structure in this study. A STRUCTURE plot results (K = 2) integratedinto a map showing the locations of the study area. B The Q matrix derived from STRUCTURE clustering analysis show the inferred ancestrymembership proportions of each individual in each cluster (K = 2). Each individual is represented by a single vertical line, partitioned into Kcolored segments that represent the individual’s estimated membership fraction in each of the K inferred clusters. The X-axis corresponds tothe pre-defined populations (TL, PNG, QLD, NT and NSW) and the Y-axis represents the proportional estimates of the estimated membershipin clusters, which add up to one.
Onyango et al. Veterinary Research (2015) 46:108 Page 3 of 9
target sequences were derived from microorganisms andor other contaminants. Primers that were found to beunique i.e. neither homologous to sequences from otherorganisms in the database nor similar to each other weresubsequently compared to our sequenced C. brevitarsisraw reads. The primer pairs that were predicted to annealto more than one read were aligned to those reads afterreverse-complementing the reverse primer.
Microsatellite validationInitially, 38 primer pairs flanking dinucleotide repeatswere selected for validation. Each primer pair was tested
on 10 individuals. Twelve of the primer pairs that amp-lified 100% of the sub-set of samples (Table 1) wereused to amplify DNA from 141 individuals (one indi-vidual acting as the positive control and reference allelesize) sampled from three regions in Australia (NorthernTerritory; southeast Queensland and New South Wales)as well as from northern Papua New Guinea andTimor-Leste (Figure 1A). Each 25 μL PCR reaction in-cluded 1.0 μL template DNA (20 ng), 0.2 μmol (each)forward and reverse fluorescently labeled primer (AppliedBiosystems, USA), 18 μL (0.396 U) of Platinum PCRsupermix high fidelity (Life Technologies) and 2.75 μL

Table 1 Microsatellite loci and primers developed in this study. Locus G7B17 excluded from population genetic due toevidence of significant (P < 0.05) linkage to locus GO2AH
Locus Motif type Range of sizes NA Left primer Right primer #PROBEDB_ACC
HH82P (AC)^13 400–422 13 CACCTCTGAGAAATCCAACCG AGTTGGTCAGCACCTCAAG Pr032367671
GU21Z (GT)^14 210–222 6 TGAGTTCGTATGGCAAGGC ACAGCGAAATGTTCATACGTG Pr032367668
G7B17 (CA)^11 204–208 3 ATGGGCGAACAAATCGAGG AACATTCGTCTTCGCTGCC Pr032367664
HIIUN (GT)^12 314–328 8 ATCCGGGAATACCTGCGAG AAGTGTTGCCGTCGATTTC Pr032367672
HNBZE (CA)^9 328–344 9 GTGTCCGTAGCGAGTAGCC AGCACGATTGAAACCGACAG Pr032367673
G9WRZ (GT)^8 400–412 6 GCTACTGGAGCGATCTAACG ATTAGTGTGCCGCCTTCAG Pr032367665
G5L7G (AC)^9 398–412 8 AGCATGATGAAATGTCCCGC TCAACTACTGCTGCCCGAG Pr032367663
GO2AH (GT)^8 178–194 8 TGGCTGCGAGTCGAGATG GCCGTCGATAAGAATTAAGGTAAAC Pr032367666
GONNE (CGG)^8 304–316 4 TGATGCCCGTCCAAGATCC GTTGCTCCGTAGTCGAACG Pr032367667
G1FMO (AC)^11 300–322 7 GCGTCATCAGTGCCAAGAC GGAACTACACGGAGCAAGC Pr032367662
HBCQD (GT)^10 368–386 9 GCATTTGCGTTTGGCGATG GAAGGCGTCATTCGATTTGC Pr032367670
GU6HJ (AG)^8 190–194 3 GGCGATGACGATAACGAGC ACATGACTTTGAAATTGAATCTGCC Pr032367669
Onyango et al. Veterinary Research (2015) 46:108 Page 4 of 9
de-ionized water (Life Technologies). The amplificationwas carried out under the following conditions: initialdenaturation of 94 °C for 3 min, then 15 cycles of 94 °Cfor 30 s, 60 °C for 30 s with a gradient decrease of 1 °C/cycle, 72 °C for 30 s followed by 30 cycles of 94 °C for30 s, 45 °C for 30 s, 72 °C for 30 s and a final elongationstep of 72 °C for 7 min. Amplified PCR products werefragment-sized by an external contractor (Macrogen,Geumchun-gu, Seoul). The fragment lengths were ana-lyzed and corrected manually using Genemapper v4.0(Applied Biosystems). A fraction of the original samplesize (6% of specimens) was re-run using touchdownPCR conditions (annealing temperature reduced to 40 °C)as a validation of initial allelic scores.
Data analysisGenepop [21] was used to test for linkage disequilibriumbetween each pair of loci and across regions (Fischer’smethod) and to estimate allelic diversity and the coeffi-cient of inbreeding (FIS) at individual loci within popula-tions. Microchecker [22] was used to check for putativenull alleles, large allele dropout or stutter peaks.Deviations from the Hardy-Weinberg equilibrium was
estimated by using Arlequin v3.0 [23]. The observednumbers of heterozygotes and homozygotes at loci ineach population were tested against the expected num-bers using a chi-square test.To infer population structure from the microsatellite
data, multilocus genetic distance [24] and fixationindex (Fst) [25] estimates were calculated betweenpopulation pairs using Genepop, Arlequin and GenA-lex v6.5 [21,23,26]. Permutation tests (100 replications)were used to determine significance of the populationstructure estimates.A Bayesian clustering approach implemented in STRUC-
TURE v2.3.4 [27] was used to provide probabilistic
estimates of population structure based on unlinked multi-locus genotype distributions. Individuals are assigned prob-abilistically to (K, where K may be unknown) populationsor jointly to two or more populations if their genotypes in-dicate they are admixed. The model doesn’t assume a par-ticular mutation process [27].To generate a matrix of individual membership co-
efficient and population ancestry components, the follow-ing parameter set was applied: burnin period of 100 000,Markov chain Monte Carlo (MCMC) repeats of 100 000,ancestry model of admixture of LOCPRIOR model and a Kvalue range from 1–10 with an iteration of 22.STRUCTURE HARVESTER v0.6.94 [28] was used to
infer the most likely number of genetic clusters (K)present using both the Evanno and Delta K methodswhile CLUMPAK [29] was used to collate the data into asingle matrix for all the K values.
ResultsWGA of heat and D1 buffer-denatured DNA and qualityassessment of whole genome amplified DNAThe DNA yield from WGA DNA of both heat-denaturedand denaturing solution (buffer D1) denatured DNA wascompared. The D1 buffer-denatured DNA yielded moreWGA product than the heat-denatured DNA (data notshown). This suggests the superiority of the D1 bufferover heat as a denaturing agent in WGA. Tests usinglow concentration DNA sample template (0.215 ng) re-sulted in higher yield of WGA products compared toyield using higher concentration DNA template (10.7 ng).The size of WGA DNA smears was from >10 kb with asmear extended down to ~1 kb. The negative controlreaction did not amplify. Positive controls based onactin gene amplification were successful in both thewhole genome amplified heat and D1 buffer-denatured

Onyango et al. Veterinary Research (2015) 46:108 Page 5 of 9
DNA. The negative control reaction from the sameWGA reaction did not amplify.
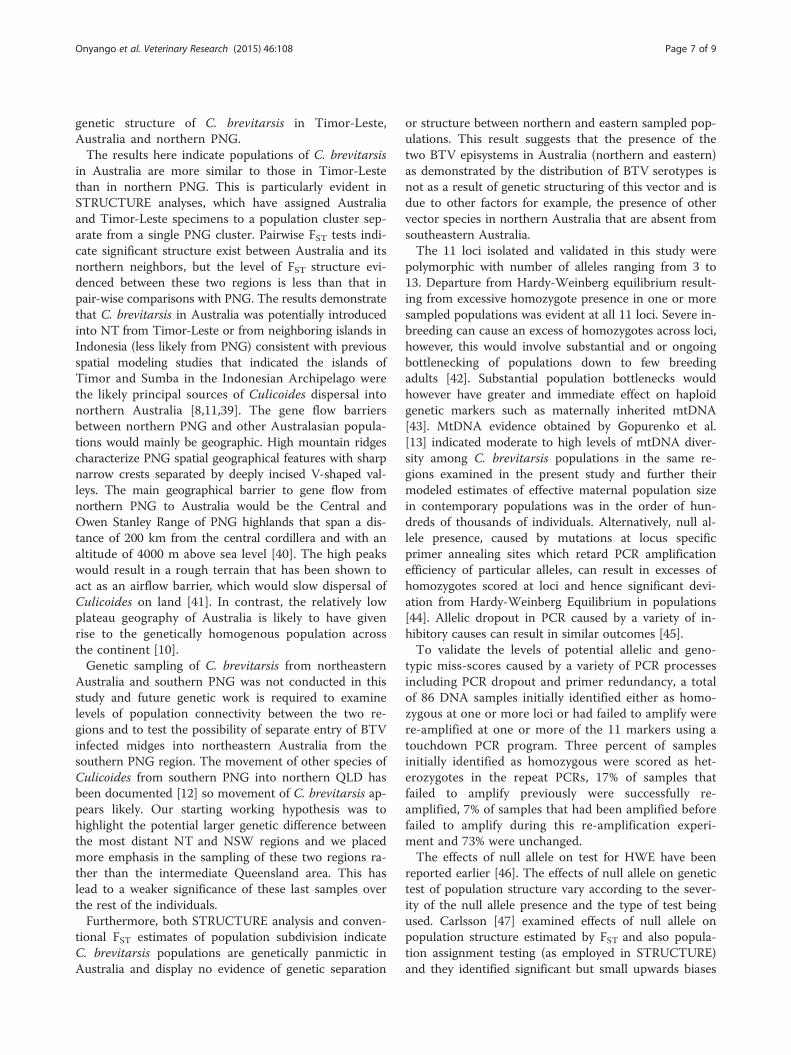
Isolation and screening of microsatellite repeats andprimer designA total of 120 005 reads of 414 average read length wasobtained after sequencing the amplified whole genomicDNA. The maximum theoretical genome coverage ob-tained in this study was ~0.25 X (no. of reads X averageread length/size of genome) of the approximately 200 MBCulicoides genome [30]. A total of 2091 reads were foundto contain putative microsatellite repeats. From the readsthat contained putative repeats, 2594 putative microsatel-lite repeats were isolated (2361 dinucleotide repeats, 90trinucleotide repeats and 98 tetranucleotides repeats). Wedetected approximately 52 microsatellite repeats per MBof the genome with most primers flanking AC and GT re-peats (Figure 2).A total of 526 primers were designed to the flanking
regions of the microsatellite repeats. From these, 420primers were either found to be similar to each otheror homologous to sequences from other organisms inthe database, while 106 primers were unique and werenot homologous to anything in the NCBI database.After comparing the 106 unique primers against the se-quenced reads, 93 primer pairs (Additional file 1) werepredicted to anneal to a single unique read while 13primer pairs were predicted to anneal to more than oneread or to more than one site on a single read. High
Figure 2 The distribution pattern of primers across thedifferent microsatellite repeats in Culicoides brevitarsis genome.Considerable variation was observed among the 12 validatedmicrosatellite loci. Exact tests for linkage disequilibrium identifiedsignificant association between locus G7B17 and GO2AH. Subsequentlylocus G7B17, which was less polymorphic than GO2AH wasexcluded from downstream analysis. The number of alleles perlocus ranged from 3–13 and 78 alleles were scored across the11 loci.
conservation between the primer pairs and the reads wasevident upon aligning them to the reads. These particularprimer pairs were excluded from the study to avoidmulti copy amplification that may complicate the ana-lysis procedures downstream. A subset of 38 primerswas used to amplify ten individuals. Twelve of theseprimer pairs PCR amplified in 100% of the individuals.The remainders amplified inconsistently and were notused further (Additional file 2).
Allele frequencies distribution, heterozygosity,Hardy-Weinberg equilibrium and linkage disequilibriumConsiderable variation was observed among the 12 vali-dated microsatellite loci (Table 1 and Additional file 3).Exact tests for linkage disequilibrium identified signifi-cant association between locus G7B17 and GO2AH.Subsequently locus G7B17, which was less polymorphicthan GO2AH (Table 1) was excluded from downstreamanalysis. A summary of genetic diversity within the fiveregional populations was calculated for the remaining 11loci (Additional file 3). The number of alleles per locusranged from 3–13 (Table 1) and 78 alleles were scoredacross the 11 loci. Expected gene diversity (He) variedfrom 0.01–0.89 and in 96% of comparisons was higherthan the observed heterozygosity (Ho) with a range of0–0.88. The inbreeding coefficient (FIS) was significantlydifferent from zero in an average of eight loci per popu-lation. Estimates of FIS differed between populationssuch that NT and NSW had a higher frequency of locishowing significant inbreeding compared to the otherpopulations. Locus HBCQD was monomorphic in TL,PNG and QLD but polymorphic in NT and NSW. Globaltests by locus revealed departure from Hardy-Weinbergequilibrium for most loci among all the populations.While putative null alleles were identified at some loci insome populations using Microchecker, the null alleleswere not locus specific (Additional file 3) and a large pro-portion (73%) of data of repeated PCRs were congruentwith the initial results.
Population genetic structureStatistically significant genetic differentiation was dem-onstrated between the northern PNG population andthe other populations in three tests employed. Both theNei genetic distance and FST estimates indicated pres-ence of population structure among all three regions.Nei’s genetic distance varied from 0.03–0.31 while theFST estimates varied from 0.01–0.19 (Table 2). Permuta-tion tests in all cases indicated that genetic structurebetween paired regions was significant (P < 0.05). Pairedregion FST estimates indicated the highest levels of sub-division between PNG and Australia (FST = 0.12) andbetween PNG and Timor-Leste (FST = 0.095). In contrast,FST between Australia and Timor-Leste (0.03) was lower
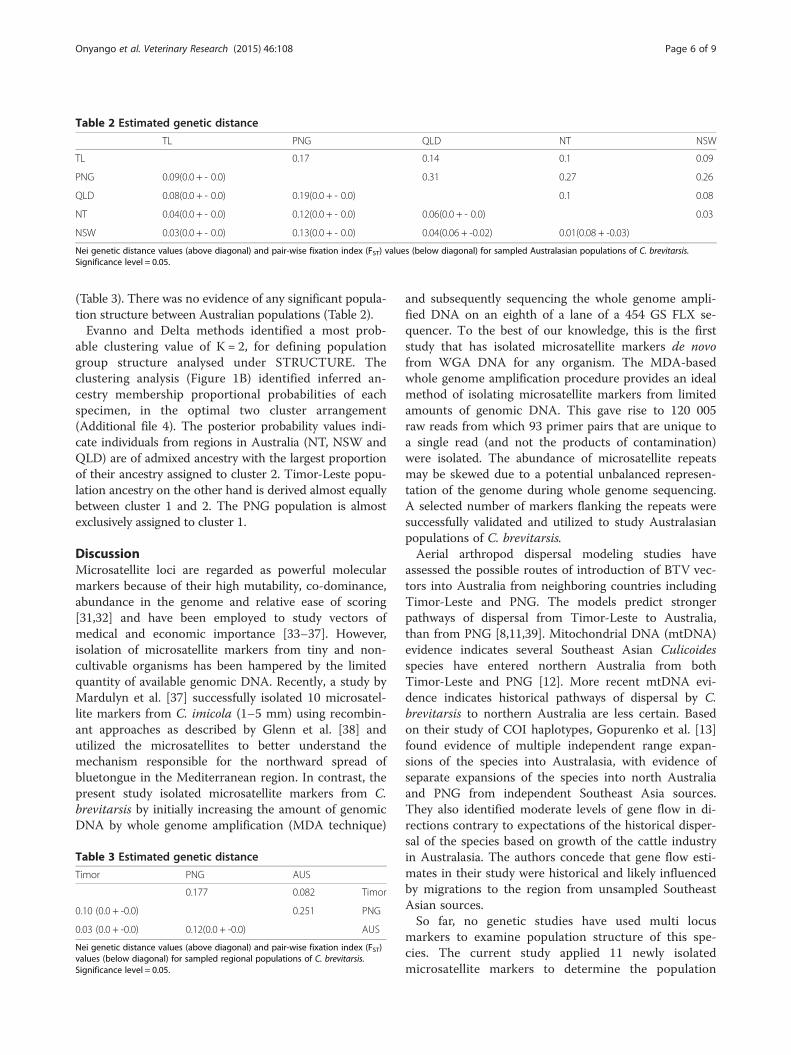
Table 2 Estimated genetic distance
TL PNG QLD NT NSW
TL 0.17 0.14 0.1 0.09
PNG 0.09(0.0 + - 0.0) 0.31 0.27 0.26
QLD 0.08(0.0 + - 0.0) 0.19(0.0 + - 0.0) 0.1 0.08
NT 0.04(0.0 + - 0.0) 0.12(0.0 + - 0.0) 0.06(0.0 + - 0.0) 0.03
NSW 0.03(0.0 + - 0.0) 0.13(0.0 + - 0.0) 0.04(0.06 + -0.02) 0.01(0.08 + -0.03)
Nei genetic distance values (above diagonal) and pair-wise fixation index (FST) values (below diagonal) for sampled Australasian populations of C. brevitarsis.Significance level = 0.05.
Onyango et al. Veterinary Research (2015) 46:108 Page 6 of 9
(Table 3). There was no evidence of any significant popula-tion structure between Australian populations (Table 2).Evanno and Delta methods identified a most prob-
able clustering value of K = 2, for defining populationgroup structure analysed under STRUCTURE. Theclustering analysis (Figure 1B) identified inferred an-cestry membership proportional probabilities of eachspecimen, in the optimal two cluster arrangement(Additional file 4). The posterior probability values indi-cate individuals from regions in Australia (NT, NSW andQLD) are of admixed ancestry with the largest proportionof their ancestry assigned to cluster 2. Timor-Leste popu-lation ancestry on the other hand is derived almost equallybetween cluster 1 and 2. The PNG population is almostexclusively assigned to cluster 1.
DiscussionMicrosatellite loci are regarded as powerful molecularmarkers because of their high mutability, co-dominance,abundance in the genome and relative ease of scoring[31,32] and have been employed to study vectors ofmedical and economic importance [33–37]. However,isolation of microsatellite markers from tiny and non-cultivable organisms has been hampered by the limitedquantity of available genomic DNA. Recently, a study byMardulyn et al. [37] successfully isolated 10 microsatel-lite markers from C. imicola (1–5 mm) using recombin-ant approaches as described by Glenn et al. [38] andutilized the microsatellites to better understand themechanism responsible for the northward spread ofbluetongue in the Mediterranean region. In contrast, thepresent study isolated microsatellite markers from C.brevitarsis by initially increasing the amount of genomicDNA by whole genome amplification (MDA technique)
Table 3 Estimated genetic distance
Timor PNG AUS
0.177 0.082 Timor
0.10 (0.0 + -0.0) 0.251 PNG
0.03 (0.0 + -0.0) 0.12(0.0 + -0.0) AUS
Nei genetic distance values (above diagonal) and pair-wise fixation index (FST)values (below diagonal) for sampled regional populations of C. brevitarsis.Significance level = 0.05.
and subsequently sequencing the whole genome ampli-fied DNA on an eighth of a lane of a 454 GS FLX se-quencer. To the best of our knowledge, this is the firststudy that has isolated microsatellite markers de novofrom WGA DNA for any organism. The MDA-basedwhole genome amplification procedure provides an idealmethod of isolating microsatellite markers from limitedamounts of genomic DNA. This gave rise to 120 005raw reads from which 93 primer pairs that are unique toa single read (and not the products of contamination)were isolated. The abundance of microsatellite repeatsmay be skewed due to a potential unbalanced represen-tation of the genome during whole genome sequencing.A selected number of markers flanking the repeats weresuccessfully validated and utilized to study Australasianpopulations of C. brevitarsis.Aerial arthropod dispersal modeling studies have
assessed the possible routes of introduction of BTV vec-tors into Australia from neighboring countries includingTimor-Leste and PNG. The models predict strongerpathways of dispersal from Timor-Leste to Australia,than from PNG [8,11,39]. Mitochondrial DNA (mtDNA)evidence indicates several Southeast Asian Culicoidesspecies have entered northern Australia from bothTimor-Leste and PNG [12]. More recent mtDNA evi-dence indicates historical pathways of dispersal by C.brevitarsis to northern Australia are less certain. Basedon their study of COI haplotypes, Gopurenko et al. [13]found evidence of multiple independent range expan-sions of the species into Australasia, with evidence ofseparate expansions of the species into north Australiaand PNG from independent Southeast Asia sources.They also identified moderate levels of gene flow in di-rections contrary to expectations of the historical disper-sal of the species based on growth of the cattle industryin Australasia. The authors concede that gene flow esti-mates in their study were historical and likely influencedby migrations to the region from unsampled SoutheastAsian sources.So far, no genetic studies have used multi locus
markers to examine population structure of this spe-cies. The current study applied 11 newly isolatedmicrosatellite markers to determine the population
Onyango et al. Veterinary Research (2015) 46:108 Page 7 of 9
genetic structure of C. brevitarsis in Timor-Leste,Australia and northern PNG.The results here indicate populations of C. brevitarsis
in Australia are more similar to those in Timor-Lestethan in northern PNG. This is particularly evident inSTRUCTURE analyses, which have assigned Australiaand Timor-Leste specimens to a population cluster sep-arate from a single PNG cluster. Pairwise FST tests indi-cate significant structure exist between Australia and itsnorthern neighbors, but the level of FST structure evi-denced between these two regions is less than that inpair-wise comparisons with PNG. The results demonstratethat C. brevitarsis in Australia was potentially introducedinto NT from Timor-Leste or from neighboring islands inIndonesia (less likely from PNG) consistent with previousspatial modeling studies that indicated the islands ofTimor and Sumba in the Indonesian Archipelago werethe likely principal sources of Culicoides dispersal intonorthern Australia [8,11,39]. The gene flow barriersbetween northern PNG and other Australasian popula-tions would mainly be geographic. High mountain ridgescharacterize PNG spatial geographical features with sharpnarrow crests separated by deeply incised V-shaped val-leys. The main geographical barrier to gene flow fromnorthern PNG to Australia would be the Central andOwen Stanley Range of PNG highlands that span a dis-tance of 200 km from the central cordillera and with analtitude of 4000 m above sea level [40]. The high peakswould result in a rough terrain that has been shown toact as an airflow barrier, which would slow dispersal ofCulicoides on land [41]. In contrast, the relatively lowplateau geography of Australia is likely to have givenrise to the genetically homogenous population acrossthe continent [10].Genetic sampling of C. brevitarsis from northeastern
Australia and southern PNG was not conducted in thisstudy and future genetic work is required to examinelevels of population connectivity between the two re-gions and to test the possibility of separate entry of BTVinfected midges into northeastern Australia from thesouthern PNG region. The movement of other species ofCulicoides from southern PNG into northern QLD hasbeen documented [12] so movement of C. brevitarsis ap-pears likely. Our starting working hypothesis was tohighlight the potential larger genetic difference betweenthe most distant NT and NSW regions and we placedmore emphasis in the sampling of these two regions ra-ther than the intermediate Queensland area. This haslead to a weaker significance of these last samples overthe rest of the individuals.Furthermore, both STRUCTURE analysis and conven-
tional FST estimates of population subdivision indicateC. brevitarsis populations are genetically panmictic inAustralia and display no evidence of genetic separation
or structure between northern and eastern sampled pop-ulations. This result suggests that the presence of thetwo BTV episystems in Australia (northern and eastern)as demonstrated by the distribution of BTV serotypes isnot as a result of genetic structuring of this vector and isdue to other factors for example, the presence of othervector species in northern Australia that are absent fromsoutheastern Australia.The 11 loci isolated and validated in this study were
polymorphic with number of alleles ranging from 3 to13. Departure from Hardy-Weinberg equilibrium result-ing from excessive homozygote presence in one or moresampled populations was evident at all 11 loci. Severe in-breeding can cause an excess of homozygotes across loci,however, this would involve substantial and or ongoingbottlenecking of populations down to few breedingadults [42]. Substantial population bottlenecks wouldhowever have greater and immediate effect on haploidgenetic markers such as maternally inherited mtDNA[43]. MtDNA evidence obtained by Gopurenko et al.[13] indicated moderate to high levels of mtDNA diver-sity among C. brevitarsis populations in the same re-gions examined in the present study and further theirmodeled estimates of effective maternal population sizein contemporary populations was in the order of hun-dreds of thousands of individuals. Alternatively, null al-lele presence, caused by mutations at locus specificprimer annealing sites which retard PCR amplificationefficiency of particular alleles, can result in excesses ofhomozygotes scored at loci and hence significant devi-ation from Hardy-Weinberg Equilibrium in populations[44]. Allelic dropout in PCR caused by a variety of in-hibitory causes can result in similar outcomes [45].To validate the levels of potential allelic and geno-
typic miss-scores caused by a variety of PCR processesincluding PCR dropout and primer redundancy, a totalof 86 DNA samples initially identified either as homo-zygous at one or more loci or had failed to amplify werere-amplified at one or more of the 11 markers using atouchdown PCR program. Three percent of samplesinitially identified as homozygous were scored as het-erozygotes in the repeat PCRs, 17% of samples thatfailed to amplify previously were successfully re-amplified, 7% of samples that had been amplified beforefailed to amplify during this re-amplification experi-ment and 73% were unchanged.The effects of null allele on test for HWE have been
reported earlier [46]. The effects of null allele on genetictest of population structure vary according to the sever-ity of the null allele presence and the type of test beingused. Carlsson [47] examined effects of null allele onpopulation structure estimated by FST and also popula-tion assignment testing (as employed in STRUCTURE)and they identified significant but small upwards biases

Onyango et al. Veterinary Research (2015) 46:108 Page 8 of 9
to FST (FST increased between 0.003 and 0.004) andslight reduction in the power of STRUCTURE to cor-rectly assign individuals to populations (0.2 and 1.0%units). With these caveats, we argue the likely slight up-ward biases to our pairwise estimates of FST as well assome effects on specimen cluster assignment usingSTRUCTURE, which would not drastically change theresults of our study.We have demonstrated that whole genome amplifica-
tion of the genomic DNA and subsequent whole genomesequencing resulted in a successful de novo isolation ofmicrosatellite markers from C. brevitarsis. These micro-satellite markers are likely to be very useful for genetic-ally typing population origins of C. brevitarsis detectedin the future. They can also be applied to carry out abroader analysis of gene flow in Australasian and South-east Asian populations of C. brevitarsis.
Additional files
Additional file 1: A summary file of the total number of primersdesigned to the flanking regions of the microsatellite repeats. Fromthe total primers isolated, 420 primers were either found to be similar toeach other or blasted to sequences from other organisms in the database,while 106 primers were unique and did not blast to anything in the NCBIdatabase. After blasting the 106 unique primers against the sequencedreads, 93 primer pairs were predicted to anneal to a single unique readwhile 13 primer pairs were predicted to anneal to more than one reador to more than one site on a single read. (XLS 36 kb)
Additional file 2: C. brevitarsis primer optimization. A subset of 38primers was used to amplify 10 individuals. Twelve of these primerpairs PCR amplified 100% of the individuals. The remainders amplifiedinconsistently and were not used further. (XLS 28 kb)
Additional file 3: Summary of allelic variation in 11 microsatelliteloci. Allelic variation among N = 141 [Timor-Leste (N = 24), Papua NewGuinea (N = 24), Queensland (N = 8), Northern Territory (N = 40) and NewSouth Wales (N = 45)] C. brevitarsis specimens sampled from regionalpopulations. Nallele- Null allele,
m - monomorphic locus, observed (Ho)and expected (He) heterozygosity, probability of deviation fromHardy-Weinberg Equilibrium (PHWE) and inbreeding co-efficient (FIS)as described. Significantly deviated FIS values (P < 0.05) highlightedin BOLD type. (XLS 38 kb)
Additional file 4: Probability values of population assignments forsamples K = 2. The population Q matrix derived from STRUCTUREclustering analysis show the inferred ancestry membership proportions ofeach individual, in each cluster. Each individual is represented by a singlevertical line, partitioned into K colored segments that represents thatindividual’s estimated membership fraction in each of the K inferredclusters. The X axis corresponds to the pre-defined populations (TL, PNG,QLD, NT and NSW) and the Y axis represents the proportional estimates ofthe estimated membership in clusters which add up to one. (TXT 11 kb)
Competing interestsThe authors declare that they have no competing interests.
Authors’ contributionsMGO designed, conducted the experiments, analyzed results and wrote thepaper. NWB participated in the microsatellite development and experimentaldesign. DG participated in the writing of the paper, provided extracted DNAfrom Timor and PNG and participated in the study design. GB did the sampling,specimen identification and participated in the study design. AN did thesampling, specimen identification and participated in the study design. MOparticipated in data analysis. AD and SK participated in the study design.
PJW involved in the study design, participated in the writing of the paper.JBD involved in the study design, experimental design and participated inthe writing of the paper. All authors read and approved the final manuscript.
AcknowledgementsM.G. Onyango was supported by a scholarship from the Australiangovernment. Laboratory works at AAHL have been partly performed thanksto the National Collaborative Research Infrastructure Strategy of Australia.The authors gratefully acknowledge David Boyle and Rhonda Voysey forinformative discussions. We would like to thank Peter Mee for providing uswith samples of C. brevitarsis from Queensland. Our gratitude also goes toJohnson Mak (CSIRO, AAHL) and George N. Michuki (International LivestockResearch Institute) for incisive suggestions and discussions. We acknowledgeCadhla Firth and Debbie Eagles (both CSIRO, AAHL) for the critical review ofthe manuscript. We thank PNG NAQIA, Timor Leste MAF and the AustralianNational Arbovirus Monitoring Program for access to specimens and permissionto publish data from their respective countries.
Author details1CSIRO Health & Biosecurity Australian Animal Health Laboratory, 5Portalington Road, Geelong, Victoria 3220, Australia. 2School of Medicine,Deakin University, 75 Pidgons Road, Waurn Ponds, Victoria 3216, Australia.3School of Biological Sciences, The University of Queensland, St Lucia,Queensland 4072, Australia. 4CSIRO Health & Biosecurity Ecosciences Precinct,41, Boggo Road, Dutton Park, Queensland 4102, Australia. 5NSW Departmentof Primary Industries, Wagga Wagga Agricultural Institute, PMB, WaggaWagga, New South Wales 2650, Australia. 6Graham Centre for AgriculturalInnovation, Locked Bag 588, Wagga Wagga, New South Wales 2678,Australia. 7Northern Australia Quarantine Strategy, 1 Pederson Road, Marrara,Northern Territory 0812, Australia. 8International Livestock Research Institute,P.O. Box 3070900100 Nairobi, Kenya. 9Biosciences eastern and central Africa –ILRI Hub (BecA-ILRI Hub), ILRI, PO Box 3070900100 Nairobi, Kenya.
Received: 3 June 2015 Accepted: 24 August 2015
References1. George S (1989) An overview of arboviruses affecting domestic animals in
Australia. Aust Vet J 66:393–3952. Mellor PS, Boorman J, Baylis M (2000) Culicoides biting midges: their role as
arbovirus vectors. Annu Rev Entomol 45:307–3403. Bellis GA, Dyce AL (2005) Intraspecific variation in three species of
Culicoides in the Orientalis complex of the subgenus Avaritia withinAustraliasian zoogeographic region. In Arbovirus research in Australia:papers from 9th Arbovirus Research in Australia Symposium, 6th Mosquitocontrol Association of Australia Symposium, 22-27 August 2004, AustralisNoosa Lakes Resort, Australia eds PA Ryan, JG Askov, TD St George, PERDale, The Queensland Institute of Medical Research, Brisbane, Australia 9:33-36
4. Standfast HA, Dyce AL, Muller MJ (1985) Vectors of bluetongue virus inAustralia. Prog Clin Biol Res 178:177–186
5. Muller MJ (1995) Veterinary arbovirus vectors in Australia - a retrospective.Vet Microbiol 46:101–116
6. Ward MP (1996) Seasonality of infection of cattle with bluetongue viruses.Prev Vet Med 26:133–141
7. Dyce AL (1982) Distribution of Culicoides (Avaritia) species (Diptera:Ceratopogonidae) west of the Pacific ocean. In: St. George TD, Kay BH (eds)Arbovirus research in Australia: proceedings 3rd symposium, 15-17 February1982. CSIRO and QIMR, Brisbane, pp 35–43
8. Eagles D, Melville L, Weir R, Davis S, Bellis G, Zalucki MP, Walker PJ, Durr PA(2014) Long-distance aerial dispersal modelling of Culicoides biting midges:case studies of incursions into Australia. BMC Vet Res 10:135
9. Boyle DB, Bulach DM, Amos-Ritchie R, Adams MM, Walker PJ, Weir R (2012)Genomic sequences of Australian bluetongue virus prototype serotypesreveal global relationships and possible routes of entry into Australia. J Virol86:6724–6731
10. St George TD, Baldock C, Bellis G, Bishop A, Cameron A, Doherty B, Ellis T,Gard G, Johnson S, Kirkland P, Melville L, Muller M, Postle T, Roe D (1999)The history of Bluetongue, Akabane and ephemeral fever viruses and theirvectors in Australia, National Arbovirus Monitoring (NAMP) Report

Onyango et al. Veterinary Research (2015) 46:108 Page 9 of 9
11. Eagles D, Deveson T, Walker PJ, Zalucki MP, Durr P (2012) Evaluation oflong-distance dispersal of Culicoides midges into northern Australia using amigration model. Med Vet Entomol 26:334–340
12. Bellis GA, Gopurenko D, Cookson B, Postle AC, Halling L, Harris N, Yanase T,Mitchell A (2015) Identification of incursions of Culicoides Latreille species(Diptera: Ceratopogonidae) in Australasia using morphological techniquesand DNA barcoding. Austral Entomol 54:332-338
13. Gopurenko D, Bellis G, Mitchell A (2011) Integrative taxonomic assessment andDNA barcoding of economically important biting midges (Ceratopogonidae:Culicoides) present in Australasia. In: Fourth International Barcode of LifeConference Adelaide Australia 2011., http://www.dnabarcodes2011.org
14. Avise JC (1991) Ten unorthodox perspectives genetic findings on evolutionprompted by comparative population genetic findings on mitochondrialDNA. Annu Rev Genet 25:46–69
15. Roderick GK (1996) Geographic structure of insect populations: gene flow,phylogeography, and their uses. Annu Rev Entomol 41:325–352
16. Bellis GA, Dyce AL, Gopurenko D, Mitchell A (2013) Revision of theImmaculatus Group of Culicoides Latreille (Diptera: Ceratopogonidae) fromthe Australasian Region with description of two new species. Zootaxa3680:15–37
17. Bellis GA, Dyce AL, Gopurenko D, Yanase T, Garros C, Labuschagne K,Mitchell A (2014) Revision of the Culicoides (Avaritia) Imicola complexKhamala & Kettle (Diptera: Ceratopogonidae) from the Australasian region.Zootaxa 3768:401–427
18. Staley M, Dorman KS, Bartholomay LC, Farfan-Ale JA, Loroño-pino MA, JulianE, Ibarra-juarez L, Blitvich BJ (2010) Sequence analysis of Actin-1 fromdiverse mosquito species. J Am Mosq Control Assoc 26:214–218
19. Faircloth BC (2008) Msatcommander: detection of microsatellite repeatarrays and automated, locus-specific primer design. Mol Ecol Resour 8:92–94
20. Koressaar T, Remm M (2007) Enhancements and modifications of primerdesign program Primer3. Bioinformatics 23:1289–1291
21. Rousset F (2007) genepop’007: a complete re-implementation of thegenepop software for Windows and Linux. Mol Ecol Resour 8:103–106
22. Van Oosterhout C, Hutchinson WF, Wills DPM, Shipley P (2004) Micro-Checker: software for identifying and correcting genotyping errors inmicrosatellite data. Mol Ecol Notes 4:535–538
23. Excoffier L, Laval G, Schneider S (2007) Arlequin (version 3.0): an integratedsoftware package for population genetics data analysis. Evol BionformOnline 1:47–50
24. Nei M (1978) Estimation of average heterozygosity and genetic distancefrom a small number of individuals. Genetics 89:583–590
25. Weir BS, Cockerham CC (1984) Estimating F-statistics for the analysis ofpopulation structure. Evolution 38:1358–1370
26. Peakall R, Smouse PE (2012) GenAlEx 6.5: genetic analysis in Excel.Population genetic software for teaching and research–an update.Bioinformatics 28:2537–2539
27. Pritchard JK, Stephens M, Donnelly P (2000) Inference of populationstructure using multilocus genotype data. Genetics 155:945–959
28. Evanno G, Regnaut S, Goudet J (2005) Detecting the number of clusters ofindividuals using the software STRUCTURE: a simulation study. Mol Ecol14:2611–2620
29. Kopelman NM, Mayzel J, Jakobsson M, Rosenberg NA, Mayrose I (2015)Clumpak : a program for identifying clustering modes and packagingpopulation structure inferences across K. Mol Ecol Resour 15:1179–1191
30. Nayduch D, Cohnstaedt LW, Saski C, Lawson D, Kersey P, Fife M, Carpenter S(2014) Studying Culicoides vectors of BTV in the post-genomic era:resources, bottlenecks to progress and future directions. Virus Res 182:43–49
31. Lagoda PJL (1996) Microsatellites, from molecules to populations and back.Trends Ecol Evol 11:424–429
32. Tóth G, Gáspári Z, Jurka J (2000) Microsatellites in different eukaryoticgenomes: survey and analysis. Genome Res 10:967–981
33. Lehmann T, Hawley WA, Grebert H, Collins FH (1998) The effectivepopulation size of Anopheles gambiae in Kenya : implications forpopulation structure. Mol Biol Evol 15:264–276
34. Lehmann T, Hawley WA, Kamau L, Fontenille D, Simard F, Collins FH (1996)Genetic differentiation of Anopheles gambiae populations from East andWest Africa : comparison of microsatellite and allozyme loci. Heredity(Edinb) 77:192–200
35. Oliveira R, Broude N, Macedo A, Cantor C, Smith C, Pena D (1998) Probingthe genetic population structure of Trypanosoma cruzi with polymorphicmicrosatellites. Proc Natl Acad Sci U S A 95:3776–3780
36. Ravel S, Monteny N, Olmos DV, Verdugo JE, Cuny G (2001) A preliminarystudy of the population genetics of Aedes aegypti (Diptera: Culicidae) fromMexico using microsatellite and AFLP markers. Acta Trop 78:241–250
37. Mardulyn P, Goffredo M, Conte A, Hendrickx G, Meiswinkel R, Balenghien T,Sghaier S, Lohr Y, Gilbert M (2013) Climate change and the spread ofvector-borne diseases: using approximate Bayesian computation tocompare invasion scenarios for the bluetongue virus vector Culicoidesimicola in Italy. Mol Ecol 22:2456–2466
38. Glenn TC, Schable N (2005) Isolating microsatellite DNA loci. MethodsEnzymol 395:202–222
39. Eagles D, Walker PJ, Zalucki MP, Durr PA (2013) Modelling spatio-temporalpatterns of long-distance Culicoides dispersal into northern Australia. PrevVet Med 110:312–322
40. Loffier E (1982) Landforms and landform development. In Biogeogr EcolNew Guinea. Edited by JL. Gressitt, Dr W. Junk Publishers The Hague pp 57-72.
41. Hendrickx G, Gilbert M, Staubach C, Elbers A, Mintiens K, Gerbier G,Ducheyne E (2008) A wind density model to quantify the airborne spreadof Culicoides species during north-western Europe bluetongue epidemic.Prev Vet Med 87:162–181
42. Nei M, Maruyama T, Chakraborty R (1975) The bottleneck effect and geneticvariability in populations. Evolution 29:1–10
43. Wilson AC, Cann RL, Carr SM, George M, Gyllensten UB, Helm-BychowskiKM, Higuchi RG, Palumbi SR, Prager EM, Sage RD, Stoneking M (1985)Mitochondrial DNA and two perspectives on evolutionary genetics. BiolJ Linn Soc 26:375–400
44. Kelly AC, Mateus-Pinilla NE, Douglas M, Douglas M, Shelton P,Novakofski J (2011) Microsatellites behaving badly: empirical evaluationof genotyping errors and subsequent impacts on population studies.Genet Mol Res 10:2534–2553
45. Séré M, Kaboré J, Jamonneau V, Belem AM, Ayala FJ, De Meeûs T (2014) Nullallele, allelic dropouts or rare sex detection in clonal organisms: simulationsand application to real data sets of pathogenic microbes. Parasit Vectors 7:331
46. Nascimento de Sousa S, Finkeldey R, Gailing O (2005) Experimentalverification of microsatellite null alleles in Norway spruce (Picea abies [L.]Karst.): implications for population genetic studies. Plant Mol Biol Report23:113–119
47. Carlsson J (2008) Effects of microsatellite null alleles on assignment testing.J Hered 99:616–623
Submit your next manuscript to BioMed Centraland take full advantage of:
• Convenient online submission
• Thorough peer review
• No space constraints or color figure charges
• Immediate publication on acceptance
• Inclusion in PubMed, CAS, Scopus and Google Scholar
• Research which is freely available for redistribution
Submit your manuscript at www.biomedcentral.com/submit