Embed Size (px)
Citation preview

INTERNATIONAL JOURNAL OF ENVIRONMENTAL SCIENCES Volume 2, No 1, 2011
© Copyright 2010 All rights reserved Integrated Publishing Association
Research article ISSN 0976 – 4402
Received on July 2011 Published on September 2011 337
Assessment of Physico-Chemical properties and sewage pollution indicator
bacteria in surface water of River Gomti in Uttar Pradesh Srivastava Anukool, Srivastava Shivani
National Botanical Research Institute (NBRI) Lucknow
Industrial Toxicology Research Institute (IITR) Lucknow*
doi:10.6088/ijes.00202010034
ABSTRACT
This study was aimed to estimate current status of Physico-chemical chararacterstics and
level of sewage pollution indicator bacteria and their variation at whole stretch of river Gomti.
The sampling covered from upstream to downstream regions of the river representing pre
monsoon (Jan-April), monsoon (May-Aug), and post monsoon (Sept-Dec) in two years i.e.
2008 and 2009. Eight water samples are subjected to Physico-chemical analysis like Water
temperature, Total Solids, Total Dissolved Solids, Total Suspended Solid, Conductivity, pH,
COD, BOD and DO. The bacteriological study of these samples included bacteriological
parameters like Total Coli (TC), Faecal Coli (FC) and Faecal Streptocoli (FS) has given the
information regarding the suitability of the water for various uses like drinking and other
domestic applications. The results are based on Spatial Variation, Seasonal Variation and
Temporal Variation. Conclusions revealed that large number of drains in Lucknow city and
industrial discharge is mainly responsible for pollution in river Gomti.
Keywords: Physico-chemical parameters, Sewage pollution indicator bacteria, River Gomti
1. Introduction
Fresh water is essential for agriculture, industry and human existence; it is a finite resource of
earth. Without adequate quantity and quality of fresh water sustainable development will not
be possible (N.Kumar, 1997, Mahananda et al., 2005). Fresh water resource are becoming
deteriorate day-by-day at the very faster rate. Now water quality is a global problem
(Mahananda et al., 2005). The healthy aquatic ecosystem is depended on the biological
diversity and Physico-chemical characteristics (Venkatesharaju et al., 2010). Microorganisms
are widely distributed in nature and diversity of microorganisms may be used as an indicator
for organic pollution (Okpokwasili and Akujobi, 1996). Bacteriological quality of drinking
water usually shows concentration of particular species of bacteria and their occurrence
(Sandy and Richard 1995). High levels of fecal-indicator bacteria can be indicated by
presence of pathogenic microorganisms present in water body. Higher the level of indicator
bacteria is directly propositional to faecal contamination and greater the risk of water-borne
diseases (Pipes, 1981). Cryptosporidiosis, typhoid fever, Cholera, dysentery, hepatitis are
some of the common waterborne diseases that spread through contaminated water. Human
faecal material is generally caused greater risk to human health because it contains human
enteric pathogens (Scott et al., 2003). Contaminated water can cause eye, ear, nose, and throat
infections also. Faecal coli and Faecal streptococci are most widely used indicator bacteria
(Kistemann et al., 2002; Pathak and Gopal, 2001; Harwood et al., 2001; Vaidya et al., 2001).
Bacteria concentration in a sample of water means the number of bacteria colonies present in
per 100 milliliters (col/100mL) of water sample. Discharge of organic wastes human excreta,
sewage waste, polythenes, municipal garbage and toxic discharge from the factories

Assessment of Physico-Chemical properties and sewage pollution indicator bacteria in surface water of River
Gomti in Uttar Pradesh
Srivastava Anukool, Srivastava Shivani
International Journal of Environmental Sciences Volume 2 No.1, 2011 338
increasing bacterial pollution in the river Gomti. This waste flow into the storm drains,
mixing with common water and subsequently posing a serious threat to the water ecology,
animals and human; spatially in Lucknow and Barabanki district. Faecal polluted water may
cause health hazard for bathers due to the presence of several microbial pathogens, including
bacteria, viruses, fungi and protozoa (Mohamed et al, 2008). The present investigation
reveals the Physico-chemical and bacteriological characteristics and their spatial, seasonal
and yearly variations in the river water during the year 2008 and 2009. The aim of the study
is to revealed out the pollution status of whole stretch of river Gomti in terms of Physico-
chemical and bacteriological characteristics in Uttar Pradesh.
2 Materials and Method
2.1 Study Area
River Gomti flows through a vast stretch with numerous small and big tributaries and forms a
great river before joining the river Ganga at Udyar Ghat near Jaunpur district. The water is
mainly used for drinking purpose. Irrigation is also an important aspect of this river water.
Eight water samples from eight different locations were selected from upstream to
downstream and analyzed to access the bacteriological pollution in river Gomti, during three
seasons and two years. The sampling location description of river Gomti is given below:
River
Course
Location Description
Gomti Neemsar Sampling location is near the Devi Lalita’s temple. Water at
is good in quality and clean in nature. It is used for fishing,
irrigation and bathing. Fish population is very good.
Gomti Bhatpur Water is clear. Main activity observed at this site is fishing.
Gomti Gaughat Sampling point is near the pumping station. From here water is
pumped to Jal Sansthan for water supply in whole city.
Gomti Mohan
Meakin
Sampling point is between the Lal pul and Shahid Smarak.
Water is dirty and black in color. It is not suitable for any
purpose.
Gomti Piperaghat This sampling location is near the Piperaghat bridge. Water at
is black in color, smelled bad, and very dirty in nature. It is not
suitable for any purpose.
Gomti Barabanki This sampling location is near the Gangaganj area. Water is
not good in quality. This is the second most polluted site of
river Gomti.
Gomti Sultanpur This sampling location is less polluted than Barabanki and
Lucknow.
Gomti Jaunpur Sampling site is near the shahi pul. Water is not so polluted.
Sampling Sampling was carried out in two different years i.e. 2008 and 2009 in three different seasons
i.e. pre monsoon (Jan-April), monsoon (May-Aug), and post monsoon (Sept-Dec) to the mid
flow of river Gomti at different locations selected from upstream to downstream i.e. Neemsar,
Bhatpur, Gaughat, Mohan Meakin, Piperaghat, Barabanki, Sultanpur and Jaunpur. Triplicate
Samples of surface water were collected in sterile glass bottles and immediately transported
to the laboratory in an ice bucket at 4oC for analysis.

Assessment of Physico-Chemical properties and sewage pollution indicator bacteria in surface water of River
Gomti in Uttar Pradesh
Srivastava Anukool, Srivastava Shivani
International Journal of Environmental Sciences Volume 2 No.1, 2011 339
Physico-chemical analysis: The temperatures of the samples were noted at the sampling
point itself. The samples were put to examination in the laboratory of Indian Institute of
Toxicological Research (IITR) to determine some physico-chemical parameters. Analysis
was carried out for various water quality parameters such as Temperature of Water, Total
solids (TS), Total Dissolved solids (TDS), Total Suspended Solids (TSS), pH, Conductivity,
Chemical Oxygen Demand (COD), Biological Oxygen Demand (BOD), and Dissolved
Oxygen (DO) using standard method. The reagents used for the analysis were AR grade and
double distilled water was used for preparation of solutions.
Bacteriological analysis: The bacteria indicators of sewage pollution i.e. Total Coli (TC),
Faecal Coli (FC), and Faecal Streptocoli (FS) were analyzed together and the ratio of FC/FS
were also calculated. Analysis of these indicator bacteria were enumerated using the Multiple
Test Tube Method (APHA 20th
edition). The analysis was carried out in the laboratory of
Indian Institute of Toxicology Research (IITR), Lucknow.
Statistical analysis: A two tailed (α=2) probability p<0.05 was considered to be statistically
significant. All statistical analyses were preformed on STATISTICA (version 6.0).
2.2 Results and Discussion
The Spatial, Seasonal and Temporal averages of physico-chemical and bacteriological
characteristics are given in Table 1, 2, 3, 4, 5, 6 and Correlation Coefficient between various
physico-chemical parameters and bacteriological parameters are showed in Table 7.
Temperature: The fluctuation in river water temperature usually depends on the season,
geographic location, sampling time and temperature of effluent entering the stream
(Ahipathy, 2006). Temperature of river water ranged from a minimum of 19.77 ± 0.98oC
to
32.59 ± 0.61oC at different locations (Table 1) and in different seasons (Table 2). Spatial
variations showed near about same trend of Temperature at all sampling locations (Table 1).
High Seasonal variations were observed at all the sites (Table 2). Temporal variations
indicates increasing trend at all the sites (Table 3). Temperature showed significant positive
correlation with pH and Dissolved Oxygen and significant negative correlation with Total
Solids, Dissolved Solids, Suspended Solids, Chemical Oxygen Demand, Biological Oxygen
Demand, Total Coliform (TC), Faecal Coliform (FC) and Faecal Streptocoli (FS) (Table 7).
Total Solids (TS): During the study average of Total Solids were found to be higher at
Barabanki site and lower at Sultanpur site (Table1). Seasonal variations revealed significantly
higher values in post monsoon season and lower in pre monsoon season (Table 2). Yearly
averages of shows comparatively decreasing trend of Total Solids in the next year (Table.3).
Correlation analysis shows positive correlation of Total Solids with Total Dissolved Solids,
conductivity, COD, BOD, Total coli, Faecal Coli and Faecal Strepto coli and had negative
correlation with Suspended Solids, pH and Dissolved Oxygen (Table 7).
Total Dissolved Solids (TDS): Spatial variations shows comparatively increasing level of
Dissolved Solids at Barabanki Site in comparison to other sites. In water, total dissolved
solids are composed mainly of carbonates, bicarbonates, chlorides, phosphates and nitrates of
calcium, magnesium, sodium, potassium and manganese, organic matter, salt and other
particles (Mahananda et al., 2010). Seasonal variations revealed slightly higher values in Post
monsoon season in contrast to other two seasons it may be due to accumulation of carbonates

Assessment of Physico-Chemical properties and sewage pollution indicator bacteria in surface water of River
Gomti in Uttar Pradesh
Srivastava Anukool, Srivastava Shivani
International Journal of Environmental Sciences Volume 2 No.1, 2011 340
and bicarbonates after heavy rainfall. Yearly averages shows comparatively decreasing trend
of Dissolved Solids in next year. Correlation analysis shows significant positive correlation
of pH with all the parameters except Suspended Solids and Dissolved Oxygen.
Total suspended solids (TSS): During the study Spatial Variation analysis shows higher
values of Suspended Solids at Lucknow i.e. Gaughat, Mohan Meakin, Piperaghat (Table 1) it
might be due to presence of high organic matter and lowest values were found to be at
Control site i.e. Neemsar and Bhatpur. The total suspended solids are composed of
carbonates, bicarbonates, chlorides, phosphates and nitrates of calcium, magnesium, sodium,
potassium, manganese, organic matter, salt and other particles. Seasonal analysis revealed
higher values of Suspended Solids in Post monsoon. It might be due to run off from many
bathing Ghats, drain water discharge and garbage dump sites (Table 2). Its lower values were
found to be in pre monsoon. Yearly averages shows increasing trend of Suspended Solids
(Table 3). Correlation analysis shows its positive correlation with pH and Dissolved Oxygen
(Table 7)
Ph: Present investigation reveals that there was no great difference found in pH values in
Spatial (Table 1), Seasonal (Table 2) and Temporal analysis (Table 3) which indicates the
alkaline nature of river water, may be due to high temperature which causes reduction in
solubility of CO2 (Mahananda et al., 2010). Correlation analysis reveals significant positive
correlation with Dissolved Oxygen, Suspended Solids, Water temperature and negative
correlation with Conductivity, COD, BOD, Total Coli, Faecal Coli and Faecal Streptocoli
(Table 7).
Conductivity: Increasing levels of conductivity and cations are the products of
decomposition and mineralization of organic materials (Abida, 2008). In the present study
Barabanki site showed higher value of Conductivity in contrast to other sites due to higher
discharge of industrial effluent to the river (Table 1). Seasonal variations showed higher
value in pre-monsoon and lower value in monsoon due to dilution with rain water. Yearly
averages showed decreasing level of Conductivity was found in the next year at all sites.
Conductivity showed significant positive correlation with all the parameters except Dissolved
Oxygen, Total Dissolved Solids and Total Solids (Table 7).
Chemical Oxygen Demand (COD): The measure of COD determines the quantity of
organic matter found in water. This makes COD useful as an indicator of organic pollution in
surface water (King et al., 2003 and Faith, 2006). Spatial Variations shows comparatively
higher values at Barabanki and Lucknow (Gaughat, Mohan Meakin, and Piperaghat) in
contrast to other sites (Table 1). Seasonal averages of COD values disclose marginal
variations in all the three seasons (Table 2). Slight decreasing trend was observed in yearly
averages (Table 3). Correlation analysis showed positive correlation with BOD, DO,
Conductivity, Total Dissolved Solids Total Solids, Total Coli, Faecal Coli while Faecal
Streptocoli and negative correlation with Conductivity, Total Dissolved Solids and Total
Solids (Table 7).
Biological Oxygen Demand (BOD): Biological oxygen demand increases due to
biodegradation of organic materials which exerts oxygen tension in a water body (Abida,
2008). Sources of BOD include leaves; dead plants and animals; effluents from various
industries specially pulp and paper mills, Wastewater treatment plants and food-processing
plants; failing septic systems; and wastewater runoff (USEPA 1997). Spatial analysis reveals
that BOD value was found to be more at Lucknow (that is Gaughat, Mohan Meakin (MM)

Assessment of Physico-Chemical properties and sewage pollution indicator bacteria in surface water of River
Gomti in Uttar Pradesh
Srivastava Anukool, Srivastava Shivani
International Journal of Environmental Sciences Volume 2 No.1, 2011 341
and Piperaghat) and Barabanki because of direct merging of sewage waste, drain water
discharge and industrial effluent at sampling sites while BOD was found within range at
Control site that is Neemsar and Bhatpur (Table 1). Seasonal and Temporal analysis shows
marginal variations in all the three seasons (Table 2) and both of years (Table 3). Correlation
analysis of BOD exhibit significant positive correlation with pH. Suspended Solids and water
temperature and had negative correlation with, COD, Conductivity, Total solids, Total
Dissolved Solids (Table 7).
Dissolved Oxygen (DO): The average value of DO levels (6.5mg/l) indicates the average
quality of river water (APHA 2005). During the study DO values were found maximum at
Control Site (Neemsar + Bhatpur) which might be due to good productivity of aquatic plants
and algae at the river bank and minimum at Barabanki site due to higher level of organic
pollution (Table1). Seasonal Variations showed near about similar trend. No variation was
found in yearly averages at all sites (Table3.). DO showed significant positive correlation
with pH, Suspended Solids, Water Temperature and negative correlation with Conductivity,
COD, BOD, Total Solids, Total Dissolved Solids, Total Coli (TC), Faecal Coli (FC) and
Faecal Streptocoli (FS) (Table 7).
Bacteriological Parameters: The Bacteriological characteristics of river Gomti is
summarized in Table 4, 5, 6 and Fig.1, 2, 3. Table 4 showed that the mean level of Total Coli
(TC) at Lucknow side (Gaughat + Mohan Meakin + Piperaghat) were found to be very high
than the other sides. Continuously increase in population of Lucknow is mainly responsible
for increased level of pollution. More than 95% of drain water often added during flushing to
carry down a drain, pathogen, and organic matters like faeces, food, vomit, waste paper, dead
plant, and humus. Most of them are discharging their waste in to river directly. Rather than,
poor people living near the river, discard their shit at river bank throughout the Lucknow. On
comparing, the mean level of Total Coli (TC), Faecal Coli (FC), Faecal Streptocoli (FS) at
Control side (Neemsar + Bhatpur) were found to be significantly (p<0.05 or p<0.01) different
and lower than the respective level at Barabanki, Sultanpur and Jaunpur (Table 4). The
association of bacteriological parameters in three different seasons i.e. pre monsoon,
monsoon and post monsoon of both of the years i.e. 2008 and 2009 were summarized in
Table 5 and Fig 2. Table 5 showed that except Total Coli (TC), Faecal Coli (FC), Faecal
Streptocoli (FS) and FC/FS were found to be higher in Monsoon season than the respective
level found in Pre monsoon and Post monsoon. Higher bacterial population during monsoon
due to increased land run off and higher faecal inputs in to river from various sources. An
increase in the Faecal Coliform level after rainfall was also reported by Shehane et al., 2005.
Table 6 and Fig 3, showed the association of all bacteriological parameters in both of the
years i.e. 2008 and 2009. A little bit variation in all bacteriological parameters were found in
both of the years. To see the results, it is clear that at all the sampling locations, in all the
seasons and in both of the years, Total Coli, Faecal coli and Faecal Streptocoli of river water
were beyond the permissible limit and was not suitable for drinking purpose without
pretreatment.
Assessment of Physico-Chemical properties and sewage pollution indicator bacteria in surface water of River
Gomti in Uttar Pradesh
Srivastava Anukool, Srivastava Shivani
International Journal of Environmental Sciences Volume 2 No.1, 2011 342
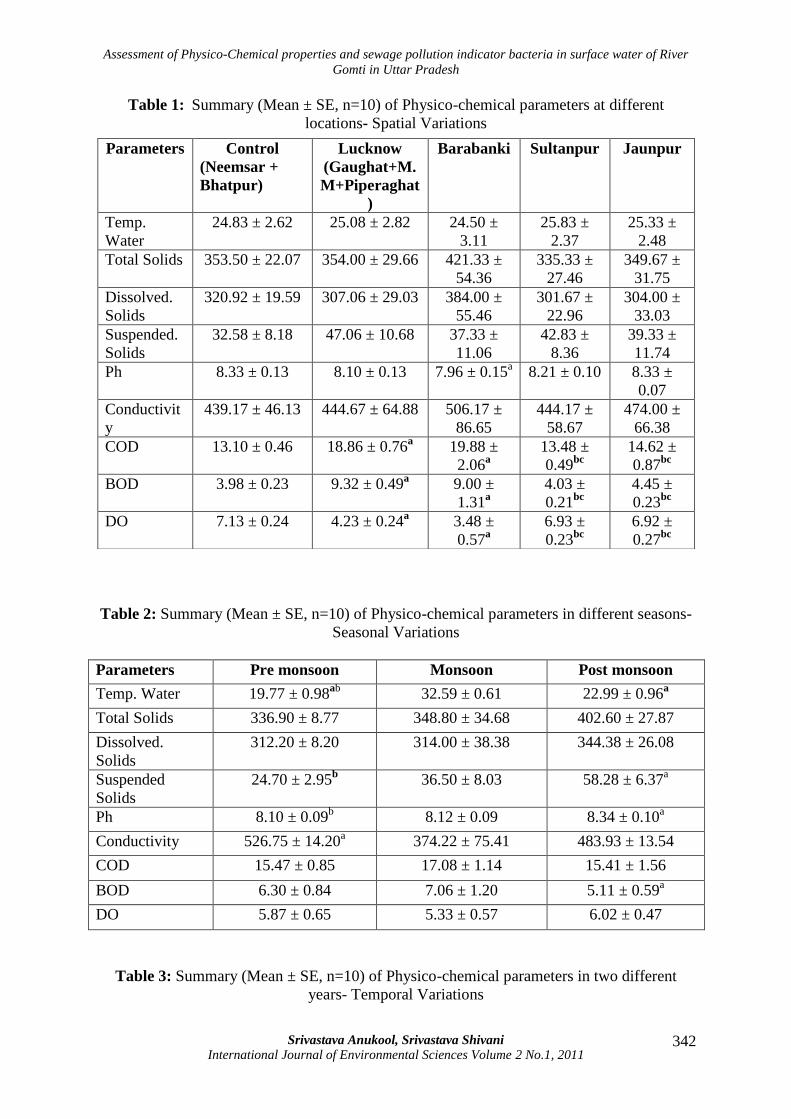
Table 1: Summary (Mean ± SE, n=10) of Physico-chemical parameters at different
locations- Spatial Variations
Table 2: Summary (Mean ± SE, n=10) of Physico-chemical parameters in different seasons-
Seasonal Variations
Parameters Pre monsoon Monsoon Post monsoon
Temp. Water 19.77 ± 0.98ab
32.59 ± 0.61 22.99 ± 0.96a
Total Solids 336.90 ± 8.77 348.80 ± 34.68 402.60 ± 27.87
Dissolved.
Solids
312.20 ± 8.20 314.00 ± 38.38 344.38 ± 26.08
Suspended
Solids
24.70 ± 2.95b 36.50 ± 8.03 58.28 ± 6.37
a
Ph 8.10 ± 0.09b 8.12 ± 0.09 8.34 ± 0.10
a
Conductivity 526.75 ± 14.20a 374.22 ± 75.41 483.93 ± 13.54
COD 15.47 ± 0.85 17.08 ± 1.14 15.41 ± 1.56
BOD 6.30 ± 0.84 7.06 ± 1.20 5.11 ± 0.59a
DO 5.87 ± 0.65 5.33 ± 0.57 6.02 ± 0.47
Table 3: Summary (Mean ± SE, n=10) of Physico-chemical parameters in two different
years- Temporal Variations
Parameters Control
(Neemsar +
Bhatpur)
Lucknow
(Gaughat+M.
M+Piperaghat
)
Barabanki Sultanpur Jaunpur
Temp.
Water
24.83 ± 2.62 25.08 ± 2.82 24.50 ±
3.11
25.83 ±
2.37
25.33 ±
2.48
Total Solids 353.50 ± 22.07 354.00 ± 29.66 421.33 ±
54.36
335.33 ±
27.46
349.67 ±
31.75
Dissolved.
Solids
320.92 ± 19.59 307.06 ± 29.03 384.00 ±
55.46
301.67 ±
22.96
304.00 ±
33.03
Suspended.
Solids
32.58 ± 8.18 47.06 ± 10.68 37.33 ±
11.06
42.83 ±
8.36
39.33 ±
11.74
Ph
8.33 ± 0.13 8.10 ± 0.13 7.96 ± 0.15a 8.21 ± 0.10 8.33 ±
0.07
Conductivit
y
439.17 ± 46.13 444.67 ± 64.88 506.17 ±
86.65
444.17 ±
58.67
474.00 ±
66.38
COD 13.10 ± 0.46 18.86 ± 0.76a 19.88 ±
2.06a
13.48 ±
0.49bc
14.62 ±
0.87bc
BOD 3.98 ± 0.23 9.32 ± 0.49a 9.00 ±
1.31a
4.03 ±
0.21bc
4.45 ±
0.23bc
DO 7.13 ± 0.24 4.23 ± 0.24a 3.48 ±
0.57a
6.93 ±
0.23bc
6.92 ±
0.27bc

Assessment of Physico-Chemical properties and sewage pollution indicator bacteria in surface water of River
Gomti in Uttar Pradesh
Srivastava Anukool, Srivastava Shivani
International Journal of Environmental Sciences Volume 2 No.1, 2011 343
Parameters 2008 2009
Temp. Water 23.98 ± 1.98 26.26 ± 1.05*
Total Solids 407.36 ± 22.41 318.18 ± 14.55**
Dissolved Solids 374.36 ± 20.54 272.70 ± 13.86**
Suspended Solids 34.87 ± 5.69 44.79 ± 6.37ns
Ph 8.34 ± 0.07 8.03 ± 0.07**
Conductivity 534.82 ± 19.09 388.44 ± 45.41*
COD 17.29 ± 1.10 14.68 ± 0.73**
BOD 6.16 ± 0.74 6.15 ± 0.79ns
DO 5.86 ± 0.50 5.61 ± 0.42ns
Table 4: Summary (Mean ± SE, n=15) of bacteriological parameters in different locations-
spatial Variations
Parameters Control
(Neemsar
+Bhatpur)
Lucknow
(Gaughat
+Mohan
Meakin +
Piperaghat)
Barabanki Sultanpur Jaunpur
Total Coli
(MPN/100ml)
416.67 ±
24.72
1916838.89 ±
361049.04a
25833.33
±
1492.57b
1550.00
±
67.08b
1350.00
±
22.36b
Faecal Coli (FC)
(MPN/100ml)
416.67 ±
24.72
2216838.89 ±
185342.23a
688000.00
±
662401.64b
1550.00
±
67.08b
1350.00
±
22.36b
Faecal Strepto Coli
(FS)
(MPN/100ml)
300.00 ±
13.35
1835115.00 ±
237763.17a
533666.67
±
513268.98b
1233.33
±
61.46b
1066.67
±
91.89b
FC/FS 1.39
±
0.06
1.46
±
0.13
1.29
±
0.11
1.26
±
0.02b
1.31
±
0.11
Note: a p<0.05 or
a p<0.01 in comparison with “Control”,
b p<0.05 or
b p<0.01 in comparison
with “Lucknow” cp<0.05 or
cp<0.01 in comparison with “Barabanki”,
d p<0.05 or
d p<0.01 in
comparison with “Sultanpur”
Table 5: Summary (Mean ± SE, n=10) of bacteriological parameters in different seasons-
Seasonal Variations
Parameters Pre monsoon Monsoon Post monsoon
Total Coli
(MPN/100ml)
259308.33
±
214960.94
436398.33
±
303269.68
471886.67
±
311279.45
Faecal Coli (FC)
(MPN/100ml)
439308.33
±
287937.27
833698.33
±
462249.36
471886.67
±
311279.45
Faecal Strepto Coli
(FS)
(MPN/100ml)
327469.83
±
216626.40
697135.50
±
388227.97
398223.67
±
262625.85
FC/FS 1.37±0.07b 1.45±0.08 1.21±0.04
a

Assessment of Physico-Chemical properties and sewage pollution indicator bacteria in surface water of River
Gomti in Uttar Pradesh
Srivastava Anukool, Srivastava Shivani
International Journal of Environmental Sciences Volume 2 No.1, 2011 344
Note: a
p<0.05 or a
p<0.01 in comparison with “Monsoon” b
p<0.05 or b
p<0.01 in comparison with “Post monsoon”
Table 6: Summary (Mean ± SE, n=10) of bacteriological parameters in two different years-
Temporal Variations
Parameters 2008 2009
Total Coli (TC)
(MPN/100ml)
392181.11
±
209726.44
386214.44
±
240822.16ns
Faecal Coli (FC)
(MPN/100ml)
657047.78
±
316736.12
506214.44
±
268444.58ns
Faecal Strepto Coli (FS)
(MPN/100ml)
496785.11
±
242638.97
451767.56
±
242871.51ns
FC/FS 1.44
±
0.07
1.24
±
0.03**
Note: ns- p>0.05, **- p<0.01
Table 7: Correlation coefficients between the Physico-chemical parameters and bacteriological
parameters in the stretch of river Gomti
Note: TS= Total Solids, TDS= Total Dissolved Solids, SS= Suspended Solids, Cond.
=Conductivity, COD= Chemical Oxygen Demand, BOD= Biological Oxygen Demand,
DO=Dissolved Oxygen, TC= Total Coli, FC= Faecal Coli, FS= Faecal Streptocoli
Temp.
Water TS TDS SS pH Cond. COD BOD DO TC FC FS
Temp.
Water 1.00
TS -0.63 1.00
TDS -0.51 0.94 1.00
SS -0.15 -0.13 -0.46 1.00
pH 0.41 -0.73 -0.70 0.13 1.00
Cond. -0.64 0.98 0.93 -0.18 -0.84 1.00
COD -0.34 0.68 0.64 -0.08 -0.77 0.71 1.00
BOD -0.31 0.61 0.55 -0.01 -0.74 0.64 0.98 1.00
DO 0.53 -0.79 -0.71 0.01 0.82 -0.83 -0.93 -0.93 1.00
TC -0.24 0.51 0.59 -0.37 -0.55 0.52 0.85 0.87
-
0.74 1.00
FC -0.24 0.51 0.59 -0.37 -0.55 0.52 0.85 0.87
-
0.74 1.00 1.00
FS -0.24 0.51 0.59 -0.38 -0.55 0.52 0.85 0.86
-
0.74 1.00 1.00
1.0
0

Assessment of Physico-Chemical properties and sewage pollution indicator bacteria in surface water of River
Gomti in Uttar Pradesh
Srivastava Anukool, Srivastava Shivani
International Journal of Environmental Sciences Volume 2 No.1, 2011 345
0.0
500000.0
1000000.0
1500000.0
2000000.0
2500000.0
Me
an
va
lue
s
Control Lucknow Barabanki Sultanpur Jaunpur
Locations
Total Coli
Faecal Coli (FC)
Faecal Strepto Coli
Figure 1: Bar graph showing spatial variations of different bacteriological parameters in
water of river Gomti.
0.0
100000.0
200000.0
300000.0
400000.0
500000.0
600000.0
700000.0
800000.0
900000.0
Me
an
va
lue
s
Pre monsoon Monsoon Post monsoon
Seasons
Total Coli
Faecal Coli (FC)
Faecal Strepto Coli
Figure 2: Bar graph showing seasonal variations of different bacteriological parameters in
water of river Gomti.
0.0
100000.0
200000.0
300000.0
400000.0
500000.0
600000.0
700000.0
Me
an
va
lue
s
2008 2009
Years
Total Coli
Faecal Coli (FC)
Faecal Strepto Coli
Figure 3: Bar graph showing temporal variations of different bacteriological parameters in
water of river Gomti.

Assessment of Physico-Chemical properties and sewage pollution indicator bacteria in surface water of River
Gomti in Uttar Pradesh
Srivastava Anukool, Srivastava Shivani
International Journal of Environmental Sciences Volume 2 No.1, 2011 346
Figure 4: Bar graph showing correlation between Physico-chemical parameters and
bacteriological parameters.
3. Conclusion
The present study revealed that water quality of river Gomti from upstream to downstream
was found to be more polluted with reference to bacteriological parameters rather than all
physico-chemical parameters. The high values of sewage pollution indicator bacteria detected,
revealed that the microbiological quality of water of river Gomti was very poor, unsafe and
not acceptable for any purpose especially in Lucknow and Barabanki districts. The main
cause of the Coliform pollution is the total absence of the wastewater treatment system for all
cities situated along side of Gomti River. The deterioration in water quality is found due to
the regular outfalls of more than 26 drains only in Lucknow. A number of industries
discharge their industrial effluent in to river especially in Barabanki and at other locations.
Due to presence of such huge amount of pollutants in to surface water, river lost their self
purifying nature, resulting high level of pathogenic bacteria. Despite the above scenario, the
people use the water of river Gomti for various purposes. That’s why proper treatment of
waste water before merging in to river Gomti needed for good water ecology and to avoid
various human diseases
4. References
1. Abida B. and Harikrishna, (2008). “Study on the Quality of Water in Some Streams of
Cauvery River,” Journal of Chemistry, ISSN: 0973-4945, 5(2), 377-384.
2. Ahipathi M.V., and Puttaiah, E.T (2006). “Ecological Characteristics of
Vrishabhavathi River in Bangalore (India)”, Environmental Geology, 49,pp 1217-
1222
3. Faith Ngwenya, (2006). “Water Quality Trends in the Eerste River, Western Cape, 1990-
2005. A mini thesis submitted in partial fulfillment of the requirements for the degree
of Magister Scientiae, Integrated Water Resources Management in the Faculty of
Natural Science, University of the Western Cape”. pp. 41.

Assessment of Physico-Chemical properties and sewage pollution indicator bacteria in surface water of River
Gomti in Uttar Pradesh
Srivastava Anukool, Srivastava Shivani
International Journal of Environmental Sciences Volume 2 No.1, 2011 347
4. Harwood, V.J., Brownell, M., Perusek, W., Whitelock, J.E (2001). “Vancomycin-
resistant Enterococcus sp. Isolated from waste water and chicken feces in the United
States.” Applied and Environmental Microbiology, 67 (10) 4930-4933
5. H.B.Mahananda, M.R. Mahananda, and B.P. Mohanty, (2005) “Studies on the
Physico-chemical and Biological Parameters of a Fresh Water Pond Ecosystem as an
Indicator of Water Pollution”. Ecology Environment & Conservation.11 (3-4), pp
537-541.
6. Kistemann, T., Claben, T., Koch, C., Dangendorf, F., Fischeder, R., Gebel, J.,
Vacata, V., Exner, M., (2002). “Microbial load of drinking water reservoir
Tributaries during extreme rainfall and runoff.” Applied and Environmental
Microbiology. 68, 2188–2197.
7. Mohamed Hatha, Abhirosh chandran, and Sherin Varghese, (2008). “Increased
Prevalence of Indicator and pathogenic bacteria in the Kumarankom Lake: A
function of salt water Regulator in Vembandu Lake, A Ramsar site, along west coast
of India. The 12th
World Lake Conference:” 250-256.
8. Mahananda, M.R, (2010). “Physico-Chemical analysis of surface water and ground
water of Bargarh District, Orissa, India.” International Journal of Research and
Review in Applied Sciences, 2 (3), pp 284-295.
9. N. Kumar, (1997) “A View on Freshwater environment”, Ecology. Environment &
Conservation. 3, (3-4).
10. Okpokwasili, G.C., Akujobi, T.C (1996). “Bacteriological indicators of tropical
water quality.” Environmental Toxicology and Water Quality. Vol. (11), 77–81.
11. Pathak, S.P., Gopal, K (2001). “Rapid detection of Escherichia coli as an indicator of
faecal pollution in water.” Indian Journal of Microbiology. 41,139–151.
12. Pipes, W.O (1981). “Bacterial indicators of pollution. CRC Press Inc., Boca Raton,”
FL, p. 242.
13. River Rehabilitation: Literature Review, Case studies and Emerging Principles. WRC Report No. 1161/1/03.
14. Scott, T.M., Salina, P., Portier, K.M., Rose, J.B., Tamplin, M.L., Farrah, S.R., Koo,
A., Lukasik, J (2003). “Geographical variation in ribotype profiles of Escherichia
coli isolates from human, swim, poultry, beef and dairy cattle in Florida.” Applied
Environmental .Microbiology 69 (2), 1089–1092.
15. Sandy C, Richard F (1995). Quality and Standard for Drinking Water Chapter 3
Environmental Health Engineering in the Tropics. And Introductory Textbook Wiley
Inter Science. 2nd Edition. ISBN 0471938858, p. 294
16. Shehane, S.D., V.J. Harwood, J.E. whitelock, and J.B.Rose (2005). “The influence of
rainfall on the incidence of Microbial faecal Indicators and the dominant sources of
faecal pollution in a Florida river.” Journal of Applied Microbiology. 98,1127-1136.

Assessment of Physico-Chemical properties and sewage pollution indicator bacteria in surface water of River
Gomti in Uttar Pradesh
Srivastava Anukool, Srivastava Shivani
International Journal of Environmental Sciences Volume 2 No.1, 2011 348
17. USEPA, 1997. Manual on Monitoring Water Quality. EPA 841-B-97-003.
18. Venkatesharaju K., Ravikumar. P., Somashekar. R. K., Prakash. K. L (2010). “Physico-
Chemical and Bacteriological Investigation on the river Cauvery of Kollegal Stretch
in Karnataka.” Journal of Science, Engineering and Technology, 6(1), pp 50-59.