Embed Size (px)
Citation preview

1
Assessment of nutrients status of areas supporting optimum oil palm (Elaeis guineensis Jacq. L) cultivation in GhanaI. DANSO*, S. A. OKYERE, E. LARBI, F. DANSO & B. N. NUERTEY (I.D.S.A.O, E.l, F.D & B.N.N.: Council for Scientific and Industrial Research- Oil Palm Research Institute (CSIR-OPRI), P.O. Box 74, Kade, Ghana)*Corresponding author’s email: [email protected]
ABSTRACTIn Ghana, information on the fertility status to support oil palm growth and productivity and possible fertilizer recommendation is not common. The objective of this study was to assess the nutrition-related limitations to production of oil palm across areas climatically delineated as optimum for sustainable oil palm production. Based on Ghana Interim Soil Classification System, benchmark soils identified in these areas were: Temang (Lixisols), Akroso (Acrisol), Kokofu (Alisols), Basitia (Acrislos), Firam (Acrisols) and Nkwanta (Acrisols). Results indicated generally strongly acidic soil and exchangeable acidity values obtained were high and consistent with very acidic soil conditions. There were generally- high C: N ratios (>20) except some few sites, thus supplementary nitrogen is required to reduce C: N ratio and improve N availability. The Total Exchangeable Bases (TEB), Effective Cation Exchange Capacity (ECEC) and available P values were less than the optimum values for sustainable oil palm production. Both soil and foliar analysis indicated that soils in areas assessed have low soil fertility with relatively good soil physical conditions. It is recommended that instead of superphosphate fertilizer application, rock phosphate should be administered due to high acidity. Raising the low ECEC levels of the soil calls for composted empty fruit bunches incorporation.
Keywords: Nutrients status; rock phosphate; benchmark soils; leaf nutrient concentration; exchangeable acidityOriginal scientific paper. Received 11 Mar 2019; revised 01 Aug 2019
IntroductionOil Palm (Elaeis guineensis Jacq.) belongs to the family Palmae and is a major cash crop in Ghana, contributing substantially to the national economy in terms of employment and foreign exchange earnings (ranks second to cocoa). Per hectare bases, oil palm is the most productive oil crop in the world, being 10 times more productive than soybean and other oil-bearing seeds (Verheye, 2010). Of the 17 major vegetable oils traded on the international
market, palm oil is the most important and accounts for more than half of the global import and export trade of all vegetable oils (Boons & Angelica, 2010).
Ghana was the first country where the British established oil palm plantations in the 19th century (Aghalino, 2000). The same seeds and production techniques were then used to establish palm oil estates in another British colony-Malaysia. Despite the common root, the palm oil value chain in Malaysia and Ghana
Ghana Jnl Agric. Sci. 54 (2), 1 - 14 GJAS is an Open Access Journal and distributed under the terms of the Creative Commons (CC) License [CC BY 4.0]
https://dx.doi.org/10.4314/gjas.v54i2.1

2 I. Danso et. al (2019) Ghana Jnl. Agric. Sci. 54 (2), 1 - 14
took two divergent development pathways. Malaysia is now the world’s second-largest palm oil producer and exporter after Indonesia, while Ghana ranks 10th in terms of production quantity (520,000 MT) (USDA, 2017). Yield potential is much higher, with annual yields of up to 25.2 t ha-1 observed in research trials in Ghana (Danso et al., 2008) but up to 4 t ha-1 being obtained in small-scale farmer’s fields which constitute about 80% of the total area under oil palm cultivation in Ghana. The underdevelopment of oil palm industry in Ghana among others may be attributed to: the use of uncertified planting materials, lack of appropriate agronomic knowledge, use of inefficient processing equipment, inadequate labor, lack of access to credit facilities and low pricing conditions due to poor oil quality production.
Oil palm a perennial crop has an economic lifespan ranging between 25-30 years (Hartley, 1988). The continuous removal of nutrients through Fresh Fruit Bunches (FFB) harvest results in declining soil fertility. This causes a serious decrease in yield per unit area
narrowing the financial base of the small-scale oil palm farmer.
For good growth and productivity, the oil palm must thrive well under optimum soil conditions with total N, available P, and available K of 0.2%, 20 mg/kg and 100 mg/kg respectively (Hartley, 1988). According to Goh and Chew (1997), other soil fertility parameters must also be present in the soil within suitable ranges. For instance, oil palm thrives well under CEC of 15-18 cmol kg-1, pH of 5.0-5.5, exchangeable K of 0.25-0.30 cmol kg-1 and exchangeable Mg of 0.25-0.3 cmol kg-
1. High fertility status of the supporting soils is therefore required for high productivity of oil palm per unit land area. In Ghana, information on the fertility status to support oil palm growth and productivity and possible fertilizer recommendation is not common.
The objective of this study was to assess the nutrition-related limitations to the production of oil palm across areas climatically delineated (Figure 1) as optimum for oil palm production in Ghana.

3
Materials and MethodsSites description
Eight sites (Figure 1) were selected (Kusi I, Kusi II, Norpalm, TOPP, Benso I, Benso II, Benso III and Aiyanase) for characterization with oil palm trees with ages ranging from 10 to 12 years across sites. The selected sites fall within the zone climatically classified as optimum (Figure 1) for oil palm cultivation
in Ghana (Van der Vossen, 1969). The areas are characterized by relatively high rainfall occurring in two seasons (bi-modal). With oil palm requiring between 1500-2000 mm annual amount of rainfall, the mean annual rainfall for the sites is 1120 mm. The major rainy season starts from April and ends in July whilst the minor season spans between September and mid-November. The major dry season occurs
Assessment of nutrients status of areas...

4
between the end of the minor wet season and the next major wet season. Temperatures are generally high and uniform throughout the year. The mean monthly temperatures range from 24 to 300C. The month of July records the lowest mean monthly temperature of about 240C, while March records the highest of 300C.
Relative humidity at the sites is about 90% at 0600 hours and falling to between 70 and 50% at 1500 hours. In the wet season, relative humidity is high (about 96%) while it is low (about 40%) in the dry season.
Soil profile characterization (Figure 2) was done for each site and soils sampled were classified based on Ghana Interim Soil Classification System (Brammer, 1962) and subsequently correlated to World Reference Base (WRB) soil names (FAO, 1998).
Fig. 2: Soil profile for characterization =in one of the sites
Soil samplingSoil profile pits were dug and samples
were taken from 0-20, 20-40, 40-60,60-80 and 80-100 cm soil depths at different sites for laboratory analysis. Samples were placed on drying trays in the drying room for 24 hours. They were then ground and passed through a 2 mm diameter nylon sieve and subjected to the following analytical methods.
Laboratory analysis
SoilSoil pH was measured in a 1:2.5
soil: water suspension using a HI 9017 microprocessor pH meter. The modified Walkley and Black procedure as described by Nelson and Sommers (1982) were used to assess the organic C content of the soils. Total N was determined by Kjeldahl digestion method. The available P was extracted with an HCl: NH4F solution as described by Bray and Kurtz (1945) and determined colorimetrically using the molybdenum blue method. Exchangeable bases (calcium, magnesium, potassium and sodium) in the soil were determined in 1.0 M ammonium acetate extract whilst exchangeable acidity (hydrogen and aluminium) was determined in 1.0 M KCl extract. The Effective Cation Exchange Capacity (ECEC) was calculated as the sum of exchangeable bases and exchangeable acidity. Soil particle size was determined using the hydrometer method (Bouyoucos, 1962).
Foliar nutrient analysisLeaf samples of the oil palm lamina
from the central leaflets of leaf No. 17 (representative leaf for nutrient concentration analysis) was sampled and analysed for nutrient concentration. Samples were cleaned thoroughly with cotton wool and distilled water and oven-dried in an oven at 700C for 48 hours to a constant weight. The oven dried leaf samples were milled to pass through 0.5 mm sieve mesh. Determination of total nitrogen, phosphorus, potassium, calcium and magnesium using the standard methods (IITA, 1982).
I. Danso et. al (2019) Ghana Jnl. Agric. Sci. 54 (2), 1 - 14
5
Results and Discussion
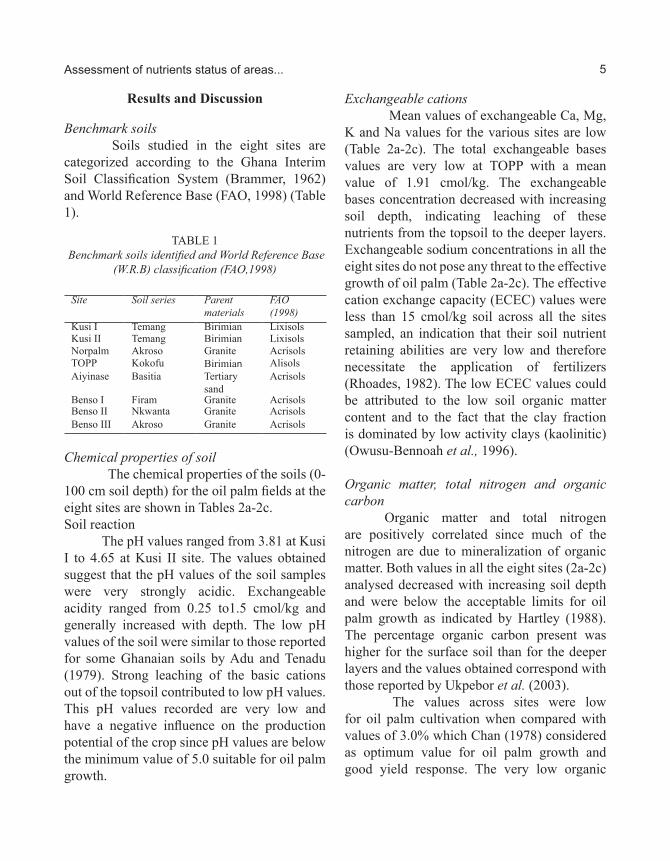
Benchmark soilsSoils studied in the eight sites are
categorized according to the Ghana Interim Soil Classification System (Brammer, 1962) and World Reference Base (FAO, 1998) (Table 1).
TABLE 1 Benchmark soils identified and World Reference Base
(W.R.B) classification (FAO,1998)
Site Soil series Parent materials
FAO (1998)
Kusi I Temang Birimian LixisolsKusi II Temang Birimian LixisolsNorpalm Akroso Granite AcrisolsTOPP Kokofu Birimian AlisolsAiyinase Basitia Tertiary
sandAcrisols
Benso I Firam Granite AcrisolsBenso II Nkwanta Granite AcrisolsBenso III Akroso Granite Acrisols
Chemical properties of soil
The chemical properties of the soils (0-100 cm soil depth) for the oil palm fields at the eight sites are shown in Tables 2a-2c.Soil reaction
The pH values ranged from 3.81 at Kusi I to 4.65 at Kusi II site. The values obtained suggest that the pH values of the soil samples were very strongly acidic. Exchangeable acidity ranged from 0.25 to1.5 cmol/kg and generally increased with depth. The low pH values of the soil were similar to those reported for some Ghanaian soils by Adu and Tenadu (1979). Strong leaching of the basic cations out of the topsoil contributed to low pH values. This pH values recorded are very low and have a negative influence on the production potential of the crop since pH values are below the minimum value of 5.0 suitable for oil palm growth.
Exchangeable cations Mean values of exchangeable Ca, Mg, K and Na values for the various sites are low (Table 2a-2c). The total exchangeable bases values are very low at TOPP with a mean value of 1.91 cmol/kg. The exchangeable bases concentration decreased with increasing soil depth, indicating leaching of these nutrients from the topsoil to the deeper layers. Exchangeable sodium concentrations in all the eight sites do not pose any threat to the effective growth of oil palm (Table 2a-2c). The effective cation exchange capacity (ECEC) values were less than 15 cmol/kg soil across all the sites sampled, an indication that their soil nutrient retaining abilities are very low and therefore necessitate the application of fertilizers (Rhoades, 1982). The low ECEC values could be attributed to the low soil organic matter content and to the fact that the clay fraction is dominated by low activity clays (kaolinitic) (Owusu-Bennoah et al., 1996).
Organic matter, total nitrogen and organic carbon
Organic matter and total nitrogen are positively correlated since much of the nitrogen are due to mineralization of organic matter. Both values in all the eight sites (2a-2c) analysed decreased with increasing soil depth and were below the acceptable limits for oil palm growth as indicated by Hartley (1988). The percentage organic carbon present was higher for the surface soil than for the deeper layers and the values obtained correspond with those reported by Ukpebor et al. (2003).
The values across sites were low for oil palm cultivation when compared with values of 3.0% which Chan (1978) considered as optimum value for oil palm growth and good yield response. The very low organic
Assessment of nutrients status of areas...

6
carbon content reflected the generally highly weathered soils in the humid rainforest agro-ecological zone of the country (Owusu-Bennoah et al., 2000).
C: N ratioThe C: N ratio for the sites Kusi II and
Norpalm (Table 2a-2c) were low and are within the range of soil organic matter that can easily mineralize without serious immobilization of nitrogen. On the other hand, the C: N ratio for the remaining sites Aiyinase, TOPP, Kusi I, Benso I, Benso II and Benso III is relatively high. Hence, additional organic materials rich in nitrogen would be required to reduce the C: N ratio and aid mineralization provided the humic materials are not in a stable state.Available P
The mean value for available P was very low for the sites studied and ranged from 0.26 mg/kg at Aiyinase to 3.07 mg/kg at Benso I site. The available P content indicated that the soil was extremely deficient in P. According to Hartley (1988), the threshold deficiency for P is 10 mg/kg. This could be attributed to the advanced stage of weathering of the parent rocks which lacked primary weatherable minerals necessary for nutrient recharge (Charreau, 1974). Although all inorganic P cannot be considered sorbed P, these findings together with the Bray P results strongly suggest deficiency of P in the soils and hence, the need for P fertilizer application.
I. Danso et. al (2019) Ghana Jnl. Agric. Sci. 54 (2), 1 - 14

7
TABLE 2A Chemical properties of soils sampled at various soil depth
site
Samp
lede
pth
pH (1:2.
5 H2O)
Org.
C (%
)Or
g. M
.(%
)To
tal N
(%
)Av
ail.
P (m
g/kg
)
Avail
. K(
cmol/
kg)
Exch
. Cat
ions c
mol/
kgEx
ch.
TEB
(cmol/
kg)
Exch
.Ac
idity
(cmol/
kg)
C:N
ratio
ECEC
(cmol/
kg)
Base
.sat.
(%)
Mg2+
K+Na
+Ca
2+
Kusi
I
0-20
20-4
040
-60
60-8
080
-100
Mea
n
4.06
4.03
4.01
3.90
3.81
3.96
1.34
1.11
1.01
0.90
0.85
1.04
2.31
1.91
1.74
1.55
1.46
1.79
0.11
0.05
0.04
0.04
0.31
0.11
4.40
0.40
0.35
0.30
0.29
1.15
31.0
562
.05
56.01
54.10
53.2
351
.29
0.96
0.32
0.30
0.29
0.24
0.42
0.13
0.13
0.12
0.09
0.07
0.11
0.14
0.20
0.25
0.27
0.29
0.23
3.84
4.32
3.45
3.89
3.88
3.88
5.07
4.
974.1
24.
544.4
84.6
4
1.45
0.85
0.90
1.00
1.05
1.05
12.18
22.2
25.2
522
.52.7
416
.97
6.52
5.82
5.02
5.54
5.53
5.69
77.76
85.4
082
.0781
.95
81.01
81.6
4
Kusi
II
0-20
20-4
040
-60
60-8
080
-100
Mea
n
4.20
4.78
4.71
4.66
4.65
4.60
1.05
0.44
0.43
0.41
0.39
0.54
1.81
0.76
0.74
0.71
0.68
0.94
0.10
0.09
0.08
0.07
0.06
0.08
0.80
0.40
0.90
0.93
0.95
0.80
69.2
059
.7070
.00
65.2
368
.23
66.47
1.60
0.40
0.41
0.30
0.31
0.60
0.07
0.06
0.04
0.05
0.06
0.06
0.15
0.20
0.21
0.19
0.23
0.20
2.88
2.40
2.54
2.64
2.50
2.60
4.70
3.06
3.20
3.18
3.10
3.45
0.25
0.30
0.36
0.41
0.40
0.34
10.5
4.9
5.37
5.86
6.5
6.63
4.95
3.36
3.56
3.59
3.50
3.79
94.9
589
.46
89.8
988
.58
88.5
790
.29
Norp
a-lm
0-20
20-4
040
-60
60-8
080
-100
Mea
n
4.03
4.13
4.11
4.12
4.15
4.11
0.91
0.56
0.51
0.50
0.49
0.49
1.57
0.97
0.88
0.86
0.84
1.02
0.07
0.06
0.05
0.04
0.03
0.05
1.45
0.20
0.42
0.39
0.40
0.57
59.70
131.3
098
.22
93.0
012
3.11
101.0
7
0.80
0.64
0.75
0.72
0.76
0.73
0.07
0.06
0.07
0.59
0.61
0.28
0.18
0.08
0.19
0.09
0.18
0.14
2.72
1.44
1.45
1.65
1.52
1.76
3.77
2.22
2.46
3.05
3.07
2.91
1.00
1.05
0.94
0.96
0.98
0.99
13.0
9.3
10.2
12.5
16.3
12.2
6
4.77
3.27
3.40
4.01
4.05
3.90
79.0
467
.89
72.3
576
.06
75.8
074
.22
TOPP
0-20
20-4
040
-60
60-8
080
-100
Mea
n
4.10
4.40
4.45
4.43
4.41
4.36
0.62
0.31
0.30
0.29
0.27
0.36
1.07
0.53
0.51
0.49
0.46
0.61
0.11
0.01
0.01
0.01
0.01
0.03
1.20
0.20
1.10
0.89
0.80
0.84
47.75
38.2
039
.0138
.4137
.9140
.26
0.48
0.48
0.47
0.46
0.44
0.47
0.09
0.08
0.07
0.08
0.06
0.08
0.07
0.14
0.12
0.13
0.12
0.12
1.60
2.40
0.70
0.80
0.78
1.26
2.24
3.10
1.36
1.47
1.40
1.91
0.40
0.30
0.30
0.31
0.30
0.32
5.64
31 30 29 27 18.9
5
2.64
3.40
1.66
1.78
1.70
2.24
84.8
591
.1881
.93
82.5
882
.35
84.5
6sit
eSa
mple
dept
hpH
(1:2.
5H2O)
Org.
C (%
)Or
g.M
(%)
Tota
lN
(%)
Avail
.P(m
g/kg
)Av
ail.K
(cmol/
)Ex
ch. C
ation
s com
l/kg
Exch
.TE
B (cm
ol/kg
)
Exch
.Ac
idity
(cmol/
kg)
C:N
ratio
ECEC
(cm
ol/kg
)Ba
se sa
t. (%
)M
g2+K+
Na+
Ca2+
Aiya
n-as
e
0-20
20-4
040
-60
60-8
080
-100
Mean
4.54
4.48
4.45
4.46
4.44
4.47
2.07
1.42
1.40
1.39
1.40
1.54
3.57
2.45
2.42
2.40
2.42
2.65
0.07
0.05
0.05
0.04
0.03
0.05
0.40
0.20
0.23
0.21
0.25
0.26
88.3
90.70
91.32
90.23
89.34
89.98
0.96
0.88
0.87
0.86
0.84
0.88
0.15
0.12
0.11
0.12
0.09
0.12
0.17
0.06
0.15
0.11
0.12
0.12
6.08
3.84
3.12
3.22
3.01
3.85
7.36
4.90
4.25
4.31
4.06
4.98
0.30
0.65
0.63
0.62
0.61
0.65
29.6
28.4
28 34.75
46.66
33.48
7.66
5.55
4.88
4.93
4.67
5.54
96.08
88.29
87.09
87.42
86.93
89.16
Bens
o I
0-20
20-4
040
-60
60-8
080
-100
Mean
4.04
4.09
4.07
4.04
4.06
4.06
3.81
2.48
2.43
2.41
2.39
2.70
6.57
4.28
4.19
4.16
4.13
4.67
0.11
0.10
0.10
0.09
0.08
0.10
3.20
3.00
3.01
3.11
3.02
3.07
76.40
45.35
47.34
48.65
49.77
53.50
1.60
0.64
0.65
0.63
0.71
0.82
0.08
0.07
0.05
0.06
0.07
0.07
0.19
0.13
0.14
0.13
0.12
0.14
3.84
3.52
3.45
3.34
3.53
3.53
5.71
4.36
4.29
4.16
4.43
4.59
0.50
0.90
0.89
0.88
0.90
0.81
34.6
24.8
24.3
26.77
29.88
17.54
6.21
5.26
5.18
5.04
5.33
5.40
91.95
82.89
82.82
82.54
83.11
84.66
Bens
o II
0-20
20-4
040
-60
60-8
080
-100
Mean
3.95
3.92
3.93
3.92
3.91
3.93
1.65
1.28
1.27
1.24
1.23
1.33
2.84
2.21
2.19
2.14
2.12
2.3
0.11
0.03
0.03
0.02
0.01
0.04
1.00
0.20
0.23
0.24
0.20
0.37
54.90
78.75
75.34
76.30
77.54
72.57
0.64
0.56
0.60
0.58
0.61
0.60
0.09
0.12
0.10
0.09
0.08
0.10
0.03
0.20
0.23
0.27
0.26
0.20
1.60
3.20
2.56
2.60
2.57
2.51
2.36
4.08
3.49
3.54
3.52
3.40
1.20
1.50
1.43
1.37
1.35
1.37
15.0
42.7
42.33
62 123
57.01
3.56
5.58
4.92
4.91
4.87
4.77
66.29
73.12
70.93
72.10
72.28
70.94
Assessment of nutrients status of areas...

8
site
Samp
lede
pthpH (1:
2.5 H
2O)Or
g.C
(%)
Org.
M.(%
)To
tal N
(%
)Av
ail.
P (m
g/kg
)
Avail
. K(
cmol/
kg)
Exch
. Cati
ons c
mol/k
gEx
ch.
TEB
(cmol/
kg)
Exch
.Ac
idity
(cmol/
kg)
C:N
ratio
ECEC
(cmol/
kg)
Base
.sa
t.(%
)Mg
2+K+
Na+
Ca2+
Kusi
I
0-20
20-4
040
-60
60-8
080
-100
Mean
4.06
4.03
4.01
3.90
3.81
3.96
1.34
1.11
1.01
0.90
0.85
1.04
2.31
1.91
1.74
1.55
1.46
1.79
0.11
0.05
0.04
0.04
0.31
0.11
4.40
0.40
0.35
0.30
0.29
1.15
31.0
562
.05
56.01
54.10
53.2
351
.29
0.96
0.32
0.30
0.29
0.24
0.42
0.13
0.13
0.12
0.09
0.07
0.11
0.14
0.20
0.25
0.27
0.29
0.23
3.84
4.32
3.45
3.89
3.88
3.88
5.07
4.9
74.1
24.5
44.4
84.6
4
1.45
0.85
0.90
1.00
1.05
1.05
12.18
22.2
25.2
522
.52.7
416
.97
6.52
5.82
5.02
5.54
5.53
5.69
77.76
85.40
82.07
81.9
581
.0181
.64
Kusi
II
0-20
20-4
040
-60
60-8
080
-100
Mean
4.20
4.78
4.71
4.66
4.65
4.60
1.05
0.44
0.43
0.41
0.39
0.54
1.81
0.76
0.74
0.71
0.68
0.94
0.10
0.09
0.08
0.07
0.06
0.08
0.80
0.40
0.90
0.93
0.95
0.80
69.2
059
.7070
.00
65.2
368
.23
66.47
1.60
0.40
0.41
0.30
0.31
0.60
0.07
0.06
0.04
0.05
0.06
0.06
0.15
0.20
0.21
0.19
0.23
0.20
2.88
2.40
2.54
2.64
2.50
2.60
4.70
3.06
3.20
3.18
3.10
3.45
0.25
0.30
0.36
0.41
0.40
0.34
10.5
4.9 5.37
5.86
6.5
6.63
4.95
3.36
3.56
3.59
3.50
3.79
94.9
589
.46
89.8
988
.58
88.57
90.2
9
Norp
a-lm
0-20
20-4
040
-60
60-8
080
-100
Mean
4.03
4.13
4.11
4.12
4.15
4.11
0.91
0.56
0.51
0.50
0.49
0.49
1.57
0.97
0.88
0.86
0.84
1.02
0.07
0.06
0.05
0.04
0.03
0.05
1.45
0.20
0.42
0.39
0.40
0.57
59.70
131.3
098
.22
93.0
012
3.11
101.0
7
0.80
0.64
0.75
0.72
0.76
0.73
0.07
0.06
0.07
0.59
0.61
0.28
0.18
0.08
0.19
0.09
0.18
0.14
2.72
1.44
1.45
1.65
1.52
1.76
3.77
2.22
2.46
3.05
3.07
2.91
1.00
1.05
0.94
0.96
0.98
0.99
13.0
9.3 10.2
12.5
16.3
12.2
6
4.77
3.27
3.40
4.01
4.05
3.90
79.0
467
.89
72.3
576
.06
75.8
074
.22
TOPP
0-20
20-4
040
-60
60-8
080
-100
Mean
4.10
4.40
4.45
4.43
4.41
4.36
0.62
0.31
0.30
0.29
0.27
0.36
1.07
0.53
0.51
0.49
0.46
0.61
0.11
0.01
0.01
0.01
0.01
0.03
1.20
0.20
1.10
0.89
0.80
0.84
47.75
38.2
039
.0138
.4137
.9140
.26
0.48
0.48
0.47
0.46
0.44
0.47
0.09
0.08
0.07
0.08
0.06
0.08
0.07
0.14
0.12
0.13
0.12
0.12
1.60
2.40
0.70
0.80
0.78
1.26
2.24
3.10
1.36
1.47
1.40
1.91
0.40
0.30
0.30
0.31
0.30
0.32
5.64
31 30 29 27 18.9
5
2.64
3.40
1.66
1.78
1.70
2.24
84.8
591
.1881
.93
82.5
882
.35
84.5
6sit
eSa
mple
depth
pH(1:
2.5H
2O)Or
g.C
(%)
Org.M
(%)
Tota
lN
(%)
Avail
.P(m
g/kg
)
Avail
.K(cm
ol/)
Exch
. Cati
ons c
oml/k
gEx
ch.
TEB
(cmol/
kg)
Exch
.Ac
idity
(cmol/
kg)
C:N
ratio
ECEC
(cm
ol/kg
)Ba
se
sat. (
%)Mg
2+K+
Na+
Ca2+
Aiya
n-as
e
0-20
20-4
040
-60
60-8
080
-100
Mean
4.54
4.48
4.45
4.46
4.44
4.47
2.07
1.42
1.40
1.39
1.40
1.54
3.57
2.45
2.42
2.40
2.42
2.65
0.07
0.05
0.05
0.04
0.03
0.05
0.40
0.20
0.23
0.21
0.25
0.26
88.3
90.70
91.32
90.23
89.34
89.98
0.96
0.88
0.87
0.86
0.84
0.88
0.15
0.12
0.11
0.12
0.09
0.12
0.17
0.06
0.15
0.11
0.12
0.12
6.08
3.84
3.12
3.22
3.01
3.85
7.36
4.90
4.25
4.31
4.06
4.98
0.30
0.65
0.63
0.62
0.61
0.65
29.6
28.4
28 34.75
46.66
33.48
7.66
5.55
4.88
4.93
4.67
5.54
96.08
88.29
87.09
87.42
86.93
89.16
TABLE 2B Chemical properties of soil sampled at various soil depth
I. Danso et. al (2019) Ghana Jnl. Agric. Sci. 54 (2), 1 - 14

9
site
Samp
lede
pthpH (1:
2.5 H
2O)Or
g.C
(%)
Org.
M.(%
)To
tal N
(%
)Av
ail.
P (m
g/kg
)
Avail
. K(
cmol/
kg)
Exch
. Cati
ons c
mol/k
gEx
ch.
TEB
(cmol/
kg)
Exch
.Ac
idity
(cmol/
kg)
C:N
ratio
ECEC
(cmol/
kg)
Base
.sa
t.(%
)Mg
2+K+
Na+
Ca2+
Kusi
I
0-20
20-4
040
-60
60-8
080
-100
Mean
4.06
4.03
4.01
3.90
3.81
3.96
1.34
1.11
1.01
0.90
0.85
1.04
2.31
1.91
1.74
1.55
1.46
1.79
0.11
0.05
0.04
0.04
0.31
0.11
4.40
0.40
0.35
0.30
0.29
1.15
31.0
562
.05
56.01
54.10
53.2
351
.29
0.96
0.32
0.30
0.29
0.24
0.42
0.13
0.13
0.12
0.09
0.07
0.11
0.14
0.20
0.25
0.27
0.29
0.23
3.84
4.32
3.45
3.89
3.88
3.88
5.07
4.9
74.1
24.5
44.4
84.6
4
1.45
0.85
0.90
1.00
1.05
1.05
12.18
22.2
25.2
522
.52.7
416
.97
6.52
5.82
5.02
5.54
5.53
5.69
77.76
85.40
82.07
81.9
581
.0181
.64
Kusi
II
0-20
20-4
040
-60
60-8
080
-100
Mean
4.20
4.78
4.71
4.66
4.65
4.60
1.05
0.44
0.43
0.41
0.39
0.54
1.81
0.76
0.74
0.71
0.68
0.94
0.10
0.09
0.08
0.07
0.06
0.08
0.80
0.40
0.90
0.93
0.95
0.80
69.2
059
.7070
.00
65.2
368
.23
66.47
1.60
0.40
0.41
0.30
0.31
0.60
0.07
0.06
0.04
0.05
0.06
0.06
0.15
0.20
0.21
0.19
0.23
0.20
2.88
2.40
2.54
2.64
2.50
2.60
4.70
3.06
3.20
3.18
3.10
3.45
0.25
0.30
0.36
0.41
0.40
0.34
10.5
4.9 5.37
5.86
6.5
6.63
4.95
3.36
3.56
3.59
3.50
3.79
94.9
589
.46
89.8
988
.58
88.57
90.2
9
Norp
a-lm
0-20
20-4
040
-60
60-8
080
-100
Mean
4.03
4.13
4.11
4.12
4.15
4.11
0.91
0.56
0.51
0.50
0.49
0.49
1.57
0.97
0.88
0.86
0.84
1.02
0.07
0.06
0.05
0.04
0.03
0.05
1.45
0.20
0.42
0.39
0.40
0.57
59.70
131.3
098
.22
93.0
012
3.11
101.0
7
0.80
0.64
0.75
0.72
0.76
0.73
0.07
0.06
0.07
0.59
0.61
0.28
0.18
0.08
0.19
0.09
0.18
0.14
2.72
1.44
1.45
1.65
1.52
1.76
3.77
2.22
2.46
3.05
3.07
2.91
1.00
1.05
0.94
0.96
0.98
0.99
13.0
9.3 10.2
12.5
16.3
12.2
6
4.77
3.27
3.40
4.01
4.05
3.90
79.0
467
.89
72.3
576
.06
75.8
074
.22
TOPP
0-20
20-4
040
-60
60-8
080
-100
Mean
4.10
4.40
4.45
4.43
4.41
4.36
0.62
0.31
0.30
0.29
0.27
0.36
1.07
0.53
0.51
0.49
0.46
0.61
0.11
0.01
0.01
0.01
0.01
0.03
1.20
0.20
1.10
0.89
0.80
0.84
47.75
38.2
039
.0138
.4137
.9140
.26
0.48
0.48
0.47
0.46
0.44
0.47
0.09
0.08
0.07
0.08
0.06
0.08
0.07
0.14
0.12
0.13
0.12
0.12
1.60
2.40
0.70
0.80
0.78
1.26
2.24
3.10
1.36
1.47
1.40
1.91
0.40
0.30
0.30
0.31
0.30
0.32
5.64
31 30 29 27 18.9
5
2.64
3.40
1.66
1.78
1.70
2.24
84.8
591
.1881
.93
82.5
882
.35
84.5
6sit
eSa
mple
depth
pH(1:
2.5H
2O)Or
g.C
(%)
Org.M
(%)
Tota
lN
(%)
Avail
.P(m
g/kg
)
Avail
.K(cm
ol/)
Exch
. Cati
ons c
oml/k
gEx
ch.
TEB
(cmol/
kg)
Exch
.Ac
idity
(cmol/
kg)
C:N
ratio
ECEC
(cm
ol/kg
)Ba
se
sat. (
%)Mg
2+K+
Na+
Ca2+
Aiya
n-as
e
0-20
20-4
040
-60
60-8
080
-100
Mean
4.54
4.48
4.45
4.46
4.44
4.47
2.07
1.42
1.40
1.39
1.40
1.54
3.57
2.45
2.42
2.40
2.42
2.65
0.07
0.05
0.05
0.04
0.03
0.05
0.40
0.20
0.23
0.21
0.25
0.26
88.3
90.70
91.32
90.23
89.34
89.98
0.96
0.88
0.87
0.86
0.84
0.88
0.15
0.12
0.11
0.12
0.09
0.12
0.17
0.06
0.15
0.11
0.12
0.12
6.08
3.84
3.12
3.22
3.01
3.85
7.36
4.90
4.25
4.31
4.06
4.98
0.30
0.65
0.63
0.62
0.61
0.65
29.6
28.4
28 34.75
46.66
33.48
7.66
5.55
4.88
4.93
4.67
5.54
96.08
88.29
87.09
87.42
86.93
89.16
TABLE 2CChemical properties of soils sampled
at various soil depth
site
Sam
ple
dept
hpH
(1:2
.5
H2O
)O
rg.
C (%
)O
rg.M
(%)
Tota
lN
(%)
Ava
il. P
(mg/
kg)
Ava
il.K
(Cm
ol/k
g)E
xch.
Cat
ions
cm
ol/k
gE
xch.
TEB
(c
mol
/kg
)
Exc
h.
Aci
dity
(c
mol
/kg)
C:N
rat
ioE
CE
C(c
mol
/kg
)
Bas
e sa
t.(%
)M
g2+K
+N
a+C
a2+
Bens
o III
0-20
20-4
040
-60
60-8
080
-100
Mea
n
4.30
4.22
4.12
4.23
4.20
4.21
1.71
0.95
0.94
0.91
0.90
1.08
2.95
1.64
1.62
1.57
1.55
1.87
0.08
0.03
0.07
0.06
0.05
0.06
0.80
0.20
0.30
0.31
0.30
0.38
81.1
591
.90
90.3
091
.32
90.1
088
.95
0.64
0.80
0.78
0.74
0.76
0.74
0.12
0.12
0.13
0.11
0.12
0.12
0.15
0.13
0.12
0.11
0.11
o.12
3.36
2.88
2.78
2.67
2.89
2.92
4.2
7 3
.93
3.8
1 3
.63
3.8
8 3
.90
0.60
0.90
0.78
0.81
0.84
0.79
21.4
31.7
13.4
315
.16
18 19.9
4
4.87
4.83
4.59
4.44
4.72
4.69
87.6
881
.37
83.0
181
.76
82.2
083
.20
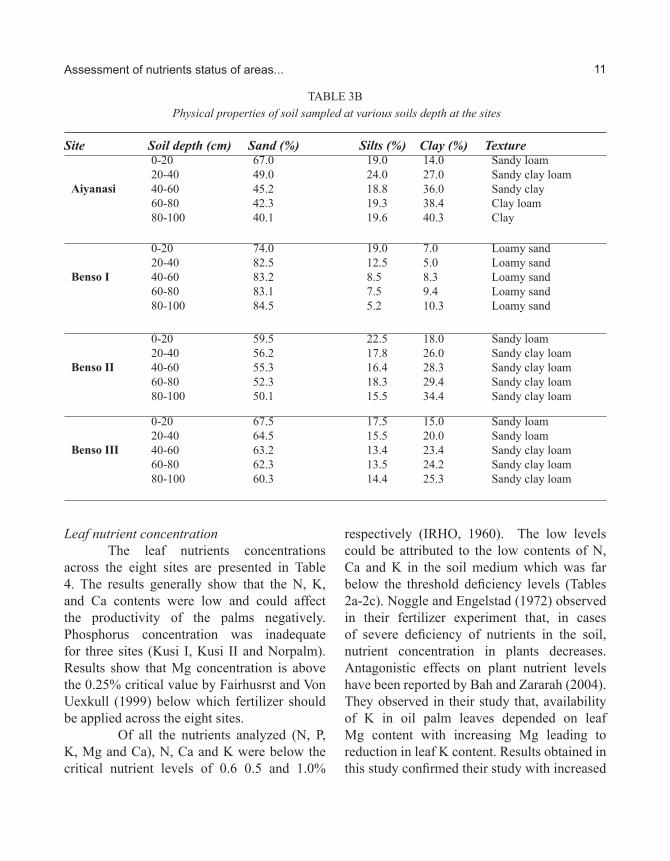
Physical properties of soils at the sites For the particle size analysis, the soils
were found to be mainly coarse with the percentage of sand ranging from 34.4 to 88.4% (Table 3a-3b). Sand contents were generally higher in the surface layers of soil as compared to deeper layers. Silt content varied from 4.7% for deeper layers at Norpalm to 46.5% for surface layers at Kusi I. On the other hand, clay contents were moderate and ranged from 5.0 to 42.2% across the eight sites. The particle size of soil and texture are important factors determining the fertility status of soils that supports the cultivation of oil palm. According to Hartley (1988), for optimum oil palm production, the soil must be deep and loamy with a well-developed structure. Soil should have a loose, friable consistency and must be without impervious layers in the top 1.5 metres. This is because the efficient root system of the oil palm is not strong enough to penetrate hard layers and will flourish and give better yields if the surface soil is physically suitable and chemically rich. The areas sampled had no hardpan within 0-100 cm depth to obstruct penetration of roots.
Assessment of nutrients status of areas...

10
TABLE 3APhysical properties of soils sampled at various soil depth at the sites
Site SoilDepth (cm)
Sand (%) Silt (%) Clay (%) Texture
Kusi I
0-2020-4040-6060-8080-100
34.540.039.038.934.4
46.537.028.025.123.4
19.0 23.033.034.942.2
LoamLoamClay loamClay loamClay
Kusi II
0-2020-4040-6060-8080-100
68.060.053.147.432.5
27.032.034.638.051.1
5.08.012.314.616.4
Sandy loamSandy loamSandy loamLoamSilt loam
Norpalm
0-2020-4040-6060-8080-100
75.575.578.379.280.3
14.514.59.66.64.7
10.010.012.114.415.0
Sandy loamSandy loamSandy loamSandy loamSandy loam
TOPP
0-2020-4040-6060-8080-100
85.087.088.486.087.0
10.08.04.66.55.2
5.05.07.07.57.8
Loamy sandLoamy sandLoamy sandLoamy sandLoamy sand
I. Danso et. al (2019) Ghana Jnl. Agric. Sci. 54 (2), 1 - 14
11
TABLE 3B Physical properties of soil sampled at various soils depth at the sites
Site Soil depth (cm) Sand (%) Silts (%) Clay (%) Texture
Aiyanasi
0-2020-4040-6060-8080-100
67.049.045.242.340.1
19.024.018.819.319.6
14.027.036.038.440.3
Sandy loamSandy clay loamSandy clayClay loamClay
Benso I
0-2020-4040-6060-8080-100
74.082.583.283.184.5
19.012.58.57.55.2
7.05.08.39.410.3
Loamy sandLoamy sandLoamy sandLoamy sandLoamy sand
Benso II
0-2020-4040-6060-8080-100
59.556.255.352.350.1
22.517.816.418.315.5
18.026.028.329.434.4
Sandy loamSandy clay loamSandy clay loamSandy clay loamSandy clay loam
Benso III
0-2020-4040-6060-8080-100
67.564.563.262.360.3
17.515.513.413.514.4
15.020.023.424.225.3
Sandy loamSandy loamSandy clay loamSandy clay loamSandy clay loam
Leaf nutrient concentrationThe leaf nutrients concentrations
across the eight sites are presented in Table 4. The results generally show that the N, K, and Ca contents were low and could affect the productivity of the palms negatively. Phosphorus concentration was inadequate for three sites (Kusi I, Kusi II and Norpalm). Results show that Mg concentration is above the 0.25% critical value by Fairhusrst and Von Uexkull (1999) below which fertilizer should be applied across the eight sites.
Of all the nutrients analyzed (N, P, K, Mg and Ca), N, Ca and K were below the critical nutrient levels of 0.6 0.5 and 1.0%
respectively (IRHO, 1960). The low levels could be attributed to the low contents of N, Ca and K in the soil medium which was far below the threshold deficiency levels (Tables 2a-2c). Noggle and Engelstad (1972) observed in their fertilizer experiment that, in cases of severe deficiency of nutrients in the soil, nutrient concentration in plants decreases. Antagonistic effects on plant nutrient levels have been reported by Bah and Zararah (2004). They observed in their study that, availability of K in oil palm leaves depended on leaf Mg content with increasing Mg leading to reduction in leaf K content. Results obtained in this study confirmed their study with increased
Assessment of nutrients status of areas...

12
Mg concentration resulting in decreased K during the period of investigation. Fertilizer recommendation studies by Council for Scientific and Industrial Research-Oil Palm Research Institute (1986) indicated that mature oil palm may not need Mg since percent leaf Mg contents are generally above the critical leaf nutrient levels of 0.24% (IRHO, 1960). This work confirms their findings since leaf Mg contents in this study were above 0.24%. The N-deficiency in the palm leaves may usually be associated with conditions of waterlogging, ineffective weed management strategies and topsoil erosion. Extended N deficiency normally reduces the number of effective fresh fruit bunches produced as well as the bunch size.
TABLE 4 Leaf nutrient concentration (%)
Site N P K Ca MgKusi I 1.83 0.12 0.08 0.12 0.33 Kusi II 1.82 0.14 0.11 0.13 0.38Norpalm 1.70 0.13 0.09 0.12 0.34TOPP 2.20 0.19 0.41 0.15 0.60 Aiyanase 1.91 0.18 0.51 0.16 0.59 Benso I 1.86 0.2 0 0.58 1.98 0.42Benso II 1.93 0.18 0.48 1.47 0.53Benso III 1.97 0.19 0.52 1.57 0.30
Conclusion and RecommendationSoil physical properties were found to be generally good at the eight sites. The main problem regarding the soils was the low levels of fertility elements. The sites were strongly acidic and exchangeable cations were low with low to very low available phosphorus. Due to the high rainfall regime of the areas, organic matter, organic carbon and total nitrogen were generally low to support good growth of palms.
Leaf nutrient concentrations across sites were below the critical values below which nutrients should be applied except Mg.
Drastic improvement of fertility levels of these soils is therefore required for improvement of oil palm production in these areas. Improvement of ECEC of these sites is necessary through the incorporation of empty fresh fruit bunches and the strongly acidic condition of the sites could be reversed through lime and rock phosphate application instead of superphosphate. Additionally, the use of lime, application of appropriate mineral fertilizers as well as maintenance of leguminous cover crops could improve the fertility status of these soils.
AcknowledgementThe authors wish to express their profound gratitude to the Staff of Agronomy Division (CSIR-OPRI), Laboratory Staff (CSIR-SRI) and Department of Crops and Soil Science, KNUST, Kumasi for their support. This paper is published with the permission of the Director, CSIR-OPRI.
REFERENCESAdu, S.V. & Tenadu, D.O. (1979) Soils of the
Proposed Enchi Rubber Project Area near Gyema, Western Region. Technical Report No. 121, S.R.I.-C.S.I.R. Kwadaso-Kumasi, Ghana.
Aghalino, S. O. (2000) British colonial policies and the oil palm industry in the Niger Delta region of Nigeria, 1900 – 1960.
Bah, A.R. & Zaharah, A.R. (2004) Evaluating urea fertilizer formulations for oil palm seedlings using the 15N isotope dilution technique. Journal of Oil Palm Research 16 (1), 72 – 77.
Bouyoucos, G.J. (1962) Hydrometer method improved for making particle size analysis of soils. Agronomy Journal 54, 464 – 465.
I. Danso et. al (2019) Ghana Jnl. Agric. Sci. 54 (2), 1 - 14

13
Boons, F. & Angelica M. (2010) Constructing sustainable palm oil: how actors define sustainabilityJournal of Cleaner Production 18 (16), 1686 – 1695.
Brammer, H. (1962) Soils:In Agriculture and Landuse in Ghana. J.B Wills ed., Oxford University Press London , Accra, New York, 88 – 126.
Bray, R.H. & Kurtz, L.T. (1945) Determination of total, organic and available forms of phosphorus in soil. Soil Science 599, 39 – 45.
Chan Y.K. (1978) Soil under coconut in Penisula Malaysia. In Proceeding International Conference on Cocoa and Coconut, Kuala Lumpur, International Society of Planters (Publishers), 583 – 594.
Charreau, C. (1974) Soil of tropical dry and dry-wet climatic areas of West Africa and their use and management. Agronomy Mimeo 74 – 26. Department of Agronomy, Cornell University,Ithaca, N.Y.
CSIR-OPRI. (1986) Commissioned annual report by Council for Scientific and Industrial Research of Oil Palm Research Institute, Kusi, Ghana.
Danso I, Nuertey B.N., Ando-Mensah E., Osei Bonsu A., Asamoah T.E.O, Dwarko D.A, Okyere Boateng G., Marfo-Ahenkorah E. & Opoku, A. (2008) Response of oil palm to planting density and water deficit in three climatic zones of southern Ghana. Journal of Ghana Science Association, 93 – 102.
Fairhurst, T.H. & Von, U.H.R. (1999) Agronomic management of oil palms on deep peat. Better Crops International 13 (1).
FAO. (1998) World Reference Base for Soil Resources. World Soil Resources Report 84,FAO, Rome.
Goh, K.J. & Chew, P.S. (1997) Interpretations of analytical data from soil survey reports for manuring recommendations: some pointers. Annual Journal/Report, Royal Johore Planters’ Association, 25 – 30.
Hartley, C.W.S. (1988) The Oil Palm. (Tropical Agriculture Series) 3rd ed. Longman Scientific and Technical, Harlow, pp. 761.
IITA (1982) Automated and semi-automated methods for soil and plant analysis. Manual series No. 7. Ibadan (Nigeria). International Institute of Tropical Agriculture.
IRHO (1960) Institute de Researches pour les Huiles et Oleagineux Rapports annueles 1960.
Nelson, D. W. & Sommers, L.W. (1982) Total carbon, organic carbon and organic matter, In: Page, A.L., R.H. Miller, and D.R. Keeney. (eds.). Methods of Soil Analysis. 2. Chemical and Microbiological Properties. Agronomy 9, 301 – 312.
Noggle, J.C. & Engelstad O.P. (1972) Concentration of N and P in young corn plants as affected by application of fertilization. Society of Agronomy Journal. America 654, 384 – 388.
Owusu-Bennoah, E. Czilas, C. Hansen, H.C.B. & Borggaard, O.K. (1996) Phosphate sorption in relation to aluminium and iron oxides of Oxisols from Ghana. Communications in Soil Science and Plant Analysis 37, 94 – 105.
Owusu-Bennoah, E., Fardeau, J.C. & Zapata, F. (2000) Evaluation of biovailable phosphorus in some acid soils of Ghana using 32P isotopic exchange method. Ghana Journal of science 33, 139 – 146.
Rhoades, J.D. (1982) Exchangeable cations. In: AL Page. Methods of Soil Analysis Part 2 2nd ed. Agron. Monogr. 9. ASA and SSSA, Madison, Wis, 159 – 165.
Ukpebor E.E., Oviasogie P.O. & Unuigbe C.A. (2003) The distribution of Mn, Zn, Cu, Cr, Ni, and Pb around two major refuse dumpsites in Benin City, Nigeria. Pak. J. Sci. Ind. Res. 46 (6), 418 – 423.
USDA (2017) Production, Supply and Distribution (PS&D) database. http://www.fas.usda.gov/psdonline/psdHome.aspx
Assessment of nutrients status of areas...

14
Van der Vossen, H.A.M. (1969) Areas climatically suitable for optional oil palm production in the forest zone of Ghana. Ghana Journal of Agricultural Science 2, pp. 113.
Verheye, W. (2010) Growth and Production of Oil Palm. In: Verheye, W. (ed.), Land Use, Land Cover and Soil Sciences. Encyclopedia of Life Support Systems, UNESCO-EOLSS Publishers, Oxford, UK http://www.eolss.net
I. Danso et. al (2019) Ghana Jnl. Agric. Sci. 54 (2), 1 - 14