Embed Size (px)
Citation preview
i
Assessment of Methods to Collect and Analyze Perfluoroalkyl and Polyfluoroalkyl Substances (PFASs) in Air, Dust and Soil
Final Report
Agreement Number 19RD019
Principal Investigator: Asa Bradman, PhD, MS
Center for Environmental Research and Children’s Health
University of California - Berkeley
February 2021
Prepared for the California Air Resources Board (CARB)
Report Authors
Asa Bradman, PhD
Rosemary Castorina, PhD
Teja Pattabhiraman
Anuroop Nirula
Monice Wong, B.A.
Sion Calabretta
Center for Environmental Research and Children’s Health
University of California - Berkeley
1995 University Avenue, Suite 265
Berkeley, CA 94704
ii
Acknowledgements
The authors wish to thank the California Air Resources Board (CARB) for sponsoring this study and especially CARB staff members Dr. Yirui Liang and Patrick Wong. We also thank Randy Maddalena with the Energy Analysis & Environmental Impacts Division at LBNL and Gary Hunt, Principal Scientist with TRC Environmental Corporation, for their insightful comments and contributions to the report.
The statements and conclusions in this Report are those of the contractor and not necessarily those of the California Air Resources Board. The mention of commercial products, their source, or their use in connection with material reported herein is not to be construed as actual or implied endorsement of such products.

iii
Table of Contents
Executive Summary ................................................................................................................vii
Glossary of PFAS Terms and Abbreviations ......................................................................... x
Glossary of Other Terms, Abbreviations, and Symbols .......................................................xii
Body of Report ......................................................................................................................... 1
1 Introduction .......................................................................................................................... 1
2 Literature Review of PFAS Health Effects, Sources in Outdoor and Indoor Air, and Air Sampling and Analytic Methods (Task 1) ............................................................................... 2
2.1 Literature Review of PFAS Health Effects .................................................................... 2 2.1.1 Literature Search Strategy on Health Effect of PFASs ............................................... 2
2.2 Noncancer Health Effect of PFASs ............................................................................... 3 2.2.1 Pregnancy-induced hypertension/pre-eclampsia ....................................................... 3 2.2.2 Liver toxicity............................................................................................................... 4 2.2.3 High Cholesterol ........................................................................................................ 5 2.2.4 Thyroid disease ......................................................................................................... 5 2.2.5 Immunotoxicity .......................................................................................................... 6 2.2.6 Ulcerative colitis ........................................................................................................ 6 2.2.7 Noncancer Health Effects of PFASs in Children ........................................................ 7 2.2.7.1 Decreased birth weight ........................................................................................... 7 2.2.7.2 Dyslipidemia ........................................................................................................... 8 2.2.7.3 Excess adiposity, obesity ........................................................................................ 8 2.2.7.4 Immunity ................................................................................................................. 9 2.2.7.5 Asthma ................................................................................................................... 9 2.2.7.6 Renal function ........................................................................................................ 9 2.2.7.7 Age at menarche ...................................................................................................10
2.3 Carcinogenic Health Effects of PFASs ........................................................................10 2.3.1 Carcinogenicity .........................................................................................................10
2.4 PFAS Exposure to California Residents .....................................................................11 2.4.1 Dominant exposure pathways for different PFASs ....................................................11 2.4.2 Peer-reviewed Studies of PFAS Exposure among California Residents ...................12 2.4.3 Biomonitoring California Studies ...............................................................................16
2.5 Comparison of California PFAS exposure levels to NHANES ....................................19 2.5.1 California studies in adults compared to NHANES....................................................19 2.5.2 California studies in women compared to NHANES ..................................................22 2.5.3 Summary ..................................................................................................................24
2.6 Current California regulations of PFASs .....................................................................24 2.6.1 California Regulations of PFASs in Water ................................................................24 2.6.2 California’s Proposition 65 ........................................................................................26 2.6.3 California Regulations of PFASs in Air ......................................................................27 2.6.4 California Regulations of PFAS Use in Chrome Plating Operations ..........................28 2.6.5 Recent California Ban on PFASs Use in Firefighting Foams .....................................28 2.6.6 California Priority Products .......................................................................................29
3 Sources of PFASs in Outdoor & Indoor Air and the Potential for Long-Range Transport (Task 1B) ..................................................................................................................................29
iv
3.1 Potential for Long-range transport of PFASs and PFAS precursors .........................33 3.6.1 Contamination of Drinking Water Supplies ...............................................................34
3.2 PFAS Concentrations in Outdoor Air and Indoor Air ..................................................34 3.2.1 PFAS Levels in Outdoor Air ......................................................................................34 3.2.2 Rainwater and other environmental monitoring media as an indicator of PFAS emissions into the air .........................................................................................................37 3.2.3 PFAS Levels in Indoor Air (North American Studies) ................................................37 3.2.4 Fluorotelomer Levels in Indoor Air Samples .............................................................42
4 Evaluation of air sampling methods for PFAS compounds (Task 1C) ............................43
4.1 Overview .......................................................................................................................43
4.2 Active vs. Passive Air Sampling ..................................................................................44 4.2.1 Annular Diffusion Denuder Samplers ........................................................................44
4.3 PFAS Air Sampling Methods in Selected Studies .......................................................48
4.4 Equipment and Media Requirements for Air Monitoring Studies of Select PFASs ..50
4.5 Air Sample Volume, Recoveries and Detection Limits for Measuring PFASs..........51
4.6 Air Sampling Method / Media Effectiveness ................................................................54 4.6.1 Passive Air Sampling ................................................................................................54 4.6.2 Active Air Sampling ..................................................................................................55
4.7 Feasibility of PFAS Air Sampling Methods in Different Environments .....................56
4.8 US EPA Methods ...........................................................................................................57
4.9 Summary ........................................................................................................................57
5 Analytical Laboratory Methods for Analyzing PFASs in Air (Task 1D) ............................57
5.1 Overview ........................................................................................................................57
5.2 Description of Analytical Methods ...............................................................................59 5.2.1 Analysis of Volatile PFASs in Outdoor Air ................................................................59 5.2.2 Analysis of Ionic Compounds in Outdoor Air ............................................................60 5.2.3 Indoor Air Sample Analysis .......................................................................................61 5.2.4 Air Sample Extraction Methods.................................................................................62 5.2.5 Measuring ether-PFASs ...........................................................................................63 5.2.6 US EPA Methods for Measuring and Analyzing PFASs in Air Samples ....................63
6 Evaluate Sampling and Laboratory Analytical Methods for PFASs in Dust (Task 1E) ...64
6.1 Overview ........................................................................................................................64
6.2 PFAS levels in House Dust ...........................................................................................64
6.4 PFAS Levels in Child Care Facility Dust ......................................................................69
6.5 Sampling and Analytical Methods for Measuring PFASs in dust ..............................71 6.5.1 Dust Sampling Methods ...........................................................................................71 6.5.2 Dust Extraction .........................................................................................................75 6.5.3 Analytical Methods for Measuring PFASs in Dust .....................................................75
7 Evaluate Sampling and Laboratory Analytic Methods for PFASs in Soil (Task 1E) .......80
7.1 Concentrations of PFASs in Soil ..................................................................................80
v
7.2 Soil Sampling Methods for Measuring PFASs ..........................................................82 7.2.1 Soil Collection ...........................................................................................................82 7.2.2 Soil Extraction ..........................................................................................................82 7.2.3 Laboratory Analysis of PFASs in soil ........................................................................82
8 Summary and Recommendations ......................................................................................87
8.1 Measuring PFASs in Air ................................................................................................87 8.1.1 Air Sample collection methods..................................................................................87 8.1.1.1 HV-AAS and LV-AAS ............................................................................................87 8.1.1.2 Passive air samplers ............................................................................................88 8.1.1.3 Annular Denuder Samplers ..................................................................................89 8.1.1.4 Quality Control ......................................................................................................89 8.1.2 Air Sample Analysis ..................................................................................................89 8.1.2.1 Neutral/Volatile PFASs ..........................................................................................89 8.1.2.2 Ionic PFASs ...........................................................................................................90 8.1.2.3 Quality Control ......................................................................................................90
8.2 Measuring PFASs in Dust .............................................................................................90 8.2.1 Dust sample collection ..............................................................................................90 8.2.2 Dust Sample Extraction and Analysis .......................................................................91 8.2.3 Quality Control .........................................................................................................91
8.3 Measuring PFASs in soil ...............................................................................................91 8.3.1 Surface Soil Sample Collection.................................................................................91 8.3.2 Soil Sample Analysis ................................................................................................92 8.3.3 Quality Control .........................................................................................................93
8.4 General Recommendations ..........................................................................................93 8.4.1 Basic Research Needs for Collecting and Analyzing PFASs in Air Samples .............93
8.5 Future Directions/General Recommendations ......................................................94
References ..............................................................................................................................96
Tables
Table 1. Summary of PFAS exposure studies among California residents published in peer-reviewed journal articles. ...........................................................................................................14
Table 2. Biomonitoring California studies: PFAS exposures to California residents ..................18
Table 3. Median serum concentrations of PFASs in adults from NHANES and Biomonitoring California exposure studies (ng/mL) ..........................................................................................20
Table 4. Median serum concentrations of PFASs in women from NHANES and CA exposure studies (ng/mL) .........................................................................................................................23
Table 6. US EPA oral RfD’s for PFOA & PFOS and proposed RfD’s for GenX and PFBS ........27
Table 7. Vapor pressure at 25o C for selected PFASs (experimental and predicted) .................31
Table 8. Mean outdoor Air PFAS concentrations in U.S studies published in 2004-05 (pg/m3) .35
Table 9. Outdoor air PFAS concentrations in US studies published in 2007 (pg/m3) .................36
Table 10. PFASs in air in office spaces, carpet shops and textile shops in the US (ng/m3) .......40
vi
Table 11. PFAS concentrations in indoor air (ng/m3) ................................................................41
Table 12. Correlations among fluorotelomers in indoor air (n=84). ............................................42
Table 13. Air sampling methods terminology ............................................................................43
Table 14. Overview of air sampling techniques for measuring PFASs ......................................46
Table 15. Summary of air sampling media effectiveness for measuring gas- and particle-phase PFASs ......................................................................................................................................50
Table 16. Summary of air sample volumes and detection limits from selected studies ..............53
Table 17. Analytical method abbreviations ................................................................................58
Table 18. Methods analyzing volatile PFASs in outdoor air.......................................................60
Table 19. Methods analyzing ionic PFASs in outdoor air ..........................................................61
Table 20. Methods for analyzing PFASs in indoor air samples .................................................62
Table 21. Extraction methods for measuring volatile and ionic PFASs ......................................63
Table 22. US EPA PFAS air measurement and analysis methods in progress .........................64
Table 23. Summary of PFASs and PFAA precursor concentrations (ng/g) in dust found in US and Canadian homes. ...............................................................................................................66
Table 24. Comparison of PFAS concentrations (ng/g) found in fire station and house dust. .....68
Table 25. Summary of PFAS concentrations (ng/g) in dust found in US childcare studies. .......70
Table 26. Summary of sampling and analytical methods for measuring PFASs in dust (US and Canadian studies). ....................................................................................................................72
Table 27. Summary of analytical methods for measuring ionic PFASs in dust (US and Canadian studies) .....................................................................................................................................76
Table 28. Summary of extraction methods used for measuring neutral PFASs in dust (US and Canadian studies). ....................................................................................................................78
Table 29. Summary of PFAS concentrations in soil (ng/g) found in US studies.........................81
Table 30. Summary of sampling and analytical methods for measuring PFASs in soil (US and Canadian studies) .....................................................................................................................84
Figures
Figure 1. Median PFAS serum levels compared to NHANES (ng/mL) - All adults ....................21
Figure 2. Median PFAS serum levels compared to NHANES (ng/mL) - Women only ...............24
Figure 3. Average air concentrations using LV-AAS (gas- and particle-phase), HV-AAS (gas and particle-phase), SIP-PAS and PUF-PAS for PFASs (Arhens et al. 2013) ..................................48
Figure 4. PFOS, PFOA, 8:2 FTOH, and MeFOSE concentrations in air measured by four different sampling techniques over one year: HV-AAS, LV-AAS, SIP-PAS and PUF-PAS (Arhens et al. 2013). .................................................................................................................56
vii
Executive Summary
Perfluoroalkyl and polyfluoroalkyl substances (PFASs) comprise a class of over 4,000 human-made chemicals that are commonly used in consumer products and industrial applications due to their water- and lipid-repellent characteristics. PFASs have been used for decades in a wide array of products, including food packaging materials, nonstick cookware, fire-fighting foams, waxes, furniture, stain-repellant fabrics, carpets and pesticides.
In the early 2000s, perfluorooctanoic acid (PFOA) and perfluorooctanesulfonic acid (PFOS), considered “long-chain” PFASs because of their eight carbon structure, were voluntarily phased out by US manufactures due to environmental and human health concerns, leading to a decline in their use. The continued use of substitute PFASs, however, and the highly persistent nature and mobility of these compounds has resulted in ongoing environmental PFAS contamination and human exposure throughout California. These compounds may be airborne, settle into dust or soil, or be present in drinking water. Consequently, human exposure may occur through inhalation, ingestion of contaminated drinking water, or non-dietary ingestion when present in residential environments, the latter of which is typically seen among young children due to hand-to-mouth behaviors. As in the general US population, there is widespread PFAS exposure in California. We identified over a dozen studies reporting detectable levels of PFASs in serum from California residents, including several large studies conducted by Biomonitoring California, a collaborative program between the California Department of Public Health (CDPH), California Environmental Protection Agency’s (Cal/EPA's) Office of Environmental Health Hazard Assessment (OEHHA) and Department of Toxic Substances Control.
Following a review of the available scientific literature, we found that there is ample evidence to demonstrate that exposure to PFASs can lead to adverse health effects in humans. In this White Paper, we summarized the epidemiological evidence for the health outcomes identified by the US EPA, C8 Science Panel, ASTDR, and recent systematic reviews of the literature. The International Agency for Research on Cancer (IARC) and the United States (US) Environmental Protection Agency (EPA) have classified certain PFASs as possibly carcinogenic to humans, and OEHHA has listed PFOS and PFOA as a Proposition 65 developmental toxicants.
Despite the wide variety of chemicals that are classified as PFASs, only PFOA and PFOS have been studied extensively for their toxicity and fate and transport in the environment. While there has been extensive monitoring of drinking water for PFASs in California, the relative lack of data on PFAS levels in air, soil, and dust makes linking PFAS sources to levels in environmental media and human exposure pathways challenging.
Several California agencies have recently taken steps to better understand and prevent PFAS exposures from environmental media, including new monitoring and notification water standards set by the California Water Resources Control Board. The California Air Resources Board (CARB) and other agencies that are concerned about emissions of these chemicals have been hampered in their response due to the lack of a standardized methodology for measuring PFASs in outdoor air.
Methods
For this project, we reviewed published scientific literature and summarized the fate and transport of PFASs in key environmental media, as well as Californians’ exposures to these
viii
materials. We solicited input from scientists currently involved in PFAS research to identify current methods used to measure PFASs in outdoor and indoor air samples, soil, and dust. In order to complete our assessment, we reviewed available scientific literature and government reports detailing current methods for collecting and analyzing these media for PFASs. We analyzed and summarized these methods to evaluate best practices for sample collection, extraction, and analysis.
Results and Recommendations
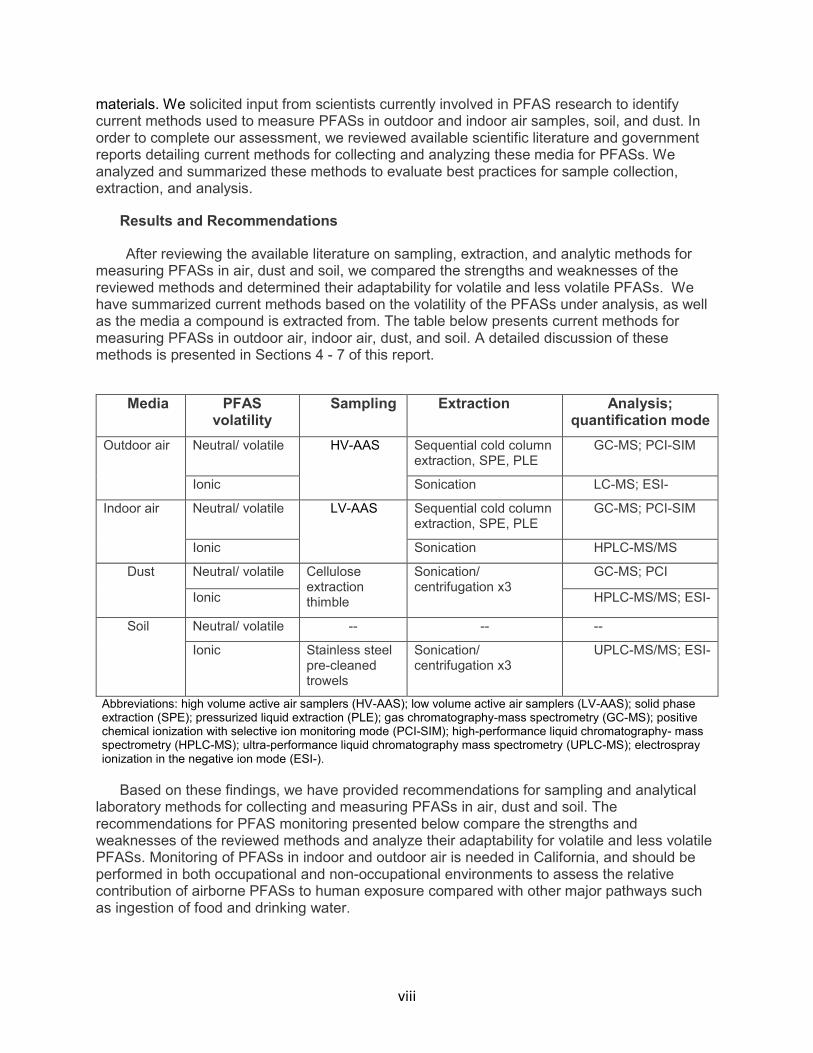
After reviewing the available literature on sampling, extraction, and analytic methods for measuring PFASs in air, dust and soil, we compared the strengths and weaknesses of the reviewed methods and determined their adaptability for volatile and less volatile PFASs. We have summarized current methods based on the volatility of the PFASs under analysis, as well as the media a compound is extracted from. The table below presents current methods for measuring PFASs in outdoor air, indoor air, dust, and soil. A detailed discussion of these methods is presented in Sections 4 - 7 of this report.
Media PFAS volatility
Sampling Extraction Analysis; quantification mode
Outdoor air Neutral/ volatile HV-AAS Sequential cold column extraction, SPE, PLE
GC-MS; PCI-SIM
Ionic Sonication LC-MS; ESI-
Indoor air Neutral/ volatile LV-AAS Sequential cold column extraction, SPE, PLE
GC-MS; PCI-SIM
Ionic Sonication HPLC-MS/MS
Dust Neutral/ volatile Cellulose extraction thimble
Sonication/ centrifugation x3
GC-MS; PCI
Ionic HPLC-MS/MS; ESI-
Soil Neutral/ volatile -- -- --
Ionic Stainless steel pre-cleaned trowels
Sonication/ centrifugation x3
UPLC-MS/MS; ESI-
Abbreviations: high volume active air samplers (HV-AAS); low volume active air samplers (LV-AAS); solid phase extraction (SPE); pressurized liquid extraction (PLE); gas chromatography-mass spectrometry (GC-MS); positive chemical ionization with selective ion monitoring mode (PCI-SIM); high-performance liquid chromatography- mass spectrometry (HPLC-MS); ultra-performance liquid chromatography mass spectrometry (UPLC-MS); electrospray ionization in the negative ion mode (ESI-).
Based on these findings, we have provided recommendations for sampling and analytical laboratory methods for collecting and measuring PFASs in air, dust and soil. The recommendations for PFAS monitoring presented below compare the strengths and weaknesses of the reviewed methods and analyze their adaptability for volatile and less volatile PFASs. Monitoring of PFASs in indoor and outdoor air is needed in California, and should be performed in both occupational and non-occupational environments to assess the relative contribution of airborne PFASs to human exposure compared with other major pathways such as ingestion of food and drinking water.
ix
Due to the ubiquitous presence of PFASs in our environment, sampling methods should include protocols to minimize sampling artifacts and analysis of field blanks, as well as duplicate or co-located samples. Further, extraction and analytic laboratory equipment should be pre-tested for contamination. For all media, extensive quality assurance and quality control (QA/QC) sample analyses, including method blanks, solvent/double blanks, and spiked QC samples, is recommended.
In addition, we recommend new studies monitoring PFASs and PFAS precursors in rainwater. Because of the relatively high water solubility of many short chain PFASs, monitoring their presence in rainwater and other media, such as snow and lake water, would provide a novel indicator of emissions and deposition in the environment. Recent studies show high detection frequencies of PFASs measured in rainwater in the Eastern US, highlighting the potential for medium and long-range transport and the utility of measuring PFASs in this environmental media.
Given the potential for long-range transport of PFASs, outdoor air monitoring should be conducted in both urban, rural, and undeveloped areas, including national and state parks and forested lands, to determine whether PFAS emissions from developed areas are contributing to contamination in California wilderness lands and watersheds providing drinking water to California residents and impacting wildlife.
Conclusions
The information summarized in this report will inform development of standardized methods for sampling, extraction, and analysis of PFASs in air, dust and soil. By identifying best practices to measure PFASs in our environment, CARB can develop monitoring and research programs to determine the fate and transport of PFAS compounds and assess human exposures and health risks from these ubiquitous chemicals and ultimately protect public health in our State.
x
Glossary of PFAS Terms and Abbreviations
Acronym Description
Perfluoroalkyl acids (PFAAs)
PFCAs Perfluoroalkyl carboxylic acids
PFBA Perfluorobutyric acid (C4)
PFPeA Perfluoropentanoic acid (C5)
PFHxA Perfluorohexanoic acid (C6)
PFHpA Perfluoroheptanoic acid (C7)
PFOA Perfluorooctanoic acid (C8)
PFNA Perfluorononanoic acid (C9)
PFDA Perfluorooctadecanoic acid (C10)
PFUnDA Perfluoroundecanoate (C11)
PFDoDA Perfluorododecanoic acid (C12)
PFTrDA Perfluorotridecanoic acid (C13)
PFTeDA Perfluorotetradecanoic acid (C14)
PFPeDA Perfluoropentadecanoic acid (C15)
PFHxDA Perfluorohexadecanoic acid (C16)
PFHpDA Perfluoroheptadecanoic acid (C17)
PFODA Perfluorooctadecanoic acid (C18)
PFSAs Perfluoroalkane sulfonic acids
PFBS Perfluorobutane sulfonic acid (C4)
PFPeS Perfluoropentane sulfonic acid (C5)
PFHxS Perfluorohexane sulfonic acid (C6)
PFHpS Perfluoroheptane sulfonic acid (C7)
PFOS Perfluorooctane sulfonic acid (C8)
PFNS Perfluorononane sulfonic acid (C9)
PFDS Perfluorodecane sulfonic acid (C10)
PFUnDS Perfluoroundecane sulfonic acid (C11)
PFDoDS Perfluorododecane sulfonic acid (C12)
(n:2) Fluorotelomer sulfonic acids (FTSAs)
4:2 FTSA 4:2 fluorotelomer sulfonic acid
6:2 FTSA 6:2 fluorotelomer sulfonic acid
8:2 FTSA 8:2 fluorotelomer sulfonic acid
Precursor compounds (Neutral PFASs)
FTOHs (n:2) Fluorotelomer alcohols
4:2 FTOH 4:2-Fluorotelomer alcohol
6:2 FTOH 6:2-Fluorotelomer alcohol
FTACs (n:2) Fluorotelomer acrylates
4:2 FTAC 4:2 Fluorotelomer acrylate
6:2 FTAC 6:2 Fluorotelomer acrylate
8:2 FTAC 8:2 Fluorotelomer acrylate
xi
Acronym Description
FTMACs (n:2) Fluorotelomer methacrylates
4:2 FTMAC 4:2 Fluorotelomer methacrylate
6:2 FTMAC 6:2 Fluorotelomer methacrylate
8:2 FTMAC 8:2 Fluorotelomer methacrylate
Perfluoroalkane sulfonamides (FASAs)
FHxSA Perfluorohexane sulfonamide
FHpSA Perfluoroheptane sulfonamide
FOSA Perfluorooctane sulfonamide
Perfluoroalkane sulfonamido ethanol
FOSE Perfluorooctane sulfonamidoethanol
N-Alkyl perfluoroalkane sulfonamidoacetic acids (FASAAs)
MeFOSAA N-methyl perfluorooctane sulfonamidoacetic acid
EtFOSAA N-ethyl perfluorooctane sulfonamidoacetic acid
N-Alkyl perfluoroalkane sulfonamides
EtFOSA Ethyl perfluorooctane sulfonamide
MeFOSA Methyl perfluorooctane sulfonamide
Perfluoroalkane sulfonamido ethanols (FASEs)
EtFOSE N-Ethylperfluorooctane sulfonamide ethanol
MeFOSE N-Methylperfluorooctane sulfonamide ethanol
n:2 Polyfluoroalkyl phosphoric acid esters
6:2 diPAP 6:2 Fluorotelomer phosphate diester
8:2 diPAP 8:2 Fluorotelomer phosphate diester
10:2 diPAP 10:2 Fluorotelomer phosphate diester
FTUCAs Fluorotelomer unsaturated carboxylic acids
Source: Buck et al. 2011 Supplemental data
xii
Glossary of Other Terms, Abbreviations, and Symbols
Acronym Description
ATSDR Agency for Toxic Substances and Disease Registry
bgs Below ground surface oC Degree Celsius
CARB California Air Resource Board
DL Detection limit
GC Gas chromatography
GM Geometric mean
IARC International Agency for Research on Cancer
LOD Limit of detection
LOQ Limit of quantification
MDL Method detection limit
MS Mass spectroscopy
NIST SRM National Institute of Standards and Technology Standard Reference Materials
NHANES National Health and Nutrition Examination Survey
OEHHA Office of Environmental Health Hazard Assessment
PLE Pressurized liquid extraction
PM Particulate matter
PM10 Particulate matter with an aerodynamic diameter of less than or equal to 10 micrometers or microns
PM2.5 Particulate matter with an aerodynamic diameter of less than or equal to 2.5 micrometers or microns
psi Pounds per square inch
QA/QC Quality Assurance and Quality Control
REL Reference Exposure Level
RfC Reference Concentrations
RfD Reference Dose
SD Standard Deviation
SIM Selective Ion Monitoring
SOP Standard Operating Procedure
SPE Solid Phase Extraction
SRS Surrogate Recovery Standards
SVOC Semi- Volatile Organic Compounds
US EPA United States Environmental Protection Agency
μg Microgram
mL Milliliter
ng Nanogram
ppt Parts per trillion
UPLC Ultra Performance Liquid Chromatography
VOC Volatile Organic Compound
1
Body of Report
1 Introduction
Perfluoroalkyl and polyfluoroalkyl substances (PFASs) are a class of pollutants including more than 3,000 human-made, fluorinated, organic chemicals (Buck et al. 2011; Wang et al. 2017). The actual number of compounds in commerce is continuously changing as some PFASs are phased out due to regulatory and voluntary actions, while new ones are created as alternatives. The majority of PFASs are not intentionally made or used in commerce but are degradation products of the PFASs used in commerce. Often called “forever chemicals,” the carbon-fluorine bond in PFASs is one of the strongest bonds in nature. This structural stabilization conveys useful attributes for industrial processes and consumer products, but they are resistant to thermal, chemical, and biological degradation, resulting in prolonged environmental persistence. PFASs have been used in many different products, including food packaging materials, nonstick cookware, fire-fighting foams, waxes, furniture, and pesticides (Buck et al. 2011; ATSDR 2018; Susmann et al. 2019).
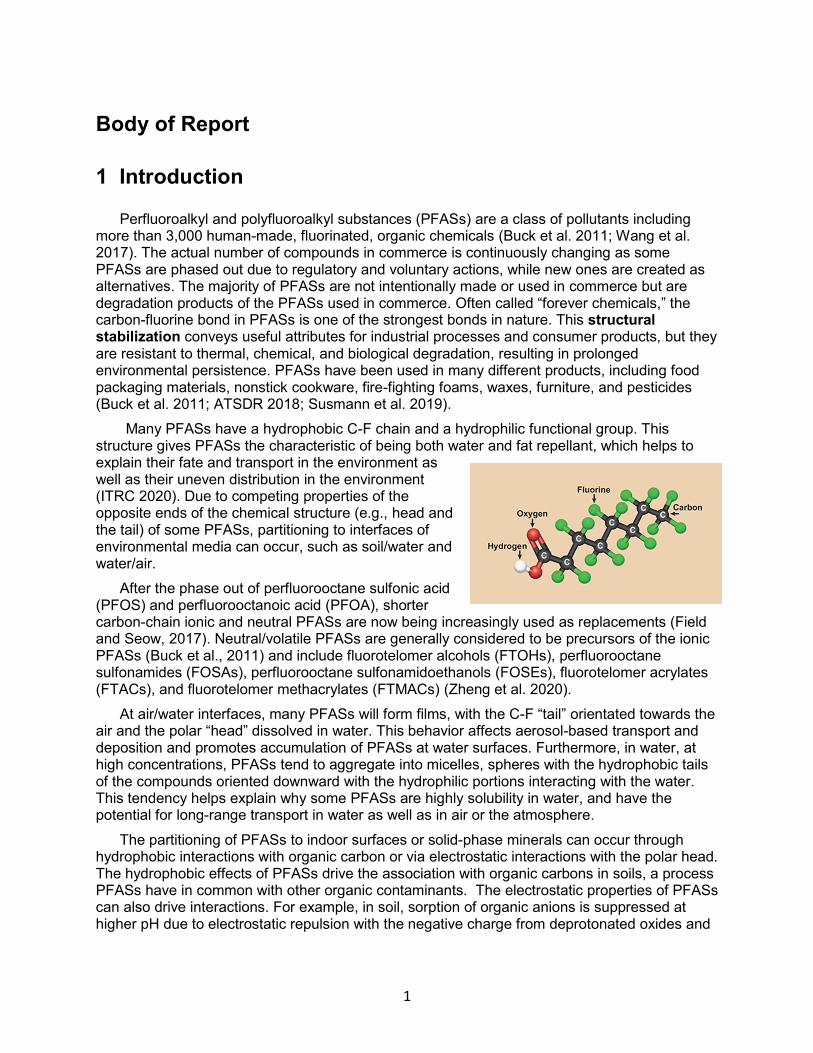
Many PFASs have a hydrophobic C-F chain and a hydrophilic functional group. This structure gives PFASs the characteristic of being both water and fat repellant, which helps to explain their fate and transport in the environment as well as their uneven distribution in the environment (ITRC 2020). Due to competing properties of the opposite ends of the chemical structure (e.g., head and the tail) of some PFASs, partitioning to interfaces of environmental media can occur, such as soil/water and water/air.
After the phase out of perfluorooctane sulfonic acid (PFOS) and perfluorooctanoic acid (PFOA), shorter carbon-chain ionic and neutral PFASs are now being increasingly used as replacements (Field and Seow, 2017). Neutral/volatile PFASs are generally considered to be precursors of the ionic PFASs (Buck et al., 2011) and include fluorotelomer alcohols (FTOHs), perfluorooctane sulfonamides (FOSAs), perfluorooctane sulfonamidoethanols (FOSEs), fluorotelomer acrylates (FTACs), and fluorotelomer methacrylates (FTMACs) (Zheng et al. 2020).
At air/water interfaces, many PFASs will form films, with the C-F “tail” orientated towards the air and the polar “head” dissolved in water. This behavior affects aerosol-based transport and deposition and promotes accumulation of PFASs at water surfaces. Furthermore, in water, at high concentrations, PFASs tend to aggregate into micelles, spheres with the hydrophobic tails of the compounds oriented downward with the hydrophilic portions interacting with the water. This tendency helps explain why some PFASs are highly solubility in water, and have the potential for long-range transport in water as well as in air or the atmosphere.
The partitioning of PFASs to indoor surfaces or solid-phase minerals can occur through hydrophobic interactions with organic carbon or via electrostatic interactions with the polar head. The hydrophobic effects of PFASs drive the association with organic carbons in soils, a process PFASs have in common with other organic contaminants. The electrostatic properties of PFASs can also drive interactions. For example, in soil, sorption of organic anions is suppressed at higher pH due to electrostatic repulsion with the negative charge from deprotonated oxides and
2
other functional groups present on the soil surface. Cations on the other hand, can sorb well to soils (ITRC 2020).
PFAS contamination poses sampling and analytical challenges. PFASs have unique chemical and physical properties, and they often occur in complex mixtures that can change over time. Very low concentrations of several different classes of PFASs must be sampled and analyzed simultaneously to assess their presence in environmental media. Currently, however, analytical standards and methods for quantifying most PFASs are lacking. Because PFASs are ubiquitous in the environment, special care must be taken to guard against contamination of sampling materials and analytical media, and thus actual environmental levels may be difficult to ascertain. To date, there is limited published research or guidance on how certain materials used by field staff affect sample results (ITRC 2020; Michigan Department of Environmental Quality 2018).
Well-established methods for sampling and analysis of many PFASs in water currently exist. In this report, we focus on other environmental media (outdoor and indoor air, soil and dust).Our primary aim is to provide a well-rounded understanding of the behavior of PFASs within different media as well as recommendations for sample collection and analytical laboratory methods. We first present a summary of the literature on PFAS exposure and specific health effects (cancer and noncancer), followed by a summary of California PFAS regulations. Second, we summarize the potential sources and concentrations of PFASs measured in outdoor and indoor air and assess their potential for long-range transport. Third, we provide an evaluation of air sampling methods based on multiple literature sources, describing active and passive sampling, sampling media and equipment requirements. We also review analytical methods for measuring PFASs in air, discussing the volatile and ionic differences between PFASs and what this means for extraction methods. In Chapters 6 and 7, we provide an overview of sampling and laboratory methods for measuring PFASs in dust and soil. In the final chapter of the report, we present recommendations for sample collection methods and laboratory analysis for PFASs in air, dust and soil.
2 Literature Review of PFAS Health Effects, Sources in Outdoor and Indoor Air, and Air Sampling and Analytic Methods (Task 1)
2.1 Literature Review of PFAS Health Effects
2.1.1 Literature Search Strategy on Health Effect of PFASs
For this section, we reviewed the Agency for Toxic Substances and Disease Registry’s (ATSDR) 2018 Toxicological Profile for Perfluoroalkyls, documents from the C8 Science Panel, and evaluations by the California Office of Environmental Health Hazard Assessment (ATSDR 2018; C8 Science Panel 2012; OEHHA 2019). From 2005-2013, the C8 Science Panel carried out exposure and health studies in the Mid-Ohio Valley communities, which had been potentially affected by the releases of PFOA (or C8) emitted since the 1950s from the Washington Works plant in Parkersburg, West Virginia. We also performed a review of the published scientific literature using PubMed (National Library of Medicine) (https://www.ncbi.nlm.nih.gov/pubmed) and Google Scholar (https://scholar.google.com) to identify cancer and noncancer health effects of PFAS exposure. Relevant studies and review articles published in peer-reviewed journals
3
were also identified from reference lists of individual articles. Results of all searches were uploaded to Endnote 8.0.
2.2 Noncancer Health Effect of PFASs
Investigations of health outcomes have primarily focused on exposure to PFOA and PFOS. Based on the current peer-reviewed toxicological and human epidemiological studies, the US EPA has reported that exposure to PFOA and PFOS is associated with adverse developmental outcomes in children (e.g., low birth weight, accelerated puberty, skeletal variations), cancer (e.g., testicular, kidney), changes in liver function (e.g., increased liver enzymes), poorer immune function (e.g., decreased vaccine response), thyroid effects, and metabolic changes (e.g., cholesterol changes) (US EPA 2016a, 2016b).
The most comprehensive study examining the human health impacts of PFASs is known as the C8 Health Project, which is a long-term study that focused on the population living near the DuPont Washington Works fluorotelomer plant in West Virginia. In 2012, the C8 Science Panel determined that there were probable links between PFOA exposure and six diseases: pregnancy-induced hypertension, thyroid disease, high cholesterol, ulcerative colitis and kidney and testicular cancer (C8 Science Panel 2012; Steenland et al. 2020; Sunderland et al. 2019).
In a 2018 toxicological profile of perfluoroalkyls, the Agency for Toxic Substances and Disease Registry (ATSDR) concluded that the available epidemiologic studies suggest associations between perfluoroalkyl exposure and the following health outcomes (ATSDR 2018):
• Pregnancy-induced hypertension/pre-eclampsia (PFOA, PFOS)
• Liver damage, as evidenced by increases in serum enzymes and decreases in serum bilirubin levels (perfluorohexane sulfonate (PFHxS), PFOA, PFOS)
• Increases in serum lipids, particularly total cholesterol and low-density lipoprotein (LDL) cholesterol (PFOA, PFOS, perfluorononanoic acid (PFNA), perfluorooctadecanoic acid (PFDA))
• Increased risk of thyroid disease (PFOA, PFOS)
• Decreased antibody response to vaccines (PFHxS, PFOA, PFOS, PFDA)
• Increased risk of asthma diagnosis (PFOA)
• Increased risk of decreased fertility (PFOA, PFOS)
• Small decreases in birth weight (PFOA, PFOS)
The epidemiological evidence for the health outcomes identified by the US EPA, C8 Science Panel, ASTDR and recent systematic reviews of the literature are summarized in the sections below.
2.2.1 Pregnancy-induced hypertension/pre-eclampsia
Several studies have examined the possible associations between PFOA and PFOS and pregnancy-induced hypertension/pre-eclampsia. According to the ATSDR, “There is suggestive epidemiological evidence for an association between serum PFOA and PFOS and pregnancy-induced hypertension and/or pre-eclampsia. Studies of highly exposed residents provide some suggestive evidence of an association between serum PFOA and increased risks of pregnancy-
4
induced hypertension/pre-eclampsia.” In a 2012 study, researchers found an increased risk of self-reported pre-eclampsia in C8 Health Project participants with elevated PFOA levels (Savitz et al. 2012). Another study of C8 Health Project participants reported statistically significant associations between serum PFOA levels (≥6.9 ng/mL) and pregnancy-induced hypertension (odds ratios = 1.27 and 1.47 for PFOA and PFOS, respectively) (Darrow et al. 2013). A third study of highly exposed residents also reported a weak association between serum PFOA and pre-eclampsia (Stein et al. 2009).
Some recent studies have provided supportive evidence of an association between other PFASs and pre-eclampsia. For example, as part of the Swedish SELMA study, eight PFASs were measured at ~10 weeks gestation and cases of pre-eclampsia were postnatally identified from registers. A doubling of PFOS and PFNA exposure was associated with an increased risk for pre-eclampsia, and participants with serum PFOS in the highest quartile had 2.7 higher odds of the disease compared with those with lower exposure (Wikstrom et al. 2019). In Shanghai, China, Huang et al. reported that prenatal exposure to perfluorobutane sulfonic acid (PFBS) was positively associated with higher risk of pre-eclampsia and overall hypertensive disorders during pregnancy (Huang et al. 2019). Another recent study examined the relationship between background levels of PFHxS, PFOA, PFOS and the development of gestational hypertension or pre-eclampsia in a Canadian pregnancy cohort (Borghese et al. 2020). Higher levels of PFHxS were associated with development of pre-eclampsia, but not gestational hypertension. Neither PFOA nor PFOS were associated with either outcome. A study of Norwegian women with background levels of PFAS exposure did not find an association between plasma levels of seven PFASs (PFOA, PFNA, PFDA, perfluoroundecanoate (PFUnDA), PFHxS, perfluoroheptane sulfonic acid (PFHpS) or PFOS) and increased risk of pre-eclampsia (Starling et al. 2014).
Overall, despite some inconsistencies, these studies suggest associations between PFAS exposure and pregnancy-induced hypertension/pre-eclampsia (PFOA, PFOS) confirmed by the ATSDR review (ATSDR 2018).
2.2.2 Liver toxicity
In 2012, the C8 Science Panel concluded there was sufficient support for a causal association between PFOA and increased serum levels of the liver enzyme alanine transferase (ALT), a marker of hepatocellular damage. This association has been observed in populations with high occupational exposures (C8 Science Panel 2012; Sakr et al. 2007a; Sakr et al. 2007b), in populations experiencing background level exposures such as NHANES (Gleason et al. 2015; Jain and Ducatman 2019; Lin et al. 2010), and in the community living near the DuPont Washington Works chemical manufacturing plant in Parkersburg, West Virginia (Darrow et al. 2016; Gallo et al. 2012). A recent study, using environmental fate and transport models and participant residential histories to characterize exposure, found that cumulative serum PFOA levels were positively associated with ALT levels, indicating possible liver toxicity (Darrow et al. 2016). Overall, these findings were consistent with previous studies indicating an association between PFOA and ALT. These researchers did not, however, find evidence that PFOA increases the risk of clinically diagnosed liver disease. Similar conclusions were reported in a recent review article by Streenland et al. (2020).
In the US EPA 2016 Health Effects Support Document for PFOA, the Agency concluded, “Associations between serum PFOA concentrations and elevations in serum levels of alanine aminotransferase (ALT) and gamma-glutamyl transpeptidase (GGT) were consistently observed in occupational cohorts, the high-exposure community, and the US general population. The
5
associations are not large in magnitude, but indicate the potential for PFOA to affect liver function” (US EPA 2016a).
2.2.3 High Cholesterol
Several studies have reported increased cholesterol levels among populations highly exposed to PFOS and PFOA (Nelson et al. 2010; Steenland et al. 2009; Winquist and Streenland 2014). One study investigated the association between plasma PFOA and PFOS and total cholesterol in a general, middle-aged Danish population and reported statistically significant positive associations between perfluorinated compounds and total cholesterol (Eriksen et al. 2013). In a recent large cross sectional study of a highly exposed population in Italy, researchers reported strong positive associations between PFHxS, PFOA and PFOS and total cholesterol, high-density lipoprotein cholesterol, and low-density lipoprotein cholesterol, and between PFHxS and PFOA and triglycerides (Canova et al. 2020). The largest increases in cholesterols were seen at the lowest PFAS concentrations. In a 2020 review article, Steenland et al. concluded “there is relatively consistent evidence of modest positive associations with lipid profiles such as total cholesterol and triglycerides, although the magnitude of the cholesterol effect is inconsistent across different exposure levels” (Steenland et al. 2020).
2.2.4 Thyroid disease
Hormones that regulate thyroid homeostasis, including thyroid stimulating hormone (TSH), triiodothyronine (T3), and thyroxine (T4), are essential in a variety of human physiological functions including metabolism and growth and development (ATSDR 2018). Toxicology studies have observed thyroid hormone imbalance in both adult and neonate rats treated with PFOS (Lau et al. 2007). According to ATSDR (ATSDR 2018), epidemiology studies provide suggestive evidence of a link between serum PFOA and PFOS and an increased risk of thyroid disease. Using data from the US National Health and Nutrition Examination Survey (NHANES), Melzer et al. (2010) analyzed the association of PFOA and PFOS exposure with thyroid disease status among 3974 adults. They found that women with higher serum PFOA concentrations were more likely to report current treated thyroid disease than women with lower serum PFOA concentrations (odds ratio = 2.24), and a similar trend among men for both PFOA and PFOS (OR= 2.12 and 2.68, respectively) (Melzer et al. 2010).
Lewis et al. (2015) examined the relationship between serum PFASs and serum testosterone, TSH, and free and total triiodothyronine (FT3, TT3) and thyroxine (FT4, TT4) among males and females 12 to 80 years of age from the 2011–2012 NHANES cycle. Their findings suggest that PFAS exposure disrupts thyroid hormone homeostasis (Lewis et al. 2015). A systematic review by Ballesteros et al. supported a positive association between maternal or teenage male exposure to some PFASs and TSH levels but noted that the small number of studies with comparable data limited the strength of the evidence and recommended further studies (Ballesteros et al. 2017). In another study, several PFASs, including PFOA and PFNA also found suggestive associations, with stronger results in women (Byrne et al. 2017).
The principal publication from the C8 Science Panel examining the effects of PFOA exposures on thyroid function found that “associations were observed for hyperthyroidism and hypothyroidism among women. Some subanalyses also suggested an increased hazard of hypothyroidism among men (Winquist and Streenland 2014b). Overall, these researchers concluded that “higher PFOA exposure was associated with incident functional thyroid disease in this large cohort with high exposure.” However, in a further review of results from C8 Health Project epidemiologic studies investigating potential associations between PFOA exposure and thyroid hormone disruption, Steenland et al. concluded that, “while a number of studies have
6
suggested associations between thyroid hormones and PFOA in cross-sectional analyses, in our view there is little consistency across studies so evidence for a causal impact on thyroid hormones remains weak” (Steenland et al. 2020).
Overall, multiple studies have suggested that PFOA and PFOS act as endocrine-disrupting chemicals and have found inverse associations between exposure levels and thyroid functioning (ATSDR 2018). Little research has been done to investigate the association between other compounds in the PFAS family and thyroid functioning.
2.2.5 Immunotoxicity
Many toxicological and human epidemiological studies have examined links between PFOA exposure and immunotoxicity related to both immunosuppression (e.g., vaccine response, infection) and hypersensitivity (e.g., asthma, allergy). In 2016, the National Toxicology Program published a systematic review of the association between immunotoxicity and exposure to PFOA or PFOS (NTP 2016). NTP identified three primary outcomes of concern with respect to PFAS-induced immunotoxicity in humans: 1) immunosuppression (e.g., otitis, infections, or decreased vaccine antibody response); 2) hypersensitivity-related outcomes (e.g., atopic dermatitis, asthma, total IgE, rhinitis); and 3) autoimmunity (e.g., thyroiditis or ulcerative colitis). NTP concluded “PFOA is presumed to be an immune hazard to humans based on a high level of evidence that PFOA suppressed the antibody response from animal studies and a moderate level of evidence from studies in humans… there is additional, although weaker, evidence that is primarily from epidemiological studies that PFOA reduced infectious disease resistance [and] increased hypersensitivity-related outcomes” (NTP 2016). According to the ATSDR, “Evidence is suggestive of a link between serum PFOA, PFOS, PFHxS, and PFDeA levels and decreased antibody responses to vaccines. A possible link between serum PFOA levels and increased risk of asthma diagnosis has also been found” (ATSDR 2018).
A recent Danish study examined serum levels of PFBA, PFHxS, PFOS, PFOA and PFNA in individuals aged 30-70 years with known SARSCoV-2 infection (Grandjean et al. 2020). This study reported significant associations between elevated plasma-PFBA concentrations and increased risk of more severe course of COVID-19. Among the five PFASs considered, perfluorobutanoic acid (PFBA) showed an odds ratio (OR) of 2.19 (95% confidence interval, CI, 1.39-3.46) for increasing severities of the disease, although the OR decreased to 1.77 (95% CI, 1.09, 2.87) after adjustment for age, sex, sampling site and interval between blood sampling and diagnosis. PFBA has a short elimination half-life in the blood and is often considered of less importance to health compared to longer chain PFASs, however, PFBA has been shown to accumulate in the lungs based on tissue samples from autopsies (Pérez et al. 2013) and SARSCoV-2 is primarily a lung disease promotant. In this study, none of the other PFAS serum levels were associations with severity of COVID-19 (Grandjean et al. 2020).
2.2.6 Ulcerative colitis
Inflammatory bowel diseases (IBDs) are disorders that involve chronic inflammation of organs of the digestive tract. Ulcerative colitis is an IBD affecting the inner lining of the colon and rectum through long-lasting inflammation and ulcers. The C8 Science Panel found a strong positive relationship between PFOA exposure and incidence of ulcerative colitis (C8 Science Panel 2012; Steenland et al. 2013). An increased risk of ulcerative colitis was also found in a cohort with more than 3,000 workers (Steenland et al. 2015). In a more recent study, Steenland et al. (2018) found that PFOA levels were 38% higher than those among combined group of Crohn's patients and controls. Conversely, the other three PFASs measured, PFHxS, PFOS and PFNA were significantly higher among Crohn's cases and controls versus ulcerative colitis

7
cases (Steenland et al. 2018). In this case-control study, ulcerative colitis was inversely associated with serum PFHxS and PFOS, and positively, but more weakly, with PFOA, in a population with generally low PFAS levels (i.e., medians in control group: PFOA=1.3 ng/mL; PFHxS=1.6 ng/ml; and PFOS=4.2 ng/ml).
A recent study investigated the association of multiple PFASs and clinically diagnosed IBD in a Swedish population with high exposure from drinking water, particularly PFOS and PFHxS (Xu et al. 2020). Using drinking water registry data and subclinical biomarkers of gut inflammation and permeability, these researchers found no consistent evidence to support PFAS exposure, particularly PFOS and PFHxS, as a risk factor for IBD (Xu et al. 2020). Conflicting findings between the C8 community cohort and Swedish studies require further investigation, particularly into the differential effects of PFASs on IBD (Steenland et al. 2020).
2.2.7 Noncancer Health Effects of PFASs in Children
Children are more exposed to environmental toxicants like PFASs because they eat, breathe, and drink more per unit of body weight compared with adults (Landrigan and Goldman 2011; Sunderland et al. 2019). Additionally, children are more vulnerable to the toxic effects of environmental exposures during critical windows of development in utero and postnatally (Landrigan and Goldman 2011; Sunderland et al. 2019). A growing body of literature addresses health effects in children exposed to PFASs (Rappazzo et al. 2017). Systematic reviews of the recent literature have identified associations between PFAS exposures and low birthweight, dyslipidemia, excess adiposity, obesity, changes in immune function (including vaccine response), asthma, renal function and age at menarche (Braun 2017; Rappazzo et al. 2017; Sunderland et al. 2019) (ATSDR 2018). Studies examining these health outcomes of concern in children are presented below.
2.2.7.1 Decreased birth weight
Several recent meta-analyses and systematic reviews have examined the association between PFAS exposure and fetal growth. Overall, the findings are mixed, with some suggesting a reduced birthweight associated with elevated PFOA and others not finding evidence for such an effect. Most recently, Dzierlenga et al. conducted a meta-analysis on 29 studies examining PFOS and birth weight (Dzierlenga et al. 2020). These researchers concluded that the evidence was weak or not supportive of a causal association between PFOS serum concentrations and birth weight. Another recent meta-analysis of both PFOA and PFOS and birthweight included toxicological studies in rats and mice as well as epidemiological studies; the researchers concluded that both epidemiological and toxicological evidence suggest that PFOA and PFOS are associated with a decrease in birthweight in both humans and rodents (Negri et al. 2017). A third recent meta-analysis of 24 epidemiological studies on PFOA concluded that present human evidence offers modest support for the association between PFOA and low birthweight, and that studies with a wide range of exposure as well as studies with blood drawn early in pregnancy show minimal to no association of PFOA with lower birthweight, while studies where blood was sampled late in the pregnancy do show an association (Steenland et al. 2018).
According to the ATSDR, evidence is “suggestive of a link between serum PFOA and PFOS and small decreases in birth weight.” Consistent associations for birth weight were not found for other perfluoroalkyls (PFHxS, PFNA, PFDA, PFUnDA, PFDoA, MeFOSAA, EtFOSAA) (ATSDR 2018)
8
2.2.7.2 Dyslipidemia
Dyslipidemia, defined as elevated total or low-density lipoprotein (LDL) cholesterol levels, or low levels of high-density lipoprotein (HDL) cholesterol, is an important risk factor for coronary heart disease and stroke. In children, dyslipidemia may lead to earlier development of atherosclerosis and cardiovascular disease. According to recent reviews of the epidemiologic literature, there is consistent evidence for a relationship between PFAS exposure and dyslipidemia (Sunderland et al. 2019; Rappazzo et al. 2017). For example, in a cross-sectional study of participants <18 years old from NHANES 1999-2008, a recent study observed that serum PFOA and PFOS were significantly associated with dyslipidemia in adolescents, even at the lower "background" exposure levels of the general US population (Geiger et al. 2014).
2.2.7.3 Excess adiposity, obesity
Several studies have reported associations between prenatal exposure to PFASs and excess adiposity and obesity among girls in mid- to late-childhood, but not early-childhood. In contrast, this association has not been seen in boys. Additionally, postnatal exposure has not been associated with markers of obesity.
For example, a study of 1006 children in mid-childhood (median age=7.7 years) found that increases in prenatal PFOA concentrations were associated with higher body mass index (BMI) and higher total fat mass index among girls only; whereas the researchers observed null associations for boys (Mora et al. 2018). Halldorsson et al. (2012) found similar results, with prenatal PFOA exposure positively associated with adiposity measures in females (age 20) but not males (Halldorsson Thorhallur et al. 2012).
When assessed at early-childhood (median of 3.2 years), Mora et al. (2018) observed null associations between adiposity measures and prenatal PFAS exposure for both girls and boys (Mora et al. 2018). Similarly, in a study examining children in the Danish National Birth Cohort, Andersen et al. observed null associations between weight, height, and BMI at 5 or 12 months of age and prenatal concentrations of PFOA or PFOS (Andersen et al. 2010). In a follow up study with the children at 7 years of age, Andersen again did not find significant associations between BMI or waist circumference and PFOA or PFOS, although overweight status did have an inverse association with increasing quartiles of PFOS, indicating that the association may develop over time and be indicative of excess adiposity later in life (Andersen et al. 2013; Rappazzo et al. 2017).
In contrast to these null findings, the Ohio based HOME study observed that maternal serum PFOA concentrations were associated (non-linearly) with higher risk of overweight/obesity in children (age 8) born to women who lived downstream from a fluoropolymer manufacturing plant, as assessed by BMI z-score, waist circumference, and BMI (Braun et al. 2016). At a later time point, Braun once again assessed children at age 12, and found that higher maternal serum PFOA concentrations was associated with lower infancy and early childhood BMI, leading to accelerated BMI increases and a higher BMI at 12 years of age (Braun et al. 2021). In contrast to PFOA, PFOS and PFHxS were not associated with alterations in BMI trajectories, but they were monotonically associated with lower BMI across infancy, childhood, and adolescence (Braun et al. 2021). Among a subset of participants from the HOME study, Liu et al. observed that maternal serum PFOA and PFHxS concentrations during pregnancy were associated with modest increases in central adiposity and risk of overweight/obesity at age 12, but there was no association for postnatal concentrations (Liu et al. 2020).
9
Overall, limited evidence suggests there may be an association between prenatal PFOA concentrations and obesity among girls in mid- to late- childhood. Given that excess adiposity itself is associated with adverse health outcomes and may increase a child's risk for adult morbidity, further research is needed to investigate this association (Rappazzo et al. 2017). No current evidence suggests an association between postnatal PFAS exposure and obesity, and the association between prenatal PFAS exposure and obesity in boys may be dependent on the level of prenatal PFAS exposure.
2.2.7.4 Immunity
Multiple studies have reported significant associations between PFAS exposure and adverse immune outcomes in children. A study by Grandjean et al. examined the impact of serum PFAS concentrations on serum antibody production in children at ages 5 and 7 years following routine vaccinations for tetanus and diphtheria. A doubling of serum PFHxS, PFOA and PFOS concentrations at age 5 was associated with a 50% decline in antibody concentrations at age 7 (Grandjean et al. 2012). In a study of prenatal PFAS exposure and altered vaccine antibody levels in early childhood, Granum et al. (2013) reported that higher levels of maternal plasma PFAS concentrations (PFOA, PFOS, PFNA, and PFHxS) at delivery were associated with lower rubella antibody concentrations at age 3 (Granum et al. 2013). Similarly, a more recent study found that serum PFOA and PFOS levels were associated with decreases in rubella and mumps antibody concentrations among children ages 12-19 years (Stein et al. 2016).
2.2.7.5 Asthma
Multiple studies have found positive associations between asthma and measured serum PFOA and PFNA levels in children, with less consistent results for other PFASs (PFHxS, PFOS and PFDA) (Dong et al. 2013; Humblet et al. 2014). A case-control study conducted in Taiwan reported that among children with asthma, nine out of the ten PFASs evaluated were positively associated with at least two of the three immunological biomarkers of asthma (immunoglobulin E (IgE)), absolute eosinophil counts (AEC), and eosinophilic cationic protein (ECP)), including serum PFHxS, PFOA, PFOS, PFNA and PFDA (Dong et al. 2013). A cross-sectional study reported associations between increasing serum PFOA and PFNA concentrations in adolescents and self-report of diagnosed asthma. For PFOS, however, there were inverse relationships found with both asthma and wheezing (Humblet et al. 2014). In a cohort across Greenland and the Ukraine, Smit et al. reported null associations between maternal plasma PFAS concentrations during pregnancy, and asthma or wheeze in their school-age children (Smit et al. 2015).
A recent study observed decreases in measures of lung function, such as forced expiratory volume, forced expiratory flow 25–75%, and forced vital capacity, with higher concentrations of select PFASs (PFHxS, PFOA, PFOS and PFNA) among children with asthma (Qin et al. 2017).
Current evidence suggests that there may be an association between serum levels of PFOA and PFNA and asthma in children. The evidence is inconsistent, however, and prospective studies are needed.
2.2.7.6 Renal function
Several studies report a positive association between PFAS serum concentration and impaired renal functioning; proper renal functioning supports normal homeostatic maintenance of blood pressure, removal of waste products from the body, red blood cell production, and electrolyte balance (Rappazzo et al. 2017). For example, in a cross-sectional study of children
10
and adolescents living near a chemical plant, Watkins et al. found lower glomerular filtration rates (GFR), indicative of impaired renal function, associated with increases in PFOA and PFOS, PFNA, and PFHxS (Watkins et al. 2013). In another study using NHANES data collected between 2003-2010, Kataria et al. found an inverse association between serum PFOA and GFR (adjusted for PFOS) but did not find as strong an association between serum PFOS and GFR (when adjusted for PFOA) and found no association between PFNA or PFHxS and GFR (Kataria et al. 2015).
Qin et al. reported that children in Taiwan with higher serum concentrations of several PFASs (PFBS, PFHxS, PFOS, PFOA, PFNA and PFDA) had an increased odds of high uric acid levels, another indicator of impaired renal function, compared to those with lower or no PFAS measured in serum (Qin et al. 2016). An additional analysis of Taiwanese adolescents and young adults found significantly higher serum PFUnA concentrations among those with chronic renal failure (Lin et al. 2013). All studies reviewed indicate that higher PFAS serum concentrations are associated with biomarkers of impaired renal functioning.
2.2.7.7 Age at menarche
There is substantial evidence for a positive association between PFAS exposure and age at menarche (the first occurrence of menstruation). Kristensen observed a one-month delay in menarche per tertile increase of maternal PFOA serum concentration, but no association between age at menarche and PFOS serum concentrations (Kristensen et al. 2013). In a cross-sectional study of the C8 Science panel cohort, researchers found that delayed menarche was associated with both serum and PFOS concentrations (after adjustment for other PFAS) (Lopez-Espinosa et al. 2011). In another analysis of this same cohort, researchers found that a marker of pubertal onset, insulin-life growth factor (IGF), was lower among girls with higher maternal PFOA serum levels and lower among both boys and girls with higher maternal PFOS and PFNA serum levels (Lopez-Espinosa et al. 2016).
In contrast, using age at menarche before 11.5 years as the primary study outcome, Christensen et al. found null associations with most PFAS levels measured in maternal serum during pregnancy, but did find an inverse association with PFOS. This may indicate that girls with higher exposure to PFOS during fetal development are more likely to have delayed menarche (Christensen and Marcus 2011). Overall, the studies reviewed show evidence for a positive association between PFAS and age at menarche, but with inconsistent results. More research is needed to determine which PFAS compounds are specifically associated with age at menarche (Rappazzo et al. 2017).
2.3 Carcinogenic Health Effects of PFASs
2.3.1 Carcinogenicity
Multiple epidemiological and experimental studies have investigated associations between perfluoroalkyl exposures and cancer risk (ATSDR 2018). The majority of these studies have focused on exposure to legacy PFASs, especially PFOA.
Occupational PFOA exposure studies have reported increased risk of testicular, kidney, and prostate cancers. In a study conducted at the Washington Works facility located in Parkersburg, West Virginia, increased mortality attributable to kidney cancer was observed among workers with high PFOA exposure (Leonard et al. 2008; Steenland and Woskie 2012). Similarly, in a 3M facility in Minnesota, PFOA exposure was associated with increased risk of prostate cancer
11
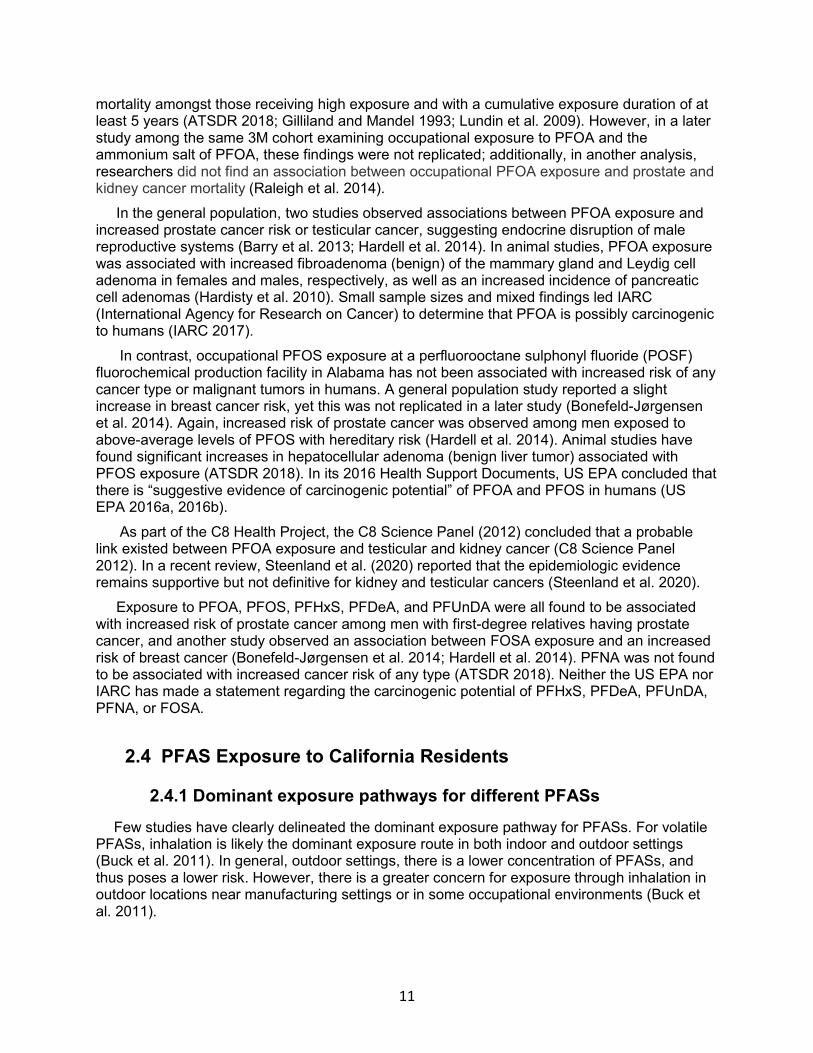
mortality amongst those receiving high exposure and with a cumulative exposure duration of at least 5 years (ATSDR 2018; Gilliland and Mandel 1993; Lundin et al. 2009). However, in a later study among the same 3M cohort examining occupational exposure to PFOA and the ammonium salt of PFOA, these findings were not replicated; additionally, in another analysis, researchers did not find an association between occupational PFOA exposure and prostate and kidney cancer mortality (Raleigh et al. 2014).
In the general population, two studies observed associations between PFOA exposure and increased prostate cancer risk or testicular cancer, suggesting endocrine disruption of male reproductive systems (Barry et al. 2013; Hardell et al. 2014). In animal studies, PFOA exposure was associated with increased fibroadenoma (benign) of the mammary gland and Leydig cell adenoma in females and males, respectively, as well as an increased incidence of pancreatic cell adenomas (Hardisty et al. 2010). Small sample sizes and mixed findings led IARC (International Agency for Research on Cancer) to determine that PFOA is possibly carcinogenic to humans (IARC 2017).
In contrast, occupational PFOS exposure at a perfluorooctane sulphonyl fluoride (POSF) fluorochemical production facility in Alabama has not been associated with increased risk of any cancer type or malignant tumors in humans. A general population study reported a slight increase in breast cancer risk, yet this was not replicated in a later study (Bonefeld-Jørgensen et al. 2014). Again, increased risk of prostate cancer was observed among men exposed to above-average levels of PFOS with hereditary risk (Hardell et al. 2014). Animal studies have found significant increases in hepatocellular adenoma (benign liver tumor) associated with PFOS exposure (ATSDR 2018). In its 2016 Health Support Documents, US EPA concluded that there is “suggestive evidence of carcinogenic potential” of PFOA and PFOS in humans (US EPA 2016a, 2016b).
As part of the C8 Health Project, the C8 Science Panel (2012) concluded that a probable link existed between PFOA exposure and testicular and kidney cancer (C8 Science Panel 2012). In a recent review, Steenland et al. (2020) reported that the epidemiologic evidence remains supportive but not definitive for kidney and testicular cancers (Steenland et al. 2020).
Exposure to PFOA, PFOS, PFHxS, PFDeA, and PFUnDA were all found to be associated with increased risk of prostate cancer among men with first-degree relatives having prostate cancer, and another study observed an association between FOSA exposure and an increased risk of breast cancer (Bonefeld-Jørgensen et al. 2014; Hardell et al. 2014). PFNA was not found to be associated with increased cancer risk of any type (ATSDR 2018). Neither the US EPA nor IARC has made a statement regarding the carcinogenic potential of PFHxS, PFDeA, PFUnDA, PFNA, or FOSA.
2.4 PFAS Exposure to California Residents
2.4.1 Dominant exposure pathways for different PFASs
Few studies have clearly delineated the dominant exposure pathway for PFASs. For volatile PFASs, inhalation is likely the dominant exposure route in both indoor and outdoor settings (Buck et al. 2011). In general, outdoor settings, there is a lower concentration of PFASs, and thus poses a lower risk. However, there is a greater concern for exposure through inhalation in outdoor locations near manufacturing settings or in some occupational environments (Buck et al. 2011).
12
Consumption of drinking water and food is likely the dominant exposure route in adults (ADD REF). Drinking water is most likely contaminated in areas where source waters are downstream of manufacturing and industrial plants or waste sites containing PFASs (Anderson et al. 2016; Houtz et al. 2013; Sunderland et al. 2019; Zhu and Kannan 2019). Non-dietary ingestion of dust is likely the dominant exposure pathway indoors for young children, most commonly due to hand-to-mouth activity (Fraser et al. 2013; Makey et al. 2017; Shoeib et al. 2011; Strynar and Lindstrom 2008). These exposures raise concerns about exposure to toddlers and young children during critical stages of development. Outdoors, non-volatile PFASs have been found in soil, which may also contribute to child exposures if play areas are contaminated.
2.4.2 Peer-reviewed Studies of PFAS Exposure among California Residents
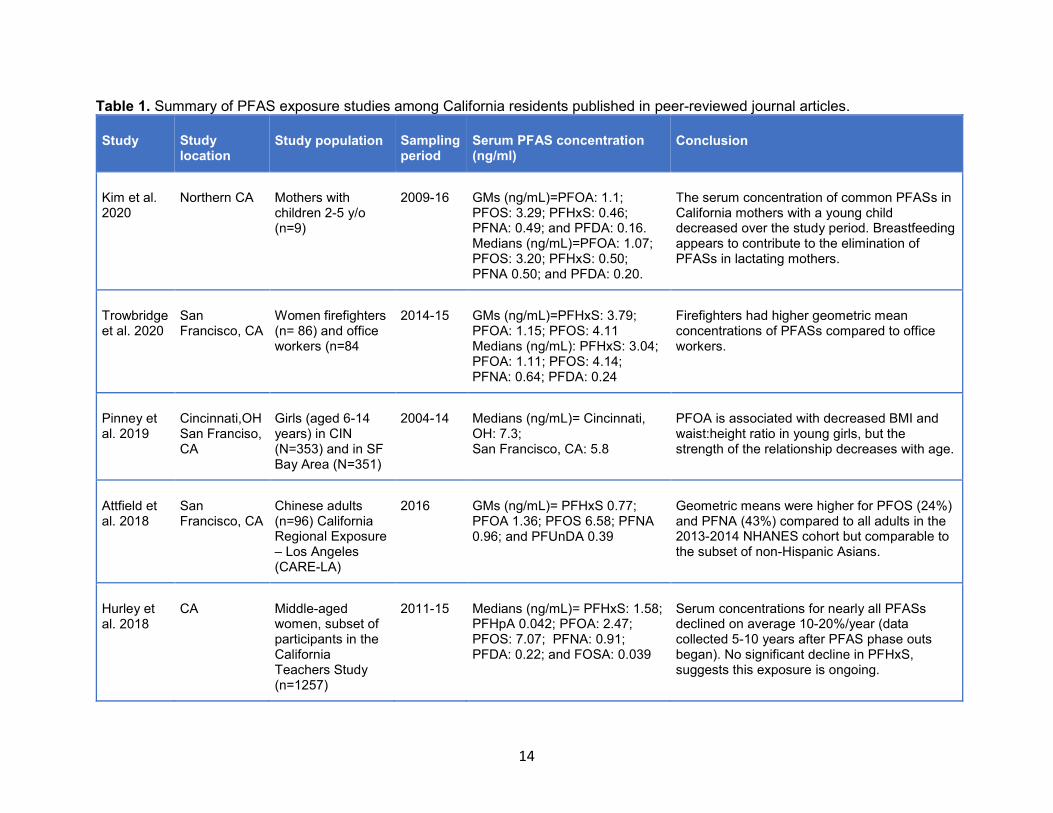
We identified seven studies reporting PFAS serum levels in California residents (Table 1) (Attfield 2018; Hurley et al. 2016; Hurley et al. 2018; Kim et al. 2020; Pinney et al. 2019; Trowbridge et al. 2020; Wang et al. 2011). Many of these studies have characterized PFAS exposure levels among women and girls (ages 6-14 years). The longitudinal studies show a decline of PFOS, PFOA and perfluorohexane sulfonic acid (PFHxS) serum levels over time, consistent with changes in the manufacturing and regulatory environment. The cross-sectional studies show that environmental factors such as water source, occupation, and location are associated with serum PFAS levels.
Wang et al. 2011 measured serum concentrations of PFOS, PFOA, and PFHxS in women in the 1960s, 1980s, and 2009, and found a statistically significant decline in PFOS serum levels from the 1960s to the 1980s, and from the 1980s to 2009 (median=42.1 ng/mL, 28.8 ng/mL, and 9.0 ng/mL, respectively) (p-value < 0.001) (Table 1). Levels of PFHxS also declined from the 1960s to the 1980s and to 2009, albeit not significantly (1.56 ng/mL, 1.06 ng/mL, and 0.73 ng/mL, respectively). Wang et al. found an increase, however, in PFOA serum levels from the 1960s to the 1980s, followed by a small decrease from the 1980s to 2009 (0.27 ng/mL, 2.71 ng/mL, and 2.08 ng/mL, respectively) and a general, continuous increase in longer chain perfluorocarboxylic acids (PFCAs) during that period (Wang et al. 2011). The initially high serum levels for PFOS and PFHxS can likely be explained by widespread use of precursor PFASs in the 1960s, while the increase in PFOA suggests alternate sources of PFOA in the environment other than electrochemical fluorination (ECF) manufacturing, which was phased out during this period. The increase in longer-chain PFCAs serum levels, including perfluorodecanoic acid (PFDA) and perfluoroundecanoic acid (PFUnDA), may be explained by the persistence of the sources and longer half-lives of these compounds compared to PFOA.
In a more recent study, Kim et al. (2020) found that PFOS, PFOA, and perfluorohexane sulfonic acid (PFHxS) serum levels decreased by 10.8%, 10.7%, and 8.0%, respectively, over a period from 2009-2016 (n=9) (Kim et al. 2020) (Table 1). Another study, conducted using a subset of participants from the California Teachers Study (CTS) between 2011- 2015, also found declining serum levels of PFOS and PFOA, but no significant decline in PFHxS (Hurley et al. 2018). Despite voluntary phase-outs, the persistence of PFHxS in serum levels may be due to the longer bio-elimination half-life of PFHxS compared to PFOS and PFOA, as well as continued exposure to PFHxS through the biodegradation of precursor compounds that are still in use (Hurley et al. 2018). Estimates for PFAS half-lives in humans range from 2.3 years for PFOA to 7.3 years for PFHxS (Bartell et al. 2010; Olsen et al. 2007).
In a cross-sectional study of a subset of the California Teachers Study participants, Hurley et al. (2016) measured serum PFAS concentrations among women with and without detectable levels of PFASs in their water source, and found significantly lower serum concentrations of
13
perfluoroheptanoic acid (PFHpA), PFOA, and PFOS among those without the specific PFASs detected in their public water source (Table 1). Serum levels of PFHxS, however, were not lower among women without detectable PFHxS in their public water sources (PWS). Data not shown. These researchers reported that forty percent of detectable concentrations exceeded the 2016 Health Advisory Level of 0.07 µg/L for combined PFOA and PFOS concentrations (Hurley et al. 2016).
An occupational study in San Francisco, CA found that among a cohort of women, firefighters (n=86) had higher geometric mean concentrations of PFASs compared to office workers (n=84) (Trowbridge et al. 2020). With office workers as the reference group, geometric means for PFOA, PFOS, and PFHxS after adjustment were 1.07, 1.10, and 2.22 times higher among the firefighters, respectively. Geometric means among the combined office worker and firefighter cohort (n=170) were 1.15 ng/mL, 4.11 ng/mL, and 3.79 ng/mL, respectively (Trowbridge et al. 2020). Another study considered young girls in Cincinnati and San Francisco and found that median PFOA serum levels were higher among girls in Cincinnati than those in San Francisco (7.3 ng/mL, 5.8 ng/mL, respectively). The higher median serum concentration in Cincinnati is likely attributable to their water source, the Ohio River, which was found to have PFOA concentration exceeding the EPA's drinking water advisory for PFOS and PFOA combined (Pinney et al. 2019) (Table 1).
14
Table 1. Summary of PFAS exposure studies among California residents published in peer-reviewed journal articles.
Study Study location
Study population Sampling period
Serum PFAS concentration (ng/ml)
Conclusion
Kim et al. 2020
Northern CA Mothers with children 2-5 y/o (n=9)
2009-16 GMs (ng/mL)=PFOA: 1.1; PFOS: 3.29; PFHxS: 0.46; PFNA: 0.49; and PFDA: 0.16. Medians (ng/mL)=PFOA: 1.07; PFOS: 3.20; PFHxS: 0.50; PFNA 0.50; and PFDA: 0.20.
The serum concentration of common PFASs in California mothers with a young child decreased over the study period. Breastfeeding appears to contribute to the elimination of PFASs in lactating mothers.
Trowbridge et al. 2020
San Francisco, CA
Women firefighters (n= 86) and office workers (n=84
2014-15 GMs (ng/mL)=PFHxS: 3.79; PFOA: 1.15; PFOS: 4.11 Medians (ng/mL): PFHxS: 3.04; PFOA: 1.11; PFOS: 4.14; PFNA: 0.64; PFDA: 0.24
Firefighters had higher geometric mean concentrations of PFASs compared to office workers.
Pinney et al. 2019
Cincinnati,OHSan Franciso, CA
Girls (aged 6-14 years) in CIN (N=353) and in SF Bay Area (N=351)
2004-14 Medians (ng/mL)= Cincinnati, OH: 7.3; San Francisco, CA: 5.8
PFOA is associated with decreased BMI and waist:height ratio in young girls, but the strength of the relationship decreases with age.
Attfield et al. 2018
San Francisco, CA
Chinese adults (n=96) California Regional Exposure – Los Angeles (CARE-LA)
2016 GMs (ng/mL)= PFHxS 0.77; PFOA 1.36; PFOS 6.58; PFNA 0.96; and PFUnDA 0.39
Geometric means were higher for PFOS (24%) and PFNA (43%) compared to all adults in the 2013-2014 NHANES cohort but comparable to the subset of non-Hispanic Asians.
Hurley et al. 2018
CA Middle-aged women, subset of participants in the California Teachers Study (n=1257)
2011-15 Medians (ng/mL)= PFHxS: 1.58; PFHpA 0.042; PFOA: 2.47; PFOS: 7.07; PFNA: 0.91; PFDA: 0.22; and FOSA: 0.039
Serum concentrations for nearly all PFASs declined on average 10-20%/year (data collected 5-10 years after PFAS phase outs began). No significant decline in PFHxS, suggests this exposure is ongoing.
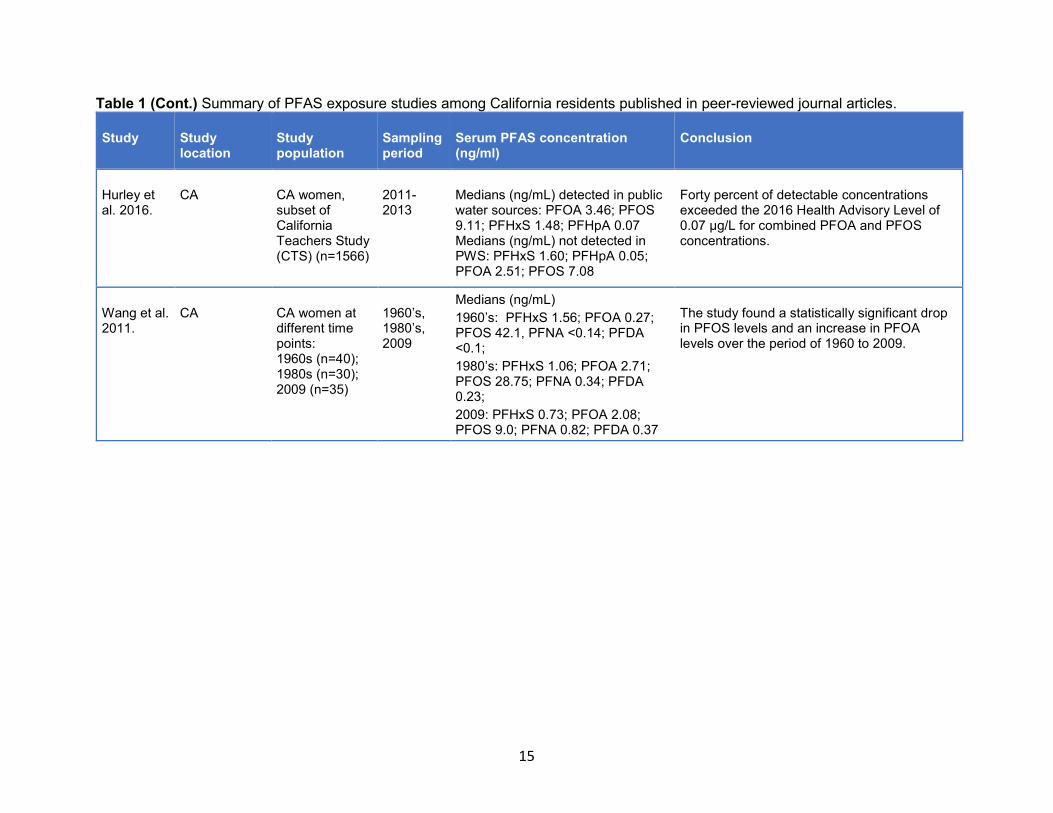
15
Table 1 (Cont.) Summary of PFAS exposure studies among California residents published in peer-reviewed journal articles.
Study Study location
Study population
Sampling period
Serum PFAS concentration (ng/ml)
Conclusion
Hurley et al. 2016.
CA
CA women, subset of California Teachers Study (CTS) (n=1566)
2011-2013
Medians (ng/mL) detected in public water sources: PFOA 3.46; PFOS 9.11; PFHxS 1.48; PFHpA 0.07 Medians (ng/mL) not detected in PWS: PFHxS 1.60; PFHpA 0.05; PFOA 2.51; PFOS 7.08
Forty percent of detectable concentrations exceeded the 2016 Health Advisory Level of 0.07 μg/L for combined PFOA and PFOS concentrations.
Wang et al. 2011.
CA CA women at different time points: 1960s (n=40); 1980s (n=30); 2009 (n=35)
1960’s, 1980’s, 2009
Medians (ng/mL)
1960’s: PFHxS 1.56; PFOA 0.27; PFOS 42.1, PFNA <0.14; PFDA <0.1;
1980’s: PFHxS 1.06; PFOA 2.71; PFOS 28.75; PFNA 0.34; PFDA 0.23;
2009: PFHxS 0.73; PFOA 2.08; PFOS 9.0; PFNA 0.82; PFDA 0.37
The study found a statistically significant drop in PFOS levels and an increase in PFOA levels over the period of 1960 to 2009.

16
2.4.3 Biomonitoring California Studies
Biomonitoring California, a joint program sponsored by the California Department of Public Health, the California Office of Environmental Health Hazard Assessment (OEHHA), and the California Department of Toxic Substances Control (DTSC), has overseen numerous initiatives over the past decade to characterize toxic chemical exposure among a range of sensitive or vulnerable populations in California. These projects include the California Teachers Study, the Maternal and Infant Environmental Exposure Project (MIEEP), Measuring Analytes in Maternal Archived Samples (MAMAS), the Biomonitoring Exposures Study series (BEST), the Asian/Pacific Islander Community Exposures (ACE) Project series, and the California Regional Exposure (CARE) study (Table 2).
The California Teachers Study (CTS) is an ongoing cohort study (n= 2,869) that includes a population of active and retired female schoolteachers and administrators across California. In 2011, researchers measured various PFAS serum concentrations in their study population and found the highest levels for PFOA and PFOS, at 2.50 ng/mL and 7.14 ng/mL, respectively (see Table 2) (CTS 2015). CTS data was used in two aforementioned published studies, in 2016 and 2018, to investigate associations between PFAS serum concentration and detection of PFASs in drinking water, and time trends in PFASs, respectively (Hurley et al. 2016; Hurley et al. 2018).
MIEEP is another ongoing cohort study of mother-infant pairs and pregnant women in the San Francisco area (n= 92). During 2010-2011, women were recruited at San Francisco General Hospital in their third trimester of pregnancy. Researchers at UC San Francisco and UC Berkeley found that the highest PFAS serum levels in their study population were for PFNA and PFOS, at 0.791 ng/mL and 2.43 ng/mL, respectively (See Table 2) (MIEEP 2011). Similarly, MAMAS, a project designed to evaluate chemical exposures to pregnant women, collected samples from women across California to approximately represent the state's overall population (n=460). The highest MAMAS PFAS serum levels for PFOA and PFOS, were 1.29 ng/mL and 4.47 ng/mL, respectively (MAMAS 2015).
BEST consists of two consecutive studies among a population of Kaiser Permanente Northern California (KPNC) members living in California’s Central Valley (n= 112). In both iterations, participants were randomly selected across gender, age, race/ethnicity, and location. Samples were collected between 2011-2012, and the highest median PFAS serum concentrations for PFOA and PFOS, were 1.99 ng/mL and 7.19 ng/mL, respectively (Table 2) (BEST-Pilot 2012). In the second iteration of the study, BEST- Expanded, researchers expanded the study population (n=341) and emphasized random sampling among Hispanic and Asian/ Pacific Islander subpopulations. In this group, the highest PFAS concentrations for PFOA and PFOS were 1.65 ng/mL and 5.31 ng/mL, respectively (BEST-Expanded 2013).
After observing higher toxic chemical levels in Asian and Pacific Islander communities in previous California-wide studies, Biomonitoring California spearheaded the ACE study to characterize PFASs, among these populations. For the first phase of the ACE Project, ACE 1, researchers recruited participants from the San Francisco Bay Area who identified as Chinese (n= 100). The highest PFAS serum levels for PFOA and PFOS were 1.36 ng/mL and 6.05 ng/mL, respectively (see Table 2) (ACE-1 2016). In the second phase of the study, the project expanded to include Vietnamese adults living in the San Francisco Bay Area (n=100). The highest PFAS serum levels for PFOA and PFOS were 1.61 ng/mL and 7.0 ng/mL, respectively (ACE-2 2017). These PFAS concentrations are similar to those found among the Chinese study population in ACE-1.
17
The CARE study, initiated in 2018, is an on-going cross-sectional study measuring and comparing environmental exposures in California residents. Results from the CARE study are presented in Table 2. The study will ultimately sample 300-500 adults in eight regions throughout the state over the upcoming years. In the first phase, researchers measured PFAS serum levels in 430 Los Angeles residents (adults, both men and women); detection frequencies were above 97% for PFHxS, PFOA, PFOS ,PFNA and MeFOSAA, and (CARE-LA 2018). The highest serum levels detected were for PFOA and PFOS, with medians of 1.13 ng/mL and 2.43 ng/mL, respectively. In the second phase of the study, CARE-2, researchers measured PFAS serum levels in 359 residents of Riverside, San Bernardino, Imperial, Mono, and Inyo counties. Detection frequencies were above 97% for PFHxS, PFOA and PFOS (CARE-2 2019). The highest serum levels detected were for PFOA and PFOS, with medians of 1.11 ng/mL and 2.80 ng/mL, respectively.
Despite the widespread phase out of legacy PFASs in California, differential exposures among subpopulations and ongoing serum levels indicate persistent exposure and the need for continued biomonitoring and research to identify exposure sources and pathways.
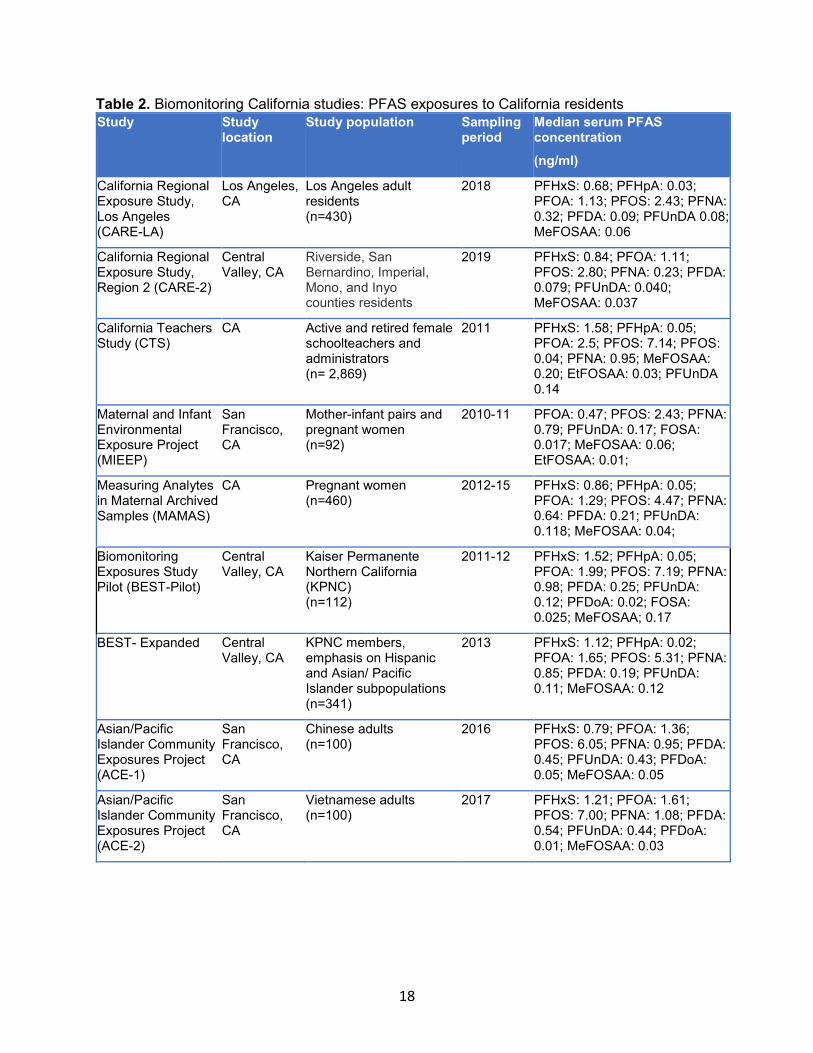
18
Table 2. Biomonitoring California studies: PFAS exposures to California residents
Study Study location
Study population Sampling period
Median serum PFAS concentration
(ng/ml)
California Regional Exposure Study, Los Angeles (CARE-LA)
Los Angeles, CA
Los Angeles adult residents (n=430)
2018 PFHxS: 0.68; PFHpA: 0.03; PFOA: 1.13; PFOS: 2.43; PFNA: 0.32; PFDA: 0.09; PFUnDA 0.08; MeFOSAA: 0.06
California Regional Exposure Study, Region 2 (CARE-2)
Central Valley, CA
Riverside, San Bernardino, Imperial, Mono, and Inyo counties residents
2019 PFHxS: 0.84; PFOA: 1.11; PFOS: 2.80; PFNA: 0.23; PFDA: 0.079; PFUnDA: 0.040; MeFOSAA: 0.037
California Teachers Study (CTS)
CA Active and retired female schoolteachers and administrators (n= 2,869)
2011 PFHxS: 1.58; PFHpA: 0.05; PFOA: 2.5; PFOS: 7.14; PFOS: 0.04; PFNA: 0.95; MeFOSAA: 0.20; EtFOSAA: 0.03; PFUnDA 0.14
Maternal and Infant Environmental Exposure Project (MIEEP)
San Francisco, CA
Mother-infant pairs and pregnant women (n=92)
2010-11 PFOA: 0.47; PFOS: 2.43; PFNA: 0.79; PFUnDA: 0.17; FOSA: 0.017; MeFOSAA: 0.06; EtFOSAA: 0.01;
Measuring Analytes in Maternal Archived Samples (MAMAS)
CA Pregnant women (n=460)
2012-15 PFHxS: 0.86; PFHpA: 0.05; PFOA: 1.29; PFOS: 4.47; PFNA: 0.64: PFDA: 0.21; PFUnDA: 0.118; MeFOSAA: 0.04;
Biomonitoring Exposures Study Pilot (BEST-Pilot)
Central Valley, CA
Kaiser Permanente Northern California (KPNC) (n=112)
2011-12 PFHxS: 1.52; PFHpA: 0.05; PFOA: 1.99; PFOS: 7.19; PFNA: 0.98; PFDA: 0.25; PFUnDA: 0.12; PFDoA: 0.02; FOSA: 0.025; MeFOSAA; 0.17
BEST- Expanded Central Valley, CA
KPNC members, emphasis on Hispanic and Asian/ Pacific Islander subpopulations (n=341)
2013 PFHxS: 1.12; PFHpA: 0.02; PFOA: 1.65; PFOS: 5.31; PFNA: 0.85; PFDA: 0.19; PFUnDA: 0.11; MeFOSAA: 0.12
Asian/Pacific Islander Community Exposures Project (ACE-1)
San Francisco, CA
Chinese adults (n=100)
2016 PFHxS: 0.79; PFOA: 1.36; PFOS: 6.05; PFNA: 0.95; PFDA: 0.45; PFUnDA: 0.43; PFDoA: 0.05; MeFOSAA: 0.05
Asian/Pacific Islander Community Exposures Project (ACE-2)
San Francisco, CA
Vietnamese adults (n=100)
2017 PFHxS: 1.21; PFOA: 1.61; PFOS: 7.00; PFNA: 1.08; PFDA: 0.54; PFUnDA: 0.44; PFDoA: 0.01; MeFOSAA: 0.03
19
2.5 Comparison of California PFAS exposure levels to NHANES
2.5.1 California studies in adults compared to NHANES
Table 3 presents median PFAS serum levels reported in NHANES 2011-2016 and five California studies among adults. Overall, the PFAS serum levels in California residents were comparable to those measured in the US adult population, though certain PFASs appeared consistently higher among California residents compared to NHANES; these compounds include PFOS, PFNA, and MeFOSAA (CDC 2019) (Figure 1).
The BEST-Pilot study, which measured levels among Kaiser Permanente Northern California (KPNC) members living in the Central Valley, reported median serum PFAS concentrations that were consistently higher than those reported for adults in NHANES (See Table 3). Median PFHxS, PFOA, PFOS, PFNA and PFDA levels reported in the BEST-Pilot study (n=112) were all above the upper bound of the NHANES median 95% confidence intervals (CI’s), indicating a significant difference in serum concentrations between the national population and the BEST-Pilot study population for these compounds (Table 3). NHANEs median concentrations were below the limit of detection (LOD) for PFBS, PFHpA, PFUnDA PFDoA, FOSA, MeFOSAA and EtFOSAA. In the BEST- Expanded study, which again randomly sampled KPNC members from the Central Valley, this time emphasizing the selection of Hispanic and Asian/ Pacific Islander-identifying participants, median serum concentrations for PFHpA, PFOS, PFNA and MeFOSAA and were also higher compared with NHANES. However, the BEST-Expanded study reported slightly lower median serum concentrations than NHANES for PFHxS, PFOA and PFDA, although the concentrations of PFOA and PFDA remained within the NHANES median 95% CI.
The first phase of the ACE Study, which considered a population of Chinese adults living in the San Francisco Bay Area, reported levels above those reported by NHANES for PFOS, PFNA, PFDA, PFDoA and MeFOSAA. In a published International Society for Environmental Epidemiology (ISEE) abstract, Attfield et al. 2018 reported that among this cohort of Chinese adults in San Francisco (n=96), the geometric means (GM) for PFOS and PFNA were 24% and 43% higher than adults in the 2013-2014 NHANES cohort, respectively, but were comparable to the subset of non-Hispanic Asians in NHANES (PFOS 6.58 ng/mL, 0.96 ng/mL, respectively) (Attfield 2018). The second phase of the ACE Study, which considered a population of Vietnamese adults living in the San Francisco Bay Area, found levels above those reported by NHANES for PFOS, PFNA, PFDA, PFDoA and MeFOSAA.
In contrast to trends found in the aforementioned studies, the CARE-LA study, which measured PFAS serum levels among men and women in Los Angeles County, reported concentrations below the lower bound of NHANES median 95% CI for PFHxS, PFOA, PFOS, and PFNA with median values of 2.43 ng/mL, 1.13 ng/mL, 0.68 ng/mL, and 0.32 ng/mL, respectively (CARE-LA 2018). The CARE-2 study reported median PFAS concentrations below the lower bound of NHANES median 95% CI for PFHxS, PFOA, PFOS, and PFNA as well, with median values of 2.80 ng/mL, 1.11 ng/mL, 0.84 ng/mL, and 0.23 ng/mL, respectively (CARE-2 2019).
Collectively considered, the higher serum concentrations for a number of PFASs (e.g., PFOS, PFNA and PFDA) reported in these studies suggest higher PFAS exposure to California residents compared to the national population (Table 3 and Figure 1).
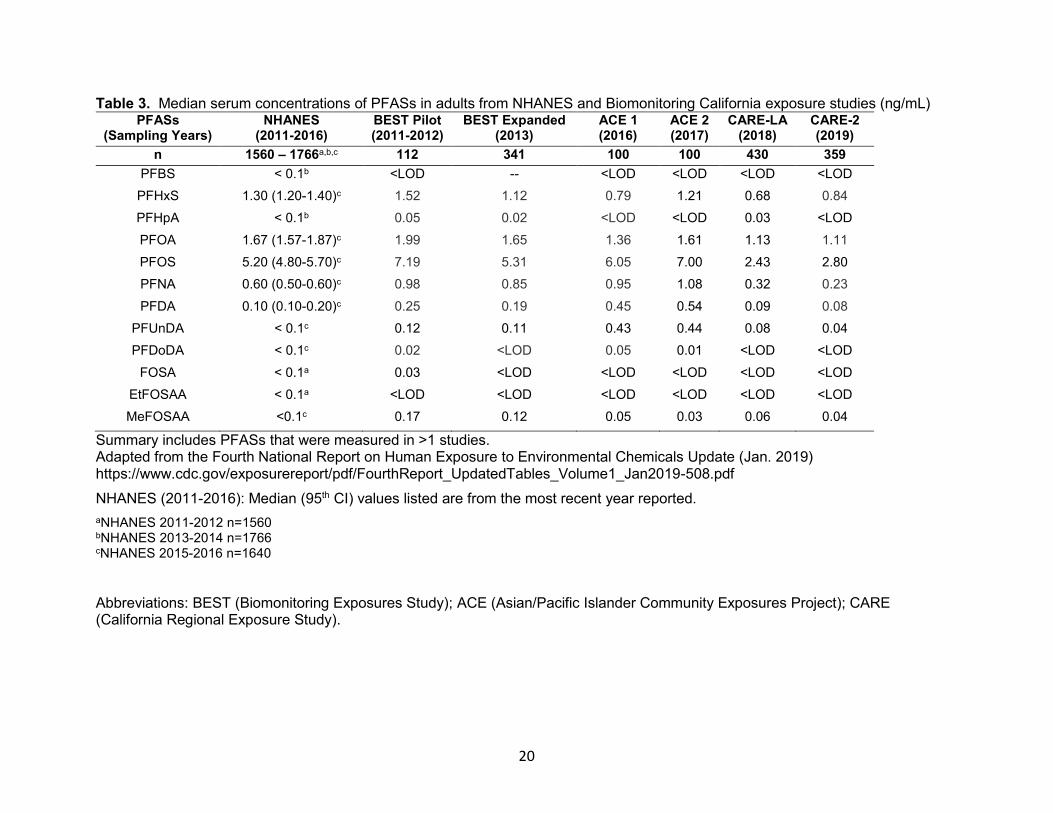
20
Table 3. Median serum concentrations of PFASs in adults from NHANES and Biomonitoring California exposure studies (ng/mL) PFASs NHANES BEST Pilot BEST Expanded ACE 1 ACE 2 CARE-LA CARE-2
(Sampling Years) (2011-2016) (2011-2012) (2013) (2016) (2017) (2018) (2019)
n 1560 – 1766a,b,c 112 341 100 100 430 359
PFBS < 0.1b <LOD -- <LOD <LOD <LOD <LOD
PFHxS 1.30 (1.20-1.40)c 1.52 1.12 0.79 1.21 0.68 0.84
PFHpA < 0.1b 0.05 0.02 <LOD <LOD 0.03 <LOD
PFOA 1.67 (1.57-1.87)c 1.99 1.65 1.36 1.61 1.13 1.11
PFOS 5.20 (4.80-5.70)c 7.19 5.31 6.05 7.00 2.43 2.80
PFNA 0.60 (0.50-0.60)c 0.98 0.85 0.95 1.08 0.32 0.23
PFDA 0.10 (0.10-0.20)c 0.25 0.19 0.45 0.54 0.09 0.08
PFUnDA < 0.1c 0.12 0.11 0.43 0.44 0.08 0.04
PFDoDA < 0.1c 0.02 <LOD 0.05 0.01 <LOD <LOD
FOSA < 0.1a 0.03 <LOD <LOD <LOD <LOD <LOD
EtFOSAA < 0.1a <LOD <LOD <LOD <LOD <LOD <LOD
MeFOSAA <0.1c 0.17 0.12 0.05 0.03 0.06 0.04
Summary includes PFASs that were measured in >1 studies. Adapted from the Fourth National Report on Human Exposure to Environmental Chemicals Update (Jan. 2019) https://www.cdc.gov/exposurereport/pdf/FourthReport_UpdatedTables_Volume1_Jan2019-508.pdf
NHANES (2011-2016): Median (95th CI) values listed are from the most recent year reported.
aNHANES 2011-2012 n=1560 bNHANES 2013-2014 n=1766 cNHANES 2015-2016 n=1640
Abbreviations: BEST (Biomonitoring Exposures Study); ACE (Asian/Pacific Islander Community Exposures Project); CARE (California Regional Exposure Study).
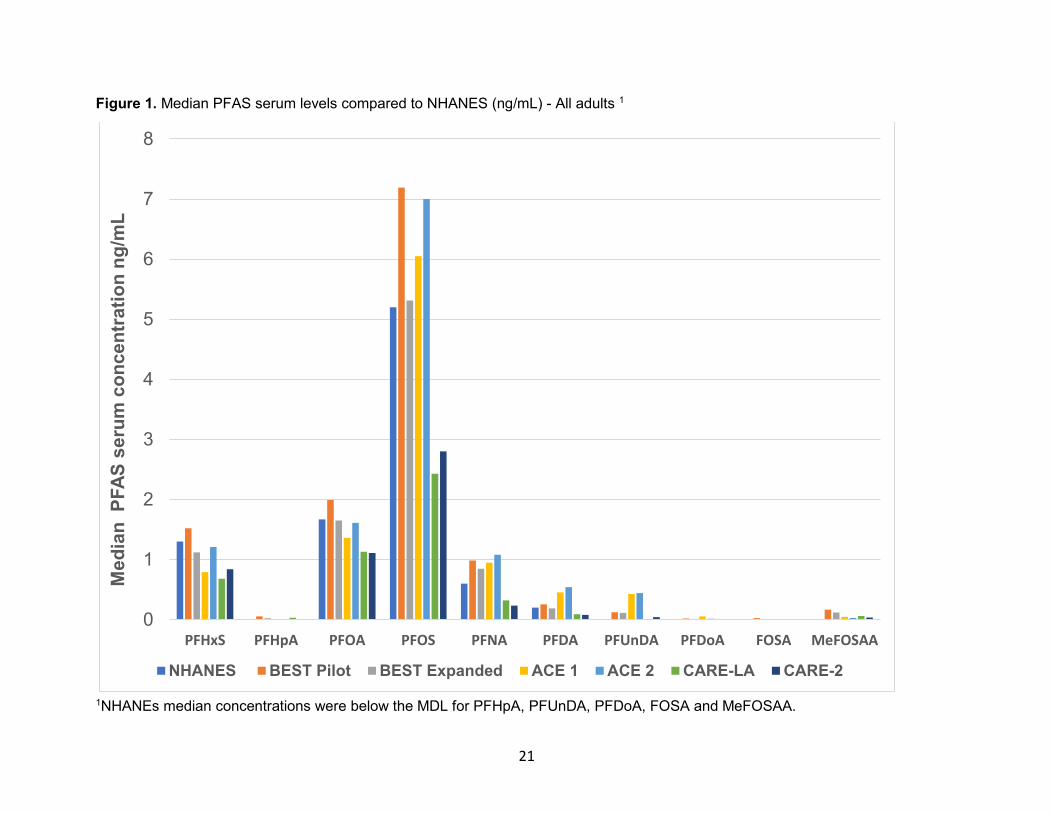
21
Figure 1. Median PFAS serum levels compared to NHANES (ng/mL) - All adults 1
1NHANEs median concentrations were below the MDL for PFHpA, PFUnDA, PFDoA, FOSA and MeFOSAA.
0
1
2
3
4
5
6
7
8
PFHxS PFHpA PFOA PFOS PFNA PFDA PFUnDA PFDoA FOSA MeFOSAA
Med
ian
P
FA
S s
eru
m c
on
cen
trati
on
ng
/mL
NHANES BEST Pilot BEST Expanded ACE 1 ACE 2 CARE-LA CARE-2
22
2.5.2 California studies in women compared to NHANES
Table 4 and Figure 2 present median PFAS serum levels reported for women in NHANES 2011-2016 and seven California studies that measured similar compounds among women. In general, the California studies reported higher median serum levels in women compared to NHANES (Figure 2) (CDC 2019). Hurley et al. 2018 reported higher serum levels for all PFASs compared to those of NHANES (Hurley et al. 2016; Hurley et al. 2018). Across all studies, the highest median serum concentrations for PFOS and PFOA were reported by Wang et al. 2011 and the California Teachers Study (9.0 ng/mL and 2.50 ng/mL, respectively) and the highest median serum level for PFHxS was reported by the California Teachers Study (1.58 ng/mL) (CTS 2015; Wang et al. 2011). Among all of the studies, the median serum concentrations for PFOS, PFOA, and PFHxS ranged from 2.43-9.0 ng/mL, 0.47-2.50 ng/mL, and 0.50-1.58 mL, respectively (Hurley et al. 2016) (Table 4).
Trowbridge et al. reports serum levels from an occupational cohort of women, including firefighters and office workers (Trowbridge et al. 2020). Comparing with NHANES, median serum levels are higher in the occupational cohort for PFBS, PFHxS, PFOS, PFNA and PFDA than in NHANES. PFOA is the only compound which was lower in the occupational cohort. The highest median concentrations found were for PFHxS and PFOS at 3.04 ng/mL and 4.14 ng/mL, respectively. The serum concentrations among women in this cohort were comparable to those of California non-occupational cohorts, aside from PFHxS, which was higher than all other California studies (Table 4).
CTS reported higher serum concentrations in California teachers compared with nationally representative NHANES data for women for the majority of PFASs, except PFBS and PFDA (Table 4). Notably, the reported PFOS concentration was nearly twice that of NHANES, and was exceeded only by Wang et al. (7.14 ng/mL, 3.60 ng/mL, and 9.0 ng/mL, respectively). Using data from CTS, Hurley et al. 2018 reported that over the period of 2011-2015, serum concentrations of all PFASs except PFxHS, decreased an average of 10-20% per year (Hurley et al. 2018). However, all median PFAS serum concentrations over this period were higher than those reported by NHANES. Also using data from CTS, Hurley et al. 2016 reported higher PFAS serum concentrations among participants both with and without PFASs detected in their public water source, compared to NHANES data (Hurley et al. 2016).
The MAMAS study reported higher or similar PFAS levels among their study population compared with NHANES. Serum concentrations were higher than NHANES for PFHpA, PFOS, PFNA, PFDA, PFUnDA and MeFOSAA and concentrations were marginally lower than NHANES for PFHxS and PFOA. Other PFASs measured were below the detection limit for both NHANES and MAMAS. The MIEEP study reported lower serum concentrations for PFHpA, PFOA, PFOS and PFDA compared with NHANES, but reported higher serum concentrations for PFNA, PFUnDA, FOSA, MeFOSAA and EtFOSAA. Across all studies, the highest median serum concentration was consistently reported for PFOS.
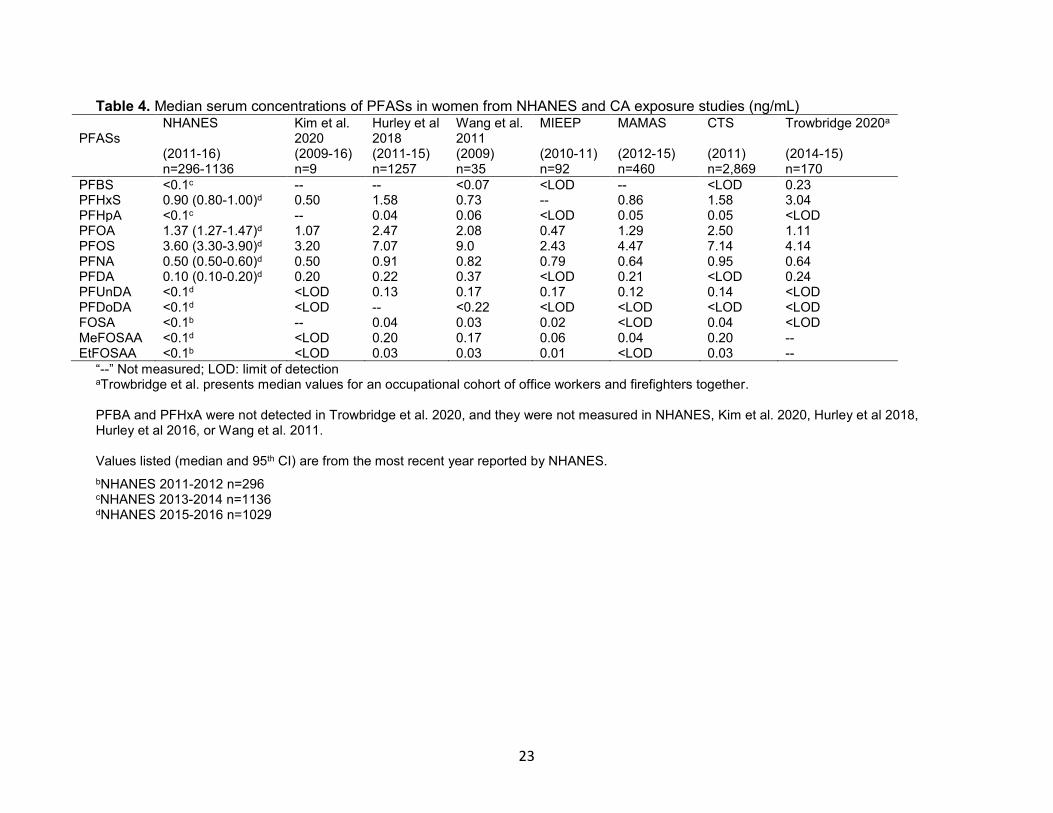
23
Table 4. Median serum concentrations of PFASs in women from NHANES and CA exposure studies (ng/mL) PFASs
NHANES Kim et al. 2020
Hurley et al 2018
Wang et al. 2011
MIEEP MAMAS CTS Trowbridge 2020a
(2011-16) (2009-16) (2011-15) (2009) (2010-11) (2012-15) (2011) (2014-15) n=296-1136 n=9 n=1257 n=35 n=92 n=460 n=2,869 n=170
PFBS <0.1c -- -- <0.07 <LOD -- <LOD 0.23 PFHxS 0.90 (0.80-1.00)d 0.50 1.58 0.73 -- 0.86 1.58 3.04 PFHpA <0.1c -- 0.04 0.06 <LOD 0.05 0.05 <LOD PFOA 1.37 (1.27-1.47)d 1.07 2.47 2.08 0.47 1.29 2.50 1.11 PFOS 3.60 (3.30-3.90)d 3.20 7.07 9.0 2.43 4.47 7.14 4.14 PFNA 0.50 (0.50-0.60)d 0.50 0.91 0.82 0.79 0.64 0.95 0.64 PFDA 0.10 (0.10-0.20)d 0.20 0.22 0.37 <LOD 0.21 <LOD 0.24 PFUnDA <0.1d <LOD 0.13 0.17 0.17 0.12 0.14 <LOD PFDoDA <0.1d <LOD -- <0.22 <LOD <LOD <LOD <LOD FOSA <0.1b -- 0.04 0.03 0.02 <LOD 0.04 <LOD MeFOSAA <0.1d <LOD 0.20 0.17 0.06 0.04 0.20 -- EtFOSAA <0.1b <LOD 0.03 0.03 0.01 <LOD 0.03 --
“--” Not measured; LOD: limit of detection aTrowbridge et al. presents median values for an occupational cohort of office workers and firefighters together. PFBA and PFHxA were not detected in Trowbridge et al. 2020, and they were not measured in NHANES, Kim et al. 2020, Hurley et al 2018, Hurley et al 2016, or Wang et al. 2011. Values listed (median and 95th CI) are from the most recent year reported by NHANES.
bNHANES 2011-2012 n=296 cNHANES 2013-2014 n=1136 dNHANES 2015-2016 n=1029

24
Figure 2. Median PFAS serum levels compared to NHANES (ng/mL) - Women only 1
1NHANES median concentrations were below the MDL for PFBS, PFUnDA and MeFOSAA.
2.5.3 Summary
As in the general US population, there is widespread PFAS exposure in California. Higher median serum concentrations of PFAS in California indicate that there may be greater PFAS exposure among California residents or certain subpopulations, including occupational groups such as firefighters and industrial workers, compared to the national population. Preliminary evidence suggests that drinking water is a substantial exposure pathway, particularly for those living near contaminated sites, such as manufacturing facilities and military bases (Domingo and Nadal 2019; Sunderland et al. 2019). Other potential routes of human exposure to PFAS include dietary and nondietary ingestion, inhalation of indoor air and contact with other contaminated media (Sunderland et al. 2019; Susmann et al. 2019; Trudel et al. 2008).
2.6 Current California regulations of PFASs
2.6.1 California Regulations of PFASs in Water
California’s AB 756, which took effect January 1st, 2020, gives the California State Water Resources Control Board (SWRCB) the authority to order water systems to monitor for PFASs (SWRCB 2020a). If PFOA or PFOS is detected and exceeds the notification level or response level, some form of public notification is required depending on the level. The notification level (NL) is a health-based concentration of a contaminant in drinking water that warrants notification and further monitoring and assessment (SWRCB 2020b). The response level (RL) is the
0
1
2
3
4
5
6
7
8
9
PFHxS PFHpA PFOA PFOS PFNA PFDA PFUnDA MeFOSAA
Med
ian
PF
AS
seru
m c
on
cen
trati
on
(n
g/m
L)
NHANES Kim et al. 2020 Hurley et al 2018 Wang et al. 2011
MIEEP MAMAS CTS Trowbridge et al. 2020
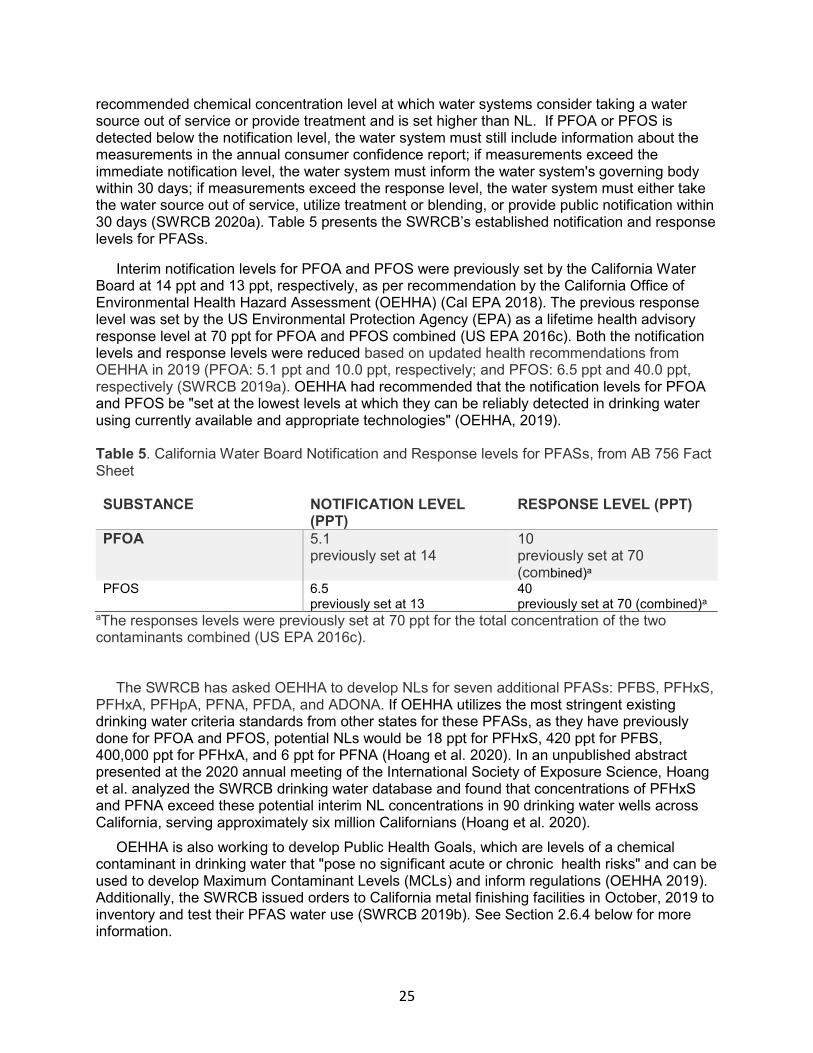
25
recommended chemical concentration level at which water systems consider taking a water source out of service or provide treatment and is set higher than NL. If PFOA or PFOS is detected below the notification level, the water system must still include information about the measurements in the annual consumer confidence report; if measurements exceed the immediate notification level, the water system must inform the water system's governing body within 30 days; if measurements exceed the response level, the water system must either take the water source out of service, utilize treatment or blending, or provide public notification within 30 days (SWRCB 2020a). Table 5 presents the SWRCB’s established notification and response levels for PFASs.
Interim notification levels for PFOA and PFOS were previously set by the California Water Board at 14 ppt and 13 ppt, respectively, as per recommendation by the California Office of Environmental Health Hazard Assessment (OEHHA) (Cal EPA 2018). The previous response level was set by the US Environmental Protection Agency (EPA) as a lifetime health advisory response level at 70 ppt for PFOA and PFOS combined (US EPA 2016c). Both the notification levels and response levels were reduced based on updated health recommendations from OEHHA in 2019 (PFOA: 5.1 ppt and 10.0 ppt, respectively; and PFOS: 6.5 ppt and 40.0 ppt, respectively (SWRCB 2019a). OEHHA had recommended that the notification levels for PFOA and PFOS be "set at the lowest levels at which they can be reliably detected in drinking water using currently available and appropriate technologies" (OEHHA, 2019). Table 5. California Water Board Notification and Response levels for PFASs, from AB 756 Fact Sheet SUBSTANCE NOTIFICATION LEVEL
(PPT) RESPONSE LEVEL (PPT)
PFOA 5.1 previously set at 14
10 previously set at 70 (combined)a
PFOS 6.5 previously set at 13
40 previously set at 70 (combined)a
aThe responses levels were previously set at 70 ppt for the total concentration of the two contaminants combined (US EPA 2016c). The SWRCB has asked OEHHA to develop NLs for seven additional PFASs: PFBS, PFHxS, PFHxA, PFHpA, PFNA, PFDA, and ADONA. If OEHHA utilizes the most stringent existing drinking water criteria standards from other states for these PFASs, as they have previously done for PFOA and PFOS, potential NLs would be 18 ppt for PFHxS, 420 ppt for PFBS, 400,000 ppt for PFHxA, and 6 ppt for PFNA (Hoang et al. 2020). In an unpublished abstract presented at the 2020 annual meeting of the International Society of Exposure Science, Hoang et al. analyzed the SWRCB drinking water database and found that concentrations of PFHxS and PFNA exceed these potential interim NL concentrations in 90 drinking water wells across California, serving approximately six million Californians (Hoang et al. 2020).
OEHHA is also working to develop Public Health Goals, which are levels of a chemical contaminant in drinking water that "pose no significant acute or chronic health risks" and can be used to develop Maximum Contaminant Levels (MCLs) and inform regulations (OEHHA 2019). Additionally, the SWRCB issued orders to California metal finishing facilities in October, 2019 to inventory and test their PFAS water use (SWRCB 2019b). See Section 2.6.4 below for more information.

26
2.6.2 California’s Proposition 65
OEHHA listed PFOA and PFOS as developmental toxicants under Proposition 65, the California Safe Drinking Water and Toxic Enforcement Act, in 2017 (OEHHA 2017). Support for the PFOA listing includes the following documents released by US EPA in 2016: Drinking Water Health Advisory (HA) for Perfluorooctanoic Acid (PFOA) (US EPA 2016d) and Health Effects Support Document for Perfluorooctanoic Acid (US EPA 2016a). In the former document, US EPA issued a lifetime drinking water Health Advisory (HA) for PFOA based on a reference dose (RfD) derived from a developmental toxicity study in mice, which showed “reduced ossification in proximal phalanges and accelerated puberty in males following exposure during gestation and lactation” (Lau et al. 2006; US EPA 2016d). The document also references “extensive human data from epidemiological data from the general population as well as worker cohorts,” which strongly support the identification of hazards related to PFOA exposure. US EPA established an RfD of 0.00002 mg/kg/day for PFOA, citing the consistency of responses “across chronic studies and those for reproductive and developmental endpoints, and with recognition of the use of developmental toxicity as the most sensitive endpoint” (US EPA 2016a).
Support for the listing of PFOS includes the following documents released by US EPA in 2016: Drinking Water Health Advisory (HA) for Perfluorooctane Sulfonate (PFOS) (US EPA 2016e) and Health Effects Support Document for Perfluorooctane Sulfonate (PFOS) (US EPA 2016b). In the former document, US EPA issued a lifetime drinking water hazard assessment for PFOS based on a rodent developmental toxicity study that reported reduced pup body weight (Luebker et al. 2005b). US EPA established the PFOS RfD of 0.00002 mg/kg/day based on developmental toxicity studies that observed reduced pup body weight after maternal exposure (Luebker et al. 2005b). Other developmental effects of PFOS included decreased survival and increased serum glucose levels, insulin resistance in adult offspring, “significant decreases in gestation length and number of implantation sites, and reductions in litter size” (US EPA 2016a).
According to US EPA, the adverse effects observed following exposures to PFOA and PFOS are the same or similar, including effects on lipids, birth weight, and antibodies in humans (US EPA 2016d). The RfD’s set for both chemicals are based on developmental endpoints, including reduced ossification and accelerated puberty in males for PFOA and decreased birth weight for PFOS (US EPA 2016e).
Table 6 presents the oral non-cancer RfD values for PFOA and PFOS as well as proposed draft oral non-cancer RfD values for GenX and PFBS, alternatives to PFOA and PFOS, respectively (US EPA 2016d, 2016e, 2018a, 2018b). The RfDs for PFOA and PFOS were determined using the human equivalent doses (HEDs) derived from the NOAEL or LOAEL serum concentrations from animal studies (US EPA 2016d). The proposed RfD values for GenX and PFBS are derived from rodent models of subchronic and chronic toxicity (US EPA 2018a, 2018b).
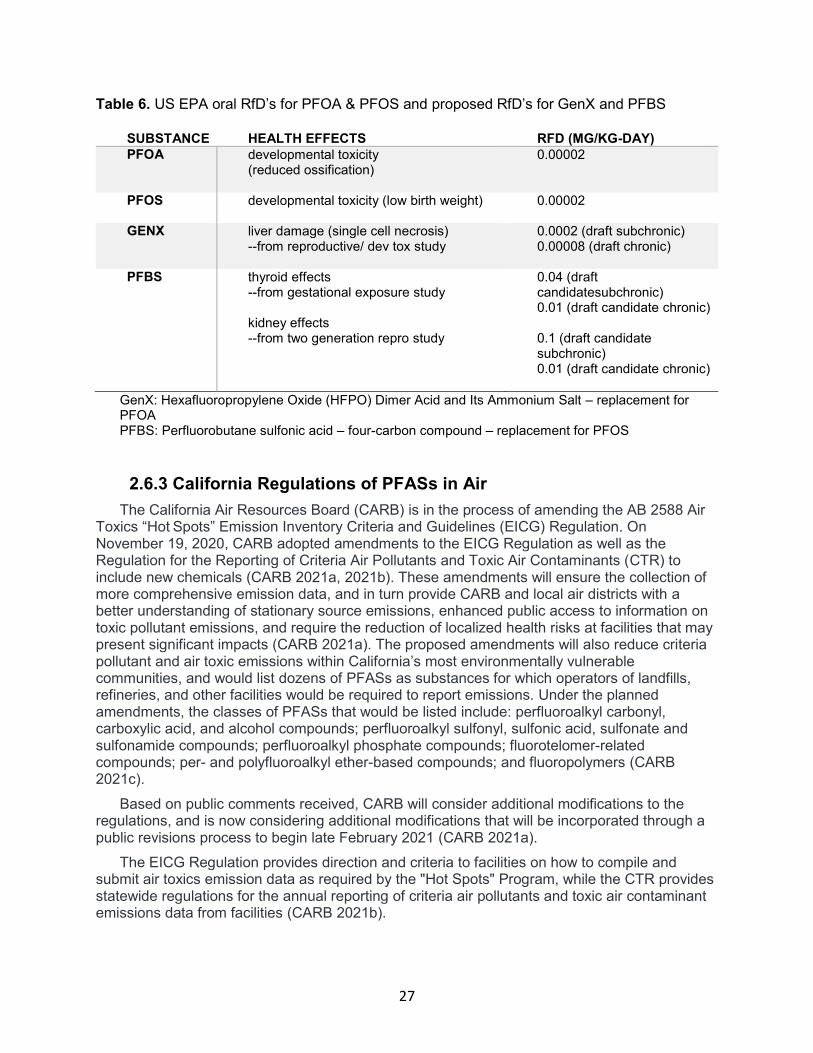
27
Table 6. US EPA oral RfD’s for PFOA & PFOS and proposed RfD’s for GenX and PFBS
SUBSTANCE HEALTH EFFECTS RFD (MG/KG-DAY)
PFOA developmental toxicity (reduced ossification)
0.00002
PFOS developmental toxicity (low birth weight)
0.00002
GENX liver damage (single cell necrosis) --from reproductive/ dev tox study
0.0002 (draft subchronic) 0.00008 (draft chronic)
PFBS thyroid effects --from gestational exposure study kidney effects --from two generation repro study
0.04 (draft candidatesubchronic) 0.01 (draft candidate chronic) 0.1 (draft candidate subchronic) 0.01 (draft candidate chronic)
GenX: Hexafluoropropylene Oxide (HFPO) Dimer Acid and Its Ammonium Salt – replacement for PFOA PFBS: Perfluorobutane sulfonic acid – four-carbon compound – replacement for PFOS
2.6.3 California Regulations of PFASs in Air
The California Air Resources Board (CARB) is in the process of amending the AB 2588 Air Toxics “Hot Spots” Emission Inventory Criteria and Guidelines (EICG) Regulation. On November 19, 2020, CARB adopted amendments to the EICG Regulation as well as the Regulation for the Reporting of Criteria Air Pollutants and Toxic Air Contaminants (CTR) to include new chemicals (CARB 2021a, 2021b). These amendments will ensure the collection of more comprehensive emission data, and in turn provide CARB and local air districts with a better understanding of stationary source emissions, enhanced public access to information on toxic pollutant emissions, and require the reduction of localized health risks at facilities that may present significant impacts (CARB 2021a). The proposed amendments will also reduce criteria pollutant and air toxic emissions within California’s most environmentally vulnerable communities, and would list dozens of PFASs as substances for which operators of landfills, refineries, and other facilities would be required to report emissions. Under the planned amendments, the classes of PFASs that would be listed include: perfluoroalkyl carbonyl, carboxylic acid, and alcohol compounds; perfluoroalkyl sulfonyl, sulfonic acid, sulfonate and sulfonamide compounds; perfluoroalkyl phosphate compounds; fluorotelomer-related compounds; per- and polyfluoroalkyl ether-based compounds; and fluoropolymers (CARB 2021c).
Based on public comments received, CARB will consider additional modifications to the regulations, and is now considering additional modifications that will be incorporated through a public revisions process to begin late February 2021 (CARB 2021a).
The EICG Regulation provides direction and criteria to facilities on how to compile and submit air toxics emission data as required by the "Hot Spots" Program, while the CTR provides statewide regulations for the annual reporting of criteria air pollutants and toxic air contaminant emissions data from facilities (CARB 2021b).
28
2.6.4 California Regulations of PFAS Use in Chrome Plating Operations
Chrome plating and chromic acid anodizing facilities frequently use PFASs to suppress hexavalent chromium (Cr(VI)) mist. PFAS fume suppressants reduce surface tension in the plating/anodizing bath, causing gas bubbles to become smaller and rise more slowly than larger bubbles with less kinetic energy. As a result, Cr(VI) is less likely to become airborne (US EPA 2009). The first use of PFASs for chrome mist suppression was reported in 1954 (Haley & Aldrich 2020). In the late 1980s, PFOS quickly became the industry standard as the most economic method to comply with the Maximum Achievable Control Technology (MACT) standard established for Cr(VI). In 1995, the US EPA published the final MACT standard for chromium electroplaters and PFOS use increased. A 2003 survey conducted by CARB reported that 190 of 222 chrome electroplating operations in California used a fume suppressant, and almost all of these used PFOS as the active ingredient (CARB 2006; Haley & Aldrich 2020) In 2015, the US EPA banned PFOS in chrome plating fume suppressants, which California adopted following a one-year extension to the federal ban (Haley & Aldrich 2020). In September 2016, CARB approved five non-PFOS alternatives for use in chrome plating and chromic acid anodizing applications: Fumetrol 21 LF2, Dicolloy CRPF, HCA- 8.4, and Macuplex STR NPFX (CARB 2016).1 These fume suppressants have since been utilized as replacements for PFOS suppressants for specified chrome plating and chromic acid anodizing operations in California (Haley & Aldrich 2020). These newer non-PFOS fume suppressants, however, may contain other PFASs (SWRCB 2019b).
More recently, in October of 2019, the SWRCB issued regulatory requirements to nearly 270 chrome plating operations throughout California through Water Code sections 13267 and 13383 (SWRCB 2019b). This order identified chrome plating facilities that have “stored and/or used fume suppressants or other substances that may contain per- and polyfluoroalkyl substances (PFASs)”. If fume suppressants or other substances containing PFASs were disposed or released to the surrounding environment, the order requires these chrome plating facilities to submit a site investigation work plan detailing potential pathways for PFAS discharge and the nature of potential PFAS contamination, perform the site investigation, and submit results for the site in a final report (SWRCB 2020b). Currently, it is reasonable to conclude that PFASs may be present in and around most Cr(VI) electroplating operations.
2.6.5 Recent California Ban on PFASs Use in Firefighting Foams
In the early 1970s, municipalities, the hydrocarbon-processing industry, and the US military began using PFAS-based aqueous film-forming foam (AFFF) to efficiently extinguish hydrocarbon-based or flammable liquid fires (Moody and Field 2000). During fire training, equipment maintenance, and emergency response, AFFF was released directly to the environment (Anderson et al. 2016). AFFFs have been identified as one of the major sources of PFAS pollution in California water (Clean Water Action 2020).
On September 29th, 2020, Governor Gavin Newsom signed SB-1044 into law which prohibits the sale of PFAS-based firefighting foam after January 1st, 2022. The bill also requires the state to track AFFF sales and bars the use of these foams in training classes and restricts the disposal of unused foams (CA Senate 2020). Additionally, manufacturers must disclose to buyers whether firefighting gear contains PFASs.
1 Note, an ether-PFAS, F-53B, is used as an alternative to PFOS in chrome mist suppressants in China.
29
2.6.6 California Priority Products
The California Department of Toxic Substance Control (DTSC) has also proposed classifying "Carpets and Rugs with PFASs" as a "Priority Product", which means a consumer product containing one or more chemicals that "… can harm people or the environment" (DTSC 2019). Listing as a Priority Product will initiate reporting requirements and an Alternatives Analysis. As of October 2020, "Carpets and Rugs with PFASs" is listed as a proposed, pre-regulatory Priority Product. The following PFAS-containing Priority Products have also been proposed: (1) treatments for use on converted textiles or leathers and (2) plant fiber-based food packaging.
3 Sources of PFASs in Outdoor & Indoor Air and the Potential for Long-Range Transport (Task 1B)
Indoor and outdoor air is contaminated by PFASs due to emissions from industrial processes that manufactured and/or used PFASs (stationary and area sources); volatilization from consumer products containing PFASs (e.g., carpets and textiles); fugitive emissions from legacy use sites (AFFF foam application), land disposal facilities (landfills) and contaminated media (e.g., house dust); or entrainment of PFASs adsorbed to airborne particulate matter (Buck et al. 2011; ITRC 2020; Prevedouros et al. 2006; US EPA 2020a). The vapor pressure, and hence volatility, of PFASs vary greatly, with some PFASs in the volatile organic compound (VOC) range, e.g., 4:2 FTOH (vapor pressure = 3.42 mmHg at 25 oC), and others that are virtually non-volatile such as PFOS (vapor pressure = 2.48e-6 mmHg at 25 oC) (Table 7). The vapor pressures for 48 selected PFASs presented in Table 7 range from 8.19 x10⁻⁹ mmHg (25 oC) for PFHxS to 9.62 mmHg (25 oC) for perfluorobutyric acid (PFBA) (US EPA CompTox Chemicals Dashboard). As a result, some PFASs are present in air primarily in the gas phase, while other compounds may be primarily present in the solid phase adsorbed to particles. Compounds with higher vapor pressures, such as FTOHs, are present in air as gases and have a higher potential for long-range transport. Compounds with moderate vapor pressures may be in air both as a gas and adsorbed to particles at the same time, and the relative proportion of gas-phase versus solid-phase PFAS may vary by temperature and season, with a higher proportion of gas-phase contaminant in summer months and higher particle associated solid-phase contaminant in winter when temperatures are lower (ITRC 2020; Riedel et al. 2019).
Although PFOS and PFOA, the most prevalent PFASs in the United States, have largely been voluntarily phased out of use, some uses continue and they continue to persist in the environment (US EPA 2017). Indirect emissions of perfluoroalkyl acids (PFAAs) into the air can occur from biotransformation and abiotic degradation of precursor substances in the environment. The most common precursors are fluorotelomer alcohols (FTOHs) and perfluoroalkane sulfonamides (FASAs) which are commonly used in the synthesis of various surfactants and are incorporated into polymeric materials used in carpets and textiles (Buck et al. 2011). FTOHs are compounds that are partially fluorinated substances, i.e., part of the carbon chain is fully fluorinated, another part is a hydrocarbon. These are produced through telomerization processes, which is the method used to manufacture fluorotelomer-based surfactant and polymer products (Buck et al. 2011). Residual alcohols left unreacted and unbound from the manufacturing process of polymers can be released into the air when their covalent bonds break. For example, the degradation of FTOHs through OH radical oxidation in the atmosphere yields PFCAs (Dinglasan-Panlilio and Mabury 2006). Unreacted and residual FOSE in textiles, leather, rugs, and paper products can also degrade in the environment to produce PFAAs, especially indoors, in places like office spaces (Dinglasan et al. 2004). In
30
addition, fluorotelomer sulfonates such as 6:2 FTS, now used as alternatives to PFOS in fire-fighting foam, can also be broken down to PFCAs (Swedish Chemicals Agency 2015).
Manufacturing facilities that use PFASs, such as chrome plating, electronics manufacturing, and oil recovery are also important source of environmental and air contamination (US EPA 2018c). As noted above, the metal plating industry has historically used PFASs in metal plating applications to reduce surface tension in chromium baths (Swedish Chemicals Agency 2015) and also as wetting agents for surface finishing, resulting in significant air contamination (ATSDR 2018). A 2003 survey conducted by CARB found that 190 of the 222 Cr(VI) electroplating operations in California used a fume suppressant to control Cr(VI) emissions. Almost all of the 190 operations used a chemical fume suppressant with PFOS as the active ingredient (CARB 2006).
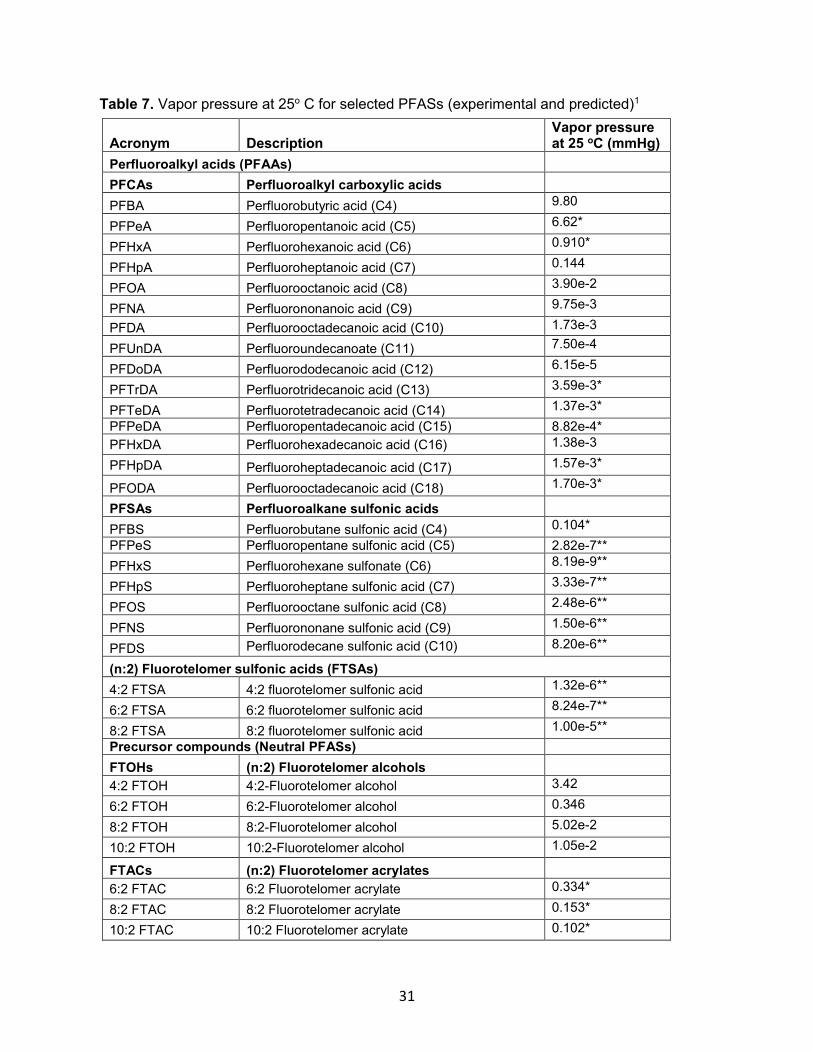
31
Table 7. Vapor pressure at 25o C for selected PFASs (experimental and predicted)1
Acronym Description Vapor pressure at 25 oC (mmHg)
Perfluoroalkyl acids (PFAAs)
PFCAs Perfluoroalkyl carboxylic acids
PFBA Perfluorobutyric acid (C4) 9.80
PFPeA Perfluoropentanoic acid (C5) 6.62*
PFHxA Perfluorohexanoic acid (C6) 0.910*
PFHpA Perfluoroheptanoic acid (C7) 0.144
PFOA Perfluorooctanoic acid (C8) 3.90e-2
PFNA Perfluorononanoic acid (C9) 9.75e-3
PFDA Perfluorooctadecanoic acid (C10) 1.73e-3
PFUnDA Perfluoroundecanoate (C11) 7.50e-4
PFDoDA Perfluorododecanoic acid (C12) 6.15e-5
PFTrDA Perfluorotridecanoic acid (C13) 3.59e-3*
PFTeDA Perfluorotetradecanoic acid (C14) 1.37e-3*
PFPeDA Perfluoropentadecanoic acid (C15) 8.82e-4*
PFHxDA Perfluorohexadecanoic acid (C16) 1.38e-3
PFHpDA Perfluoroheptadecanoic acid (C17) 1.57e-3*
PFODA Perfluorooctadecanoic acid (C18) 1.70e-3*
PFSAs Perfluoroalkane sulfonic acids
PFBS Perfluorobutane sulfonic acid (C4) 0.104*
PFPeS Perfluoropentane sulfonic acid (C5) 2.82e-7**
PFHxS Perfluorohexane sulfonate (C6) 8.19e-9**
PFHpS Perfluoroheptane sulfonic acid (C7) 3.33e-7**
PFOS Perfluorooctane sulfonic acid (C8) 2.48e-6**
PFNS Perfluorononane sulfonic acid (C9) 1.50e-6**
PFDS Perfluorodecane sulfonic acid (C10) 8.20e-6**
(n:2) Fluorotelomer sulfonic acids (FTSAs)
4:2 FTSA 4:2 fluorotelomer sulfonic acid 1.32e-6**
6:2 FTSA 6:2 fluorotelomer sulfonic acid 8.24e-7**
8:2 FTSA 8:2 fluorotelomer sulfonic acid 1.00e-5**
Precursor compounds (Neutral PFASs)
FTOHs (n:2) Fluorotelomer alcohols
4:2 FTOH 4:2-Fluorotelomer alcohol 3.42
6:2 FTOH 6:2-Fluorotelomer alcohol 0.346
8:2 FTOH 8:2-Fluorotelomer alcohol 5.02e-2
10:2 FTOH 10:2-Fluorotelomer alcohol 1.05e-2
FTACs (n:2) Fluorotelomer acrylates
6:2 FTAC 6:2 Fluorotelomer acrylate 0.334*
8:2 FTAC 8:2 Fluorotelomer acrylate 0.153*
10:2 FTAC 10:2 Fluorotelomer acrylate 0.102*

32
Table 7 (Cont.) Vapor pressure at 25o C for selected PFASs (experimental and predicted)1
Acronym Description Vapor pressure at 25 oC (mmHg)
FTMACs (n:2) Fluorotelomer methacrylates
6:2 FTMAC 6:2 Fluorotelomer methacrylate 0.116*
8:2 FTMAC 8:2 Fluorotelomer methacrylate 2.20e-2
10:2 FTMAC 10:2 Fluorotelomer methacrylate 5.60e-3
Perfluoroalkane sulfonamides (FASAs)
FOSA Perfluorooctane sulfonamide 0.248
Perfluoroalkane sulfonamido ethanols
FOSE Perfluorooctane sulfonamidoethanol 2.16e-4*
N-Alkyl perfluoroalkane sulfonamidoacetic acids (FASAAs)
MeFOSAA N-methyl perfluorooctane sulfonamidoacetic acid 4.08e-5*
EtFOSAA N-ethyl perfluorooctane sulfonamidoacetic acid 2.41e-5*
N-Alkyl perfluoroalkane sulfonamides
EtFOSA Ethyl perfluorooctane sulfonamide 4.28e-7
MeFOSA Methyl perfluorooctane sulfonamide 7.80e-2*
Perfluoroalkane sulfonamidoethanols (FASEs)
EtFOSE N-Ethylperfluorooctane sulfonamide ethanol 3.78e-3
MeFOSE N-Methylperfluorooctane sulfonamide ethanol 1.50e-5
n:2 Polyfluoroalkyl phosphoric acid esters
6:2 diPAP 6:2 Fluorotelomer phosphate diester 1.90e-5
8:2 diPAP 8:2 Fluorotelomer phosphate diester 1.60e-7*
10:2 diPAP 10:2 Fluorotelomer phosphate diester 3.64e-9*
GenX Hexafluoropropylene oxide dimer acid (HFPO-DA) fluoride, ammonium salt
0.262
Source: US EPA CompTox Chemicals Dashboard. https://comptox.epa.gov/dashboard 1High volatility: >1; Medium volatility: <1 to >0.001; Low volatility: <0.001 * = predicted median value if no experimental data was available ** = predicted average if no predicted median value was available
Sources of PFASs that may contribute to air levels include contaminated soil, cooking utensils, fire-fighting foams, window and floor polishes, waxes, paints, cleaning products, cosmetics, stain- or water-repellent fabrics and carpets, food packaging and other consumer products (EWG 2018; US EPA 2018c). For example, analysis of fluorotelomers in air samples associated with the ski wax use showed high concentrations of FTOH (a precursor for PFASs) in indoor air (Swedish Chemicals Agency 2015). PFASs may also be used in plant protection agents such as pesticides and are also used in tropical environments against termites, cockroaches and other insects (Munoz et al. 2017) (Swedish Chemicals Agency 2015). Furthermore, airports have been important local emission sources due to use of fluorosurfactants that leads to uncontrolled emissions into the surrounding environment
33
(Jouanneau et al. 2020). Recent studies have reported that household dust and inhalation of indoor air account for some of the most prevalent sources of PFASs and human exposure (Poothong et al. 2020; Sunderland et al. 2019). In summary, use of these products serves as a vehicle for the transmission of PFASs into the environment (Swedish Chemicals Agency 2015).
3.1 Potential for Long-range transport of PFASs and PFAS precursors
Many PFASs are resistant to degradation in the environment and have been detected in remote locations in the United States and Arctic and Antarctic regions (Lindstrom et al. 2011; Muir et al. 2019), including in humans and arctic mammals (Gibson 2020). PFASs and volatile precursors such as fluorotelomer alcohols (FTOHs) can undergo long-range atmospheric transport (LRT) by two pathways: marine transport of ionic compounds and atmospheric transport of volatile precursors followed by oxidizing degradation (Zhao et al. 2012). In the atmosphere, FTOHs can be degraded to PFCAs and PFSAs by OH radical oxidation. For example, 8:2 FTOH, a commonly manufactured fluorotelomer, can be cleaved to form PFOA. These processes essentially result in “global distillation” where compounds emitted in temperate regions are transported and deposited in polar or other remote regions (Lindstrom et al. 2011).
Elevated levels of PFASs have been detected in the North Atlantic Ocean and in the Greenland Sea. Common compounds detected were PFBS, PFHxS, PFHxA, PFOA and PFOS (Zhao et al. 2012). Elevated levels of PFOA in the Greenland Sea were likely first deposited from the atmosphere, released from melting Arctic snow and ice, and later transported south towards the Atlantic (Zhao et al. 2012). PFASs released northward of European countries can be transported to the polar Arctic regions by combining with PFASs delivered by the North Atlantic Current from North America.
The presence of PFCAs and PFSAs compounds in air and lake water in remote mountains, and the occurrence of precursor degradation intermediates in precipitation, Arctic sediments, and air particles have shown that atmospheric transport and degradation is a key pathway of contamination in remote locations (Dreyer et al. 2009; Young et al. 2007). Volatile PFAS precursors like FTOH and FTAC are emitted into the atmosphere during the manufacturing and production of fluoropolymers and surfactants (Prevedouros et al. 2006) (Dinglasan-Panlilio and Mabury 2006).
Early studies estimated the Arctic deposition of PFOA from the oxidation of FTOHs to be between 50-500 kg/a (Schenker et al. 2008; Wania 2007). In another study, 20 high-volume air samples were collected during a crossing of the North Atlantic and Canadian Archipelago in July 2005. The highest concentrations were found for 8:2 FTOH (5.8-26 pg/mg3). For PFASs, MeFOSE was dominant with levels between 2.6-31 pg/mg3). Analysis of these air samples showed that they were representative of the Arctic air mass. These reported air concentrations were on the same order of magnitude as the air concentrations of these chemicals in source regions. Thus, these results confirmed models which predict efficient, long-range atmospheric transport of PFASs and related compounds to the Arctic region (Shoeib et al. 2006).
In the Arctic, PFASs have been detected in the snow, likely the result of atmospheric deposition caused by long-range transport. Armitage et al. also found that atmospheric transport of PFOA and PFOS to the Southern Ocean was faster than transport by ocean currents (Armitage et al. 2006). These results are consistent with other research showing that atmospheric transport was a significant contributor of PFCAs and PFSAs in the Southern Ocean (Dreyer et al. 2009). Importantly, these studies strongly support the hypothesis that long-range transport of PFASs and its volatile precursors through ocean currents and atmospheric
34
degradation is a key driver of PFAS contamination in remote locations where there are no direct emissions sources.
3.6.1 Contamination of Drinking Water Supplies
In the US, PFASs in drinking water has been linked to industrial sites, military fire training areas, and wastewater treatment plants (Hu et al. 2016). The California Water Board has recently conducted studies to measure drinking water supplies across California for PFAS contamination (SWRCB 2020b). In 2017, these studies reported PFAS concentrations above the detection limit in 74 community water systems serving 7.5 million Californians (EWG 2019). High levels have been detected in wells serving the southern part of the Camp Pendleton Marine Corps base in San Diego County, the City of Corona, and areas of Oroville, Rosemont, and other Sacramento suburbs. PFASs have been detected in water systems throughout California including those found in remote areas. This water sampling was performed, however, only at sites expected to be at risk of PFAS contamination (e.g., next to landfills, chrome plating, etc.), thus the results are not necessarily representative of the average contamination across the State. These studies focused on testing of wells providing drinking water to communities across the State; however, they did not monitor the lakes and watersheds that supply these wells. Based on water sampling in California, there is likely PFAS contamination in these remote areas, which may expose humans and adversely impact wildlife, game, and watersheds. Testing in these areas should be a focus for future work.
3.2 PFAS Concentrations in Outdoor Air and Indoor Air
3.2.1 PFAS Levels in Outdoor Air
Five published studies conducted between 2004 and 2007 report outdoor PFAS air concentrations in the U.S (Boulanger et al. 2005; Kim and Kannan 2007; Piekarz et al. 2007; Stock et al. 2004) (Barton et al. 2006) (Tables 8 and 9). Reporting conventions by the studies were not consistent and target analytes also varied. The detection frequencies for PFASs in air were not provided in any of these studies, although they were sometimes reported for other media. Only Kim and Kannan 2007 reported the mean, median, and maximum (pg/mg3) outdoor air concentrations for both gas and solid phase particle-associated measurements.
Reported concentrations from these studies varied with PFOS ranging from 0.64-8.1 pg/mg3 for particle phase measurements (Boulanger et al. 2005; Kim and Kannan 2007). Only Kim and Kannan reported gas-phase measurements for PFOS, with a range of 0.94-3.0 pg/mg3, a mean of 1.7 pg/mg3 and a median of 1.42 pg/mg3 (Tables 8 and 9). Overall, concentrations did not differ greatly and tended to be lower than measurements indoors (see below).
Outdoor air concentrations of precursor compounds (see Glossary of PFAS Terms and Abbreviations, above) are also detected in air, and appear to be associated with proximate industrial activities. Mean levels of MeFOSE of 359 pg/mg3 were detected in Griffin, GA (Stock et al. 2004), with lower levels in Reno, NV (<40 pg/mg3), Cleves, OH (20 pg/mg3), and Mount Bachelor, Oregon (11 pg/mg3) (Piekarz et al. 2007). The higher levels in Griffin, GA were associated with carpet manufacturing and treatment industries (Table 8). In contrast, EtFOSE levels in Reno NV were higher than other locations (199 pg/mg3) (Tables 8 and 9) (Boulanger et al. 2005; Piekarz et al. 2007; Stock et al. 2004). Other precursor compounds, including 6:2 FTOH, 8:2 FTOH, and 10:2 FTOH were often present when tested.
In another study, high volume sampling was performed along the fence line of a fluoropolymer manufacturing facility (Washington Works) located near Parkersburg, WV, in the
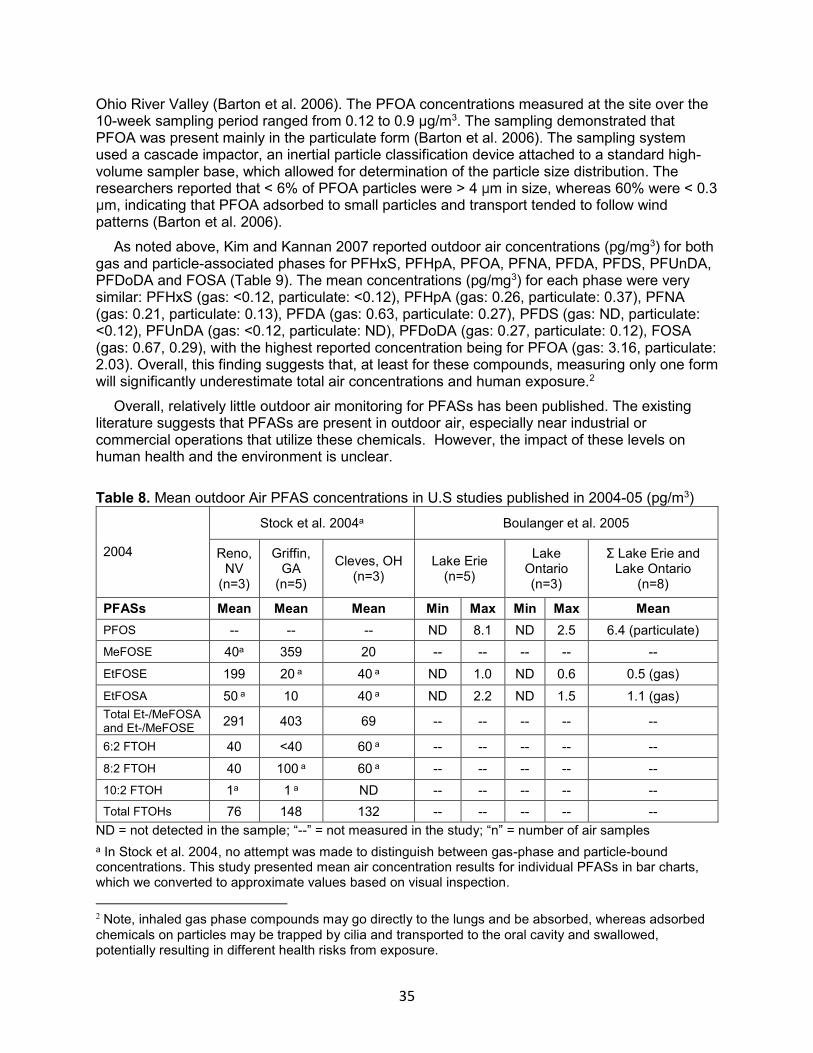
35
Ohio River Valley (Barton et al. 2006). The PFOA concentrations measured at the site over the 10-week sampling period ranged from 0.12 to 0.9 μg/m3. The sampling demonstrated that PFOA was present mainly in the particulate form (Barton et al. 2006). The sampling system used a cascade impactor, an inertial particle classification device attached to a standard high-volume sampler base, which allowed for determination of the particle size distribution. The researchers reported that < 6% of PFOA particles were > 4 μm in size, whereas 60% were < 0.3 μm, indicating that PFOA adsorbed to small particles and transport tended to follow wind patterns (Barton et al. 2006).
As noted above, Kim and Kannan 2007 reported outdoor air concentrations (pg/mg3) for both gas and particle-associated phases for PFHxS, PFHpA, PFOA, PFNA, PFDA, PFDS, PFUnDA, PFDoDA and FOSA (Table 9). The mean concentrations (pg/mg3) for each phase were very similar: PFHxS (gas: <0.12, particulate: <0.12), PFHpA (gas: 0.26, particulate: 0.37), PFNA (gas: 0.21, particulate: 0.13), PFDA (gas: 0.63, particulate: 0.27), PFDS (gas: ND, particulate: <0.12), PFUnDA (gas: <0.12, particulate: ND), PFDoDA (gas: 0.27, particulate: 0.12), FOSA (gas: 0.67, 0.29), with the highest reported concentration being for PFOA (gas: 3.16, particulate: 2.03). Overall, this finding suggests that, at least for these compounds, measuring only one form will significantly underestimate total air concentrations and human exposure.2
Overall, relatively little outdoor air monitoring for PFASs has been published. The existing literature suggests that PFASs are present in outdoor air, especially near industrial or commercial operations that utilize these chemicals. However, the impact of these levels on human health and the environment is unclear.
Table 8. Mean outdoor Air PFAS concentrations in U.S studies published in 2004-05 (pg/m3)
2004
Stock et al. 2004a Boulanger et al. 2005
Reno, NV
(n=3)
Griffin, GA
(n=5)
Cleves, OH (n=3)
Lake Erie (n=5)
Lake Ontario (n=3)
Σ Lake Erie and Lake Ontario
(n=8)
PFASs Mean Mean Mean Min Max Min Max Mean
PFOS -- -- -- ND 8.1 ND 2.5 6.4 (particulate)
MeFOSE 40a 359 20 -- -- -- -- --
EtFOSE 199 20 a 40 a ND 1.0 ND 0.6 0.5 (gas)
EtFOSA 50 a 10 40 a ND 2.2 ND 1.5 1.1 (gas) Total Et-/MeFOSA and Et-/MeFOSE
291 403 69 -- -- -- -- --
6:2 FTOH 40 <40 60 a -- -- -- -- --
8:2 FTOH 40 100 a 60 a -- -- -- -- --
10:2 FTOH 1a 1 a ND -- -- -- -- --
Total FTOHs 76 148 132 -- -- -- -- --
ND = not detected in the sample; “--” = not measured in the study; “n” = number of air samples
a In Stock et al. 2004, no attempt was made to distinguish between gas-phase and particle-bound concentrations. This study presented mean air concentration results for individual PFASs in bar charts, which we converted to approximate values based on visual inspection.
2 Note, inhaled gas phase compounds may go directly to the lungs and be absorbed, whereas adsorbed
chemicals on particles may be trapped by cilia and transported to the oral cavity and swallowed, potentially resulting in different health risks from exposure.
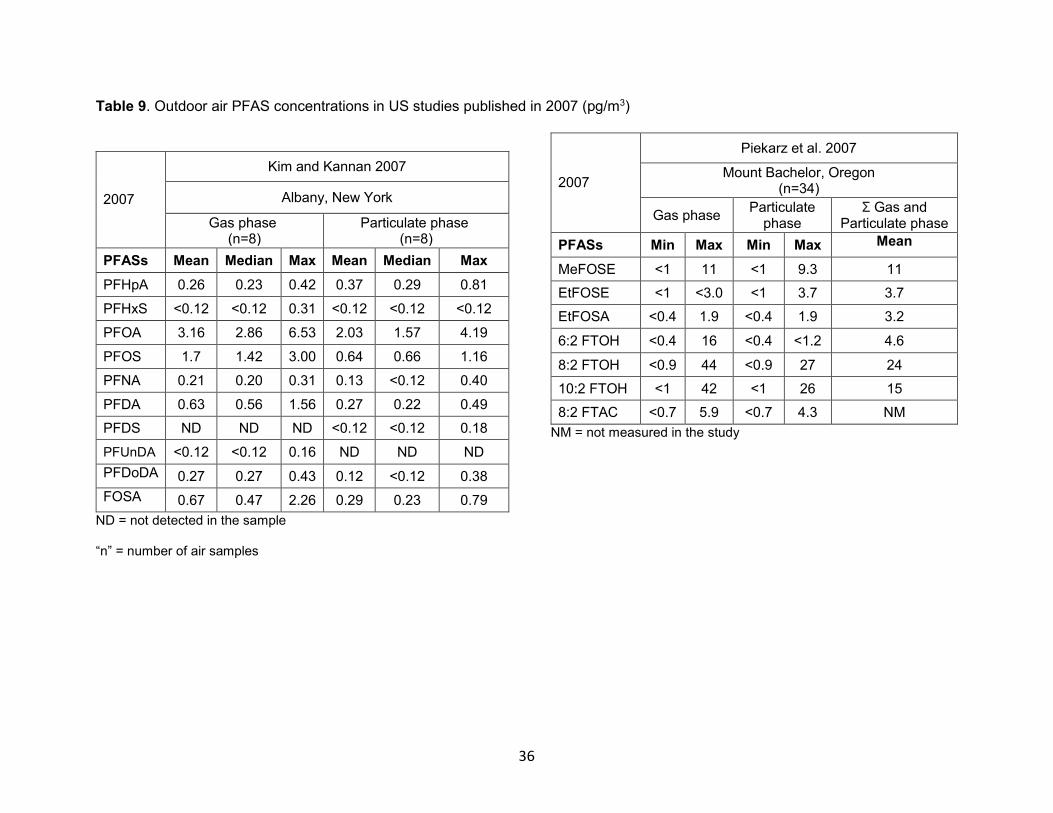
36
Table 9. Outdoor air PFAS concentrations in US studies published in 2007 (pg/m3)
2007
Kim and Kannan 2007
Albany, New York
Gas phase (n=8)
Particulate phase (n=8)
PFASs Mean Median Max Mean Median Max
PFHpA 0.26 0.23 0.42 0.37 0.29 0.81
PFHxS <0.12 <0.12 0.31 <0.12 <0.12 <0.12
PFOA 3.16 2.86 6.53 2.03 1.57 4.19
PFOS 1.7 1.42 3.00 0.64 0.66 1.16
PFNA 0.21 0.20 0.31 0.13 <0.12 0.40
PFDA 0.63 0.56 1.56 0.27 0.22 0.49
PFDS ND ND ND <0.12 <0.12 0.18
PFUnDA <0.12 <0.12 0.16 ND ND ND
PFDoDA 0.27 0.27 0.43 0.12 <0.12 0.38
FOSA 0.67 0.47 2.26 0.29 0.23 0.79
ND = not detected in the sample
“n” = number of air samples
2007
Piekarz et al. 2007
Mount Bachelor, Oregon (n=34)
Gas phase Particulate
phase Σ Gas and
Particulate phase
PFASs Min Max Min Max Mean
MeFOSE <1 11 <1 9.3 11
EtFOSE <1 <3.0 <1 3.7 3.7
EtFOSA <0.4 1.9 <0.4 1.9 3.2
6:2 FTOH <0.4 16 <0.4 <1.2 4.6
8:2 FTOH <0.9 44 <0.9 27 24
10:2 FTOH <1 42 <1 26 15
8:2 FTAC <0.7 5.9 <0.7 4.3 NM
NM = not measured in the study
37
3.2.2 Rainwater and other environmental monitoring media as an indicator of PFAS emissions into the air
Many recent studies have collected and analyzed rainwater for PFASs. Rainwater PFAS contamination is an important consideration in locations near factories that produce PFASs such as the Chemours facility in North Carolina (NC DEQ 2020). Emissions from factories like Chemours are making their way into drinking water through rainfall. The North Carolina Department of Environmental Quality (DEQ) has measured GenX, a short chain PFAS, in rainfall 20 miles from the Chemours facility (NC DEQ 2018). Multiple North American studies have reported PFASs in rainwater collected in urban areas and remote areas as well as near industrial facilities (Barton et al. 2007; Kim and Kannan 2007; Scott et al. 2006; Yeung et al. 2017). For example, Kim and Kannan (2007) measured perfluoroalkyl acids (PFAAs) in various environmental matrices (air, rain, snow, surface runoff water, and lake water) in downtown Albany New York and surrounding lakes. Total PFAA concentrations ranged from 8.28 to 16.0 pg/m3 (mean 11.3 pg/m3) in bulk air (sum of vapor and particulate phases), 0.91 to 13.2 ng/L (6.19 ng/L) in rainwater, 0.91 to 23.9 ng/L (7.98 ng/L) in snow, 1.11–81.8 ng/L (15.1 ng/L) in surface runoff water (SRW), and 9.49 to 35.9 ng/L (21.8 ng/L) in lake water (Kim and Kannan 2007). Perfluorooctanoic acid (PFOA) was the predominant compound, accounting for >35% of the total PFAA concentrations, in all environmental matrices analyzed. Yeung et al 2017 sampled rain and river water in Toronto Canada. The study found the standard deviation of the differences between the river and rain sample concentrations to be between 2-16%. Short chain PFASs accounted for 80% of detectable PFASs highlighting the need for short chain PFASs to be further monitored (Yeung et al. 2017). Barton et al. 2007 collected rainwater and outdoor air samples in a 2-mile radius around a manufacturing facility in Parkersburg, West Virginia that used the ammonium salt of PFOA. PFOA was measured at each sample location at concentrations ranging from undetectable to 1660 ng/L. This range of values illustrates the ability for PFOA to travel in the atmosphere and deposit in rainfall. It is a complex process that depends on meteorological conditions and the gas/particulate distribution of compounds in the atmosphere. These authors reported that the majority of the PFOA was associated with particles < 2.5 μ (aerodynamic diameter) in the atmosphere. This is a significant finding that affects the behavior of PFOA and likely other PFASs in the atmosphere resulting in long-range transport from emissions sources (Barton et al. 2007). Rainwater is typically collected in polypropylene bottles and analyzed using ultra performance liquid chromatography coupled to tandem mass spectrometry (UPLC-MS/ MS) and liquid chromatography/tandem mass spectrometry (LC/MS/MS). Results show high detection frequencies of PFASs measured in rainwater, highlighting the potential for long-range transport and the utility of measuring PFASs in this environmental media.
In summary, because of the relatively high water solubility of many PFASs, monitoring their presence in rainwater and other media provides a novel indicator of emissions and deposition in the environment.
3.2.3 PFAS Levels in Indoor Air (North American Studies)
We reviewed two US studies and one Canadian study that reported PFAS concentrations in indoor air (Tables 10 and 11). The fluorotelomer alcohols were most frequently detected, with 6:2 FTOH and 8:2 FTOH detected in 100% of samples (Fraser et al. 2012; Mackey et al. 2017).
Schlummer et al. (2013) measured PFCA precursors (FTOHs) in air samples from ten US workplace environments and a car interior (Schlummer et al. 2013) (Table 10). The study
38
employed a low-volume active air sampling membrane pump (5-50 m3/48h) placed ~50 cm above ground, using Isolute ENV + solid-phase extraction (SPE) cartridges for capturing neutral, volatile PFASs. The FTOH concentrations presented in Table 10 were measured in the gas phase by GC–CI–MS analysis. Concentrations of FTOH measured in indoor air ranged from 0.15-46.8 ng/m3 for 6:2 FTOH, 0.25-286 ng/m3 for 8:2 FTOH, and 0.11-57.5 ng/m3 for 10:2 FTOH. Importantly, the highest concentrations in indoor air were in shops selling outdoor clothing, textiles, and carpets. Emission rates from selected textiles were as high as 494 ng/h for 8:2 FTOH. The median and the 95th percentile of 8:2 FTOH levels in the investigated indoor air samples were 8.43 ng/m3 and 175 ng/m3, respectively. The highest levels were found in a workplace environment. The authors estimated a median daily exposure of 202 ng FTOH/day or 3.37 ng FTOH/kg bw day (Schlummer et al. 2013).
A second US study investigated indoor air concentrations in 31 offices in Boston, MA (Fraser et al. 2012). Particulate and gas phase neutral PFASs were collected and extracted together for total air concentrations of fluorotelomer alcohols (6:2 FTOH, 8:2 FTOH, 10:2 FTOH), perfluoroalkane sulfonamides (MeFOSA, EtFOSA) and perfluoroalkane sulfonamidoethanols
(MeFOSE, EtFOSE). Air samples were not extracted for ionic compounds during analysis; thus, measurement of the less volatile, ionic PFASs such as PFOA and PFOS was not possible. The study employed active air sampling (4 L/min for 96 hours) using glass fiber filters (GFF) and a PUF/XAD-2 cartridge. Neutral PFASs were measured by gas chromatography−positive chemical ionization mass spectrometry (GC−PCIMS). FTOH concentrations in the office air samples were higher than Me-/EtFOSA and Me-/EtFOSE (Fraser et al. 2012)
The highest geometric mean concentration was for 8:2 FTOH (9.9 ng/m3) with a range of 0.283-70.6 ng/m3 (Fraser et al. 2012) (Table 11). 6:2 FTOH had a geometric mean of 1.3 ng/m3
with a range of <0.0195 -11 ng/m3, whereas 10:2 FTOH had a geometric mean of 2.85 ng/m3
with a range of 0.138-12.6 ng/m3. MeFOSE had the highest concentration among the sulfonamides, with a geometric mean of 0.28 ng/m3 (range = 0.0485– 3.88 ng/m3).
Furthermore, this study posited that office air concentrations of PFOA would most likely be orders of magnitude lower than the much more volatile precursor FTOHs (Fraser et al. 2012). This is likely due to the high volatility of FTOHs and the low volatility of PFOA and the fact that FTOHs are often present in unbound and residual forms in household items such as carpets, which can be released into air. However, Fraser et al. 2012 found a strong positive association between FTOHs in office air and PFOA concentrations in serum. This evidence suggests that exposure to FTOHs in air contributes substantially to the body burden of PFOA and inhalation indoors is a possible exposure pathway.
A third study conducted in Vancouver, Canada attempted to determine the extent to which precursors to PFAAs in air determine serum PFAA concentrations (Makey et al. 2017). The study analyzed 50 maternal serum samples for PFAAs such as PFOA, PFOS and PFNA and measured PFAAs and their precursors (FTOHs, Me-/EtFOSA and Me-/EtFOSE) in air using passive air samplers deployed in residential bedrooms (Makey et al. 2017). Indoor air was sampled using SIP (sorbent impregnated polyurethane foam disks) passive air samplers, deployed in bedrooms for 4 weeks. The precursor compounds, including FTOHs and FOSA/Es, were measured in the gas phase and the PFAAs were measured in the particle phase. Air samples were analyzed for PFAAs using HPLC/MS/MS and FTOHs and FOSA/Es were analyzed using gas-chromatography positive chemical ionization mass spectrometry (GC-(PCI)MS) (Makey et al. 2017) (Table 11). Results from this study were consistent with those reported by Fraser et al. (2012). PFOS levels in indoor bedroom air were all below the level of detection (<DL), which was attributed to the fact that airborne indoor PFOS levels are generally low and non detected due to low instrument sensitivity. The geometric mean concentrations for PFAAs and precursor PFAAs in indoor air were as follows: PFOA (0.047 ng/m3), PFNA (0.0015
39
ng/m3), MeFOSA (0.028 ng/m3), EtFOSA (0.02 ng/m3), MeFOSE (0.38 ng/m3), EtFOSE (0.05 ng/m3), 8:2 FTOH (2.4 ng/m3), 10:2 FTOH (0.96 ng/m3). The sulfonamide alcohols (MeFOSE, EtFOSE) had higher concentrations in air than the alkyl substituted sulfonamides (MeFOSA, EtFOSA). The study found that concentrations of PFAA precursors were higher than for PFAAs in air, and air samples were dominated by FTOHs while PFNA was infrequently detected. The results also demonstrated that airborne 10:2 FTOHs and MeFOSE/A in bedrooms were associated with serum PFOA/PFNA and PFOS levels, respectively. For a one unit increase in MeFOSE in air (ng/m3) there was a 0.75 ng/m3 increase in serum PFOS; for one unit increase in 10:2 FTOH (ng/m3) there was a 0.22 ng/m3 increase in serum PFOA. Only PFNA in air predicted serum PFNA. The study lacked the statistical power to detect small associations and recommended more studies with stronger power (Makey et al. 2017).
Overall, these studies suggest that airborne PFAA precursors are associated with different perfluoroalkyl substances in the body (PFOA, PFOS and PFNA). All three studies also suggest that inhalation of air may represent an important exposure pathway for PFASs in a variety of indoor environments.
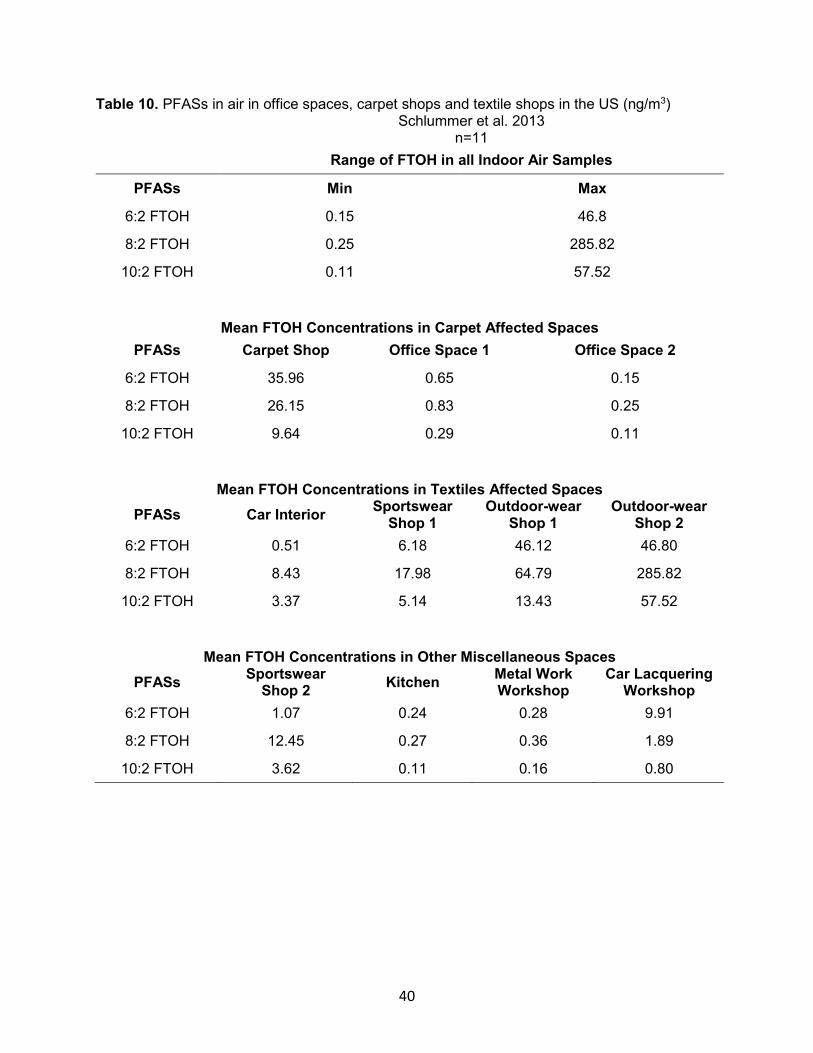
40
Table 10. PFASs in air in office spaces, carpet shops and textile shops in the US (ng/m3)
Schlummer et al. 2013 n=11
Range of FTOH in all Indoor Air Samples
PFASs Min Max
6:2 FTOH 0.15 46.8
8:2 FTOH 0.25 285.82
10:2 FTOH 0.11 57.52
Mean FTOH Concentrations in Carpet Affected Spaces
PFASs Carpet Shop Office Space 1 Office Space 2
6:2 FTOH 35.96 0.65 0.15
8:2 FTOH 26.15 0.83 0.25
10:2 FTOH 9.64 0.29 0.11
Mean FTOH Concentrations in Textiles Affected Spaces
PFASs Car Interior Sportswear
Shop 1 Outdoor-wear
Shop 1 Outdoor-wear
Shop 2
6:2 FTOH 0.51 6.18 46.12 46.80
8:2 FTOH 8.43 17.98 64.79 285.82
10:2 FTOH 3.37 5.14 13.43 57.52
Mean FTOH Concentrations in Other Miscellaneous Spaces
PFASs Sportswear
Shop 2 Kitchen
Metal Work Workshop
Car Lacquering Workshop
6:2 FTOH 1.07 0.24 0.28 9.91
8:2 FTOH 12.45 0.27 0.36 1.89
10:2 FTOH 3.62 0.11 0.16 0.80
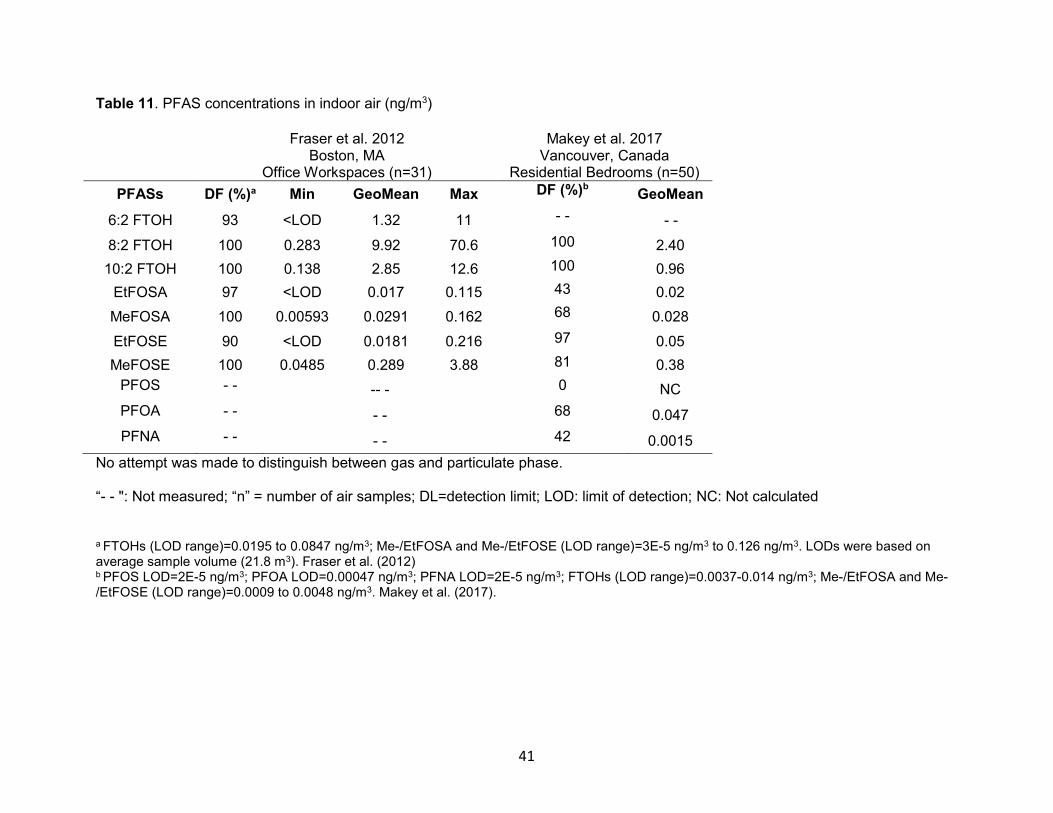
41
Table 11. PFAS concentrations in indoor air (ng/m3)
Fraser et al. 2012
Boston, MA Office Workspaces (n=31)
Makey et al. 2017 Vancouver, Canada
Residential Bedrooms (n=50)
PFASs DF (%)a Min GeoMean Max DF (%)b GeoMean
6:2 FTOH 93 <LOD 1.32 11 - - - -
8:2 FTOH 100 0.283 9.92 70.6 100 2.40
10:2 FTOH 100 0.138 2.85 12.6 100 0.96
EtFOSA 97 <LOD 0.017 0.115 43 0.02
MeFOSA 100 0.00593 0.0291 0.162 68 0.028
EtFOSE 90 <LOD 0.0181 0.216 97 0.05
MeFOSE 100 0.0485 0.289 3.88 81 0.38
PFOS - - -- - 0 NC
PFOA - - - - 68 0.047
PFNA - - - - 42 0.0015
No attempt was made to distinguish between gas and particulate phase. “- - ": Not measured; “n” = number of air samples; DL=detection limit; LOD: limit of detection; NC: Not calculated a FTOHs (LOD range)=0.0195 to 0.0847 ng/m3; Me-/EtFOSA and Me-/EtFOSE (LOD range)=3E-5 ng/m3 to 0.126 ng/m3. LODs were based on average sample volume (21.8 m3). Fraser et al. (2012) b PFOS LOD=2E-5 ng/m3; PFOA LOD=0.00047 ng/m3; PFNA LOD=2E-5 ng/m3; FTOHs (LOD range)=0.0037-0.014 ng/m3; Me-/EtFOSA and Me-/EtFOSE (LOD range)=0.0009 to 0.0048 ng/m3. Makey et al. (2017).
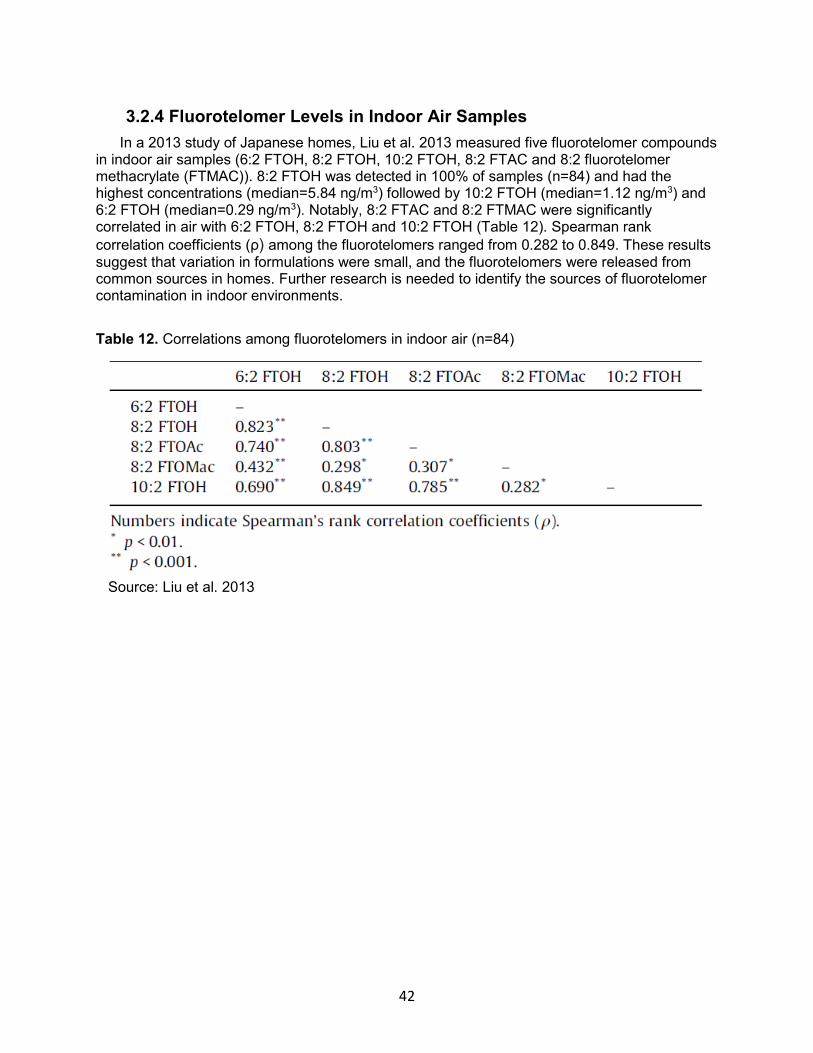
42
3.2.4 Fluorotelomer Levels in Indoor Air Samples
In a 2013 study of Japanese homes, Liu et al. 2013 measured five fluorotelomer compounds in indoor air samples (6:2 FTOH, 8:2 FTOH, 10:2 FTOH, 8:2 FTAC and 8:2 fluorotelomer methacrylate (FTMAC)). 8:2 FTOH was detected in 100% of samples (n=84) and had the highest concentrations (median=5.84 ng/m3) followed by 10:2 FTOH (median=1.12 ng/m3) and 6:2 FTOH (median=0.29 ng/m3). Notably, 8:2 FTAC and 8:2 FTMAC were significantly correlated in air with 6:2 FTOH, 8:2 FTOH and 10:2 FTOH (Table 12). Spearman rank
correlation coefficients (ρ) among the fluorotelomers ranged from 0.282 to 0.849. These results suggest that variation in formulations were small, and the fluorotelomers were released from common sources in homes. Further research is needed to identify the sources of fluorotelomer contamination in indoor environments.
Table 12. Correlations among fluorotelomers in indoor air (n=84)
Source: Liu et al. 2013
43
4 Evaluation of air sampling methods for PFAS compounds (Task 1C)
4.1 Overview
For over a decade, numerous studies have attempted to measure PFASs in air using a variety of outdoor and indoor air sampling methods (Nakayama et al. 2019). These methods include both active and passive air sampling. Active air sampling, using high volume active air samplers (HV-AAS) and low volume active air samplers (LV-AAS), requires the use of a pumping device to actively pull air through a collection medium. Passive air sampling (PAS) relies on the kinetic energy of gas molecules and diffusion of gases onto a sorbent medium (Wania et al. 2003).
Chemical-specific physical and chemical properties will inform selected methods for collecting and analyzing each PFAS in air. Vapor pressure and persistence will also determine which sampling and analysis methods can be used. For example, very volatile species will be more likely to have breakthrough problems with a given sorbent, and neutral/volatile versus ionic species will generally be more amenable to GC or LC, respectively, and have different collection efficiencies on different media. Table 7 summarizes the vapor pressures of 48 selected PFASs.
Both HV-AAS and LV-AAS have been used for measuring PFASs in outdoor air. LV-AAS are often used to sample indoor air. The sampling media these active samplers typically employ are quartz fiber filters (QFFs) or glass fiber filters (GFFs) for particle phase sampling and PUF/XAD-2 cartridges (XAD-2 resin sandwiched between a polyurethane plug cut in half) for gas-phase sampling. Air sampling method abbreviations are defined in Table 13.
Passive air samplers are frequently used to measure PFASs in outdoor and indoor air. Currently, there are multiple passive air samplers in use that employ different sampling media: PUF-PAS uses a polyurethane foam disk; SIP-PAS uses a sorbent-impregnated polyurethane disk; XAD-PAS can involve using steel cartridges filled with XAD resin; and PE-PAS involves the use of polyethylene sheets (Ahrens et al. 2013; Dixon-Anderson and Lohmann 2018; Karásková et al. 2018). Uncertainty exists regarding the ability of passive systems to capture PFAAs in air and quantify air concentrations for PFASs where there is a high particle associated fraction (e.g., FOSEs, longer chained PFSAs and PFCAs) (Arhens et al. 2013). Methods for sampling PFASs using active and passive air samplers are summarized in Table 14.
Table 13. Air sampling methods terminology
Abbreviation Description
HV-AAS High-volume active air sampler
LV-AAS Low-volume active air sampler
GFF Glass fiber filter
QFF
XAD
Quartz fiber filter
Styrene-divinylbenzene co-polymer sorbent medium
PUF-XAD-2 sandwich/cartridge XAD-2 resin sandwiched between a polyurethane plug cut in half
PUF-PAS Polyurethane foam passive air sampler
SIP-PAS Sorbent impregnated polyurethane foam disk passive air sampler
XAD-PAS Styrene divinylbenzene co-polymer resin passive air sampler
PE-PAS Polyethylene sheet passive air sampler
44
4.2 Active vs. Passive Air Sampling
HV-AAS are used for measuring PFASs in the atmosphere because of their ability to provide information on the gas and particle-phase distribution of analytes and collect large air volumes accurately (Ahrens et al. 2013). However, due to pump noise and the need for electrical service nearby, these samplers are not typically used to provide the spatial coverage needed to understand distributions of PFASs and are often not ideal for indoor sampling (Ahrens et al. 2013). Furthermore, in human exposure assessment, personal AAS systems show that single location assessment does not accurately depict human exposure patterns. HV-AAS and LV-AAS use QFFs and GFFs to sample particle-phase concentrations along with PUF/XAD-2 cartridges to sample gas-phase concentrations (see Table 14). Due to its high sorption capacity, XAD-2 can trap gaseous compounds effectively. Thus, AAS can provide information on the gas and particle phase-distribution of analytes and temporal resolution. However, at low outdoor air concentrations, gas-phase compounds can irreversibly sorb to QFFs and GFFs, preventing gas-phase compounds from passing through these filters to downstream sorbents. As a result, it becomes difficult to distinguish particle-associated compounds (Kim and Park 2014). This limits their usefulness when measuring polar, target compounds when time-weighted sampling is desired (Shoeib et al. 2008).
XAD-4 in SIP-PAS has a high sorption capacity for organic and polar compounds and lengthens PAS deployment by expanding the linear uptake range. Another type of PAS, XAD-PAS (steel cartridges filled with 10g of XAD-2 resin), is considered more appropriate for polar compounds than PUF-PAS, but it has a limited ability to collect particle-phase compounds, and thus may not be ideal for ionic PFASs like PFOA (Tables 14 and 15).
Diffusion rates in a passive air sampler are influenced by atmospheric temperature and pressure at the sampling location. Thus, whether or not a compound is in the gas- or particle-phase is a function of the temperature and can affect sampling methods and detection frequency of specific samplers (Karásková et al. 2018; Wania et al. 2003).
4.2.1 Annular Diffusion Denuder Samplers
Several studies measuring atmospheric fate and long-range transport of PFASs have used annular diffusion denuders to more accurately measure gas-particle partitioning of PFASs (Ahrens et al. 2011; Ahrens et al. 2012). Annular diffusion denuders measure semi-volatile organic compounds (SVOCs) and atmospheric carbonaceous aerosols in ambient air (Fan et al. 2003; Zhang et al. 2013) and are designed to improve separation of gas-phase and particle-phase contaminants (see graphic, below). Studies using annular denuders employ an Integrated Organic Gas and Particle Sampler (IOGAPS) system, which consists of multi-channel annular denuders in tandem for the gas phase, followed by a filter pack for collecting the particle phase (Ahrens et al. 2011; Zhang et al. 2013). The multi-channel configuration provides additional surface area to expand capacity for absorbing gas-phase compounds. The surfaces of the denuder are coated with ground XAD-4, and the filter pack consists of GFF and QFF in series (Tables 14 and 15). Furthermore, there are backup sorbent impregnated filters (SIFs) to capture any particles that may have evaporated (Fan et al. 2003). In the denuder, the gas-phase is captured first using the XAD-4 coated layer, followed by the particle phase collection on GFF and QFF (Ahrens et al. 2011).
Techniques using annular denuders have helped improve speciation between gas-phase and particle bound phase due to the use of ground XAD-4 powder coating, which is finer than the XAD-2 used in HV-AAS, and has more surface area (Ahrens et al. 2011). In general, the use of an annular diffusion denuder results in lower particle-associated fractions due to reduction of sampling artifacts by collecting the gas-phase first (Ahrens et al. 2011). This sampling approach

45
overcomes a potential “blow-on artifact” of traditional systems, where vapor phase PFSAs and PFCAs adsorb onto GFF or QFF before reaching the sorbent, resulting in higher particle-associated fractions than should be expected. However, the use of the denuder itself can also result in negative and positive sampling error (Ahrens et al. 2011). Further, blow-on artifacts are not observed for more volatile PFASs. Regardless, denuders do generate more accurate gas and particle phase concentrations for PFSAs and PFCAs (Table 14). Although we did not identify any studies using annular denuder techniques to measure PFAS in outdoor air, their use for measuring SVOCs in other studies suggests possible utility in measuring ambient PFAS.
Source: Arhens et al. 2011. Analytical Chemistry. 2011;
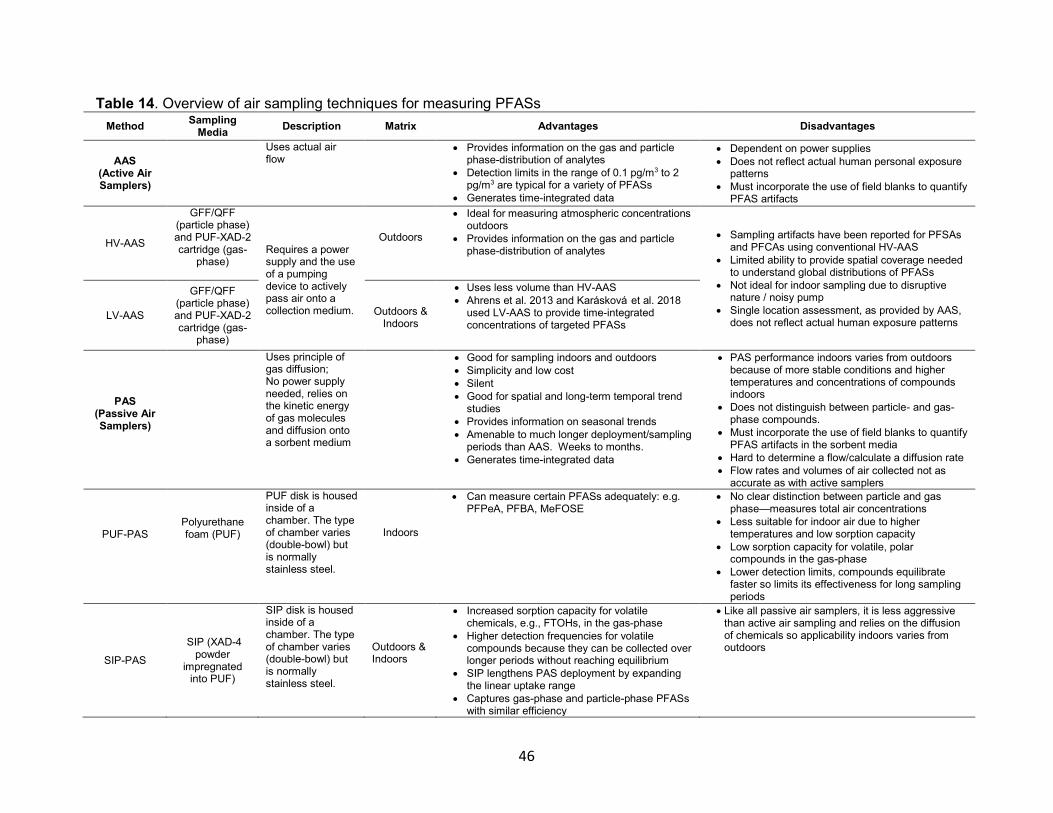
46
Table 14. Overview of air sampling techniques for measuring PFASs
Method Sampling
Media Description Matrix Advantages Disadvantages
AAS (Active Air Samplers)
Uses actual air flow
Provides information on the gas and particle phase-distribution of analytes
Detection limits in the range of 0.1 pg/m3 to 2 pg/m3 are typical for a variety of PFASs
Generates time-integrated data
Dependent on power supplies
Does not reflect actual human personal exposure patterns
Must incorporate the use of field blanks to quantify PFAS artifacts
HV-AAS
GFF/QFF (particle phase) and PUF-XAD-2 cartridge (gas-
phase)
Requires a power supply and the use of a pumping device to actively pass air onto a collection medium.
Outdoors
Ideal for measuring atmospheric concentrations outdoors
Provides information on the gas and particle phase-distribution of analytes
Sampling artifacts have been reported for PFSAs and PFCAs using conventional HV-AAS
Limited ability to provide spatial coverage needed to understand global distributions of PFASs
Not ideal for indoor sampling due to disruptive nature / noisy pump
Single location assessment, as provided by AAS, does not reflect actual human exposure patterns
LV-AAS
GFF/QFF (particle phase) and PUF-XAD-2 cartridge (gas-
phase)
Outdoors &
Indoors
Uses less volume than HV-AAS
Ahrens et al. 2013 and Karásková et al. 2018 used LV-AAS to provide time-integrated concentrations of targeted PFASs
PAS (Passive Air Samplers)
Uses principle of gas diffusion; No power supply needed, relies on the kinetic energy of gas molecules and diffusion onto a sorbent medium
Good for sampling indoors and outdoors
Simplicity and low cost
Silent
Good for spatial and long-term temporal trend studies
Provides information on seasonal trends
Amenable to much longer deployment/sampling periods than AAS. Weeks to months.
Generates time-integrated data
PAS performance indoors varies from outdoors because of more stable conditions and higher temperatures and concentrations of compounds indoors
Does not distinguish between particle- and gas-phase compounds.
Must incorporate the use of field blanks to quantify PFAS artifacts in the sorbent media
Hard to determine a flow/calculate a diffusion rate
Flow rates and volumes of air collected not as accurate as with active samplers
PUF-PAS
Polyurethane foam (PUF)
PUF disk is housed inside of a chamber. The type of chamber varies (double-bowl) but is normally stainless steel.
Indoors
Can measure certain PFASs adequately: e.g. PFPeA, PFBA, MeFOSE
No clear distinction between particle and gas phase—measures total air concentrations
Less suitable for indoor air due to higher temperatures and low sorption capacity
Low sorption capacity for volatile, polar compounds in the gas-phase
Lower detection limits, compounds equilibrate faster so limits its effectiveness for long sampling periods
SIP-PAS
SIP (XAD-4 powder
impregnated into PUF)
SIP disk is housed inside of a chamber. The type of chamber varies (double-bowl) but is normally stainless steel.
Outdoors & Indoors
Increased sorption capacity for volatile chemicals, e.g., FTOHs, in the gas-phase
Higher detection frequencies for volatile compounds because they can be collected over longer periods without reaching equilibrium
SIP lengthens PAS deployment by expanding the linear uptake range
Captures gas-phase and particle-phase PFASs with similar efficiency
Like all passive air samplers, it is less aggressive than active air sampling and relies on the diffusion of chemicals so applicability indoors varies from outdoors

47
Table 14 (Cont.). Overview of air sampling techniques for measuring PFASs
Method Sampling
Media Description Matrix Advantages Disadvantages
XAD-PAS XAD-2 (styrene divinylbenzene
resin)
Steel cartridges filled with XAD-2 resin
Outdoors
Appropriate for measuring gas-phase compounds in outdoor air
Sorption properties are not affected by moisture
Can be deployed for long periods of time (2-3 months).
Limited ability to measure ionic, particle-phase compounds
Lower uptake rate
Longer deployment time needed to collect sufficient air volume
PE-PAS Polyethylene
sheets
A low-density PE sheet 25 um in thickness, 0.9g placed inside an inverted stainless steel bowl
Outdoors
Potential for the detection of neutral, volatile PFASs at sites with elevated concentrations
Unclear whether they can be used effectively in background and remote sites
Annular Diffusion Denuder
XAD-4 (gas-phase) and
filter pack (GFF and QFF)
(particle-phase)
Multi-channel denuders coated with ground XAD-4, followed by a filter pack consisting of GFF and two QFFs in series, which together make up the integrated organic gas and particle sampler (IOGAPS)
Atmosphere/Outdoors
Improves speciation between gas-phase and particle bound phase
Generates more accurate air concentrations of gas and particle phase PFSAs and PFCAs compared to HV-AAS.
Use of ground XAD-4 coating ensures greater surface capacity
Superior recoveries and lower blank values for vapor PFASs, resulting in lower LODs
Avoids positive sampling artifacts for PFSAs and PFCAs by collecting gas-phase first, followed by the particle-phase.
Results useful for modeling atmospheric long- range transport, deposition, and overall fate of PFASs in the environment
Negative sampling error (underestimation of particle-phase) due to particle loss via evaporation to the gas-phase, which then passes through the filter
Positive sampling error (overestimation of particle-phase) due to ‘blow-on’ artifacts, where vapor phase compounds diffuse onto the GFF.
The migration of adsorbed compounds through a denuder is faster at higher temperatures, and may result in potential breakthrough and reduced sampling efficiency
Abbreviations: HV-AAS= High volume active air sampler; GFF= glass fiber filter; QFF= quartz fiber filter; PUF-XAD-2 sandwich= XAD-2 resin sandwiched between a polyurethane foam (PUF) plug cut in half; LV-AAS= low volume active air sampler; PAS= passive air sampler; PUF-PAS= polyurethane foam passive air sampler; SIP-PAS= sorbent-impregnated polyurethane foam disk passive air samplers; XAD-PAS= divinylbenzene resin- passive-air sampler; PE-PAS= polyethylene passive air sampler; LOD=limit of detection.

48
4.3 PFAS Air Sampling Methods in Selected Studies
Ahrens et al. 2013 employed four different sampling techniques: (1) PUF-PAS and (2) SIP-PAS in parallel with (3) HV-AAS and (4) LV-AAS for over one year in order to characterize the use of PAS for measurement of PFASs. Target analytes were PFCAs, PFSAs, FTOHs, FOSE, FTACs, FTMACs, and FOSA. For passive sampling, SIP and PUF disks were individually housed inside stainless steel chambers 2m above the ground. For active air sampling, HV-AAS (330 m3 over 24h periods) used GFFs for collecting particle phase analytes followed by a PUF/XAD-2 cartridge for trapping gas-phase compounds. The PUF/XAD-2 cartridge consisted of 15g of XAD-2 resin sandwiched between a PUF plug that was cut in half. LV-AAS (3.3 m3/day) used PUF-XAD-2 cartridges (1.5g of XAD-2 resin sandwiched between a PUF plug) to sample gas- and particle-phase compounds (sum). SIP disks showed good performance for all target PFAS analytes while PUF disks were found to be suitable only for PFSAs (See Figure 3 adapted from Ahrens et al. 2013). Consistent with Shoeib et al. (2008), the functionality of the SIP-PAS for uptake of PFCA and FTOH was greatly improved compared to PUF-PAS (Ahrens et al. 2013; Shoeib et al. 2008). Greater sorption capacities were also observed for FOSE and FOSA, as seen by longer linear uptake curves (>56 days) compared to PUF-PAS (<28 days). Uptake for PFSA were similar in both PUF-PAS and SIP-PAS. In general, however, no significant differences were reported for PFAS concentrations measured by the four methods (Ahrens et al. 2013).
In general, SIP-PAS showed good agreement with the air concentrations determined by HV-AAS for all PFASs (Figure 3). For PUF-PAS, FOSA/FOSE concentrations showed a higher scattering of data due to the limited uptake capacity of PUF-PAS. The PFSA concentrations derived from SIP-PAS and PUF-PAS were lower compared to those measured by HV-AAS, which can be due to PFSA predominantly being in the particle phase. Overall, the difference for individual PFASs were within a factor of 2 using PUF-PAS and SIP-PAS compared to HV-AAS (Ahrens et al. 2013).
Figure 3. Average air concentrations using LV-AAS (gas- and particle-phase), HV-AAS (gas and particle-phase), SIP-PAS and PUF-PAS for PFASs (Arhens et al. 2013)
Karásková et al. (2018) deployed PAS in indoor and outdoor air and compared them to concentrations found using AAS. PUF-PAS and XAD-PAS (containing XAD-2 resin) were deployed in outdoor air in a suburban area and PUF-PAS in indoor air from a university lecture
49
room (Karásková et al. 2018). Samples were analyzed for four classes of PFASs: PFSA; PFCA; FOSE; and FOSAs and were compared against LV-AAS deployed indoors and outdoors. LV-AAS in outdoor air used both QFF and a PUF/XAD-2 (15g XAD) sandwich whereas LV-AAS indoors used QFF and PUF as the gas-phase sorbent. All of the 21 target PFASs were detected in at least one LV-AAS sample deployed outdoors. The median indoor concentrations of PFASs measured by AAS were 3x greater than those measured outdoors, dominated by PFBA and PFPeA, which are associated primarily with particles. This makes sense because the indoor LV-AAS only employed PUF, which resulted in a limited sorption capacity for gaseous PFASs.
The study found that PUF-PAS is an adequate sampler for PFBA, PFPeA, and MeFOSE, but performs as a total-air sampler rather than gas-phase only (Karásková et al. 2018). This finding is consistent with information presented by Shoeib et al. (2008). The study also found that the bulk of PFASs in outdoor air were present in the gas-phase; thus XAD-PAS seems appropriate for outdoor air-sampling, yet it has limited capacity for uptake of compounds in the particle phase (Tables 14 and 15). In general, PAS performance in indoor air differs from that in outdoor air because of the more stable atmospheric conditions and higher concentrations indoors. In order to determine air concentrations and volumes from a passive sampler, the sampler should ideally have a consistent, linear uptake of the target compound over time and should not equilibrate within the deployment period (Karásková et al. 2018). However, while the majority of compounds in this study were detected in PUF-PAS, they showed no increase in concentrations over time, suggesting rapid equilibration indoors. Further, higher temperatures and concentrations indoors could decrease the length of the linear uptake phase of samplers, leading to faster equilibration. This suggests that PUF-PAS is not an appropriate sampler for measuring PFASs indoors.
A study in Rhode Island, USA assessed the use of polyethylene passive samplers (PE-PAS) as a sampling tool for 9 neutral PFASs in air, specifically FTOHs, fluorotelomer acrylates (FTACs), perfluorinated sulfonamidoethanols (FOSEs), and sulfonamides (FOSAs) (Dixon-Anderson and Lohmann 2018). PE samplers are most suitable for the collection of gaseous, organic compounds due to its reliance on passive diffusion. PE sheets perform best at accumulating hydrophobic organic compounds, have a low cost, and provides insight into the transport processes of different compounds. Each passive sampler consisted of a low-density PE sheet 25 um in thickness, and contained 0.9g placed inside an inverted stainless steel bowl and woven onto a stainless steel wire. These were co-deployed with active air samples containing a PUF-XAD sandwich and were situated on the roof of a 4-story building. In contrast to AAS, all of the target compounds were found in the PE-PAS. MeFOSE and EtFOSE were detected at the highest concentrations (>1000 pg/g). The results of this study show the potential use of PE samplers in the detection of neutral, volatile PFASs in sites with elevated concentrations.
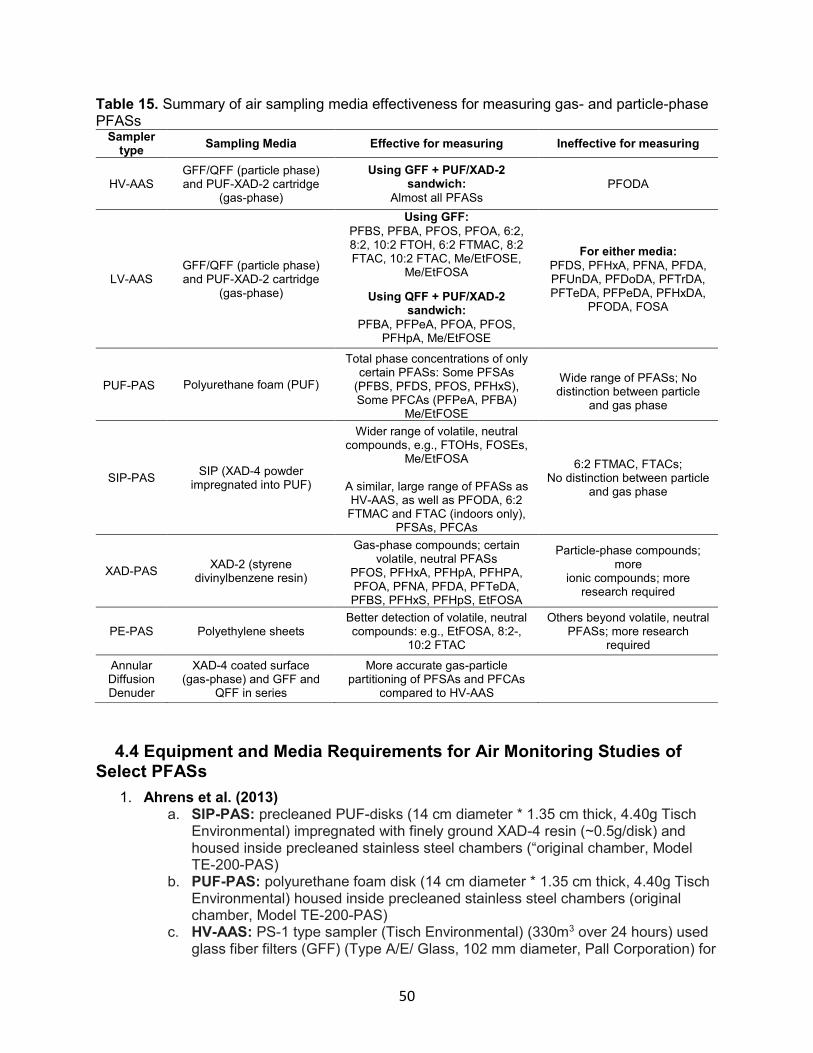
50
Table 15. Summary of air sampling media effectiveness for measuring gas- and particle-phase PFASs
Sampler type
Sampling Media Effective for measuring Ineffective for measuring
HV-AAS GFF/QFF (particle phase) and PUF-XAD-2 cartridge
(gas-phase)
Using GFF + PUF/XAD-2 sandwich:
Almost all PFASs PFODA
LV-AAS GFF/QFF (particle phase) and PUF-XAD-2 cartridge
(gas-phase)
Using GFF:
PFBS, PFBA, PFOS, PFOA, 6:2, 8:2, 10:2 FTOH, 6:2 FTMAC, 8:2 FTAC, 10:2 FTAC, Me/EtFOSE,
Me/EtFOSA
Using QFF + PUF/XAD-2 sandwich:
PFBA, PFPeA, PFOA, PFOS, PFHpA, Me/EtFOSE
For either media:
PFDS, PFHxA, PFNA, PFDA, PFUnDA, PFDoDA, PFTrDA, PFTeDA, PFPeDA, PFHxDA,
PFODA, FOSA
PUF-PAS Polyurethane foam (PUF)
Total phase concentrations of only certain PFASs: Some PFSAs
(PFBS, PFDS, PFOS, PFHxS), Some PFCAs (PFPeA, PFBA)
Me/EtFOSE
Wide range of PFASs; No distinction between particle
and gas phase
SIP-PAS SIP (XAD-4 powder
impregnated into PUF)
Wider range of volatile, neutral compounds, e.g., FTOHs, FOSEs,
Me/EtFOSA
A similar, large range of PFASs as HV-AAS, as well as PFODA, 6:2 FTMAC and FTAC (indoors only),
PFSAs, PFCAs
6:2 FTMAC, FTACs; No distinction between particle
and gas phase
XAD-PAS XAD-2 (styrene
divinylbenzene resin)
Gas-phase compounds; certain volatile, neutral PFASs
PFOS, PFHxA, PFHpA, PFHPA, PFOA, PFNA, PFDA, PFTeDA, PFBS, PFHxS, PFHpS, EtFOSA
Particle-phase compounds; more
ionic compounds; more research required
PE-PAS Polyethylene sheets Better detection of volatile, neutral compounds: e.g., EtFOSA, 8:2-,
10:2 FTAC
Others beyond volatile, neutral PFASs; more research
required
Annular Diffusion Denuder
XAD-4 coated surface (gas-phase) and GFF and
QFF in series
More accurate gas-particle partitioning of PFSAs and PFCAs
compared to HV-AAS
4.4 Equipment and Media Requirements for Air Monitoring Studies of Select PFASs
1. Ahrens et al. (2013) a. SIP-PAS: precleaned PUF-disks (14 cm diameter * 1.35 cm thick, 4.40g Tisch
Environmental) impregnated with finely ground XAD-4 resin (~0.5g/disk) and housed inside precleaned stainless steel chambers (“original chamber, Model TE-200-PAS)
b. PUF-PAS: polyurethane foam disk (14 cm diameter * 1.35 cm thick, 4.40g Tisch Environmental) housed inside precleaned stainless steel chambers (original chamber, Model TE-200-PAS)
c. HV-AAS: PS-1 type sampler (Tisch Environmental) (330m3 over 24 hours) used glass fiber filters (GFF) (Type A/E/ Glass, 102 mm diameter, Pall Corporation) for

51
the particle phase and PUF/XAD-2 cartridge for gas-phase (15g of XAD-2 resin (Supelpak-2, precleaned) sandwiched between a PUF plug cut in half (76 mm diameter, 60 mm thick precleaned).
d. LV-AAS: BGI-400-4 personal LV-AAS (~46m3 over 14 days). Used PUF/XAD-2 cartridge (1.5 g of XAD-2 sandwiched between a PUF plug (22 mm diameter and 76 mm long, precleaned from Supelco) cut in half and placed in the ORBO1000 glass sampling head (Supelco, Bellefonte, PA, USA).
2. Karásková et al. (2018) a. PUF-PAS: polyurethane foam samplers consisting of two stainless steel bowls
(24cm diameter lower bowl and 30 cm diameter upper bowl) surrounding a PUF disk (15cm diameter * 1.5 cm thick)
b. XAD-PAS: steel cartridges filled with 10g of XAD-2 resin c. LV-AAS (outdoors): QFF (Whatman 47 mm) for particle phase and PUF/XAD-2
sandwich (15g XAD-2 resin) d. LV-AAS (indoors): QFF (particle phase) and PUF (gas-phase)
3. Dixon-Anderson and Lohmann (2018) a. PE-PAS: low-density polyethylene (25µm thick, 0.9g each). PE sheet placed
inside an inverted stainless steel bowl. b. HV-AAS: high volume air sampler (24 m3/hour) (TE-PNY-1123, Tisch
Environmental) using a PUF/XAD-2 sandwich
4.5 Air Sample Volume, Recoveries and Detection Limits for Measuring PFASs
The equivalent air volume for a passive air sampler is a measure of the amount of air that has been sampled over a given exposure period. For analytes in the linear phase, the equivalent air volume can be calculated by multiplying the sampling of the analyte with the days of deployment. A passive diffusion rate is needed to calculate the air flow and volume for each sample. Air concentrations result from the lab results in total mass per compound divided by the total air volume collected. The diffusion rate is either available from the published literature or calculated in the field from data provided by collocated active samplers.
Table 16 summarizes air sample volumes and analytical limits of detection for measuring PFASs from selected studies. In Ahrens et al. 2013, for both PUF-PAS and SIP-PAS, all PFASs (except FOSA and FOSE in PUF-PAS) showed a lengthy uptake phase, with an average sampling rate of 3.5 m3/day. Thus, the study suggested a sampling rate of 4 m3/d for both PAS. For all classes of PFASs measured in SIP-PAS and PUF-PAS (except for FOSA and FOSE in PUF-PAS), the equivalent sample air volume was 112 m3 for a one-month deployment period. The sample volume for FOSA and FOSE in the PUF-PAS ranged from 39 m3-72 m3. The detection limits ranged from 0.007-9.177 pg/m3 for measuring PFSAs, Me-/EtFOSA and Me-/EtFOSE (PUF-PAS), and from 0.001-3.154 pg/m3 for measuring PFSAs, PFCAs, FTOHs, Me-/EtFOSA and Me-/EtFOSE (SIP-PAS). Air was collected by HV-AAS at a rate of 330 m3/day, and over an 8-month period the volume of air collected per day ranged from 245 m3 – 352 m3 or about 70-100x the PAS. The detection limits ranged from 0.001-1.020 pg/m3 (gas-phase; HV-AAS) and from 0.001-1.327 pg/m3 (particle phase; HV-AAS). The volume of air collected by LV-AAS (46 m3 over 14 days) over 8 months ranged from 39 m3 – 52 m3 per 2 weeks, with a sampling rate of 0.14 m3/hour or about 10x the PAS. The detection limits ranged from 0.005- 9.694 pg/m3 (LV-AAS) (Table 16). During extraction and analysis, 17 mass-labeled internal standards, three injection standards, and three isotopically labeled fluorinated depuration compounds were used to determine recovery rates. Average recoveries were 78%, 96%, 67%,
52
81%, and 93% for the LV-AAS, SIP-PAS, PUF-PAS, and gas phase (HV-AAS) and particle phase (HV-AAS), respectively.
In Karásková et al. (2018), the LV-AAS sampler flow rates outdoors were 2.3 m3/h for one week, with an average volume was 373.5 m3 per sample outdoors and 344.47 m3 per sample indoors. The detection limits for measuring PFSAs, PFCAs, Me-/EtFOSA and MeFOSE ranged from 0.011-0.926 pg/m3 sampling outdoors with LV-AAS, and from 0.004-0.207 pg/m3 sampling indoors with LV-AAS. For XAD-PAS, the calculated sampling rate for a variety of compounds ranged from 0.7 m3/day (for PFPeA) -14 m3/day (for PFBS). For PUF-PAS, the measured sampling rate for a variety of compounds ranged from 0.5 m3/day (for PFOS) - 30 m3/day (for PFPeA). Thirteen mass-labeled standards (MPFBA, MPFHxA, MPFOA, M8PFOA, MPFNA, MPFDA, MPFUnDA, MPFDoDA, MPFHxS, MPFOS, M8PFOS, dMeFOSA, dMeFOSE) were used to determine recoveries. The average percent recovery for those labelled target compounds depended on sampling matrices, ranging from 47 ± 4.6% for M8PFOA in PUF-PAS to 102 ± 7.3% for M8PFOS in PUF/XAD/PUF-LV-AAS.
Finally, in Dixon-Anderson and Lohmann (2018), the average HV-AAS sampling rate was 24 m3/h. Poor chromatography prevented the quantification of PFASs in the HV-AAS samples. The detection limits for measuring FTOHs, FTACs, Me-/EtFOSA and Me-/EtFOSE using PE-PAS ranged from 0.1-0.8 pg/m3 (outdoors). Native and mass-labeled surrogate standards were used. Recoveries of the surrogate standards were 80 ± 48% for 6:2 FTOH, 72 ± 23% for 8:2 FTOH, 75 ± 32% for 10:2 FTOH, 88 ± 29% for MeFOSA, and 87 ± 32% for MeFOSE. Recoveries tended to be greater for active sampling media (polyurethane foams: 70–123%) compared to PE-PAS (polyethylenes: 27–121%).
In a review completed by Nakayama et al., typical total air sampling volumes for active air sampling ranged from 300-2,000 m3 for outdoor air and 20-200 m3 for indoor air, with volumes decreasing to 0.2-8 m3 in recent studies (Nakayama et al. 2019). Detection limits ranged from 0.008-4.2 pg/m3 for measuring FTOHs, FASEs, FASAs and FTACs outdoors (HV-AAS), and from 0.03-71 pg/m3 for measuring PFSAs, PFCAs, FTOHs, FASAs, FASEs, diPAPs and fluorotelomer unsaturated carboxylic acids (FTUCAs) indoors (LV-AAS).
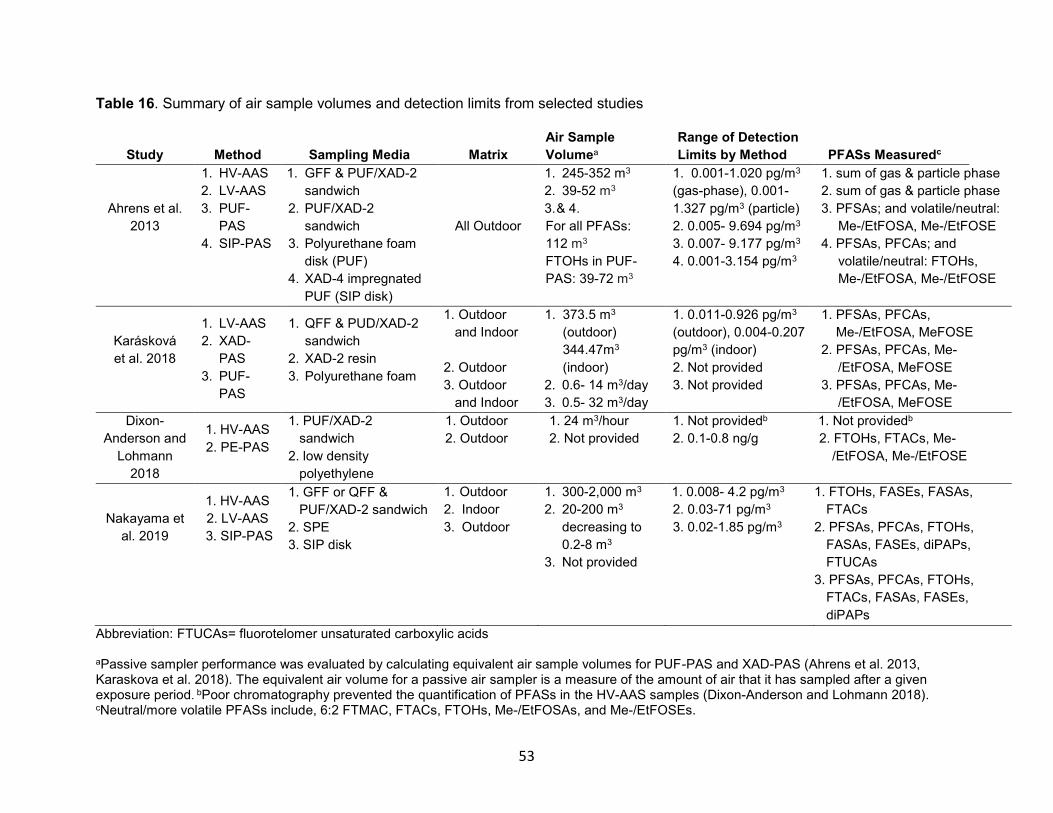
53
Table 16. Summary of air sample volumes and detection limits from selected studies
Study
Method
Sampling Media
Matrix
Air Sample
Volumea
Range of Detection
Limits by Method
PFASs Measuredc
Ahrens et al.
2013
1. HV-AAS
2. LV-AAS
3. PUF-
PAS
4. SIP-PAS
1. GFF & PUF/XAD-2
sandwich
2. PUF/XAD-2
sandwich
3. Polyurethane foam
disk (PUF)
4. XAD-4 impregnated
PUF (SIP disk)
All Outdoor
1. 245-352 m3
2. 39-52 m3
3. & 4.
For all PFASs:
112 m3
FTOHs in PUF-
PAS: 39-72 m3
1. 0.001-1.020 pg/m3
(gas-phase), 0.001-
1.327 pg/m3 (particle)
2. 0.005- 9.694 pg/m3
3. 0.007- 9.177 pg/m3
4. 0.001-3.154 pg/m3
1. sum of gas & particle phase
2. sum of gas & particle phase
3. PFSAs; and volatile/neutral:
Me-/EtFOSA, Me-/EtFOSE
4. PFSAs, PFCAs; and
volatile/neutral: FTOHs,
Me-/EtFOSA, Me-/EtFOSE
Karásková
et al. 2018
1. LV-AAS
2. XAD-
PAS
3. PUF-
PAS
1. QFF & PUD/XAD-2
sandwich
2. XAD-2 resin
3. Polyurethane foam
1. Outdoor
and Indoor
2. Outdoor
3. Outdoor
and Indoor
1. 373.5 m3
(outdoor)
344.47m3
(indoor)
2. 0.6- 14 m3/day
3. 0.5- 32 m3/day
1. 0.011-0.926 pg/m3
(outdoor), 0.004-0.207
pg/m3 (indoor)
2. Not provided
3. Not provided
1. PFSAs, PFCAs,
Me-/EtFOSA, MeFOSE
2. PFSAs, PFCAs, Me-
/EtFOSA, MeFOSE
3. PFSAs, PFCAs, Me-
/EtFOSA, MeFOSE
Dixon-
Anderson and
Lohmann
2018
1. HV-AAS
2. PE-PAS
1. PUF/XAD-2
sandwich
2. low density
polyethylene
1. Outdoor
2. Outdoor
1. 24 m3/hour
2. Not provided
1. Not providedb
2. 0.1-0.8 ng/g
1. Not providedb
2. FTOHs, FTACs, Me-
/EtFOSA, Me-/EtFOSE
Nakayama et
al. 2019
1. HV-AAS
2. LV-AAS
3. SIP-PAS
1. GFF or QFF &
PUF/XAD-2 sandwich
2. SPE
3. SIP disk
1. Outdoor
2. Indoor
3. Outdoor
1. 300-2,000 m3
2. 20-200 m3
decreasing to
0.2-8 m3
3. Not provided
1. 0.008- 4.2 pg/m3
2. 0.03-71 pg/m3
3. 0.02-1.85 pg/m3
1. FTOHs, FASEs, FASAs,
FTACs
2. PFSAs, PFCAs, FTOHs,
FASAs, FASEs, diPAPs,
FTUCAs
3. PFSAs, PFCAs, FTOHs,
FTACs, FASAs, FASEs,
diPAPs
Abbreviation: FTUCAs= fluorotelomer unsaturated carboxylic acids
aPassive sampler performance was evaluated by calculating equivalent air sample volumes for PUF-PAS and XAD-PAS (Ahrens et al. 2013, Karaskova et al. 2018). The equivalent air volume for a passive air sampler is a measure of the amount of air that it has sampled after a given exposure period. bPoor chromatography prevented the quantification of PFASs in the HV-AAS samples (Dixon-Anderson and Lohmann 2018). cNeutral/more volatile PFASs include, 6:2 FTMAC, FTACs, FTOHs, Me-/EtFOSAs, and Me-/EtFOSEs.
54
4.6 Air Sampling Method / Media Effectiveness
4.6.1 Passive Air Sampling
Overall, when comparing SIP-PAS and PUF-PAS, SIP-PAS detected almost all of the compounds targeted by Ahrens et al. (2013) (Figure 1): PFBS, PFHxS, PFOS, PFDS, PFBA, PFPeA, PFHxA, PFHpA, PFOA, PFNA, PFDA, PFUnDA, PFDoDA, PFTrDA, PFTeDA, PFPeDA, PFHxDA, PFODA, 6:2 FTOH, 8:2 FTOH, 10:2 FTOH, MeFOSA, EtFOSA, MeFOSE, and EtFOSE. Although Karásková et al. 2018 showed higher detection frequencies of PFASs from PUF-PAS compared with Ahrens et al. (2013), SIP-PAS still exceeds PUF-PAS detection frequencies in both contexts. SIP-PAS showed better agreement with air concentrations determined by HV-AAS outdoors for almost all PFASs classes except 8:2 FTMAC, FTACs, and FOSA. Similarly, XAD-PAS also detected almost identical sets of PFASs as LV-AAS did. In both cases, PUF-PAS had more variation than the concentrations detected by active air samplers.
In both studies, it was determined that PUF-PAS has a lower sorptive capacity than SIP-PAS and XAD-PAS. While PUF-PAS can be used to sample certain PFSAs and their precursors outdoors (PFBS, PFHxS, PFDS, Me/EtFOSA, Me/EtFOSE and some PFCAs (PFBA, PFPeA)3 (Karásková et al. 2018), there are several factors that make this media inappropriate for sampling PFASs outdoors and indoors. Its low sorption capacity means that it has the potential to detect fewer PFASs than HV-AAS, LV-AAS, and SIP-PAS. In the case that compounds are detectable (as seen with Karásková et al. 2018), the concentrations typically are significantly different from PFAS levels measured using active air samplers, and are thus less appropriate for sampling a wide range of PFASs. For example, compounds that were not detected by PUF-PAS include: 6:2, 8:2, 10:2 FTOH, 6:2 FTMAC, PFCAs (PFBA, PFPeA, PFHxA, PFHpA, PFOA, PFNA, PFDA, PFUnDA, PFDoDA, PFTrDA, PFTeDA, PFPeDA, PFHxDA), FTACs, and FOSA.
While XAD-PAS are perceived to be more appropriate for polar compounds, they have a limited capability to sample particle-phase compounds and may not be ideal for less volatile PFASs. Because the majority of PFASs in the air are in the gas-phase may contribute to the potential usefulness of XAD-PAS in measuring gas-phase compounds. XAD-PAS had higher detection frequencies for these compounds compared with PUF-PAS: PFHxA, PFHpA, PFPeA, PFOA, PFNA, PFDA, PFTeDA, PFBS, PFHxS, PFHpS, PFOS, EtFOSA; where as XAD-PAS was not able to detect: PFBA, PFDS,PFUnDA, PFDoDA, PFTrDA and EtFOSE. For all compounds detected, however, SIP-PAS surpassed the detection frequencies of XAD-PAS as well.
Overall, SIP-PAS performs better than XAD-PAS or PUF-PAS as a sampling medium for many PFASs. For example, measurements of PFUnDA and PFDoDA sampled with XAD-PAS and PUF-PAS were below detections limits. Similarly, when sampled with PUF-PAS, PFTrDA was barely detectable, and not detectable when sampled with XAD-PAS, versus a 100% detection frequency for PFUnDA, PFDoDA, and PFTrDA when sampled with SIP-PAS (Ahrens et al. 2013). This is just one of many examples where measurements of PFASs sampled with SIP-PAS has higher detection frequencies of more compounds compared with XAD- and PUF-PAS.
Regarding PE samplers, in several studies all target compounds were detected in the PE passive samplers (Dixon-Anderson and Lohmann 2018). Neutral PFASs equilibrated within
3 There are discrepancies between some compounds: PFBS (only detected in PUF-PAS in Ahrens et al. 2013), and PFCAs (only detected in Karásková et al. 2018), PFOA, PFNA, and PFTrDA were barely detected (Karásková et al. 2018).
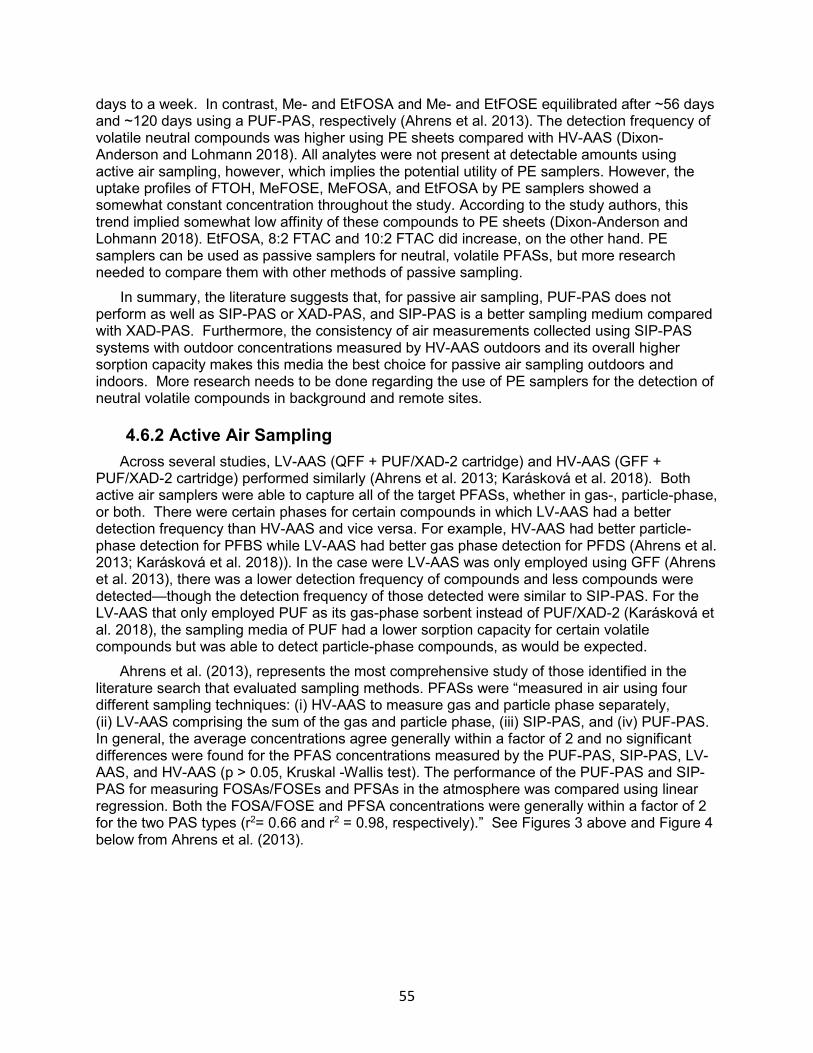
55
days to a week. In contrast, Me- and EtFOSA and Me- and EtFOSE equilibrated after ~56 days and ~120 days using a PUF-PAS, respectively (Ahrens et al. 2013). The detection frequency of volatile neutral compounds was higher using PE sheets compared with HV-AAS (Dixon-Anderson and Lohmann 2018). All analytes were not present at detectable amounts using active air sampling, however, which implies the potential utility of PE samplers. However, the uptake profiles of FTOH, MeFOSE, MeFOSA, and EtFOSA by PE samplers showed a somewhat constant concentration throughout the study. According to the study authors, this trend implied somewhat low affinity of these compounds to PE sheets (Dixon-Anderson and Lohmann 2018). EtFOSA, 8:2 FTAC and 10:2 FTAC did increase, on the other hand. PE samplers can be used as passive samplers for neutral, volatile PFASs, but more research needed to compare them with other methods of passive sampling.
In summary, the literature suggests that, for passive air sampling, PUF-PAS does not perform as well as SIP-PAS or XAD-PAS, and SIP-PAS is a better sampling medium compared with XAD-PAS. Furthermore, the consistency of air measurements collected using SIP-PAS systems with outdoor concentrations measured by HV-AAS outdoors and its overall higher sorption capacity makes this media the best choice for passive air sampling outdoors and indoors. More research needs to be done regarding the use of PE samplers for the detection of neutral volatile compounds in background and remote sites.
4.6.2 Active Air Sampling
Across several studies, LV-AAS (QFF + PUF/XAD-2 cartridge) and HV-AAS (GFF + PUF/XAD-2 cartridge) performed similarly (Ahrens et al. 2013; Karásková et al. 2018). Both active air samplers were able to capture all of the target PFASs, whether in gas-, particle-phase, or both. There were certain phases for certain compounds in which LV-AAS had a better detection frequency than HV-AAS and vice versa. For example, HV-AAS had better particle-phase detection for PFBS while LV-AAS had better gas phase detection for PFDS (Ahrens et al. 2013; Karásková et al. 2018)). In the case were LV-AAS was only employed using GFF (Ahrens et al. 2013), there was a lower detection frequency of compounds and less compounds were detected—though the detection frequency of those detected were similar to SIP-PAS. For the LV-AAS that only employed PUF as its gas-phase sorbent instead of PUF/XAD-2 (Karásková et al. 2018), the sampling media of PUF had a lower sorption capacity for certain volatile compounds but was able to detect particle-phase compounds, as would be expected.
Ahrens et al. (2013), represents the most comprehensive study of those identified in the literature search that evaluated sampling methods. PFASs were “measured in air using four different sampling techniques: (i) HV-AAS to measure gas and particle phase separately, (ii) LV-AAS comprising the sum of the gas and particle phase, (iii) SIP-PAS, and (iv) PUF-PAS. In general, the average concentrations agree generally within a factor of 2 and no significant differences were found for the PFAS concentrations measured by the PUF-PAS, SIP-PAS, LV-AAS, and HV-AAS (p > 0.05, Kruskal -Wallis test). The performance of the PUF-PAS and SIP-PAS for measuring FOSAs/FOSEs and PFSAs in the atmosphere was compared using linear regression. Both the FOSA/FOSE and PFSA concentrations were generally within a factor of 2 for the two PAS types (r2= 0.66 and r2 = 0.98, respectively).” See Figures 3 above and Figure 4 below from Ahrens et al. (2013).
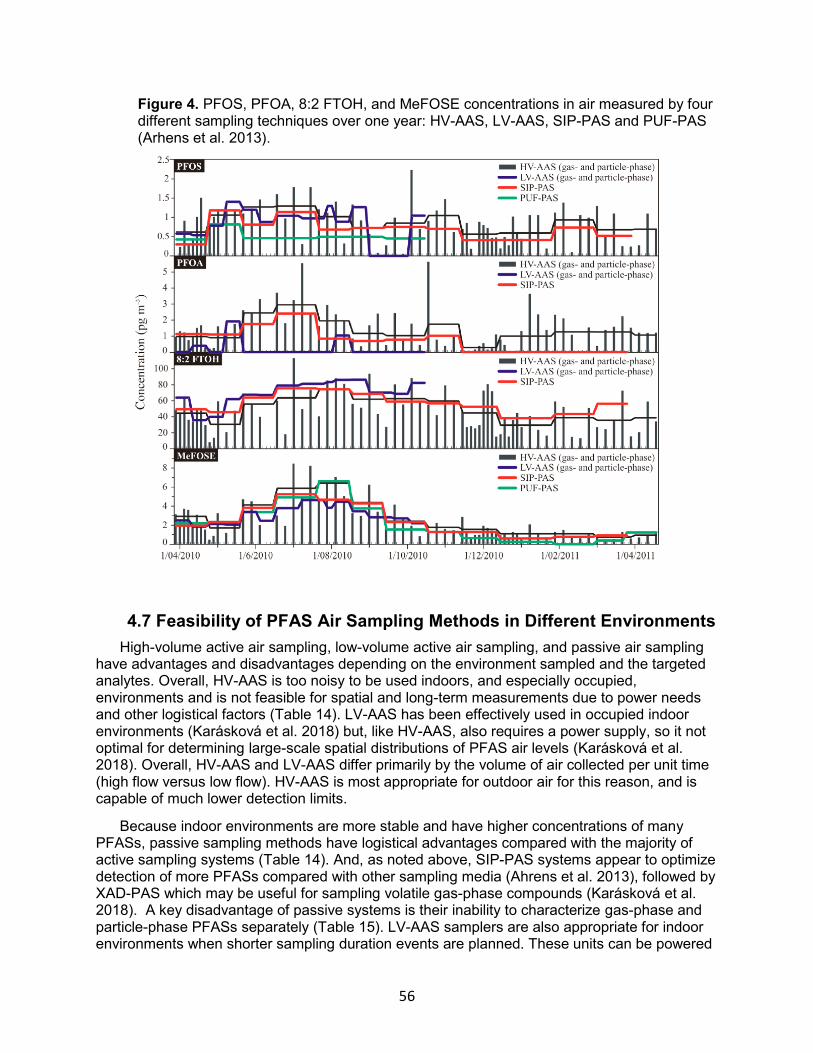
56
Figure 4. PFOS, PFOA, 8:2 FTOH, and MeFOSE concentrations in air measured by four different sampling techniques over one year: HV-AAS, LV-AAS, SIP-PAS and PUF-PAS (Arhens et al. 2013).
4.7 Feasibility of PFAS Air Sampling Methods in Different Environments
High-volume active air sampling, low-volume active air sampling, and passive air sampling have advantages and disadvantages depending on the environment sampled and the targeted analytes. Overall, HV-AAS is too noisy to be used indoors, and especially occupied, environments and is not feasible for spatial and long-term measurements due to power needs and other logistical factors (Table 14). LV-AAS has been effectively used in occupied indoor environments (Karásková et al. 2018) but, like HV-AAS, also requires a power supply, so it not optimal for determining large-scale spatial distributions of PFAS air levels (Karásková et al. 2018). Overall, HV-AAS and LV-AAS differ primarily by the volume of air collected per unit time (high flow versus low flow). HV-AAS is most appropriate for outdoor air for this reason, and is capable of much lower detection limits.
Because indoor environments are more stable and have higher concentrations of many PFASs, passive sampling methods have logistical advantages compared with the majority of active sampling systems (Table 14). And, as noted above, SIP-PAS systems appear to optimize detection of more PFASs compared with other sampling media (Ahrens et al. 2013), followed by XAD-PAS which may be useful for sampling volatile gas-phase compounds (Karásková et al. 2018). A key disadvantage of passive systems is their inability to characterize gas-phase and particle-phase PFASs separately (Table 15). LV-AAS samplers are also appropriate for indoor environments when shorter sampling duration events are planned. These units can be powered
57
by either line power or battery operated. Separate vapor and particulate phases can also be collected for use in exposure studies indoors.
4.8 US EPA Methods
There are currently no multi-laboratory certified US EPA methods for sampling PFASs in air. Existing US EPA TO methods for sampling of Polynuclear Aromatic Hydrocarbons (TO-13A) and Chlorinated Dioxins/Chlorinated Furans (TO-9) can be adapted for the collection of PFASs in outdoor air (ITRC 2020). Both of these methods make use of high-volume air samplers fitted with a particulate filter (quartz/glass fiber) and sorbent cartridge for the collection of particulate and gaseous phases, respectively. US EPA Method TO-13A specifies collection of air samples at a flow rate of approximately 225 liters/minute resulting in an air volume greater than 300 m3/day. The solid sorbent used consists of a “sandwich” of polyurethane foam (PUF) and XAD-2 (polymer of styrene divinylbenzene). Modified versions of US-EPA method TO-13A have been customized and evaluated by Battelle Labs and TRC for measurement of a variety of PFAS in outdoor air (G. Hunt, personal communication, January 19, 2021). US EPA methods TO-13A and TO-9 are included in the Appendix.
4.9 Summary
Due to simplicity, low cost, and overall effectiveness, SIP-PAS are widely used for monitoring outdoor air. Not only are they more feasible for measuring personal exposure, their detection frequencies and levels strongly correlate to results from active air samplers. Compared with other passive air samplers, SIP-PAS offers the greatest sorption capacity for volatile neutral compounds like FTOH. However, like all PAS, it does not distinguish between gas and particle-phase compounds associated PFASs. Further, PAS relies on the principle of gas diffusion and accurate air flow data are not readily available. Air volumes, as a result, are typically estimated and not as accurate as LV-AAS and HV-AAS unless accurate diffusion rate data are available. Yet, sampling methods for air are optimized for anionic and neutral compounds using SIP-PAS, in comparison with PUF-PAS.
There is, however, no standardized methodology nationwide or globally for measuring PFASs in air, which hampers study comparisons and makes it difficult to select which methods are best for what conditions and list of compounds. For this reason, development and standardization of a globally applicable sampling method is needed to more efficiently develop guidelines for PFAS indoor and outdoor air measurements.
5 Analytical Laboratory Methods for Analyzing PFASs in Air (Task 1D)
5.1 Overview
We reviewed the analytical methods from eleven studies that measured volatile PFASs in outdoor air samples, three studies that measured ionic PFASs in outdoor air samples, and four studies that measured PFASs in indoor air samples (Ahrens et al. 2013; Barber et al. 2007; Barton et al. 2006; Dimzon et al. 2017; Dixon-Anderson and Lohmann 2018; Fraser et al. 2012; Jahnke et al. 2007a.; Jahnke et al. 2007b.; Padilla-Sanchez and Haug 2016; Riedel et al. 2019; Schlummer et al. 2013; Shoeib et al. 2011). Three of these studies analyzed both volatile and ionic PFASs (Barber 2007, Ahrens 2013, Jahnke 2007a), and one of these studies analyzed both indoor and outdoor air samples (Jahnke 2007a). Methods for PFAS analysis included either gas chromatography or liquid chromatography coupled with mass spectrometry (GC-MS
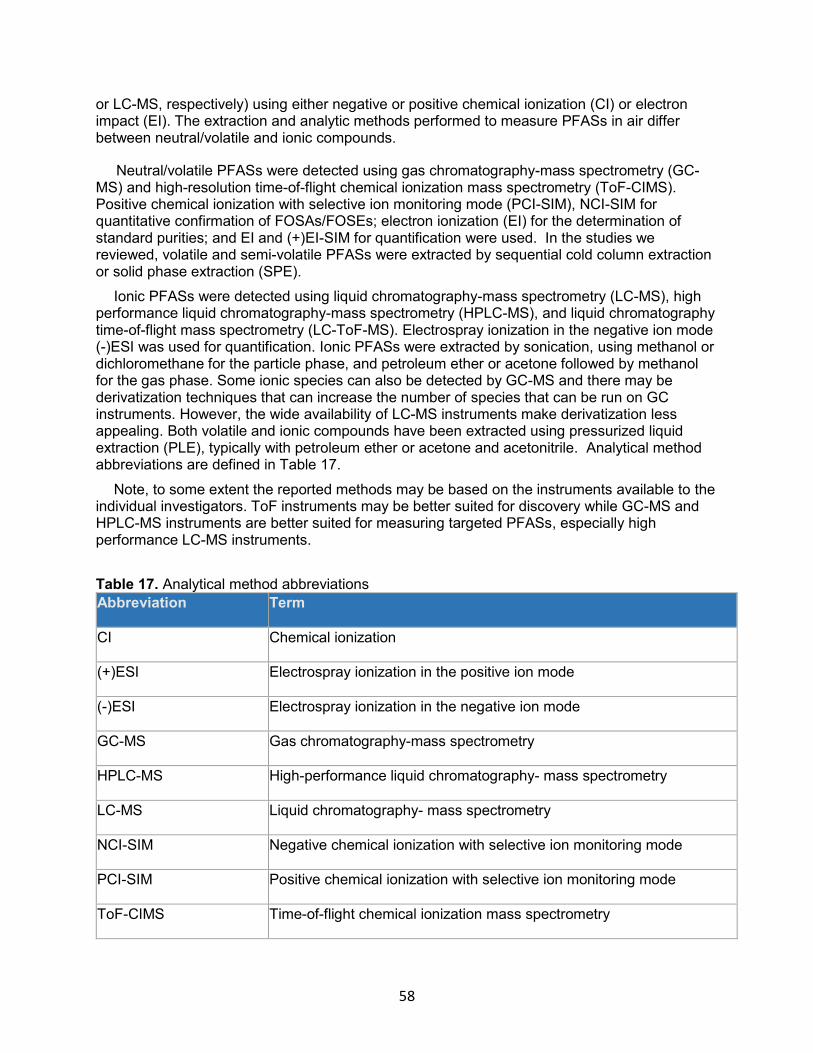
58
or LC-MS, respectively) using either negative or positive chemical ionization (CI) or electron impact (EI). The extraction and analytic methods performed to measure PFASs in air differ between neutral/volatile and ionic compounds.
Neutral/volatile PFASs were detected using gas chromatography-mass spectrometry (GC-MS) and high-resolution time-of-flight chemical ionization mass spectrometry (ToF-CIMS). Positive chemical ionization with selective ion monitoring mode (PCI-SIM), NCI-SIM for quantitative confirmation of FOSAs/FOSEs; electron ionization (EI) for the determination of standard purities; and EI and (+)EI-SIM for quantification were used. In the studies we reviewed, volatile and semi-volatile PFASs were extracted by sequential cold column extraction or solid phase extraction (SPE).
Ionic PFASs were detected using liquid chromatography-mass spectrometry (LC-MS), high performance liquid chromatography-mass spectrometry (HPLC-MS), and liquid chromatography time-of-flight mass spectrometry (LC-ToF-MS). Electrospray ionization in the negative ion mode (-)ESI was used for quantification. Ionic PFASs were extracted by sonication, using methanol or dichloromethane for the particle phase, and petroleum ether or acetone followed by methanol for the gas phase. Some ionic species can also be detected by GC-MS and there may be derivatization techniques that can increase the number of species that can be run on GC instruments. However, the wide availability of LC-MS instruments make derivatization less appealing. Both volatile and ionic compounds have been extracted using pressurized liquid extraction (PLE), typically with petroleum ether or acetone and acetonitrile. Analytical method abbreviations are defined in Table 17.
Note, to some extent the reported methods may be based on the instruments available to the individual investigators. ToF instruments may be better suited for discovery while GC-MS and HPLC-MS instruments are better suited for measuring targeted PFASs, especially high performance LC-MS instruments.
Table 17. Analytical method abbreviations
Abbreviation Term
CI Chemical ionization
(+)ESI Electrospray ionization in the positive ion mode
(-)ESI Electrospray ionization in the negative ion mode
GC-MS Gas chromatography-mass spectrometry
HPLC-MS High-performance liquid chromatography- mass spectrometry
LC-MS Liquid chromatography- mass spectrometry
NCI-SIM Negative chemical ionization with selective ion monitoring mode
PCI-SIM Positive chemical ionization with selective ion monitoring mode
ToF-CIMS Time-of-flight chemical ionization mass spectrometry
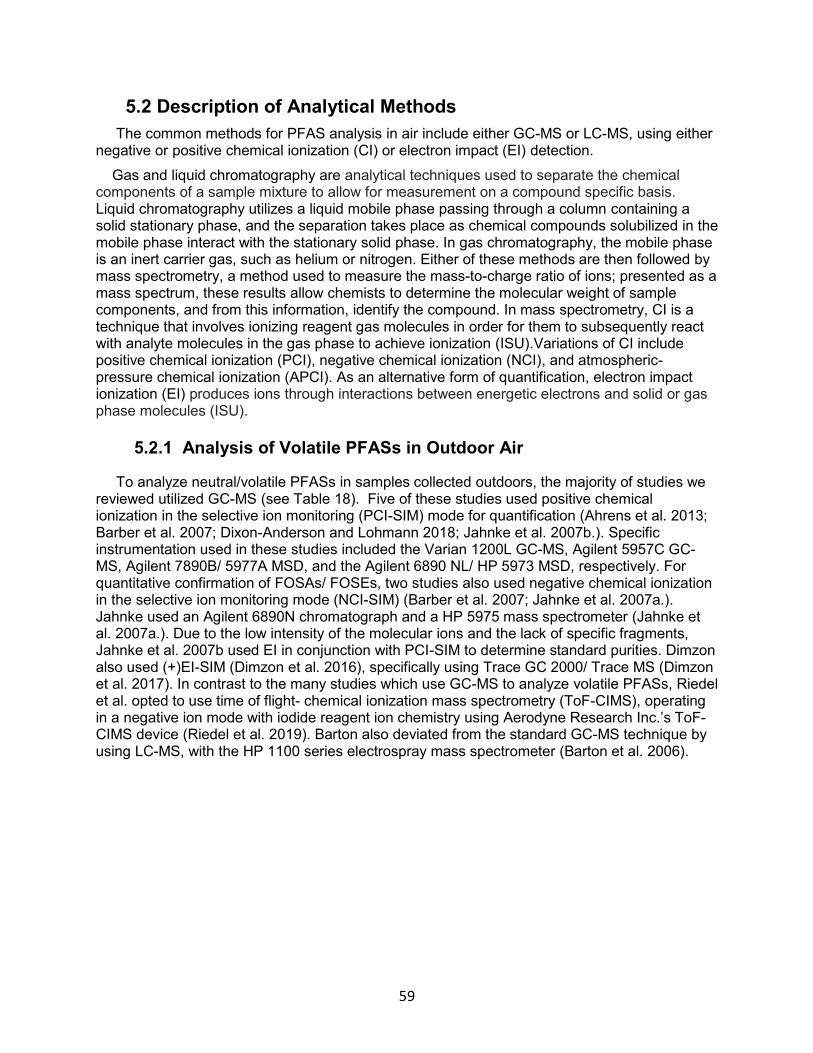
59
5.2 Description of Analytical Methods
The common methods for PFAS analysis in air include either GC-MS or LC-MS, using either negative or positive chemical ionization (CI) or electron impact (EI) detection.
Gas and liquid chromatography are analytical techniques used to separate the chemical components of a sample mixture to allow for measurement on a compound specific basis. Liquid chromatography utilizes a liquid mobile phase passing through a column containing a solid stationary phase, and the separation takes place as chemical compounds solubilized in the mobile phase interact with the stationary solid phase. In gas chromatography, the mobile phase is an inert carrier gas, such as helium or nitrogen. Either of these methods are then followed by mass spectrometry, a method used to measure the mass-to-charge ratio of ions; presented as a mass spectrum, these results allow chemists to determine the molecular weight of sample components, and from this information, identify the compound. In mass spectrometry, CI is a technique that involves ionizing reagent gas molecules in order for them to subsequently react with analyte molecules in the gas phase to achieve ionization (ISU).Variations of CI include positive chemical ionization (PCI), negative chemical ionization (NCI), and atmospheric-pressure chemical ionization (APCI). As an alternative form of quantification, electron impact ionization (EI) produces ions through interactions between energetic electrons and solid or gas phase molecules (ISU).
5.2.1 Analysis of Volatile PFASs in Outdoor Air
To analyze neutral/volatile PFASs in samples collected outdoors, the majority of studies we reviewed utilized GC-MS (see Table 18). Five of these studies used positive chemical ionization in the selective ion monitoring (PCI-SIM) mode for quantification (Ahrens et al. 2013; Barber et al. 2007; Dixon-Anderson and Lohmann 2018; Jahnke et al. 2007b.). Specific instrumentation used in these studies included the Varian 1200L GC-MS, Agilent 5957C GC-MS, Agilent 7890B/ 5977A MSD, and the Agilent 6890 NL/ HP 5973 MSD, respectively. For quantitative confirmation of FOSAs/ FOSEs, two studies also used negative chemical ionization in the selective ion monitoring mode (NCI-SIM) (Barber et al. 2007; Jahnke et al. 2007a.). Jahnke used an Agilent 6890N chromatograph and a HP 5975 mass spectrometer (Jahnke et al. 2007a.). Due to the low intensity of the molecular ions and the lack of specific fragments, Jahnke et al. 2007b used EI in conjunction with PCI-SIM to determine standard purities. Dimzon also used (+)EI-SIM (Dimzon et al. 2016), specifically using Trace GC 2000/ Trace MS (Dimzon et al. 2017). In contrast to the many studies which use GC-MS to analyze volatile PFASs, Riedel et al. opted to use time of flight- chemical ionization mass spectrometry (ToF-CIMS), operating in a negative ion mode with iodide reagent ion chemistry using Aerodyne Research Inc.’s ToF-CIMS device (Riedel et al. 2019). Barton also deviated from the standard GC-MS technique by using LC-MS, with the HP 1100 series electrospray mass spectrometer (Barton et al. 2006).
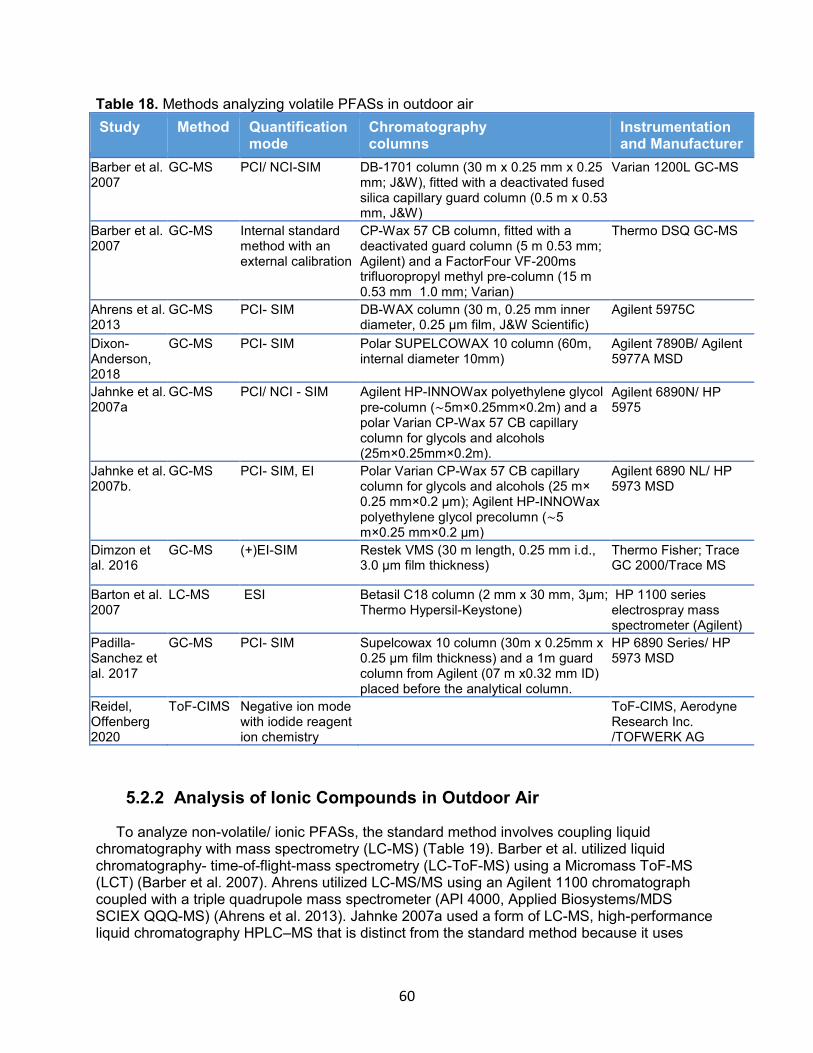
60
Table 18. Methods analyzing volatile PFASs in outdoor air
Study Method Quantification mode
Chromatography columns
Instrumentation and Manufacturer
Barber et al. 2007
GC-MS PCI/ NCI-SIM DB-1701 column (30 m x 0.25 mm x 0.25 mm; J&W), fitted with a deactivated fused silica capillary guard column (0.5 m x 0.53 mm, J&W)
Varian 1200L GC-MS
Barber et al. 2007
GC-MS Internal standard method with an external calibration
CP-Wax 57 CB column, fitted with a deactivated guard column (5 m 0.53 mm; Agilent) and a FactorFour VF-200ms trifluoropropyl methyl pre-column (15 m 0.53 mm 1.0 mm; Varian)
Thermo DSQ GC-MS
Ahrens et al. 2013
GC-MS PCI- SIM DB-WAX column (30 m, 0.25 mm inner diameter, 0.25 μm film, J&W Scientific)
Agilent 5975C
Dixon-Anderson, 2018
GC-MS PCI- SIM Polar SUPELCOWAX 10 column (60m, internal diameter 10mm)
Agilent 7890B/ Agilent 5977A MSD
Jahnke et al. 2007a
GC-MS PCI/ NCI - SIM Agilent HP-INNOWax polyethylene glycol
pre-column (∼5m×0.25mm×0.2m) and a polar Varian CP-Wax 57 CB capillary column for glycols and alcohols (25m×0.25mm×0.2m).
Agilent 6890N/ HP 5975
Jahnke et al. 2007b.
GC-MS PCI- SIM, EI Polar Varian CP-Wax 57 CB capillary column for glycols and alcohols (25 m× 0.25 mm×0.2 μm); Agilent HP-INNOWax polyethylene glycol precolumn (∼5 m×0.25 mm×0.2 μm)
Agilent 6890 NL/ HP 5973 MSD
Dimzon et al. 2016
GC-MS (+)EI-SIM Restek VMS (30 m length, 0.25 mm i.d., 3.0 μm film thickness)
Thermo Fisher; Trace GC 2000/Trace MS
Barton et al. 2007
LC-MS ESI Betasil C18 column (2 mm x 30 mm, 3µm; Thermo Hypersil-Keystone)
HP 1100 series electrospray mass spectrometer (Agilent)
Padilla-Sanchez et al. 2017
GC-MS PCI- SIM Supelcowax 10 column (30m x 0.25mm x 0.25 μm film thickness) and a 1m guard column from Agilent (07 m x0.32 mm ID) placed before the analytical column.
HP 6890 Series/ HP 5973 MSD
Reidel, Offenberg 2020
ToF-CIMS Negative ion mode with iodide reagent ion chemistry
ToF-CIMS, Aerodyne Research Inc. /TOFWERK AG
5.2.2 Analysis of Ionic Compounds in Outdoor Air
To analyze non-volatile/ ionic PFASs, the standard method involves coupling liquid chromatography with mass spectrometry (LC-MS) (Table 19). Barber et al. utilized liquid chromatography- time-of-flight-mass spectrometry (LC-ToF-MS) using a Micromass ToF-MS (LCT) (Barber et al. 2007). Ahrens utilized LC-MS/MS using an Agilent 1100 chromatograph coupled with a triple quadrupole mass spectrometer (API 4000, Applied Biosystems/MDS SCIEX QQQ-MS) (Ahrens et al. 2013). Jahnke 2007a used a form of LC-MS, high-performance liquid chromatography HPLC–MS that is distinct from the standard method because it uses
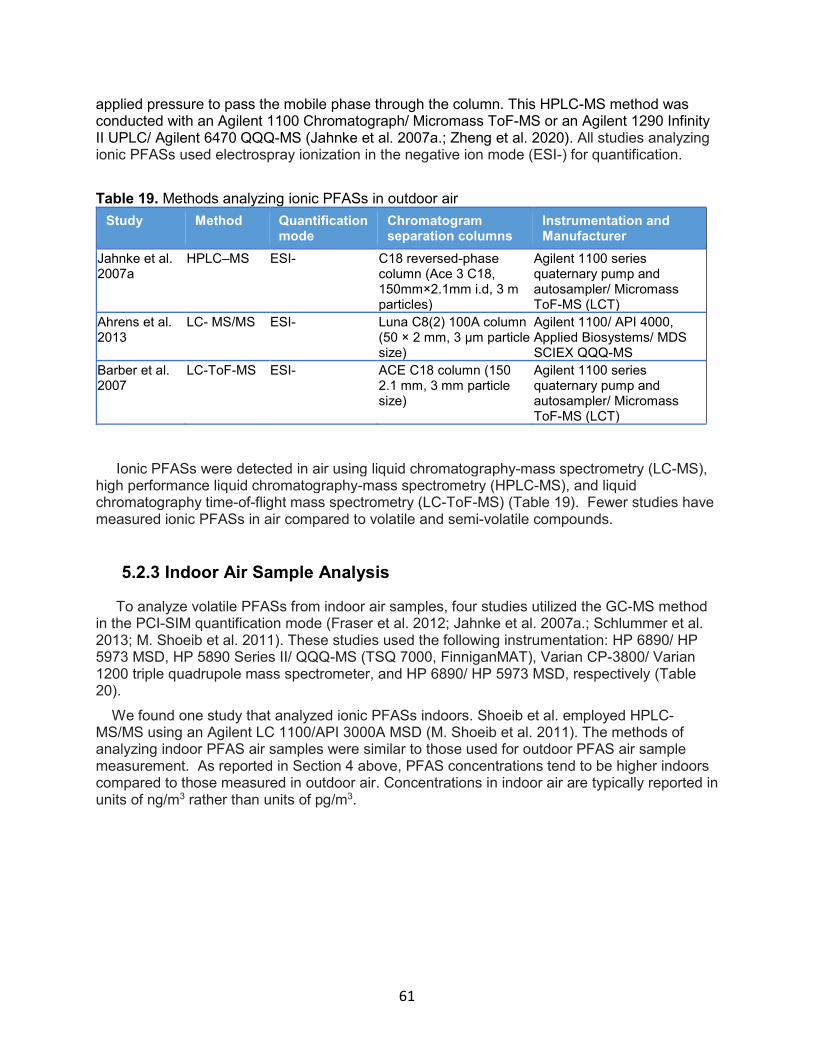
61
applied pressure to pass the mobile phase through the column. This HPLC-MS method was conducted with an Agilent 1100 Chromatograph/ Micromass ToF-MS or an Agilent 1290 Infinity II UPLC/ Agilent 6470 QQQ-MS (Jahnke et al. 2007a.; Zheng et al. 2020). All studies analyzing ionic PFASs used electrospray ionization in the negative ion mode (ESI-) for quantification.
Table 19. Methods analyzing ionic PFASs in outdoor air
Study Method Quantification mode
Chromatogram separation columns
Instrumentation and Manufacturer
Jahnke et al. 2007a
HPLC–MS ESI- C18 reversed-phase column (Ace 3 C18, 150mm×2.1mm i.d, 3 m particles)
Agilent 1100 series quaternary pump and autosampler/ Micromass ToF-MS (LCT)
Ahrens et al. 2013
LC- MS/MS ESI- Luna C8(2) 100A column (50 × 2 mm, 3 μm particle size)
Agilent 1100/ API 4000, Applied Biosystems/ MDS SCIEX QQQ-MS
Barber et al. 2007
LC-ToF-MS ESI- ACE C18 column (150 2.1 mm, 3 mm particle size)
Agilent 1100 series quaternary pump and autosampler/ Micromass ToF-MS (LCT)
Ionic PFASs were detected in air using liquid chromatography-mass spectrometry (LC-MS), high performance liquid chromatography-mass spectrometry (HPLC-MS), and liquid chromatography time-of-flight mass spectrometry (LC-ToF-MS) (Table 19). Fewer studies have measured ionic PFASs in air compared to volatile and semi-volatile compounds.
5.2.3 Indoor Air Sample Analysis
To analyze volatile PFASs from indoor air samples, four studies utilized the GC-MS method in the PCI-SIM quantification mode (Fraser et al. 2012; Jahnke et al. 2007a.; Schlummer et al. 2013; M. Shoeib et al. 2011). These studies used the following instrumentation: HP 6890/ HP 5973 MSD, HP 5890 Series II/ QQQ-MS (TSQ 7000, FinniganMAT), Varian CP-3800/ Varian 1200 triple quadrupole mass spectrometer, and HP 6890/ HP 5973 MSD, respectively (Table 20).
We found one study that analyzed ionic PFASs indoors. Shoeib et al. employed HPLC-MS/MS using an Agilent LC 1100/API 3000A MSD (M. Shoeib et al. 2011). The methods of analyzing indoor PFAS air samples were similar to those used for outdoor PFAS air sample measurement. As reported in Section 4 above, PFAS concentrations tend to be higher indoors compared to those measured in outdoor air. Concentrations in indoor air are typically reported in units of ng/m3 rather than units of pg/m3.
62
Table 20. Methods for analyzing PFASs in indoor air samples
Study Method PFASs Quantification mode
Chromatography columns
Instrumentation and Manufacturer
Jahnke et al. 2007a
GC-MS Volatile PCI/NCI- SIM Polar Varian CP-Wax 57 CB capillary column for glycols and alcohols (25m×0.25mm×0.2μm)b
Varian CP-3800/ Varian 1200 triple quadrupole mass spectrometer
Fraser et al. 2012
GC-MS Volatile PCI-SIM DB-wax column (30m×0.25mm×0.25 μm)
HP 6890/ HP 5973 MSD
Schlummer 2013
GC-MS Volatile PCI-SIM ZB-624 column (Phenomenex, 60m×0.25 mm×1.4 μm)
HP 5890 Series II/ QQQ-MS (TSQ 7000, FinniganMAT)
Shoeib et al. 2011
GC-MS Volatile PCI-SIM DB-wax column (30m×0.25mm×0.25μm)
HP 6890 GC/ HP 5973 MSD
Shoeib et al. 2011
HPLC-MS/MS
Ionic -- LC column (Synergi 120 Hydro-RP 80A, 150m×3.00 mm×4μm)
Agilent LC 1100/ API 3000A
alength×inner diameter×film thickness
In a recent abstract presented at ISES 2020, Zhou et al. collected air and dust samples before, during, and after indoor floor stripping and waxing to assess floor wax workers potential PFAS exposure. To analyze indoor airborne particulate matter (PM2.0) emitted during floor waxing, Zhou et al. used an AB SCIEX TripleQuad 6500 LC/MS/MS instrument (Zhou 2020). Ten PFASs were detected in airborne PM2.0 samples, and among those, PFHxA and PFOS concentrations were significantly higher during floor waxing events compared (Zhou 2020).
5.2.4 Air Sample Extraction Methods
Four main methods were identified for the extraction of PFASs from sampling media, including sequential cold column extraction, solid phase extraction (SPE), pressurized liquid extraction (PLE), and sonication (Table 21). These methods serve to clean up analytes prior to quantification, and to improve recovery of the specific analyte. Sequential cold column extraction can be employed to extract volatile compounds from PUF-XAD or GFF using ethyl acetate as a solvent (Barber et al. 2007; Jahnke et al. 2007b.). SPE utilizes a fiber coated with an extracting phase, either a liquid (polymer) or a solid (sorbent), which is able to extract different kinds of analytes (including both volatile and non-volatile) from different kinds of media, either in liquid or gas phase. The main advantages of SPE are the ability to concentrate analytes and reduce matrix interferences (sample cleanup). In contrast to liquid-liquid extraction, it has shorter processing times, low solvent consumption, and simpler processing procedures (Jahnke et al. 2007b). PLE is an extraction technique that operates under high temperature and pressure. The elevated temperature can dramatically increase the solubility and diffusion of analytes resulting in less extraction time and lower solvent consumption. Ahrens et al. (2013) employed PLE to extract both volatile and ionic compounds following sample collection (via LV-AAS, SIP-PAS, and PUF-PAS) by extracting GFFs with petroleum ether/acetone and acetonitrile (Ahrens et al. 2013). Sonication, the process of applying sound energy to agitate particles or discontinuous fibers in a liquid, was used in multiple studies to improve extraction of ionic compounds from GFFs. For example, Ahrens et al. (2013) extracted GFFs from HV-AAS
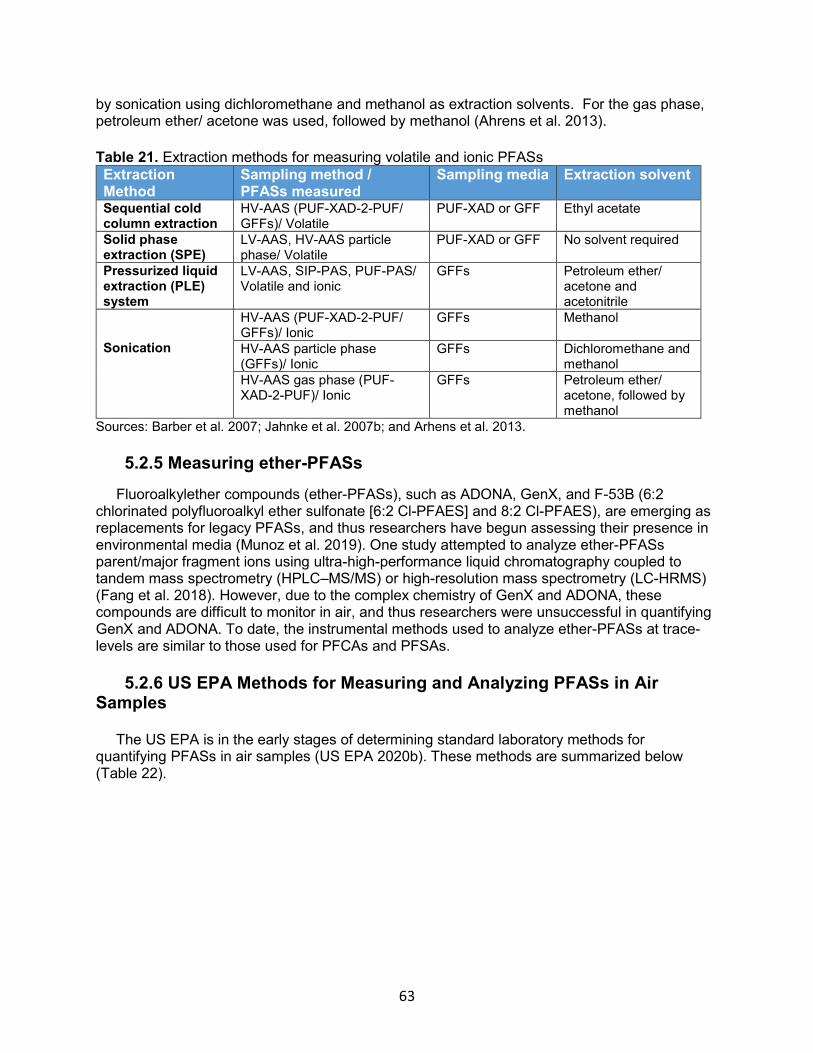
63
by sonication using dichloromethane and methanol as extraction solvents. For the gas phase, petroleum ether/ acetone was used, followed by methanol (Ahrens et al. 2013).
Table 21. Extraction methods for measuring volatile and ionic PFASs
Extraction Method
Sampling method / PFASs measured
Sampling media Extraction solvent
Sequential cold column extraction
HV-AAS (PUF-XAD-2-PUF/ GFFs)/ Volatile
PUF-XAD or GFF Ethyl acetate
Solid phase extraction (SPE)
LV-AAS, HV-AAS particle phase/ Volatile
PUF-XAD or GFF No solvent required
Pressurized liquid extraction (PLE) system
LV-AAS, SIP-PAS, PUF-PAS/ Volatile and ionic
GFFs Petroleum ether/ acetone and acetonitrile
Sonication
HV-AAS (PUF-XAD-2-PUF/ GFFs)/ Ionic
GFFs Methanol
HV-AAS particle phase (GFFs)/ Ionic
GFFs Dichloromethane and methanol
HV-AAS gas phase (PUF-XAD-2-PUF)/ Ionic
GFFs Petroleum ether/ acetone, followed by methanol
Sources: Barber et al. 2007; Jahnke et al. 2007b; and Arhens et al. 2013.
5.2.5 Measuring ether-PFASs
Fluoroalkylether compounds (ether-PFASs), such as ADONA, GenX, and F-53B (6:2 chlorinated polyfluoroalkyl ether sulfonate [6:2 Cl-PFAES] and 8:2 Cl-PFAES), are emerging as replacements for legacy PFASs, and thus researchers have begun assessing their presence in environmental media (Munoz et al. 2019). One study attempted to analyze ether-PFASs parent/major fragment ions using ultra-high-performance liquid chromatography coupled to tandem mass spectrometry (HPLC–MS/MS) or high-resolution mass spectrometry (LC-HRMS) (Fang et al. 2018). However, due to the complex chemistry of GenX and ADONA, these compounds are difficult to monitor in air, and thus researchers were unsuccessful in quantifying GenX and ADONA. To date, the instrumental methods used to analyze ether-PFASs at trace-levels are similar to those used for PFCAs and PFSAs.
5.2.6 US EPA Methods for Measuring and Analyzing PFASs in Air Samples
The US EPA is in the early stages of determining standard laboratory methods for quantifying PFASs in air samples (US EPA 2020b). These methods are summarized below (Table 22).
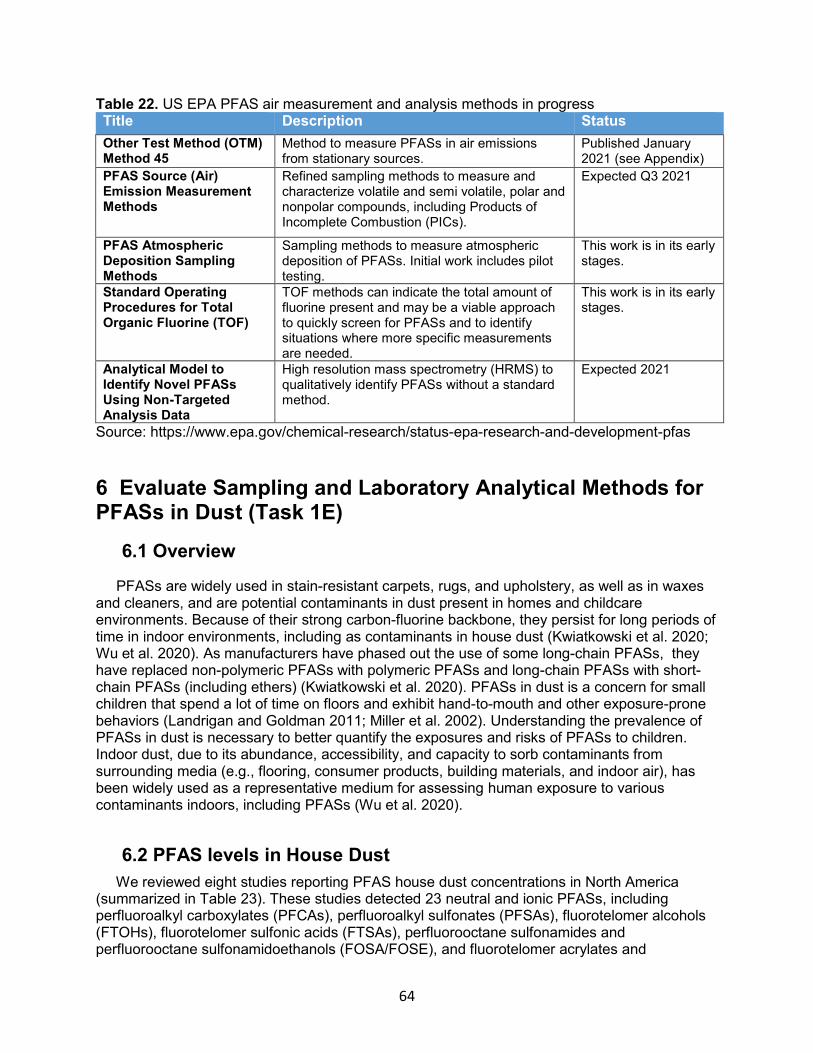
64
Table 22. US EPA PFAS air measurement and analysis methods in progress Title Description Status
Other Test Method (OTM) Method 45
Method to measure PFASs in air emissions from stationary sources.
Published January 2021 (see Appendix)
PFAS Source (Air) Emission Measurement Methods
Refined sampling methods to measure and characterize volatile and semi volatile, polar and nonpolar compounds, including Products of Incomplete Combustion (PICs).
Expected Q3 2021
PFAS Atmospheric Deposition Sampling Methods
Sampling methods to measure atmospheric deposition of PFASs. Initial work includes pilot testing.
This work is in its early stages.
Standard Operating Procedures for Total Organic Fluorine (TOF)
TOF methods can indicate the total amount of fluorine present and may be a viable approach to quickly screen for PFASs and to identify situations where more specific measurements are needed.
This work is in its early stages.
Analytical Model to Identify Novel PFASs Using Non-Targeted Analysis Data
High resolution mass spectrometry (HRMS) to qualitatively identify PFASs without a standard method.
Expected 2021
Source: https://www.epa.gov/chemical-research/status-epa-research-and-development-pfas
6 Evaluate Sampling and Laboratory Analytical Methods for PFASs in Dust (Task 1E)
6.1 Overview
PFASs are widely used in stain-resistant carpets, rugs, and upholstery, as well as in waxes and cleaners, and are potential contaminants in dust present in homes and childcare environments. Because of their strong carbon-fluorine backbone, they persist for long periods of time in indoor environments, including as contaminants in house dust (Kwiatkowski et al. 2020; Wu et al. 2020). As manufacturers have phased out the use of some long-chain PFASs, they have replaced non-polymeric PFASs with polymeric PFASs and long-chain PFASs with short-chain PFASs (including ethers) (Kwiatkowski et al. 2020). PFASs in dust is a concern for small children that spend a lot of time on floors and exhibit hand-to-mouth and other exposure-prone behaviors (Landrigan and Goldman 2011; Miller et al. 2002). Understanding the prevalence of PFASs in dust is necessary to better quantify the exposures and risks of PFASs to children. Indoor dust, due to its abundance, accessibility, and capacity to sorb contaminants from surrounding media (e.g., flooring, consumer products, building materials, and indoor air), has been widely used as a representative medium for assessing human exposure to various contaminants indoors, including PFASs (Wu et al. 2020).
6.2 PFAS levels in House Dust
We reviewed eight studies reporting PFAS house dust concentrations in North America (summarized in Table 23). These studies detected 23 neutral and ionic PFASs, including perfluoroalkyl carboxylates (PFCAs), perfluoroalkyl sulfonates (PFSAs), fluorotelomer alcohols (FTOHs), fluorotelomer sulfonic acids (FTSAs), perfluorooctane sulfonamides and perfluorooctane sulfonamidoethanols (FOSA/FOSE), and fluorotelomer acrylates and
65
fluorotelomer methacrylates (FTACs/FTMACs) in house dust (Byrne et al. 2017; Fraser et al. 2013; Goosey and Harrad 2011; Karásková et al. 2016; Makey et al. 2017; M. Shoeib et al. 2011; Strynar and Lindstrom 2008; Wu et al. 2015). The highest PFAS geometric mean or median concentrations were reported for five PFAA and two precursor compounds: PFHxA (C6); PFHpA (C7); PFOA (C8); PFNA (C9); PFOS (C8); 6:2 FTOH and 8:2 FTOH (Medians ranged from 0.4 – 69 ng/g; and geometric means ranged from 0.71 – 99 ng/g). Eight compounds were detected at 100% frequency in dust: MeFOSA; MeFOSE; 8:2 FTOH; 10:2 FTOH; 8:2 diPAP;10:2 diPAP; PFNA; and PFOS (Fraser et al. 2013; Makey et al. 2017; Shoeib et al. 2011; Strynar and Lindstrom 2008). MeFOSA, EtFOSA and EtFOSE were detected at > 50% frequency in Makey et al. 2017 and Shoeib et al. 2011, but were detected at < 20% frequency in Karásková et al. 2016. The compounds PFBS, PFDA, PFDS, PFUnDA and PFDoDA were all detected above 50% frequency in Karásková et al. 2016.
A recent study analyzed dust samples from 184 homes in North Carolina and 49 fire stations across the United States and Canada for a suite of PFASs using GC-MS and LC-MS (Hall et al. 2020). House dust samples were collected in 2014-2016. Seventeen PFCAs, PFSAs, FTOHs, diPAPs and Me-/EtFOSE were measured. FTOHs and diPAPs were the most prevalent PFASs in both fire station and house dust samples, with medians of approximately 100 ng/g dust or greater. PFHxS, PFOS, PFOA, PFNA and 6:2 diPAP were significantly higher in dust from the fire stations than from homes, and 8:2 FTOH was significantly higher in homes than in fire stations (See Table 24). The dominant compounds measured were the neutral precursors 6:2 FTOH and 8:2 FTOH, making up >90% of the PFAS dust composition based on median concentrations. The authors reported that their concentrations of legacy chemicals PFHxA, PFHpA, PFOA, PFHxS and PFOS were significantly lower than those measured in a study conducted years earlier (Strynar and Lindstrom 2008).
PFOS and PFOA were commonly measured in all nine studies. Both compounds were detected in house dust at frequencies > 70%, posing a concern for exposure, especially to children.
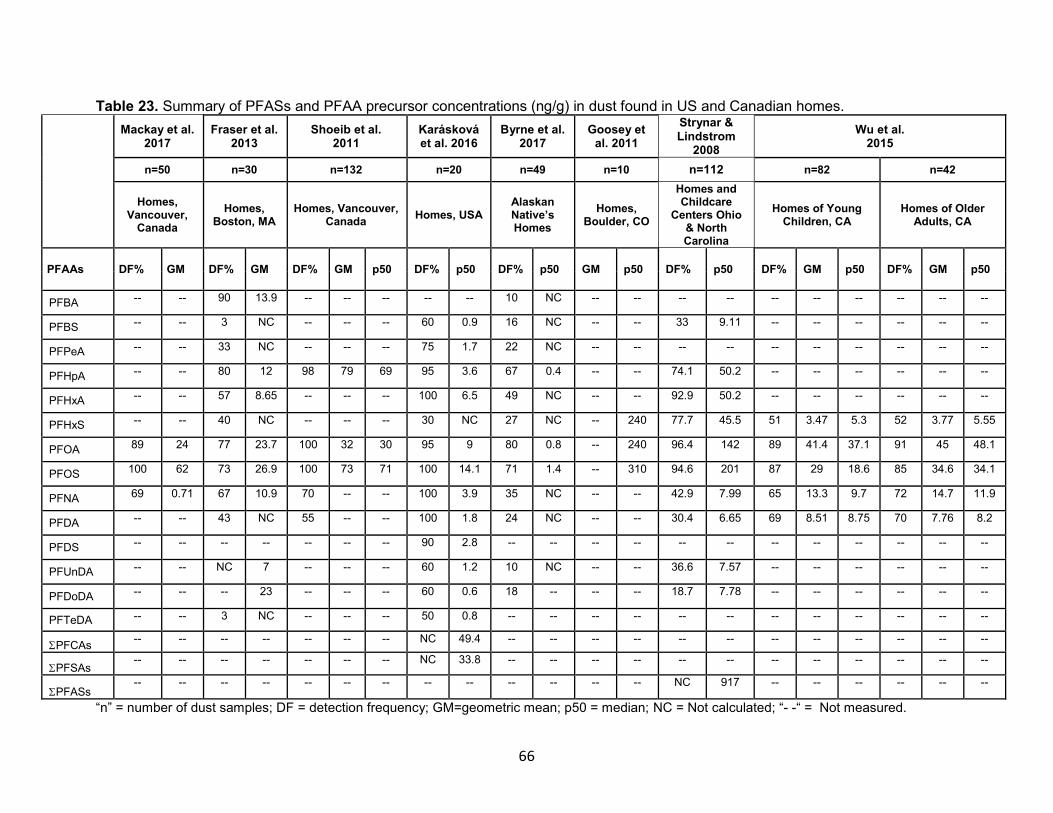
66
Table 23. Summary of PFASs and PFAA precursor concentrations (ng/g) in dust found in US and Canadian homes.
Mackay et al. 2017
Fraser et al. 2013
Shoeib et al. 2011
Karásková et al. 2016
Byrne et al. 2017
Goosey et al. 2011
Strynar & Lindstrom
2008
Wu et al. 2015
n=50 n=30 n=132 n=20 n=49 n=10 n=112 n=82 n=42
Homes, Vancouver,
Canada
Homes, Boston, MA
Homes, Vancouver, Canada
Homes, USA Alaskan Native’s Homes
Homes, Boulder, CO
Homes and Childcare
Centers Ohio & North Carolina
Homes of Young Children, CA
Homes of Older Adults, CA
PFAAs DF% GM DF% GM DF% GM p50 DF% p50 DF% p50 GM p50 DF% p50 DF% GM p50 DF% GM p50
PFBA -- -- 90 13.9 -- -- -- -- -- 10 NC -- -- -- -- -- -- -- -- -- --
PFBS -- -- 3 NC -- -- -- 60 0.9 16 NC -- -- 33 9.11 -- -- -- -- -- --
PFPeA -- -- 33 NC -- -- -- 75 1.7 22 NC -- -- -- -- -- -- -- -- -- --
PFHpA -- -- 80 12 98 79 69 95 3.6 67 0.4 -- -- 74.1 50.2 -- -- -- -- -- --
PFHxA -- -- 57 8.65 -- -- -- 100 6.5 49 NC -- -- 92.9 50.2 -- -- -- -- -- --
PFHxS -- -- 40 NC -- -- -- 30 NC 27 NC -- 240 77.7 45.5 51 3.47 5.3 52 3.77 5.55
PFOA 89 24 77 23.7 100 32 30 95 9 80 0.8 -- 240 96.4 142 89 41.4 37.1 91 45 48.1
PFOS 100 62 73 26.9 100 73 71 100 14.1 71 1.4 -- 310 94.6 201 87 29 18.6 85 34.6 34.1
PFNA 69 0.71 67 10.9 70 -- -- 100 3.9 35 NC -- -- 42.9 7.99 65 13.3 9.7 72 14.7 11.9
PFDA -- -- 43 NC 55 -- -- 100 1.8 24 NC -- -- 30.4 6.65 69 8.51 8.75 70 7.76 8.2
PFDS -- -- -- -- -- -- -- 90 2.8 -- -- -- -- -- -- -- -- -- -- -- --
PFUnDA -- -- NC 7 -- -- -- 60 1.2 10 NC -- -- 36.6 7.57 -- -- -- -- -- --
PFDoDA -- -- -- 23 -- -- -- 60 0.6 18 -- -- -- 18.7 7.78 -- -- -- -- -- --
PFTeDA -- -- 3 NC -- -- -- 50 0.8 -- -- -- -- -- -- -- -- -- -- -- --
PFCAs -- -- -- -- -- -- -- NC 49.4 -- -- -- -- -- -- -- -- -- -- -- --
PFSAs -- -- -- -- -- -- -- NC 33.8 -- -- -- -- -- -- -- -- -- -- -- --
PFASs-- -- -- -- -- -- -- -- -- -- -- -- -- NC 917 -- -- -- -- -- --
“n” = number of dust samples; DF = detection frequency; GM=geometric mean; p50 = median; NC = Not calculated; “- -“ = Not measured.
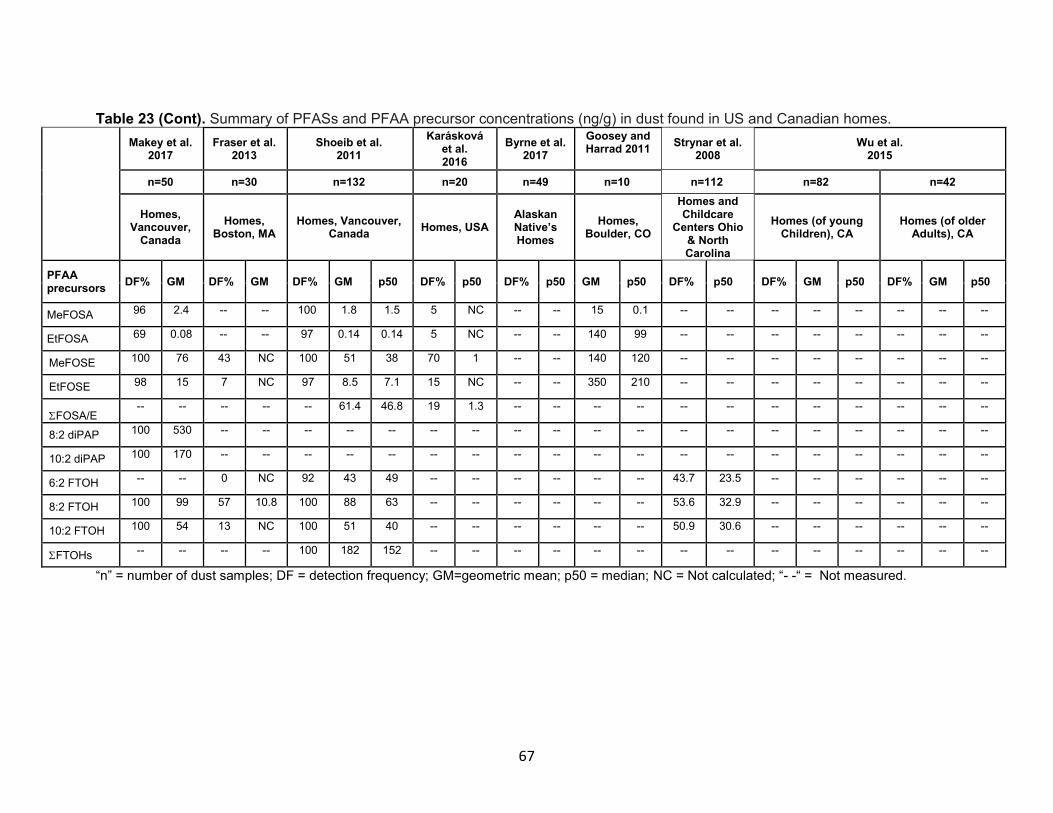
67
Table 23 (Cont). Summary of PFASs and PFAA precursor concentrations (ng/g) in dust found in US and Canadian homes.
Makey et al. 2017
Fraser et al. 2013
Shoeib et al. 2011
Karásková et al. 2016
Byrne et al. 2017
Goosey and Harrad 2011
Strynar et al. 2008
Wu et al. 2015
n=50 n=30 n=132 n=20 n=49 n=10 n=112 n=82 n=42
Homes, Vancouver,
Canada
Homes, Boston, MA
Homes, Vancouver, Canada
Homes, USA Alaskan Native’s Homes
Homes, Boulder, CO
Homes and Childcare
Centers Ohio & North Carolina
Homes (of young Children), CA
Homes (of older Adults), CA
PFAA precursors
DF% GM DF% GM DF% GM p50 DF% p50 DF% p50 GM p50 DF% p50 DF% GM p50 DF% GM p50
MeFOSA 96 2.4 -- -- 100 1.8 1.5 5 NC -- -- 15 0.1 -- -- -- -- -- -- -- --
EtFOSA 69 0.08 -- -- 97 0.14 0.14 5 NC -- -- 140 99 -- -- -- -- -- -- -- --
MeFOSE 100 76 43 NC 100 51 38 70 1 -- -- 140 120 -- -- -- -- -- -- -- --
EtFOSE 98 15 7 NC 97 8.5 7.1 15 NC -- -- 350 210 -- -- -- -- -- -- -- --
FOSA/E-- -- -- -- -- 61.4 46.8 19 1.3 -- -- -- -- -- -- -- -- -- -- -- --
8:2 diPAP 100 530 -- -- -- -- -- -- -- -- -- -- -- -- -- -- -- -- -- -- --
10:2 diPAP 100 170 -- -- -- -- -- -- -- -- -- -- -- -- -- -- -- -- -- -- --
6:2 FTOH -- -- 0 NC 92 43 49 -- -- -- -- -- -- 43.7 23.5 -- -- -- -- -- --
8:2 FTOH 100 99 57 10.8 100 88 63 -- -- -- -- -- -- 53.6 32.9 -- -- -- -- -- --
10:2 FTOH 100 54 13 NC 100 51 40 -- -- -- -- -- -- 50.9 30.6 -- -- -- -- -- --
FTOHs -- -- -- -- 100 182 152 -- -- -- -- -- -- -- -- -- -- -- -- -- --
“n” = number of dust samples; DF = detection frequency; GM=geometric mean; p50 = median; NC = Not calculated; “- -“ = Not measured.
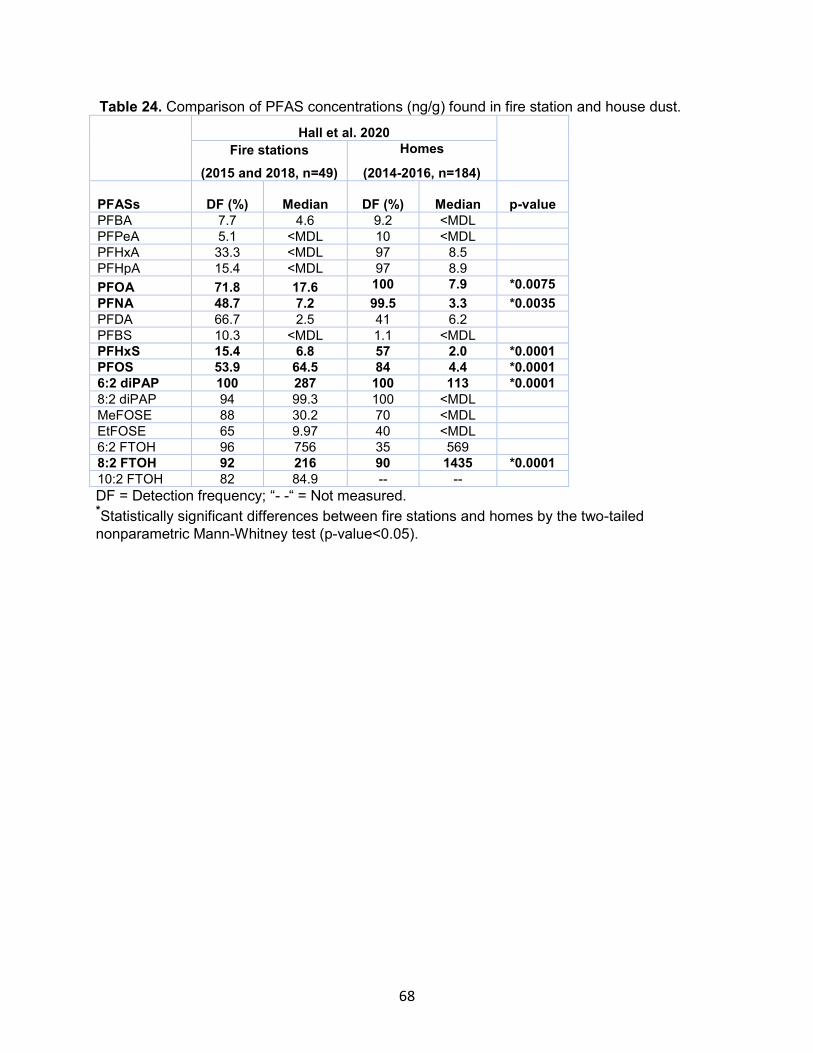
68
Table 24. Comparison of PFAS concentrations (ng/g) found in fire station and house dust.
Hall et al. 2020 Fire stations
(2015 and 2018, n=49)
Homes
(2014-2016, n=184)
PFASs DF (%) Median
DF (%)
Median
p-value
PFBA 7.7 4.6 9.2 <MDL
PFPeA 5.1 <MDL 10 <MDL
PFHxA 33.3 <MDL 97 8.5
PFHpA 15.4 <MDL 97 8.9
PFOA 71.8 17.6 100 7.9 *0.0075
PFNA 48.7 7.2 99.5 3.3 *0.0035
PFDA 66.7 2.5 41 6.2
PFBS 10.3 <MDL 1.1 <MDL
PFHxS 15.4 6.8 57 2.0 *0.0001
PFOS 53.9 64.5 84 4.4 *0.0001
6:2 diPAP 100 287 100 113 *0.0001
8:2 diPAP 94 99.3 100 <MDL
MeFOSE 88 30.2 70 <MDL
EtFOSE 65 9.97 40 <MDL
6:2 FTOH 96 756 35 569
8:2 FTOH 92 216 90 1435 *0.0001
10:2 FTOH 82 84.9 -- --
DF = Detection frequency; “- -“ = Not measured. *Statistically significant differences between fire stations and homes by the two-tailed
nonparametric Mann-Whitney test (p-value<0.05).

69
6.4 PFAS Levels in Child Care Facility Dust
Table 25 summarizes 3 studies reporting PFAS dust concentrations in childcare facilities in California. Thirty neutral and ionic PFASs were detected in dust in childcare facilities (Wu et al. 2020; Zheng et al. 2020). Total PFAS concentrations in paired dust and carpet samples from California childcare centers were dominated by the two neutral PFAS groups: ΣFTOH and ΣFOSA/FOSE (Wu et al. 2020; Zheng et al. 2020). Two short-chain fluorotelomer-based PFASs dominated both carpets and dust; 6:2 FTOH and 6:2 FTSA, and collectively accounted for over 50% of the sum of PFASs in both media. Other frequently detected PFASs included C4-C14 perfluoroalkylcarboxylic acids, C4-C8 perfluoroalkylsulfonic acids, PFDS, 4:2 FTSA, 8:2 FTSA, FOSA, MeFOSE, EtFOSE, 8:2 FTOH, and 10:2 FTOH. Strong associations were found between PFAS levels in carpet and dust sample pairs with the ∑PFAS mean reported at 572 and 430 ng/g in Wu et al. (2020) and Zheng et al. (2020), respectively. Zheng et al, detected twenty-eight PFASs in dust with total PFAS concentrations (∑PFAS) ranging from 8.1 to 3,700 ng/g and, dominated by the two neutral PFAS groups: ∑FTOH (range=<LOD- 3,100 ng/g) and ∑FOSA/FOSE (range=<LOD-380 ng/g). The ionic PFASs were detected at lower concentrations and were dominated by 6:2 FTSA and 8:2 FTSA (median 12 and 5.8 ng/g, respectively). Similar to findings for house dust, the high frequency of PFASs in childcare settings may pose health risks to children.
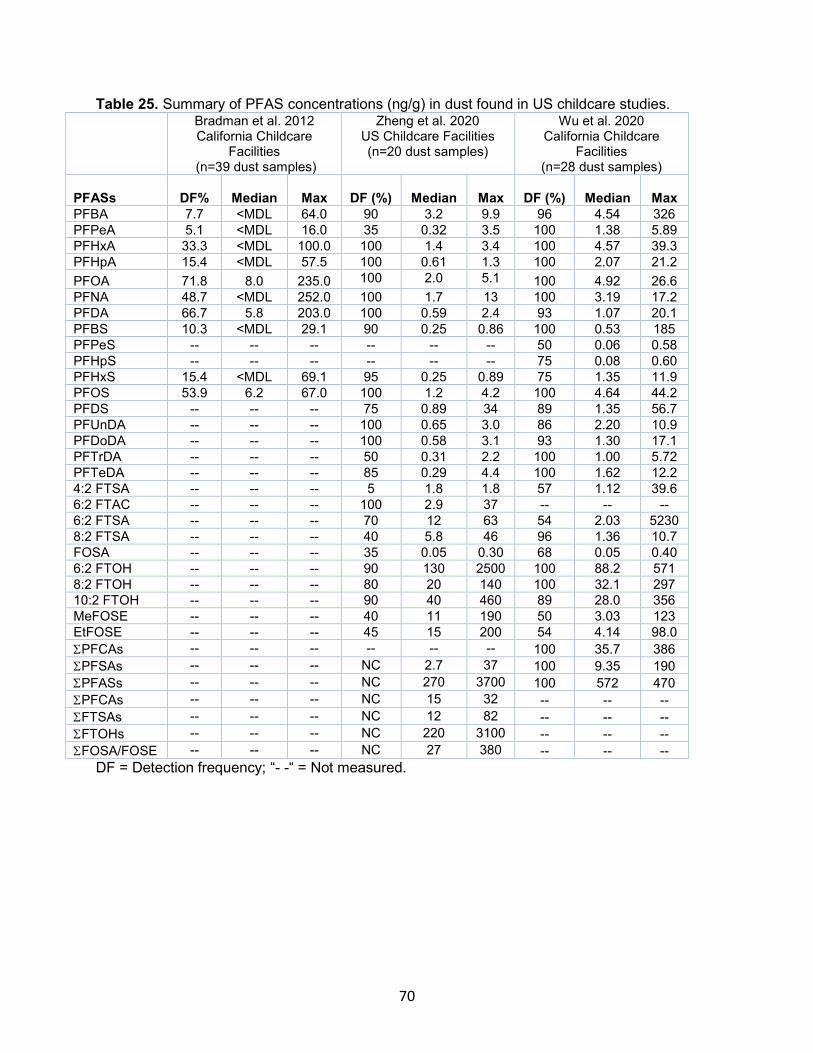
70
Table 25. Summary of PFAS concentrations (ng/g) in dust found in US childcare studies. Bradman et al. 2012
California Childcare Facilities
(n=39 dust samples)
Zheng et al. 2020 US Childcare Facilities (n=20 dust samples)
Wu et al. 2020 California Childcare
Facilities (n=28 dust samples)
PFASs DF% Median Max
DF (%)
Median
Max
DF (%)
Median
Max
PFBA 7.7 <MDL 64.0 90 3.2 9.9 96 4.54 326
PFPeA 5.1 <MDL 16.0 35 0.32 3.5 100 1.38 5.89
PFHxA 33.3 <MDL 100.0 100 1.4 3.4 100 4.57 39.3
PFHpA 15.4 <MDL 57.5 100 0.61 1.3 100 2.07 21.2
PFOA 71.8 8.0 235.0 100 2.0 5.1 100 4.92 26.6
PFNA 48.7 <MDL 252.0 100 1.7 13 100 3.19 17.2
PFDA 66.7 5.8 203.0 100 0.59 2.4 93 1.07 20.1
PFBS 10.3 <MDL 29.1 90 0.25 0.86 100 0.53 185
PFPeS -- -- -- -- -- -- 50 0.06 0.58
PFHpS -- -- -- -- -- -- 75 0.08 0.60
PFHxS 15.4 <MDL 69.1 95 0.25 0.89 75 1.35 11.9
PFOS 53.9 6.2 67.0 100 1.2 4.2 100 4.64 44.2
PFDS -- -- -- 75 0.89 34 89 1.35 56.7
PFUnDA -- -- -- 100 0.65 3.0 86 2.20 10.9
PFDoDA -- -- -- 100 0.58 3.1 93 1.30 17.1
PFTrDA -- -- -- 50 0.31 2.2 100 1.00 5.72
PFTeDA -- -- -- 85 0.29 4.4 100 1.62 12.2
4:2 FTSA -- -- -- 5 1.8 1.8 57 1.12 39.6
6:2 FTAC -- -- -- 100 2.9 37 -- -- --
6:2 FTSA -- -- -- 70 12 63 54 2.03 5230
8:2 FTSA -- -- -- 40 5.8 46 96 1.36 10.7
FOSA -- -- -- 35 0.05 0.30 68 0.05 0.40
6:2 FTOH -- -- -- 90 130 2500 100 88.2 571
8:2 FTOH -- -- -- 80 20 140 100 32.1 297
10:2 FTOH -- -- -- 90 40 460 89 28.0 356
MeFOSE -- -- -- 40 11 190 50 3.03 123
EtFOSE -- -- -- 45 15 200 54 4.14 98.0
PFCAs -- -- -- -- -- -- 100 35.7 386
PFSAs -- -- -- NC 2.7 37 100 9.35 190
PFASs -- -- -- NC 270 3700 100 572 470
PFCAs -- -- -- NC 15 32 -- -- --
FTSAs -- -- -- NC 12 82 -- -- --
FTOHs -- -- -- NC 220 3100 -- -- --
FOSA/FOSE -- -- -- NC 27 380 -- -- --
DF = Detection frequency; “- -“ = Not measured.
71
6.5 Sampling and Analytical Methods for Measuring PFASs in dust
6.5.1 Dust Sampling Methods
The most common method to sample dust in households and childcare centers is with a vacuum (Table 26). One approach is to collect dust from the vacuum bags of participating households (Makey et al. 2017; Shoeib et al. 2016; Strynar and Lindstrom 2008). Collecting vacuum bags is time and cost efficient but presents issues for houses that do not have vacuums. This method can also result in the collection of dust from multiple locations around the home and is not room specific. Further, the collection of dust in vacuum bags that have been used in the home for widely varying time intervals contributes undefined variability to the results. Another approach used a nylon sock (25 μm pore size) that was mounted in the furniture attachment tube of the vacuum cleaner and acted as a filter. The sample was then scraped off the sock and stored until processing (Byrne et al. 2017; Goosey and Harrad 2011; Karásková et al. 2016; Winkens et al. 2017; Wu et al. 2020; Zheng et al. 2020). Goosey and Harrad 2011 and Zheng et al. 2020 used nylon collection socks with 25 μm pore size while the rest used polyester socks (Karásková et al. 2016; Winkens et al. 2018; Wu et al. 2020). This sampling method is time and room specific compared with collecting vacuum bags, but may lose material passing through the sock filter. Wu et al. 2015 used a high volume small surface sampler (HVS3) for collecting dust (Roberts 1991). This method uses a cyclone to trap collected dust in a sample bottle and is not affected by changes in flow or clogging of filters. Another method used cellulose extraction thimbles as filters while vacuuming (Byrne et al. 2017; Fraser et al. 2013). The thimbles are inserted between the crevice tool and vacuum tube to collect the dust sample. Cellulose extraction thimbles are safe and easy to use compared with the HVS3. Table 26 summarizes the sampling methods used for measuring PFASs in dust.
Before analysis, most researchers sieved dust samples to <150 micrometers to remove hair, furniture fibers, and other large debris followed by sample storage at −20°C or colder until analysis.
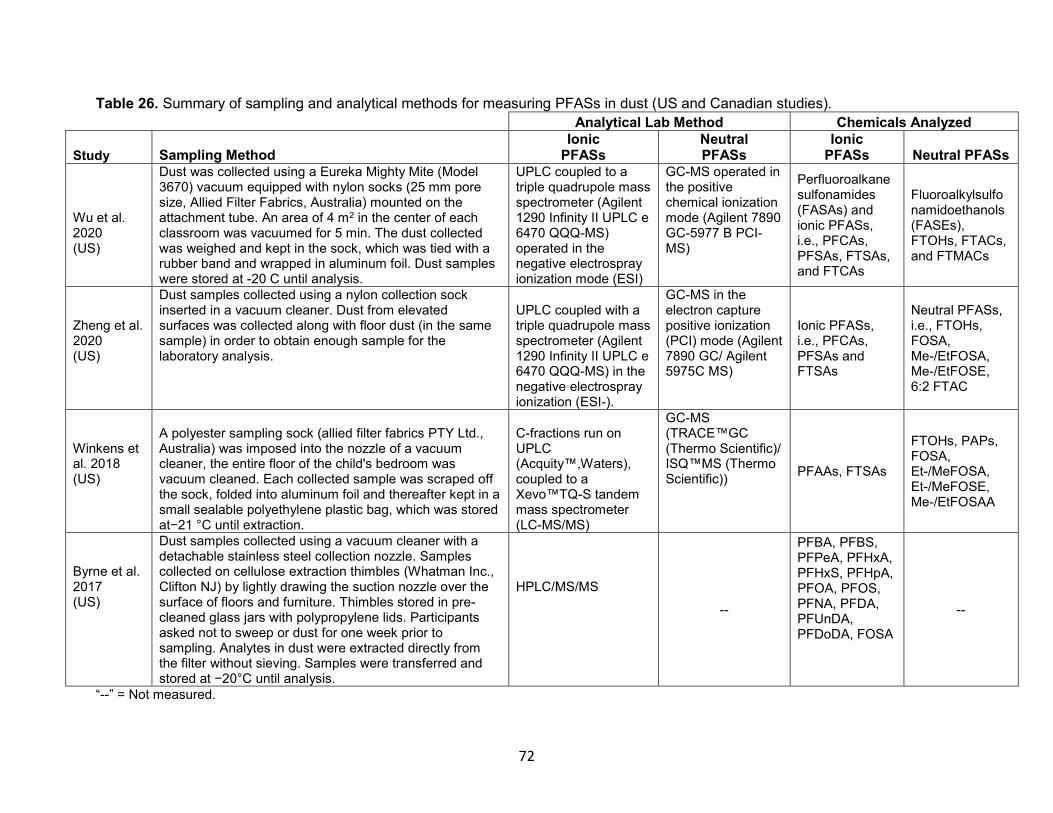
72
Table 26. Summary of sampling and analytical methods for measuring PFASs in dust (US and Canadian studies).
Analytical Lab Method Chemicals Analyzed
Study Sampling Method Ionic
PFASs Neutral PFASs
Ionic PFASs Neutral PFASs
Wu et al. 2020 (US)
Dust was collected using a Eureka Mighty Mite (Model 3670) vacuum equipped with nylon socks (25 mm pore size, Allied Filter Fabrics, Australia) mounted on the attachment tube. An area of 4 m2 in the center of each classroom was vacuumed for 5 min. The dust collected was weighed and kept in the sock, which was tied with a rubber band and wrapped in aluminum foil. Dust samples were stored at -20 C until analysis.
UPLC coupled to a triple quadrupole mass spectrometer (Agilent 1290 Infinity II UPLC e 6470 QQQ-MS) operated in the negative electrospray ionization mode (ESI)
GC-MS operated in the positive chemical ionization mode (Agilent 7890 GC-5977 B PCI-MS)
Perfluoroalkane sulfonamides (FASAs) and ionic PFASs, i.e., PFCAs, PFSAs, FTSAs, and FTCAs
Fluoroalkylsulfo namidoethanols (FASEs), FTOHs, FTACs, and FTMACs
Zheng et al. 2020 (US)
Dust samples collected using a nylon collection sock inserted in a vacuum cleaner. Dust from elevated surfaces was collected along with floor dust (in the same sample) in order to obtain enough sample for the laboratory analysis.
UPLC coupled with a triple quadrupole mass spectrometer (Agilent 1290 Infinity II UPLC e 6470 QQQ-MS) in the negative electrospray ionization (ESI-).
GC-MS in the electron capture positive ionization (PCI) mode (Agilent 7890 GC/ Agilent 5975C MS)
Ionic PFASs, i.e., PFCAs, PFSAs and FTSAs
Neutral PFASs, i.e., FTOHs, FOSA, Me-/EtFOSA, Me-/EtFOSE, 6:2 FTAC
Winkens et al. 2018 (US)
A polyester sampling sock (allied filter fabrics PTY Ltd., Australia) was imposed into the nozzle of a vacuum cleaner, the entire floor of the child's bedroom was vacuum cleaned. Each collected sample was scraped off the sock, folded into aluminum foil and thereafter kept in a small sealable polyethylene plastic bag, which was stored at−21 °C until extraction.
C-fractions run on UPLC (Acquity™,Waters), coupled to a Xevo™TQ-S tandem mass spectrometer (LC-MS/MS)
GC-MS (TRACE™GC (Thermo Scientific)/ ISQ™MS (Thermo Scientific))
PFAAs, FTSAs
FTOHs, PAPs, FOSA, Et-/MeFOSA, Et-/MeFOSE, Me-/EtFOSAA
Byrne et al. 2017 (US)
Dust samples collected using a vacuum cleaner with a detachable stainless steel collection nozzle. Samples collected on cellulose extraction thimbles (Whatman Inc., Clifton NJ) by lightly drawing the suction nozzle over the surface of floors and furniture. Thimbles stored in pre-cleaned glass jars with polypropylene lids. Participants asked not to sweep or dust for one week prior to sampling. Analytes in dust were extracted directly from the filter without sieving. Samples were transferred and stored at −20°C until analysis.
HPLC/MS/MS
--
PFBA, PFBS, PFPeA, PFHxA, PFHxS, PFHpA, PFOA, PFOS, PFNA, PFDA, PFUnDA, PFDoDA, FOSA
--
“--” = Not measured.
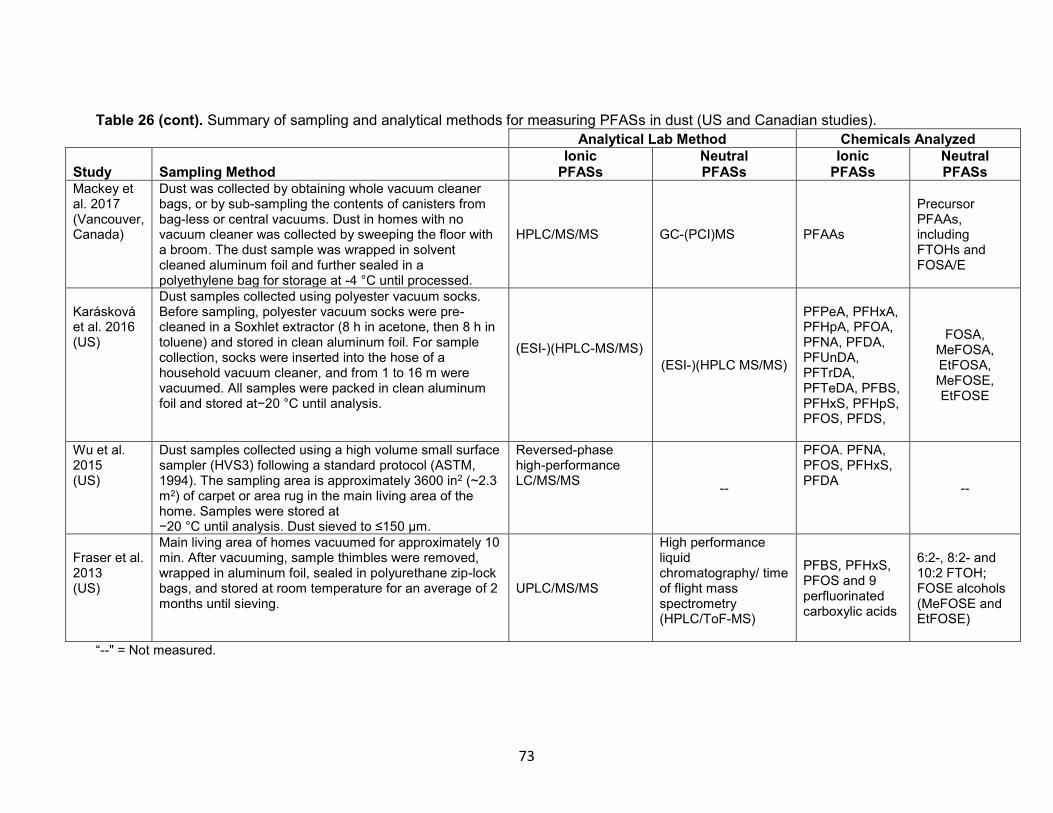
73
Table 26 (cont). Summary of sampling and analytical methods for measuring PFASs in dust (US and Canadian studies).
Analytical Lab Method Chemicals Analyzed
Study Sampling Method Ionic
PFASs Neutral PFASs
Ionic PFASs
Neutral PFASs
Mackey et al. 2017 (Vancouver, Canada)
Dust was collected by obtaining whole vacuum cleaner bags, or by sub-sampling the contents of canisters from bag-less or central vacuums. Dust in homes with no vacuum cleaner was collected by sweeping the floor with a broom. The dust sample was wrapped in solvent cleaned aluminum foil and further sealed in a polyethylene bag for storage at -4 °C until processed.
HPLC/MS/MS GC-(PCI)MS PFAAs
Precursor PFAAs, including FTOHs and FOSA/E
Karásková et al. 2016 (US)
Dust samples collected using polyester vacuum socks. Before sampling, polyester vacuum socks were pre-cleaned in a Soxhlet extractor (8 h in acetone, then 8 h in toluene) and stored in clean aluminum foil. For sample collection, socks were inserted into the hose of a household vacuum cleaner, and from 1 to 16 m were vacuumed. All samples were packed in clean aluminum foil and stored at−20 °C until analysis.
(ESI-)(HPLC-MS/MS)
(ESI-)(HPLC MS/MS)
PFPeA, PFHxA, PFHpA, PFOA, PFNA, PFDA, PFUnDA, PFTrDA, PFTeDA, PFBS, PFHxS, PFHpS, PFOS, PFDS,
FOSA, MeFOSA, EtFOSA, MeFOSE, EtFOSE
Wu et al. 2015 (US)
Dust samples collected using a high volume small surface sampler (HVS3) following a standard protocol (ASTM, 1994). The sampling area is approximately 3600 in2 (~2.3 m2) of carpet or area rug in the main living area of the home. Samples were stored at −20 °C until analysis. Dust sieved to ≤150 μm.
Reversed-phase high-performance LC/MS/MS
--
PFOA. PFNA, PFOS, PFHxS, PFDA
--
Fraser et al. 2013 (US)
Main living area of homes vacuumed for approximately 10 min. After vacuuming, sample thimbles were removed, wrapped in aluminum foil, sealed in polyurethane zip-lock bags, and stored at room temperature for an average of 2 months until sieving.
UPLC/MS/MS
High performance liquid chromatography/ time of flight mass spectrometry (HPLC/ToF-MS)
PFBS, PFHxS, PFOS and 9 perfluorinated carboxylic acids
6:2-, 8:2- and 10:2 FTOH; FOSE alcohols (MeFOSE and EtFOSE)
“--" = Not measured.
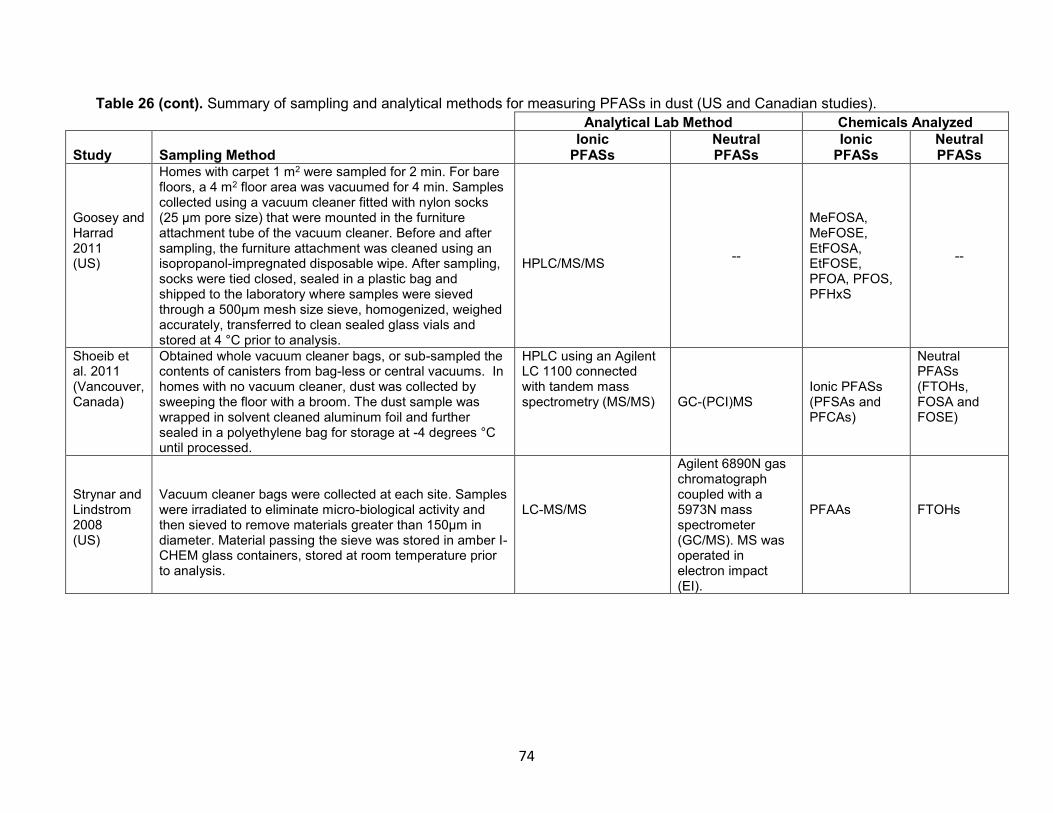
74
Table 26 (cont). Summary of sampling and analytical methods for measuring PFASs in dust (US and Canadian studies).
Analytical Lab Method Chemicals Analyzed
Study Sampling Method Ionic
PFASs Neutral PFASs
Ionic PFASs
Neutral PFASs
Goosey and Harrad 2011 (US)
Homes with carpet 1 m2 were sampled for 2 min. For bare floors, a 4 m2 floor area was vacuumed for 4 min. Samples collected using a vacuum cleaner fitted with nylon socks (25 μm pore size) that were mounted in the furniture attachment tube of the vacuum cleaner. Before and after sampling, the furniture attachment was cleaned using an isopropanol-impregnated disposable wipe. After sampling, socks were tied closed, sealed in a plastic bag and shipped to the laboratory where samples were sieved through a 500μm mesh size sieve, homogenized, weighed accurately, transferred to clean sealed glass vials and stored at 4 °C prior to analysis.
HPLC/MS/MS
--
MeFOSA, MeFOSE, EtFOSA, EtFOSE, PFOA, PFOS, PFHxS
--
Shoeib et al. 2011 (Vancouver, Canada)
Obtained whole vacuum cleaner bags, or sub-sampled the contents of canisters from bag-less or central vacuums. In homes with no vacuum cleaner, dust was collected by sweeping the floor with a broom. The dust sample was wrapped in solvent cleaned aluminum foil and further sealed in a polyethylene bag for storage at -4 degrees °C until processed.
HPLC using an Agilent LC 1100 connected with tandem mass spectrometry (MS/MS)
GC-(PCI)MS Ionic PFASs (PFSAs and PFCAs)
Neutral PFASs (FTOHs, FOSA and FOSE)
Strynar and Lindstrom 2008 (US)
Vacuum cleaner bags were collected at each site. Samples were irradiated to eliminate micro-biological activity and then sieved to remove materials greater than 150μm in diameter. Material passing the sieve was stored in amber I-CHEM glass containers, stored at room temperature prior to analysis.
LC-MS/MS
Agilent 6890N gas chromatograph coupled with a 5973N mass spectrometer (GC/MS). MS was operated in electron impact (EI).
PFAAs
FTOHs
75
6.5.2 Dust Extraction
Tables 27 and 28 summarize extraction and analytical methods for measuring ionic and neutral PFASs in dust.
Similar methods were used to extract ionic PFASs across the 11 studies (Table 27) (Byrne et al. 2017; Fraser et al. 2013; Goosey and Harrad 2011; Karásková et al. 2016; Makey et al. 2017; M. Shoeib et al. 2011; Strynar and Lindstrom 2008; Winkens et al. 2018; Wu et al. 2015; Wu et al. 2020; Zheng et al. 2020). After being spiked with internal standards, all studies sonicated the dust samples with a variety of solvents including hexane/isopropanol, methanol, acetonitrile, and ethyl acetate. Sonication was followed by centrifugation, and these two steps were repeated for two- three extraction rounds. Supernatants from each extraction round were collected and combined into a new tube, where they may have been cleaned up using either activated carbon (Supelclean ENVI-Carb 120/400) or the appropriate solvent to capture all analytes. Dust samples were then blown to dryness, typically using nitrogen blowdown, and filtered through either a centrifuge filter or a nylon syringe filter.
Extraction methods for neutral PFASs were identical to methods described for ionic PFASs, aside from the solvent used in sonication (Table 28). Methanol (MeOH), hexane/Isopropanol, MeOH/ acetonitrile, ethyl acetate, and baked Supelclean™ ENVICarb SPE Bulk Packing were used to extract both ionic and neutral PFASs (Fraser et al. 2013; Winkens et al. 2018; Wu et al. 2020; Zheng et al. 2020), whereas Shoeib et al. 2011 opted to use dichloromethane for neutral PFASs and MeOH for ionic PFASs, and Strynar and Lindstrom opted to use hexane/ 3-propanol for neutral PFASs and acetonitrile/ internal standards for ionic PFASs (Shoeib et al. 2011; Strynar and Lindstrom 2008) (Table 28).
Important considerations for sample analysis include ensuring all analytical equipment, lab materials, and supplies are PFAS-free. The use of cellulose extraction thimbles from Fraser et al. (2013) and Byrne et al. (2017) included an extra step for dust extraction and ensuring that equipment was PFAS free.
6.5.3 Analytical Methods for Measuring PFASs in Dust
Similar methods were used to analyze ionic PFASs in air and dust across the 11 studies (Table 27). Ultra- or high-performance liquid chromatography mass spectrometry (UPLC/MS or HPLC/MS) was typically used with MS or tandem MS (MS/MS) operating in the negative ESI mode (Byrne et al. 2017; Fraser et al. 2013; Goosey and Harrad 2011; Makey et al. 2017; Shoeib et al. 2016) (Table 26). Only one study opted to use LC/MS/MS to analyze ionic PFASs (Strynar and Lindstrom 2008).
For analysis of neutral PFASs and PFAA precursors, including FTOH and FOSA/E, gas chromatography coupled with mass spectrometry operating in the positive chemical ionization mode (GC-(PCI)MS) was typically used (Shoeib et al. 2016; Winkens et al. 2018; Wu et al. 2020; Zheng et al. 2020) (Table 28). Strynar and Lindstrom operated in the electron impact (EI) mode, while Fraser et al. 2013 opted to use HPLC/ time of flight mass spectrometry (ToF-MS) (Fraser et al. 2013; Strynar and Lindstrom 2008).
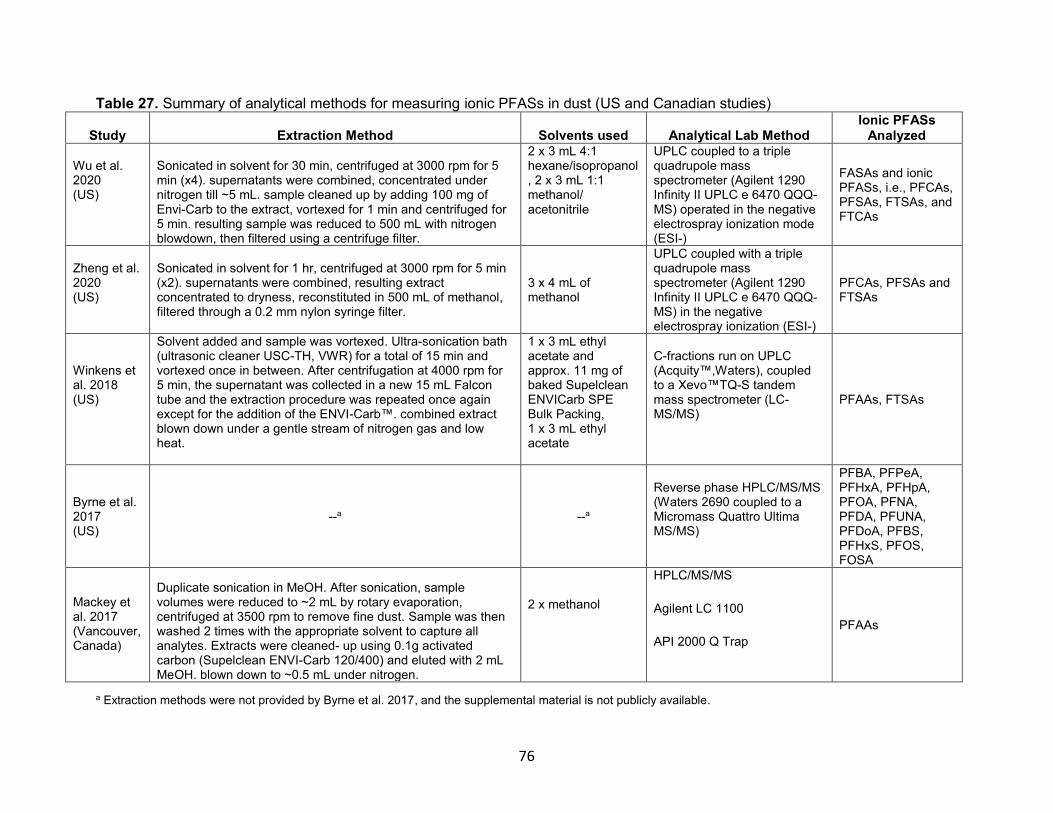
76
Table 27. Summary of analytical methods for measuring ionic PFASs in dust (US and Canadian studies)
Study Extraction Method
Solvents used Analytical Lab Method Ionic PFASs
Analyzed
Wu et al. 2020 (US)
Sonicated in solvent for 30 min, centrifuged at 3000 rpm for 5 min (x4). supernatants were combined, concentrated under nitrogen till ~5 mL. sample cleaned up by adding 100 mg of Envi-Carb to the extract, vortexed for 1 min and centrifuged for 5 min. resulting sample was reduced to 500 mL with nitrogen blowdown, then filtered using a centrifuge filter.
2 x 3 mL 4:1 hexane/isopropanol, 2 x 3 mL 1:1 methanol/ acetonitrile
UPLC coupled to a triple quadrupole mass spectrometer (Agilent 1290 Infinity II UPLC e 6470 QQQ-MS) operated in the negative electrospray ionization mode (ESI-)
FASAs and ionic PFASs, i.e., PFCAs, PFSAs, FTSAs, and FTCAs
Zheng et al. 2020 (US)
Sonicated in solvent for 1 hr, centrifuged at 3000 rpm for 5 min (x2). supernatants were combined, resulting extract concentrated to dryness, reconstituted in 500 mL of methanol, filtered through a 0.2 mm nylon syringe filter.
3 x 4 mL of methanol
UPLC coupled with a triple quadrupole mass spectrometer (Agilent 1290 Infinity II UPLC e 6470 QQQ-MS) in the negative electrospray ionization (ESI-)
PFCAs, PFSAs and FTSAs
Winkens et al. 2018 (US)
Solvent added and sample was vortexed. Ultra-sonication bath (ultrasonic cleaner USC-TH, VWR) for a total of 15 min and vortexed once in between. After centrifugation at 4000 rpm for 5 min, the supernatant was collected in a new 15 mL Falcon tube and the extraction procedure was repeated once again except for the addition of the ENVI-Carb™. combined extract blown down under a gentle stream of nitrogen gas and low heat.
1 x 3 mL ethyl acetate and approx. 11 mg of baked Supelclean ENVICarb SPE Bulk Packing, 1 x 3 mL ethyl acetate
C-fractions run on UPLC (Acquity™,Waters), coupled to a Xevo™TQ-S tandem mass spectrometer (LC-MS/MS)
PFAAs, FTSAs
Byrne et al. 2017 (US)
--a
--a
Reverse phase HPLC/MS/MS (Waters 2690 coupled to a Micromass Quattro Ultima MS/MS)
PFBA, PFPeA, PFHxA, PFHpA, PFOA, PFNA, PFDA, PFUNA, PFDoA, PFBS, PFHxS, PFOS, FOSA
Mackey et al. 2017 (Vancouver, Canada)
Duplicate sonication in MeOH. After sonication, sample volumes were reduced to ~2 mL by rotary evaporation, centrifuged at 3500 rpm to remove fine dust. Sample was then washed 2 times with the appropriate solvent to capture all analytes. Extracts were cleaned- up using 0.1g activated carbon (Supelclean ENVI-Carb 120/400) and eluted with 2 mL MeOH. blown down to ~0.5 mL under nitrogen.
2 x methanol
HPLC/MS/MS
Agilent LC 1100
API 2000 Q Trap
PFAAs
a Extraction methods were not provided by Byrne et al. 2017, and the supplemental material is not publicly available.
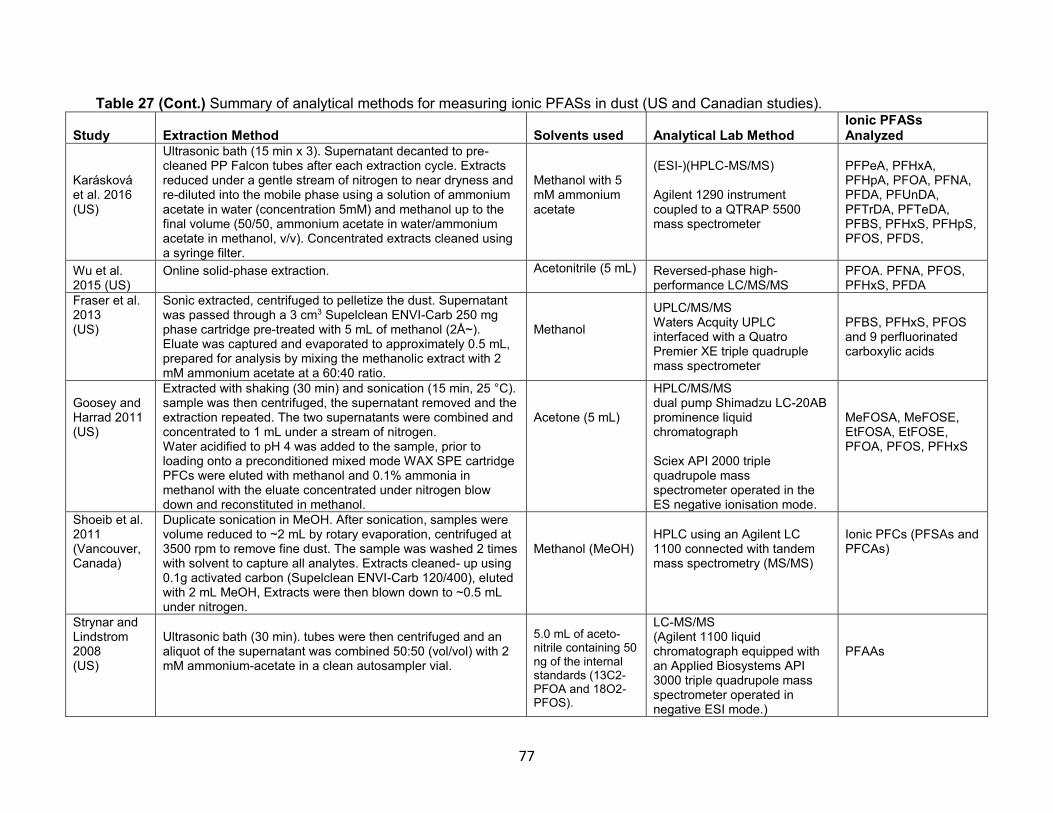
77
Table 27 (Cont.) Summary of analytical methods for measuring ionic PFASs in dust (US and Canadian studies).
Study Extraction Method Solvents used Analytical Lab Method
Ionic PFASs Analyzed
Karásková et al. 2016 (US)
Ultrasonic bath (15 min x 3). Supernatant decanted to pre-cleaned PP Falcon tubes after each extraction cycle. Extracts reduced under a gentle stream of nitrogen to near dryness and re-diluted into the mobile phase using a solution of ammonium acetate in water (concentration 5mM) and methanol up to the final volume (50/50, ammonium acetate in water/ammonium acetate in methanol, v/v). Concentrated extracts cleaned using a syringe filter.
Methanol with 5 mM ammonium acetate
(ESI-)(HPLC-MS/MS) Agilent 1290 instrument coupled to a QTRAP 5500 mass spectrometer
PFPeA, PFHxA, PFHpA, PFOA, PFNA, PFDA, PFUnDA, PFTrDA, PFTeDA, PFBS, PFHxS, PFHpS, PFOS, PFDS,
Wu et al. 2015 (US)
Online solid-phase extraction.
Acetonitrile (5 mL) Reversed-phase high-performance LC/MS/MS
PFOA. PFNA, PFOS, PFHxS, PFDA
Fraser et al. 2013 (US)
Sonic extracted, centrifuged to pelletize the dust. Supernatant was passed through a 3 cm3 Supelclean ENVI-Carb 250 mg phase cartridge pre-treated with 5 mL of methanol (2Å~). Eluate was captured and evaporated to approximately 0.5 mL, prepared for analysis by mixing the methanolic extract with 2 mM ammonium acetate at a 60:40 ratio.
Methanol
UPLC/MS/MS Waters Acquity UPLC interfaced with a Quatro Premier XE triple quadruple mass spectrometer
PFBS, PFHxS, PFOS and 9 perfluorinated carboxylic acids
Goosey and Harrad 2011 (US)
Extracted with shaking (30 min) and sonication (15 min, 25 °C). sample was then centrifuged, the supernatant removed and the extraction repeated. The two supernatants were combined and concentrated to 1 mL under a stream of nitrogen. Water acidified to pH 4 was added to the sample, prior to loading onto a preconditioned mixed mode WAX SPE cartridge PFCs were eluted with methanol and 0.1% ammonia in methanol with the eluate concentrated under nitrogen blow down and reconstituted in methanol.
Acetone (5 mL)
HPLC/MS/MS dual pump Shimadzu LC-20AB prominence liquid chromatograph Sciex API 2000 triple quadrupole mass spectrometer operated in the ES negative ionisation mode.
MeFOSA, MeFOSE, EtFOSA, EtFOSE, PFOA, PFOS, PFHxS
Shoeib et al. 2011 (Vancouver, Canada)
Duplicate sonication in MeOH. After sonication, samples were volume reduced to ~2 mL by rotary evaporation, centrifuged at 3500 rpm to remove fine dust. The sample was washed 2 times with solvent to capture all analytes. Extracts cleaned- up using 0.1g activated carbon (Supelclean ENVI-Carb 120/400), eluted with 2 mL MeOH, Extracts were then blown down to ~0.5 mL under nitrogen.
Methanol (MeOH)
HPLC using an Agilent LC 1100 connected with tandem mass spectrometry (MS/MS)
Ionic PFCs (PFSAs and PFCAs)
Strynar and Lindstrom 2008 (US)
Ultrasonic bath (30 min). tubes were then centrifuged and an aliquot of the supernatant was combined 50:50 (vol/vol) with 2 mM ammonium-acetate in a clean autosampler vial.
5.0 mL of aceto-nitrile containing 50 ng of the internal standards (13C2-PFOA and 18O2-PFOS).
LC-MS/MS (Agilent 1100 liquid chromatograph equipped with an Applied Biosystems API 3000 triple quadrupole mass spectrometer operated in negative ESI mode.)
PFAAs
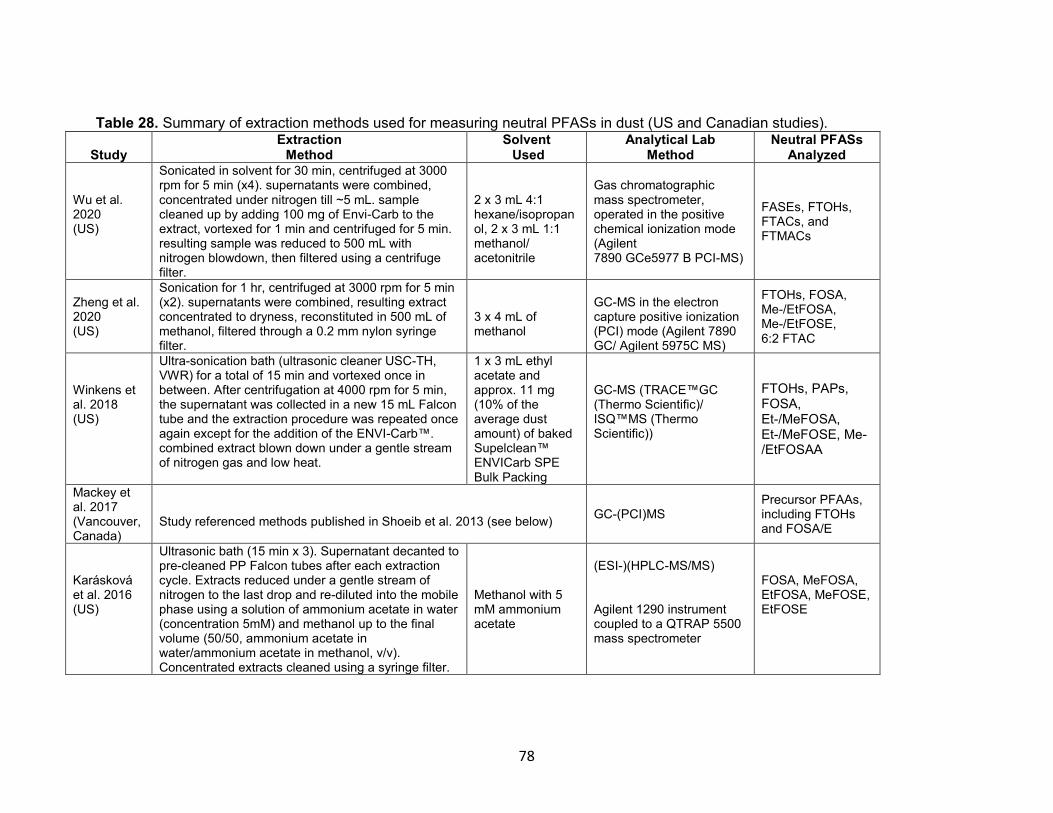
78
Table 28. Summary of extraction methods used for measuring neutral PFASs in dust (US and Canadian studies).
Study Extraction
Method Solvent Used
Analytical Lab Method
Neutral PFASs Analyzed
Wu et al. 2020 (US)
Sonicated in solvent for 30 min, centrifuged at 3000 rpm for 5 min (x4). supernatants were combined, concentrated under nitrogen till ~5 mL. sample cleaned up by adding 100 mg of Envi-Carb to the extract, vortexed for 1 min and centrifuged for 5 min. resulting sample was reduced to 500 mL with nitrogen blowdown, then filtered using a centrifuge filter.
2 x 3 mL 4:1 hexane/isopropanol, 2 x 3 mL 1:1 methanol/ acetonitrile
Gas chromatographic mass spectrometer, operated in the positive chemical ionization mode (Agilent 7890 GCe5977 B PCI-MS)
FASEs, FTOHs, FTACs, and FTMACs
Zheng et al. 2020 (US)
Sonication for 1 hr, centrifuged at 3000 rpm for 5 min (x2). supernatants were combined, resulting extract concentrated to dryness, reconstituted in 500 mL of methanol, filtered through a 0.2 mm nylon syringe filter.
3 x 4 mL of methanol
GC-MS in the electron capture positive ionization (PCI) mode (Agilent 7890 GC/ Agilent 5975C MS)
FTOHs, FOSA, Me-/EtFOSA, Me-/EtFOSE, 6:2 FTAC
Winkens et al. 2018 (US)
Ultra-sonication bath (ultrasonic cleaner USC-TH, VWR) for a total of 15 min and vortexed once in between. After centrifugation at 4000 rpm for 5 min, the supernatant was collected in a new 15 mL Falcon tube and the extraction procedure was repeated once again except for the addition of the ENVI-Carb™. combined extract blown down under a gentle stream of nitrogen gas and low heat.
1 x 3 mL ethyl acetate and approx. 11 mg (10% of the average dust amount) of baked Supelclean™ ENVICarb SPE Bulk Packing
GC-MS (TRACE™GC (Thermo Scientific)/ ISQ™MS (Thermo Scientific))
FTOHs, PAPs, FOSA, Et-/MeFOSA, Et-/MeFOSE, Me-/EtFOSAA
Mackey et al. 2017 (Vancouver, Canada)
Study referenced methods published in Shoeib et al. 2013 (see below)
GC-(PCI)MS Precursor PFAAs, including FTOHs and FOSA/E
Karásková et al. 2016 (US)
Ultrasonic bath (15 min x 3). Supernatant decanted to pre-cleaned PP Falcon tubes after each extraction cycle. Extracts reduced under a gentle stream of nitrogen to the last drop and re-diluted into the mobile phase using a solution of ammonium acetate in water (concentration 5mM) and methanol up to the final volume (50/50, ammonium acetate in water/ammonium acetate in methanol, v/v). Concentrated extracts cleaned using a syringe filter.
Methanol with 5 mM ammonium acetate
(ESI-)(HPLC-MS/MS) Agilent 1290 instrument coupled to a QTRAP 5500 mass spectrometer
FOSA, MeFOSA, EtFOSA, MeFOSE, EtFOSE
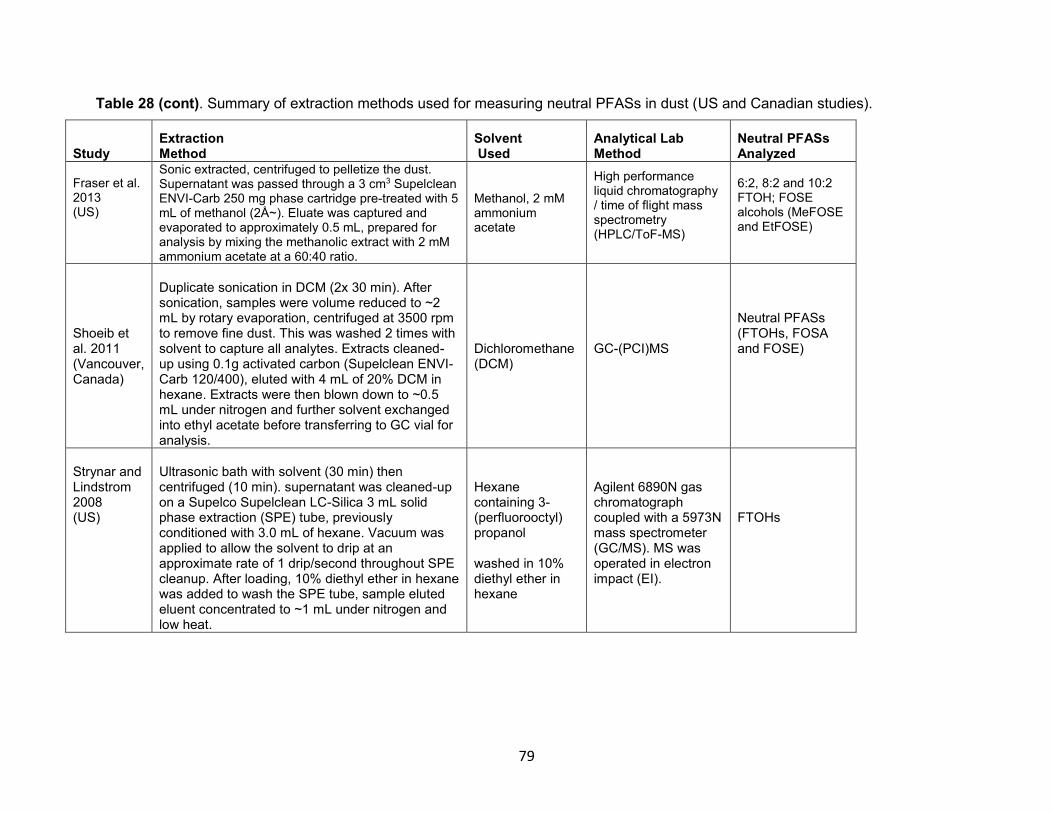
79
Table 28 (cont). Summary of extraction methods used for measuring neutral PFASs in dust (US and Canadian studies).
Study Extraction Method
Solvent Used
Analytical Lab Method
Neutral PFASs Analyzed
Fraser et al. 2013 (US)
Sonic extracted, centrifuged to pelletize the dust. Supernatant was passed through a 3 cm3 Supelclean ENVI-Carb 250 mg phase cartridge pre-treated with 5 mL of methanol (2Å~). Eluate was captured and evaporated to approximately 0.5 mL, prepared for analysis by mixing the methanolic extract with 2 mM ammonium acetate at a 60:40 ratio.
Methanol, 2 mM ammonium acetate
High performance liquid chromatography / time of flight mass spectrometry (HPLC/ToF-MS)
6:2, 8:2 and 10:2 FTOH; FOSE alcohols (MeFOSE and EtFOSE)
Shoeib et al. 2011 (Vancouver, Canada)
Duplicate sonication in DCM (2x 30 min). After sonication, samples were volume reduced to ~2 mL by rotary evaporation, centrifuged at 3500 rpm to remove fine dust. This was washed 2 times with solvent to capture all analytes. Extracts cleaned- up using 0.1g activated carbon (Supelclean ENVI-Carb 120/400), eluted with 4 mL of 20% DCM in hexane. Extracts were then blown down to ~0.5 mL under nitrogen and further solvent exchanged into ethyl acetate before transferring to GC vial for analysis.
Dichloromethane (DCM)
GC-(PCI)MS
Neutral PFASs (FTOHs, FOSA and FOSE)
Strynar and Lindstrom 2008 (US)
Ultrasonic bath with solvent (30 min) then centrifuged (10 min). supernatant was cleaned-up on a Supelco Supelclean LC-Silica 3 mL solid phase extraction (SPE) tube, previously conditioned with 3.0 mL of hexane. Vacuum was applied to allow the solvent to drip at an approximate rate of 1 drip/second throughout SPE cleanup. After loading, 10% diethyl ether in hexane was added to wash the SPE tube, sample eluted eluent concentrated to ~1 mL under nitrogen and low heat.
Hexane containing 3-(perfluorooctyl) propanol washed in 10% diethyl ether in hexane
Agilent 6890N gas chromatograph coupled with a 5973N mass spectrometer (GC/MS). MS was operated in electron impact (EI).
FTOHs

80
7 Evaluate Sampling and Laboratory Analytic Methods for PFASs in Soil (Task 1E)
7.1 Concentrations of PFASs in Soil
Table 29 presents results from three studies reporting PFASs in surface, subsurface, and surficial soil samples. These samples were collected in various locations throughout the US near sources of PFAS contamination. Zhu and Kannan (2019) measured soil samples from a floodplain in Ohio that had been contaminated from industrial sources of release. PFOA, PFUnDA, and PFDoDA were the PFASs at the highest levels, with medians of 93 ng/g, 7.3 ng/g, and 4.5 ng/g, respectively (Zhu and Kannan 2019). Anderson et al. measured soil samples on active US Air Force installations with historic aqueous film-forming foam (AFFF) use of varying magnitude. In surface soil samples, they reported the highest PFAS concentrations for PFOS, PFHxS, and PFDS, with medians of 52.5 ng/g, 5.70 ng/g, and 3.70 ng/g, respectively. In subsurface soil samples, they reported the highest concentrations for PFOS, PFHxS, and PFDS, with medians of 11.5 ng/g, 4.40 ng/g, and 3.55 ng/g, respectively (Anderson et al. 2016). Houtz et al. measured soil samples from an unlined firefighter training area at a US Air Force Base where AFFF was regularly used between 1970 and 1990, and found the highest PFAS concentrations for PFOS, 6:2 FTSA, and 8:2 FTSA, with medians of 2400 ng/g, 85 ng/g, and 81 ng/g, respectively (Houtz et al. 2013).
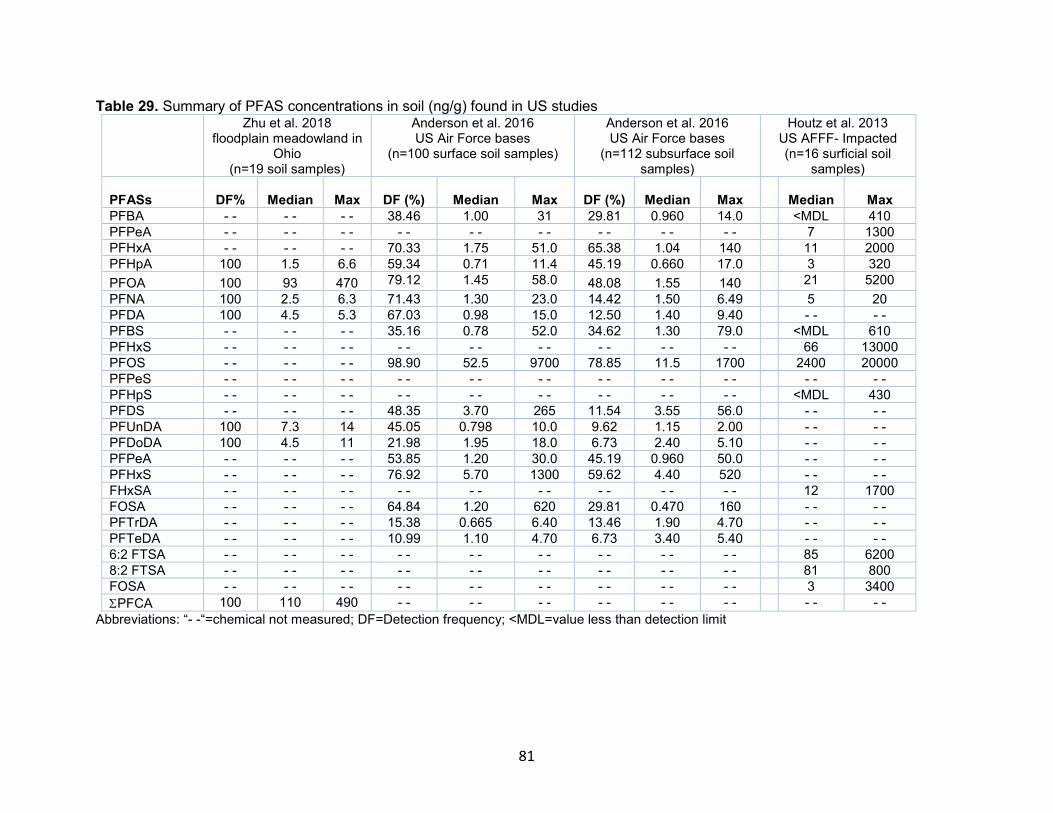
81
Table 29. Summary of PFAS concentrations in soil (ng/g) found in US studies Zhu et al. 2018
floodplain meadowland in Ohio
(n=19 soil samples)
Anderson et al. 2016 US Air Force bases
(n=100 surface soil samples)
Anderson et al. 2016 US Air Force bases
(n=112 subsurface soil samples)
Houtz et al. 2013 US AFFF- Impacted (n=16 surficial soil
samples)
PFASs DF% Median Max
DF (%)
Median
Max
DF (%)
Median
Max
Median
Max
PFBA - - - - - - 38.46 1.00 31 29.81 0.960 14.0 <MDL 410
PFPeA - - - - - - - - - - - - - - - - - - 7 1300
PFHxA - - - - - - 70.33 1.75 51.0 65.38 1.04 140 11 2000
PFHpA 100 1.5 6.6 59.34 0.71 11.4 45.19 0.660 17.0 3 320
PFOA 100 93 470 79.12 1.45 58.0 48.08 1.55 140 21 5200
PFNA 100 2.5 6.3 71.43 1.30 23.0 14.42 1.50 6.49 5 20
PFDA 100 4.5 5.3 67.03 0.98 15.0 12.50 1.40 9.40 - - - -
PFBS - - - - - - 35.16 0.78 52.0 34.62 1.30 79.0 <MDL 610
PFHxS - - - - - - - - - - - - - - - - - - 66 13000
PFOS - - - - - - 98.90 52.5 9700 78.85 11.5 1700 2400 20000
PFPeS - - - - - - - - - - - - - - - - - - - - - -
PFHpS - - - - - - - - - - - - - - - - - - <MDL 430
PFDS - - - - - - 48.35 3.70 265 11.54 3.55 56.0 - - - -
PFUnDA 100 7.3 14 45.05 0.798 10.0 9.62 1.15 2.00 - - - -
PFDoDA 100 4.5 11 21.98 1.95 18.0 6.73 2.40 5.10 - - - -
PFPeA - - - - - - 53.85 1.20 30.0 45.19 0.960 50.0 - - - -
PFHxS - - - - - - 76.92 5.70 1300 59.62 4.40 520 - - - -
FHxSA - - - - - - - - - - - - - - - - - - 12 1700
FOSA - - - - - - 64.84 1.20 620 29.81 0.470 160 - - - -
PFTrDA - - - - - - 15.38 0.665 6.40 13.46 1.90 4.70 - - - -
PFTeDA - - - - - - 10.99 1.10 4.70 6.73 3.40 5.40 - - - -
6:2 FTSA - - - - - - - - - - - - - - - - - - 85 6200
8:2 FTSA - - - - - - - - - - - - - - - - - - 81 800
FOSA - - - - - - - - - - - - - - - - - - 3 3400
PFCA 100 110 490 - - - - - - - - - - - - - - - -
Abbreviations: “- -“=chemical not measured; DF=Detection frequency; <MDL=value less than detection limit

82
7.2 Soil Sampling Methods for Measuring PFASs
Table 30 summarizes sampling, extraction and analysis methods for measuring PFASs in soil samples from eight North American studies (Washington et al. 2020; Anderson et al. 2016; Xiao et al. 2015; McGuire et al. 2013; Strynar et al. 2012; Sepulvado et al. 2011; Washington et al. 2010).
7.2.1 Soil Collection
Fresh soil samples are typically acquired using stainless-steel trowels pre-cleaned with methanol and may be collected as a composite sample from multiple locations within a given area at varying depths below ground surface (bgs), usually ranging from 0–60 cm, depending on the type of soil sample being collected (See Table 30) (Strynar et al. 2012; Washington et al. 2020). Surface soil samples are typically collected 0-15 cm bgs, while subsurface soil samples are collected up to 60 cm. Sediment soil samples are collected 0-30 cm below the top of the sediment layer (Anderson 2016). After collection, soil samples are sieved with a mesh sieve that is typically washed with methanol (MeOH). Note, the soil samples are typically sieved as collected so there is no change in moisture content. After sieving, the soil samples are shipped in commercially available polyethylene zip-top bags and stored at either 4ºC or -20 ºC until analysis (Houtz et al. 2013; Sepulvado et al. 2011; Strynar et al. 2012).
7.2.2 Soil Extraction
After sample collection, soil samples typically are extracted in triplicate. Prior to extraction, soil samples are rotated and spiked with perfluorinated internal standards (IS) or surrogate standards (Sepulvado et al. 2011). They are then vortexed, sonicated, and shaken using either a rotating table, orbital shaker, or some other rotational device for various amounts of time (see Table 30). The samples are then transferred to polycarbonate (PPCO) centrifuge tubes, capped with PPCO centrifuge caps, and extracts are separated from the soil via centrifugation. This process is usually repeated twice, for a total of three extractions (Houtz et al. 2013). The supernatant is then subject to cleanup using one of several techniques such as solid phase extraction (SPE), temperature-modified phase separation, or graphitized carbon (Anderson et al. 2016; Strynar et al. 2012). ENVI-Carb SPE tubes are typically used to remove excess organic matter that could "suppress ionization of the compounds in the mass spectrometer or reduce the efficiency of the oxidative assay" (Houtz et al. 2013). To ensure that ENVI-CARB did not remove any PFASs, Houtz et al. performed controlled experiments to confirm that ENVI-CARB did not alter PFASs recoveries (Houtz et al. 2013).
Throughout soil collection and extraction, it is critical to ensure that all lab materials and supplies are PFAS-free in order to not contaminate soil sample analyses. Additionally, vacuum evaporation must be used with caution to avoid blowing the sample extract down to complete dryness, as this will likely decrease the recoveries of some PFAS analytes (Strynar and Lindstrom 2008; Washington et al. 2020).
7.2.3 Laboratory Analysis of PFASs in soil
Following extraction, soil samples are typically analyzed for ionic PFASs using ultra performance liquid chromatography (UPLC) coupled to tandem mass spectrometry (MS/MS) (-ESI) or LC-MS/MS (Sepulvado et al. 2011; Washington et al. 2010; Washington et al. 2020)

83
(Styrnar et al. 2012). UPLC operates at higher pressures (15,000 psi) and allows for lower particle sizes in columns, while HPLC operates at lower pressures (max <6000 psi). MS/MS allows increased analytic capabilities of chemical compounds by coupling two mass spec analyzers. Washington et al. (2020) utilized UPLC coupled to a quadrupole time-of-flight (QToF) mass spectrometer operating in a negative electrospray ionization (ESI), MSe (no mass filtering) mode. This method allows for high mass accuracy and accurate quantitation capabilities (Washington et al. 2020). Xiao et al. utilized high performance liquid chromatography (HPLC) coupled to a triple stage quadrupole (TSQ) mass spectrometer, which uses the first and third quadrupoles as mass filters; the second quadrupole acts to cause analyte fragments to collide with gas (Xiao et al. 2015). Two of these soil studies successfully measured both PFAS precursors (Et-/MeFOSAA and chloroperfluoropolyether carboxylates) and ionic PFASs (Sepulvado et al. 2011; Washington et al. 2020).
The LC and MS instruments used differed in the studies considered. Soil samples were typically analyzed on a wet weight basis after sieving, however, moisture content may differ between samples and over time. To normalize the data, it is typical to dry sub-samples in the oven and reweigh them to calculate original moisture content (Strynar et al. 2012).

84
Table 30. Summary of sampling and analytical methods for measuring PFASs in soil (US and Canadian studies)
Study Sampling Method
Extraction Method Analysis Method Chemicals Analyzed
Washington et al. 2020 (US)
Surface: 0 -10 cm bgs via methanol-washed stainless-steel spades. Each sample consisted of soil collected at three subsample locations within ~1 m area; first premixed in the holes prior to transfer to the sample container. Samples were stored in high-density polyethylene sample containers with unlined caps, which were stored in coolers on ice.
Sieved in methanol-washed (MeOH-) 2-mm stainless-steel (SS) sieves. extracted in triplicate. ~2 g (dry weight) samples transferred into MeOH-washed polypropylene copolymer (PPCO) centrifuge tubes spiked with 13C8-labeled perfluorooctanoate (M8C8) as a recovery standard. aliquot of 2M sodium hydroxide prepared in polished 18 MΩ water (PW) and 90:10 acetonitrile:PW (ACN:PW) solution were mixed into the soils by vortexing. sonicated in an ice both. rotated by rotisserie mixer for ~15 hrs. centrifuged second round of ACN:PW extraction. blown to near dryness via SPE manifold.
Ultraperformance liquid chromatograph (UPLC) coupled to a quadrupole time-of-flight (QToF) mass spectrometer operating in negative electrospray ionization (ESI), MSe (no mass filtering) mode (Waters Acquity/ Waters Xevo)
ClPFPECAs (chloroperfluoro- polyether carboxylate) and legacy PFCAs C6 through C13 PFCAs Neutral: FTOHs (precursor)
Anderson et al. 2016 (US)
Subsurface: collected at intervals from each direct push technology (DPT) boring between the top of the water table and the 0-1 ft bgs sample. Surface soil (0-1 ft bgs) and sediment samples (0-1 ft below top of the sediment) were collected directly into sample containers
Mixed with sodium hydroxide, then addition of methanol. Mixture was sonicated, tumbled, and adjusted to pH < 2. Extracts were centrifuged, concentrated, solvent-exchanged, cleaned, and reduced to a final volume of 1 ml. Extract cleanup through one of several techniques (solid phase extraction, temperature-modified phase separation, or graphitized carbon). 13C- or 18O-labeled PFASs were used as isotope dilution standards.
LC-MS/MS (as per US EPA Method 537 for drinking water as modified by TestAmerica's proprietary standard operating procedures (SOP DV-LC-0019)
PFBA, PFBS, PFPeA, PFHxA, PFHxS, PFHpA, PFOA, FOSA, PFOS, PFNA, PFDA, PFDS, PFUnDA, PFDoA, PFTrDA, PFTeDA
Xiao et al. 2015 (US)
Surface: composite of four sub-samples obtained in a 2 m × 2 m grid via stainless steel auger after removing stones and vegetation from surface. sieved through a 2-mm stainless steel mesh, mixed thoroughly. The sample was ground and homogenized with a methanol-rinsed mortar and pestle.
HPLC- TSQ MS (Agilent 1100/ Thermo-Finnigan triple stage quadrupole (TSQ) mass spectrometer), internal standard-response factor method
PFOS and PFOA
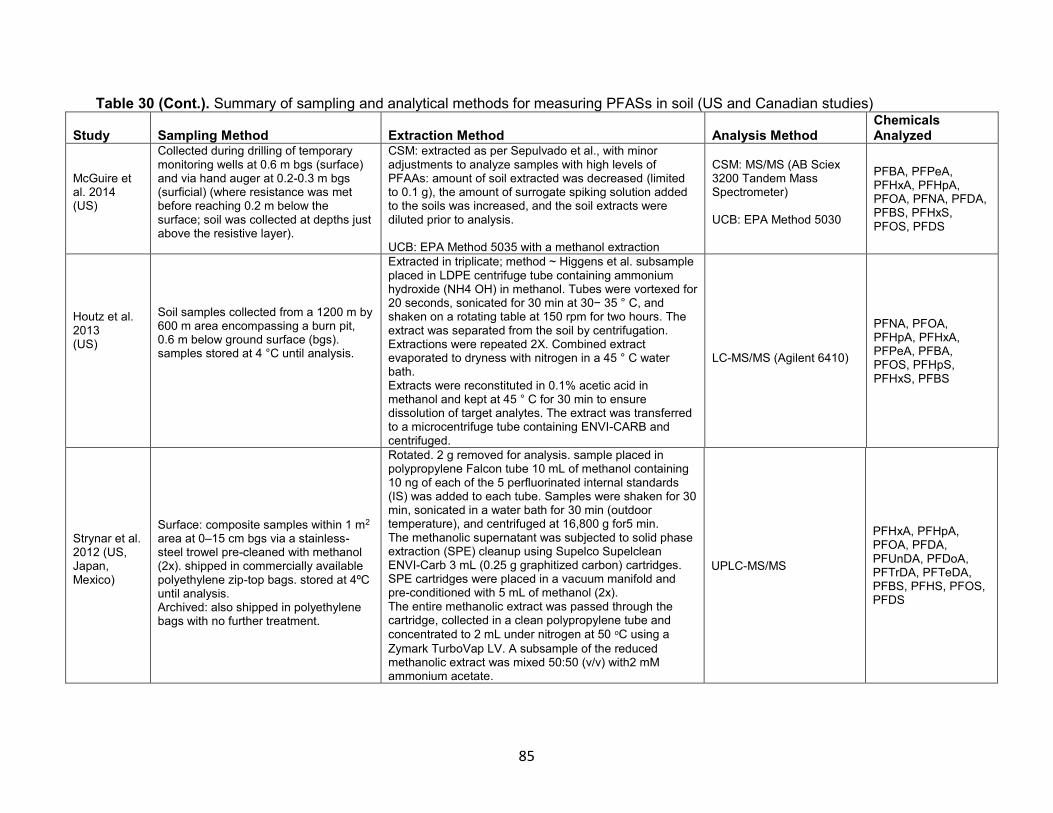
85
Table 30 (Cont.). Summary of sampling and analytical methods for measuring PFASs in soil (US and Canadian studies)
Study Sampling Method Extraction Method Analysis Method
Chemicals Analyzed
McGuire et al. 2014 (US)
Collected during drilling of temporary monitoring wells at 0.6 m bgs (surface) and via hand auger at 0.2-0.3 m bgs (surficial) (where resistance was met before reaching 0.2 m below the surface; soil was collected at depths just above the resistive layer).
CSM: extracted as per Sepulvado et al., with minor adjustments to analyze samples with high levels of PFAAs: amount of soil extracted was decreased (limited to 0.1 g), the amount of surrogate spiking solution added to the soils was increased, and the soil extracts were diluted prior to analysis. UCB: EPA Method 5035 with a methanol extraction
CSM: MS/MS (AB Sciex 3200 Tandem Mass Spectrometer) UCB: EPA Method 5030
PFBA, PFPeA, PFHxA, PFHpA, PFOA, PFNA, PFDA, PFBS, PFHxS, PFOS, PFDS
Houtz et al. 2013 (US)
Soil samples collected from a 1200 m by 600 m area encompassing a burn pit, 0.6 m below ground surface (bgs). samples stored at 4 °C until analysis.
Extracted in triplicate; method ~ Higgens et al. subsample placed in LDPE centrifuge tube containing ammonium hydroxide (NH4 OH) in methanol. Tubes were vortexed for 20 seconds, sonicated for 30 min at 30− 35 ° C, and shaken on a rotating table at 150 rpm for two hours. The extract was separated from the soil by centrifugation. Extractions were repeated 2X. Combined extract evaporated to dryness with nitrogen in a 45 ° C water bath. Extracts were reconstituted in 0.1% acetic acid in methanol and kept at 45 ° C for 30 min to ensure dissolution of target analytes. The extract was transferred to a microcentrifuge tube containing ENVI-CARB and centrifuged.
LC-MS/MS (Agilent 6410)
PFNA, PFOA, PFHpA, PFHxA, PFPeA, PFBA, PFOS, PFHpS, PFHxS, PFBS
Strynar et al. 2012 (US, Japan, Mexico)
Surface: composite samples within 1 m2 area at 0–15 cm bgs via a stainless-steel trowel pre-cleaned with methanol (2x). shipped in commercially available polyethylene zip-top bags. stored at 4ºC until analysis. Archived: also shipped in polyethylene bags with no further treatment.
Rotated. 2 g removed for analysis. sample placed in polypropylene Falcon tube 10 mL of methanol containing 10 ng of each of the 5 perfluorinated internal standards (IS) was added to each tube. Samples were shaken for 30 min, sonicated in a water bath for 30 min (outdoor temperature), and centrifuged at 16,800 g for5 min. The methanolic supernatant was subjected to solid phase extraction (SPE) cleanup using Supelco Supelclean ENVI-Carb 3 mL (0.25 g graphitized carbon) cartridges. SPE cartridges were placed in a vacuum manifold and pre-conditioned with 5 mL of methanol (2x). The entire methanolic extract was passed through the cartridge, collected in a clean polypropylene tube and
concentrated to 2 mL under nitrogen at 50 οC using a
Zymark TurboVap LV. A subsample of the reduced methanolic extract was mixed 50:50 (v/v) with2 mM ammonium acetate.
UPLC-MS/MS
PFHxA, PFHpA, PFOA, PFDA, PFUnDA, PFDoA, PFTrDA, PFTeDA, PFBS, PFHS, PFOS, PFDS
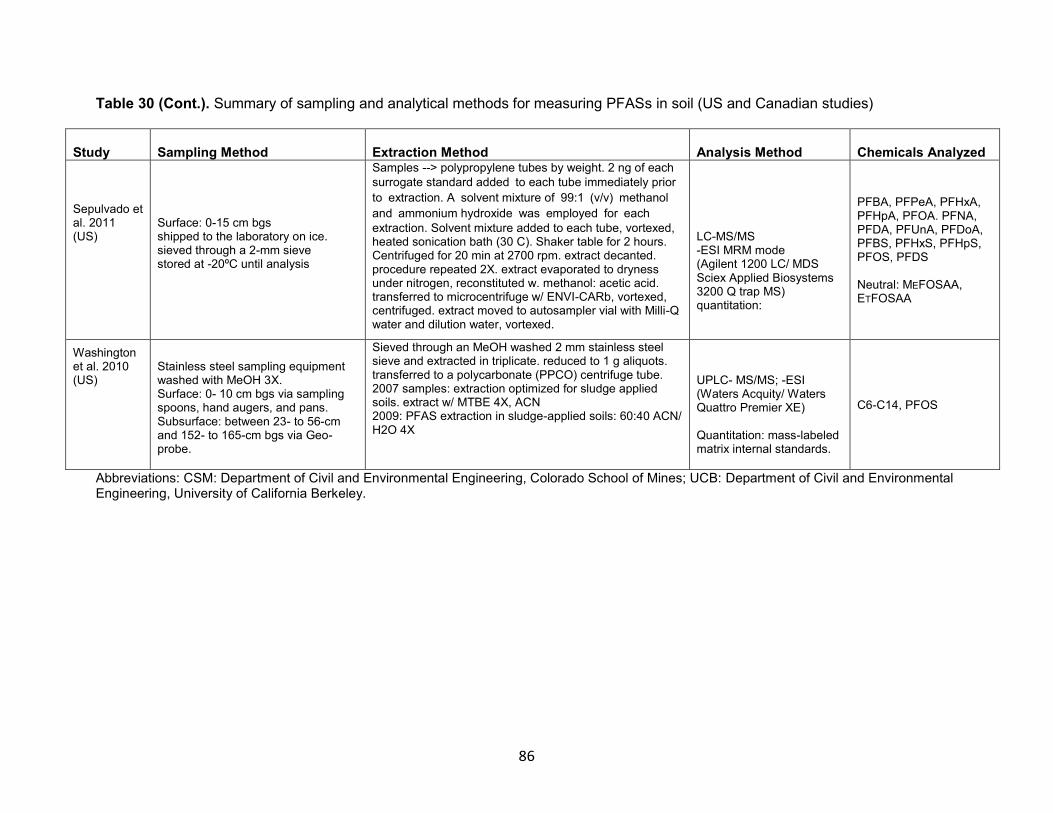
86
Table 30 (Cont.). Summary of sampling and analytical methods for measuring PFASs in soil (US and Canadian studies)
Study Sampling Method
Extraction Method Analysis Method Chemicals Analyzed Sepulvado et al. 2011 (US)
Surface: 0-15 cm bgs shipped to the laboratory on ice. sieved through a 2-mm sieve stored at -20ºC until analysis
Samples --> polypropylene tubes by weight. 2 ng of each
surrogate standard addedto each tube immediately prior
toextraction. Asolvent mixture of99:1(v/v)methanol
andammonium hydroxidewasemployedforeachextraction. Solvent mixture added to each tube, vortexed, heated sonication bath (30 C). Shaker table for 2 hours. Centrifuged for 20 min at 2700 rpm. extract decanted. procedure repeated 2X. extract evaporated to dryness under nitrogen, reconstituted w. methanol: acetic acid. transferred to microcentrifuge w/ ENVI-CARb, vortexed, centrifuged. extract moved to autosampler vial with Milli-Q water and dilution water, vortexed.
LC-MS/MS -ESI MRM mode (Agilent 1200 LC/ MDS Sciex Applied Biosystems 3200 Q trap MS) quantitation:
PFBA, PFPeA, PFHxA, PFHpA, PFOA. PFNA, PFDA, PFUnA, PFDoA, PFBS, PFHxS, PFHpS, PFOS, PFDS Neutral: MEFOSAA, ETFOSAA
Washington et al. 2010 (US)
Stainless steel sampling equipment washed with MeOH 3X. Surface: 0- 10 cm bgs via sampling spoons, hand augers, and pans. Subsurface: between 23- to 56-cm and 152- to 165-cm bgs via Geo-probe.
Sieved through an MeOH washed 2 mm stainless steel sieve and extracted in triplicate. reduced to 1 g aliquots. transferred to a polycarbonate (PPCO) centrifuge tube. 2007 samples: extraction optimized for sludge applied soils. extract w/ MTBE 4X, ACN 2009: PFAS extraction in sludge-applied soils: 60:40 ACN/ H2O 4X
UPLC- MS/MS; -ESI (Waters Acquity/ Waters Quattro Premier XE) Quantitation: mass-labeled matrix internal standards.
C6-C14, PFOS
Abbreviations: CSM: Department of Civil and Environmental Engineering, Colorado School of Mines; UCB: Department of Civil and Environmental Engineering, University of California Berkeley.
87
8 Summary and Recommendations
In this section we provide recommendations for sampling and analytical laboratory methods for collecting and measuring PFASs in air, dust and soil. The recommendations presented below compare the strengths and weaknesses of the methods reviewed and evaluated including their adaptability for measurement of volatile, semi-volatile and ionic PFASs.
Important considerations for sampling and analysis of perfluoro- and polyfluoroalkyl substances includes ensuring that all sampling equipment, laboratory materials, and other supplies are PFAS-free. In this regard, rigorous quality control measures are required including collection and analysis of multiple field and laboratory blanks.
8.1 Measuring PFASs in Air
8.1.1 Air Sample collection methods
PFASs in outdoor air have been measured using both active (with actual flow) and passive (gas diffusion) sampling techniques. The majority of techniques have made use of solid sorbents such as PUF, XAD-2, and sorbent-impregnated PUF (SIP). (Finely ground XAD-4 resin is often the sorbent of choice for impregnating the PUF). Active samplers also often include use of a particulate filter (glass or quartz fiber) in front of the sorbent module.
Passive air samplers are frequently used to measure PFASs in outdoor and indoor air. Currently, there are multiple passive air samplers in use that employ different sampling media, each with differing levels of effectiveness: PUF-PAS use a polyurethane foam disk; SIP-PAS use a sorbent-impregnated polyurethane foam disk; XAD-PAS employs steel cartridges filled with XAD resin; and PE-PAS involve the use of polyethylene sheets. PAS are often co-deployed with AAS in order to compare their ability to measure a wide range of PFASs.
Recommendations for use of active and passive sampling techniques for measuring ionic PFASs and PFAS precursors in outdoor and indoor air are summarized below.
8.1.1.1 HV-AAS and LV-AAS
HV-AAS are recommended for measuring atmospheric concentrations of PFASs because of their ability to provide information on the gas and particle-phase distribution of analytes, use of calibrated air flows resulting in known air volumes, more accurate analyte concentrations and collection of relatively large volumes of air, resulting in lower detection limits (Ahrens et al. 2013). Due to sample pump noise and power requirements, however, HV-AAS are relatively immobile and have limited ability to provide the spatial coverage needed to examine the geographic distribution of PFASs in outdoor air. Pump noise and size of the sampling devices renders HV-AAS sampling methods less practical for sampling indoors (Ahrens et al. 2013). Furthermore, single location assessments do not accurately reflect actual human personal exposure patterns.
LV-AAS have smaller pumps and thus less noise than HV-AAS, can be battery powered, and therefore more amenable to sampling indoors. HV-AAS are most often used for sampling in ambient or outdoor air as larger air volumes result in lower detection limits needed to accommodate PFAS levels found in outdoor settings. LV-AAS may also detect a smaller range of PFASs in outdoor air when levels are low (Ahrens et al. 2013).
88
HV-AAS and LV-AAS use QFFs and GFFs to sample particle-phase concentrations along with PUF/XAD-2 cartridges to sample gas-phase concentrations. Due to its high sorption capacity, XAD-2 can sorb a wide variety of semi-volatile compounds effectively. Thus, AAS can provide information on the gas and particle phase-distribution of analytes. However, at low outdoor air concentrations, gas-phase compounds can irreversibly sorb to QFFs and GFFs, preventing gas-phase compounds from passing through these filters to downstream sorbents. As a result, it becomes difficult to distinguish particle-associated compounds at trace concentrations (Kim and Park 2014). This limits their usefulness when measuring polar target compounds when time-weighted sampling is desired (Shoeib et al. 2008).
8.1.1.2 Passive air samplers
PAS, unlike AAS, rely on the diffusion of gases rather than an active air flow to calculate sample volumes. However, diffusion rates in a passive air sampler are influenced by atmospheric temperature and pressure at the sampling location. In addition, the fraction of a compound that is in the gas- or particle-phase is a function of the ambient temperature and can affect sampling methods and detection frequency of specific samplers (Karásková et al. 2018; Wania et al. 2003).
SIP-PAS impregnated with XAD-4 powder has a high sorption capacity for neutral and polar organic compounds and lengthens PAS deployment times by expanding the linear uptake range. With regards to PUF-PAS, the greatly increased sorption capacity of the SIP disk, compared to the PUF disk, makes SIP-PAS more useful for volatile compounds when time-integrated sampling is desired (Shoeib et al. 2008). To validate this approach, Kim and Park (2014) compared SIP-PAS with PUF-PAS for measuring volatile PFASs, and reported that impregnation of XAD-4 powder into PUF (i.e., SIP) can remarkably improve the sorption capacity of a conventional PUF, which lengthens PAS deployment duration and then enlarges the effective air sampling volume and detection frequency of chemicals at trace levels. Consequently, volatile chemicals such as FTOHs can be collected for sufficiently long time periods without equilibrium (i.e., saturation of the sampling media) being reached when SIP is used (Kim and Park 2014).
Another type of PAS, XAD-PAS (steel cartridges filled with 10 g of XAD-2 resin), is considered more appropriate for polar compounds than PUF-PAS, but it has a limited ability to collect particle-phase compounds, and thus may not be ideal for ionic PFASs like PFOA.
The SIP-PAS (with XAD-4 powder impregnated into the PUF) have many advantages for use
to measure PFASs in air. It requires no power supply, is simple to deploy, silent, and low cost. SIP-PAS generates time-integrated data and is useful for spatial and long-term temporal trend studies, and can be deployed for sampling indoors and outdoors. Importantly, SIP-PAS has demonstrated good agreement with the air concentrations determined by HV-AAS for all PFASs (Arhens et al. 2013). Given its efficacy, ease of deployment and lower cost, SIP-PAS has many notable advantages over active air samplers.
Overall, SIP-PAS performs better than XAD-PAS or PUF-PAS as a sampling medium for many PFASs because PFASs sampled with SIP-PAS have higher detection frequencies of more compounds compared to XAD- and PUF-PAS. In summary, the literature suggests that SIP-PAS measurement systems are the preferred choice for passive air sampling of PFASs outdoors and indoors because of their high sorption capacity and reported measurements that are consistent with HV-AAS systems.

89
8.1.1.3 Annular Denuder Samplers
Annular denuder samplers have been used to improve speciation between gas-phase and particle phase PFASs (Ahrens et al. 2011, Ahrens et al. 2012). These methods reduce the potential for “blow-on artifact” (i.e., positive sampling artifact) in which vapor phase PFSAs and PFCAs adsorb onto the GFF or QFF before reaching the sorbent in a traditional sampling design, resulting in an overestimation of the particle-phase concentration. The work by Ahrens et al. 2011 and 2012 demonstrate that diffusion denuder samplers can be a more accurate method (compared to conventional high volume air samplers) for measuring the gas−particle partitioning of PFSAs and PFCAs.
Air studies using annular diffusion denuder sampling methods can improve understanding of the gas-particle partitioning of PFASs, which is important for assessing atmospheric behavior and reaction chemistry, as well as, modeling their long-range fate and transport. Robust sets of gas−particle partitioning data for polar/ionizable PFASs are needed to evaluate atmospheric long-range transport, deposition, and the overall fate of PFASs in the environment.
8.1.1.4 Quality Control
Sampling artifacts have been reported for PFSAs and PFCAs using conventional HV-AAS as well as passive samplers. Field sampling programs must include collection of field blanks as a means of assessing PFAS artifacts present in sampling media and potentially introduced during sample handling in the field and in the lab. Other field quality control measures that should be followed include collection of duplicate or co-located samples and the use of isotopically labeled PFASs when the analytical detector is mass spectrometry (ITRC 2020).
8.1.2 Air Sample Analysis
There are currently no standard, validated methods (US EPA Standard Reference Methods or TO Methods) for analyzing outdoor or indoor air for PFASs. Methods for PFAS analysis include either gas chromatography or liquid chromatography coupled with mass spectrometry (GC-MS or LC-MS, respectively) using either negative or positive chemical ionization (CI) or electron impact (EI) detection. The extraction and analytical methods performed to measure PFASs in air differ between neutral/volatile and ionic compounds. No single sample preparation and instrumental analyses will accommodate all PFAS analytes. Multiple analyses are needed, dictated by the chemistry of the PFASs of interest.
8.1.2.1 Neutral/Volatile PFASs
To analyze volatile PFASs in outdoor air samples, the majority of studies reviewed utilized GC-MS with positive chemical ionization in the selective ion monitoring (PCI-SIM) mode for quantification (Ahrens et al. 2013; Barber et al. 2007; Dixon-Anderson and Lohmann 2018; Jahnke et al. 2007b.). For quantitative confirmation of FOSAs/ FOSEs, two studies also used negative chemical ionization in the selective ion monitoring mode (NCI-SIM) (Barber et al. 2007; Jahnke et al. 2007a.). In contrast to the many studies which use GC-MS to analyze volatile PFASs, Riedel et al. (2019) opted to use time of flight- chemical ionization mass spectrometry (ToF-CIMS), operating in a negative ion mode with iodide reagent ion chemistry (Riedel et al. 2019). Barton also deviated from the standard GC-MS technique by using LC-MS, with the HP 1100 series electrospray mass spectrometer (Barton et al. 2006).
90
Methods of analyzing volatile PFASs in indoor air were similar to those used for outdoor air samples, with studies predominantly utilizing GC-MS in the PCI-SIM quantification mode to analyze volatile PFASs from indoor air samples (Fraser et al. 2012; Jahnke et al. 2007a.; Schlummer et al. 2013; M. Shoeib et al. 2011). PFAS concentrations tend to be higher indoors compared to those measured in outdoor air. As a result, concentrations in indoor air are typically reported in units of ng/m3 rather than pg/m3.
8.1.2.2 Ionic PFASs
Fewer studies have measured ionic PFASs in outdoor air compared to volatile compounds. To analyze ionic PFASs, the standard methods involve coupling liquid chromatography with mass spectrometry (LC-MS). Several researchers have also utilized liquid chromatography- time-of-flight-mass spectrometry (LC-ToF-MS) using a Micromass ToF-MS (LCT) (Barber et al. 2007) and LC-MS/MS using an Agilent 1100 chromatograph coupled with a triple quadrupole mass spectrometer (Ahrens et al. 2013). Jahnke 2007 used a form of LC-MS, high-performance liquid chromatography HPLC–MS that is distinctively different from the standard method because it uses applied pressure to pass the mobile phase through the column. This HPLC-MS method was conducted with an Agilent 1100 Chromatograph/ Micromass ToF-MS or an Agilent 1290 Infinity II UPLC/ Agilent 6470 QQQ-MS (Jahnke et al. 2007a.; Zheng et al. 2020). All studies analyzing ionic PFASs used electrospray ionization in the negative ion mode (ESI-) for quantification. Researchers have also employed HPLC-MS/MS to measure ionic PFASs in indoor air.
In summary, ionic PFASs have been successfully measured in air using liquid chromatography-mass spectrometry (LC-MS), high performance liquid chromatography-mass spectrometry (HPLC-MS), and liquid chromatography time-of-flight mass spectrometry (LC-ToF-MS).
8.1.2.3 Quality Control
As noted above, field sampling programs must include collection of field blanks as a means to assess PFAS artifacts present in sampling media and potentially introduced during sample handling in the field and lab. As important, adherence to strict standard operating procedures must be followed to prevent PFAS sample contamination in the laboratory, including pre-testing laboratory equipment for contamination and the regular use of laboratory blanks to test all phases of sample handling, extraction, and analysis.
Extensive in laboratory QA/AC sample analysis should be performed, including: 1) method blanks (once per sample extraction batch); 2) solvent/double blanks (at the beginning and end of every sample analysis batch as well as every 10 samples); and 3) spiked QC samples (minimum once per analysis batch). At least one method blank should be extracted with each air sample batch.
8.2 Measuring PFASs in Dust
8.2.1 Dust sample collection
Best practices for dust collection involve vacuuming dust using a cellulose extraction thimble. After collection, the thimble should be wrapped in aluminum foil and placed in a polyurethane zip-lock bag and stored at room temperature. Dust should be sieved to <150 μm
91
and placed in a clean amber glass jar and stored at -20 oC (Strynar & Lindstrom 2008; Fraser et al. 2013).
Throughout dust collection and extraction, it is critical to ensure that all lab materials and supplies are PFAS-free to avoid contamination of dust samples during collection and analysis. Additionally, solvent volume reductions employing vacuum techniques (e.g., rotary evaporators) must be used with caution to avoid reducing the sample down to complete dryness, as this may decrease recoveries for selected analytes (Strynar and Lindstrom 2008; Washington et al. 2020).
8.2.2 Dust Sample Extraction and Analysis
Important considerations for sample analysis include ensuring all analytical equipment, lab materials, and supplies are PFAS-free. Similar methods were used to analyze ionic PFASs in air and dust across the 11 studies reviewed. Ultra- or high-performance liquid chromatography mass spectrometry (UPLC/MS or HPLC/MS) is typically used with MS or tandem MS (MS/MS) operating in the negative ESI mode (Byrne et al. 2017; Fraser et al. 2013; Goosey and Harrad 2011; Makey et al. 2017; Shoeib et al. 2016) (Table 26). One study opted to use LC/MS/MS to analyze ionic PFASs (Strynar and Lindstrom 2008).
To analyze neutral PFASs and PFAA precursors, including FTOH and FOSA/E, gas chromatography coupled with mass spectrometry operating in the positive chemical ionization mode (GC-(PCI)MS) was typically used (Shoeib et al. 2016; Winkens et al. 2018; Wu et al. 2020; Zheng et al. 2020). Strynar and Lindstrom (2008) operated in the electron impact (EI) mode, while Fraser et al. (2013) opted to use HPLC/ time of flight mass spectrometry (ToFMS) (Fraser et al. 2013; Strynar and Lindstrom 2008).
8.2.3 Quality Control
As with air, field sampling programs must include collection of field blanks (unused thimbles and washed silica gel (Supelco, part # 21342U) used as a surrogate for dust) as a means to assess PFAS artifacts present in sampling media and potentially introduced during sample handling in the field. As important, adherence to strict standard operating procedures must be followed to prevent PFAS sample contamination in the laboratory, including pre-testing laboratory equipment for contamination and the regular use of laboratory blanks to test all phases of sample handling, extraction, and analysis.
Extensive QA/AC sample analysis should be performed, including: 1) method blanks (once per sample extraction batch); 2) solvent/double blanks (at the beginning and end of every sample analysis batch as well as every 10 samples); and 3) spiked QC samples (minimum once per analysis batch). At least one method blank and one standard reference material sample (NIST SRM) should be extracted with each dust sample batch.
8.3 Measuring PFASs in soil
8.3.1 Surface Soil Sample Collection
Best practices for soil sample collection involve collecting composite soil samples with a stainless steel pre-cleaned trowel from multiple locations within a 1 m2 area at 1-15 cm depth. After collection, 200-500 g of fresh soil should be placed in a polyethylene zip-top bag. Soil
92
samples should be sieved at original moisture content through a cleaned brass or stainless steel #10 mesh sieve (2mm) by mechanical shaking. Material not passing through the sieve can be discarded. Samples that are too moist for sieving can be allowed to air dry until sieving is possible. Between samples, the sieving apparatus should be washed with a bristle brush and mild detergent to remove all soil particles, rinsed thoroughly with tap water, rinsed with deionized water (2x), and then methanol (1x) before drying prior to further use (Strynar et al. 2012; Washington et al. 2020). Samples should be stored at 4 °C.
Throughout soil collection and extraction, it is critical to ensure that all lab materials and supplies are PFAS-free in order to avoid contamination of soil samples.
It should be noted that soil sampling programs have been conducted by a number of state agencies in the US. These agencies may have adopted methods for the sampling and analyses of PFASs in soils. Some agencies have also established regulatory guidelines for acceptable concentrations of selected PFASs in soils.
8.3.2 Soil Sample Analysis
Soil samples should be analyzed at moisture content after sieving and storage. To normalize data, sub-samples (2–3 g) should be weighed, placed in a drying oven for 24 h (105 °C), and then reweighed to calculate the original moisture content (Strynar et al. 2012). Analytical methods for measuring PFAS in soil vary depending on the volatility of the PFAS target analytes. In addition, long chain PFAS strongly absorb to soil whereas short chain compounds are more mobile.
Following extraction, soil samples are typically analyzed for ionic PFASs using ultra performance liquid chromatography (UPLC) coupled to tandem mass spectrometry (MS/MS) (-ESI) or LC-MS/MS (Sepulvado et al. 2011; Washington et al. 2010; Washington et al. 2020) (Styrnar et al. 2012). MS/MS is especially useful when multiple target analytes have similar mass-to-charge ratios (m/z) and cannot be fully resolved by chromatography. In this case, a specific m/z can be “extracted” and fragmented a second time where the specific m/z from different chemicals may not have the same pattern during the second MS (and third and so on) (R. Maddalena, personal communication, January 19, 2021). Recent studies have utilized UPLC coupled to a quadrupole time-of-flight (QToF) mass spectrometer operating in the negative electrospray ionization (ESI), MSe (no mass filtering) mode (Washington et al. 2020) and high performance liquid chromatography (HPLC) coupled to a triple stage quadrupole (TSQ) mass spectrometer. The TSQ uses the first and third quadrupoles as mass filters; while the second quadrupole acts to cause analyte fragments to collide with gas for more definitive mass analyses (Xiao et al. 2015). Two studies successfully measured both PFAS precursors (Me-/EtFOSAA and chloroperfluoropolyether carboxylates) and ionic PFASs (Sepulvado et al. 2011; Washington et al. 2020).
Soil samples were typically analyzed at the original moisture content after sieving, but this moisture content may differ between samples and over time. To normalize the data, it is typical to dry sub-samples in the oven and reweigh them to calculate original moisture content (Strynar et al. 2012).
Alternative forms of mass spectrometry that are used less frequently, but have also shown to be valuable include quadrupole time of flight (QToF) mass spectrometry, which combines ToF and quadrupole instruments to allow for high mass accuracy and accurate quantitation capabilities, as well as TSQ mass spectrometry (Xiao et al. 2015) (Washington et al. 2020).

93
8.3.3 Quality Control
As with air and dust, field soil sampling programs should adhere to strict standard operating procedures. A field soil blank can be collected using washed silica gel (Supelco, part # 21342U) and serve as a surrogate soil to test sampling methods (i.e., place silica gel in a clean container and then execute soil sample collection and handling using all study collection equipment and procedures) as a means to assess PFAS artifacts present in sampling media and potentially introduced during sample handling in the field. As important, adherence to strict standard operating procedures must be followed to prevent PFAS sample contamination in the laboratory, including pre-testing laboratory equipment for contamination and the regular use of laboratory blanks to test all phases of sample handling, extraction, and analysis.
Extensive QA/AC sample analysis should be performed, including: 1) method blanks (once per sample extraction batch); 2) solvent/double blanks (at the beginning and end of every sample analysis batch as well as every 10 samples); and 3) spiked QC samples (minimum once per analysis batch). At least one method blank sample should be extracted with each soil sample batch.
8.4 General Recommendations
It is important to recognize that no single method is suitable for the sampling and analyses of all PFASs in either air, soil or indoor dust. The target compound list of PFASs must be identified in the design of each sampling program such that the most appropriate method or suite of methods can be identified. This is especially true for sample collection in outdoor air and indoor environments. The selection of methods must also take into consideration the end use of the data itself.
8.4.1 Basic Research Needs for Collecting and Analyzing PFASs in Air Samples
In general, given the number of PFAS analytes and the complexity of PFAS chemistry, we need more research on methods to collect and analyze these materials. Key basic research needs include the following: Air sampling:
To date, a small proportion of the total universe of PFASs have been monitored in air (or other media). Ongoing validation of sorbent materials for active and passive systems for a larger number of PFASs is needed, particularly for high-use materials.
Development and validation of lower-cost and smaller devices for passive sampling is needed to increase deployment opportunities in residential, school, occupational, and outdoor environments.
As noted above, robust data sets of gas−particle partitioning for polar/ionizable PFASs are needed to evaluate the potential for atmospheric long-range transport, deposition, and overall fate of PFASs in the environment.
Commercially available sources of sorbent media are needed that have been certified to be PFAS contaminant free or certified to contain known minimum concentrations of selected PFAS.
94
Laboratory analysis methods:
Evaluation of thermal desorption-GC/MS (TD-GC/MS) approaches for sampling and analysis of volatile PFASs is needed. Validation of TD-GC/MS methods could potentially reduce sampling and analytic costs for those compounds that can be sampled and analyzed by these methods.
Laboratory protocols that standardize and automate extraction and analytical steps are needed to increase throughput for chemical analyses and reduce laboratory costs.
Given the extremely low levels of PFASs in environmental media that raise regulatory concerns, research is needed to enhance instrument sensitivity and thereby reduce sample volumes (and cost) needed to characterize air levels.
Continued development and application of methods to identify and quantify non-targeted analytes is needed (see below).
8.5 Future Directions/General Recommendations
1. To date, there has been limited monitoring of PFASs in indoor and outdoor air in California. Monitoring of indoor and outdoor air should be completed to characterize PFAS levels in both occupational and non-occupational environments, including homes, schools, businesses, manufacturing facilities, and other settings. This information should be used to inform #2 and #3, below.
2. The relative importance of inhalation, dermal absorption, and ingestion to total PFAS exposures should be assessed across age groups. For example, young children may be exposed through diet, drinking water, non-dietary ingestion of dust or soil, inhalation, and dermal absorption from contact with contaminated surfaces or transfer of volatile PFASs from air directly to skin. Exposures to workers in occupational settings may be dominated by inhalation and dermal contact.
3. To date, small studies suggests that PFASs in air may be correlated with PFASs in blood in young children. Research evaluating correlations between air PFAS levels, indoor contamination, and PFAS exposure biomarkers is needed to improve exposure and risk assessments for this vulnerable population and to inform exposure-reduction strategies.
4. Passive air samplers are the best approach for initial or “screening” surveys of PFASs in both indoor environments and outdoors. “Hot spots” can be readily identified warranting further study. Passive samplers can be deployed with less support than is needed for active samplers (e.g., batteries or electricity) and with less preparation and mobilization time. Less expertise (no in-field calibration) is required in the field to deploy passive devices as well. Passive samplers can be deployed for long periods of time without servicing or maintenance unlike active pump sampling systems. The ideal air monitoring program should include both passive and active sampling data. Active samplers can also be collocated with passive samplers at a reduced frequency to provide data for calibration of the passive sampling devices. In this manner, air flows and volumes for passive samples do not rely exclusively on diffusion rate estimates for PFASs from prior sampling events or those published in the open literature.
5. Relative to the total PFAS universe encompassing thousands of volatile and ionic compounds, very few substances have been targeted for laboratory analysis of air
95
samples. Additional studies are needed to scan samples for unknown PFASs in all media and identify significant contaminants that have not been previously targeted. Once validated, follow-up studies should then test for previously unknown PFASs and inform human exposure and health risk assessments.
6. Sampling and analyses of PFASs in all types of environmental media is a rapidly evolving area. This will continue for years to come as additional PFAS analytes are identified for consideration by regulatory agencies worldwide. CARB and other California agencies should track future publication of PFAS guidance documents and adopt best-practices for field sampling and laboratory methods as they become validated and standardized. These documents will be issued on an on-going basis by US EPA, the National Institute of Standards and Technology (NIST) (https://www.nist.gov/programs-projects/measurement-science-and-polyfluoroalkyl-substances-pfas), and many other state regulatory agencies.
7. We recommend new studies monitoring PFASs and PFAS precursors in rainwater. Because of the relatively high water solubility of many PFASs, monitoring their presence in rainwater and other media, such as snow and lake water, provides a novel indicator of emissions and deposition in the environment. Recent studies show high detection frequencies of PFASs measured in rainwater near manufacturing/production facilities and industrial users of PFASs in the Eastern US, highlighting the potential for medium and long-range transport and the value of measuring PFASs in this environmental media. The presence of PFASs in rainwater at sample collection sites also serves as an indicator of potential contamination that can pass through surficial soils to underlying groundwater.
8. Given the potential for long-range transport of PFASs, outdoor air monitoring should be conducted in both urban, rural, and undeveloped areas, including national and state parks and forested lands, to determine whether PFAS emissions from developed areas are contributing to contamination in California wilderness lands and watersheds that provide drinking water, and impacting wildlife.

96
References
ACE-1. 2016. Project Results for Asian/Pacific Islander Community Exposures (ACE) Project - ACE 1. Biomonitoring California. Accessed October 2020. https://biomonitoring.ca.gov/results/projects/2751
ACE-2. 2017. Project Results for Asian/Pacific Islander Community Exposures (ACE) Project - ACE 2. Biomonitoring California. Accessed October 2020. https://biomonitoring.ca.gov/results/projects/2750
Ahrens L, Shoeib M, Harner T, Lane DA, Guo R, Reiner EJ. 2011. Comparison of Annular Diffusion Denuder and High Volume Air Samplers for Measuring Per- and Polyfluoroalkyl Substances in the Atmosphere. Anal Chem 83:9622-9628.
Ahrens L, Harner T, Shoeib M, Lane DA, Murphy JG. 2012. Improved Characterization of Gas―Particle Partitioning for Per- and Polyfluoroalkyl Substances in the Atmosphere Using Annular Diffusion Denuder Samplers. Environmental Science & Technology 46:7199-7206.
Ahrens L, Harrier T, Shoeib M, Koblizkova M, Reiner EJ. 2013. Characterization of Two Passive Air Samplers for Per- and Polyfluoroalkyl Substances. Environmental Science & Technology 47:14024-14033.
Andersen CS, Chunyuan FEI, Gamborg M, Aagaard Nohr E, SØRensen TIA, Olsen J. 2010. Prenatal Exposures to Perfluorinated Chemicals and Anthropometric Measures in Infancy. American Journal of Epidemiology 172:1230-1237.
Andersen CS, Chunyuan FEI, Gamborg M, Nohr EA, SØRensen TIA, Olsen J. 2013. Prenatal Exposures to Perfluorinated Chemicals and Anthropometry at 7 Years of Age. American Journal of Epidemiology 178:921-927.
Anderson RH, Long GC, Porter RC, Anderson JK. 2016. Occurrence of select perfluoroalkyl substances at U.S. Air Force aqueous film-forming foam release sites other than fire-training areas: Field-validation of critical fate and transport properties. Chemosphere 150:678-685.
Armitage J, Cousins IT, Buck RC, Prevedouros K, Russell MH, MacLeod M, et al. 2006. Modeling Global-Scale Fate and Transport of Perfluorooctanoate Emitted from Direct Sources. Environmental Science & Technology 40:6969-6975.
ATSDR. 2018. Toxicological Profile for Perfluoroalkyls (Draft for Public Comment). Agency for Toxic Substances and Disease Registry. Atlanta, GA. https://www.atsdr.cdc.gov/toxprofiles/tp.asp?id=1117&tid=237
Attfield KS, Farmmary; VillaRomero, Juan; Wu, Nerissa. 2018. Serum Per- and Polyfluoroalkyl Substances Levels and Their Predictors in a San Francisco Bay Area Chinese

97
Community. Accessed https://ehp.niehs.nih.gov/doi/abs/10.1289/isesisee.2018.O01.02.36
Ballesteros V, Costa O, Iniguez C, Fletcher T, Ballester F, Lopez-Espinosa MJ. 2017. Exposure to perfluoroalkyl substances and thyroid function in pregnant women and children: A systematic review of epidemiologic studies. Environ Int 99:15-28.
Barber JL, Berger U, Chaemfa C, Huber S, Jahnke A, Temme C, et al. 2007. Analysis of per- and polyfluorinated alkyl substances in air samples from Northwest Europe. J Environ Monit 9:530-541.
Barry V, Winquist A, Steenland K. 2013. Perfluorooctanoic Acid (PFOA) Exposures and Incident Cancers among Adults Living Near a Chemical Plant. Environmental Health Perspectives 121:1313-1318.
Bartell SM, Calafat AM, Lyu C, Kato K, Ryan PB, Steenland K. 2010. Rate of decline in serum PFOA concentrations after granular activated carbon filtration at two public water systems in Ohio and West Virginia. Environ Health Perspect 118:222-228.
Barton CA, Butler LE, Zarzecki CJ, Flaherty J, Kaiser M. 2006. Characterizing perfluorooctanoate in ambient air near the fence line of a manufacturing facility : Comparing modeled and monitored values. Journal of the Air & Waste Management Association (1995) 56:48-55.
Barton CA, Kaiser MA, Russell MH. 2007. Partitioning and removal of perfluorooctanoate during rain events: the importance of physical-chemical properties. Journal of Environmental Monitoring 9:839.
BEST-Expanded. 2013. Project Results for Biomonitoring Exposures Study (BEST) - 2.Expanded. Biomonitoring California. Accessed 2020. https://biomonitoring.ca.gov/results/projects/494
BEST-Pilot. 2012. Project Results for Biomonitoring Exposures Study (BEST) - 1.Pilot. Accessed https://biomonitoring.ca.gov/results/projects/408
Bonefeld-Jørgensen EC, Long M, Fredslund SO, Bossi R, Olsen J. 2014. Breast cancer risk after exposure to perfluorinated compounds in Danish women: a case–control study nested in the Danish National Birth Cohort. Cancer Causes & Control: An International Journal of Studies of Cancer in Human Populations 25:1439.
Borghese MM, Walker M, Helewa ME, Fraser WD, Arbuckle TE. 2020. Association of perfluoroalkyl substances with gestational hypertension and preeclampsia in the MIREC study. Environment International 141.
Boulanger B, Peck AM, Schnoor JL, Hornbuckle KC. 2005. Mass Budget of Perfluorooctane Surfactants in Lake Ontario. Environmental Science & Technology 39:74-79.
98
Braun JM, Chen A, Romano ME, Calafat AM, Webster GM, Yolton K, et al. 2016. Prenatal perfluoroalkyl substance exposure and child adiposity at 8 years of age: The HOME study. Obesity (Silver Spring) 24:231-237.
Braun JM. 2017. Early-life exposure to EDCs: role in childhood obesity and neurodevelopment. Nat Rev Endocrinol 13:161-173.
Braun JM, Eliot M, Papandonatos GD, Buckley JP, Cecil KM, Kalkwarf HJ, et al. 2021. Gestational perfluoroalkyl substance exposure and body mass index trajectories over the first 12 years of life. International Journal of Obesity 45:25.
Buck RC, Franklin J, Berger U, Conder JM, Cousins IT, de Voogt P, et al. 2011. Perfluoroalkyl and polyfluoroalkyl substances in the environment: terminology, classification, and origins. Integr Environ Assess Manag 7:513-541.
Byrne S, Seguinot-Medina S, Miller P, Waghiyi V, von Hippel FA, Buck CL, et al. 2017. Exposure to polybrominated diphenyl ethers and perfluoroalkyl substances in a remote population of Alaska Natives. Environ Pollut 231:387-395.
C8 Science Panel. 2012. C8 Probable Link Reports. http://www.c8sciencepanel.org/prob_link.html
CA Senate. 2020. SB-1044 Firefighting equipment and foam: PFAS chemicals. https://leginfo.legislature.ca.gov/faces/billTextClient.xhtml?bill_id=201920200SB1044
Cal EPA. 2018. PFAS Chemicals in California: The Current Need for Characterization. California Environmental Protection Agency. https://oehha.ca.gov/media/downloads/crnr/4henderson.pdf
Canova C, Barbieri G, Zare Jeddi M, Gion M, Fabricio A, Daprà F, et al. 2020. Associations between perfluoroalkyl substances and lipid profile in a highly exposed young adult population in the Veneto Region. Environment International 145.
CARB. 2006. Proposed Amendments to the Hexavalent Chromium Airborne Toxic Control Measure for Chrome Plating And Chromic Acid Anodizing Operations. ww3.arb.ca.gov/regact/chrom06/cpisor.pdf
CARB. 2016. Chemical Fume Suppressants for use in Chrome Plating Facility Operations. California Air Resources Board. https://ww2.arb.ca.gov/resources/documents/chrome-plating-approved-fume-suppressant-list
CARB. 2021a. "Hot Spots" Inventory Guidelines. California Air Resources Board. https://ww2.arb.ca.gov/our-work/programs/ab-2588-air-toxics-hot-spots/hot-spots-inventory-guidelines
99
CARB. 2021b. Criteria Pollutant and Toxics Emissions Reporting. California Air Resources Board. https://ww2.arb.ca.gov/our-work/programs/criteria-and-toxics-reporting
CARB. 2021c. Amendments to the EICG Report for the Air Toxics “Hot Spots” Program. California Air Resources Board. https://ww2.arb.ca.gov/rulemaking/2020/hotspots2020
CARE-2. 2019. Project Results for California Regional Exposure Study, Region 2 (CARE-2). Biomonitoring California. https://biomonitoring.ca.gov/results/projects/3088
CARE-LA. 2018. Project Results for California Regional Exposure Study, Los Angeles County (CARE-LA). Biomonitoring California. https://biomonitoring.ca.gov/results/projects/2876
CDC. 2019. Fourth National Report on Human Exposure to Environmental Chemicals. Centers for Disease Control and Prevention. https://www.cdc.gov/exposurereport/pdf/FourthReport_UpdatedTables_Volume1_Jan2019-508.pdf
Christensen KYM, M. Rubin, C. Holmes, A. Calafat, A.M. Kato, K. Flanders, W.D. Heron, J. McGeehin, M.A., Marcus M. 2011. Exposure to polyfluoroalkyl chemicals during pregnancy is not associated with offspring age at menarche in a contemporary British cohort. Environ Int 37:129–135.
Clean Water Action. 2020. PFAS-Containing Firefighting Foams Accessed July 7, 2020
https://www.cleanwateraction.org/features/pfas-containing-firefighting-foams
CTS. 2015. Project Results for California Teachers Study (CTS). Biomonitoring California. Accessed October 2020. https://biomonitoring.ca.gov/results/projects/411
Darrow LA, Stein CR, Steenland K. 2013. Serum Perfluorooctanoic Acid and Perfluorooctane Sulfonate Concentrations in Relation to Birth Outcomes in the Mid-Ohio Valley, 2005-2010. Environmental Health Perspectives 121:1207-1213.
Darrow LA, Groth AC, Winquist A, Shin H-M, Bartell SM, Steenland K. 2016. Modeled Perfluorooctanoic Acid (PFOA) Exposure and Liver Function in a Mid-Ohio Valley Community.
Dimzon IK, Westerveld J, Gremmel C, Frömel T, Knepper TP, de Voogt P. 2017. Sampling and simultaneous determination of volatile per- and polyfluoroalkyl substances in wastewater treatment plant air and water. Analytical and Bioanalytical Chemistry 409:1395.
Dinglasan-Panlilio MJA, Mabury SA. 2006. Significant Residual Fluorinated Alcohols Present in Various Fluorinated Materials. Environmental Science & Technology 40:1447-1453.
Dinglasan MJA, Ye Y, Edwards EA, Mabury SA. 2004. Fluorotelomer Alcohol Biodegradation Yields Poly- and Perfluorinated Acids. Environmental Science & Technology 38:2857-2864.
100
Dixon-Anderson E, Lohmann R. 2018. Field-testing polyethylene passive samplers for the detection of neutral polyfluorinated alkyl substances in air and water. Environ Toxicol Chem 37:3002-3010.
Domingo JL, Nadal M. 2019. Human exposure to per- and polyfluoroalkyl substances (PFAS) through drinking water: A review of the recent scientific literature. Environ Res 177:108648.
Dong G-H, Tung K-Y, Tsai C-H, Liu M-M, Wang D, Liu W, et al. 2013. Serum Polyfluoroalkyl Concentrations, Asthma Outcomes, and Immunological Markers in a Case-Control Study of Taiwanese Children. Environmental Health Perspectives 121:507-513.
Dreyer A, Weinberg I, Temme C, Ebinghaus R. 2009. Polyfluorinated Compounds in the Atmosphere of the Atlantic and Southern Oceans: Evidence for a Global Distribution. Environmental Science & Technology 43:6507-6514.
DTSC. 2019. Chemical Profile for Carpets and Rugs Containing Perfluoroalkyl or Polyfluoroalkyl Substances. California Department of Toxic Substances Control. online. https://dtsc.ca.gov/wp-content/uploads/sites/31/2020/02/Final_Product-Chemical_Profile_Carpets_Rugs_PFASs_a.pdf
Dzierlenga MW, Crawford L, Longnecker MP. 2020. Birth weight and perfluorooctane sulfonic acid: a random-effects meta-regression analysis. Environmental Epidemiology 4:e095.
Eriksen KT, Raaschou-Nielsen O, McLaughlin JK, Lipworth L, Tjønneland A, Overvad K, et al. 2013. Association between Plasma PFOA and PFOS Levels and Total Cholesterol in a Middle-Aged Danish Population. PLoS ONE 8:1-7.
EWG. 2018. How Can I Avoid PFAS Chemicals? Environmental Working Group. Accessed September 2020. https://www.ewg.org/avoidpfas
EWG. 2019. Toxic ‘Forever Chemicals’ Detected in Drinking Water Supplies Across California. Environmental Working Group. Accessed November 12 2020. https://www.ewg.org/research/toxic-forever-chemicals-detected-drinking-water-supplies-across-california
Fan X, Brook JR, Mabury SA. 2003. Sampling Atmospheric Carbonaceous Aerosols Using an Integrated Organic Gas and Particle Sampler. Environmental Science & Technology 37:3145-3151.
Fang X, Wang Q, Zhao Z, Tang J, Tian C, Yao Y, et al. 2018. Distribution and dry deposition of alternative and legacy perfluoroalkyl and polyfluoroalkyl substances in the air above the Bohai and Yellow Seas, China. Atmospheric Environment 192:128-135.
101
Fraser AJ, Webster TF, Watkins DJ, Nelson JW, Stapleton HM, Calafat AM, et al. 2012. Polyfluorinated compounds in serum linked to indoor air in office environments. Environmental science & technology 46:1209-1215.
Fraser AJ, Webster TF, Watkins DJ, Strynar MJ, Kato K, Calafat AM, et al. 2013. Polyfluorinated compounds in dust from homes, offices, and vehicles as predictors of concentrations in office workers' serum. Environ Int 60:128-136.
Gallo V, Leonardi G, Genser B, Lopez-Espinosa M-J, Frisbee SJ, Karlsson L, et al. 2012. Serum perfluorooctanoate (PFOA) and perfluorooctane sulfonate (PFOS) concentrations and liver function biomarkers in a population with elevated PFOA exposure. Environmental Health Perspectives 120:655-660.
Geiger SD, Xiao J, Ducatman A, Frisbee S, Innes K, Shankar A. 2014. The association between PFOA, PFOS and serum lipid levels in adolescents. Chemosphere 98:78-83.
Gibson JC. 2020. Emerging persistent chemicals in human biomonitoring for populations in the Arctic: A Canadian perspective. Science of The Total Environment 708.
Gilliland FD, Mandel JS. 1993. Mortality among employees of a perfluorooctanoic acid production plant.
Gleason JA, Post GB, Fagliano JA. 2015. Associations of perfluorinated chemical serum concentrations and biomarkers of liver function and uric acid in the US population (NHANES), 2007–2010. Environmental Research 136:8-14.
Goosey E, Harrad S. 2011. Perfluoroalkyl compounds in dust from Asian, Australian, European, and North American homes and UK cars, classrooms, and offices. Environment International 37:86-92.
Grandjean P, Wreford Andersen E, Budtz-Jorgensen E, Nielsen F, MØLbak K, Weihe P, et al. 2012. Serum Vaccine Antibody Concentrations in Children Exposed to Perfluorinated Compounds. JAMA, the journal of the American Medical Association 307:391-397.
Grandjean P, Timmmermann C, Kruse M, Nielsen F, Vinholt PJ, Boding L, et al. 2020. Severity of COVID-19 at elevated exposure to perfluorinated alkylates. medRxiv: the preprint server for health sciences.
Haley & Aldrich. 2020. PFAS Technical Update: The chrome plating industry. Accessed https://www.haleyaldrich.com/wp-content/uploads/2020/08/HA-Technical-Update-PFAS-in-the-plating-industry.pdf
Hall SM, Patton S, Petreas M, Zhang S, Phillips AL, Hoffman K, et al. 2020. Per- and Polyfluoroalkyl Substances in Dust Collected from Residential Homes and Fire Stations in North America. Environmental Science & Technology 54:14558-14567.
102
Halldorsson Thorhallur I, Rytter D, Haug Line S, Bech Bodil H, Danielsen I, Becher G, et al. 2012. Prenatal Exposure to Perfluorooctanoate and Risk of Overweight at 20 Years of Age: A Prospective Cohort Study. Environmental Health Perspectives 120:668-673.
Hardell E, Karrman A, Van Bavel B, Jia BAO, Carlberg M, Hardell L. 2014. Case-control study on perfluorinated alkyl acids (PFAAs) and the risk of prostate cancer. Environment international:35.
Hardisty J, Willson G, Brown Wea. 2010. Pathology Working Group review and evaluation of proliferative lesions of mammary gland tissues in female rats fed ammonium perfluorooctanoate (APFO) in the diet for 2 years. Drug Chem Toxicol 33(2):131-137. .
Hoang T, Winters BR, Hall LC. 2020. PFHxS and PFNA in California Drinking Water: Potential Notification Levels & Implications for Human Exposure. ISES Conference Poster.
Houtz EF, Higgins CP, Field JA, Sedlak DL. 2013. Persistence of Perfluoroalkyl Acid Precursors in AFFF-Impacted Groundwater and Soil. Environmental Science & Technology 47:8187-8195.
Hu XC, Andrews DQ, Lindstrom AB, Bruton TA, Schaider LA, Grandjean P, et al. 2016. Detection of Poly- and Perfluoroalkyl Substances (PFASs) in U.S. Drinking Water Linked to Industrial Sites, Military Fire Training Areas, and Wastewater Treatment Plants. Environmental science & technology letters 3:344-350.
Huang R, Chen Q, Zhang L, Luo K, Chen L, Zhao S, et al. 2019. Prenatal exposure to perfluoroalkyl and polyfluoroalkyl substances and the risk of hypertensive disorders of pregnancy. Environ Health 18:5.
Humblet O, Diaz-Ramirez LG, Balmes JR, Pinney SM, Hiatt RA. 2014. Perfluoroalkyl chemicals and asthma among children 12-19 years of age: NHANES (1999-2008).
Hurley S, Houtz E, Goldberg D, Wang M, Park J-S, Nelson DO, et al. 2016. Preliminary Associations between the Detection of Perfluoroalkyl Acids (PFAAs) in Drinking Water and Serum Concentrations in a Sample of California Women.
Hurley S, Goldberg D, Wang M, Park J-S, Petreas M, Bernstein L, et al. 2018. Time Trends in Per- and Polyfluoroalkyl Substances (PFASs) in California Women: Declining Serum Levels, 2011-2015. Vol. 52, 277-287. https://libproxy.berkeley.edu/login?qurl=https%3a%2f%2fsearch.ebscohost.com%2flogin.aspx%3fdirect%3dtrue%26db%3dedswsc%26AN%3d000419419500031%26site%3deds-live
IARC. 2017. Agents classified by the IARC Monographs, Volumes 1–117. International Agency for Research on Cancer. Lyon, France. http://monographs.iarc.fr/ENG/Classification/List_of_Classifications.pdf.

103
ISU. 2020. Mass Spectrometry Tutorial. Iowa State University. Accessed October 20 2020. https://www.cif.iastate.edu/mass-spec/ms-tutorial
ITRC. 2020. PFAS Fact Sheet Site Characterization. Interstate Technology and Regulatory Council. https://pfas-1.itrcweb.org/wp-content/uploads/2020/04/PFAS_Fact_Sheet_Site_Characterization_April2020.pdf
Jahnke A, Huber S, Tenune C, Kylin H, Berger U. 2007a. Development and application of a simplified sampling method for volatile polyfluorinated alkyl substances in indoor and environmental air. Journal of chromatography 1164:1-9.
Jahnke A, Ahrens L, Ebinghaus R, Berger U, Barber JL, Temme C. 2007b. An improved method for the analysis of volatile polyfluorinated alkyl substances in environmental air samples. Analytical and bioanalytical chemistry 387:965-975.
Jain RB, Ducatman A. 2019. Selective associations of recent low concentrations of perfluoroalkyl substances with liver function biomarkers: NHANES 2011 to 2014 data on US adults aged >= 20 years. Journal of Occupational Environmental Medicine 61:293-302.
Jouanneau W, Bardsen BJ, Herzke D, Johnsen TV, Eulaers I, Bustnes JO. 2020. Spatiotemporal Analysis of Perfluoroalkyl Substances in White-Tailed Eagle (Haliaeetus albicilla) Nestlings from Northern Norway- A Ten-Year Study. . Environmental Science & Technology 54:5011-5020.
Karásková P, Venier M, Melymuk L, Bečanová J, Vojta Š, Prokeš R, et al. 2016. Perfluorinated alkyl substances (PFASs) in household dust in Central Europe and North America. Environ Int 94:315-324.
Karásková P, Codling G, Melymuk L, Klánová J. 2018. A critical assessment of passive air samplers for per- and polyfluoroalkyl substances. Atmospheric Environment 185:186-195.
Kataria A, Trachtman H, Malaga-Dieguez L, Trasande L. 2015. Association between perfluoroalkyl acids and kidney function in a cross-sectional study of adolescents. Vol. 14. https://libproxy.berkeley.edu/login?qurl=https%3a%2f%2fsearch.ebscohost.com%2flogin.aspx%3fdirect%3dtrue%26db%3dedswsc%26AN%3d000364998200001%26site%3deds-live
Kim K, Bennett DH, Calafat AM, Shin H-M. 2020. Temporal trends and determinants of serum concentrations of per- and polyfluoroalkyl substances among Northern California mothers with a young child, 2009–2016. Environmental Research.
104
Kim S-K, Park J-E. 2014. Comparison of two different passive air samplers (PUF-PAS versus SIP-PAS) to determine time-integrated average air concentration of volatile hydrophobic organic pollutants. Ocean Science Journal 49:137.
Kim SK, Kannan K. 2007. Perfluorinated Acids in Air, Rain, Snow, Surface Runoff, and Lakes: Relative Importance of Pathways to Contamination of Urban Lakes. Environmental Science & Technology 41:8328-8334.
Kristensen SL, Ramlau-Hansen CH, Ernst E, Olsen SF, Bonde JP, Vested A, et al. 2013. Long-term effects of prenatal exposure to perfluoroalkyl substances on female reproduction. Hum Reprod 28:3337-3348.
Kwiatkowski CF, Andrews DQ, Birnbaum LS, Bruton TA, DeWitt JC, Knappe DRU, et al. 2020. Scientific Basis for Managing PFAS as a Chemical Class. Environmental Science & Technology Letters 7:532-543.
Landrigan PJ, Goldman LR. 2011. Children's Vulnerability To Toxic Chemicals: A Challenge And Opportunity To Strengthen Health And Environmental Policy. Health Affairs 30:842-850.
Lau C, Thibodeaux JR, Hanson RG, Narotsky MG, Rogers JM, Lindstrom AB, et al. 2006. Effects of perfluorooctanoic acid exposure during pregnancy in the mouse. Toxicol Sci 90:510-518.
Lau C, Anitole K, Hodes C, Lai D, Pfahles-Hutchens A, Seed J. 2007. Perfluoroalkyl Acids: A Review of Monitoring and Toxicological Findings. Toxicological Sciences 99:366-394.
Leonard RC, Kreckmann KH, Sakr CJ, Symons JM. 2008. Retrospective Cohort Mortality Study of Workers in a Polymer Production Plant Including a Reference Population of Regional Workers. Annals of Epidemiology 18:15-22.
Lewis RC, Johns LE, Meeker JD. 2015. Serum Biomarkers of Exposure to Perfluoroalkyl Substances in Relation to Serum Testosterone and Measures of Thyroid Function among Adults and Adolescents from NHANES 2011–2012. International Journal of Environmental Research and Public Health 12:6098-6114.
Lin C-Y, Lin L-Y, Chiang C-K, Wang W-J, Su Y-N, Hung K-Y, et al. 2010. Investigation of the associations between low-dose serum perfluorinated chemicals and liver enzymes in US adults. The American Journal of Gastroenterology 105:1354-1263.
Lin C-Y, Wen L-L, Lin L-Y, Wen T-W, Lien G-W, Hsu SHJ, et al. 2013. The associations between serum perfluorinated chemicals and thyroid function in adolescents and young adults. Journal of Hazardous Materials 244-245:637-644.
Lindstrom AB, Strynar MJ, Libelo EL. 2011. Polyfluorinated Compounds: Past, Present, and Future. Environmental Science & Technology 45:7954-7961.
105
Liu W, Takahashi S, Sakuramachi Y, Harada KH, Koizumi A. 2013. Polyfluorinated telomers in indoor air of Japanese houses. Chemosphere 90:1672-7.
Liu Y, Li N, Papandonatos GD, Calafat AM, Eaton CB, Kelsey KT, et al. 2020. Exposure to Per- and Polyfluoroalkyl Substances and Adiposity at Age 12 Years: Evaluating Periods of Susceptibility. Environmental Science & Technology 54:16039-16049.
Lopez-Espinosa M-J, Fletcher T, Armstrong B, Genser B, Dhatariya K, Modal D, et al. 2011. Association of Perfluorooctanoic Acid (PFOA) and Perfluorooctane Sulfonate (PFOS) with Age of Puberty among Children Living near a Chemical Plant. Environmental science & technology 45:8160-8166.
Lopez-Espinosa MJ, Mondal D, Armstrong BG, Eskenazi B, Fletcher T. 2016. Perfluoroalkyl Substances, Sex Hormones, and Insulin-like Growth Factor-1 at 6-9 Years of Age: A Cross-Sectional Analysis within the C8 Health Project. Environ Health Perspect 124:1269-1275.
Luebker DJ, Case MT, York RG, Moore JA, Hansen KJ, Butenhoff JL. 2005b. Two-generation reproduction and cross-foster studies of perfluorooctanesulfonate (PFOS) in rats. Toxicology 215:126-148.
Lundin JI, Alexander BH, Olsen GW, Church TR. 2009. Ammonium Perfluorooctanoate Production and Occupational Mortality. Epidemiology 20:921.
Makey CM, Webster TF, Martin JW, Shoeib M, Harner T, Dix-Cooper L, et al. 2017. Airborne Precursors Predict Maternal Serum Perfluoroalkyl Acid Concentrations. Environmental Science & Technology 51:7667-7675.
MAMAS. 2015. Project Results for Measuring Analytes in Maternal Archived Samples (MAMAS). Accessed https://biomonitoring.ca.gov/results/projects/2157
Melzer D, Rice N, Depledge MH, Henley WE, Galloway TS. 2010. Association between Serum Perfluorooctanoic Acid (PFOA) and Thyroid Disease in the U.S. National Health and Nutrition Examination Survey. Environmental Health Perspectives 118:686.
Michigan Department of Environmental Quality. 2018. General PFAS Sampling Guidance. https://www.michigan.gov/documents/pfasresponse/General_PFAS_Sampling_Guidance_634597_7.pdf
MIEEP. 2011. Project Results for Maternal and Infant Environmental Exposure Project (MIEEP). Biomonitoring California. Accessed 2020. https://biomonitoring.ca.gov/results/projects/409
Miller MD, Marty MA, Arcus A, Brown J, Morry D, Sandy M. 2002. Differences Between Children and Adults: Implications for Risk Assessment at California EPA. International Journal of Toxicology (Taylor & Francis) 21:403-418.
106
Moody CA, Field JA. 2000. Perfluorinated surfactants and the environmental implications of their use in fire-fighting foams. Environmental science & technology 34:3864-3870.
Mora AM, Fleisch AF, Rifas-Shiman SL, Woo Baidal JA, Pardo L, Webster TF, et al. 2018. Early life exposure to per- and polyfluoroalkyl substances and mid-childhood lipid and alanine aminotransferase levels. Environ Int 111:1-13.
Muir D, Bossi R, Carlsson P, Evans M, De Silva A, Halsall C, et al. 2019. Levels and trends of poly- and perfluoroalkyl substances in the Arctic environment – An update. Emerging Contaminants 5:240-271.
Munoz G, Labadie P, Botta F, Lestremau F, Lopez B, Geneste E, et al. 2017. Occurrence survey and spatial distribution of perfluoroalkyl and polyfluoroalkyl surfactants in groundwater, surface water, and sediments from tropical environments. Sci Total Environ 607-608:243-252.
Munoz G, Liu J, Vo Duy S, Sauvé S. 2019. Analysis of F-53B, Gen-X, ADONA, and emerging fluoroalkylether substances in environmental and biomonitoring samples: A review. Trends in Environmental Analytical Chemistry 23:e00066.
Nakayama SF, Yoshikane M, Onoda Y, Nishihama Y, Iwai-Shimada M, Takagi M, et al. 2019. Worldwide trends in tracing poly- and perfluoroalkyl substances (PFAS) in the environment. Trends in Analytical Chemistry 121.
NC DEQ. 2018. North Carolina Air Quality Update. Department of Environmental Quality. Accessed November 5 2020. https://www.mecknc.gov/LUESA/AirQuality/PermittingRegulations/Documents/NCDAQupdate.pdf
NC DEQ. 2020. Air Quality Sampling. North Carolina Department of Environmental Quality. Accessed November 28 2020. https://deq.nc.gov/news/key-issues/genx-investigation/air-quality-sampling
Negri E, Metruccio F, Guercio V, Tosti L, Benfenati E, Bonzi R, et al. 2017. Exposure to PFOA and PFOS and fetal growth: a critical merging of toxicological and epidemiological data. Crit Rev Toxicol 47:482-508.
Nelson JW, Hatch EE, Webster TF. 2010. Exposure to polyfluoroalkyl chemicals and cholesterol, body weight, and insulin resistance in the general U.S. population. Environmental Health Perspectives 118:197-202.
NTP. 2016. Monograph on Immunotoxicity Associated with Exposure to Perfluorooctanoic acid (PFOA) and perfluorooctane sulfonate (PFOS). (NTP Monograph). Research Triangle Park:National Toxicology Program.
107
OEHHA. 2017. Chemicals Listed Effective November 10, 2017 as Known to the State of California to Cause Reproductive Toxicity. California Office of Environmental Health Hazard Assessment. https://oehha.ca.gov/media/downloads/crnr/listingnotice111017.pdf
OEHHA. 2019. Notification Level Recommendations: Perfluorooctanoic Acid (PFOA) and Perfluorooctane Sulfonate (PFOS) in Drinking Water. California Office of Environmental Health Hazard Assessment. https://oehha.ca.gov/media/downloads/water/chemicals/nl/final-pfoa-pfosnl082119.pdf
Olsen GW, Burris JM, Ehresman DJ, Froehlich JW, Seacat AM, Butenhoff JL, et al. 2007. Half-Life of Serum Elimination of Perfluorooctanesulfonate, Perfluorohexanesulfonate, and Perfluorooctanoate in Retired Fluorochemical Production Workers. Environmental Health Perspectives 115:1298.
Padilla-Sanchez JA, Haug LS. 2016. A fast and sensitive method for the simultaneous analysis of a wide range of per- and polyfluoroalkyl substances in indoor dust using on-line solid phase extraction-ultrahigh performance liquid chromatography-time-of-flight-mass spectrometry. J Chromatogr A 1445:36-45.
Pérez F, Nadal M, Navarro-Ortega A, Fàbrega F, Domingo JL, Barceló D, et al. 2013. Accumulation of perfluoroalkyl substances in human tissues. Environment International 59:354-362.
Piekarz AM, Primbs T, Field JA, Barofsky DF, Simonich S. 2007. Semivolatile Fluorinated Organic Compounds in Asian and Western U.S. Air Masses. Environmental Science & Technology 41:8248-8255.
Pinney SM, Windham GC, Xie C, Herrick RL, Calafat AM, McWhorter K, et al. 2019. Perfluorooctanoate and changes in anthropometric parameters with age in young girls in the Greater Cincinnati and San Francisco Bay Area. Vol. 222, 1038-1046. https://libproxy.berkeley.edu/login?qurl=https%3a%2f%2fsearch.ebscohost.com%2flogin.aspx%3fdirect%3dtrue%26db%3dedswsc%26AN%3d000496901300007%26site%3deds-live
Poothong S, Papadopoulou E, Padilla-Sanchez JA, Thomsen C, Haug LS. 2020. Multiple pathways of human exposure to poly- and perfluoroalkyl substances (PFASs): From external exposure to human blood. Environ Int 134:105244.
Prevedouros K, Cousins IT, Buck RC, Korzeniowski SH. 2006. Sources, Fate and Transport of Perfluorocarboxylates. Environmental Science & Technology 40:32-44.
Qin X-D, Qian Z, Vaughn MG, Huang J, Ward P, Zeng X-W, et al. 2016. Positive associations of serum perfluoroalkyl substances with uric acid and hyperuricemia in children from Taiwan. Environmental Pollution 212:519-524.
108
Qin XD, Qian ZM, Dharmage SC, Perret J, Geiger SD, Rigdon SE, et al. 2017. Association of perfluoroalkyl substances exposure with impaired lung function in children. Environ Res 155:15-21.
Raleigh KK, Alexander BH, Olsen GW, Ramachandran G, Morey SZ, Church TR, et al. 2014. Mortality and cancer incidence in ammonium perfluorooctanoate production workers. Occupational and Environmental Medicine 71:500.
Rappazzo KM, Coffman E, Hines EP. 2017. Exposure to Perfluorinated Alkyl Substances and Health Outcomes in Children: A Systematic Review of the Epidemiologic Literature. Int J Environ Res Public Health 14.
Riedel TP, Lang JR, Strynar MJ, Lindstrom AB, Offenberg JH. 2019. Gas-Phase Detection of Fluorotelomer Alcohols and Other Oxygenated Per- and Polyfluoroalkyl Substances by Chemical Ionization Mass Spectrometry. Environmental Science & Technology Letters 6:289-293.
Roberts JW, Budd, W. T., Ruby, M. G., Bond, A. E., Lewis, R. G., Wiener, R. W., & Camann, D. E. . 1991. Development and field testing of a high volume sampler for pesticides and toxics in dust. Journal of exposure analysis and environmental epidemiology 1:143-155.
Sakr CJ, Leonard RC, Kreckmann KH, Slade MD, Cullen MR. 2007a. Longitudinal study of serum lipids and liver enzymes in workers with occupational exposure to ammonium perfluorooctanoate. Journal of Occupational Environmental Medicine 49:872-879.
Sakr CJ, Kreckmann KH, Green JW, Gillies PJ, Reynolds JL, Leonard RC. 2007b. Cross-sectional study of lipids and liver enzymes related to a serum biomarker of exposure (ammonium perfluorooctanoate or APFO) as part of a general health survey in a cohort of occupationally exposed workers. Journal of occupational and environmental medicine 49:1086-1096.
Savitz DA, Stein CR, Bartell SM, Elston B, Gong J, Shin H-M, et al. 2012. Perfluorooctanoic acid exposure and pregnancy outcome in a highly exposed community. Epidemiology 23:386-392.
Schenker U, Scheringer M, MacLeod M, Martin JW, Cousins IT, Hungerbühler K. 2008. Contribution of Volatile Precursor Substances to the Flux of Perfluorooctanoate to the Arctic. Environmental Science & Technology 42:3710-3716.
Schlummer M, Gruber L, Fiedler D. 2013. Detection of fluorotelomer alcohols in indoor environments and their relevance for human exposure. Environment International 57-58:42-49.
Scott BF, Spencer C, Mabury SA, Muir DCG. 2006. Poly and perfluorinated carboxylates in North American precipitation. Environmental Science & Technology 40:7167-7174.
109
Sepulvado JG, Blaine AC, Hundal LS, Higgins CP. 2011. Occurrence and Fate of Perfluorochemicals in Soil Following the Land Application of Municipal Biosolids. Environmental Science & Technology 45:8106-8112.
Shoeib M, Harner T, Vlahos P. 2006. Perfluorinated Chemicals in the Arctic Atmosphere. Environmental Science & Technology 40:7577-7583.
Shoeib M, Harner T, Sum Chi LEE, Lane D, Jiping ZHU. 2008. Sorbent-Impregnated Polyurethane Foam Disk for Passive Air Sampling of Volatile Fluorinated Chemicals. Analytical chemistry (Washington, DC) 80:675-682.
Shoeib M, Harner T, M. Webster G, Lee SC. 2011. Indoor Sources of Poly- and Perfluorinated Compounds (PFCS) in Vancouver, Canada: Implications for Human Exposure. Environmental Science & Technology 45:7999-8005.
Smit LAM, Lenters V, Høyer BB, Lindh CH, Pedersen HS, Liermontova I, et al. 2015. Prenatal exposure to environmental chemical contaminants and asthma and eczema in school-age children. Allergy 70:653-660.
Starling AP, Engel SM, Richardson DB, Baird DD, Haug LS, Stuebe AM, et al. 2014. Perfluoroalkyl substances during pregnancy and validated preeclampsia among nulliparous women in the Norwegian Mother and Child Cohort Study. Am J Epidemiol 179:824-833.
Steenland K, Tinker S, Frisbee S, Ducatman A, Vaccarino V. 2009. Association of Perfluorooctanoic Acid and Perfluorooctane Sulfonate With Serum Lipids Among Adults Living Near a Chemical Plant. American journal of epidemiology 170:1268-1278.
Steenland K, Woskie S. 2012. Cohort Mortality Study of Workers Exposed to Perfluorooctanoic Acid. American journal of epidemiology:909.
Steenland K, Zhao L, Winquist A, Parks C. 2013. Ulcerative colitis and perfluorooctanoic acid (PFOA) in a highly exposed population of community residents and workers in the mid-Ohio valley. Environmental Health Perspectives 121:900-905.
Steenland K, Zhao L, Winquist A. 2015. A cohort incidence study of workers exposed to perfluorooctanoic acid (PFOA). Occupational and Environmental Medicine 72:373-380.
Steenland K, Kugathasan S, Barr DB. 2018. PFOA and ulcerative colitis. Environmental Research 165:317-321.
Steenland K, Fletcher T, Stein CR, Bartell SM, Darrow L, Lopez-Espinosa M-J, et al. 2020. Review: Evolution of evidence on PFOA and health following the assessments of the C8 Science Panel. Environment International 145:106-125.
110
Stein CR, Savitz DA, Dougan M. 2009. Serum Levels of Perfluorooctanoic Acid and Perfluorooctane Sulfonate and Pregnancy Outcome. American journal of epidemiology 170:837-846.
Stock NL, Lau FK, Ellis DA, Martin JW, Muir DCG, Mabury SA. 2004. Polyfluorinated Telomer Alcohols and Sulfonamides in the North American Troposphere. Environmental Science & Technology 38:991-996.
Strynar MJ, Lindstrom AB. 2008. Perfluorinated Compounds in House Dust from Ohio and North Carolina, USA. Environmental Science & Technology 42:3751-3756.
Strynar MJ, Lindstrom AB, Nakayama SF, Egeghy PP, Helfant LJ. 2012. Pilot scale application of a method for the analysis of perfluorinated compounds in surface soils. Chemosphere 86:252-257.
Sunderland EM, Hu XC, Dassuncao C, Tokranov AK, Wagner CC, Allen JG. 2019. A review of the pathways of human exposure to poly- and perfluoroalkyl substances (PFASs) and present understanding of health effects. J Expo Sci Environ Epidemiol 29:131-147.
Susmann HP, Schaider LA, Rodgers KM, Rudel RA. 2019. Dietary Habits Related to Food Packaging and Population Exposure to PFASs. Environ Health Perspect 127:107003.
Swedish Chemicals Agency. 2015. Occurance and use of highly fluorinated substances and alternatives. Swedish Chemicals Agency No. 7/15. Accessed November 2020. https://www.kemi.se/download/18.6df1d3df171c243fb23a98ea/1591454109137/report-7-15-occurrence-and-use-of-highly-fluorinated-substances-and-alternatives.pdf
SWRCB. 2019a. State Water Board Updates Guidelines for Testing and Reporting PFOA and PFOS As It Assesses Scope of Problem. State Water Resources Control Board. https://www.waterboards.ca.gov/press_room/press_releases/2019/pr082319_pfoa_pfos_guidelines_news_release.pdf
SWRCB. 2019b. Water Code Sections 13267 and 13383 Order for the Determination of the Presence of Per- and Polyfluoroalkyl Substances at Chrome Plating Facilities. State Water Resources Control Board. https://www.waterboards.ca.gov/pfas/docs/pfas_final_order_chrome_plating.pdf
SWRCB. 2020a. Frequently Asked Questions: What does AB 756 Require For Perfluoroalkyl and Polyfluoroalkyl Substances (PFAS). State Water Resources Control Board. https://www.waterboards.ca.gov/drinking_water/certlic/drinkingwater/documents/pfos_and_pfoa/pfas_ab756_factsheet.pdf
SWRCB. 2020b. Response Levels Lowered for Water Systems Statewide as PFAS Investigation Continues. State Water Resources Control Board. https://www.waterboards.ca.gov/press_room/press_releases/2020/pr02062020_pfoa_pfos_response_levels.pdf
111
Trowbridge J, Gerona RR, Lin T, Rudel RA, Bessonneau V, Buren H, et al. 2020. Exposure to Perfluoroalkyl Substances in a Cohort of Women Firefighters and Office Workers in San Francisco. Vol. 54, 3363-3374. https://libproxy.berkeley.edu/login?qurl=https%3a%2f%2fsearch.ebscohost.com%2flogin.aspx%3fdirect%3dtrue%26db%3dedswsc%26AN%3d000526416600032%26site%3deds-live
Trudel D, Horowitz L, Wormuth M, Scheringer M, Cousins IT, Hungerbühler K. 2008. Estimating consumer exposure to PFOS and PFOA. Risk Anal 28:251-269.
US EPA. CompTox Chemicals Dashboard. https://comptox.epa.gov/dashboard
US EPA. 2009. PFOS Chromium Electroplater Study. United States Environmental Protection Agency-Region 5. . https://www.in.gov/idem/ctap/files/plating_chromium_pfos_study.pdf
US EPA. 2016a. Health Effects Support Document for Perfluorooctanoic Acid (PFOA). US Environmental Protection Agency. https://www.epa.gov/sites/production/files/2016-05/documents/pfoa_hesd_final-plain.pdf
US EPA. 2016b. Health Effects Support Document for Perfluorooctane Sulfonate (PFOS). US Environmental Protection Agency. 822-R-16-002. https://www.epa.gov/sites/production/files/2016-05/documents/hesd_pfos_final-plain.pdf
US EPA. 2016c. PFOA & PFOS Drinking Water Health Advisories: Fact Sheet. US Environmental Protection Agency. https://www.epa.gov/sites/production/files/2016-06/documents/drinkingwaterhealthadvisories_pfoa_pfos_updated_5.31.16.pdf
US EPA. 2016d. Drinking Water Health Advisory for Perfluorooctanoic Acid (PFOA). US Environmental Protection Agency. https://www.epa.gov/sites/production/files/2016-05/documents/pfoa_health_advisory_final-plain.pdf
US EPA. 2016e. Drinking Water Health Advisory for Perfluorooctane Sulfonate (PFOS). US Environmental Protection Agency. https://www.epa.gov/sites/production/files/2016-05/documents/pfos_health_advisory_final-plain.pdf
US EPA. 2017. Technical Fact Sheet – Perfluorooctane Sulfonate (PFOS) and Perfluorooctanoic Acid (PFOA). US Environmental Protection Agency. https://www.epa.gov/sites/production/files/2017-12/documents/ffrrofactsheet_contaminants_pfos_pfoa_11-20-17_508_0.pdf
US EPA. 2018a. Human Health Toxicity Values for Hexafluoropropylene Oxide (HFPO) Dimer Acid and Its Ammonium Salt. (CASRN 13252-13-6 and CASRN 62037-80-3). Also Known as “GenX Chemicals". US Environmental Protection Agency. https://www.epa.gov/sites/production/files/2018-11/documents/genx_public_comment_draft_toxicity_assessment_nov2018-508.pdf

112
US EPA. 2018b. Human Health Toxicity Values for Perfluorobutane Sulfonic Acid and Related Compound Potassium Perfluorobutane Sulfonate, Draft for Public Comment. US Environmental Protection Agency. https://www.epa.gov/sites/production/files/2018-11/documents/pfbs_public_comment_draft_toxicity_assessment_nov2018-508.pdf
US EPA. 2018c. PFOA, PFOS and Other PFASs: Basic Information on PFAS. US Environmental Protection Agency. Online. https://www.epa.gov/pfas/basic-information-pfas. Accessed April 14, 2020.
US EPA. 2020a. Per- and Polyfluoroalkyl Substances (PFASs). https://clu-in.org/contaminantfocus/default.focus/sec/Per-_and_Polyfluoroalkyl_Substances_(PFASs)/cat/Overview/
US EPA. 2020b. Status of EPA Research and Development on PFAS: Methods to Detect and Quantify PFAS. US Environmental Protection Agency. Accessed September 3 2020. https://www.epa.gov/chemical-research/status-epa-research-and-development-pfas#methods
Wang B, Zhang R, Jin F, Lou H, Mao Y, Zhu W, et al. 2017. Perfluoroalkyl substances and endometriosis-related infertility in Chinese women. Environ Int 102:207-212.
Wang M, Park J-S, Petreas M. 2011. Temporal Changes in the Levels of Perfluorinated Compounds in California Women's Serum over the Past 50 Years. Environmental science & technology 45:7510-7516.
Wania F, Li S, Ying Duan LEI, Teixeira C, Muir DCG. 2003. Development and calibration of a resin-based passive sampling system for monitoring persistent organic pollutants in the atmosphere. Environmental science & technology 37:1352-1359.
Wania F. 2007. A Global Mass Balance Analysis of the Source of Perfluorocarboxylic Acids in the Arctic Ocean. Environmental Science & Technology 41:4529-4535.
Washington JW, Yoo H, Ellington JJ, Jenkins TM, Libelo EL. 2010. Concentrations, Distribution, and Persistence of Perfluoroalkylates in Sludge-Applied Soils near Decatur, Alabama, USA. Environmental Science & Technology 44:8390-8396.
Washington JW, Rosal CG, McCord JP, Strynar MJ, Lindstrom AB, Bergman EL, et al. 2020. Nontargeted mass-spectral detection of chloroperfluoropolyether carboxylates in New Jersey soils. Science 368:1103.
Watkins DJ, Josson J, Elston B, Bartell SM, Shin H-M, Vieira VM, et al. 2013. Exposure to Perfluoroalkyl Acids and Markers of Kidney Function among Children and Adolescents Living near a Chemical Plant. Environmental Health Perspectives 121:625-630.
Wikstrom S, Lin PI, Lindh CH, Shu H, Bornehag CG. 2019. Maternal serum levels of perfluoroalkyl substances in early pregnancy and offspring birth weight. Pediatr Res.
113
Winkens K, Koponen J, Schuster J, Shoeib M, Vestergren R, Berger U, et al. 2017. Perfluoroalkyl acids and their precursors in indoor air sampled in children's bedrooms. Environmental Pollution 222:423-432.
Winkens K, Giovanoulis G, Koponen J, Vestergren R, Berger U, Karvonen AM, et al. 2018. Perfluoroalkyl acids and their precursors in floor dust of children's bedrooms - Implications for indoor exposure. Environment International 119:493-502.
Winquist A, Streenland K. 2014. Modeled PFOA Exposure and Coronary Artery Disease, Hypertension, and High Cholesterol in Community and Worker Cohorts. Environmental Health Perspectives 122.
Winquist A, Streenland K. 2014b. Perfluorooctanoic acid exposure and thyroid disease in community and worker cohorts. Epidemiology 25:255-264.
Wu X, Bennett DH, Calafat AM, Kato K, Strynar M, Andersen E, et al. 2015. Serum concentrations of perfluorinated compounds (PFC) among selected populations of children and Adults in California. Environmental research 136:264-273.
Wu Y, Romanak K, Bruton T, Blum A, Venier M. 2020. Per- and polyfluoroalkyl substances in paired dust and carpets from childcare centers. Chemosphere 251:126771.
Xiao F, Simcik MF, Halbach TR, Gulliver JS. 2015. Perfluorooctane sulfonate (PFOS) and perfluorooctanoate (PFOA) in soils and groundwater of a U.S. metropolitan area: Migration and implications for human exposure. Water Research 72:64-74.
Xu Y, Li Y, Scott K, Lindh CH, Jakobsson K, Fletcher T, et al. 2020. Inflammatory bowel disease and biomarkers of gut inflammation and permeability in a community with high exposure to perfluoroalkyl substances through drinking water. Environ Res 181:108923.
Yeung LWY, Stadey C, Mabury SA. 2017. Simultaneous analysis of perfluoroalkyl and polyfluoroalkyl substances including ultrashort-chain C2 and C3 compounds in rain and river water samples by ultra performance convergence chromatography. Journal of Chromatography A 1522:78-85.
Young CJ, Furdui VI, Franklin J, Koerner RM, Muir DCG, Mabury SA. 2007. Perfluorinated Acids in Arctic Snow: New Evidence for Atmospheric Formation. Environmental Science & Technology 41:3455-3461.
Zhang Z, Fan X, Graham L, Chan TW, Brook JR. 2013. Evaluation of an annular denuder system for carbonaceous aerosol sampling of diesel engine emissions. Journal of the Air & Waste Management Association 63:87-99.
Zhao Z, Xie Z, Sturm R, Tang J, Zhang G, Ebinghaus R. 2012. Distribution and long-range transport of polyfluoroalkyl substances in the Arctic, Atlantic Ocean and Antarctic coast. Environmental Pollution 170:71-77.
114
Zheng G, Boor BE, Schreder E, Salamova A. 2020. Indoor exposure to per- and polyfluoroalkyl substances (PFAS) in the childcare environment. Environmental Pollution 258:113714.
Zhou J. 2020. Per- and Polyfluoroalkyl Substances (PFASs) in Airborne Particulate Matter (PM2.0) Emitted During Floor Waxing. Meeting of the International Society of Exposure Science (ISES) Conference Poster. September, 2020.
Zhu H, Kannan K. 2019. Distribution and partitioning of perfluoroalkyl carboxylic acids in surface soil, plants, and earthworms at a contaminated site. Science of The Total Environment 647:954-961.