Embed Size (px)
Citation preview

Instructions for use
Title Assessment of higher insect taxa as bioindicators for different logging-disturbance regimes in lowland tropical rainforest in Sabah, Malaysia
Author(s) Akutsu, Kosuke; Khen, Chey Vun; Toda, Masanori J.
Citation Ecological Research, 22(4), 542-550https://doi.org/10.1007/s11284-006-0052-6
Issue Date 2007-07
Doc URL http://hdl.handle.net/2115/28417
Rights The original publication is available at www.springerlink.com
Type article (author version)
File Information ER22-4.pdf
Hokkaido University Collection of Scholarly and Academic Papers : HUSCAP
Revised version
Title
Assessment of higher insect taxa as bioindicators for different logging-disturbance
regimes in lowland tropical rain forest in Sabah, Malaysia
Names of authors
Kosuke Akutsu 1, Chey Vun Khen 2, Masanori J. Toda 1
Addresses of affiliations
1 Institute of Low Temperature Science, Hokkaido University, Kita 19 Nishi 8, Kitaku,
Sapporo, Hokkaido, 060-0819 Japan
2 Forestry Research Centre, P. O. Box 1407, 90715 Sandakan, Sabah, Malysia
The e-mail addresses, telephone, and fax numbers of the communicating author.
Kosuke Akutsu, [email protected], Tel: +81-11-706-5499, Fax. No.:
+81-11-706-7142
1

Abstract
One of the serious environmental problems since the 1980s is the conflict between high
rate of deforestation and maintenance of healthy ecosystem services and biological
values in tropical forests. There is an urgent demand for setting up an appropriate
environmental assessment to keep healthy ecosystem functions and biodiversity along
with sustainable forest use based on ecology. In this study, we tried to assess
logging-disturbance effects on abundances of several flying insect groups (higher-taxon
approach) in lowland tropical rain forest, Deramakot Forest Reserve, Sabah, Malaysia,
with consideration of seasonal changes and vertical forest stratification. The season was
the most important factor affecting the abundances of all the insect groups. Effects of
logging disturbance were prominent in the understorey but obscure in the canopy.
Changes in physical conditions by logging, possibly increased evaporation by solar
radiation, may have decreased the abundance of desiccation-sensitive insects, especially
in the understorey. And, there are two probable reasons for the difference between in the
understorey and in the canopy: 1) noise effects of various physical, environmental
factors may have obscured insect responses to logging disturbance in the canopy; 2)
higher spatio-temporal variation in quality and quantify of living food resources such as
leaves, flowers and fruits provided in the canopy may have affected the abundance of
2

their consumer insects independently of logging disturbance. Thus, this study suggests
that the abundance of some insect groups at higher-taxon level, especially in the
understorey, can be used as bioindicators for assessing effects of logging disturbance on
the forest ecosystem.
Key words
Bioindicator, Higher-taxon Approach, Flying Insects, Selective Logging, Tropical
Forests
Introduction
A major environmental concern of tropical forest disappearance has been centered on
one of the biggest topics in conservation ecology since the 1980s (Bowles et al., 1998).
The importance of ecosystem services and biological values provided from tropical
forests has been pointed out by scientists and has been noticed by citizens of the world.
Nevertheless, the disappearance of tropical forests proceeds still at a high rate (Laurance,
1999; Bawa et al., 2004). Main driving forces of deforestation are population pressure,
policies of governments (Laurance, 1998) or financial problems (Wilkie et al., 1992)
and those complexes. Under these circumstances, we must renovate policies and
schemes of tropical forest conservation to keep healthy ecosystem functions and
biodiversity along with sustainable forest use (Kleine & Heuveldop, 1993; Organisation,
3

I. T. T., 1990), and must show the tolerance level of forest use based on ecology (Bawa
et al., 2004).
The first step to answer this demand is to scientifically but instantly assess current
conditions of disturbed and undisturbed environments. Various bioindicators have been
applied as useful tools to assess living conditions for organisms, traditionally in aquatic
environments (Rosenberg et al., 1986) and recently in terrestrial environments (van
Jaarsveld et al., 1998; Baldi, 2003; Ekschmitt et al., 2003; Woodcock et al., 2003).
Particularly, invertebrates have an advantage as bioindicators, because of being
ubiquitous in a wide range of environments and moderate in the growth rate and
population turnover (Hodkinson, 2005).
There are various approaches in bioindicator assessment. Some focus on certain
taxa, but others measure the diversity of the whole community at the level of species or
higher taxa (McGeoch, 1998; Hodkinson, 2005). Naturally, the higher the taxonomic
resolution is, more fine-scaled information on the environment will be gained. However,
such a fine-scale assessment at the species level is impractical when using highly
diverse taxa such as insects. Identification of species is almost impossible for
non-experts, and even for experts; the work necessitates a large amount of labor and
time (Oliver & Beattie, 1996; Baldi, 2003; Keith et al., 2004). Recently, instant and
4

economically reasonable approaches of using higher taxa (family or order) or functional
groups for bioindicator assessment have made a presence (Baldi, 2003; Deans et al.,
2005).
In this study, we examined the possibility of flying insects at the family level as an
environmental indicator of logging disturbance in lowland tropical forests. Flying
insects with high mobility have two potential advantages for environmental assessment.
Their high dispersion ability enables them to escape rapidly from inconvenient habitats
to better ones, implying their sensitivity to disturbance. Secondly, their high mobility
enables us to assess relatively wide-range environmental conditions from a fixed point.
Our study is the first trial to apply a higher-taxon approach for assessing the impact of
logging disturbance on insect communities in lowland tropical forests. The assessment
was conducted in Deramakot Forest Reserve, Sabah, Malaysia, where various logging
regimes were historically applied to different stands of tropical lowland rain forest.
Effects of different degrees of logging disturbance were compared across an array of
forest stands differing in applied method of logging operation and time after logging.
5

Materials and Methods
Location and climate of study site
Deramakot Forest Reserve (DFR), Sabah, Malaysia (5°19’- 20’N, 117°20’-42’E),
covers about 55,000 hectares in the east of central Sabah. The climate is marine
equatorial, with low variance in monthly mean temperature of about 26°C. Being
greatly influenced by the northeast monsoon (November-February) and the southwest
monsoon (May-August), the annual precipitation ranges from 1700 to 5100 mm (Kleine
& Heuveldop, 1993). The forest of DFR is classified as the Parashorea
tomentella-Eusideroxylon zwageri type, dominated by Dipterocarps such as Parashorea
tomentella, Shorea leptoclados, Dryobalanops lanceolata and Dipterocarpus caudiferus,
which together make up 40 % of bigger trees (Chey, 2002).
Logging history in DFR
Logging in DFR began from the southern part, along the Kinabatangan River, in
the 1950s. The initially adopted logging method was the Malayan Uniform System,
which allowed harvesting of all commercial timber over 45 cm in DBH (Diameter at
Breast Height) and subsequent systematic poisoning to unwanted species for promoting
6

the natural regeneration of saplings and seedlings of commercial trees. This was
modified in 1971 to the Sabah Uniform System along with the timber boom having
started in the late 1960s (Kleine & Heuvelfop, 1993). The method applied heavy
machineries without appropriate consideration of forest stand conditions and abandoned
all silvicultural treatments except cutting of lianas one year before felling. The
minimum DBH for harvesting was 60 cm and felling was assumed to be cycled at
60-year intervals. However, loggers and foresters ignored even those reduced
requirements for convenience or profit. As a result, many patches of deforested area
have been created in mosaic with residual forests to such a degree that any silvicultural
management or rehabilitation procedure has made no sense.
In 1989, the State Forestry Department of Sabah, assisted by the German
Government, started a project aimed at introducing sustainable management for timber
production, soil conservation, non-timber forest produce and conservation of native
flora and fauna in DFR. The introduced logging operation is called Reduced Impact
Logging (RIL). RIL is a kind of selective logging, which lays down various guidelines
for sustainable forest use, e.g., setting of stream buffer zones, preservation of potential
crop trees, and damage assessment after harvesting (Sabah Forestry Department, 1998).
By the authentication from the State Government of Sabah, the price of timber from
7

DFR has royalty in respect of the efforts for sustainable management.
Study plots
To assess logging impact on various components and functions of lowland tropical
rain forest ecosystem, in total ten 0.2-hectare study plots were established in different
forest compartments in and near DFR: those plots were classified into five groups, each
with two replicate plots, under different regimes of disturbance in logging operation and
the length of interval after logging. We chose one of the two replicate plots from each
group for sampling flying insects. The disturbance regimes were specified by two
factors, logging method (RIL or CM: conventional method referring to non-RIL) and
interval after logging. The five plots were named according to the disturbance regimes;
NIL: primary forest with no impact of logging, CM-70s: harvested in the 1970s by CM,
RIL-95: harvested in 1995 by RIL, RIL-00: harvested in 2000 by RIL, and CM-con:
continuing to be harvested intermittently by CM.
To estimate the effects of logging on forest environment, six environmental
variables were extracted from vegetation data for all trees with DBH over 9 cm in each
plot (Seino et al., personal communications): 1) tree species richness (TSR), 2) tree
density: number of trees within each plot (TDN), 3) total basal area of trees (BAT), 4)
8

basal area of Macaranga trees (BAM), 5) basal area of commercial (Dipterocarpaceae)
trees over 60 cm in DBH (BAC), 6) basal area of small trees below 10 cm in DBH
(BAS). In addition, 7) the amount (dry weight) of litter on the ground (ALG) was
measured, as the mean of A0-layer samples collected from five 25 cm2 quadrats in each
plot (Ito & Hasegawa, personal communications). Furthermore, in March 2005, vertical
forest structure was measured by a portable lidar system. Details of the system were
described in Parker et al. (2004). To measure the vertical forest profiles, each plot was
divided into 10 m meshes. Measurements were conducted at 2 m intervals along a mesh
line. Summing up the data, i.e., the height from the lidar system to the nearest foliage,
for each 10 m section (five measuring points), the foliage densities were calculated at 1
m intervals by MacArthur-Horn method (MacArthur & Horn, 1969). Then, the foliage
height diversity was estimated by the Shannon-Wiener index for each 10 m section and
8) the average (FHD) was calculated for each plot as a measure of foliage-layer
diversity. As another measure of foliage structure, 9) the horizontal constancy of vertical
foliage profile (HCF) was calculated by Kendall’s coefficient of concordance for the
1m-interval foliage densities across all 10 m sections within each plot (Tanabe, 2002).
9

Insect sampling
We employed a bait trap specially designed by Toda (1977) for sampling flying
insects in the above-ground forest space. To collect mainly fruit flies (Drosophilidae)
the traps were baited with fermented banana (ca. 170 g per trap), but non-drosophilid
flies (Diptera), beetles (Coleoptera), bees and wasps (Hymenoptera) were also collected
in abundance and other orders more or less.
In order not to disturb the forest floor of study plots by repeated visits to the
trapping sites, we selected a tree or two trees just adjacent (within 5 m) to each plot for
setting the banana traps (the vegetation was continuous in configuration between
respective trapping site and plot). The traps were set vertically from the understorey to
the canopy: the lowest trap was set at 0.5 m above the ground surface, the next at 1.5 m,
and others at 5 m intervals up to the canopy, the top trap varying in height according to
the canopy height of the forest (36.5 m at NIL, 31.5 m at CM-70s, 26.5 m at RIL-95 and
RIL-00 and 21.5 m at CM-con). Some (up to four) upper traps were suspended from the
same rope with a pulley that was hung from a bough of the selected tree, but the lowest
two were tied directly to the trunk of the same tree or a nearby tree.
We conducted sampling four times, in July to August and in October to November,
2003 and in January to February and in April to May, 2004. During each sampling
10

period trapped insects were collected and trap baits were renewed three times at 10-day
intervals. All samples were preserved in 70 % ethanol and carried to Hokkaido
University (Japan). Collected insect specimens were identified to family for Diptera,
Coleoptera and Hymenoptera, but to order for the others.
Analyses
Consolidation of environmental variables
The disturbance of logging itself is initially represented by direct loss of
commercial timber and soil agitation. As time goes by, however, those direct effects of
logging seem to be concerned with various aspects of forest succession. With the
thought of this complexity, we summarized the nine measured environmental variables
as a few major axes of a standardized Principal Component Analysis (PCA). Since PCA
axes are, by definition, orthogonal and independent of one another, this procedure
creates composite, independent, environmental variables and avoids the danger of
spurious correlations, i.e., multicollinearity (Voigt et al., 2003).
Effects of logging disturbance on insect abundance
Effects of logging disturbance were examined for the abundance of the following
11

seven insect families with the total number of collected individuals more than 500:
Drosophilidae, Phoridae, Sciaridae, Muscidae, Nitidulidae, Staphylinidae and Apidae,
the first four belonging to Diptera, the next two to Coleoptera, and the last to
Hymenoptera.
Considering the vertical stratification of insect communities within forest, we
focused on two extreme strata, the understorey (the lowest two traps) and the canopy
(the highest two). Although the actual height of canopy varied among the study plots,
the canopy was the uppermost stratum with similar characteristics such as dense foliage
and being exposed to the outer, open environment, and therefore comparable across the
plots. On the other hand, intermediate strata varied in number and environmental
conditions, with difficulty for objective comparison, among the study plots. The data
from traps other than the lowest and the highest two were excluded from the analyses.
Generalized Linear Models were adopted to estimate effects of logging
disturbance (R Development Core Team, 2004), separately for the abundance of each
insect group in the understorey and in the canopy. In this study probability distributions
were assumed to be of Poisson, and link functions were set to logarithmic function. In
addition to the composite, environmental variables, season was incorporated into the
analyses as a categorical variable: the four sampling periods were each coded by three
12

binary, dummy variables (SV1, 2 and 3).
From all the possible models (including the null model with no variables) differing
in composition of incorporated covariates (the composite, environmental variables) and
cofactor (season), the best model was selected with Akaike’s Information Criteria (AIC)
(Akaike, 1973). The deviance improvement was evaluated for each variable
incorporated into the selected model. Its percentage to the deviance of null model can be
regarded as a relative explanatory power of each variable.
Results
Consolidation of environmental variables
PCA axes were calculated for the original data of the nine environmental variables at the
five study plots (Table 1). Nearly all (92 %) of the total variance in the original data was
explained by the first two PCA axes, 57.8 % by Axis 1 and 34.1 % by Axis 2. Biplot of
the environmental variables and the study plots on these axes is shown in Fig. 1. The
principal component coefficients (loadings) of the environmental variables for the two
axes are shown in Table 2. Fig. 1 and Table 2 show that four environmental variables,
BAC, BAT, BAM and FHD are represented mostly by Axis 1, and that ALG, and HCF
are represented by Axis 2. However, the variance for the remaining three variables, TSR,
TDN and BAS, are explained by both axes in combination.
13

Among the four environmental variables well represented by Axis 1, BAM was
negatively correlated with BAC, BAT and FHD. Macaranga are major pioneer plants in
Southeast Asian tropics, rapidly entering deforested areas. Gap formation by selective
logging would promote the growth of Macaranga rapidly and such simultaneous forest
regeneration may reduce vertical complexity of foliage, FHD. On the other hand,
harvesting of big commercial trees directly reduces BAC and eventually BAT. Thus,
Axis 1 can be interpreted as representing direct effects of selective logging. As for Axis
2, ALG was negatively correlated with HCF (strongly), TDN and BAS (partially).
Interpretation of these correlations is difficult, except for partial correlation between
TDN, BAS and HCF: the promotion of young tree growth (BAS) would partly
contribute to the increase of the tree density (TDN) and more number of small trees,
which are highly variable in height according to the growth rates of different tree
species under the light conditions of stands, may result in high degrees of HCF. To
interpret the negative correlations between ALG and these three variables, we need
more information, for example on the rates of supply and decomposition of litter and
relations between nutrient cycling and plant growth.
The positions of study plots on Axis 1 are consistent with the interpretation of this
axis. NIL with no logging disturbance and CM-con with the strongest disturbance were
14

plotted at the opposite extremes, and the other three study plots, CM-70s, RIL-95 and
RIL-00, with moderate disturbance but varying in logging method and interval after
logging were at intermediate positions. However, the positions along Axis 2 are difficult
to be interpreted as mentioned above, varying especially among the moderately
disturbed plots.
All GLM analyses were carried out using these two PCA axes as composite,
environmental variables, Com1 and Com2. The first variable represents the intensity of
logging disturbance, but the second represents an unknown factor independent of
logging disturbance but related to the amount of ground litter, the tree density or
horizontal constancy of foliage.
Effects of logging disturbance on insect abundance
Understorey
The selected models were divided into two categories, one including all environmental
variables for Drosophilidae, Phoridae, Nitidulidae, Staphylinidae and Apidae and the
other not including Com2 for Sciaridae and Muscidae. The pattern of spatio-temporal
variation in abundance predicted from the selected model is shown in comparison with
the observed pattern, separately for each insect group, in Fig. 2. Table 3 shows the
15

parameter estimate for each environmental variable incorporated into the selected model
for each insect group, and Table 5 the improved deviance and its percentage. The
selected models fairly improved deviance (53.97 % to 85.45 %). The most important
factor explaining the deviance was Season in all the selected models, except for that of
Muscidae. Com1 representing the logging disturbance impact was the most important in
Muscidae and the second important in the other families, suggesting that all the insect
groups concerned, especially Sciaridae and Muscidae for which Com2 has been
excluded from the models, can be used as indicators for assessing impact of logging
disturbance.
Canopy
The selected models for canopy communities were different in the incorporated
variables and/or their relative importance from those for understorey communities in all
insect groups except for Drosophilidae and Nitidulidae. The selected models improved
25.34 % to 66.74 % of the deviance and season was also the most important variable in
all the insect groups except for Apidae (Table 5), and Muscidae was independent of
Com1 and Com2. For Sciaridae in contrast to the results for the understorey
communities, Com1 was excluded from the selected model instead of Com2 (Table 5).
16

In Phoridae, Staphylinidae and Apidae , the relative importance of Com1 and Com2 was
reversed between the understorey and the canopy: Com2 was the most important in
Apidae (Table 5). Even in Drosophilidae and Nitidulidae, for which Com1 was also the
second important variable, the percentage improvement of deviance by this variable was
less in the canopy than in the understorey (Table 5). The parameter estimates for Com1
were positive in Phoridae and Apidae, implying positive effects of logging disturbance
on these insects in the canopy (Table 4). Thus, the patterns of abundance variation
across the study plots were different between in the understorey and in the canopy:
effects of logging disturbance were less clear on canopy communities than on
understorey ones (Figs. 2 and 3).
Discussion
Seasonality in abundance of every insect group studied was apparent as in previous
works (Wolda, 1980; 1988; Kato et al., 1995). Additionally, our study showed that the
seasonal fluctuations in tropical insect populations were strong enough to exceed the
effects of logging disturbance. This result is consistent with the study by Hill et al.
(2003). Even in the tropics near the equator, monitoring of insect communities should
be done in the same season, or ideally throughout a year. Another point to be taken into
consideration is the interaction between logging disturbance and seasonal effects.
17

Silviculture treatments such as logging alter physical structure of forest stands and
change microclimate conditions there (Aussenac, 2000). Unfortunately, our study was
too small in the spatial scale to detect such interactive effects. More spatially scaled-up
research is needed to evaluate the interaction effects.
The logging disturbance (Com1) was detected as the most or second important,
environmental factor, which generally caused the decrease in abundance of all the insect
groups concerned, in the understorey communities. In the canopy, however, the insect
groups except Drosophilidae and Nitidulidae responded differently to the logging
disturbance: Com2 was the most or second important. What is the reason for this
difference in insect responses to the logging disturbance between the understorey and
the canopy? First, consider the difference in physical environment between the two
strata. The understorey is the innermost part of forest and well buffered by foliage cover
from the external, physical environment, e.g., solar radiation, wind, rainfall and so on
(Lee, 1978; Parker, 1995). On the other hand, the canopy is the outermost part exposed
to radical changes in weather conditions. It seems likely that in the understorey, all the
insect groups would have responded similarly to changes in some environmental factors
caused by logging disturbance under well-buffered, stable conditions of other factors.
For example, probably decreased humidity due to increased evaporation by solar
18

radiation would have decreased the abundances of desiccation-sensitive insects such as
most of the studied Dipteran families with small body size. In the canopy, however, the
impact of logging disturbance, if present, may have been obscured for most of the insect
groups studied, probably due to noise effects of spatio-temporal variation in a number of
physical, environmental factors. Another possible reason for not detecting of logging
impact on the canopy insect communities is high heterogeneity of food resources there.
Main food resources for insects in the understorey are dead and/or decayed, organic
matters such as leaf litter, fallen logs, (decayed) barks and fruits, or fungi and microbes
growing on such dead matters. On the other hand, the canopy provides insects mainly
with living food resources such as leaves, flowers and fruits. In general, living vegetable
matters are spatio-temporally more variable in both quality and quantity than dead
matters, according to leaf ages and species-specific characters of living plants (Coley,
1983; Coley & Barone, 1996). The quality of dead matters on the understorey is
considered to be less species-specific and much influenced by physical, environmental
factors such as temperature and humidity. Thus, logging disturbance may have affected
the abundance of understorey insects through changes in their food resources. On the
other hand, the abundance of canopy insects utilizing highly diverse food resources may
have been determined by various factors independent of logging disturbance. Most of
19

the Dipteran families studied depend on dead, organic matters or fungi/microbes on
them, spend their larval stages in soil, and have an important role for organic
decomposition in forest ecosystem (Schaeffer & Schauermann, 1990; Frouz, 1999).
Responses of Dipteran families in the understorey, especially Muscidae and Sciaridae,
might be related to some changes in decomposition system by logging disturbance.
Anthropogenic disturbance especially by logging on natural forest ecosystems has
been greatly intensified since the 1960s in Southeast Asia (Brookfield & Byron, 1990),
causing deterioration of ecosystem functions and mass extinction of biological species
(e.g., Laurance, 1999). In the last decade, effects of clear felling or selective logging on
invertebrates have been studied (Holloway et al., 1992; Chey et al., 1997; 2002; Willott,
1999; Willott et al., 2000; Chung et al., 2000; Lewis, 2001; Eltz et al., 2002; 2003;
Samejima et al., 2004). Their findings have suggested a possibility to apply those
invertebrate responses for assessing the impact of logging disturbance on ecosystem
functioning. However, such scientific assessment is not yet enough as to keep the
balance between forest harvesting and natural revegetation (Laurance, 1999). It is an
urgent demand to assess current and future threats of ecosystem degradation for
planning effective managements of ecosystem maintenance, sustainable use and
remediation. Higher-taxon approach seems to be the most realistic in its convenience
20

and cost efficiency to this current demand. In this context, the present study showed
possible effectiveness of such an approach. However, the patterns observed in the
present study may be highly dependent on the particular sampling method by
banana-baited trap. The obtained samples do not cover all members of the selected taxa,
even for Drosophilidae, and the sampling efficiency, if comparable across different
environments for each taxon, should vary among the different taxa. For generalization,
more evidence should be obtained by different sampling methods.
Acknowledgments
This study would not have been possible without kind support from a lot of people
including K. Kitayama, T. Seino, S. Aiba, M. Takyu, H. Matsubayashi, S. Tanabe, and
staff of Deramakot Forest Office, especially Peter Lagan, Azny Ahmad, Mike and Joel.
Finally, K.A. must appreciate the research partner, Erwin. This study was funded by the
Project (P-2) of the Research Institute for Humanity and Nature, Kyoto, Japan.
21

References
Akaike H. (1973) Information theory as an extension of the maximum likelihood
principle. In: Proceedings in second international symposium on information theory pp.
267-281, Budapest, Hungary.
Aussenac G. (2000) Interactions between forest stands and microclimate:
Ecophysiological aspects and consequences for silviculture. Annals of Forest Science
57: 287-301.
Baldi A. (2003) Using higher taxa as surrogates of species richness: a study based on
3700 Coleoptera, Diptera, and Acari species in Central-Hungarian reserves. Basic and
Applied Ecology 4: 589-593.
Bawa K. S., Kress W. J., Nadkarni N. M. & Lele S. (2004) Beyond paradise - Meeting
the challenges in tropical biology in the 21st century. Biotropica 36: 437-446.
Bowles I. A., Rice R. E., Mittermeier R. A. & da Fonseca G. A. B. (1998) Logging and
tropical forest conservation. Science 280: 1899-1900.
Brookfield H. & Byron Y. (1990) Deforestation and Timber Extraction in Borneo and
the Malay Peninsula - the Record since 1965. Global Environmental Change-Human
and Policy Dimensions 1: 42-56.
22

Chey V. K., Holloway J. D. & Speight M. R. (1997) Diversity of moths in forest
plantations and natural forests in Sabah. Bulletin of Entomological Research 87:
371-385.
Chey V. K. (2002) Comparison of moth diversity between lightly and heavily logged
sites in a tropical rain forest. Malayan Nature Journal 56: 23-41.
Chung A. Y. C., Eggleton P., Speight M. R., Hammond P. M. & Chey V. K. (2000) The
diversity of beetle assemblages in different habitat types in Sabah, Malaysia. Bulletin of
Entomological Research 90: 475-496.
Coley P. D. (1983) Herbivory and Defensive Characteristics of Tree Species in a
Lowland Tropical Forest. Ecological Monographs 53: 209-233.
Coley P. D. & Barone J. A. (1996) Herbivory and plant defenses in tropical forests.
Annual Review of Ecology and Systematics 27: 305-335.
Deans A. M., Malcolm J. R., Smith S. M. & Bellocq M. I. (2005) Edge effects and the
responses of aerial insect assemblages to structural-retention harvesting in Canadian
boreal peatland forests. Forest Ecology and Management 204: 249-266.
Department S. F. (1998) RIL Operation Guide Book, Specifically For Tracked Skidder
Use, Sandakan, Malaysia.
Ekschmitt K., Stierhof T., Dauber J., Kreimes K. & Wolters V. (2003) On the quality of
23

soil biodiversity indicators: abiotic and biotic parameters as predictors of soil faunal
richness at different spatial scales. Agriculture Ecosystems & Environment 98: 273-283.
Eltz T., Bruhl C. A., van der Kaars S. & Linsenmair K. E. (2002) Determinants of
stingless bee nest density in lowland dipterocarp forests of Sabah, Malaysia. Oecologia
131: 27-34.
Eltz T., Bruhl C. A., Imiyabir Z. & Linsenmair K. E. (2003) Nesting and nest trees of
stingless bees (Apidae : Meliponini) in lowland dipterocarp forests in Sabah, Malaysia,
with implications for forest management. Forest Ecology and Management 172:
301-313.
Frouz J. (1999) Use of soil dwelling Diptera (Insecta, Diptera) as bioindicators: a
review of ecological requirements and response to disturbance. Agriculture Ecosystems
& Environment 74: 167-186.
Hill J. K., Hamer K. C., Dawood M. M., Tangah J. & Chey V. K. (2003) Rainfall but not
selective logging affect changes in abundance of tropical forest butterfly in Sabah,
Borneo. Journal of Tropical Ecology 19: 35-42.
Hodkinson I. D. (2005) Terrestrial and aquatic invertebrates as bioindicators for
environmental monitoring, with particular reference to mountain ecosystems.
Environmental Management 35: 649-666.
24

Holloway J. D., Kirkspriggs A. H. & Khen C. V. (1992) The Response of Some
Rain-Forest Insect Groups to Logging and Conversion to Plantation. Philosophical
Transactions of the Royal Society of London Series B-Biological Sciences 335:
425-436.
Kato M., Inoue T., Hamid A. A., Nagamitsu T., Merdek M. B., Nona A. R., Itino T.,
Yamane S. & Yumoto T. (1995) Seasonality and Vertical Structure of Light-Attracted
Insect Communities in a Dipterocarp Forest in Sarawak. Researches on Population
Ecology 37: 59-79.
Keith S. Summerville L. M. R., Thomas O. Crist (2004) Forest moth taxa as indicators
of lepidopteran richness and habitat disturbance: a preliminary assessment. Biological
Conservation 116: 9-18.
Kleine M. & Heuveldop J. (1993) A Management Planning Concept for Sustained Yield
of Tropical Forests in Sabah, Malaysia. Forest Ecology and Management 61: 277-297.
Laurance W. F. (1998) A crisis in the making: responses of Amazonian forests to land
use and climate change. Trends in Ecology & Evolution 13: 411-415.
Laurance W. F. (1999) Reflections on the tropical deforestation crisis. Biological
Conservation 91: 109-117.
Lee R. (1978) Forest microclimatology. Columbia University Press, New York.
25

Lewis O. T. (2001) Effect of experimental selective logging on tropical butterflies.
Conservation Biology 15: 389-400.
MacArthur R. & Horn H. (1969) Foliage profile by vertical Measurements. Ecology 50:
802-804.
Mcgeoch M. A. (1998) The selection, testing and application of terrestrial insects as
bioindicators. Biological reviews 73: 181-201.
Oliver I. & Beattie A. J. (1996) Designing a cost-effective invertebrate survey: A test of
methods for rapid assessment of biodiversity. Ecological Applications 6: 594-607.
Organisation I. T. T. (1990) ITTO guidelines for the sustainable management of natural
tropical forests (ed. H. Marjuni). ITTO, Kuala Lumpur, Malaysia.
Parker G. G. (1995) Structure and microclimate of forest canopies. In: Forest canopies
(ed. M. D. N. Lowman, N. M.) pp. 73-106. Academic Press, San Diego.
Parker G. G., Harding D. J. & Berger M. L. (2004) A portable LIDAR system for rapid
determination of forest canopy structure. Journal of Applied Ecology 41: 755-767.
R Development Core Team. (2004), R: A language and environment for statistical
computing. http://www.R-project.org (R Foundation for Statistical Computing: Vienna
Austria.)
Rosenberg D. M., Danks H. V. & Lehmkuhl D. M. (1986) Importance of Insects in
26

Environmental-Impact Assessment. Environmental Management 10: 773-783.
Samejima H., Marzuki M., Nagamitsu T. & Nakasizuka T. (2004) The effects of human
disturbance on a stingless bee community in a tropical rainforest. Biological
Conservation 120: 577-587.
Schaeffer M., Schauermann, J. (1990) The fauna of beech forests: comparison between
mull and moder soil. Pedobiologia 34: 299-314.
Tanabe S. (2002) Between-forest variation in vertical stratification of drosophilid
populations. Ecological Entomology 27: 720-731.
Toda M. J. (1977) Two new 'retainer' bait traps. Drosophila Information Service 52:
180.
van Jaarsveld A. S., Freitag S., Chown S. L., Muller C., Koch S., Hull H., Bellamy C.,
Kruger M., Endrody-Younga S., Mansell M. W. & Scholtz C. H. (1998) Biodiversity
assessment and conservation strategies. Science 279: 2106-2108.
Voigt W., Perner J., Davis A. J., Eggers T., Schumacher J., Bahrmann R., Fabian B.,
Heinrich W., Kohler G., Lichter D., Marstaller R. & Sander F. W. (2003) Trophic levels
are differentially sensitive to climate. Ecology 84: 2444-2453.
Wilkie D. S., Sidle J. G. & Boundzanga G. C. (1992) Mechanized Logging, Market
Hunting, and a Bank Loan in Congo. Conservation Biology 6: 570-580.
27

Willott S. J. (1999) The effects of selective logging on the distribution of moths in a
Bornean rainforest. Philosophical Transactions of the Royal Society of London Series
B-Biological Sciences 354: 1783-1790.
Willott S. J., Lim D. C., Compton S. G. & Sutton S. L. (2000) Effects of selective
logging on the butterflies of a Bornean rainforest. Conservation Biology 14: 1055-1065.
Wolda H. (1980) Seasonality of Tropical Insects .1. Leafhoppers (Homoptera) in
Las-Cumbres, Panama. Journal of Animal Ecology 49: 277-290.
Wolda H. (1988) Insect Seasonality - Why. Annual Review of Ecology and Systematics
19: 1-18.
Woodcock B. A., Watt A. D. & Leather S. R. (2003) Influence of management type on
Diptera communities of coniferous plantations and deciduous woodlands. Agriculture
Ecosystems & Environment 95: 443-452.
28

Table 1. Original data for nine environmental variables at each study plot.
Plot TSRa TDNb FHDc HCFd BATe(m2) BAMf(m2) BACg(m2) BASh(m2) ALGi(g)
NIL 50 151 2.606 0.677 7.853 0.107 2.402 0.053 50.572
CM-70s 35 102 2.300 0.398 7.694 0.317 2.026 0.046 78.734
RIL-95 40 154 2.239 0.630 7.590 0.297 1.534 0.074 28.964
RIL-00 33 128 2.123 0.476 7.155 1.048 1.253 0.074 63.580
CM-con 25 126 2.088 0.635 4.089 1.976 0.000 0.090 53.678
aTree species richness. bNumber of trees. cFoliage height diversity. dHorizontal constancy of vertical foliage. eTotal basal area of trees. fBasal area of Macaranga trees. gBasal area of commercial (Dipterocarpaceae) trees over 60cm in DBH. hBasal area of small trees below 10cm in DBH. iThe amount (dry weight) of litter on the ground.
29
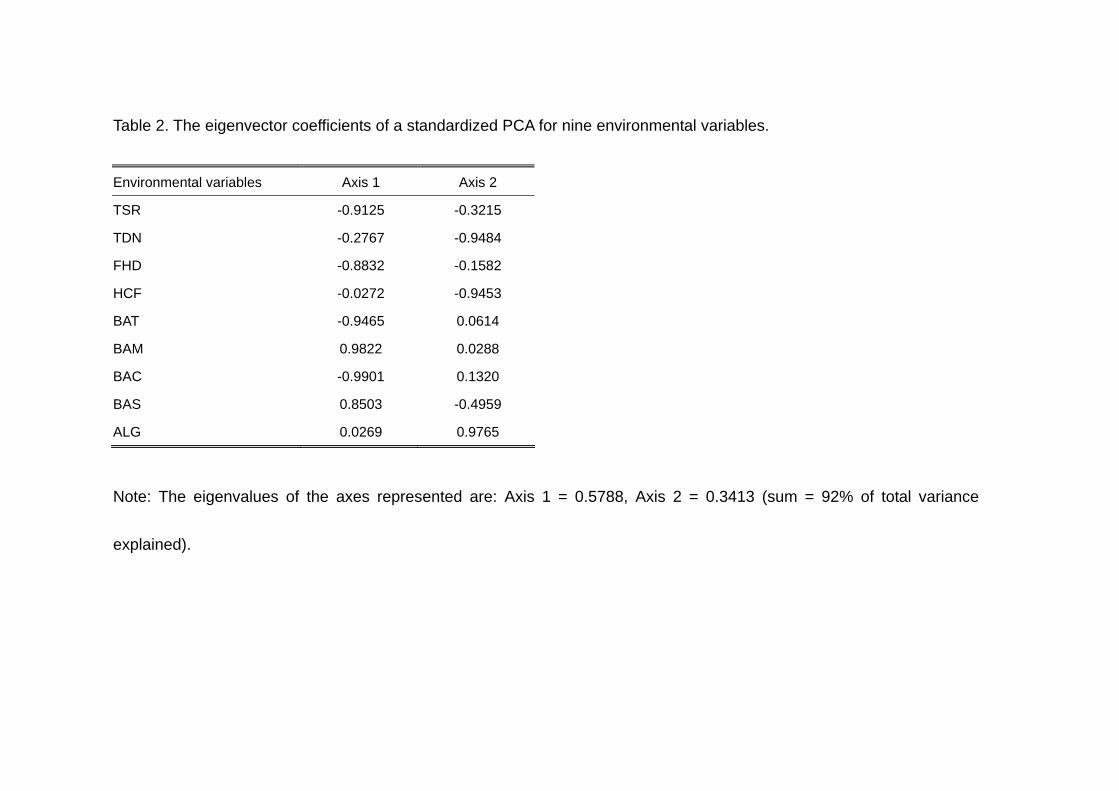
Table 2. The eigenvector coefficients of a standardized PCA for nine environmental variables.
Environmental variables Axis 1 Axis 2
TSR -0.9125 -0.3215
TDN -0.2767 -0.9484
FHD -0.8832 -0.1582
HCF -0.0272 -0.9453
BAT -0.9465 0.0614
BAM 0.9822 0.0288
BAC -0.9901 0.1320
BAS 0.8503 -0.4959
ALG 0.0269 0.9765
Note: The eigenvalues of the axes represented are: Axis 1 = 0.5788, Axis 2 = 0.3413 (sum = 92% of total variance
explained).
30

Table 3. Parameter estimates of the selected model to explain spatio-temporal
variation in abundance of each insect group in the understorey.
Insect group Intercept Com1 Com2 SV1 SV2 SV3
Drosophilidae 6.0156 -0.3737 -0.1331 0.0237 0.8823 0.8644
Phoridae 2.8015 -0.2336 -0.1728 0.5496 1.4537 1.6963
Sciaridae -0.0458 -0.9641 -* 1.6094 1.1896 3.2415
Muscidae 2.4301 -0.6352 - -0.8522 -0.5819 -1.2238
Nitidulidae 4.6603 -0.2441 -0.1125 -0.3223 0.3257 0.3231
Staphylinidae 5.2393 -0.4524 -0.2490 -2.1484 -0.4730 -1.3183
Apidae 1.2659 -0.2904 -0.2224 0.5521 1.1664 0.4229
* Not selected.
31
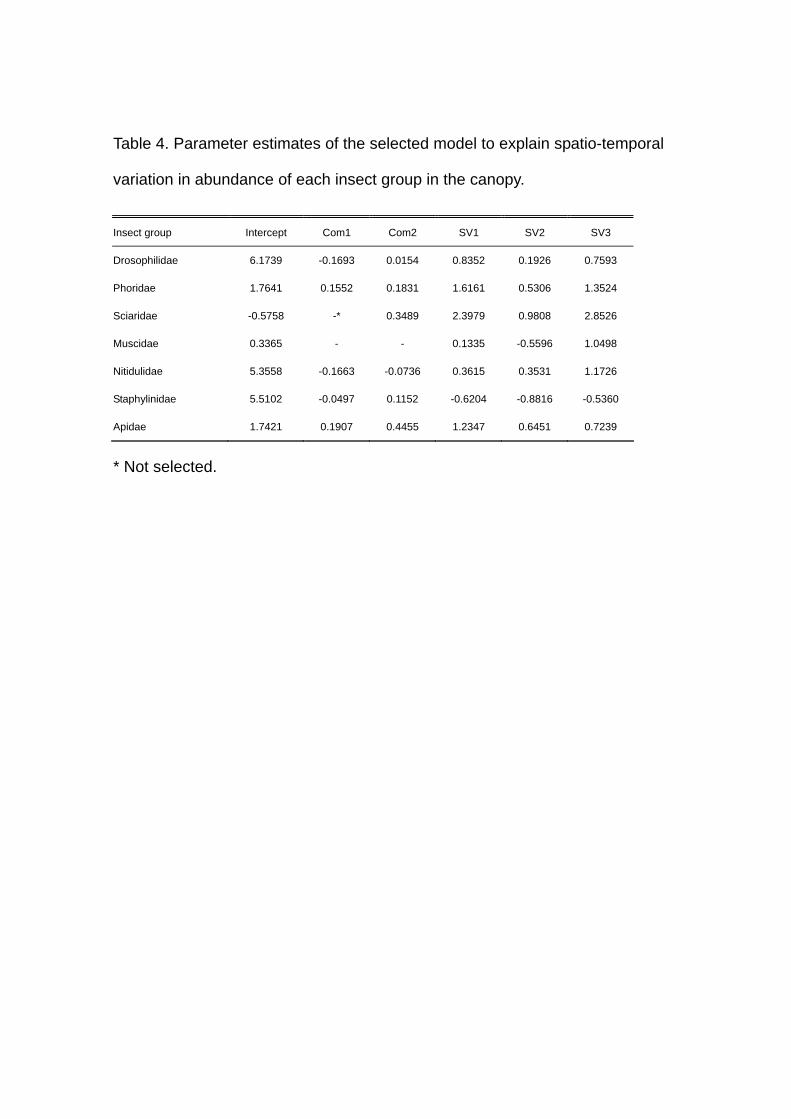
Table 4. Parameter estimates of the selected model to explain spatio-temporal
variation in abundance of each insect group in the canopy.
Insect group Intercept Com1 Com2 SV1 SV2 SV3
Drosophilidae 6.1739 -0.1693 0.0154 0.8352 0.1926 0.7593
Phoridae 1.7641 0.1552 0.1831 1.6161 0.5306 1.3524
Sciaridae -0.5758 -* 0.3489 2.3979 0.9808 2.8526
Muscidae 0.3365 - - 0.1335 -0.5596 1.0498
Nitidulidae 5.3558 -0.1663 -0.0736 0.3615 0.3531 1.1726
Staphylinidae 5.5102 -0.0497 0.1152 -0.6204 -0.8816 -0.5360
Apidae 1.7421 0.1907 0.4455 1.2347 0.6451 0.7239
* Not selected.
32
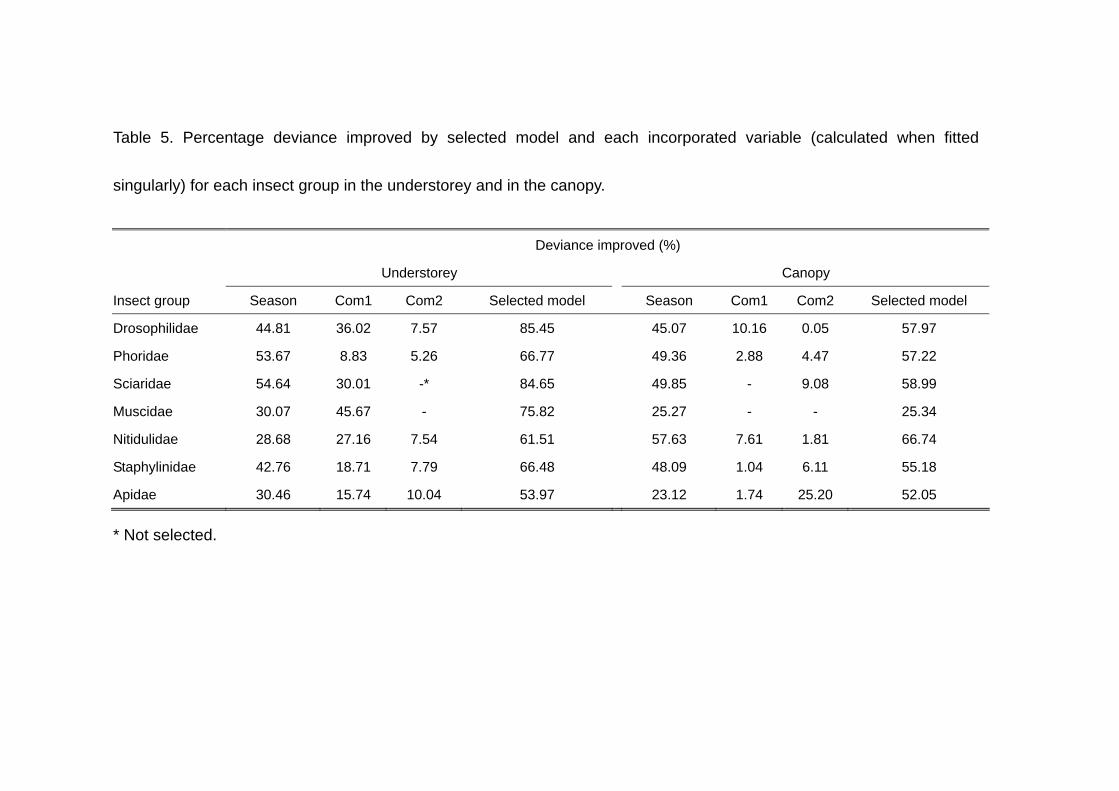
Table 5. Percentage deviance improved by selected model and each incorporated variable (calculated when fitted
singularly) for each insect group in the understorey and in the canopy.
Deviance improved (%)
Understorey Canopy
Insect group Season Com1 Com2 Selected model Season Com1 Com2 Selected model
Drosophilidae 44.81 36.02 7.57 85.45 45.07 10.16 0.05 57.97
Phoridae 53.67 8.83 5.26 66.77 49.36 2.88 4.47 57.22
Sciaridae 54.64 30.01 -* 84.65 49.85 - 9.08 58.99
Muscidae 30.07 45.67 - 75.82 25.27 - - 25.34
Nitidulidae 28.68 27.16 7.54 61.51 57.63 7.61 1.81 66.74
Staphylinidae 42.76 18.71 7.79 66.48 48.09 1.04 6.11 55.18
Apidae 30.46 15.74 10.04 53.97 23.12 1.74 25.20 52.05
* Not selected.
33

Figure legends
Fig. 1. PCA biplot for relations between environmental variables and study plots.
Environmental variables are shown with vectors and study plots with circles.
Fig. 2. Seasonal and among-plot variations in abundance of each insect group in
the understorey: observed value (bar) and prediction from the selected model (dot
with line).
Fig. 3. Seasonal and among-plot variations in abundance of each insect group in
the canopy: (see legend of Fig. 2 for further explanation.
34

Fig. 1. PCA biplot for relations between environmental variables and study plots.
Environmental variables are shown with vectors and study plots with circles.
-1.5 1.5Axis 1-1.0
1.0
Axis
2
TSR
BAT
BAMBAC
BAS
TDN
ALG
FHD
HCF
NIL
CM-70s
RIL-00
RIL-95
CM-con

Drosophilidae
0400800
120016002000
Phoridae
0
40
80
120
160
Sciaridae
020406080
100
Muscidae
01020304050
Nitidulidae
0
100
200
300
Staphylinidae
0
200
400
600
800
Apidae
0
10
20
Abundance
Jul-Aug Oct-Nov Apr-May Jan-Feb
NIL CM-70s RIL-00 RIL-95 CM-con
Fig. 2.
2003 2004
Jul-Aug Oct-Nov Apr-May Jan-Feb2003 2004

Drosophilidae
0
400
800
1200
1600
Phoridae
0
25
50
Sciaridae
0
10
20
30
Muscidae
0
5
10
Nitidulidae
0
400
800
1200
Staphylinidae
0
200
400
600
Apidae
0
25
50
NIL CM-70s RIL-00 RIL-95 CM-con
Fig. 3.
Abundance
Jul-Aug Oct-Nov Apr-May Jan-Feb2003 2004
Jul-Aug Oct-Nov Apr-May Jan-Feb2003 2004