Embed Size (px)
Citation preview

i
ASSESSMENT OF HEAVY METAL POLLUTION IN SOIL AND SURFACE WATER
IN MNG-GOLD, KOKOYA DISTRICT, BONG COUNTY, LIBERIA
A THESIS PRESENTED TO THE DEPARTMENT OF MATERIAL SCIENCE AND
ENGINEERING
AFRICAN UNIVERSITY OF SCIENCE AND TECHNOLOGY, ABUJA
IN PARTIAL FULFILMENT OF THE REQUIREMENTS FOR THE DEGREE OF
MASTER OF SCIENCE
BY
MOHAMMED AMARA KAMARA
SUPERVISED BY
PROF. RICHARD KWASI AMANKWAH
ABUJA, NIGERIA
JULY, 2019
ii
ASSESSMENT OF HEAVY METAL POLLUTION IN SOIL AND SURFACE WATER
IN MNG-GOLD MINE, KOKOYA, BONG COUNTY, LIBERIA
By
MOHAMMED A. KAMARA
A THESIS APPROVED BY THE DEPARTMENT OF MATERIAL SCIENCE AND
ENGINEERING
RECOMMENDED:
__________________________________
Supervisor, Prof. Richard Kwasi Amankwah
___________________________________
Co-supervisor, Prof. Abdul Ganiyu Alabi
___________________________________
Professor Peter Onwualu
Head, Department of Material Science and Engineering
APPROVED:
_____________________________________
Chief Academic Officer
_________________________________
Date March, 2020

iii
DECLARATION
I, the undersigned, declare that this thesis is my personal work written under the direct
supervision of my advisor, Professor Richard Kwasi Amankwah and has not been presented and
published as a thesis for a degree in any other university. All relevant materials used or cited for
this work have also been duly acknowledged for their contributions.

iv
ABSTRACT
The presence of heavy metals in water and soil by metalliferous mining activities at MNG-Gold
Mine was fully investigated. The extraction of gold in recent years, has led to the generation of
huge quantities of solid and liquid wastes. During the course of the investigation, fourteen
samples including surface water, groundwater and soil were collected and analyzed to
determine physio-chemical parameters and heavy metal contents. Atomic Absorption
spectrometer (AAS FS 240) was used to analyze iron (Fe), zinc (Zn), nickel (Ni), manganese (Mn)
and lead (Pb) in samples from Adana, old TSF, new TSF and St. John River. Garmin 60 GPS was
used during the field exercise to determine the coordinate points. The fourteen samples
collected from water, soil and underground water were stored in 250 ml polyethylene bottle
and kept at 190 C before analysis was conducted. The findings revealed that the iron
concentration in water and soil at certain places was extremely high as compared to other
metals.
Out of 14 samples analyzed, five heavy metals such as Fe, Zn, Ni, Mn and Pb were detected in
water at Adana, old TSF, new TSF and St. John River. The concentrations range from < 0.01 to
1.58, < 0.02 to 0.02, < 0.01 to 0.03, < 0.01 to 0.08 and < 0.01 to 0.02 ppm. Also, Fe, Zn, Ni, Mn
and Pb were detected in sediment samples at Adana, old TSF, new TSF, Saprolite and St. John
River and the concentrations range from 50,000-120,000 ppm, 15-55 ppm, 10-200 ppm, 50-
1000 ppm and 5-20 ppm respectively. Except for iron, all the other metals were below the WHO
maximum thresholds.
Keywords Heavy metals, soil, water, pH, Atomic Absorption Spectrometer, contaminants, GPS
polyethylene bottle.

v
ACKNOWLEDGEMENT
I wish to acknowledge and extend my profound gratitude to the many people who have in
various ways and means aided or contributed to the successful completion of this thesis. In
furtherance, I wish to thank the Almighty Allah for providing me the time and energy in writing
this thesis. Also, my humble and deepest gratitude to my supervisor, Prof. Richard Kwasi
Amankwah and co-supervisor, Prof. Abdul Ganiyu F. Alabi for their tireless efforts, patience,
guidance and encouragement in giving direction to this research. I am extremely grateful to
Prof. Alhassan Conteh, Liberian ambassador to Nigeria, Bro. Sowani Bility and his Colleagues
based in the United States of America, Mohammed A. Dukuly, Branch Manager Ecobank Liberia
limited, Bro. Muka K. Kamara, Bro. Musa Kamara, Chairman, Department of Mining
Engineering, University of Liberia for their immerse supports and word of encouragement
during my study.
I am grateful to all my professors and support staff of African University of Science and
Technology, (AUST) Abuja for making the difference in my life during my sojourn. My special
appreciation goes to the World Bank (WB), African Development Bank (AFDB) and Pan African
Material Institute (PAMI) for their financial supports. I also appreciate MNG- Gold mine, Kokoya
District, Bong County, through the Ministry of Lands, Mines and Energy of Liberia for providing
the space for practical trainings which greatly contributed to the successful completion of my
research.
Lastly, I am deeply indebted to my late father, Amara S. Kamara, my mother Assata Kamara, my
Mariam Kromah, my daughter, Masietta Kamara and my brothers and Sisters for their love and
encouragement. To all my class mates and PhD friends, especially, Mr. Olanrewaju Yusuf
Afolabi,
appreciate you for the wonderful time together. You will always remain ingrained in my mind
where ever I go.

vi
DEDICATION
I am deeply humbled and honored to dedicate this thesis to my beloved wife, daughter and my
parents for their unconditional love, support and prayers offered during my sojourn in acquiring
quality education.

vii
TABLE OF CONTENTS
DECLARATION…………………………………………………………………………………………………………………………. iii
ABSTRACT…………………………………………………………………………………………………………………………….... iv
ACKNOWLEDGEMENT………………………………………………………………………………………………………………vi
DEDICATION…………………………………………………………………………………………………………………………… vii
TABLE OF CONTENTS……………………………………………………………………………………………………………. viii
LIST OF FIGURES……………………………………………………………………………………………………………………… xi
LIST OF TABLES………………………………………………………………………………………………………………………. Xii
LIST OF ABBREVIATIONS………………………………………………………………………………………………………. xiii
CHAPTER ONE……………………………………………………………………..........................................................1
INTRODUCTION………………………………………………………………............................................................1
1.1 Background to the Study………………………………………….............................................................1
1.2 Statement of the Problem………………………………………………………………………………………………….4
1.3 Objective of the Study………………………………………...................................................................6
1.4 Importance of the Study ……………………………………................................................................7
1.5 The research questions…………………………………………….............................................................7
1.6 Scope and limitation of the research………………………………………………………………………………….7
1.6.1 Scope of the research……………………………………………………………………………………………………….8
1.6.2 Limitation of the research………………………………………………………………………………………….…....8
CHAPTER TWO………………………………………………………………………………………………………………………....9
Literature review……………………………………………………………………………………………………………………….9
2.1 Geology of Liberia………………………………………………………………………………………………………….….10
2.2 Climate and vegetation……………………………………………………………………………………………….…….11
2.2.1 Gold formation………………………………………………………………………………………………………….……13

viii
2.2.2 Local geology………………………………………………………………………………………………………….………14
2.3 Hydrogeological condition of MNG-gold mine…………………………………………………………….……15
2.3.1 Surface water flow and pit discharge…………………………………………………………………….………16
2.3.2 Groundwater quality…………………………………………………………………………………………………..16
2.3.3 General concept of surface mining……………………………………………………………………………..17
2.4 Environmental impact of gold on mining activities………………………………………………….……18
2.4.1 Effect of heavy metals………………………………………………………………………………………………..19
2.4.2 Effect of heavy metals on soil…………………………………………………………………….………………19
2.4.3 Water pollution………………………………………………………………………………………………………….20
2.4.4 Surface water pollution………………………………………………………………………………………………21
2.4.5 Groundwater pollution……………………………………………………………………………………………….22
2.4.6 Effect of mine-water pollution……………………………………………………………………………………23
2.4.7 Air pollution……………………………………………………………………………………………………………….25
2.5 Impacts on public health……………………………………………………………………………………………….25
2.5.1 Mitigating environmental impact of mining……………………………………………………………….26
CHAPTER THREE…………………………………………………………………………………………………………………..28
Material and methodology………………………………………………………………………………….………………28
3.1 Field investigation………………………………………………………………………………………………….…….28
3.2 Study area…………………………………………………………………………………………………………. ….. ……28
3.3 Site selection……………………………………………………………………………………………………….………..29
3.4 Sampling procedures and sample management……………………………………………….………….30
3.5 Sample analysis…………………………………………………………………………………………………………….31
CHAPTER FOUR……………………………………………………………………………………………………………………33
Results and Discussions………………………………………………………………………………….……………………33
4.1 Results………………………………………………………………………………………………………………….……….33
4.2 Discussion………………………………………………………………………………………………………………........37
4.2.1 Concentration level of iron (Fe) in water and soil………………………………………………………37

ix
4.2.2 Concentration level of zinc (Zn) in water and soil…………………………………………………….38
4.2.3 Concentration level of nickel (Ni) in water and soil………………………………………………….39
4.2.4 Concentration level of manganese (Mn) in water and soil……………………………………….39
4.2.5 Concentration level of lead (Pb) in water and soil………………………………………………….40
4.2.6 Physio-chemical parameters of surface and groundwater quality, MNG-gold……….40
4.2.7 Means and standard deviation of heavy metals……………………………………………….…….41
4.3 Observation……………………………………………………………………………………………………….……….42
4.4 Future work………………………………………………………………………………………………………….…….43
CHAPTER FIVE…………………………………………………………………………………………………………….…….44
Conclusions and recommendations………………………………………………………………………………….44
5.1 Conclusions………………………………………………………………………………………………………………….44
5.2 Recommendations……………………………………………………………………………………………………….45
References…………………………………………………………………………………………………………………………47
APPENDIX I: Table of findings

x
LIST OF FIGURES
Figure 1.1: Political Map of Liberia indicating Major Areas………………………………………………….3
Figure 1.2: The Mining Sequence of the 3D Print of The Open-pit Mine, Kokoyah District….4
Figure 1.3: Map of Liberia indicating MNG-gold property, Kokoyah……………………………………6
Figure 2.1: Geological Structural Unit of Liberia………………………………………………………………….11
Figure 2.2: The eighth Statutory Districts of Bong County………………………………………………….12
Figure 2.3: The Occurrences of Gold in Liberia……………………………………………………………………14
Figure 2.4: Acid- Mine Drainage of Rinto River (Zettler et al, 2003) …… …………………………….25
Figure 3.1: Partial View of St. John River between Bong and Grand Bassa, Republic of
Liberia………………………………………………………………………………………………………………………………….29
Figure 3.2 Surface Water and Soil Sampling Locations……………………………………………………….30
Figure 4.1: Total Elementals (ppm) of concentrations water samples against the heavy metal
elements………………………………………………………………………………………………………………………………34
Figure 4.2: Variation between Temperature, Dissolved Oxygen and pH…………………………….35
Figure 4.3: Conductivity and Study area relationship………………………………………………………….35
Figure 4.4: Concentrations of selected Heavy metals in soil………………………………………………39
Figure 4.5: Groundwater Depth Level July 2019……………………………………………………………….…36

xi
LIST OF TABLES
Table 1: Dimensions of the three Open-pit Mine…………………………………………….3
Table 2: Total Occurrences of Minerals in Liberia (LEIT,2005) ……………………….15
Table 2.1: Impact of Heavy Metals on Human Health and Water (Jucan et
al.,2016) ……………………………………………………………………………………………………………24
Table 2.2: EPA/WHO Standard of Heavy Metals in Water and Sediments……….25
Table 4.1: Total Elemental Concentrations (ppm) of Heavy Metals in Water
Sample………………………………………………………………………………………………………………53
Table 4.2: Physical Parameters of Selected Study Areas In MNG-Gold Mine
between July 1, 2019 and July 30, 2019…………………………………………………………….54
Table 4.3: Value of Heavy Metal Contents (average± Standard Deviation)
Summary in water (ppm)………………………………………………………………………………...54
Table 4.4: Total Concentrations (ppm) of Heavy Metals in soil samples………….55
Table 4.5: Concentration of Heavy Metals in soil…………………………………………….55
Table 4.6: Value of Heavy Metal Contents (average ± standard deviation) in
soil……………………………………………………………………………………………………………………56
Table 4.7: Parameters of Groundwater Condition, Kokoya District, MNG-
gold………………………………………………………………………………………………………………….56
Table 4.8: Groundwater Level for the month of July 2019……………………………….57

xii
LIST OF ABBREVIATION
AAS Atomic Absorption Spectrometer
AM Arbuscular Mycorrhizal
AMD Acid Mine Drainage
AMLIB American Liberian
ARD Acid Rock Drainage
ANFO Ammonium Nitric Fuel Oil
ASM Artisanal Small- Skill Mining
Au Gold
BGM Bureau De Geologie et Mine
BGS British Geology Survey
BH Borehole
BOD Biological Oxygen Demand
Cd Cadmium
CO2 Carbon dioxide
Cr Chromium
CSZ Cestos Shear Zone
Cu Copper
CuSO4 Copper (II) sulphate
DO Dissolved Oxygen
EC Electrical Conductivity
EIAs Environmental Impact assessments
EPA Environmental Protection Agency
FAO Food and Agricultural Organization
FeOH3 Ferric Hydroxide
Ga Billion years ago,
GPS Global Position System
HCL Hydrochloric Acid
HF Hydrofluoric Acid
HM Heavy Metal
HCLO4 Perchloric Acid
HNO3 Nitric Acid
ICP-MS Inductively Coupled Plasma Mass Spectrometer
ISO International Standard Organization
KHY-LAB Kokoyah Laboratory
LEITI Liberia Extractive Industry Transparency Initiative
LGS Liberia Geological Survey

xiii
Ma Million Years Ago,
Mn Manganese
Ni Nickel
NE Northeast
NW Northwest
Pb Lead
pH Potential Hydrogen
Ppm Part per millions
SD Standard Deviation
SDWF Safe Drinking water Foundation
Na2S2O5 Sodium metabisulfite
TDS Total Dissolved Solid
TSF Tailing Storage Facility
TTG Tonalite-Trondhjemite-granodiorite
USGS United States Geological Survey
WHO World Health Organization
Zn Zinc

xiv

1
CHAPTER 1
INTRODUCTION
1.1 BACKGROUND TO THE STUDY
Mining and ore beneficiation processes, such as grinding, ore concentration processes and
disposal of tailings provide obvious sources of contamination in the surface environment, along
with mine and mill waste water [1]. Throughout history, mining in the world has been regarded
as destructive due to its anthropogenic activities on the environment. The release of heavy
metals is the major cause of environmental problems affecting communities where mining is
done and steps must be taken to safeguard the environment against pollution such as water
and soil pollution during and after mining.
Some of these metals are hazardous and carcinogenic and can cause serious health problems in
humans if they are absorbed into the human body through the food chain. In recent history of
mining, metal contamination has created potential environmental issues for the people and the
environment. As a result of this, in some places where mining is done, the people have
instigated violence against mining company due to their failure to control wastes emanating
from processing plants. Sometimes untreated mining wastes are discharged directly into rivers
or nearby streams [2].
These rivers are used by people either for irrigation purposes during the dry season or for
domestic purposes. The presence of heavy metals in aquatic environments has contributed to a
life-threatening situation to marine life. The sources of pollutants are industrial mining and ore
beneficiation, domestic and agricultural wastes. Based on several investigations it has been
established that, heavy metals concentrate in the sediment samples [3]. According to [4],
sediments contain toxins that may accumulate in fish indirectly through the food web or
indirectly from exposure due to re-suspended sediments. Low concentrations of some trace
metals, such as Cu, Mn, Zn and Fe are good for all living organisms while some have been
detected in biotas, sediments, and water [5]. Toxic metals can change many physiological
processes and biochemical parameters in tissues including structural deformations in aquatic

2
animals [6]. Being non-biodegradable, they can be concentrated along the food chain,
producing their toxic effects at points often far away from the source of pollution [7]. In
addition, with anthropogenic activities, ultimate disposal of treated and untreated waste
effluents containing toxic metals as well as metal chelates [8] from different industries, e.g.,
tannery, steel plants, battery industries, thermal power plants, etc. and also the indiscriminate
use of heavy metal-containing fertilizers and pesticide in agriculture results in deterioration of
water quality, rendering serious environmental problems posing threat on human beings [9]
and biodiversity [10]. Prolonged exposure to heavy metals such as cadmium, copper, lead,
nickel, and zinc can cause deleterious health effects in human [11]. Previous studies revealed
carcinogenic effects of several heavy metals such as cadmium (Cd), chromium (Cr), lead (Pb),
mercury (Hg) and arsenic (As) [12].
The MNG-Gold is the Turkish company which has been mining gold in Liberia since 2015. It has
a property ownership which stretches over 537 km2 piece of concession land. The company is
situated in the Kokoya district, Bong County, Liberia, approximately 50 km southeast of
Gbarnga, the capital city of Bong County and some 170 km northeast of Monrovia, the capital
city of Liberia as presented in Figure 1.1. According to the mineral potential map of Liberia, the
mineral predominantly found and mined is gold. The mine established in this area is an open
pit. It comprises of three open pits; namely, Arhavi, Istanbu and Adana respectively. The length,
width and depth of the three open pit mines are presented in Table 1 and Figure 1.2. At the top
of each pit consists of the saprolite zone and moving into formation of the soil are composed of
hard competent rocks. Extending deep into the ground formation, there is major intrusion of
the quartz and amphibolite into gold belt. The rock type is gneiss, amphibolite and quartzite
associated with the gold. The climatic condition consists of both rainy and dry seasons. Each
season has six-month period. The rainy season begins May and ends in October while the dry
season kicks up November to April respectively. Prior to the coming of this multinational
company, the people of Kokoya were engaged in artisanal and small-scale mining activities for
their livelihood. They were also involved with subsistent farming which benefited them to some
extent.

3
Figure 1.1: Political Map of Liberia indicating major areas
Table 1: Dimensions of the Three open-pit Mine
Open Pit Length(M) Width(M) Area(M2) Depth(M)
Arhavi 460 220 101200 120
Istanbul 170 165 28050 110
Adana 365 315 114975 95

4
Figure 1.2: The Mining Sequence of the 3D Print of The Open-Pit Mine, Kokoyah District
1.2 STATEMENT OF THE PROBLEM
Liberia is blessed with abundant mineral resources such as gold, diamond and iron ore but
many parts of the country are yet to be explored. Prior to the outbreak of the civil conflict in
1989, Liberia was among the leading exporters of iron ore in the world. In 2012, exploration
activities were previously conducted by Amlib in Kokoya, Bong county on the shear zone at
KleKle, now owned by MNG Gold, and several broad zones of gold mineralization have been
defined [13]. Due to limited funds, the investment was later sold to MNG Gold.
Initially, the American Liberian (AMLIB) joint venture company did a resource estimate on the
licensed property worth 380,000 oz of gold before being subsequently sold to MNG gold in
2014. As presented in Figure 1.3, MNG Gold project area is located in the central part of Liberia.
It is situated between three counties of Liberia; namely, Bong, Nimba and Grand Bassa
respectively. The area also has access to train track which runs from Yekepa, Nimba county to
the port city of Buchanan, Grand Bassa county. It is the transport route for the iron ore being
mined by Arcelor Mittal in Liberia. Subsequently, the project was later expanded to
approximately 600,000 oz after being taken over by MNG. The project also has mineable
underground potential. The reginal morphology of this area is mainly associated with Archaen

5
West African craton which comprises mainly Precambrian igneous and metamorphic rock types
called the Liberia Age Province (2700Mya). The gold is embedded in quartz vein-deposit and
strongly deformed in amphibolites and gneisses. The ore is extracted/mined by open pit
method. In the mine, explosives such as Ammonium Nitrate and fuel oil (ANFO) are used to
blast massive ore containing hard competent rocks. However, the blasting of the rocks
sometimes releases dust in the environment, which eventually settle down in the river or
nearby streams. As these rocks are fragmented into smaller boulders, they are transported by
trucks from the run-off mine and then stockpiled. At the stockpile, separation of high grade
from the low grade is considered. Subsequently, materials are fed into the grizzly hopper which
is robustly built to accommodate materials about 1m in size to move into the jaw crusher. The
jaw crusher which contains a movable jaw and fixed jaw, crushes the materials then transports
through conveyed belts and delivers it to the grinding mill for ore beneficiation.
During the beneficiation process, several methods are employed to recover the gold. For
example, cyanide is used to dissolve the gold in solution before it is adsorbed by activated
carbon. The loaded carbon is subsequently removed from the circuit and sent to elution where
the gold is stripped off the carbon back into solution, electrowon and smelted into bars. The
remaining ‘barren’ solution is sent to detoxification tanks where sodium metabisulfite (Na2S2O5)
and copper (II) sulphate (CuSO4) are added to destroy the cyanide. The waste materials from
the processing units are then discharged into the tailing dams. According to the company
regulation, the maximum allowed cyanide concentration that should be discharged into the
dam is ±50 ppm (MNG gold, 2019). In some cases, the cyanide concentration exceeds the
maximum allowable concentration. If such is observed, more copper sulfate and sodium
metabisulfite is added to the detoxification tanks to avoid major pollution. Currently, the MNG
gold has two dams. The first tailing dam constructed collapsed in 2018 due to structure failure.
As a result of the collapsing of the dam, overflow of waste materials from the dam ran into
surrounding swarms and streams which caused environmental problems. The next dam
constructed in recent times also receive wastes from the processing plant and subsequently
send them to another dam which is 2.5 km away from the new storage facility or tailing dam. At
this dam, the waste is treated before discharging into the St. John River.

6
According to report by [14], metallic tastes of the contaminated water of the mine can stain the
surfaces and cause an unpleasant water taste. Water pH also causes corrosion of metal
components used in industry [15]. This can lead to grounding of machine tools.
Figure1.3: Map of Liberia indicating MNG gold property, Kokoyah.
Source Available at AZOMining.com
1.3 OBJECTIVE OF THE STUDY
The objectives of this research were to investigate the contamination level of heavy metals in
water and soil along with their physio-chemical parameters (temperature, dissolved oxygen
content, pH and electrical conductivity) collected from different locations in MNG gold, and to
recommend the preventive mechanisms for the mitigations/remediations of pollution level of
water and soil in the environment.

7
1.4 IMPORTANCE OF THE STUDY
Mining activities come with lot of social-economic benefits and consequences. This study is
important for two reasons. Firstly, mining activities create potential economic investment in the
country leading to employment opportunity for both unskilled and skilled workers. Secondly,
the consequence is that, it creates environmental problems which may lead to land
degradation, habitat alteration and water and air pollution. So, this research leads us to review
the impacts of mining activities done on the environment in order to ensure a safe working
environment. In so doing, mining companies may be compelled to treat wastes properly before
releasing it into the environment.
1.5 THE RESEARCH QUESTIONS
The questions which arise during the research are as follows:
1.0 What is the mining method used to extract the gold from their bed?
2.0 Is there any hydrological challenge? If yes, how can it be solved?
3.0 What are the heavy metals and other chemicals released from the plant?
4.0 What is the source of water in the pit? (groundwater or rainwater)
As a result, the above questions are found in previous and subsequent chapters.
8
1.6 SCOPE AND LIMITATION OF THE RESEARCH
1.6.1 Scope of the research
The research reviewed past works along with present ones on heavy metal concentration in soil
and water. Information gathered from literature enabled us to conduct sampling. After
collecting samples for both water and soil, they were sent to the KYH- lab-3602 to determine
the heavy metal levels in both soils and waters. Other parameters assessed were pH,
temperature, dissolved oxygen (DO) and electrical conductivity (EC).
1.6.2 Limitation of the research
In the context of this research, tests were conducted on soil, surface and underground water
samples to determine the pH, EC, temperature, DO and heavy metals respectively. However,
the turbidity, salinity of water and compatibility test could not be determined.

9
CHAPTER TWO
LITERATURE SURVEY
In the past and the present, several works detailing heavy metal contents in both soil and water
have been reviewed and published by many writers and publishers in mining journal and other
significant documents [16]. Gold which has symbol Au and atomic weight 196.96 is a heavy
metal. Although there is no precise definition of what a heavy metal is, density in most cases
taken to be the defining factor. Heavy metals are thus commonly defined as those having
atomic weight and specific density at least six times greater than that of water [17]. When
heavy metals such as lead, cadmium, mercury and the metalloid arsenic are exposed to the
environment in high concentrates, due to their multiple industrial, domestic, agricultural,
medical and technological applications, there is wide distribution in the environment; raising
concerns over their potential effects on human health and the environment. The presence of
heavy metals in soil and water depends on several factors which include chemical species, the
dose and amount of exposure. Also, the heavy metals such as, arsenic, cadmium, chromium,
lead and mercury rank among the priority metals that are of public health concern. According
to the U.S. Environmental Protection Agency, and the International Agency for Research on
cancer [18] they consider heavy metals as systemic toxicants that damage human’s organ, even
at lower levels of exposure.
Also, prolonged and contaminated waste water that is subsequently used for irrigation may
lead to the accumulation of heavy metals in soil and plant. Food poisoning and potential health
risks cause most serious environmental problems [19]. At lower concentration, some of the
heavy metals such as Zn, Mn, Ni and Cu behave as micro-nutrients; however, they become toxic
at higher level. According to [20], health risks due to heavy metal pollution of soil has been
widespread in mining activities. In comparison, crops and vegetables grown in contaminated
soils with heavy metals have more accumulation of heavy metals than those grown in
uncontaminated soil [21].

10
2.1 GEOLOGY OF LIBERIA
Liberia is a part of the West Africa Craton which constitutes two major features of the Archean
to early Proterozoic terranes: The Man Shield and the Reguibat Shield. The Man Shield
composed of the Archean basement of Liberian Age (3.0 to 2.5Ga) stretches across central and
western Liberia and is characterized by TTG gneisses, locally migmatitic, which are folded with
supracrustal metavolcanics and metasedimentary rocks and intruded by late-Archean granitoids
dated at c. 2800Ma [22]. In the eastern and northern direction, the Man Shield is overlain by
Birimian rocks of Paleoproterozoic age which is presented in (Figure 2.1).
The Archean Liberian-Age province is separated from eastern Birimian Ebumian- Age province
by the regional, northeast trending Cestos shear Zone (CSZ). The Liberian province is described
as a typical Archean granite- greenstone type terrane in that it can be subdivided into
infracrustal rocks, supracrustal rocks and basic and ultrabasic igneous intrusion. Most of the
rocks Baoule’- Mossi domain in Liberia, extending west from the Cote d’Ivoire border to
Greenville, comprise tightly folded paragneiss, mimatite and amphibolite [23]. These rocks have
been considered to be part of the Birimian sequence [24], but they are generally poorly known
with little published modern research. Basically, there are three age province rocks formed in
Liberia. These comprise of the Liberian Age province, the Pan African- Age rock and the
Eburnean Age province (Figure 2.1). Liberian Age Province (2600-2700 million years) consists of
granitic gneiss and granites which are mainly made up metasedimentary, containing schists,
quartzites and iron formations. Eburnean Age province (2000 million years) composed of
Paleoproterozoic which is an extension of the Baole-Mossi Domain of the Ivory Coast and
contains less gneiss than the Liberian Age province [25] and underlain by isoclinally folded
biotite- rich paragneiss. Pan African- Age Province (c. 550Ma) runs parallel to the coast, extends
into northwest Liberia and consists of elongate and fault- bounded zone. Pan African province
has a series of south- west dipping faults associated with intense zones of mylonite. It is formed
along much of Liberia’s coastline. They are associated with metasedimentary and mafic igneous
rocks such as granitic and noritic.

11
Figure 2.1: Geologic Structural Unit of Liberia
2.2 CLIMATE AND VEGETATION
Liberia is bounded on the west coast of Africa within the Mano river basin. It is bounded on the
Atlantic Ocean in the south, Sierra Leone in the west, Guinea in the north and Ivory Coast in the
east. Along the African continent, Liberia is located 6.42810 N and 9.42950 W which is
characterized by predominantly tropical humid climate. It extends few degrees north above the
equator and lies south of the Tropic of Cancer. The total land area of Liberia is estimated to be
111,370 Km2. Out of the total number, 96,160 km2 is covered by land while the remaining
15,210 km2 is covered by water. The climatic condition in Liberia comprises of two seasons: the
rainy and dry season. The rainy season begins May then reaches a maximum in July through
September, and declines in October whereas the dry season kicks up in mid-October and ends
in April. However, on the coastal plain, especially, Monrovia and Buchanan receive the highest
number of rainfalls at the beginning of the rainy season. Also, they experienced a short period
rainfall in October. This period is known as ‘’middle dries’’. In the central part of the country as

12
shown in Figure 2.2, the rainy season kicks off in April then continues for a period of three
months and proceeds by a drier season for a maximum of three months. Between September
to November, there is little bit of rainfalls which is sometimes refer to as ‘’middle dries. The
short dry season has little effect on the people. This is because the Harmattan or cool
Northeastern winds which sweep across the continent reaches Liberia in December and
February cause intense amounts of dust with low cold temperature during the night. The
average annual rainfall along the coast of Liberia is at least 4000mm and reduces to 1300mm
extending to the northern part of Savannah belts [26]. The overall temperature of Liberia varies
between 270C to 320C during the day while it ranges between 210Cto 240C during the night
respectively. The minimum average rainfall temperature of Kokoya is 25.50C, and the maximum
precipitation is 2076mm. Along the coastal parts of Liberia, study has shown that the relative
air humidity varies from 90% to 100% during the rainy season (July to August) and from 80% to
85% during the dry season (January to February).
The word vegetation means assemblages of plant species and ground covering the surface of
the earth (Burrow, 1990) [27]. In Liberia, vegetation can be characterized into three main zones.
They are: (Savannah woodland), northern Savannah and the tropical rainforest [28]. The
Savanna vegetation is mainly caused by anthropogenic activities such as clearing of land to
make farming. The northern Savanna region in Liberia is covered with elephant grass which are
intermixed with scattered tress, woodland and patches of forest. These types of forest are
mainly found in Lofa and Nimba counties. The third type of vegetation is the tropical rainforest.
Over the years, this rainforest has been progressively reduced at the rate of 1.5% per annum.
This is due to shifting cultivation and the felling of trees in the Liberian forest.
Figure 2.2: The eighth Statutory districts of Bong county

13
2.2.1 Gold formation
Liberia is endowed with many mineral resources but chief resources are gold, diamond and iron
ore. 90 percent of Liberia lies within the Birimian and Archean which have most productive
gold- bearing terranes in the world. Nearly 600 gold occurrences were recorded by USGS in
Liberia, with the gold placer deposits accounting for almost 80 percent of the total [29].
Several ‘gold belts’ have been identified based on the distribution of alluvial placer deposits.
These are located in Bukon Jedeh, Putu Range- Zwedru, Cestos River, St. John River-Kokoyah,
Mano River-Wologizi Range, Masawo-ZoloWo- Zorzor, Bopolu-Wuesua-Tawalata and Bea
Mountain. A good number of alluvial placer deposits are formed in some of these areas. The
widespread occurrence of placer deposits indicates potential for bedrock-hosted gold
mineralization. Bedrock gold deposits along the Archean and Proterozoic terranes in West
Africa are highly mineralized shear zone and structurally-controlled quartz veins, greenstone-
hosted gold mineralization.
Economically, the most important gold occurrences in the Archean greenstone belts are found
in the north-west of Liberia. It is mainly associated with lineaments and shear zone. New Liberty
Gold Mine is a shear zone-hosted gold deposit in Archean age rocks with greenstone belt.
Another major gold occurrence occurs north- east of New Liberty gold. In addition, Weaju and
Ndablama are currently undergoing significant exploration. Ndablama is hosted in the sheared
ultramafic and mafic rocks intercalated in a gneiss sequence above a buried granitic body. In
Ndablama, based on geology investigation, the mineral resource estimate including (indicated +
inferred) consists of 901000 ounces of gold at grade of 1.6g/t Au.
In the Kpo Mountain Gbarpolu county, several mineralization was discovered due to recent
exploration activities which identified major gold-bearing quartz veins. To the north of the Kpo
Range, gold-bearing vein, are associated with hosted granitic gneiss. Also, this rock occurs in the
lucky Hill (Gblita) area. Mineralization appears to be based on the lithological contact between
granite and granitic gneiss

14
2.2.2 LOCAL GEOLOGY
Kokoya is situated within Liberia Age province. It constitutes the metamorphic rocks which
compose mainly structural grains. Also, several deformations are recorded in the metamorphic
rocks, comprising folding and faulting. Those metamorphic rocks found in kokoya are strongly
deformed in amphibolite, gneiss and quartzite. Moreover, these metamorphic origins have
undergone poly-phase deformation and display number of cross-cutting features. Several areas
in Kokoyah have undergone high degrees of partial melting resulting in migmatitic textures.
However, gold mineralization occurs along a series of broadly NE-trending, NW-dipping, shears
and veins as shown in Figure 2.3. Table 2 shows the total mineral occurrences of Liberia.
Figure 2.3: the occurrences of gold in Liberia.
Source: sciencedirect.com

15
Table 2 Total Occurrences of Minerals in Liberia (LEIT, 2015)
No. Ore type Number of occurrences
1 Barite 14
2 Bauxite 9
3 Chromite 12
4 Copper 14
5 Corundum 31
6 Diamond 158
7 Gold 258
8 Heavy minerals 19
9 Iron 172
10 Kyanite 5
11 Vanadium 5
12 Manganese 25
13 Molybdenum 4
14 Nickel 8
15 Niobium, tantalum 22
16 Phosphorite 2
17 Platinum 2
18 Rutile 94
19 Sulfur 3
20 Tin 10
21 Titanium 14
22 Tungsten 9
23 Uranium 3
24 Wolframite 2
25 Zinc 2
Total - 897
2.3 THE HYDROGEOLOGICAL CONDITION OF MNG GOLD MINE
Following a thoroughly reviewed process of the local geology of MNG-gold, Kokoyah, it has
been established that the hydrogeological condition of the area is challenged as a result of
mining activities characterized by influx of both surface and groundwater into mine pit. The
local geology describes in Section 2.2.2 indicates that gold is embedded in amphibolite, gneiss
and quartzite respectively. At the northeast direction of the MNG gold, lies the St. John River
which flows from the north of Guinea into Liberia. Much of the hydrogeological information

16
about Liberia and its environs have not been studied in full details due to limited research
capacity. However, the Bureau de Recherche Geologie et Mines (BRGM) has produced a
hydrogeological map of Africa as part of Africa GIS network’s ongoing project for mapping
Africa resources. This map indicates that groundwaters in several parts of Africa are connected
to small aquifer zones. The St. John River which is located approximately 2.5 km away from the
mine site serves as a discharge point.
2.3.1 SURFACE WATER FLOW AND PIT DISCHARGE
Surface water is any water that collects on the surface of the earth. This includes oceans, seas,
lakes, rivers or wetlands. The climatic condition of Liberia is categorized into two seasons. They
are: the rainy and dry seasons. The dry season runs from November to April while the rainy
season runs from May to October. During the rainy season, the mine is heavily flooded with
water, sediment laden flood waters, rich in organic matter and nutrients which causes risks for
operational activities, miners’ safeties and environmental impact. Similarly, the problems of
acid- mine drainage, excess inflow of rain water to mine pit affect the extraction processes of
the metals. At the pick of the rainy season the mine gets flooded with water to the extent that
it become inaccessible to mine. As a result, the Global water pump 8GHH and 4GSH with the
capacities 605m3/h and 313m3/h are being installed to dewater the mine so that the extraction
process can be effective and efficient.
2.3.2 Groundwater quality
Prior to investigating the groundwater quality in MNG, on September 24, 2018, a tailing storage
facility containing slurry from MNG-gold’s processing plants collapsed and ran in nearby Sien
Creek and swarm. As a result of this incident, up to 30 people from the surrounding villages
were hospitalized due to the effects of the spillage over of the slurry. The plant was shut down
for a while to improve the environmental condition. In July 2019, water samples around the
mine in Kokoyah were collected from five different locations.

17
2.3.3 General Concept of surface Mining
By definition, surface mining is the removal of soil and rock overlying the mineral deposit (the
overburden) surface mining includes open-pit mining and strip mining. Both open-pit and strip-
mining methods constitute more than 90% worldwide surface production. However, the major
distinction between these two mining methods are the geographical location of the ore body
and the mode of mechanical extraction. Strip mining (open cast mining) techniques involve the
extraction of ore bodies that are near the surface and relatively flat or tabular in nature and
mineral seams. In strip mining, equipment such as shovels, trucks, drag lines, bucket wheel
excavators and scrapers are used. Most strip mines process non-hard rock deposits such as
coal. Open-pit mining involves the removal of hard rock ore that is disseminated and/ or
located in deep seems and is typically limited to extraction by shovel and truck equipment. For
example, gold, silver and copper are mined by open pit method. Another surface mining
method is quarrying mining. It is specialized open-pit mining technique wherein solid rock with
a high degree of consolidation and density is extracted from localized deposits quarried
materials are either crushed and broken to produce aggregate or building stone, such as
dolomite and limestone, or combined with other chemical to produce cement and lime.
Dimension stone such as flagstone, granite, limestone, marble, sandstone and slate represent a
second class of quarried minerals. Sometimes it becomes very difficult to mine some ore bodies
by strip or open pit methods due to its irregular size and shape. More advanced surgical
method such as underground mining is employed to extract the ore. The factors that justify
open pit mining includes: The terrain and elevation of the site and region, its remoteness,
climate, infrastructure (roads, power and water supply, regulatory and environmental
requirements, slope stability, overburden disposal and product transportation).
Production and equipment: mechanical drilling and blasting are the first steps in extracting ore
from most developed open-pit mines and are the most common method used to remove hard
rock overburden. Explosives are used. A commonly used hard rock explosive is ammonium
nitrate, fuel oil and emulsifier. Also, drilling equipment is selected on the basis of the nature of

18
the ore and the speed and depth of the holes necessary to fracture a specified tonnage of ore
per day.
Loading: surface mining is now typically conducted utilizing table shovels, front- end loaders or
hydraulic shovels. In open-pit mining, loading equipment is matched with haul trucks that can
be loaded in three to five cycles or passes of the shovels; however, various factors determine
the preference of loading equipment. Haulage: haulage in open- pit and strip mine is most
commonly accomplished by haul trucks. The role of trucks in many surface mines is restricted to
cycling between the loading zone and the transfer point such as an in- pit crushing station or
conveyance system.
2.4 ENVIRONMENTAL IMPACT OF GOLD ON MINING ACTIVITIES
Keeping wastes for irrigation over long period may lead to the accumulation of heavy metals in
agricultural soils and plants. Biological toxic effects of heavy metals depend upon the
concentrations and oxidation states of metals, sources and mode of deposition [30]. Like other
creatures, humans should make the environment clean and safe, otherwise they cannot live,
but unlike the others, human should choose the type and amounts of these changes [31].
Heavy metals are naturally occurring elements that have atomic weight and a density greater
than that of water. However, most environmental problems originate from heavy metals. It is
also widespread by industries where mining is practiced. Metal contamination has received
huge condemnation from rights group as a result of toxicity issues. Multiple industrial,
domestic, agricultural, medical and technological applications have led to their wide
distribution in the environment; raising concerns over their potential effect on human health
and environment. Their toxicity depends on several factors including the dose, route of
exposure and chemical species, as well as the age, gender, genetics and nutritional status of the
exposed individuals in the gold mining areas. Because of their high degree of toxicity, arsenic,
cadmium, chromium, lead and mercury rank among the priority metals that are of public health
significance. The heavy metals are considered systemic toxicants that are known to induce
multiple organs damage, even at lower level of exposure [32].

19
2.4.1 EFFECTS OF HEAVY METALS
Mining, mineral processing and metallurgical extraction are the three principal activities of gold
mining industries which contribute to the production of large volume of wastes; especially
when the metal contents in an ore is very low to process. Mineral processing also known as
beneficiation aims to physically separate and concentrate the ore mineral(s) using physical,
chemical and sometimes microbiological techniques. Metallurgical extraction breaks the
crystallographic bonds in the ore mineral in order to recover the desire element or compound
[33]. Large quantities of waste are produced during this activity particularly in gold mines which
release over 99% of extracted ore as waste to the environment [34].
Tailings are the major waste produced from gold extraction and they contain high amounts of
heavy metals (HM). These metals may be dispersed in an uncontrolled manner into surrounding
environments on exposure to water or through dispersal by wind. The presence of elevated
concentrations of Heavy metals in the environment is a serious health issue worldwide due to
their non-degradative nature which makes them persistent and thereby exert long- term effects
on the ecosystem [35]. Heavy metals affect the natural population of bacterial in soils. This
leads to loss of bacterial species responsible for material cycling with a consequent negative
effect on ecosystem functioning [36].
2.4.2 EFFECT OF HEAVY METALS ON SOIL
Soil contamination of heavy metals is the most important apprehension throughout the
industrialized world [37]. Heavy metal population not only result in adverse effects on various
parameters relating to plant quality and yield but also cause changes in the size, composition
and activity of the microbial community [38]. Therefore, heavy metals are considered as one of
the major sources of soil pollution. Heavy metal pollution is caused by various metals especially
Cu, Ni, Cd, Zn, Cr, and Pb [39].

20
Heavy metals are present in industrial wastes, agricultural processes, domestic wastes and
vehicles emission, and they are considered as one of the most serious pollutants as a result of
their high toxicity [40]. Heavy metals exhibit toxic effects towards soil biota by affecting key
microbial processes and decrease the number and activity of soil microorganisms. Conversely,
long-term heavy metal effects can increase bacterial community tolerance as well as the
tolerance of fungi such as Arbuscular mycorrhizal (AM) fungi, which can play an important role
in the restoration of contaminated ecosystem [41]. Cu inhibits b-glucosidase activity more than
cellulose activity. Pb decreases the activities of urease, catalase, invertase and acid
phosphatase significantly. Cd contamination has a negative effect on the activities of protease,
urease, alkaline phosphatase and arylsulfatase but no significant effect on that of invertase.
Each soil enzyme exhibits a different sensitivity of heavy metals.
Mining is the major source of soil contamination. It destroys large areas of farming lands near
mining project. According to a study commissioned by the European Union: ‘’Mining operations
routinely modify the surrounding landscape by exposing previously undisturbed earthen
materials. Finally, soils contaminated from chemical spills and residuals at mine sites may pose
a direct contact risk when these materials are misused as fill materials, ornamental landscaping,
or soil supplements [42].
2.4.3 WATER POLLUTION
To begin with, water is the most vital resource used for the existence of human beings and
without which; human cannot survive. Orlaniran [43] defined water pollution to be the
presence of excessive amounts of a hazard (pollutants) in water in such a way that it is no
longer suitable for drinking, bathing, cooking or other uses. Pollution is the introduction of a
contamination into the environment [44]. Generally, pollution may also be defined when
natural or induced change affects the natural quality of water which renders it unstable or
dangerous to food, human and animal health, industry, agriculture, fishing, etc.
Basically, water pollution is influenced by anthropogenic activities which cause pollutants to
enter natural waters. Water pollution containing solid or liquid wastes discharge directly into

21
river, sea or ocean. The wastes that contribute towards water pollution may be grouped into
three: sewage, industrial and agricultural wastes respectively. It originates from domestic and
commercial premises, land drains, some industrial plants and agricultural sites. Other industrial
waste is discharged directly into rivers, canals and the sea and not into sewage systems.
Furthermore, sewage treatment can be subdivided into three stages. They are preliminary,
primary and secondary treatments. The preliminary treatment removes large suspended debris
and solid particles by screen. The primary stage removes approximately 55% of settleable solids
as sludge, and 35% reduction in biological oxygen demand (BOD) value. The sewage at this
point contain suspended colloids, finely divided solids and dissolved solutes. Lastly, secondary
stage activates sludge method which applies in the modern sewage treatment plants. Also, the
primary effluent is agitated and aerated in large tanks, in the presence of flocculent suspension
of activated sludge containing microorganisms. Industrial wastes are located near rivers or
fresh water streams. These are responsible for discharging their untreated effluents into rivers
like highly toxic heavy metals such as chromium, arsenic, lead, mercury, etc. along with
hazardous organic and inorganic wastes (e.g., acids, alkalies, cyanides, chlorides, etc.).
Agricultural wastes comprise of manure, fertilizers, pesticides, wastes form farms, poultry
farms, salts and silt are drained as run-off from agricultural lands. Similarly, the expansion of
human population, industrial and agricultural activities is the major causes of pollution in our
environment [45].
2.4.4 SURFACE WATER POLLUTION
As pollutants enter stream, river or lake they give rise to surface water pollution. Surface water
pollution is the major problem in the mining industry. Ore is washed or processed in its slurry
form for enrichment and after the extraction of useful mineral, tailings are rejected and stored
in big ponds. These ponds may overflow during the rainy season or they may even breach their
banks, carrying huge quantities of suspended and dissolved solid into surrounding areas [46-
47].

22
The silt may get deposited in water courses or agricultural lands. Such waters may become unfit
for direct usage and to make this water fit for consumption, elaborate treatment has to be
done at additional cost. The spill-over of toxic material like heavy metal is a major problem in
the iron ore mining sites were water becomes turbid [48]. However, many aquatic organisms
live in the sea and ocean. As the temperature level in the water increases, life become very
inhospitable for aquatic organisms to survive. Furthermore, the increase in Earth’s water
temperature is caused by global warming. Global warming is the average global temperature
increases due to the greenhouse effect. For example, gases from the mine, burning of fossil fuel
releases greenhouse gases in the form of CO2, into the atmosphere thus causing intense heat
back in the earth’s atmosphere.
2.4.5 GROUNDWATER POLLUTION
Groundwater pollution may occur from the top or below the water table. If a contaminant is
spilled on the surface of the ground or injected into the ground above the water table, it may
have to move through numerous layers of soil and underlying materials before it reaches the
groundwater [49]. As the contaminants move through these layers, a number of processes
come in operation, (e.g. filtration, dilution, oxidation and biological decay), that can lessen the
eventual impact of the substances once it finally reaches the groundwater. The distance
between the groundwater and place of contamination introduction and length of time affects
the effectiveness of these processes [50].
Substances which contaminate groundwater can be divided into two basic categories,
substances that occur naturally and substances produced or introduced by man’s activities.
Substances that occur naturally included minerals such as iron, calcium, selenium etc. and
substances resulting from man’s activities includes synthetic organic chemicals and
hydrocarbons, pesticides, petroleum products etc.) landfill and pond leachates [51]. One of the
significant sources of groundwater contamination is the surface impoundments used by
municipalities and industries for disposing off variety of liquid wastes and wastewater [52].

23
Also, the percolation of toxic components from ore waste and storage yards in mining areas
causes’ groundwater pollution. As a result, land also gets polluted [53]. Drinking water from
contaminated ground well can cause serious health problems. Diseases related to hepatitis and
dysentery are caused by contamination from septic tank wastes, contaminated groundwater
can affect the wildlife.
2.4.6 EFFECT OF MINE- WATER POLLUTION
Major water pollution emanates from mining activities. Basically, there are four main types of
mine water pollution which adversely impact the water quality; they are: acid mine drainage
(AMD), heavy metal contamination and leaching, processing chemical pollution and erosion and
sedimentation respectively. Acid mine drainage or acid rock drainage (ARD) is one of the major
problems affecting waters. According to [54], acid mine drainage is also characterized by high
total dissolved solids (TDS), high sulphates and high levels of heavy metals, particularly iron,
manganese, nickel and cobalt. As shown in table 2.1, such that, the presence of low pH, high
electrical conductivity, iron, manganese and aluminum contribute to the existence of heavy
metals. However, dark, reddish-brown water and pH as low as 2.5 persist at the site [55]. Acid
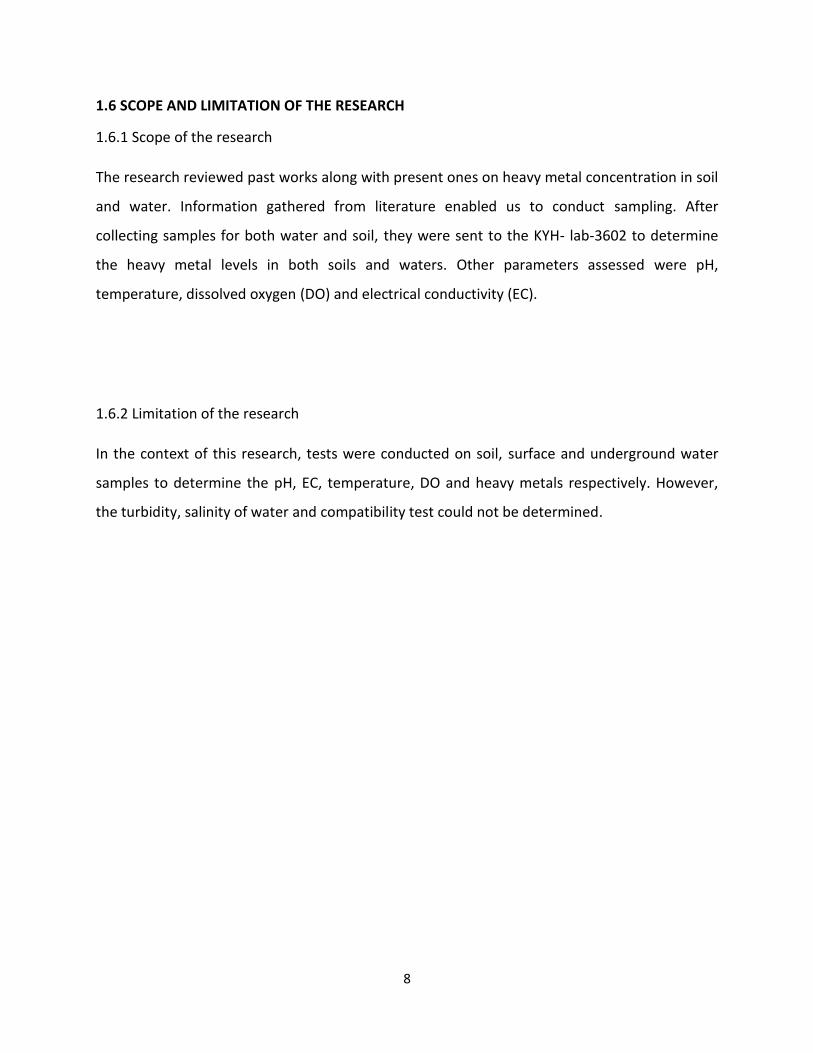
mine drainage as shown in Figure 2.4, affects not only surface and groundwater but also
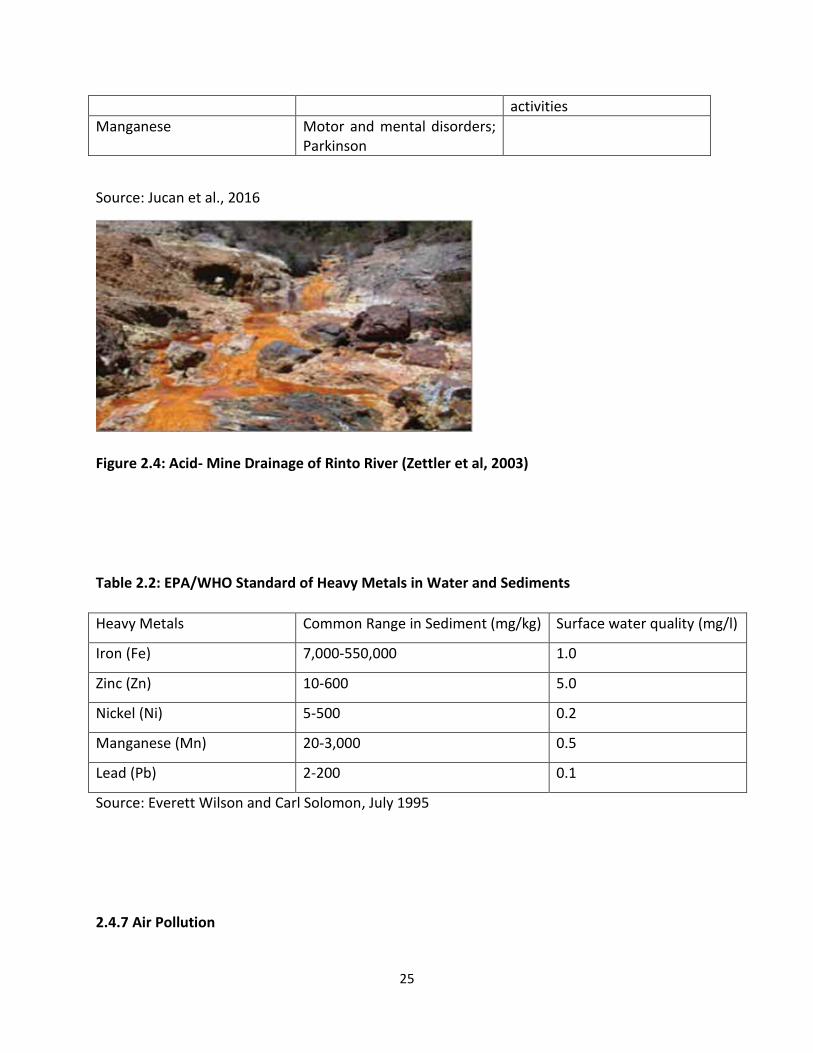
destroy the soil and water quality [56]. Also, Table 2.2 shows the Environmental Protection
Agency and World Health Organization standard for some heavy metals.
During mining operation, huge volume of rocks composed of sulphide minerals are mined from
open pits, which reacts with water and oxygen if exposed, to produce sulphuric acid. As the
water levels reaches acidic contents, Thiobacillus ferroxidans are found thereby accelerating
the oxidation and acidification. As it shown in Figure 2.4, acid is transported and deposited into
rivers or stream by means of rainy water and surface drainage.
Pollution of surface and ground water bodies are caused by leaching and heavy metals to the
earth crust. They have particularly existed in mining communities for years as a major pollution
[57]. Thirdly, processing chemical pollution occurs when chemical agent (such as cyanide or
sulphuric acid used by mining companies to separate the target mineral from the ore) spill, leak,

24
or leach from the mine site into nearby water bodies. These chemicals can be highly toxic to
humans and wide life.
Lastly, mineral development poses major challenge to rock and soil. Rock and soil are used to
maintain roads, open pits and waster impoundments. Adequate prevention and control
strategies should be used to prevent soil and water erosion respectively.
Table 2.1: Impact of Heavy Metals on Human Health and Waters
Heavy Metals To Humans To Waters
Lead After the central and peripheral nervous systems; circulatory and digestive system
Acute toxicity to plants, animals and microorganisms
Mercury Causes brain damage leading to blindness; mental abnormalities; acute intoxications affecting digestive system and kidneys death
Chronic effects
Cadmium Induces respiratory and kidney disorders; cancer
Poisonous to flora and fauna decalcification bodies
Copper Affects the liver, kidney and eyes; neurological disturbances
Toxic plants
Iron Affects heart and liver; causes the diseases called siderosis
Chromium Is irritant to skin and mucous; induces circulatory disorders; allergic reactions; affects the nervous system; cancer
Poisonous to marine plankton and fish
Nickel Induces allergic reaction; affects lung and kidney tissue; cancer
High toxicity to palamuru plants, approximately 8 times more toxic than zinc
Arsenic Vomiting; cardiac dysfunction; skin cancer
Affects the plant growth
Zinc Epigastric pains; affects the central nervous system, muscle cardiovascular system
Changes in physical and physiochemical properties reduces the biological
25
activities
Manganese Motor and mental disorders; Parkinson
Source: Jucan et al., 2016
Figure 2.4: Acid- Mine Drainage of Rinto River (Zettler et al, 2003)
Table 2.2: EPA/WHO Standard of Heavy Metals in Water and Sediments
Heavy Metals Common Range in Sediment (mg/kg) Surface water quality (mg/l)
Iron (Fe) 7,000-550,000 1.0
Zinc (Zn) 10-600 5.0
Nickel (Ni) 5-500 0.2
Manganese (Mn) 20-3,000 0.5
Lead (Pb) 2-200 0.1
Source: Everett Wilson and Carl Solomon, July 1995
2.4.7 Air Pollution

26
Car vehicular emissions, chemical from mining sites, factories, and dust are examples of
pollution. Generally, it is a mixture of solid particles and gases which is released into the
atmosphere. Mining and beneficiation processes in the minerals value chain generate gases
that contaminate the environment. Ores are transported from the mining site to the processing
unit by trucks and excavators. The equipment uses a lot of fossil fuels. However, the
combustion of fossil fuel during mining operation produces sulfuric, carbonic and nitric acids
and other volatile organic compounds and heavy metals that pollute the environment. At the
mine, these gases react with water in the atmosphere in the form of acid rain and destroy
limestone and marble.
2.5 IMPACTS ON PUBLIC HEALTH
In the developing countries such as Liberia, and Sierra Leone, mining project sometimes
downplay the potential risks factored in the environmental impact assessments, (EIAs).
However, hazardous substances and wastes in water, air and soil may cause serious public
health. The
World Health Organization (WHO) defines health as a ‘’a state of complete physical, mental and
social well-being, and not merely the absence of disease or infirmity [58]. ‘Hazardous
substances’ include all substances which are harmful to people and the environment. Also,
hazardous substances may cause an increase of mortality or further increase in human illness;
pose a substantial health or environmental problem.
2.5.1 MITIGATING ENVIRONMENTAL IMPACT OF MINING
Mining in the past took place at a time when environmental impacts were not as well
understood and not significant concerns. Now, mine closure is a major issue to be considered
and a series of activities to remediate the impacts of mining are important part in mine
planning and design of mineral development from the exploration phase through to closure.

27
Steps to mitigate environmental impacts are as follows: reclamation, soil treatment, water
treatment and preventing acid rock drainage
Reclamation: restoring the soil and vegetation back to its pre-mining state. After mining,
the lands are destroyed. consequently, reclamation process is necessary and includes
using sludge, ‘’biosolid’’ from municipal waste water treatment processes as an organic
soil amendment, and growing plant species that are more tolerant to acidic conditions.
Soil treatment: elevated levels in sediments, not just acidity, can be harmful to plants,
animals and people. Future remediations are needed to prevent soil pollution. This may
include the use of chemical methods to stabilize metals in soils, use bacteriacides that
prevent the bacterial growth, promotes the oxidation of pyrite and accompanying
formation of sulfuric acid.
Water treatment: lime is the most common treatment for acidic and metal-bearing in
water. This ‘’active’’ treatment process, causes the dissolved metals to precipitate from
water but the process is very expensive. Some possible alternatives include wetland
systems to treat metal-bearing water. This method is necessary because the volumes
and acidity of water are not too great.
Preventing Acid Rock Drainage: acid drainage presents challenges to water quality;
however widespread occurrence of acid rock drainage is important to prevent its
occurrence. Possible measures to reduce acid rock drainage include: flooding of old
grounding mine, sealing exposed surfaces in grounding, backfilling mine and adding
chemicals to the water flooded surface to prevent acid rock drainage.

28
CHAPTER THREE
MATERIAL AND METHODOLOGY
3.1 FIELD INVESTIGATION
In July 2019, the study was conducted on both soil and water to determine heavy metal
concentration in a place, called MNG-Gold, which is situated in Kokoya district, 50 km southeast
from Gbarnga, the capital city of Bong county. It is 170 km northeast from Monrovia, the capital
city of Liberia. The road connecting Monrovia to Gbarnga is asphalted while from Gbarnga to
Kokoya is of reddish soil and laterite. During the field investigation, composite Sampling was
adopted for surface water whereas grab sampling was done on soil and groundwater. Four
water grab samples, five soil samples and five groundwater samples were collected from
different locations using Global Positioning System (GPS). For each of the sampling locations,
the GPS coordinates was marked and recorded in the note pad. The collected samples for soils
and waters were sent to KHY-lab-3602 to establish the heavy metals while electrical
conductivity, dissolved oxygen, potential hydrogen and temperature were measured and
recorded in the field. For groundwater, the physio-chemical parameters such as temperature,
electrical conductivity, dissolved oxygen and water level of each well were determined.
3.2 STUDY AREA
The MNG- gold is located in Kokoyah district, Bong county, Republic of Liberia. Figure 3.1 shows
the St. John River. The St. John River which has a source in Guinea flows through Bong county
northwest of Nimba Mountains. The St. John River in Guinea is called the Mano River. The

29
MNG-gold, situated in Kokoya district, is characterized by tropical, hot and humid climate with
the highest and lowest temperature ranges from 290 C to 190 C respectively. Moreover, the
average annual precipitation is 2076 mm. Approximately, 178 to 453 mm of convectional
rainfall occurs in the interior. This happens as a result of reduced in air moisture contents. The
soil types are composed of latosols. Latosols are type of soil which is predominately in Kokoya,
Bong county. It constitutes 18% of the total land in Liberia. It is rich in silica nutrients and
humus. Also, this area has a very good vegetation. The vegetable is divided in an evergreen rain
forest zone and the moist semi-deciduous forest zone. As the evergreen forest, it receives 453
mm of rain fall annually. However, for the semi-deciduous forest, the prolonged dry season
causes the leaves to fall due to the present of less evaporation.
Figure 3.1 Partial view of the St. John River Between Bong and Grand Bassa, Republic of
Liberia
3.3 SITE SELECTION
In selecting suitable site for soil and water samples, the primary objective was to clearly define
the appropriate field for which the samples were collected. Figure 3.2 shows the site utilized.

30
Following that, the collected samples from the field were investigated, labeled, marked and
sent to the laboratory for analysis. The results indicated that heavy metal concentrations and
physio-chemical parameters for water and soil were reported and recorded. The water sample
was conducted at four different sites and additional five groundwater samples collected from
well. The surface water was collected 0.4 m below the water surface and less than 40 m away
from the mine.
Figure 3.2: surface water and soil sampling locations
3.4 SAMPLING PROCEDURE AND SAMPLE MANAGEMENT
To begin with sampling procedure, it is important to understand what sampling procedure is?
According to [59], sampling procedure means the technique adopted to sub-group an individual
selected from largest group. The technique adopted for this work is as followed:
Sampling point

31
Various sampling points were identified for sample collection. Sample containers such as
density polyethylene bottles were washed at least three times with water from the specific site
of sampling prior to taking the samples.
Sampling tools
Sampling tools such as polypropylene, polyethylene, bucket and hoe were used during the
sample procedure. For example, the hoe and digger were used to dig the ground 1 cm to 50 cm
to take the soil sample and subsequently transfer into polyethylene bottle for laboratory tests.
Similarly, water sample was also collected by the means of composite grab and as for ground
water, the water level meter was also taken to know the depth of ground water condition.
Cleanliness
Sampling materials and containers were thoroughly cleaned and at least three times in order to
avoid contamination prior to sampling the materials.
Field recordings
All samples collected in the field, for example, sample name, (code), sampling site’s name
(code), an accurate position for the sample site, sampling data, environmental condition of
the mine site such as temperature, pH, dissolved oxygen contents, depth of the
groundwater and electrical conductivity were all recorded in the note pad.
Labeling of soil and water samples
After collecting the samples for both water and soil, water- resistant ink was used to label
the name and code of the samples, the sampling date and sampling name respectively.
3.5 SAMPLE ANALYSIS
The sampling for water was done in a period of one month from July 1, 2019 to July 30, 2019 at
four different locations and additional five different locations for groundwater. Groundwater,

32
surface water, stream and tailing samples were collected from different points. However, water
samples were collected 0.4 m below the water surface and less than 40m apart within the
perimeter of the mining sites. The samples were stored in 250ml cleaned polyethylene bottles,
and then acidified with concentrated nitric acid to pH less than 2. Also, pH, temperature,
electric conductivity (EC) and dissolved oxygen (DO) were measured at the sampling sites while
heavy metals such as Fe, Mn, Pb, Zn and Ni determination in water samples an air acetylene
flame was analyzed using an atomic absorption spectrophotometers (AAS) FS 240.
Similarly, field surveys were conducted in July 2019. Five soil samples along with their
geographical coordinates at different locations were recorded. During the laboratory analysis,
0.7 g dried, homogenized sediment samples were accurately weighed on an analytical balance
and then transferred into a glass beaker. Three drops of distilled water plus 13 ml of nitric acid,
HNO3 were added to the solution in the beaker then heated on a hot plate till it was completely
dried. The dried sample was allowed to cool for 45 min, after adding 8 ml of HF (%40w/w) and 8
ml of HCLO4 (%60w/w) respectively. The acid mixture was allowed to heat on a hot plate at
85oC inside a fume hood until the dark color disappeared. At 120oC, HF was subjected to boil
and then the boiling temperature was not allowed to exceed 120oC after final traces of HF and
HCLO4 were expelled. The final residue was dissolved in 10 ml HCL then allowed to heat for
thirty minutes. After cooling, the solution was transferred to a 50 ml volumetric flask. The AAS
FS 240 was used to analyzed the concentration of Fe, Mn, Zn, Pb and Ni after the process was
completed.

33
CHAPTER FOUR
RESULTS AND DISCUSSIONS
4.1 RESULTS
The graphs of total elemental concentration in water, relation of temperature, dissolved
oxygen, and pH, conductivity and study areas, total elements of concentration in soil and
groundwater depth are presented in Figure 4.1, Figure 4.2, Figure 4.3, Figure 4.4 and Figure 4.5
respectively. The raw data is presented in the Appendix. The heavy metal concentrations for
iron in water was extremely high at 1.5 ppm, followed by manganese, nickel, zinc and lead
which were all below 0.08 ppm. In Figure 4.2 and 4.3, Adana and new TSF reported high
conductivity values. In Figure 4.4 and 4.5, the concentrations of iron and the depth of the BH-1
were reported high.

34
Figure 4.1 Total Elementals (ppm) Concentrations in Water Samples against the Heavy metal
element.
0.02 0.02 0.03 0.08
0.01 0.07
0.02 0.01 0.03 0.02 0.01 0.02 0.02 0.01 0.01
1.58
0.02 0.01 0.01 0.01 0
0.2
0.4
0.6
0.8
1
1.2
1.4
1.6
1.8
Fe Zn Ni Mn Pb
CO
NC
ENTR
ATI
ON
(PP
M)
HEAVY METALS
Concentration of Heavy Metal in water
Adana
Old TSF
New TSF
River

35
Figure 4.2: Variation between temperature, dissolved oxygen and pH
Figure 4.3: Conductivity and study area relationship
23.3 23.4 23 23.1
8.04 7.96 7.67 7.5 8.49
0
8.2 7.65
ADANA OLD TSF NEW TSF RIVER
Study Area
Temperature-Dissolved Oxygen-pH
Temperature(oC) Dossolved oxygen(mg/L) PH
38.7
67.7
182.1
38.7
0
20
40
60
80
100
120
140
160
180
200
Adana Old TSF New TSF River
Co
nd
uct
ivit
y(u
S/cm
)
Study Area
Conductivity(uS/cm) -Study Area

36
Figure 4.4: Concentrations of selected heavy metals in soils
Figure 4.5: Ground water depth level July 2019
-40000
-20000
0
20000
40000
60000
80000
100000
120000
140000
160000
Fe Zn Ni Mn Pb
CO
NC
ENTR
ATI
ON
(PP
M)
HEAVY METAL
Concentration- Heavy Metals
Adana
Old TSF
New TSF
Saprolite
St. John
0
5
10
15
20
25
Depth(m) Depth(m) Depth(m) Depth(m)
Week 1 Week 2 Week 3 Week 4
Month of July 2019
19.19 19.78 19.89 20.28
11.05 11.24 10.98 11.98
9.11 7.78
9.02 8.98
1.4 1.25 1.26 1.17
8.52 8.85 10.18 9.62
Dep
th(m
)
Well Hole Number
Ground water depth level July 2019
BH-1
BH-2
BH-4
BH-6
KMW06

37
4.2 Discussion
Data analysis parameters such as standard deviation, mean concentrations were calculated.
The statistical approach clearly indicates that the metal values for some heavy metals were
below the detection limit especially in water sample except iron and manganese which
exceeded the detection limit shown in Figure 4.1. As for the sediment samples, the
concentrations of all metals were above the detection limit.
4.2.1 Concentration of iron (Fe) in water and soil
Iron is one of the heavy metals which makes up at least 5 % of the earth’s crust. It is one of the
most abundant elements in the earth. Iron exists in water as soluble ferrous (Fe2+) and insoluble
(Fe3+). Iron’s concentration as low as 0.3 mg/L causes stains on tableware, fixtures and laundry
that are very difficult to remove. Irons are formed when rainwater infiltrates the soil and
dissolves the iron, causing it to seep into underground well. Although iron is not harmful to
health, it is referred to as secondary contaminate. It is essential for good health and helps move
oxygen in the blood. If more than 10 mg/kg of iron level exists in the human body, it causes
increase of blood in the vessels. According to a report by [60] the maximum allowed
concentration of iron present in drinking water is 1.0 mg/kg. As presented in Figure 4.1 water
samples, the concentration level of iron was slightly above the permissible limit in the St. John
River whereas it was below the limit in the remaining water samples. Sampling points closer the
mining site, had higher concentrations of iron. The concentrations of iron can vary significantly
as a result of source types and the presence of ferrous iron.
Based on statistics, it constitutes 4.6% of igneous rocks and 4.4% of sedimentary rocks.
Investigation by [61] revealed that iron concentrations in soils range from (20,000 to 550,000
mg/kg) and concentration can also vary due to soil types and the presence of other sources.
Iron can exist in either the divalent (Fe2+) or trivalent (Fe3+) states and the divalent state can be
oxidized to the trivalent state which form oxide or hydroxide precipitates, and become
unavailable to plants as micronutrient [62]. During mining, large amounts of iron are released

38
into the environment as pyrite (FeS2) which is found in coal seams, or sulphide minerals in
general. When sulphide minerals are exposed to air and water, it is oxidized to sulphate by
bacterial and chemical reactions. The reaction produces dissolved ferrous iron into mine
drainage. When ferrous iron reacts with oxygen to form ferric iron, then hydrolyzes to form
insoluble ferric hydroxide (FeOH3). However, roots of some plants are able to reduce iron from
ferric to the ferrous state, and allow iron uptake into the plant [63]. The iron concentration in
all the soil samples collected from Adana, old TSF, New TSF, Saprolite and St. John as presented
in Table 4.5 ranged 52,968 to 115,781 mg/kg. In all the soil samples concentration of iron was
above the permissible limit set by WHO.
4.2.2 Concentration of Zinc (Zn) in water and Soil
Zinc is a heavy metal which is considered as a trace element in soil. It plays a major role in
protein synthesis and is a metal showing fairly low concentration in surface water as a result of
its restricted mobility from the weathering processes to deposition point. Higher concentration
of zinc can cause more risk to an organism’s survival.
The zinc concentration in water samples remained constant as presented in Table 4.1.
According to WHO, the permissible limit of zinc in water is 5 mg/L. The zinc concentration in all
the water samples collected from Adana, old TSF, new TSF, St. John River was recorded below
the permissible limit. However, the zinc concentration in soil from old TSF, new TSF, saprolite
and St. John River was also below the permissible limit except for Adana’s soil sample which
was slightly above 5 mg/L. The concentrations of zinc in soil samples ranged between 16.68 to
51.35 mg/kg.

39
4.2.3 Concentration of Nickel (Ni) in water and soil
Nickel (Ni) is one of the trace elements that is found in humans and animals. It is essential for
human and animal health. It poses risk to human health if it is present in large quantities. As
recommended by the WHO, the maximum permissible limit for nickel in water is 0.2 mg/L [64].
Nickel in water sample ranged between 0.01 to 0.03 mg/L which was below the permissible
limit recommended by WHO. The permissible limit of nickel concentration presents in soil is
100 mg/kg [65-66]. As presented in Table 4.5, the value of Ni in all soil samples ranged between
17.55 and 186.49 mg/kg which was obtained from old TSF, new TSF, saprolite and St. John
River. Nevertheless, in Adana soil sample, the value was recorded above the permissible limit of
international standard. The variation of nickel in water and soil is based on the distance where
the samples was collected in the mine. Nickel contamination of soil contributes high
environmental impact.
4.2.4 Concentration of manganese (Mn) in water and Soil
Manganese is a heavy metal with symbol Mn and atomic number 25. As a free element in
nature, it combines with iron. It also exists as a trace mineral which is present in the body in
small amounts. When it is combined with calcium, zinc and copper, it supports bone formation.
For water, the permissible limit of manganese is 0.5 mg/L [67]. Above this value, it is considered
as risk to human health. As presented in Table 4.5, the concentrations of manganese in all
water samples ranged between 0.01 to 0.08 mg/L in Adana, old TSF, new TSF, and St. John River
which were recorded below the permissible WHO water standard. The permissible limit of Mn
in soil is 12 mg/kg [68]. In soil, manganese ranged between 55.11 and 994.83 mg/kg which was
recorded above the permissible limit of 12 mg/L.
40
4.2.5 Concentration of Lead (Pb) in water and Soil
Lead is a chemical element with the symbol Pb and atomic number 82. It is heavy metal that is
denser than most materials. Lead is soft and malleable, and has a relatively low melting point.
For water sample, the permissible limit of Pb is 0.05 mg/L. In all the water samples collected
from Adana, old TSF, new TSF and St. John River, the concentration of lead was below the
permissible limit since it ranged between 0.01 and 0.02 mg/L. However, the concentration of
lead in soil samples was recorded to be ranged between 8.74 to 19.53 mg/kg. In all the
collected soil samples from Adana, old TSF, new TSF and St. John River, the concentration was
above the permissible limit set by WHO. Lead as a source of contaminant is considered as
widespread issue; it accumulates with age bones aorta, and kidney, liver and spleen. It can
enter human body through uptake of food (65%), water (20%) and air (15%). Lead mineral is
naturally present in the soil.
4.2.6 Physio-chemical Parameters of surface and groundwater quality, MNG-gold
Temperature and color of water are physical parameters while pH, dissolved oxygen contents,
alkalinity, hardness and electrical conductivity belong to chemical parameters. Table 4.3 in
Appendix I shows the results for pH, electrical conductivity and dissolved oxygen in water
samples whereas Figure 4.2 shows temperature, dissolved oxygen-pH relationship. In Table 4.1,
the composite water samples collected directly from the new tailing storage facility, (TSF) had
higher electrical conductivity and less temperature than samples taken from the rest of the
sampling points. This is because the wastewater from the processing unit which contains high
concentration of ions are directly discharged into the new TSF.
According to WHO, the normal ranges for pH of drinking water is 6.5-8.5. pH of all the water
collected from Adana, new TSF and St. John River was below the normal range except for pH
value of old TSF which was not detected. Also, WHO normal range for electrical conductivity
(EC) of water is 400-600𝜇s/cm. In all the water samples collected from Adana, old TSF, new TSF

41
and St. John River was recorded within the range. The temperature for the study area ranged
between 23.0oC to 23.4oC. WHO normal range for hardness of water is 50-250mg/ml [69].
Electrical conductivity (EC) is a measure the ability of water to conduct an electric current which
is associated to the amounts of dissolved minerals in water; however, it does not give indication
of which element is present. Higher value of electrical conductivity is a perfect indicator of the
presence of contaminants such as sodium, potassium, chloride or sulphate. Hardness is referred
to as the measure of concentration of dissolved calcium and magnesium ions in water.
Hardness is one of the most important properties of water such that it is significance for life
processes. All these water parameters are very useful because their study is important for fish
and human health.
4.2.7 Means and Standard Deviation of Heavy Metals
In Table 4.2, it is also indicated that the iron concentrations in sediment samples were
extremely higher than the concentration levels of other metals. The heavy metal
concentrations (mean ± SD) available in water samples are presented in Figure 4.4. From the
above data, iron is the most predominate elements analyzed in the water samples in July 2019.
However, the total concentrations of iron ranged from 0.42±0.64 ppm in July 2019. As
presented, manganese is the second most abundant element in water samples with an
estimated value of 0.04±0.03 in July 2019. The remaining heavy metals such as Zn, Ni and Pb
were found under detention limit in July. In furtherance, the concentrations of zinc with value
less than 0.02 ppm in all four samples were constant which was also less than the same amount
as the detention limit of July 2019. Nickel further exhibited gradual reduction in July 2019 of the
given water samples.
Similarly, the concentrations (mean ± SD) of heavy metals in soil are presented in Table 4.5
Appendix I. Again, iron concentrations in soil samples varied 71859±23507.54 ppm in July 2019.
Nevertheless, the elemental iron concentration in the soil sample was extremely higher than

42
the other heavy metals. Manganese is the second most predominate element in the soil sample
with total mean concentration of 283.12 ppm. The concentration levels of heavy metal in soil
were far higher than those of heavy metals in water. The heavy metals in sediment samples
were all above the detention limit. The analysis presented in Table 4.3 and Table 4.5 Appendix I
indicated that Fe, Zn, Ni, Mn and Pb in soil samples, varied hugely with water samples in July. In
this work, manganese and iron concentration levels were recorded extremely high quantities in
soil. However, lead, manganese, nickel and zinc in water samples were reported below the
detention limit. Iron and manganese were considered to be the more concentrated metals in
water samples. Similarly, the dissolved oxygen values varied from 7.50 mg/L to 8.04 mg/L and
the electrical conductivity values changed from 38.7𝜇S/cm to 182.1𝜇S/cm.
4.3 Observation
In July 2019, after the water samples were collected and analyzed for heavy metals (Fe, Zn, Ni,
Mn and Pb) using an atomic absorption spectrophotometer (AAS FS 240), it was observed that
the concentrations of heavy metals such as iron were above the maximum permissible limit set
by WHO while Zinc, Nickel and manganese were below the permissible limit in Adana, old TSF
and new TSF respectively. The analysis of the study further revealed that the presence of heavy
iron content in water at MNG-gold, Bong county, Liberia was beyond the permissible limit in St.
John River. The pH value of all the water collected was in the permissible limit of WHO
standard. Similarly, the soil samples, the concentration of all the heavy metals such as iron,
lead, manganese and zinc were recorded above the permissible limit set by WHO. The
concentration of nickel and zinc in Adana study area was recorded below the permissible limit
set by WHO standard.
For the groundwater condition, it was clearly observed that electrical conductivity of BH-1, and
BH-6 reported high electrical conductivity and temperature as compared to BH-2, BH-4 and
KMW06. It was observed that people practiced open defecation along streams and beaches. In
addition, industrial and sewage of the city and town were directly discharged into the river. This
also contaminates the water making it unsafe for both aquatic and human life. Also using the
43
affected water for the purpose of irrigation will further expose the soil and plants to heavy
metals. Finally, it was observed that the heavy metal in soil was more than the value of heavy
metals in water.
4.4 Future work
This research work provides a fundamental understanding of the presence of heavy metals in
spaces close to and within the mining area due to open pit gold mining activities which has
been taking place in Kokoya, Bong county Liberia since 2015. For detailed analysis of future
work on soil and water quality in MNG-gold, regular monitoring system should be conducted on
periodic basis to observe the contaminant levels of other heavy metals which were not
discussed in the work. In so doing, the minimum time duration for such investigation should be
at least one year in order to have more and accurate data that relate to the topic under
discussion. In addition, sampling equipment should be designed to ensure easy collections of
samples from sampling locations. Lithologies, bedrocks and another important feature need to
be further analyzed by the use of scanning electron microscope to determine their
mineralogical composition of the elements. Study on other heavy metals concentration should
be investigated. The water and soil parameters should be analyzed in advanced, analytical
techniques such as inductively coupled plasma-mass spectrometer (ICP-MS) in comparison to
FAAS FS 240 (used in current study) due to high detection limits. Besides, the chemical and
heavy metal analysis, radionuclides (radioactive materials such as uranium) should be analyzed
using advanced techniques such as ICP-MS. The load of microorganisms (protozoa, parasite,
algae, bacterial and virus) could also be assessed. This may not be from the mine but from the
open defecation observed.

44
CHAPTER FIVE
CONCLUSIONS AND RECOMMENDATIONS
5.1 Conclusions
Mining and milling as well as tailing discharge into the environment led to accumulation of
heavy metals in soil and water. The fundamental goal of this research work was to investigate
the concentration level of some heavy metals and physio-chemical parameters such as
temperature, electrical conductivity, dissolved oxygen and pH of surface water, groundwater
and soil samples collected from MNG-Gold Kokoyah district, Bong county, Republic of Liberia.
During the course of investigating soil, surface water and groundwater, a total of fourteen
samples were collected and analyzed. It was reported in the research that five soil samples
were collected and analyzed for heavy metals (Fe, Zn, Ni, Mn and Pb). Also, four water samples
were collected and analyzed for the physio-chemical parameter ( temperature, electrical
conductivity, dissolved oxygen and pH) and five heavy metals (Fe, Zn, Ni, Mn and Pb), while five
groundwater samples were collected and analyzed for the three chemical parameters such as
the electrical conductivity, dissolved oxygen and pH respectively.
In addition, the presence of heavy metal concentration varied from one location to another.
Zinc, nickel, manganese and lead concentrations in surface water were less than or equal to
0.02 ppm, 0.03 ppm, 0.08 ppm and 0.02 ppm which are below the permissible limits set by
WHO, whereas iron concentration of up to 1.5 ppm were above the permissible limit set by
WHO in the St. John River. The presence of lead, manganese, nickel and zinc in soil were < 20
ppm, 1000 ppm, 200 ppm and 60 ppm respectively above the permissible limits set by WHO.
However, in certain locations such as old TSF, new TSF, St. John River and saprolite, the
concentrations of zinc and nickel in Adana remained relatively below the permissible limit set
by WHO standard for soil. The increased levels of these heavy metals in sediments have the

45
potential to endanger soil quality which is used for the agricultural processes. From the analysis
of the investigation, the results showed that pH values of all the water samples were between
7.6 and 8.5 and within the permissible limits set by WHO, while the values of electrical
conductivity of all the collected surface and groundwater samples below 200𝜇s/cm far less than
permissible limits set by the WHO. Similarly, dissolved oxygen of all collected surface water and
groundwater samples was recorded to be less than permissible limits set by WHO. From the
above studies of heavy metals and chemical parameter, it was found that the surface water at
various locations of MNG-gold around kokoya district, Bong County are significantly rich in
micronutrients (Zn, Mn and Pb) and have good pH and electrical conductivity for agricultural
use. However, the iron concentration of the water samples exceeds the standard value for
drinking water and irrigation as set by WHO and food and agriculture organization (FAO) and
therefore, in terms of iron concentration, the surface water is not suitable for drinking and
irrigation. Furthermore, proper treatment of the surface water containing elevated iron content
should be carried out before use for drinking and irrigation; otherwise, it may lead to an
overload which can cause hemochromatosis, diabetes, stomach problems, nausea and vomiting
in human body when it is consumed as a result of drinking. The recommended level of iron in
water is less than 0.3ppm. The best water treatment for iron removal is to install an iron water
filter in private homes. It helps to removes iron, bacteria, sulfur and manganese from water,
making it healthy enough to drink.
5.2 Recommendations
To address the problems of heavy metal concentration in water and soil at MNG-gold, it is
absolutely necessary that the following considerations are made:
(i) Treatment of waste water before discharging into the environment should involve
steps to remove metals causing risk to human health within the environment.

46
(ii) Waste water from the processing plants into the St. John River should be subjected
to suitable chemicals for keeping Fe, Pb, Zinc, Mn and Ni within the permissible safe
levels
(iii) Regular monitoring by the company should be put in place such that contaminations
of heavy metal pollution would be avoided and reduce the health risk caused by
taking contaminated vegetables grown in the area
(iv) Government in collaboration with Environmental Protection Agency (EPA) and the
Ministry of lands, Mines and Energy should monitor, regulate and improve the water
quality of MNG-gold and other environs which should also consider heavy metals
such that water and soil are exposed to minimum amount of heavy metals

47
References
[1] Adriano, D.C., 1986. Trace elements in the terrestrial environment. Springer-Verlag, New
York.
[2] Jonnalagadda, S.B., Mathuthus, A.S., Odipo, R. W., & Wandiga, S.D. (1991). River Pollution in
developing Countries: A case study III: Effect of industrial discharges on quality of Ngong river
waters in Kenya. Bulletin of Chemical Society in Ethiopia, 5,49-64
[3] Barlas (1999) Histopathological examination of gill, liver and kidney tissues of (Cyprinus
Carpio L. 1758) fish in upper Sarkaya River Basin. Turkish J Vet Anim Sci 23: 277-284
[4] Atchinson GJ, Murphy BR, Bishop WE, Mcintosh A, Mayers RA (1977) Trace metal
contamination of bluegill (Lepomis macrohirus) from two Indiana lakes. Trans American fish Soc
106:637-640
[5] Srihanth R, Madhumohan RA, Shravan KCH, Khanum A (1993), lead, cadmium, Nickel and
Zinc contamination of groundwater around Husain Sagar Lake, Hyderabad, India. Bull Environ
Contam Toxicol 50: 138-143
[6] Al-Yousuf MH, El-Shahawi MS, Al-Ghais SM (2000) Trace metals in liver, skin and muscle of
Lethrinus lenjan fish species in relation to body length and sex. Sci Total Environ 256:87-94
[7] Fernandez M, CuestanS, Jimenez O, Garcia MA, Hernandez LM, Marina ML, Gonzalez MJ
(2000) Organochlorine and heavy metal residues in the water/sediment system of the
Southeast Regional park in Madrid, Spain. Chemosphere 41: 801-812

48
[8] Ammann, A. A., Michalke, B., & Schramel, P. (2000). Speciation of heavy metals in
environmental water by ion chromatography coupled to ICP-MS. Analytical and Bioanalytical
chemistry, 372, 448-452.
[9] Lantzy, R. J., & Mackenzie, F. T. (1979). Atmospheric trace metals: Global cycles and
assessment of man’s impact. Geochimica et Cosmochimica Acta, 43, 511-525.
[10] Ghosh, S., & Vass, K. K. (1997). Role of sewage treatment plant in Environmental
Mitigation. In K. K. Vass & and M. Sinha (Eds.), proceeding of the national seminar on changing
perspective of Inland Fisheries (pp.36-40). Inland Fisheries Society of India, Barrackpore, March
16-17, 1997
[11] Reilly C (1991) Metal contamination of food, 2nd edition. Elsevier applied Science, London
[12] Trichopoulos D (1997) Epidemiology of cancer. In: De Vita VT (ed) cancer, principles and
practice of oncology. Lippincott company, Philadelphia, pp 231- 258
[13] Amlib, 2012. Delivering on Liberia’s potential. Amlib Holdings plc, February 2012. Available
at < http://www.mineafrica.com/documents/ 13%20-%20Amlib.pdf>(accessed 02.06.2017).
[14] Fetter C.W. Jr., 1980. Applied Hydrogeology, CharclesMerrill Pub. Co. 365p
[15] Olarewaju V.O, M.O. Olurufemi and O. Alade, 1997. Chemical characteristics of
groundwater from comparts of the Basement complex of central Nigeria, Journal of mining and
Geology Vol. 33pp.138
[16] Thornton, I., 1980. Geochemical aspects of heavy metal pollution and agriculture in
England and Wales. In Inorganic Pollution and Agriculture. MAFF ref. Book 326, HMSO, London.
[17] Duffus JH. Heavy metals- a meaningless term? Pure Applied Chemistry 2002; 74 (5): 793-
807. [Google Scholar]
[18] Sutton D, Tchounwou PB, Ninashvili N, Shen E. Mercury induces Cytotoxicity, and
Transcriptionally Activates Stress Genes in Human Liver Carcinoma Cells. International J. Mol
Sci. 2002 3(9):965-984

49
[19] cui, Y.J., Y.G. Zhu, R.H. Zhai, D.Y. Chen, Y.Z. Huang, Y. Qui & J.Z. Liang. 2004. Transfer of
metals from near a smelter in Nanning, China. Environmental International 30: 785-791.
[20] Eriyamremu, G.E., S.O. Asagba, A. Akpoborie & S.I. Ojeaburu. 2005. Evaluation of lead and
cadmium levels in some commonly consumed vegetables in the Niger-Delta oil area of Nigeria.
Bulletin of Environmental Contamination and Texicology 75: 278-283.
[21] Marshall, F.M., J. Holden, C. Ghose, B. Chisala, E. Kapungwe, J. Volk, M. Agrawal, R.
Agrawal, R. K. Sharma & R.P. singh. 2007. Contaminated Irrigation Water and Food Safety for
the Urban and Periurban poor: Appropriate Measures for monitoring and Control from Field
Research in India and Zambia. Inception Report DFID Enkar R160, SPRU, University of Sussex.
www.pollutionandfood.net 2007.
[22] Rollinson, H., 2016. Archean Crustal evolution in west African: a new synthesis of the
Archean geology in Sierra Leone, Liberia, Guinea and Ivory Coast. Precambr. Res. 281, 1-12.
[23] Behrendt, J.C., Wotorson, C.S., 1974. Geophysical surveys of Liberia with tectonic and
geologic interpretations. U.S. Geological Survey Professional Paper 810.
[24] Milesi, J.-P., ledru, P., Feybesse, J.-L., Dommaget, A., Marcoux, E., 1992. Early Proterozoic
ore deposits and tectonics of the Birimian orogenic belt, West Africa. Precambr. Res. 58, 305-
344
[25] Whit, G.W., Leo, G.W., 1969. Geological Reconnaissance in Western Liberia. Liberian
Geological Survey, Special paper 1.
[26] Bongers F., Poorter L., Kouame F.N and Hawthorne (1999). Biodiversity of West African
Forests: An Ecological Atlas of woody plant species
[27] Burrow, Collin, J, (1990). The nature of vegetation and kinds of vegetation change.
[28] GTZ/MPEA (1983): Joint Assessment Report. GTZ/ Ministry of Planning and Economic
Affairs, Monrovia.
[29] Wahl, R.R., 2007. Geologic, Geophysical and Mineral Localities Map of Liberia: A Digital
compilation. USGS Open-Files Report 2007-1258
50
[30] Duruibe, J.O., M.D.C. Ogwuegbu & J.N. Egwurugwu. 2007. Heavy metal pollution and
human biotoxic effects. International Journal of Physical Sciences 2:112-118.
[31] Evernder, N. 1992. The social Creation of Nature Baltimore and London: John Hopkins
University Press.
[32] J. Buffle, Complexation reactions in aquatic systems, Englewood Cliffs: Prentige Hall, 1990.
[33] Lottermoser B., 2007. Mine Wastes- Characterization, Treatment and Environmental
Impact 3rd edition. DOI 10.10071978-3-642-12419-8-1.
[34] Adler R. and Rascher, J. (2007). A Strategy for the management of Acid and Mine Drainage
from Gold Mines in Gautenng. CSIR report Number CSIR/NRE/PW/ER/2007/0053/C. Pretoria:
CSIR.
[35] Sigh R, Gautam N, Mishra A. and Gupta. R. (2011) Heavy metals and living Systems an
Overview, Indian Journal Pharmacology, 43, 246-253.
[36] Piotrowska-Seget, cycon, and Kozdroj (2005) Metal-Tolerant Bacterial Occurring in Heavily
Polluted Soil and Mine Soil.
[37] Hinojasa M. Belen and Richard P. Dick (2004). Soil moisture pre-treatment effects on
enzyme activities as indicators of heavy metals-contaminated and reclaimed soil.
[38] Yao R, et al. (2003) Subcellular Localization of yeast ribonucleotide reductase regulated by
the DNA replication and damage checkpoint pathways.
[39] Carreira A. and Roberto Garcia-Ruiz (2004). Soil moisture pre-treatment effects on
enzyme activities as indicators of heavy metals-contaminated and reclaimed soil.
[40] S. Li, Q. Zhang, Spatial characterization of dissolved trace elements and heavy metals
in the Upper River (China) using multivariate statistical techniques, J. Hazard. Matter. 176
(2010) 579-588.
[41] Madejon E., Cabrera F., Perez A., de Mora and Julio J (2005) Changes in enzyme
activities and microbial biomass after ‘’in situ’’ remediation of a heavy metal-contaminated
soil.

51
[42] MINEO Consortium (2000). ‘’Review of potential environmental and social impact of
mining’’ http://www2.brgm.fr/mineo/userNeed/IMPACTs.pdf
[43] Olaniran N.S. (1995). Environment and Health: An Introduction, in olaniran, N.S. et. Al (ed)
Environment and Health. Lagos. Micmillan Nig.pub. Co for NCF, 34-151.
[44] Webster.com. (2010). Definition from Webster Dictionary 08-13 Retrieved 2010-08-26
[45] Eguabor V., STAN Journal Environmental Education Series (2) (1998) 49.
[46-47] Manjunath, D. I. and Pearson (online service). Environmental studies (for Vtu). Pearson
India.
[48] Foppen, J.W.A. (2008) ‘’Impact of high strength wastewater infiltration on groundwater
quality and drinking water supply: the case of Sana’a Yemen, ‘’ Science Direct-Journal of
hydrology, Elsevier B.V.
[49] Jakhrani, A.Q. (2002) ‘’Impact of oxidation ponds on groundwater quality at Hyderabad’’
M.E. Thesis, Institute of Environmental Engineering and Management, Mehran University of
Engineering and Technology, Jamshoro.
[50] Mahmood, S. (2006) ‘’Wastewater irrigation issues and constraint for sustainable irrigated
agriculture’’, Journal of Italian Agronomy 234- 344.
[51] Maqbool, A. (2007) ‘’Environmental consequences of wastewater irrigation’’ M.S. thesis,
Center of Excellence in water resources Engineering, Labore, Pakistan.
[52] Manjunath, D. I. and Pearson (online service). Environmental studies (for Vtu). Pearson
India
[53] Mulopo, J., (2015). Continuous pilot scale assessment of the alkaline barium calcium
desalination process for acid mine drainage treatment. Journal of Environmental Chemical
Engineering 2, 1295-1302.
[54] Akcil, A and Koldas, S. (2006). Acid Mine Drainage (AMD): causes, treatment and case
studies. Journal of Cleaner Production, 14, 1139-1145.

52
[55] Adler R. and Rascher, J. (2007). A Strategy for the Management of Acid Mine Drainage
from Gold Mines in Gauteng. CSIR report Number CSIR/NRE/PW/ER/2007/2007/0053/C.
[56] Davis, D. W. Hirdes, W., Schaltegger, U., and Nunoo, E.A. (1994). U-Pb age constraints on
deposition and provenance of Birimian and gold-bearing Tarkwaian sediments in Ghana, West
Africa. Precambrian Research 67:89-107.
[57] World Health Organization (1946). Preamble to the Constitution of the World Health
Organization. Official Records of the World Health Organization No. 2, p. 100.
[58] Ogula, P.A. (2005). Research methods. Nairobi: Catholic University of Eastern Africa
Publications.
[660] Federal Environmental Protection Agency (FEPA) (1999) Ecolex The Gateway to
environmental law, Abuja, Africa.10
[59] Morel, F. M. M., and J.G. Hering. 1993. Principles and Applications of Aquatic Chemistry.
John Wiley and Sons, Inc., New York City, NY.
[60] Lyman, W.J., Reehl, W.F., and D.H Rosenblatt. 1988. Environmental Inorganic Chemistry:
Properties, Processes, and Estimation Methods. SETAC Special Publication Series, B.T. Walton
and R.A. Conway, editors. Pergamon Press. New York.
[61] Troeh, F. R, and Thompson, L. M. 1973. Soils and Soil Fertility, third ed. McGraw-Hill Book
Company.
[62] Grussak, M.A. 1996. Plant Breeding Strategies for improving Human Mineral and Vitamin
Nutrition. Federation of American Scientists. http://www.fas.org./mnp/micro.htm#iron.
[63] Zaigham, H., Zubair, A., Khalid U. K. (2012). Civic pollution and its effect on water quality of
river Toi at District Kohat, NWFP. Res J Env and Earth Sci. 4:334-339.
[64] ISO (2009) Standard ISO 5667-11: Water quality- Sampling- part 11: Guidance on sampling
of groundwaters. Geneva, International organization for Standardization.

53
[65-67] WHO 1998. Guidelines for Drinking Water-Quality, Second Edition, Addendum to
volume 2.
[68] Zaigham, H., Zubair, A., Khalid U. K. (2012). Civic pollution and its effect on water quality of
river Toi at District Kohat, NWFP. Res J Env and Earth Sci. 4:334-339
Appendix I:
Tables of Findings
Table 4.1: Total Elemental Concentrations (ppm) of Heavy Metal in Water
Sample

54
Source: Fieldwork findings, July 2019
Table: 4.2: Physio-chemical parameters of selected study area in MNG- gold Mine between
July 1,2019 and July 30,2019.
Study area DO (mg/L) Temperature(oC) EC (𝜇S/cm) pH
Adana 8.04 23.3 38.7 8.49
Old TSF 7.96 23.4 67.7 Nd
New TSF 7.67 23.0 182.1 8.20
PH Fe Zn Ni Mn Pb8.49 <0.02 <0.02 0.03 0.08 <0.01
nd 0.07 <0.02 <0.01 0.03 0.02
8.2 0.01 <0.02 0.02 <0.01 <0.01
7.65 1.58 <0.02 <0.01 <0.01 <0.01
<0.01 0.02 0.01 0.01 0.01
ppm ppm ppm ppm ppm
Detention Limit
Units
Recording
Reporting
5/8/2019
9/8/2019
LDO (mg/L)
8.04
7.96
7.69
7.5
Total Elemental Concentrations (mg/L) of Heavy Metal in Water Samples
Conductivity(u/cm)
38.7
67.7
182.1
38.7
Temperature (0C)
23.3
23.4
23
23.1River
Open Pit
Behind processing Plant
Opposite Processing Plant
St. John River 2.25km, NW of New TSF
GPS CoordinatesE0468963 N0733773
E0469721 N0732541
E0469138 N0732912
E0470666 N0730896
Water Samples Location / DescriptionAdana
Old TSF
New TSF
Laboratory Number
Reference Number
KYH-LAB-3602
POP 06/08

55
River 7.50 23.1 38.7 7.65
Nd: not detected
Source: fieldwork finding, July 2019
Table 4.3: Value of heavy metal contents (average ± standard deviation) summary in
Water(ppm)
HM Concentrations Mean SD M±SD
Fe 0.02 0.07 0.01 1.58 0.42 0.64 0.42±0.64
Zn 0.02 0.02 0.02 0.02 0.02 0.00 0.02±0.00
Ni 0.03 0.01 0.02 0.01 0.02 0.01 0.01±0.02
Mn 0.08 0.03 0.01 0.01 0.04 0.03 0.04±0.03
Pb 0.01 0.02 0.01 0.01 0.01 0.004 0.01±0.004
Source: fieldwork finding, 2019
Table 4.4: Total Elemental Concentrations (ppm) of Heavy Metals in Soil Samples

56
Source: fieldwork finding, July 2019
Table 4.5: Concentration of heavy metal in soil
Source: Fieldwork finding, July 2019
Table 4.6: Value of heavy metal contents (Mean ± Standard Deviation) in soil.
Ni Mn PbSoil Samples Descrptions GPS Coordinates Fe Zn
Units
Inside Adana Pit E0463867 N0732762
E0470167 N0732480Behind processing
Opposite processing E0469183 N0732967
Adana
Old TSF
New TSF
Saprolite
St.John
Detention Limits
115781
56367E0469381 N0734129Open Pit
2.25km NW, new TSFE0470261 N0730605 52968
76875
51.35
16.68
27.64
57304
36.64
186.49
19.91
17.55
22.72
18.35
ppmppmppm ppm
55.11
0.1
26.24
0.20.1
65.22
0.1
ppm
0.01
17.03
12.61
19.53
16.59
8.7478.15
994.83
222.27
Fe Zn Ni Mn Pb
57404 51.35 186.49 994.83 16.59
76875 27.65 17.55 78.15 8.74
115781 36.64 22.72 222.27 19.53
56367 16.68 19.91 65.22 12.61
52968 26.24 18.35 55.11 17.03
Adana
Old TSF
New TSF
Saprolite
St. John
Study Area

57
Source: fieldwork finding, July 2019
Table 4.7: Parameters of Groundwater Condition, Kokoya District, MNG-gold
Study Area Conductivity(𝜇S/cm) Dissolved
oxygen(mg/L)
Temperature(oC) Water
Level(m)
BH-1 24.87 2.41 26.49 19.97
24.7 2.73 27.07 19.78
26.81 2.59 26.47 19.89
26.47 2.25 26.29 20.28
BH-2 8.59 4.4 26.49 11.05
8.69 4.45 27.02 11.24
8.67 4.31 27.19 10.98
8.48 4.36 32.22 11.98
BH-4 8.3 2.86 26.97 9.11
15.55 3.06 27.09 7.78
8.59 2.68 26.59 9.02
16.19 2.65 26.81 8.98
BH-6 25.21 4.63 27.51 1.4
24.34 5.41 27.96 1.25
HM Mean SDFe 57304 76875 115781 56367 52968 71859 23507.54
Zn 51.35 27.65 36.64 16.68 26.24 31.71 11.68 31.71±11.68
Ni 186.49 17.55 22.72 19.91 18.35 53 66.77
Mn 994.83 78.15 222.27 65.22 55.11 283.12 361.03
Pb 16.59 8.74 19.53 12.61 17.03 14.9 3.79 14.9±3.79
283.12±361.03
Concentrations M±SD71859±23507.54
53.00±66.77

58
25.22 5.98 27.93 1.26
24.94 6 27.74 1.17
KMW06 6.72 5.86 26.27 8.52
7.03 5.57 26.49 8.85
7.79 5.2 26.9 10.18
8.43 6.08 26.72 9.62
Source: fieldwork finding, July 2019
Table 4.8: Ground water level for July 2019
Source: fieldwork finding, July 2019
Week 1 Week 2 Week 3 Week 4
Depth(m) Depth(m) Depth(m) Depth(m)
19.19 19.78 19.89 20.28
11.05 11.24 10.98 11.98
9.11 7.78 9.02 8.98
1.4 1.25 1.26 1.17
8.52 8.85 10.18 9.62
BH-4
BH-6
KMW06
Well Hole Number
Month of July 2019
BH-1
BH-2