Embed Size (px)
Citation preview

Assessment of Fruit and Vegetable
Availability and Consumption
in English Speaking Sub-Saharan
African Countries

Filled by 3 representatives per country:
• Agriculture sector
• Health sector
• Education sector
15/21 countries
(71% respondants)
The Questionnaire for National Assessment

The Questionnaire for National Assessment
5 parts:
• Production for domestic markets and exports
• Importations
• Consumption trends and behaviors
• Availability
• National Programmes for the promotion of
F&V consumption

Part 1 – Data on Production and Trade
• Data from the Ministry of Agriculture or estimates
• Complete for few countries (e.g. KEN, MAL, SAF, ZIM)
• Accurate data on exports on few crops
– Ex.: Nuts (cashew nuts, macadamia nuts)
• Almost no data on domestic markets except in ETH (study from CSA in 2009-10) and ZIM (MOAMID)
• Often lack of information on backyard production
– e.g. no avocado reported in SWA, or mango in SUD, or tomato in SIE
– no reference to leafy vegetables (most countries)

• No clear indication whether constant or increasing production
• No clear indication whether more or less producers, although large majority of small holders
• No clear indication whether more or less acreage with horticulture crops
• No clear information on irrigated crops according to the potential
Part 1 – Data on Production Systems

• No report data available, few studies (ETH, GHA)
• Some detailed estimations (see map)
Part 1 – Data on Post Harvest Losses

Part 1 – Data on Post Harvest Losses
No data
Mango: 40%
Vege.: 10-40%
Fruit: 8-60%
Vege.: 9-30%
Fruit: 30%
Vege.: 30%
Fruit: 20-35%
Vege.: 5-40%
Fruit: 1-40%
Vege.: 5-50%
Fruit: 30-60%
Vege.: 7-80%
Fruit: 4-15%
Vege.: 3-27%
Fruit: 1-30%
Vege.: 10-33%

• No report data available, few studies (ETH, GHA)
• Some detailed estimations (ETH, KEN, SUD, TAN, ZIM)
– Poor harvesting methods, handling, packaging and transportation, marketing (losses all the way)
– Mango (60%) and tomato (50%) the highest losses
– Lack of quality storage facilities at farm level and markets (e.g. 33% losses for onion in ZIM)
– Few airports equipped with storage facilities serve fresh produce exportation (ETH, KEN, TAN...)
Part 1 – Data on Post Harvest Losses

• No report data available, generally negligible
• Few case studies (potato in KEN)
• Some encouraging examples of reduced post-
harvest losses
– In okra due to dehydration (SUD)
– In citrus due to processing into juice (ZIM)
– Tomato (TAN), pineapple (KEN) canning
– SAF leading the processing industry in Africa (n.d.)
Part 1 – Data on Post Harvest Processing

• Constant or general increase of imports of fruits and vegetables over the last 3 years
– e.g. TAN vegetable imports raised during the last 3 years
• Bilateral partnership for specific products
– Dried onions from Belgium, garlic from ZAM, to SAF
– Apples from SAF to MAL, SEY, SWA, ZIM
– Cherry tomato to SUD from Egypt and ETH
• Multi-sourcing for specific products
– Grape and apple to ETH from SAF, Iran, India, Jordan, Egypt…
– Mango to GHA from GAM, Burkina, France, Brazil…
• Lack of information on regional trade except for ZIM
– No data for KEN, GHA (except for mango), UGA
Part 2 – Data on Importation

Part 3 – Data on Consumption
a. FRUITS
• Mostly during lunch (variability among countries)
• In general less than once per day for low-income and low-education consumers
• Once a day for middle- and high-income / education consumers
• Throughout the year for urban consumers thanks to imports
• Usually raw

URBAN RURAL
PawPaw Consumption (Estimates)
Low
Medium
High

b. VEGETABLES
• In general during lunch and dinner
• Mostly twice a day
• Inversely correlated to income / education
• Throughout the year
• Usually cooked
Part 3 – Data on Consumption
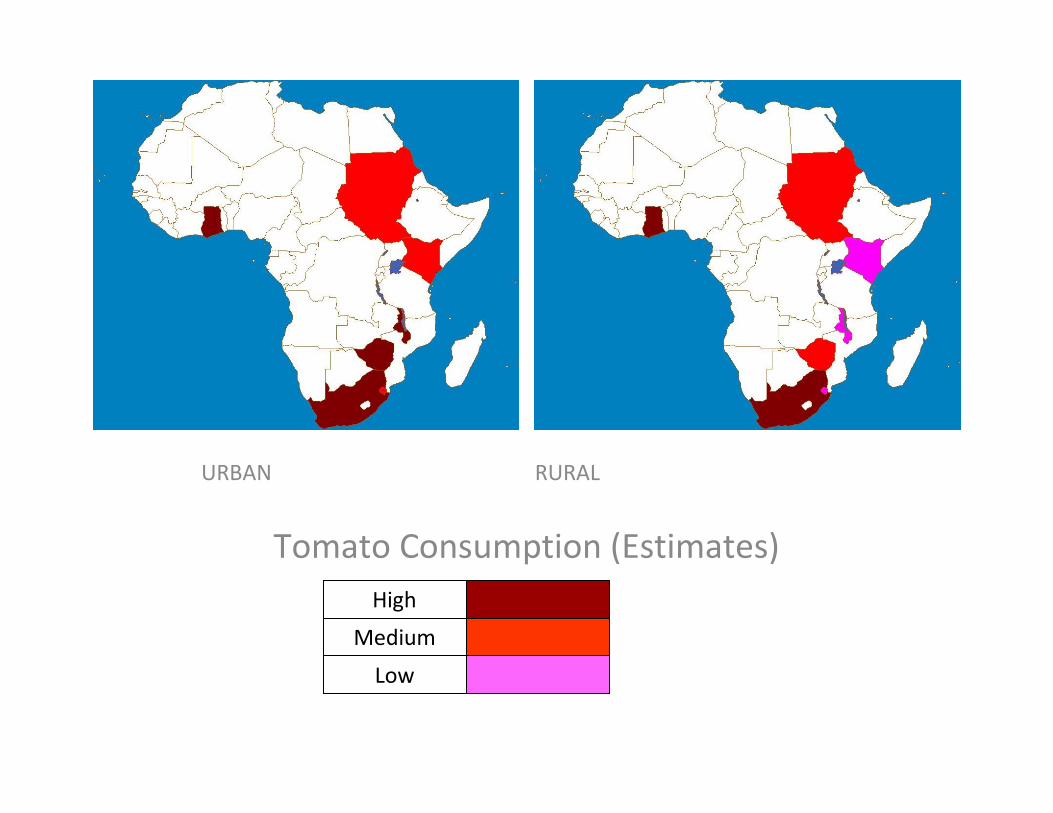
URBAN RURAL
Tomato Consumption (Estimates)
High
Medium
Low

Part 4 – Availability
Calculated availability in F&V in Africa - FAO 2006
400 g/day

One suggestion as follow up
Possibility to consolidate F&V Availability from the
questionnaires with data on population
AV= Production – Exports - Losses + Imports
AV per capita = AV/inhabitants*
* Missing information from the questionnaires

Part 5 – National Programs on F&V
Policy Agri-
Nutrition-Health
Target groups Priority areas On-going initiatives on F&V
consumption
BOT NAMPAADD Mothers and
youth
Increase F&V consumption X
ERI Promote awareness through
campaigns and programmesETH No (draft only) _
GAM No _
GHA No in Horticulture
Yes in Health
School children Create demand and
consumption of F&V
regenerative health
programme on national TV
Month of F&V
KEN Nat. Hort. Policy Increase availability by
planting F&V at school
gardens
X
LES To build habit/ culture of
eating fruits and vegetables LIB
MAL No Non gov. Initiatives
MAU Educate learners on how
plant and manage school
gardensNAM No _
NIG

Part 5 – National Programs on F&V
Policy Agri-Nutrition-
Health
Target groups Priority areas On-going initiatives on F&V
consumption
SAF • FRUIT INDUSTRY
PLAN
• National school
feeding schemes
• Zero hunger
campaign
Urban
households
Increase demand and
consumption of F&V
marketing and promotion of
fruits
SEY Establish a system of
monitoring production and
consumption of F&V in the
country
SIE No (draft only) _
SUD No _
SWA No Micronutrient campaign
Farmers' Field Day
Nutrition Days
TAN National Horticulture
Development
Strategy 2012-2021
Rural
households
To impart knowledge on F&V
consumption in the
household
x
Mango and Mushroom
testing festival
UGA No HIV -AIDS
infected
people
Increase in consumption of
F&V as a means of boosting
immunity
Bean campaign in 1983-84
ZAM
ZIM Yes _

INSTITUTION/ORGAZATION ROLE(S)
Ministry of Agriculture Increased production under Good Agricultural Practices
Ministry of Public Health
and Sanitation
Increased awareness creation on the importance of
consumption of fruits and vegetables (F & V)
Ministry of Education Include the importance of F&V in the school curriculum
Food IndustryPromote cottage industries to reduce post harvest loses
and also to ensure availability throughout the year
Development Partners Capacity building, technology transfer, service (e.g.
credit) provision
NGOsCapacity building, technology transfer, service (e.g.
credit) provision
Religious groups Advocacy and awareness creation
Civil Society Advocacy and awareness creation
Professional groupsProfessional guidance into the importance of
consumption of F & V
Part 5 – Role of various actors
(suggested by KEN)

Few Conclusions
• Lack of information and data on F&V at domestic and regional levels
• Promotion of higher consumption shall come along with good practices along the value chain
• Lack of formal policies to enable promotional initiatives at national level
• Poor contacts with mass media to raise awareness on nutrition and health issues
• School generally listed to best influence young generations and their parents

Thanks to all contributors!
Special thanks to
Luca Fornasari and
Christelle Monier
for their help in fast
analysis of the
questionnaires