Embed Size (px)
Citation preview
ASSESSMENT OF ENVIRONMENTAL STATUS
OF LUCKNOW CITY
(PRE-MONSOON)
FINDINGS OF A RANDOM SURVEY
Presented on
WORLD ENVIRONMENT DAY, 2008
INDIAN INSTITUTE OF TOXICOLOGY RESEARCH
Formerly Industrial Toxicology Research Centre
(Council of Scientific and Industrial Research)
Post Box 80, Mahatma Gandhi Marg,
Lucknow: 226 001
5th
June 2008

CONTENTS
SELECT FEATURE OF THE STUDY AT A GLANCE 1
1.1 INTRODUCTION 2
1.2 MONITORING LOCATIONS AND METHODOLOGY 5
1.2.1 AIR QUALITY 5
1.2.2 NOISE LEVEL MEASUREMENTS 8
1.3 RESULTS 9
1.3.1 AIR QUALITY 9
1.3.1.1 PARTICULATE MATTER (RSPM and SPM) 9
1.3.1.2 SULPHUR DI OXIDE (SO2) 13
1.3.1.3 OXIDES OF NITROGEN (NOx) 13
1.3.2 NOISE 15
1.4 TRENDS 16
1.4.1 AMBIENT AIR QUALITY 16
1.4.2 NOISE LEVEL 20
1.5 HEALTH HAZARDS OF AIR POLUTANTS 23
1.6 DISCUSSION 25
1.7 CONCLUSION 28
1.7 RECOMMENDATIION 28

1
Geographical Position : 26o 52' N Latitude
80o 56' E Longitude
128 m above Sea Level
Area : 310 sq. km.
Population : 22.45 lakhs as per 2001 Census
Projected Population : 45 lakhs as per Master Plan 2021
Climate : Subtropical climate, cool dry winter
(Dec. - Feb.) & summer (Mar - Jun.).
Temperature about 450C in summer
to 30C in winter. Average annual
rainfall about 100 cm.
Total Vehicle Population
In the Lucknow city as on 31/03/2008 : 968915
Growth of Vehicle over 2007-2008 : 7.08%
Road Transportation : Two Wheelers (79.66%)
Three Wheelers (1.36%)
Car (12.00%)
Bus (0.45%)
Total Number of Petrol Pumps : 89
Consumption of Petrol : 93,476 KL
Consumption of Diesel : 1,59,193 KL
Major Source of Pollution : Automobiles, D. G. sets, Civil
Constructions
Parameters Monitored : SPM, RSPM, SO2, NOX, and
Noise
Study Conducted by : Environmental Monitoring Section
IITR, Lucknow
Select Features of the Study at a Glance
GGGGGGGlanceGArea Glance
2
1.1 INTRODUCTION
Urban population is exposed to high level of air pollutants as well as noise due to
motor vehicle pollution. It is world wide phenomena and problem is more acute
especially in developing countries because of fast growth rate, slow adaptability of
upgrade technology and other socio economical factors. There are several reports
regarding the vehicular emission is responsible for higher level of air pollutants like
SPM, RSPM, SO2, NOx and other organic and inorganic pollutants including trace
metals and their adverse effects on human and environmental health.
Technological upgradation, scientific knowhow, and gradually increase use of
green fuel (CNG) has changed the pollutant level and their composition ratio,
especially reduction of the gaseous pollutants but increase in number of vehicles
causes more emission of pollutants especially the particulate matter, which includes the
fine and ultrafine particles. Besides tailpipe emission from vehicle exhaust, the other
source of pollutants are secondary sulphates, wood combustion, diesel and gasoline
genets exhaust and road dust are responsible for the higher level of air pollutants in
urban area especially the PM. Besides that, various types of vehicles and their different
operating modes such as idling, stop and start flow of vehicles, accelerating and
decelerating, combined with a high density of vehicles lead to a pollution source
problem and many trace metals are present in leaded and unleaded petrol, diesel oil,
antiwear substances which added to lubricants, brake pads and tyres and are emitted
by vehicles exhaust pipe.
Several scientific studies especially the epidemiological studies in different parts
of the worlds indicates the higher level of urban pollutants due to vehicular pollution
especially the respirable particles (PM10 < 10 μm) are responsible for the
cardiovascular as well as respiratory diseases including cancer of human being
because these particles can penetrate deep into the respiratory system, and studies
also indicates that the smaller the particle, severe the health impacts. Ambient
particulate matter may be carriers of acidic or toxic species (e.g., heavy metals, acids
and carcinogenic organic compounds) and may have detrimental effects on human
health and ecosystems. Besides particulate matter, literature also suggests that there is
a strong relationship between higher concentration of SO2 & NOx and several health
effects, like cardiovascular diseases, respiratory health effects such as asthma and
bronchitis, reproductive and developmental effects such as increased risk of preterm
birth.
In view of above facts, it is need of the hour to have a look at our city Lucknow
the capital of Uttar Pradesh with a population of 22,45,509 (Municipal corporation +
Cantonment) as per 2001 census and an area of 310 sq. km.

3
Total vehicle of different categories registered with RTO, Lucknow during 2007-2008 were 968,915 as against 904,831 during 2006-2007. The overall growth registered is 7.08 % during 2007-2008 (Table 1).
Table 1: Registered Vehicle with R.T.O. Lucknow during 2006 - 07 and 2007- 08
Sl. No.
Type of Vehicle Number of Registered Vehicles On 31st March
% Change
2007 2008
1 Multi Axial 1365 1611 48.85
2 Light, Medium and Heavy weight Vehicles (Four wheeler)
8232 11193 35.97
3 Light commercial vehicles(Three wheeler) 3362 3526 6.36
4 Light commercial Vehicles (Four wheeler) 6217 6738 8.38
5 Buses 4198 4364 3.95
6 Taxi 8012 7474 -6.71
7 Three Wheelers and Auto Rickshaw 15154 13224 -12.74
8 Two wheelers 720378 771846 7.14
9 Car 105674 116285 9.99
10 Jeep 13000 13705 5.144
11 Tractor 13923 14582 4.73
12 Trailers 1062 1082 1.88
13 Others 4254 3285 32.97
Total 904831 968915 7.08
Source: RTO, Lucknow
The details of vehicles plying as public transport (non government) on different
routes in Lucknow are shown in Table 2.
.
Table 2: Status of Public Transport Available on Different Routes (31.03.08)
Sl. No. Type of vehicles Number
1 Buses
(LMPS) Total 105
CNG Bus 43
2 Tempo/Taxi
Total 2116
Diesel 214
CNG 1902
3 Auto Rickshaw
Total 4177
Diesel 353
CNG 3024
Source: RTO, Lucknow
Uttar Pradesh State Road Transport Corporation (UPSRTC) introduced bus
services under the banner “Lucknow Mahanagar Parivahan Sewa” on different routes of
Lucknow city. The details of bus routes and number of buses plying as on 31.03.2008
are given in Table 3.

4
Table 3: Details of Lucknow city bus service
Sl. No.
Route No. To and Fro No. of Buses
1 11 Chinhat-Gomti Nagar-Alambagh 18
11 A Chinhat-Gomtinagar-Dalibagh-Charbagh 02
11B Chinhat-Gomtinagar-Charbagh-SGPGI 02
11C Charbagh-Uttaria-Sardar Patel Dental college 01
11D Charbagh-Babasaheb Bhimrao Ambedkar-BB 01
11E Charbagh-Telibagh-Ganesh Kunj 01
2 12 Chinhat-Scooter India 10
3 23 Rajinikhand-Gudamba thana 13
4 24 Charbagh - Engineering College 13
5 25 Charbagh-Bijnor 02
6 31 Alambagh – IIM 02
7 33 Alambagh- Engineering College 15
8 34 Alambagh-Charbagh-Hazratganj-Kapporthala-
Keshavnagar
01
9 44 Charbagh-Andhi Chowki 09
10 45 Parag Dairy – Polytechnic Chowraha 10
11 66 GPO- Hazratganj-Rajajipuram 02
12 Shuttle service
Charbagh-Alambagh 03
Total 105
Source: UPSRTC, Lucknow
Monitoring of Environmental Status of Lucknow city with respect to air and noise is being conducted by IITR, since 1997 twice in a year (pre monsoon and post monsoon in the month of May and October respectively) to assess the environmental quality and its trends. The study was conducted with the following aim and objectives. To assess the ambient air quality with respect to SPM, RSPM, SO2 and NOx.
To study trends of pollutants over a period of time.
To assess day and night time noise to ensure compliance of permissible noise
levels. To create a database for future use.
To create public awareness about environmental pollution.
The present study is conducted during the month of March to May, 2008
representing the pre monsoon (summer) period.
5
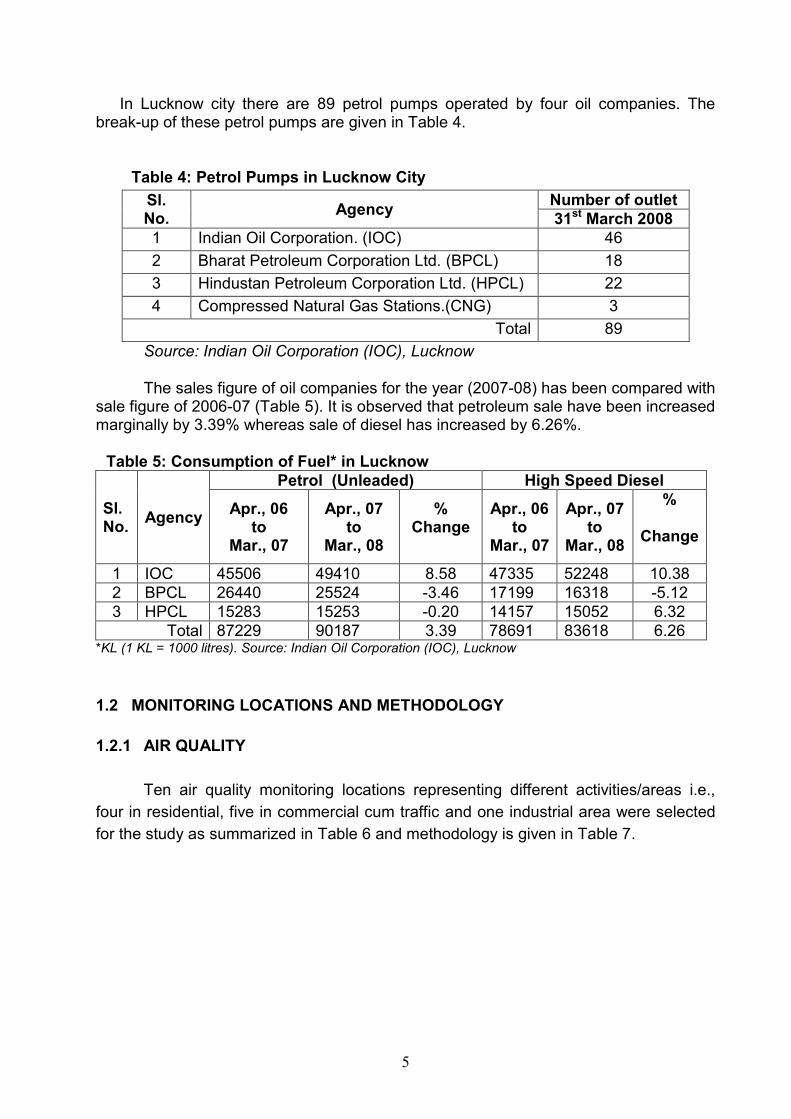
In Lucknow city there are 89 petrol pumps operated by four oil companies. The break-up of these petrol pumps are given in Table 4.
Table 4: Petrol Pumps in Lucknow City
Sl. No.
Agency Number of outlet
31st March 2008
1 Indian Oil Corporation. (IOC) 46
2 Bharat Petroleum Corporation Ltd. (BPCL) 18
3 Hindustan Petroleum Corporation Ltd. (HPCL) 22
4 Compressed Natural Gas Stations.(CNG) 3
Total 89
Source: Indian Oil Corporation (IOC), Lucknow The sales figure of oil companies for the year (2007-08) has been compared with
sale figure of 2006-07 (Table 5). It is observed that petroleum sale have been increased marginally by 3.39% whereas sale of diesel has increased by 6.26%.
Table 5: Consumption of Fuel* in Lucknow
Sl. No.
Agency
Petrol (Unleaded) High Speed Diesel
Apr., 06 to
Mar., 07
Apr., 07 to
Mar., 08
% Change
Apr., 06 to
Mar., 07
Apr., 07 to
Mar., 08
%
Change
1 IOC 45506 49410 8.58 47335 52248 10.38
2 BPCL 26440 25524 -3.46 17199 16318 -5.12
3 HPCL 15283 15253 -0.20 14157 15052 6.32
Total 87229 90187 3.39 78691 83618 6.26 *KL (1 KL = 1000 litres). Source: Indian Oil Corporation (IOC), Lucknow
1.2 MONITORING LOCATIONS AND METHODOLOGY
1.2.1 AIR QUALITY
Ten air quality monitoring locations representing different activities/areas i.e.,
four in residential, five in commercial cum traffic and one industrial area were selected
for the study as summarized in Table 6 and methodology is given in Table 7.

6
Table 6: Air Quality Monitoring Locations
Sl. No. Locations Activity
1 Aliganj
Residential
2 Vikas Nagar
3 Indira Nagar
4 Gomti Nagar
5 Hussainganj
Commercial cum
traffic
6 Charbagh
7 Alambagh
8 Aminabad
9 Chowk
10 Amausi Industrial
The brief description of each sampling site is given below:-
I. Aliganj
Earlier, Aliganj was a residential area, now it has become a semi commercial
area. In this locality, the main source of air pollution is vehicular emission. Most of the
people are using LPG gas for cooking. Aliganj has a traffic route from Engineering
College to Power House LDA Colony Kanpur Road via Charbagh railway station. In this
route means of mass public transportation is by jeep, city buses, three wheeler (Vikram
and tempo) which are run by diesel and CNG. Monitoring location was at CSIR
Scientist Apartments; sector K, near main road. The main vehicle was two wheeler,
passenger car and maxi cab (Jeep).
II. Vikas Nagar
Like Aliganj, Vikas Nagar was earlier a purely residential area and now it has
become a semi commercial area. On the main route public transport is by Vikram
tempo, minibuses and buses. In Vikas Nagar, vehicular emission is mainly dominated
by two wheelers, passenger cars and pubic transport. The monitoring location was at a
residential area, which is about 500 meter away from the Vikas Nagar main road.
III. Indira Nagar
Indira Nagar is now a semi commercial area. In this area the means of public
transport is by Jeep and buses running on diesel. In day time, main source of vehicular
emission is public transport, two wheelers and passenger cars. The main Ring Road
pass through Indira Nagar is carrying high volume of mixed vehicular traffic. During
night time large volume of different capacity of commercial trucks pass though this
route, generating high level of air and noise pollution. Monitoring was carried out 30 m
away from the main Ring Road.

7
IV. Gomti Nagar
Gomti Nagar is a residential area, dominated by middle and upper class families,
using LPG gas for cooking. Source of air pollution is public transport (tempo, jeep and
mini buses), two wheeler and passenger car. Night time traffic flow is low. The
monitoring location was in Vinay Khand, near Jaipuria crossing about 25 meter away
from the main road
V. Hussainganj
In Hussainganj, the monitoring location was 40 meter away from the main road.
It is a purely commercial place and during day time traffic flow are city buses, jeeps, two
wheelers and passenger cars. Night time commercial vehicles were the main source of
pollution.
VI. Charbagh
The place is congested with roadside make shift shops/hawkers and having a
high traffic flow. The major source of pollution is auto exhaust from mixed type of
vehicles including buses and trucks during night hours. One of the important sources is
diesel locomotive. It is one of the busiest places in Lucknow city. The monitoring
location was near the main traffic junction.
VII. Alambagh
In Alambagh, monitoring location was 100 m away from the Alambagh crossing
on the main Lucknow – Kanpur road. The main source of pollution is vehicular exhaust.
In day time, source of pollution is from city as well as from inter city buses, tempos, two
wheelers and passenger cars. In night time trucks and long distance buses are the
main sources of pollution. Major source of pollution in the area is diesel engine driven
vehicular traffic.
VIII. Aminabad
The monitoring location was situated in the central place of Aminabad. This is
purely commercial area mainly consisting mainly of shopping complexes. Aminabad
serves as major shopping area for upper middle class and middle class family. The
whole area is congested having narrow lanes and mixed traffic ranging from bicycles,
rickshaws to two wheeler and passenger cars. Sampling site was located adjacent to
the Jhandewala Park.
IX. Chowk
The monitoring location was 100 m away from the main road. Area is residential

8
cum commercial. Source of pollution is mainly from tempo, two wheeler and passenger
car. During night time commercial vehicles passes through the main road.
X. Amausi
Amausi is an industrial area. There are a number of small-scale industries. In
this area, main source of pollution is from vehicular as well as industrial. The monitoring
location was about 300 meter away from the main Lucknow - Kanpur road.
Table 7: Methodology for Air Quality Monitoring
Particulars SPM RSPM SO2 NOx
Sampling equipment HVS RDS HVS/RDS with gaseous sampling
attachment
Collection media Glass Fibre *TCM NaOH
Flow rate 1.0-1.3 m3/min 0.5 L/min
Analytical method Gravimetric Spectrophotometry
Frequency 24 hourly 8 hourly
Sampling duration Continuous for 24 hours
No. of days of sampling at each location
8 days (Once a week)
HVS: High Volume Sampler, RDS: Respirable Dust Sampler, *TCM: Tetra chloro-mercurate
1.2.2 NOISE LEVEL MEASUREMENTS
The measurement of noise level was carried out at twelve locations for 30
minutes at each location during the day time (6 AM to 10 PM) and night time (10 PM to
6 AM). All measurements were made with the “A” weighing filter at a height of receptor
organ, i.e., ~1.5 metres above the ground level. The location for the noise level
measurement is given in Table 8.
Table 8: Noise Monitoring Location
Sl. No. Locations Activity
1 Aliganj
Residential 2 Vikas Nagar
3 Indira Nagar
4 Gomti Nagar
5 Hussainganj
Commercial cum traffic
6 Hazratganj
7 Charbagh
8 Alambagh
9 Aminabad
10 Chowk
11 Amausi Industrial
12 Talkatora

9
1.3 RESULTS
1.3.1 AIR QUALITY
The detailed results of air quality monitoring are presented in Table 9 &10 and
Fig. 1.
1.3.1.1 PARTICULATE MATTER (RSPM and SPM)
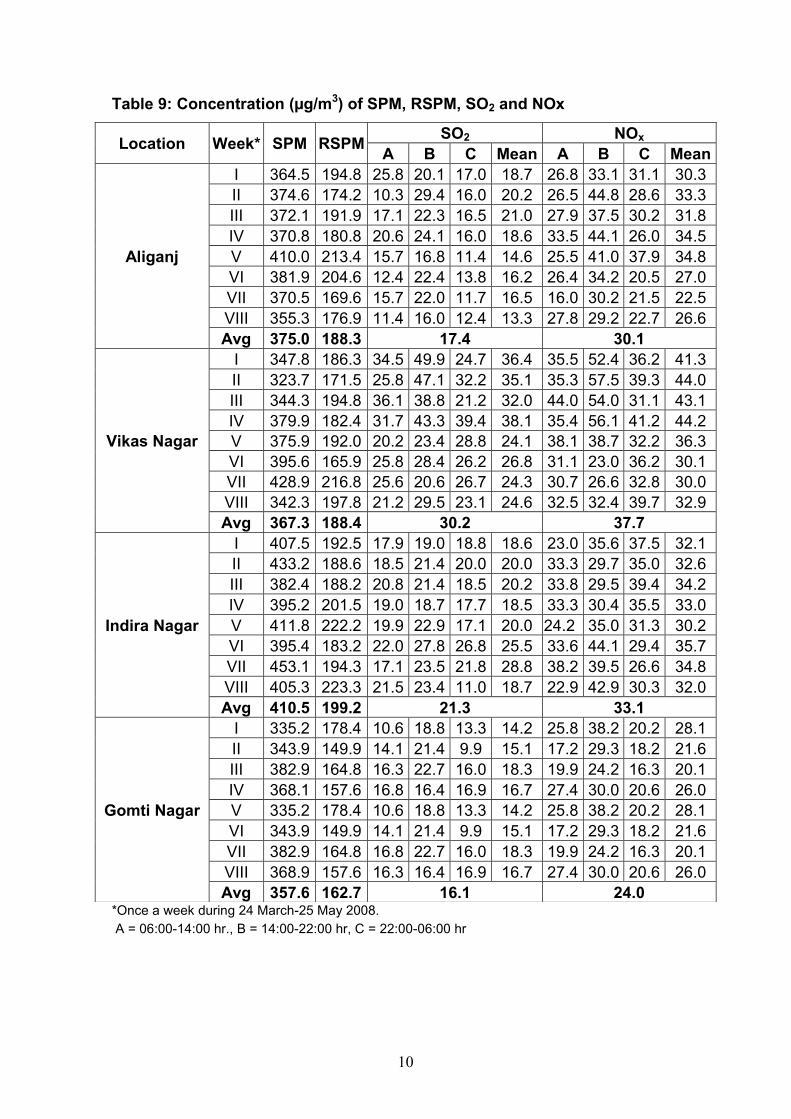
In residential areas (Aliganj, Vikas Nagar, Indira Nagar and Gomti Nagar) the
average concentration of RSPM and SPM were in the range of 162.7 to 199.2 and
357.6 to 410.5 µg/m3 respectively.
In commercial areas (Hussainganj, Charbagh, Alambagh, Aminabad and Chowk)
the average concentration of RSPM and SPM were in the range of 183.8 to 216.2 and
371.8 to 425.1 µg/m3 respectively.
In industrial area (Amausi), the average concentration of RSPM and SPM were
found to be 167.2 and 396.1 µg/m3 respectively.
The details of SPM & RSPM levels are presented in Table 9 and average of
SPM and RSPM in Table 10 and Fig. 1.
All the values of RSPM and SPM, except in Amausi under industrial area were
above the prescribed National Ambient Air Quality Standards (NAAQS) 100 and 150
µg/m3 for RSPM and 200, and 500 µg/m3 for SPM in residential, rural and other area
and Industrial areas respectively.
10
Table 9: Concentration (µg/m3) of SPM, RSPM, SO2 and NOx
*Once a week during 24 March-25 May 2008.
A = 06:00-14:00 hr., B = 14:00-22:00 hr, C = 22:00-06:00 hr
Location Week* SPM RSPM SO2 NOx
A B C Mean A B C Mean
Aliganj
I 364.5 194.8 25.8 20.1 17.0 18.7 26.8 33.1 31.1 30.3
II 374.6 174.2 10.3 29.4 16.0 20.2 26.5 44.8 28.6 33.3
III 372.1 191.9 17.1 22.3 16.5 21.0 27.9 37.5 30.2 31.8
IV 370.8 180.8 20.6 24.1 16.0 18.6 33.5 44.1 26.0 34.5
V 410.0 213.4 15.7 16.8 11.4 14.6 25.5 41.0 37.9 34.8
VI 381.9 204.6 12.4 22.4 13.8 16.2 26.4 34.2 20.5 27.0
VII 370.5 169.6 15.7 22.0 11.7 16.5 16.0 30.2 21.5 22.5
VIII 355.3 176.9 11.4 16.0 12.4 13.3 27.8 29.2 22.7 26.6
Avg 375.0 188.3 17.4 30.1
Vikas Nagar
I 347.8 186.3 34.5 49.9 24.7 36.4 35.5 52.4 36.2 41.3
II 323.7 171.5 25.8 47.1 32.2 35.1 35.3 57.5 39.3 44.0
III 344.3 194.8 36.1 38.8 21.2 32.0 44.0 54.0 31.1 43.1
IV 379.9 182.4 31.7 43.3 39.4 38.1 35.4 56.1 41.2 44.2
V 375.9 192.0 20.2 23.4 28.8 24.1 38.1 38.7 32.2 36.3
VI 395.6 165.9 25.8 28.4 26.2 26.8 31.1 23.0 36.2 30.1
VII 428.9 216.8 25.6 20.6 26.7 24.3 30.7 26.6 32.8 30.0
VIII 342.3 197.8 21.2 29.5 23.1 24.6 32.5 32.4 39.7 32.9
Avg 367.3 188.4 30.2 37.7
Indira Nagar
I 407.5 192.5 17.9 19.0 18.8 18.6 23.0 35.6 37.5 32.1
II 433.2 188.6 18.5 21.4 20.0 20.0 33.3 29.7 35.0 32.6
III 382.4 188.2 20.8 21.4 18.5 20.2 33.8 29.5 39.4 34.2
IV 395.2 201.5 19.0 18.7 17.7 18.5 33.3 30.4 35.5 33.0
V 411.8 222.2 19.9 22.9 17.1 20.0 24.2 35.0 31.3 30.2
VI 395.4 183.2 22.0 27.8 26.8 25.5 33.6 44.1 29.4 35.7
VII 453.1 194.3 17.1 23.5 21.8 28.8 38.2 39.5 26.6 34.8
VIII 405.3 223.3 21.5 23.4 11.0 18.7 22.9 42.9 30.3 32.0
Avg 410.5 199.2 21.3 33.1
Gomti Nagar
I 335.2 178.4 10.6 18.8 13.3 14.2 25.8 38.2 20.2 28.1
II 343.9 149.9 14.1 21.4 9.9 15.1 17.2 29.3 18.2 21.6
III 382.9 164.8 16.3 22.7 16.0 18.3 19.9 24.2 16.3 20.1
IV 368.1 157.6 16.8 16.4 16.9 16.7 27.4 30.0 20.6 26.0
V 335.2 178.4 10.6 18.8 13.3 14.2 25.8 38.2 20.2 28.1
VI 343.9 149.9 14.1 21.4 9.9 15.1 17.2 29.3 18.2 21.6
VII 382.9 164.8 16.8 22.7 16.0 18.3 19.9 24.2 16.3 20.1
VIII 368.9 157.6 16.3 16.4 16.9 16.7 27.4 30.0 20.6 26.0
Avg 357.6 162.7 16.1 24.0

11
Table 9: Concentration (µg/m3) of SPM, RSPM, SO2 and NOx, Continued...
*Once a week during 24 March-25 May 2008.
A = 06:00-14:00 hr., B = 14:00-22:00 hr, C = 22:00-06:00 hr
Location Week* SPM RSPM SO2 NOx
A B C Mean A B C Mean
Hussainganj
I 459.3 226.7 44.3 34.6 38.6 39.2 52.7 46.2 38.3 45.7
II 487.3 223.7 31.4 44.7 50.2 42.1 46.3 61.4 44.3 50.7
III 454.0 245.6 36.1 42.8 48.2 42.4 58.7 55.5 47.7 54.0
IV 409.4 205.4 33.3 39.5 44.4 39.1 49.3 60.9 39.2 49.8
V 422.5 223.4 28.5 33.3 23.7 28.5 34.8 44.7 28.9 36.1
VI 422.2 221.2 21.9 32.6 24.7 26.4 36.8 51.8 18.8 35.8
VII 351.3 171.4 28.1 36.9 17.1 27.4 37.7 57.9 17.4 37.7
VIII 394.5 212.4 20.8 32.9 21.4 25.1 35.0 46.8 16.3 32.7
Avg 425.1 216.2 33.8 42.8
Charbagh
I 456.3 212.5 30.8 38.0 38.0 35.6 41.1 50.7 42.5 44.7
II 433.7 193.6 33.2 30.1 31.3 31.5 35.7 33.6 33.5 34.3
III 445.7 230.3 32.9 35.5 29.1 32.5 40.5 38.0 35.8 38.1
IV 463.2 204.9 30.8 30.9 39.2 33.6 33.4 33.3 36.8 34.5
V 442.9 212.0 28.8 28.6 18.5 22.7 31.7 38.4 19.8 30.0
VI 416.0 193.9 23.7 32.3 29.6 28.5 40.5 49.2 43.3 44.3
VII 409.5 233.3 24.9 29.4 25.1 26.5 53.1 53.8 45.9 50.9
VIII 378.5 204.9 26.5 32.8 22.6 27.3 56.7 59.9 36.7 51.1
Avg 430.7 210.7 29.8 41.0
Alambagh
I 375.8 190.7 25.0 39.3 26.8 30.4 37.5 40.5 34.6 37.6
II 400.2 205.3 28.5 29.2 31.0 29.6 35.6 38.0 41.7 38.4
III 388.9 182.6 30.8 27.9 29.1 29.2 38.5 45.6 42.5 42.2
IV 378.5 196.6 28.5 28.5 23.1 26.7 38.0 40.4 46.2 41.5
V 393.1 185.5 15.0 28.4 23.6 22.3 42.7 55.5 43.1 47.1
VI 364.4 178.8 17.0 31.1 21.2 23.1 27.6 53.2 29.1 36.6
VII 438.1 217.8 19.8 26.4 17.9 21.4 38.0 56.3 36.3 43.5
VIII 455.1 226.5 22.7 25.9 28.5 25.7 48.4 44.2 23.1 38.6
Avg 399.3 198.0 26.1 40.7
Aminabad
I 401.3 189.6 20.0 22.8 20.9 21.2 30.0 25.3 30.5 28.6
II 396.6 213.6 18.3 21.4 26.1 21.9 32.8 35.6 38.0 35.5
III 423.5 185.6 25.7 30.4 24.6 26.9 38.5 43.1 40.2 40.6
IV 428.7 178.3 35.6 33.4 28.5 32.5 38.0 39.8 33.3 37.0
V 377.1 191.7 10.8 16.0 12.5 13.1 19.7 19.2 19.0 22.7
VI 361.3 171.0 16.1 19.5 14.1 16.6 26.2 38.7 22.9 29.3
VII 334.6 176.4 15.4 20.0 12.9 16.1 23.0 36.5 10.5 23.0
VIII 444.1 210.0 16.8 21.5 15.4 17.9 27.3 39.3 12.5 26.4
Avg 395.9 189.5 20.8 30.4

12
Table 9: Concentration (µg/m3) of SPM, RSPM, SO2 and NOx, Continued...
*Once a week during 24 March-25 May 2008.
A = 06:00-14:00 hr., B = 14:00-22:00 hr, C = 22:00-06:00 hr
Table 10: Average Concentration (µg/m3) of SPM, RSPM, SO2 and NOx
Area Location SPM RSPM SO2 NOx
Residential
Aliganj 375.0 188.3 17.4 30.1
Vikas nagar 367.3 188.4 30.2 37.7
Indiranagar 410.5 199.2 21.3 33.1
Gomti nagar 357.6 162.7 16.1 24.0
Average 377.6 184.7 21.3 31.3
NAAQS 200 100 80 80
Commercial
Hussainganj 425.1 216.2 33.8 42.8
Charbagh 430.7 210.7 29.8 41.0
Alambagh 399.3 198.0 26.1 40.7
Aminabad 395.9 189.5 20.8 30.4
Chowk 371.8 183.8 21.6 35.4
Average 404.6 199.6 26.4 38.0
NAAQS 200 100 80 80
Industrial Amausi 396.1 167.2 19.7 27.5
NAAQS 500 150 120 120
NAAQS=National Ambient Air Quality Standards
Location Week* SPM RSPM SO2 NOx
A B C Mean A B C Mean
Chowk
I 389.6 185.1 18.7 21.0 20.9 20.2 37.3 35.0 37.5 36.6
II 376.5 166.9 18.5 21.4 26.1 22.0 39.2 41.6 38.0 39.6
III 355.9 170.2 25.3 30.4 25.5 27.1 44.3 43.1 37.1 41.5
IV 346.3 188.4 29.7 32.6 26.1 29.5 45.6 46.4 40.4 44.1
V 397.0 194.6 17.0 22.8 17.7 19.2 24.1 41.7 36.0 34.0
VI 374.8 181.1 16.6 23.2 15.1 18.3 27.0 39.0 18.4 28.1
VII 327.5 175.0 17.7 20.2 15.4 17.8 28.8 34.0 28.2 30.3
VIII 406.9 209.3 16.8 28.7 11.0 18.8 27.4 39.3 20.2 29.0
Avg 371.8 183.8 21.6 35.4
Amausi
I 445.0 162.3 17.7 20.1 22.5 20.1 22.8 31.3 40.5 31.5
II 425.6 161.7 18.5 21.4 26.1 22.0 35.6 40.4 33.3 36.4
III 390.3 170.2 22.4 30.4 27.6 26.8 33.5 32.9 31.4 32.6
IV 373.5 188.4 28.5 29.9 26.1 28.2 41.6 34.9 35.6 37.4
V 328.8 159.1 15.0 16.8 10.0 13.9 15.2 27.4 15.2 19.3
VI 432.5 171.1 13.8 22.4 11.1 15.8 16.9 27.3 17.0 20.4
VII 379.4 143.4 14.1 19.7 15.8 16.5 17.2 24.1 19.2 20.2
VIII 393.6 181.4 15.8 16.7 11.0 14.5 19.3 27.1 20.1 22.2
Avg 396.1 167.2 19.7 27.5
13
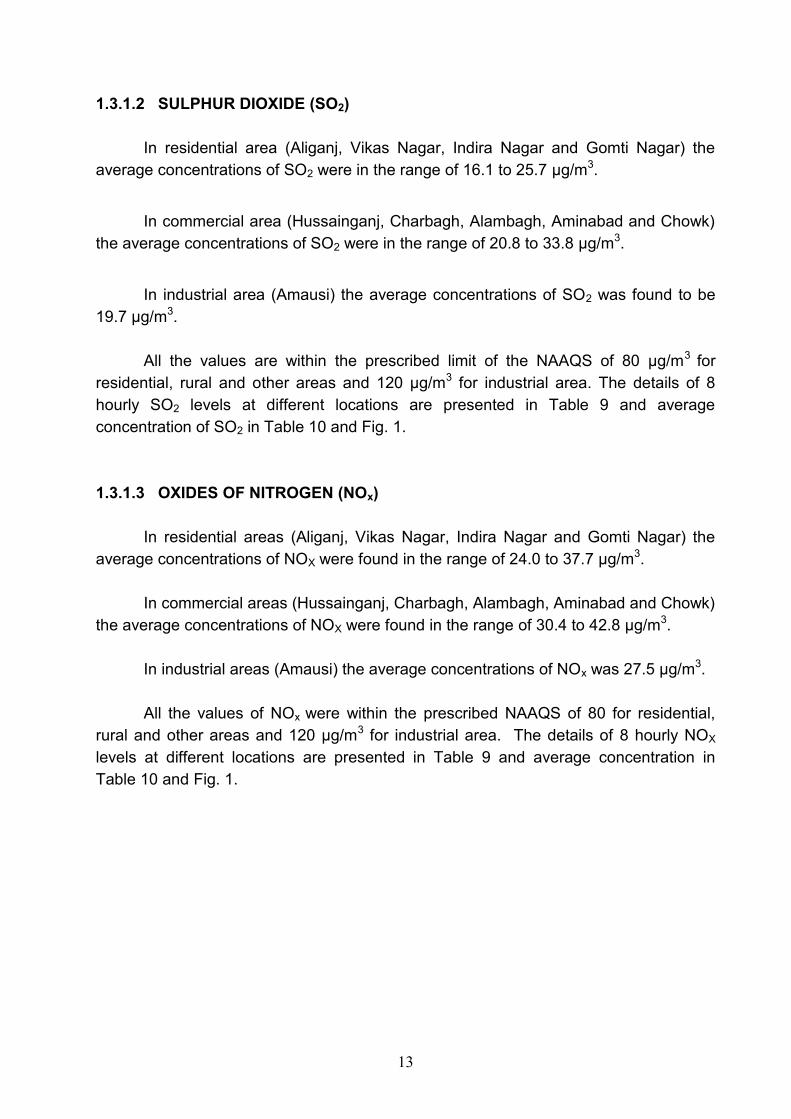
1.3.1.2 SULPHUR DIOXIDE (SO2)
In residential area (Aliganj, Vikas Nagar, Indira Nagar and Gomti Nagar) the
average concentrations of SO2 were in the range of 16.1 to 25.7 µg/m3.
In commercial area (Hussainganj, Charbagh, Alambagh, Aminabad and Chowk)
the average concentrations of SO2 were in the range of 20.8 to 33.8 µg/m3.
In industrial area (Amausi) the average concentrations of SO2 was found to be
19.7 µg/m3.
All the values are within the prescribed limit of the NAAQS of 80 µg/m3 for
residential, rural and other areas and 120 µg/m3 for industrial area. The details of 8
hourly SO2 levels at different locations are presented in Table 9 and average
concentration of SO2 in Table 10 and Fig. 1.
1.3.1.3 OXIDES OF NITROGEN (NOx)
In residential areas (Aliganj, Vikas Nagar, Indira Nagar and Gomti Nagar) the
average concentrations of NOX were found in the range of 24.0 to 37.7 µg/m3.
In commercial areas (Hussainganj, Charbagh, Alambagh, Aminabad and Chowk)
the average concentrations of NOX were found in the range of 30.4 to 42.8 µg/m3.
In industrial areas (Amausi) the average concentrations of NOx was 27.5 µg/m3.
All the values of NOx were within the prescribed NAAQS of 80 for residential,
rural and other areas and 120 µg/m3 for industrial area. The details of 8 hourly NOX
levels at different locations are presented in Table 9 and average concentration in
Table 10 and Fig. 1.

14
Fig. 1: Average concentration (μg/m3) of SPM, RSPM, SO2 and NOx in different areas of
Lucknow city during pre monsoon season (2008) and compared with prescribed
National Ambient Air Quality Standard (NAAQS).

15
1.3.2 NOISE
Elevated noise levels have been associated with adverse impact on human
health, ranging from minor annoyance to physiological damage. As such, traffic noise
has become a major environmental concern and a source of an ever-increasing level of
discomfort particularly in urban areas with high traffic congestion. The sources of noise
in the urban settings are primarily vehicular engines; exhaust systems, aerodynamic
friction, and tyre-pavement interaction. Traffic noise is affected by factors such as traffic
volume and speed, vehicle mix, pavement type, and vehicle conditions. In general, from
small vehicles the major part of noise emitted is at the pavement-tyre interface, heavy
vehicles emit much of their noise at the engine/exhaust. The monitoring data recorded
during the pre monsoon period (May, 2008) is presented in Table 11.
In residential areas, the day and night time noise level were recorded between
63.4 to 75.3 and 54.1 to 61.0 dB(A) respectively. All the values are higher than the
prescribed limit of 55 and 45 dB (A) for day and night time respectively.
In commercial and traffic area the day and night time noise level were recorded
between 67.1 to 75.3 and 59.5 to 71.2 dB (A) respectively. Noise level at all the
commercial sites during day and night time were found above the prescribed limit of 65
and 55 dB (A) respectively.
In industrial areas, Amausi and Talkotora the day and night time noise level were
recorded between 70.4 to 78.5 and 62.8 to 68.9 dB(A) respectively. Noise level at
Talkatora in the day time was higher than the prescribed limit of 75 dB (A) respectively.
Table 11: Noise Level dB(A) during Day and Night Time (May, 2008)
Sl. No. Area Location Day Night
1 Residential
Aliganj 63.4 54.1
Vikas Nagar 67.8 55.8
Indira Nagar 75.3 61.0
Gomti Nagar 64.9 59.3
Standard 55.0 45.0
2 Commercial
Hazratganj 67.1 60.8
Hussainganj 73.5 69.8
Charbagh 75.3 70.5
Alambagh 72.6 71.2
Aminabad 73.7 59.8
Chowk 74.2 59.5
Standard 65.0 55.0
3 Industrial
Amausi 70.4 62.8
Talkatora 78.5 68.9
Standard 75.0 70.0

16
1.4 TRENDS
1.4.1 AMBIENT AIR QUALITY
The observed SPM, RSPM, SO2 and NOx for 3 years data have been compared
to find out the prevailing trend of air pollution in Lucknow city Fig. 2- 4)
1.4.1.1 Suspended Particulate Matter (SPM)
At all the locations in residential areas, slight increase was recorded over
previous year and all the values are higher than the NAAQS (Fig. 2).
Among the commercial areas, RSPM values showed increasing trend at all the
locations than the previous year and are higher than the NAAQS (Fig 2).
Amausi under industrial area showed increasing trend over the previous year
and but lower than the NAAQS (Fig. 2).
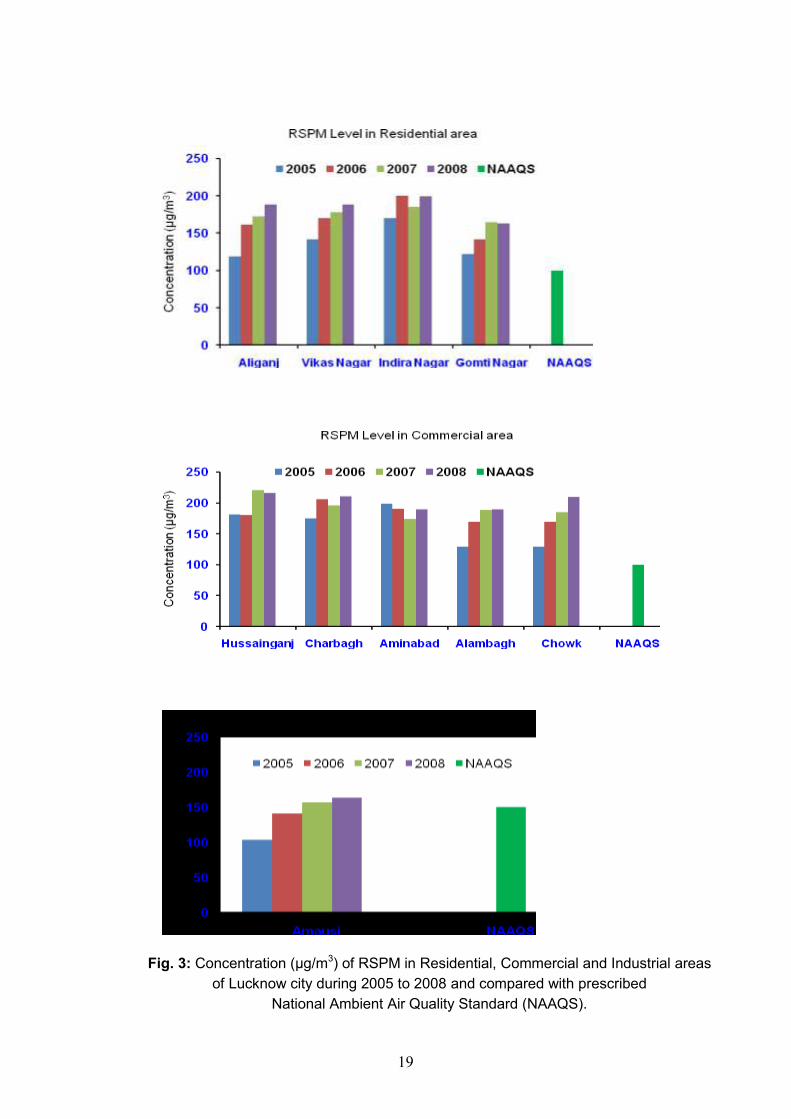
1.4.1.1 Respirable Suspended Particulate Matter (RSPM)
In all the locations in residential areas, slight increase was recorded over
previous year except Gomti Nagar and all the values are higher than the NAAQS (Fig.
3).
Among the commercial areas, RSPM values showed increasing trend at all the
locations except only in Hussainganj which showed slightly lower value than the
previous year. All the values are higher than the NAAQS (Fig 3).
Amausi under industrial area showed increasing trend over the previous year
and marginally higher than the NAAQS (Fig. 3).
1.4.1.2 Sulphur Dioxide (SO2)
SO2 level in residential areas namely Vikas Nagar registered slightly increasing
trend in comparison to last years (Fig. 4).
In the commercial areas, SO2 registered an increasing trend at all the locations
except in Hussainganj which shows slightly lower level when compared with the last
year values (Fig. 4).
The industrial area Amausi showed also increasing trend since 2005 (Fig. 4).

17
1.4.1.3 Oxides of Nitrogen (NOx)
Among the Residential areas all the locations showed slightly higher values in
comparison to last year (Fig.5).
Among commercial areas, NOx registered increasing trend at all the locations
when compared with the last year data (Fig. 5).
The industrial area Amausi showed increasing trend when compared with the
last year data (Fig.5).

18
Fig. 2: Concentration (μg/m3) of SPM in Residential, Commercial and Industrial areas of
Lucknow city during 2005 to 2008 and compared with prescribed
National Ambient Air Quality Standard (NAAQS).
19
Fig. 3: Concentration (μg/m3) of RSPM in Residential, Commercial and Industrial areas
of Lucknow city during 2005 to 2008 and compared with prescribed
National Ambient Air Quality Standard (NAAQS).

20
.
Fig. 4: Concentration (μg/m3) of SO2 in Residential, Commercial and Industrial areas of
Lucknow city during 2005 to 2008 and compared with prescribed
National Ambient Air Quality Standard (NAAQS).

21
Fig. 5: Concentration (μg/m3) of NOx in Residential, Commercial and Industrial areas of
Lucknow city during 2005 to 2008 and compared with prescribed
National Ambient Air Quality Standard (NAAQS).

22
1.4.2 TRENDS OF NOISE LEVEL
Current year’s noise data has been compared with the corresponding data of
previous years and are presented in Fig. 6 and 7. The comparative noise level in
residential, commercial and Industrial areas is described below:
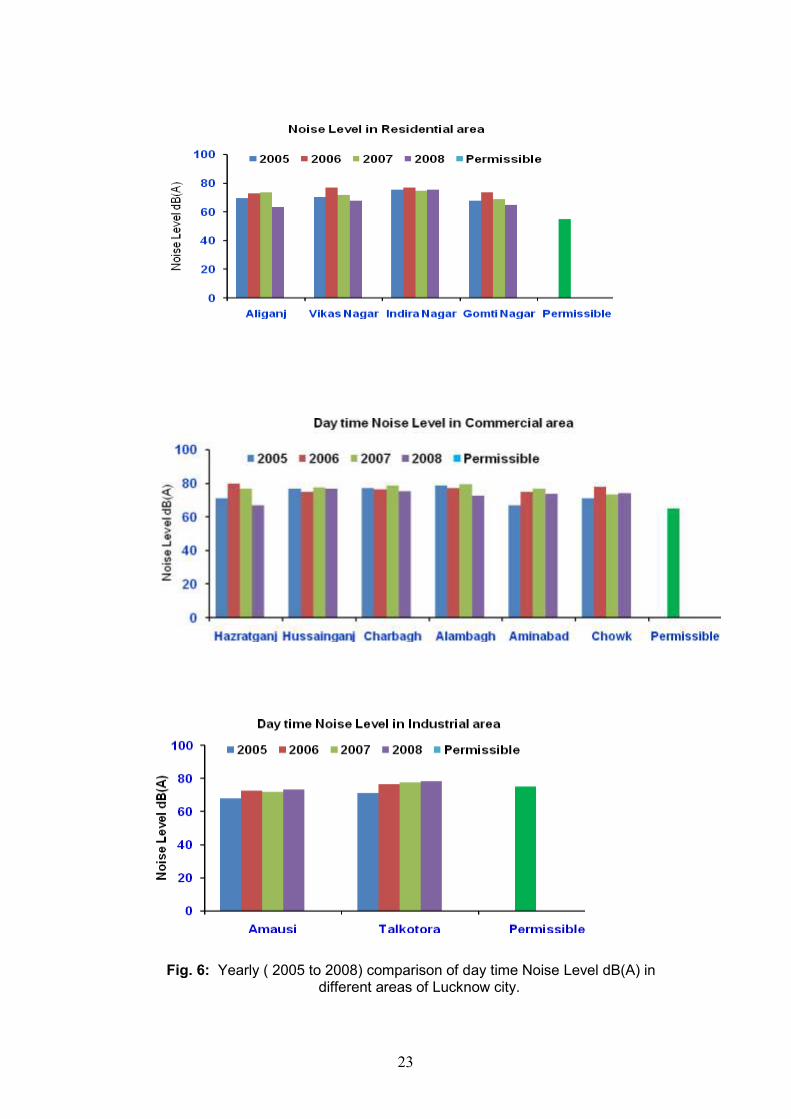
1.4.2.1 Day Time Noise Level
In residential areas all the locations shows slightly decreasing trend except Indra
Nagar which shows almost equal trend over the last year level. (Fig. 6).
In commercial cum traffic areas slightly lower levels were recorded except Chowk
slightly increasing trends was recorded over the last year (Fig.6).
In industrial area, in both the locations the noise level was recorded higher over
last year data. The comparative data are presented in (Fig. 6).
1.4.2.2 Night Time Noise Level
All four residential areas shows slightly lower trend was recorded over the last year
level (Fig. 7).
Among commercial areas, all the locations showed almost showed slightly higher
values than the previous year (Fig. 7).
In both the locations of industrial area, registered a slight decrease in the noise
level during nighttime over last year data (Fig. 7).
23
Fig. 6: Yearly ( 2005 to 2008) comparison of day time Noise Level dB(A) in
different areas of Lucknow city.

24
Fig. 7: Yearly (2005 to 2008) comparison of night time Noise Level dB(A) in different areas of Lucknow city.

25
1.5 HEALTH HAZARDS OF AIR POLUTANTS
1.5.1 Particulate Matter
The respirable particles known as PM10 have a diameter less than 10 µm and
when inhaled would penetrate beyond the larynx.
Particulate air pollution is associated with a range of effects on health including
effects on the respiratory and cardiovascular systems, asthma and mortality. In
addition, constituents of particulate matter, such as acid sulphates, may irritate the
upper airway and deep lung, reduce bronchial clearance, and modify the lung's
resistance to infection.
Effects:
Small particles can penetrate deeply into the lung and result in bronco-
constriction and an alteration in respiratory mechanisms.
Ultra fine particles ranging from 0.001 to 0.1 micron in diameter are able to
penetrate deep into the lung and to the alveolar sacs where gaseous exchange
occurs.
Small particles penetrate deeply into sensitive parts of the lungs and can cause
or worsen respiratory disease such as emphysema and bronchitis, and
aggravate existing heart disease.
They work by increasing both the rates of blood flow and vascular permeability to
white blood cells, elevating clotting activity, constriction of the airways and fever
induction.
1.5.2 Sulfur Dioxide (SO2)
SO2 is a colorless water-soluble gas. It smells like burnt matches. It can be
oxidized to sulphur trioxide, which in the presence of water vapour is readily
transformed to sulphuric acid mist. Sulphur dioxide is detectable to the human nose at
concentrations of around 0.5–0.8 parts per million (1400–2240 µg/m3).
Exposure to concentrations of 10 to 50 parts per million for 5 to 15 minutes
causes irritation of the eyes, nose and throat, choking and coughing.
This causes a reflex cough, irritation, and a feeling of chest tightness, which
may lead to narrowing of the airways, particularly likely to occur in people
suffering from asthma and chronic lung disease, whose airways are often
inflamed and easily irritated
For nasal breathing with low to moderate volumes the penetration into the
lungs is negligible.

26
For oral inhalation and larger volumes, doses may reach the segmental
bronchi
Exposure of the eyes to liquid sulfur dioxide, (from, for example an industrial
accident) can cause severe burns, resulting in the loss of vision.
Repeated or prolonged exposure to moderate concentrations may cause
inflammation of the respiratory tract, wheezing and lung damage
Other health effects include headache, general discomfort and anxiety.
1.5.3 Oxides of Nitrogen (NOx)
NOx causes a wide variety of health and environmental impacts because of
various compounds and derivatives in the family of nitrogen oxides, including nitrogen
dioxide, nitric acid, nitrous oxide, nitrates, and nitric oxide.
NO2 is a reddish-brown gas with a pungent and irritating odour. It transforms in
the air to form gaseous nitric acid and toxic organic nitrates.
Nitrogen Dioxide (NO2) can have both acute (short term) and chronic (long-term)
effects on health, particularly in people with asthma. Its toxicity relates to its ability to
form nitric acid with water in the eye, lung, mucus membrane and skin.
Effects
Eye, nose, and throat irritation
NO2 causes inflammation of the airways.
Long term exposure to NO2 may affect lung function
May increase the level of respiratory infections in children
Enhance the response to allergens in sensitised individuals.
Lowering the resistance to diseases such as pneumonia and influenza.
Extremely high-dose exposure (as in a building fire) to NO2 may result in
pulmonary edema and diffuse lung injury.
Continued exposure to high NO2 levels can contribute to the development of
acute or chronic bronchitis.
It can cause collapse, rapid burning and swelling of tissues in the throat and upper respiratory tract, difficult breathing, throat spasms, and fluid build-up in the lungs.
It can interfere with the blood's ability to carry oxygen through the body, causing
headache, fatigue, dizziness, and a blue color to the skin and lips.
Industrial exposure to nitrogen dioxide may cause genetic mutations, damage a
developing fetus, and decrease fertility in women.
Industrial exposure to nitric oxide can cause unconsciousness, vomiting, mental
confusion, and damage to the teeth.
27
Exposure to low levels of nitrogen oxides in smog can irritate the eyes, nose,
throat, and lungs and can cause coughing, shortness of breath, fatigue, and
nausea.
1.5.4 Noise
Elevated levels of noise have
Adverse effects varying from hearing loss to annoyance.
Noise produces both temporary and permanent hearing loss. Noise can range from the bursting of the eardrum to permanent hearing loss,
Cardiac and cardiovascular changes, stress, fatigue, dizziness, lack of concentration,
Cause of accident, irritation, inefficiency, deterioration in motor and psychomotor functions, nausea, interference with work tasks and speech communication, headaches, insomnia and loss of appetite and many others.
Continuous noise causes an increase in cholesterol level resulting in constriction of blood vessel making prone to heart attack and stress.
1.6 DISCUSSION
The emissions from vehicles exhaust are usually an outcome of several factors:
population density, congestion, weather, type of fuel and vehicle used, driving habits,
road conditions and maintenance schedule.
Similarly, weather, climate and topography of a region determine the ambient
conditions. However, exposure to emissions is mainly a function of socio-economic
status of an individual and the location-both house and office.
The automobile exhaust directly influences ambient air quality in urban area.
Overall the pollution levels show an increasing trend with respect to SPM and RSPM,
at most of the locations and also higher than the prescribed limit, whereas SO2 and
NOx also showed increasing trend with compared with previous year results except few
locations in residential area but well below the prescribed limit recommended by MoEF,
New Delhi.
The study revealed that concentration of the pollutants in residential, commercial
and industrial area showed little variations indicates that pollutants are well dispersed
within the urban area. The major concern is the particulate matter which is much higher
than the permission limit and affects the human health. The effect of pollutant especially
the particulate matter in urban areas depends on several factors like number of
concentration, size composition, time of exposure, and lastly the receptor (in case of
humans these factors depend on age, health conditions etc.).
28
Thus it is necessary to monitor the air quality as well as the health effects on
regular interval at strategic locations. Our pre monsoon monitoring survey might be of
help to focus on the pollution level in Lucknow city and its probable consequences. Our
data base since 1997 will also help the planners for sustainable development of the
city.
1.7 CONCLUSIONS
Monitoring of air pollutants such as SPM, RSPM, SO2 and NOx at 10 locations during
pre monsoon, 2008 revealed that-
The SPM and RSPM level at all the monitoring locations of residential and
commercial areas showed higher than the NAAQS.
The concentration of gaseous pollutants, SO2 & NOx were within the prescribed
NAAQS at all the locations.
Increasing trend for the RSPM was found at all the locations over the 2007 data
except at Gomti Nagar and Hussainganj.
The noise level at all the locations during day and night time showed much
higher level than the respective permissible limits.
Overall results indicate that vehicular pollution in the urban area is one of the major causes for deterioration of ambient air quality and high noise level.
1.8 RECOMMENDATIONS
Public mass transport must be strengthened to minimize use of personal vehicle.
Improve traffic management
Encroachment should be removed for smooth flow of traffic.
Check on fuel adulteration.
Regular sweeping of roads to avoid re-suspension of soil dust
Increase use of alternative fuel e.g., CNG.
Public awareness programme for automobile pollution.
Pressure horns to be removed from all vehicles.


![PERSONNELiitrindia.org/Admin/EnviromentalReport/efcb74ed-62eb-4e...Petroleum gas (LPG), coal, etc.]. Due to change of technologies and change of fuel consumption patterns, the composition](https://img.dokumen.tips/doc/110x75/5fe10d08cd3a35499f277b52/-petroleum-gas-lpg-coal-etc-due-to-change-of-technologies-and-change-of.jpg)


![Untitled-1 [iitrindia.org]iitrindia.org/En/pdf/hrd.pdf · Parvej Khan Created Date: 11/4/2015 5:51:24 AM](https://img.dokumen.tips/doc/110x75/5b89e7467f8b9a78618cd155/untitled-1-parvej-khan-created-date-1142015-55124-am-.jpg)