Embed Size (px)
Citation preview

ASSESSMENT OF ENERGY EXPENDITURE AND PHYSICAL ACTIVITY INTENSITY
THROUGH SIMULTANEOUS USE OF
HEART RATE MONITORING AND ACCELEROMETRY
A THESIS
SUBMITTED TO THE GRADUATE SCHOOL
IN PARTIAL FULFILLMENT OF THE REQUIREMENTS FOR THE DEGREE
MASTER OF SCIENCE
BY
MONICA M. KIRSCHNER
THESIS CHAIR: LEONARD A. KAMINSKY, Ph.D.
BALL STATE UNIVERSITY
MUNCIE, IN
MAY 2012

ACKNOWLEDGEMENTS
I would like to thank Dr. Kaminsky for serving as my thesis chairperson. I would like to thank you for the hard work, guidance, and wisdom that you have put into my research study. I would also like to thank you for answering all of my many questions I have asked in regards to my thesis. I feel very privileged to have been a part of such a prestigious program and feel honored to have been given great educational and professional opportunities within the Clinical Exercise Physiology Program. I would like to thank my parents, Mike and Terry Kirschner, for their love and support throughout this entire research project. I know that without you and your encouragement and belief in me, I would not be where I am today. Both of you have been there for me and I know you always will be. I would like to thank Cemal Ozemek for playing an integral role in helping me complete my thesis. You have been there through my ups and downs and are a great listener. You definitely were my sounding board whenever I had writer’s block and I greatly appreciate it. I want to wish you the best of luck in your future endeavors. I know you will be a great researcher and educator. Again, thank you. I would like to thank Brittany Wilkerson for helping me with every aspect of my thesis. You helped me recruit subjects, helped me with both visits, and helped me keep my sanity when little things would go wrong. I truly appreciate your positive attitude and all of your help. I could not have done it without you. Based on your work ethic and your desire for learning I know you will go far and achieve great things in whatever it is you decide to do. Again, thank you. Finally, I would like to thank the other Graduate Assistants: Kayla Campbell, Stacy Hoeksema, and Ross Lynema. The memories and friendships that we shared have made my experience here so meaningful. It has been enjoyable to see all of us grow from day one until now. I want to thank all of you for helping me grow as an individual. I also want to wish each one of you the best of luck in your future endeavors. Again, thank you and God Bless!

i
TABLE OF CONTENTS
LIST OF TABLES AND FIGURES ......................................................................................... iii ABBREVIATIONS.............................................................................................................. iv ABSTRACT ........................................................................................................................ v Chapters
I. INTRODUCTION ........................................................................................ 1 Purpose .................................................................................................... 7 Delimitations ............................................................................................ 8 Definitions ................................................................................................ 9
II. LITERATURE REVIEW ............................................................................... 10 Physical Activity ...................................................................................... 10 Doubly Labeled Water ............................................................................ 15 Self-Report ............................................................................................. 17 Indirect Calorimetry................................................................................ 19 Heart Rate Monitoring ............................................................................ 26 Accelerometry ........................................................................................ 33 Simultaneous Use of Multiple Methods .................................................. 41
III. METHODOLOGY ..................................................................................... 50 Subjects .................................................................................................. 50 Resting Measures ................................................................................... 51 Activities of Daily Living .......................................................................... 52 Indirect Calorimetry................................................................................ 53 Accelerometry ....................................................................................... 54 Heart Rate Monitor ................................................................................ 55 Physical Activity Assessment................................................................... 55 Resting Metabolic Rate ........................................................................... 56 Dual-Energy X-Ray Absorptiometer Scan ................................................ 57 Submaximal Exercise Test ....................................................................... 57 Data Analysis .......................................................................................... 58 Statistical Analysis .................................................................................. 59
IV. RESEARCH MANUSCRIPT ........................................................................ 60 Abstract .................................................................................................. 61
ii
Introduction ........................................................................................... 62 Methods ................................................................................................. 64 Subjects .................................................................................................. 64 Resting Measures ................................................................................... 65 Activities of Daily Living .......................................................................... 66 Indirect Calorimetry................................................................................ 67 Accelerometry ....................................................................................... 68 Heart Rate Monitor ................................................................................ 69 Physical Activity Assessment................................................................... 69 Resting Metabolic Rate ........................................................................... 70 Dual-Energy X-Ray Absorptiometer Scan ................................................ 71 Submaximal Exercise Test ....................................................................... 71 Data Analysis .......................................................................................... 72 Statistical Analysis .................................................................................. 72 Results .................................................................................................... 73 Discussion............................................................................................... 77 References ............................................................................................. 95
V. SUMMARY AND CONCLUSIONS ............................................................. 97 Future Research .................................................................................. 100
REFERENCES ........................................................................................ 103

iii
LIST OF TABLES AND FIGURES TABLE 1 Subject Characteristics ..................................................................... 88
TABLE 2 Average VO2 for Sedentary Activities ............................................... 88
TABLE 3 Average VO2 for Housework Activities ............................................. 88
TABLE 4 Average VO2 for Yard Work Activities ............................................... 89
TABLE 5 Average VO2 for Locomotion Activities ............................................ 89
TABLE 6 Average VO2 for Recreational Activities ........................................... 89
FIGURE 1 Mean Energy Expenditure: Sedentary .............................................. 90
FIGURE 2 Mean Energy Expenditure: Housework ............................................ 91
FIGURE 3 Mean Energy Expenditure: Yard Work ............................................. 92
FIGURE 4 Mean Energy Expenditure: Locomotion ........................................... 93
FIGURE 5 Mean Energy Expenditure: Recreational .......................................... 94

iv
ABBREVIATIONS
Symbols
ADL Activities of Daily Living
BMI Body Mass Index
bpm beats per minute
CAD Coronary Artery Disease
CSA Computer Science and Applications, Inc.
DB Douglas Bag
DLW Doubly Labeled Water
EE Energy Expenditure
FECO2 Fraction of Expired Carbon Dioxide
FEO2 Fraction of Expired Oxygen
HR Heart Rate
iDXA Intelligent Dual Energy X-Ray Absorptiometer
kcal kilocalories
PA Physical Activity
RER Respiratory Exchange Ratio
VCO2 Carbon Dioxide Production
VE Ventilation
VO2 Oxygen Uptake
VO2max Maximal Oxygen Uptake

v
ABSTRACT
THESIS: Assessment of Energy Expenditure and Physical Activity Intensity through Simultaneous Use of Heart Rate Monitoring and Accelerometry
STUDENT: Monica M. Kirschner DEGREE: Master of Science COLLEGE: Applied Sciences and Technology DATE: May 2012 PAGES: 115 Purpose: In order to have a complete understanding of the relationship between physical
activity (PA) and health, it is essential to be able to accurately assess PA in free-living situations.
The purpose of this study was to use three accelerometers located on each subject’s dominant
ankle, hip, and wrist and a HR monitor to estimate energy expenditure (EE) compared to
measured EE via indirect calorimetry while completing ADL. Methods: Forty subjects, aged 20-
60 years, completed two activities from each of the following activity categories: sedentary,
housework, yard work, locomotion, and recreational. During each activity, EE was measured
using the Cosmed K4b2. Subjects also wore three ActiGraph GT3X+ accelerometers and one
Polar RS800CX HR monitor. Correlations between EE measured by the Cosmed K4b2, activity
counts recorded by the Actigraph GT3x+ accelerometers and HR recorded by the Polar RS800CX
HR monitor were calculated, and a regression equation was developed to predict EE from the
multi-method approach. Results: The regression equation showed a significant relationship (r2 =
0.84; P < 0.05) with EE. Together, HR and the hip-worn accelerometer explained 73.4% of the
variance in EE with HR accounting for 59.3% (P < 0.05). Type of activity explained an additional

vi
5% of the variance in EE (r2 = 0.78; P < 0.05). Both the wrist- and ankle-worn accelerometers
each explained an additional 3% of the variance in EE (r2 = 0.81; r2 = 0.84, respectively) (P <
0.05). When cross-validated, the regression equation significantly overestimated sedentary
activities by 0.22 ± 0.08 kcals/min (P < 0.004) and underestimated housework activities by 0.20 ±
0.08 kcals/min (P < 0.01). Conclusion: The regression equation developed is a good predictor of
EE during selected ADL, and allows researchers to more accurately quantify free-living PA.

CHAPTER I
Introduction
PA is defined as any movement or posture that is produced by skeletal muscle
contractions and results in EE (23). For several years’, researchers, epidemiologists, exercise
scientists, and health professionals have tried to convey to individuals the importance of PA. PA
is known to promote better health, improve physical functioning, and increase longevity (10).
Many studies have clearly documented the dose-response relationship between PA and risk of
cardiovascular disease and premature mortality for both men and women of ethnically diverse
populations (53,72,78,95). However, more than half of the U.S. population still remains
sedentary (76). This high prevalence of physical inactivity can be attributed to technology
incentives, economic incentives, lack of self-motivation, lack of social support, and lack of time
(40).
Physical inactivity acts as an independent risk factor in increasing the risk of developing
coronary artery disease (CAD) and other chronic diseases (98). Such chronic diseases include
hypertension, obesity, dyslipidemia, and pre-diabetes which can also act as independent risk
factors for developing CAD along with age, family history, and cigarette smoking (98). CAD is the
leading cause of death in the United States for both men and women and is also the most
common form of heart disease in the United States. An estimated 616,000 deaths were due to
CAD in 2007 (76).

2
Various exercise prescriptions have been recommended in order to address the high
prevalence of physical inactivity. The most current PA recommendations come from the U.S.
Department of Health and Human Services (HHS). In 2008, the federal government
recommended individuals accumulate either 150 minutes of moderate intensity PA/week, 75
minutes of vigorous intensity PA/week or some combination of moderate and vigorous intensity
PA in bouts of ≥10 minutes (1). Moderate intensity, in absolute terms, can be defined as 3-6
metabolic equivalents (METs) and vigorous activity is any activity >6 METs. In relative terms,
moderate intensity can be defined as 40-<60% of an individual’s heart rate reserve; whereas,
vigorous intensity can be defined as any activity ≥60% of an individual’s heart rate reserve.
Muscle strengthening exercises were recommended to be completed two days/week. These
recommendations were focused on “reducing the risk of chronic disease and promoting health-
related fitness, particularly cardiovascular and muscular fitness” (1).
Attaining the aforementioned PA recommendations enables individuals to accrue
numerous health benefits. Such benefits may include improvements in cardiovascular and
respiratory function such as decreased heart rate (HR) and blood pressure measurements at a
given submaximal workload and an increase in exercise threshold for the onset of disease signs
or symptoms (98). Reductions in CAD risk factors as well as a decrease in morbidity and
mortality can be seen with increases in PA (98). Despite these health benefits as well as other
health benefits not mentioned, more than 50% of the U.S. adult population does not meet the
current PA recommendations (76).
In order for individuals to know whether they are attaining the recommended amounts
of PA, accurate and reliable methods of estimating PA intensity and EE for activities of daily
living (ADL) and structured bouts of activity must be determined. Researchers have developed

3
numerous ways of addressing this issue through both subjective and objective methods. The
initial efforts primarily utilized subjective methods such as surveys, logs, and questionnaires to
quantify EE and PA intensity levels. Subjective methods are inexpensive tools that are easily
applicable to large populations and provide low participant burden (100). However, when
utilizing subjective methods, subjects may misinterpret the questions being asked, may have
difficulty recalling duration and/or intensity of activities they performed, or subjects may
deliberately misrepresent the information (105). Conversely, objective methods (indirect
calorimetry, HR monitoring, and motion sensors) are able to account for limitations associated
with subjective methods and are able to provide a much more accurate presentation of one’s
activity. Even though these methods may be more expensive compared to subjective methods,
they take away recall error and misrepresentation of information (105). Several studies have
shown both subjective and objective methods to be fairly accurate when estimating EE and PA
intensity levels during structured bouts of exercise such as running, walking, and cycling
(17,37,43,45,54,107). Researchers have found individuals to be able to recall duration, type,
and workload during structured bouts of exercise more readily compared to recalling duration,
type, and workload during ADL (8). Also, research has found an individual’s HR and/or activity
counts from an accelerometer are directly correlated with the workload being performed during
structured bouts of exercise (31). However, in regards to estimating EE and PA intensity levels
while completing ADL, researchers are still trying to determine the most accurate method due
to the wide variety of intensities and complex movements that can occur during ADL. ADL may
involve an individual’s upper body, lower body, or use of their entire body for a given activity.
For instance, a hip mounted accelerometer does not accurately estimate EE and PA intensity
levels for non-ambulatory activities and/or upper body movement (7). Having an accurate

4
estimation of EE and PA intensity levels for both structured bouts of exercise and ADL will give
individual’s a clearer picture of their total daily PA.
Currently the most accurate way to measure PA intensity levels and EE for a given
activity is through indirect calorimetry. Indirect calorimetry has the capability to provide
estimates of intensity, duration, and short-term measurements of EE and fuel utilization through
the measurement of expired gasses (69). From this perspective, indirect calorimetry may be
considered the “gold standard” when wanting to know estimations of intensity, duration, and EE
for a given activity (i.e. walking, running, and cycling). However, the limitations of indirect
calorimetry include the expense of the equipment and the technical knowledge that is required
to operate the device and analyze the data. Thus, these limitations hinder the use of this
method within the general population.
HR monitoring is a more applicable method of estimating EE for individuals within the
general population. HR monitoring can be used to estimate an individual’s PA intensity as well
as EE while completing ADL and/or structured bouts of activity. HR measurements are
beneficial since it is a physiological parameter that is known to have a strong positive linear
correlation with EE (38). Other benefits to using HR monitoring as a method to estimate EE
include its relatively low cost, user friendliness, and its ability to give information on the
intensity of PA (93). Current literature has proposed multiple ways to use HR measurements to
estimate an individual’s EE. One predictor of daily EE has been the use of average pulse rate
(38). An individual’s net HR (activity heart rate – resting heart rate) has also been utilized to
quantify EE and has been found to be simple and accurate (101). Lastly, the most accurate way
to predict EE utilizing HR measurements is through single and multiple individual HR-VO2
calibration curves (3,26). The benefit to this last approach is that the method takes into account

5
differences in VO2max and HRmax that may exist between individuals. However, HR monitoring
does have its limitations. Even though HR is a physiological variable that reflects changes in PA
intensity, it is influenced by several factors such as mental stress, ambient temperature,
hydration status, emotion, activity mode, posture, and quantity of muscle mass involved in the
activity (44,57,93,103). Due to this high influence of various factors, researchers developed
other methods to quantify EE and PA intensity levels such as motion sensors.
Motion sensors, specifically accelerometers, are the most recent and accurate tools for
estimating EE and PA intensity levels. Accelerometers are small, portable units that are capable
of recording both accelerations and decelerations of the body, as well as duration of the activity.
Several studies have suggested that accelerometers are the most promising motion sensors for
the assessment of total PA in everyday life, yet their ability to accurately estimate EE and PA
intensity levels during lifestyle type activities still remains in question (13). Accelerometers are
capable of assessing ambulatory activities, but are not capable of assessing non-ambulatory
activities such as cycling, swimming, resistance training, etc. Another limitation of
accelerometers is the sensitivity of the motion sensor. Sensitivity refers to the level of noise or
vibrations in which the accelerometer can detect. An accelerometer that has a high sensitivity is
more likely to record lower vibrations and quicker movements; whereas, an accelerometer that
has a low sensitivity is more likely to record higher vibrations and slower movements. Data
suggests the use of triaxial accelerometers will underestimate total EE for both sedentary and
light intensity activities compared with measurements of EE from indirect calorimetry due to the
high sensitivity of the accelerometer (28). Brandon et al. also demonstrated the limitation of
sensitivity when assessing activity patterns in older adults (18). Older adults tend to have slower
gait speeds and often walk with a shuffle, they also tend to have lower EE than younger adults,

6
and the literature has found that existing monitors may have a flooring effect where sensitivity
is lost with faint and/or slow movement patterns (18). The location of the accelerometer also
poses a problem for accurate estimations of EE and PA intensity levels. Accelerometers are
usually mounted on the hip or waistband. However, Bassett et al. reported that hip-worn
accelerometers are unable to detect arm movements and the external work done in lifting or
pushing objects which may represent a considerable component of free living activities (7).
Atallah et al. reported the use of wearable accelerometers for activity recognition is often
difficult to predict which location(s) on the body can provide the most relevant features with
respect to activity classification (5).
In order to utilize the information that is obtained from accelerometers several
prediction equations have been developed relating activity counts to EE. The most current
regression equations for estimating EE were developed either during walking or running on a
treadmill (17,37,43,54,107). According to Crouter et al., these different equations pose a
problem for researchers because there is no single regression line that has the capability to
accurately predict EE or time spent in different PA intensities, across a wide range of activities
(31). Bassett et al. were able to show that regression equations developed during walking and
jogging slightly overestimated the energy cost of walking and light activities, whereas they
greatly underestimated the energy cost of moderate intensity lifestyle type activities (7). Thus,
lifestyle regression equations have been developed that have been shown to provide more
accurate estimates of EE for moderate intensity activities, but these equations have also been
shown to overestimate the EE of sedentary and light activities and underestimate the EE of
vigorous intensity activities (7). The most current prediction equation is the two-regression
model produced by Crouter et al (31). This two-regression model is based on activity
7
counts/minute and variability in activity counts between 10-second epochs and has the
capability to distinguish between walking, running, and other activities (31). According to
Crouter et al., this two-regression model provides better estimates of time spent in light,
moderate, and vigorous intensity activities compared to the single-regression models (31).
Statement of the Problem
In order to have a complete understanding of the relationship between daily PA and
health, it is essential to be able to accurately assess PA in free-living subjects (11,81). As
previously mentioned, there have been several methods—subjective and objective—developed
that are capable of estimating EE and PA intensity levels. These methods have been found to be
accurate when used to measure EE and PA intensity levels during structured bouts of activity
such as walking, running, and cycling (17,37,43). However, researchers have been unable to
determine a good method to estimate EE and PA intensity levels while individuals complete ADL.
Movements during ADL can be quite variable in regards to intensity and sometimes complex
causing the most currently used methods—HR monitoring and accelerometers—to be unable to
capture accurate estimations of EE and PA intensity levels (7). Therefore, the problem lies in not
having a good method to accurately estimate EE and PA intensity levels while completing ADL in
free-living situations.
Purpose
The purpose of this study was to use three ActiGraph GT3X+ accelerometers located on
each subject’s dominant ankle, hip, and wrist and one Polar RS800CX HR Monitor to estimate EE
compared to measured EE via indirect calorimetry while completing different ADL.

8
Hypothesis
It was hypothesized that the simultaneous use of HR monitoring and multiple
accelerometers located on the dominant ankle, hip, and wrist would provide an accurate
estimation of EE compared to indirect calorimetry. It was also hypothesized that utilizing
multiple methods to estimate EE would provide a more accurate estimation compared to
utilizing the Crouter equation.
Delimitations
Forty subjects, all between the ages of 20-60 years, completed a research study
regarding the simultaneous use of HR monitoring and accelerometry to estimate EE while
completing several different ADL. Subjects were asked to complete 10 randomly chosen ADL
during visit one. Subjects then completed a seven day PA Assessment. Subjects returned for a
second visit that consisted of a resting metabolic rate measurement, a dual-energy x-ray
absorptiometer (DXA) scan, and a submaximal exercise test. Data was collected from all
subjects and analyzed for statistical differences of EE between the simultaneous use of HR
monitoring and accelerometry compared to indirect calorimetry while completing ADL.
Significance
Numerous methods (i.e. questionnaires, HR monitoring, motion sensors) have been
utilized to estimate intensity and/or EE during ADL, but the extent to which these methods are
accurate and reliable remains in question. Precise estimates of PA are extremely important in
understanding dose-response relationships, clarifying which dimension of activity is most
strongly associated with a particular health outcome, improving the ability to monitor secular

9
trends in activity levels and the compliance to intervention programs, and cross-cultural
comparisons (98,101). However, there is still an inability to capture all aspects of PA due to
numerous limitations with individual methods. The significance of this study was to create a
reliable methodology that would potentially capture all aspects of PA. Thus, allowing
researchers and clinicians to have a more accurate assessment of total daily activity and making
individuals more aware of how active or inactive they are throughout the day.
Definitions
1. Physical Activity: Bodily movement that is produced by the contraction of skeletal muscle and
that substantially increases energy expenditure (98).
2. Accelerometer: an instrument or device for measuring acceleration forces. These forces may
be static, like the constant force of gravity pulling at your feet, or they may be dynamic, which
may be caused by moving or vibrating the accelerometer.
3. Activities of Daily Living: The tasks of everyday life. These activities include eating, dressing,
getting into or out of a bed or chair, taking a bath or shower, and using the toilet. Instrumental
activities of daily living are activities related to independent living and include preparing meals,
managing money, shopping, doing housework, and using a telephone.

CHAPTER II
Review of Literature
Physical Activity and Associated Health Benefits
Being physically active allows individuals the opportunity to accrue several health
benefits. PA promotes better health, improves physical functioning, and increases longevity
(10). However, more than 50% of the U.S. population does not meet current PA
recommendations and approximately 250,000 or 12% of deaths per year in the U.S. are
attributable to a lack of regular PA (39,63,76). The Centers for Disease Control and Prevention
(CDC) determined in 2005 that 23.7% of the U.S. population is completely sedentary (i.e.
reporting no leisure-time PA) (25). This high prevalence of physical inactivity can be attributed
to technology incentives, economic incentives, lack of self-motivation, lack of social support, and
lack of time (40).
Physical inactivity acts as an independent risk factor in increasing the risk of developing
coronary artery disease (CAD) which is the leading cause of death in the United States for both
men and women and is also the most common form of heart disease in the United States. An
estimated 616,000 deaths were due to CAD in 2007 (76). Roughly every 29 seconds an
American will experience a coronary event, and approximately every minute an American will
die from a coronary related event (19). Mortality rates seem to be plateauing due to
enhancements of both diagnostic and revascularization procedures, but morbidity rates still

11
appear to be on the rise (19). Not only does CAD take a toll on the health of individuals, but also
this epidemic disease presents problems from a financial standpoint. A recent statement
released by the American Heart Association (AHA) stated that high direct medical care and high
indirect costs of cardiovascular disease are approaching $450 billion per year and are expected
to rise over $1 trillion by the year 2030 (104). The majority of these direct and indirect costs are
related to short- and long-term care, not prevention, and the cost estimates do not include costs
related to obesity, diabetes mellitus, and tobacco use (104). CAD risk factors can be broken up
into two groups: non-modifiable and modifiable. Non-modifiable CAD risk factors include age,
gender, and family history. Whereas, modifiable CAD risk factors include tobacco use,
dyslipidemia, hypertension, obesity, diabetes mellitus, psychosocial factors, and physical
inactivity. Physical inactivity is of major concern because it can act as an independent risk factor
for not only CAD, but also for the development of other chronic diseases such as obesity,
diabetes mellitus, dyslipidemia, and hypertension.
There is strong evidence that confirms the effectiveness of being physically active. This
evidence was first observed in two classical studies—the Aerobics Center Longitudinal Study
(ACLS) and the Harvard Alumni Study (71,90). The ACLS was an observational study that
observed PA, physical fitness, and health outcomes of both males and females who were
receiving preventative medical examination (90). The subjects were followed for eight years for
all-cause mortality in relation to initial levels of cardiorespiratory fitness. For both men and
women there was a prominent inverse relationship between cardiorespiratory fitness and all-
cause mortality. The Harvard Alumni Study was also an observational study of approximately
17,000 men (71). These men attended Harvard University between 1916 and 1950 and were
followed for 16 years in order to determine the relationship between PA levels and all-cause
12
mortality. The results revealed an inverse dose-response relationship and found men who had
greater levels of PA at baseline to be associated with a lower risk of death from all causes. The
results also revealed men who expended >2,000 kcals/week had a 27% reduced risk of mortality
compared with men who expended <2,000 kcals/week. Paffenbarger et al. continued to define
the relationship between PA levels and all-cause mortality with epidemiological studies
throughout the 1980s (72).
Being physically active reduces the risk of all-cause mortality specifically by decreasing
HR and blood pressure measures, decreasing total cholesterol, triglycerides, and low density
lipoproteins, increasing high-density lipoproteins, increasing VO2max and decreasing body mass
index (BMI) and body fat percent. Several research studies have also shown that individuals
with higher activity and/or fitness levels are associated with lower incidence rates for combined
cardiovascular diseases, CAD, stroke, type 2 diabetes, osteoporotic fractures, cancer of the colon
and breast, and gallbladder disease (1,40,47,106).
Based on the scientific evidence that has discovered an inverse relationship between PA
levels and all-cause mortality, researchers, clinicians, and health organizations have developed
numerous exercise prescriptions over the years to help address the high prevalence of physical
inactivity. There has been a continued debate as to how much, what type, how often, what
intensity, and how long the PA dose should be in order to gain the aforementioned health
benefits; thus, leading to different public health and clinical recommendations. PA
recommendations have evolved over time due to methodological differences in collecting and
interpreting the data. Early data of PA levels were usually assessed via questionnaires that
relied on self-reports of the subject’s habitual level of PA. As technology began to advance in
the United States, scientists and researchers began to develop more sophisticated methods of

13
measuring habitual PA levels which have led to a better understanding of the dose-response
relationship between PA and health.
In 1990 the American College of Sports Medicine (ACSM) proposed specific exercise
recommendations in order to help individuals develop and maintain their cardiorespiratory
fitness, body composition, and muscular strength and endurance. The ACSM recommended
exercise be conducted three to five days/week at an intensity of 50-85% of maximal VO2 for 20-
60 minutes continuously (2). The type of exercise recommended included any activity that
involved the large muscle groups that could be maintained continuously, and was rhythmical
and aerobic in nature. Resistance training was recommended to be conducted at a moderate
intensity for a minimum of two days/week. Despite these recommendations, participation in
exercise was still minimal.
It was suggested that the current low participation rate for exercise may be due in part
to the misconception that in order to reap health benefits one must engage in vigorous,
continuous exercise (74). However, the research clearly documents that regular, moderate-
intensity PA is able to provide substantial health benefits. Thus, in 1995 members from the
ACSM and CDC were organized to issue a public health statement on the types and amounts of
PA needed for health promotion and disease prevention. This recommendation was not
intended to supersede previous exercise recommendations, but merely complement previous
exercise recommendations. Members from the ACSM and the CDC recommended individuals
“accumulate 30 minutes of moderate intensity PA on most if not all days of the week” in order
to obtain the health benefits associated with regular PA (74). It was suggested that the
recommended amount of 30 minutes could be accumulated in intermittent bouts of moderate-
intensity PA (i.e. walking up the stairs instead of taking the elevator, walking instead of driving

14
short distances, etc.). The CDC and ACSM targeted health benefits such as improvements in
CAD risk factors, blood lipid profile, body composition, and blood pressure. This 1995
recommendation was unique for two reasons: 1) it emphasized the health benefits associated
with moderate-intensity PA and 2) intermittent, short bouts of PA was considered an
appropriate approach to achieving the recommended amount of PA (74).
In 1996 the first Surgeon General’s report was released addressing PA and health (10).
The main message of this report was to inform all Americans of the dose-response relationship
between PA and health. This report stated that the effective threshold for level of intensity was
moderate intensity. Thus, vigorous intensity activity is not needed in order to gain
improvements in health. Essentially, health benefits appear to be proportional to the amount of
activity and not necessarily the intensity of activity. Thus, every increase in activity ultimately
leads to some health benefit. Due to the emphasis being placed on amount rather than
intensity of PA, individuals have more options to select from and can vary their activities
according to their personal preference when incorporating PA into their everyday lives. This
report really emphasized to Americans that while some is good, more is better. It was hoped
that this change in emphasis would encourage individuals to make PA a regular and sustainable
part of their lives.
Eleven years later the ACSM teamed up with the American Heart Association (AHA) to
update the 1995 PA recommendations based on new scientific evidence. The ACSM/AHA
recommended individuals aged 18-65 years should accumulate 30 minutes of moderate
intensity PA five days/week or 20 minutes of vigorous intensity PA three days/week or some
combination of moderate and vigorous intensity activities (40). These updated
recommendations also stated that the recommended amount of aerobic activity is in addition to

15
routine ADLs (i.e. activities of light intensity or <10 minutes in duration) (40). Muscle
strengthening two days/week was also added to the recommendation. Due to the dose-
response relationship between PA and health, individuals who wish to further enhance their
physical fitness, reduce their risk for chronic diseases and disabilities or prevent unhealthy
weight gain may benefit by exceeding the minimum recommended amount of PA (40).
In 2008, due to the vast majority (roughly 50%) of the U.S. adult population still being
classified as inactive or sedentary, the U.S. Department of Health and Human Services (HHS)
implemented new PA recommendations based on the most recent scientific evidence. The
federal government recommended individuals accumulate 150 minutes of moderate intensity
PA/week or 75 minutes of vigorous intensity PA/week or some combination of the two in bouts
of ≥10 minutes (1). Muscle and bone strengthening activities were recommended at least two
days/week. These recommendations were focused on “reducing the risk of chronic disease and
promoting health-related fitness, particularly cardiovascular and muscular fitness” (1). These
recommendations also specified frequency, intensity, time, and type for specific age groups (i.e.
children & adolescents, adults, older adults, etc.).
Physical Activity Monitoring
Doubly Labeled Water
In 1949, Lifson et al. discovered that O2 in respiratory CO2 was in equilibrium with O2 in
body water (58). This became an imperative first step in the introduction of the DLW method.
Lifson et al. in 1955 had success with the DLW method in mice, but despite these great
achievements, the high cost of stable isotopes and lack of precise analytical instrumentation to

16
measure isotopic enrichments in bodily fluid halted further research until the 1980s (59). The
DLW method was then reintroduced in 1982 by Schoeller and van Santen.
This method was introduced to potentially allow for accurate measurements of total
daily EE in humans through the use of biological markers that reflect the rate of metabolism in
the body. The DLW method utilizes two stable isotopes—H2 and 18O—to measure total daily EE.
Using an isotope-ratio mass spectrometer, urinary isotope elimination is generally followed for 7
to 21 days. There have been a few studies that have suggested the DLW method is the gold
standard when measuring total EE due to its high precision of 2-8% when compared to
continuous respiratory gas exchange (80,82). This high precision is usually dependent upon the
dose of the isotope, the length of the elimination period, and the number of samples within the
study (80). Due to its high precision the DLW method has been used in numerous studies to
validate the precision of other methods of measuring PA (i.e. questionnaires, accelerometry,
and HR monitoring) (55,87,88).
When the DLW method is combined with the individual’s resting metabolic rate (RMR)
and thermic effect of food (TEF), activity-related EE can be calculated. However, the DLW
method does not have the capability to measure EE for a specific activity nor does this method
have the capability to measure intensity, frequency, and duration for a given activity (22). Due
to this major shortcoming, PA patterns and dose-response relationships cannot be assessed via
the DLW method. DLW is also very expensive and lack of availability of the H2 18O isotope can
also pose a problem when wanting to assess large populations.

17
Self-Report Methods
Self-report methods have been around for numerous years and are the most commonly
used measures of PA due to their low financial cost and low participant burden. There are a
variety of self-report methods which include PA diaries, interview-administered questionnaires,
self-administered questionnaires, and reports by proxy. These self-report methods require
individuals to record and/or recall all PA that was performed throughout the day or previous
days and even PA that was performed throughout the past weeks, months, or years. Typically
subjects are asked to report on the types of activities they performed as well as the intensity,
frequency, and duration of the activities. Self-report methods can vary in regards to their
complexity, characteristics, and type of activity that is being assessed (i.e. ADL, light-, moderate-,
vigorous-intensity activity).
The complexity of questionnaires can vary from global, single-item questionnaires to
quantitative history questionnaires that may estimate PA throughout a lifetime. Global
questionnaires are capable of providing specific types and patterns of PA and are able to provide
simple classifications of an individual’s activity level. Global questionnaires may be self-
administered (89) or given as a phone interview (62). The precision and reproducibility of global
questionnaires has been adequate, however; misclassification in regards to the current level of
activity has often occurred (62) and lack of detail makes it hard to investigate proper PA
dimensions and patterns. Recall questionnaires are slightly more complex and inquire about an
individual’s frequency, duration, and type of activities being performed during a defined recall
period (i.e. days, months, weeks, years). Quantitative histories record both the frequency and
duration of occupational, leisure, and other physical activities over the past year (66,96). This
type of questionnaire is useful for researchers and clinicians who are investigating PA patterns

18
over long periods of time and the associations PA is assumed to have in relation to the
development of chronic diseases (51).
Other characteristics of questionnaires that may potentially affect estimates of PA
include how PA is defined, how the questions are worded, and how the response sets and scales
are scored and analyzed (10,85). A fourth characteristic—converting the activity data to EE—
may also pose a problem. It is common to use published data tables (i.e. Compendium of
Physical Activities) to convert the activity data to EE; however, most of these published data
tables are based on male adults which may not reflect the energy costs of activities for other
populations (i.e. women, children, older adult population, and the diseased population) (67).
The type of activity that is being assessed also draws concern for researchers when
looking to accurately quantify PA. Numerous comprehensive reviews have been published
describing the reliability and validity for several of the self-report methods in regards to types of
activities being performed (6,49,52,79,102). However, most of these self-report methods have
focused on vigorous intensity PA (50,68). Individuals within the general population usually
perform activities that are in the light to moderate intensity ranges and there is evidence that
shows PA surveys and questionnaires are less accurate at the light and moderate intensity
activities compared to vigorous intensity activities (77,105). It is suggested this reduced
accuracy may be due in large part to recall error by the subject since less intense activities (i.e.
walking throughout the day, activities of daily living) are more spread throughout the day,
compared to high-intensity activities, which are generally performed in structured bouts (i.e.
playing basketball, swimming, running) (8). Thus, self-report methods may not be suitable
methods to quantify PA levels in the adult, older adult and/or diseased populations since they
generally perform their activities in the light to moderate intensity ranges. Given these

19
limitations and the fact that greater accuracy is needed when assessing PA, other methods of
measurement have been developed.
Indirect Calorimetry
Indirect calorimetry is another method that is used to measure EE during activities, but
for many years this method was only utilized within the laboratory setting due to the large size
of most metabolic carts. This created problems for measuring EE for activities such as
occupational, housework, yard work, and recreational activities. Due to the need to quantify an
individual’s total daily PA and EE to determine dose-response relationships and PA patterns,
portable metabolic measurement systems were developed. Some of the first portable
systems—Oxylog and Cosmed K2—were capable of measuring ventilation and VO2 (73). As
technology advancements were made, the portable metabolic measurement systems were able
to measure both VO2 and carbon dioxide production (VCO2). Being able to measure both VO2
and VCO2 enabled the respiratory exchange ratio (RER) to be calculated and substrate utilization
to be determined. The Cosmed K4 became one of the first portable metabolic measurement
systems that included a CO2 analyzer allowing both VO2 and VCO2 to be measured in the field
setting. The most recent portable indirect calorimeter—the Cosmed K4b2—was developed with
a unique breath-by-breath measurement capability while maintaining the capability to measure
VO2 and VCO2.
The Cosmed K4b2 is a lightweight (1.5 kg) unit that is battery operated and self-
contained. It measures VO2 and VCO2 on a breath-by-breath basis as well as ventilation (VE),
fraction of expired oxygen (FEO2), fraction of expired carbon dioxide (FECO2), and HR (64). Data
can be stored in memory and later downloaded to a PC or it can be transmitted to a Windows-

20
based PC by telemetry. A valid portable metabolic measurement system is essential in order to
assess the energy cost of a wide range of activities for use in clinical, educational, and field
settings.
McLaughlin et al. conducted one of the first studies to validate the Cosmed K4b2
portable metabolic measurement system (64). Ten healthy males volunteered to perform two
exercise trials, one using the Cosmed K4b2 and one using the Douglas Bag (DB) method which
served as the criterion measure. In order to control for diurnal variation, the trials were
performed on consecutive days at roughly the same time of day. There was a ten minute rest
period at the beginning of each trial with data collection occurring in the last five minutes. The
subjects were then required to pedal on a cycle ergometer for five minutes at five different
power outputs: 50, 100, 150, 200, and 250 Watts (W). Measurements were collected during the
final two minutes of each power output when gas exchange was being measured with the DB.
The Cosmed K4b2 was connected to each subject throughout the entire protocol. The Cosmed
K4b2 demonstrated significantly higher VO2 (L/min) values compared to the DB method at 50W
(1.03±0.02 vs. 0.94±0.04), 100W (1.63±0.03 vs. 1.53±0.02), 150W (2.24±0.03 vs. 2.14±0.01), and
200W (2.87±0.04 vs. 2.79±0.03), respectively. McLaughlin et al. claimed this statistical
significance was due to extremely small standard errors (64). As a percent of the measured VO2,
these differences ranged from 9.6% at 50W to less than 3% at 200W. The Cosmed K4b2
produced significantly lower VCO2 and VE values at power outputs of 200W and 250W (p<0.05)
while producing no significant difference from rest through 150W. The significantly lower VCO2
values are directly correlated with the differences in VE values since FECO2 values were not
statistically different at 200W and 250W. FEO2 values were significantly lower at every power
output compared to the DB method. Lastly, the RER value was significantly lower at every

21
power output when measured with the Cosmed K4b2 as compared to measures from the DB
method. This difference was due in part to the slight overestimation of VO2 at power outputs of
50W through 200W combined with an underestimation of VCO2 values at 200W and 250W. The
mean exercise EE was not found to be significantly different between the two metabolic systems
(11.0 kcals/min for the K4b2, and 10.8 kcals/min with DB) suggesting the Cosmed K4b2 provides
accurate measures of EE throughout a wide range of exercise intensities. Overall these findings
support the Cosmed K4b2 portable metabolic measurement system to be an acceptable method
of measuring VO2 over a wide range of exercise intensities. However, it is suggested that this
method be validated using different modes of exercise and under various environmental
conditions (64).
Parr et al. performed a similar study to McLaughlin et al. and did so due to updated
software and the addition of a more stable CO2 analyzer (64,73). The purpose of this study was
to examine the accuracy of the Cosmed K4b2 for the measurement of VE, FEO2, FECO2, VO2, VCO2,
and RER at rest and during incremental exercise. Seven healthy male volunteers performed two
graded exercise tests on a calibrated cycle ergometer on different days, separated by a time
period of one week. For half of the subjects, metabolic measurements were collected utilizing
the Cosmed K4b2 during the first test and the other half used the DB method. During the second
exercise test, subjects were measured with the system they had not previously been measured
with. Before each session, subjects were required to refrain from exercise two days prior to
testing to help reduce any likelihood of glycogen depletion potentially effecting substrate
utilization during the exercise test (73). Diet was also controlled for in order to combat any
effects on substrate utilization. Subjects were asked to maintain the same diet three days prior
to their scheduled session and were asked to record all dietary intakes. Nutritionist Five

22
software (Version 2.2, First Data Bank, Inc., San Bruno, CA) was used to confirm that the
composition of each subject’s diet was similar prior to each testing session. Subjects were
required to rest for ten minutes prior to beginning the exercise test with metabolic
measurements being collected in the last five minutes of the rest period. Subjects were then
required to pedal for five minutes at five different power outputs: 50W, 100W, 150W, 200W,
and 250W. During each power output, metabolic measurements were made in the final two
minutes to ensure that a steady-state had been reached. At power outputs between 50-200W
FEO2 (P < 0.01) and FECO2 (P < 0.05) values were found to be significantly different when
comparing values between the Cosmed K4b2 and DB method. At power outputs of 50-150W
there were small (between 1.0-1.6 L/min.), but no significant differences in measures of VE
between the Cosmed K4b2 and the DB method. At 200W and 250W, the differences were
slightly higher (5.6 L/min. and 8.5 L/min., respectively), but were not statistically significant for
measures of VE. The difference in mean VO2 between the two systems was less than 60 ml/min.
for all workloads except at 250W (difference was 106 ml/min.) and were not statistically
significant. Significant differences, however, were found between the Cosmed K4b2 and the DB
method at a power output of 250W for both VCO2 values (P < 0.01) and RER values (P < 0.05). It
should be noted that only four of the seven subjects were able to pedal for five minutes at a
power output of 250W. When analyzing this data there are a few considerations to be made.
Despite the Cosmed K4b2 producing similar VE values, significantly underestimating FEO2 and
overestimating FECO2 values compared to the DB method, there were no significant differences
in VO2 values at any power output and only small differences in VCO2 at a power output of
250W. These differences are due in large part to the special characteristics of the Cosmed K4b2
breath-by-breath system (73). In contrast to the previous validation study (64), these findings
23
produced no significant differences in VO2, VCO2, and VE. Based on the results of this study,
there was an improvement in the accuracy of the Cosmed K4b2 after the changes had been
made. Overall, it can still be concluded that the Cosmed K4b2 is an accurate method of
measuring EE at rest and through high power outputs and can be utilized to assess the energy
cost of a wide range of activities.
Schrack et al. compared the average VO2 and VCO2 measured between the Cosmed
K4b2 and the Medgraphics D-series gas exchange system in 19 healthy men and women (nine
women, ten men) during steady-state submaximal walking exercise (83). Each subject was
required to perform two identical treadmill tests within the same session in order to compare
VO2 and VCO2 values from each metabolic system. Subjects were able to self-select their pace
on the treadmill (between 2.7-4.6 mph at 0% grade) and were instructed to use that speed for
both submaximal exercise tests. The exercise test was completed once each subject had walked
one quarter mile. Data was continuously collected during each test and for an additional two
minutes upon completion of the walking exercise followed by a ten minute washout period in
between the two submaximal exercise tests. Utilizing the same protocol in the first exercise
test, a second exercise test was conducted with the alternate metabolic measurement system.
VO2 normalized for body weight (ml/kg/min), VO2 (ml/min), and VCO2 (ml/min) were highly
correlated with one another with Pearson coefficients of 0.96, 0.97, and 0.97, respectively. The
average VO2 (ml/kg/min) for all subjects as measured by the Cosmed K4b2 was 16.9 ± 4.5
ml/kg/min and as measured by the Medgraphics D-series gas exchange system was 17.3 ± 4.0
ml/kg/min. The Cosmed K4b2 demonstrated lower VO2 values and higher VCO2 values overall,
however; this difference was not statistically significant (P > 0.05). It should be noted that this
study did not compare the Cosmed K4b2 to the DB method (83). Another limitation to this study

24
is the fact that a narrow range of intensities was utilized. However, the main purpose of this
study was to conclude the accuracy of the Cosmed K4b2 portable metabolic measurement
system at intensities that mimic the energy cost of ADL (i.e. low to moderate intensity activities).
Based on these results, it can be concluded that the Cosmed K4b2 portable metabolic
measurement system produces accurate measures for both VO2 and VCO2 and is an acceptable
method of measurement for steady-state, low to moderate intensity exercise.
Eisenmann et al. compared measures of VE, VO2, and VCO2 production between the
Cosmed K4b2 portable metabolic measurement system and its laboratory counterpart—the
Cosmed Quark b2 (34). Twenty-one normal, healthy male and female subjects volunteered to
attend one exercise session to complete study requirements. The session consisted of each
subject exercising for three minutes at three different workloads; 1) 3.0 mph, 0% grade; 2) 3.0
mph, 5% grade; 3) 3.0 mph, 10% grade. Each workload was performed twice in order to have
measures of VE, VO2, and VCO2 with both metabolic systems for the same workload. Each
subject walked for three minutes at the first workload (3.0 mph, 0% grade) and then the
treadmill was stopped for approximately 15-30 seconds to switch metabolic systems,
specifically, exchanging the optoelectronic reader that contains the turbine and the gas
sampling plug. The first workload was then repeated for another three minutes with the
alternate metabolic system. This same protocol was continued for the last two workloads. The
order, in which subjects wore the metabolic systems, either first or second, was randomized.
The results showed a significantly higher VO2 value produced by the Cosmed K4b2 when walking
at 3.0 mph, 0% grade and 3.0 mph, 10% grade (P < 0.01). The mean difference between the
two metabolic systems was 0.5-1.0 ml/kg/min representing a 5% systematic error. This
systematic error, however, is physiologically not significant. The measurement differences

25
appear to be due to the oxygen analysis methods (i.e. FEO2) rather than the measurement of gas
volumes (34). The Cosmed K4b2 produced significantly lower fractional concentrations of
oxygen in expired air (FEO2) when walking at 3.0 mph, 0% grade (P < 0.01) and 3.0 mph, 10%
grade (P < 0.05). Conversely, the Cosmed K4b2 produced significantly higher fractional
concentrations of carbon dioxide in expired air (FECO2) when walking at 3.0 mph, 5% grade (P >
0.05). Mean differences between the two systems for VCO2 were not significantly different and
were highly correlated across all workloads (r = 0.97). The Cosmed Quark b2 produced
significantly higher RER values for each workload (P < 0.01) with a coefficient correlation value
of 0.82. The experimental design of this study would not have been the main limitation if the
gas sampling between systems had been done simultaneously during each workload (75). It also
may have been beneficial to use two consecutive days to assess the different metabolic systems
at the same workloads. However, the setup of this present study avoided any day-to-day bio
variability that may have occurred and there was no significant difference in heart rates during
the 1st and 2nd phase of each workload suggesting there was a similar physiological response.
From the results, it can be concluded once again that the Cosmed K4b2 provides accurate
measures of VE, VO2, and VCO2 during low to moderate intensity exercise.
The aforementioned papers conclude that the Cosmed K4b2 is a reliable and accurate
portable metabolic measurement system and is able to assess activities throughout a wide
range of intensities. Despite indirect calorimetry being an accurate method of measuring EE
throughout a wide range of activities, it is too cumbersome to be used in free-living situations.
Thus, researchers needed to develop more applicable methods of measuring EE for the general
population during free-living situations.

26
Heart Rate Monitoring
The concept of utilizing HR as a way to measure PA and EE was first recognized in the
early 1950s by Berggren and Christensen (9). They determined that the acute response of HR to
increasing levels of PA is directly proportional to the intensity of movement and is driven by an
increased need to deliver oxygen to skeletal muscles (9). HR measures were not utilized for
practical applications until the 1970s when portable HR monitors were developed. These
portable HR monitors allowed for the assessment of day-to-day variation within subjects, but
prevented precise estimates of PA and EE (3,67). During the 1980s and 1990s technology made
great advancements that enabled the production of ambulatory HR monitoring. These HR
monitors had the capabilities to record HR continuously, thus; allowing for improvements in the
precision of estimating PA and EE (4).
There are several confounding factors that may disrupt the linear relationship between
HR and VO2 making it more challenging to accurately assess PA and EE utilizing the HR method
during free-living situations. One major confounding factor is the amount of skeletal muscle
mass utilized for the activities. There is a linear relationship for HR and VO2 during both upper-
and lower-body dynamic exercises, but upper-body dynamic exercise produces a HR that is
approximately 10% higher at any given submaximal workload compared to lower-body dynamic
exercise (70). This difference would ultimately result in a prediction error of EE for subjects who
engage in primarily upper- or primarily lower-body PA.
A second major confounding factor is the type of activity being performed. HR is higher
during static exercise compared to dynamic exercise at any given submaximal workload due to
HR being directly related to the active muscle mass and the percentage of maximum ventilatory

27
ventilation rather than VO2 (70). This could potentially create a source of error during field
settings when the type of activity being performed cannot easily be determined.
A third major confounding factor that may affect the linear relationship between HR and
VO2 is an individual’s level of physical fitness. Nieman et al. discovered that physically fit
individuals will have a lower HR at any given submaximal workload compared to unfit individuals
due to a greater stroke volume (70). HR also has a tendency to remain elevated after activity
has ceased and lags behind when there are changes in activity type compared to that of VO2
(70). Other confounding factors include ambient temperature, altitude, emotion, mental stress,
and hydration status (93,105). Despite all of these confounding variables that could potentially
affect HR, this physiological parameter has been validated against the DLW method and indirect
calorimetry to accept its applicability for use in estimating EE at certain intensity levels (61,86).
Bradfield et al. was one of the first to describe the technique used to determine the
linear relationship between HR and VO2 discovered by Berggren and Christensen (16). In order
to establish the individual regression equations, measurements of VO2 and HR had to be taken
simultaneously at rest and at several different levels of activity. The measurements were taken
at various HR ranges: 75-90 bpm (rest); 120-130 bpm; 140-150 bpm; and >160 bpm. VO2 was
measured using Darex meteorological balloons (similar to Douglas Bags), HR was obtained
through telemetry, and the Weir formula was used to calculate EE. Combining the Weir
regression equation with mean 24-hour HR, estimates of 24-hour EE were obtained. The
researchers of this study wanted to focus on the external and internal validity of HR monitoring
in estimating EE. External validity was defined as the effect of total environment upon the
individual, including the effect of the equipment used on the subject’s behavior. Internal
validity was defined as physiological validity. This study found there to be an internal validity of

28
±5 to 15%, dependent upon the number of sedentary activities that were involved for each
subject throughout the 24-hour monitoring period. The techniques and equipment employed in
this study did not interfere with the usual behavior of the subject suggesting the external
validity is higher compared to other methods of measurement (i.e. DB method, indirect
calorimetry). The results of this study suggest that the utilization of HR in everyday living to
determine EE is accurate for moderate and vigorous intensity activities, but may be questioned
during sedentary and light intensity activities. This may be problematic when wanting to
determine accurate estimates of an individual’s overall PA level and establish the most accurate
dose-response relationship between PA and health benefits.
Dauncey et al. performed a similar study comparing measures of EE via HR to measures
of EE via heat production while eight subjects lived in a whole-body calorimeter for 27-hours on
at least two occasions (32). A linear relationship has been shown between HR and EE; however,
Booyens and Harvey found that during sedentary activities the relationship between HR and EE
shows more variation than during moderate and vigorous intensity exercise (12). Therefore,
upon completion of each session in the calorimeter, subjects were individually calibrated using
standard techniques to determine HR and heat production over periods of 10-15 minutes at
several levels of activity. Utilizing five different methods, EE in the calorimeter was predicted
from the mean HR in the calorimeter. The five methods were as follows: 1) calibration points
obtained while lying still and while cycling; 2) calibration points obtained for sitting still and for
cycling; 3) calibration points while the subject was lying, sitting, and standing still; 4) calibration
points which were representative of the subject’s activity while in the calorimeter; and 5) this
last method employed a logistic fit such that the curve was constrained to pass through the
lower calibration points (32). They found that standard methods of prediction utilizing one

29
calibration point at rest and several points during activity were extremely unreliable for
predicting EE for a given individual over a 24-hour period. They proposed that this discrepancy
was because the relation between HR and heat production was linear using standard
calibrations only when EE was >10 kJ/min. The mean difference between the actual and
predicted 24-hour heat production was +3 ± 10.5% for light activities and -3 ± 6.7% for moderate
activities. Again, based on these results, this calibration technique is not accurate during
sedentary and light intensity activities suggesting that another method or additional methods
are needed to gain the most accurate estimate of EE during free-living situations.
Christensen et al. tested the reproducibility and reliability of the daily EE estimates
obtained by the same method described by Bradfield et al. in five healthy subjects, five subjects
with obesity, five subjects with untreated thyrotoxicosis, and two subjects with anorexia
nervosa (29). Subjects were required to report to the laboratory twice on consecutive days to
obtain individual HR-VO2 regression lines. VO2 and HR were recorded in the last four minutes
during eight activities that varied in level of intensity. The activities consisted of lying at rest,
seated rest, three 10-minute bouts of cycling, and three 10-minute bouts of walking. The
subjects were instructed to carry around a two-channel ECG Holter recorder for the
determination of HR over a 24-hour period. Using these regression equations that were
developed and the mean 24-hour HR, the energy that was expended over two 24-hour periods
was estimated and these estimations were then compared to one another. The results
demonstrated high correlation coefficients of the regression lines, but showed fairly large
differences between the slopes and intercepts of the duplicate regression lines which resulted in
large discrepancies of EE between the duplicate estimates. The authors proposed that
variations in HR independent of VO2, at sedentary and light intensity activities, were responsible

30
for the disagreement and suggested that regression lines based on the specific HR-VO2
relationship for different levels of activity may be more appropriate. However, as mentioned
before, such a procedure would consume large amounts of time (29). Again, this study
demonstrates a strong argument for use of this method during moderate and vigorous intensity
activities, but questions the accuracy of this method during sedentary and light intensity
activities. Unfortunately, the majority of the population spends relatively large amounts of time
in both sedentary and light intensity activities posing a major problem for use of this method
within the general population during free living situations.
Strath et al. examined the relationship between HR and VO2 during field- and
laboratory-based moderate intensity activities (93). A unique feature of this study was their
secondary purpose to examine the validity of estimating EE from HR after adjusting for both age
and fitness levels. Adjustments were made by expressing the data as a percent of HR reserve
(%HRR) and percent of VO2 reserve. Sixty-one adults volunteered to participate in this study
that required them to complete one to seven activities in both the laboratory and field settings.
Activities that took place in the field included vacuuming, sweeping and mopping, laundry,
ironing, washing dishes, cooking, light cleaning, grocery shopping with a cart, feeding and
grooming animals, caring for small children, mowing the lawn, raking, trimming, general
gardening, playing with children or animals in the yard, doubles tennis, golf while carrying clubs,
golf while pulling clubs, and softball. Activities conducted in the laboratory included walking at
2.5 mph while carrying items of 6.8 kg, walking at 3.5 mph while carrying items of 6.8 kg, loading
and unloading boxes of 6.8 kg, stretching and light calisthenics, a slow walk and a fast walk on
an outdoor track. Each activity was performed for 15 minutes with a five minute rest period
prior to the start of each activity. HR (Polar HR transmitter) and VO2 (indirect calorimetry—

31
Cosmed K4b2) were measured continuously over the 15-minute activity period with the mean
values from 5-15 minutes being used for linear regression analysis on HR versus VO2. EE was
estimated based on age-predicted HRmax and estimated VO2max. A correlation of 0.68 was
found between HR and VO2 with HR being accountable for 47% of the variance in VO2. These
results suggest that HR is an acceptable method of estimating EE during moderate intensity
activity; however, when the data was adjusted for age and fitness level, HR became an even
more accurate predictor of EE as compared to measured EE via indirect calorimetry with a
correlation of 0.87. The one major limitation to this study is that measured values of HRmax
and VO2max were not used to estimate EE which may in fact increase the accuracy of this
method even further. Also, the activities were all focused on one intensity range limiting these
accurate estimations to moderate intensity activity only. The activities represented free-living
situations, but those activities are only performed for short periods of time and may not be
performed on a daily basis; whereas, sedentary and light intensity activities occur more often in
free-living situations and are an important component to developing the most accurate dose-
response relationship between PA and health benefits.
Despite the confounding variables that could potentially affect the relationship between
HR and VO2, manufacturers of HR monitors have proceeded to incorporate this method into
their devices based on refined regression equations over the years. Polar Electro, Inc. has been
the leading manufacturer of HR monitors for years. These HR monitors have been validated
against electrocardiogram (ECG) recordings by many researchers (56,99). These HR monitors
generally consist of a transmitter and a watch-like receiver. The transmitter sends ECG signals
to the receiver through a timing circuit that measures the interval between heart beats. The
values that are transmitted are then stored and processed by the receiver. Polar HR monitors

32
allow for the information that is collected to be downloaded directly to a PC for data analysis
purposes.
The most current Polar HR monitors (i.e. RS800CX utilized in the current study) are
equipped with a specialized software program—OwnCalS—to calculate EE based on prediction
equations that were developed and evaluated in a series of research projects. OwnCalS
estimates EE from exercise HR and either measured or predicted individual HRmax and VO2max
values. Predictions of HRmax and VO2max are based on a non-exercise prediction equation that
takes into account the individual’s gender, age, height, weight, and activity HR. Crouter et al.
conducted a study to assess the accuracy of the OwnCalS program for estimating EE during
exercise when using both predicted and measured VO2max and HRmax compared to indirect
calorimetry (30). Twenty male and female volunteers initially had their VO2max and HRmax
values predicted by the Polar S410 HR Monitor and then they each performed a maximal
treadmill test to determine actual values of their HRmax and VO2max. Each participant was
instructed to complete a total of nine submaximal exercise bouts with three being performed on
a treadmill, three on a cycle ergometer, and three on a rowing ergometer. During each
submaximal bout of exercise, subjects were equipped with two Polar S410 HR monitors—one
utilizing their predicted values and the other utilizing their measured values—and an indirect
calorimetry system was attached to measure EE. Subjects were asked to exercise for ten
minutes at each stage. The first five minutes at each stage allowed for the subject to reach a
steady state and the last five minutes were used for data collection. For males, no differences in
EE were reported to be seen between actual values, predicted values, and indirect calorimetry
for any mode of exercise. However, predicted values for females significantly overestimated EE
on the treadmill (by 2.4 kcal/min.), cycle (2.9 kcal/min.), and rower (1.9 kcal/min.) (p<0.05)

33
compared to indirect calorimetry. The actual values of HRmax and VO2max significantly
improved the EE for females during all modes of exercise, but the Polar S410 HR monitor still
overestimated EE on the treadmill (0.6 kcal/min.) and the cycle (1.2 kcal/min.) as compared to
indirect calorimetry. The results of this study demonstrate acceptable use of the OwnCalS
program to estimate EE during bouts of exercise; however, the most accurate measurements
are produced when actual measures of HRmax and VO2max are utilized. It should also be noted
that no sedentary or light intensity activities were utilized in this validation study suggesting the
results may vary if using the OwnCalS program to determine total daily EE in free-living
situations.
HR is an acceptable objective method that is low in cost and is noninvasive, but lacks in
its ability to accurately estimate EE at all levels of PA intensity and has many variables that could
potentially affect HR measures for a given situation. Due to this disparity, accurate
determinations of the dose-response relationship between PA and health benefits cannot be
fully understood utilizing this method alone. With that being said, researchers needed to
determine other methods of measuring EE in hopes of capturing areas of PA that the HR method
cannot accurately capture.
Accelerometry
Accelerometry has been used to study gait and other human movements as well as for
the measurement of tremor and motor activity in neurological patients for several years. One of
the earliest accelerometers was created in 1961 by Cavagna and colleagues (24). This particular
accelerometer consisted of strain gauges that were able to sense accelerations of the human
body in the forward, lateral, and vertical directions (24). In the 1970s the Large-Scale Integrated

34
(LSI) Motor activity monitor was developed to assess movement patterns in psychiatric patients
(67). This particular device utilized a mercury switch mechanism that was able to detect
movement and contained a telemetry-based recorder that collected the data. The LSI monitor
was eventually applied to PA research as described by LaPorte et al. (52). Accelerometers have
now progressed to using either piezoelectric or piezoresistive sensors to detect the human
motion during activity.
Piezoelectric sensors contain a ceramic material with a brass core that produces a
charge proportional to the force being exerted when acceleration of the human body occurs. In
1981, Wong et al. developed a piezoelectric portable accelerometer that was utilized to
estimate EE of various activities—the Caltrac (13). The Caltrac was attached to the waist and
was capable of recording accelerations parallel to the vertical axis of the body (13).
Piezoresistive motion sensors, on the other hand, are created with silicon resistors which
change the electrical resistance in response to any applied mechanical load (13). Piezoresistive
accelerometers are smaller than piezoelectric accelerometers, but the piezoresistive
accelerometers require an external power source in order to be utilized (13). The characteristics
of these two types of sensing elements are different, but it is unclear if there is any advantage or
disadvantage to using one or the other. Most all contemporary models use piezoresistive
sensors as the basis for their accelerometry readings.
Advantages of accelerometers include its small size, noninvasiveness and ability to
record data over long periods of time. Accelerometers can also be used to measure the
frequency and duration of PA. Specifically, accelerometers capture the accelerations and
decelerations of human movement and these measurements are said to be linearly related to EE
during walking (105). This prompted researchers to hypothesize that the integral of the

35
modulus of acceleration measured on the human body—especially in the vertical direction—can
be used to predict EE during PA (14). With this proposed hypothesis, researchers began to
develop accelerometers that measured human motion in the vertical direction. These
accelerometers became known as uniaxial or single plane accelerometers. Some of the most
common uniaxial accelerometers include the Caltrac, model 7164 Actigraph, MTI, and GT1M.
These accelerometers are either worn on the low back, hip, wrist, or ankle dependent upon the
type of activities being assessed. Uniaxial accelerometers have been validated mainly within
laboratory settings with much of the work being performed on a treadmill consisting of either
walking or running (37,41,65). Due to there being a direct relationship between total amount of
PA and risk of CAD, there was a need for researchers to determine the validity of uniaxial
accelerometers during free-living situations (7,35,68).
Several validation studies concluded uniaxial accelerometers underestimate EE during
lifestyle type activities (7,35,68). Bassett et al. and Eisenmann et al. postulated that the
accuracy of estimating EE with uniaxial accelerometers could have improved if energy that was
expended by the upper body had been taken into account when subjects performed activities
such as vacuuming, ironing clothes, washing dishes, cooking, loading/unloading boxes, and
taking care of children (7,35). Interestingly, Swartz et al. found that wrist counts from the MTI
accelerometer would provide very little addition to the accuracy of estimating EE during lifestyle
type activities (94). Montoye et al. also noted that differences in EE between accelerometers
and indirect calorimetry were due to accelerometers being unable to detect changes in level of
terrain, such as when subjects walked up an incline or walked up/down stairs (68).
Accelerometers have also been shown to provide inaccurate estimates of EE during static
exercise or when the individual’s weight is partially supported during non-ambulatory activities

36
(i.e. cycling and rowing). Lastly, researchers have found that the type of regression equation
used plays a role in determining accurate estimates of EE. Most regression equations have been
developed from treadmill walking and running (7,35). The development of regression equations
that are activity specific may provide more accurate estimates of EE.
Triaxial accelerometers are capable of capturing human movement in multiple
directions (i.e. vertical, mediolateral, and anterior-posterior directions). Just like uniaxial
accelerometers, triaxial accelerometers are capable of assessing frequency and duration of PA.
Most triaxial accelerometers are worn on the waist, but can also be worn on the low back, wrist,
and ankle. Bouten et al. utilized a triaxial accelerometer to evaluate the relationship between
EE due to PA and body acceleration during sedentary activities and walking in 11 male subjects
(15). Energy that was expended during the activities was calculated from total EE and sleeping
metabolic rate. The triaxial accelerometer was placed on the low back of each subject in order
to measure the accelerations and decelerations of the human body. Sedentary and walking
activities were chosen for this study due to their resemblance of normal daily activities and the
fact that together they represent a large portion of normal daily PA in today’s Western society.
Subjects were asked to perform nine different activities for three minutes/activity that included
1) sitting relaxed; 2) sitting and writing; 3) sitting with arm work; 4) alternately sitting and
standing for 10 seconds each; and 5-9) walking at five different speeds (1.9, 2.5, 3.1, 3.7, 4.4
mph) on a motor driven treadmill. A linear relationship was seen during sedentary activities
between EE and the sum of the integrals of the absolute value of accelerometer output from all
three measurement directions (r = 0.82, p<0.001). It should be noted that this linear
relationship may be due to the fact that movement in all three planes were incorporated into
the activities. For instance, the major acceleration component during sitting with arm work was

37
in the medio-lateral direction and during sitting and standing the major acceleration component
was in the anterior-posterior direction. Thus, the linear relationship that was found may be
biased based on the types of activities that were chosen for this study and may not be
representative of all sedentary activities. Interestingly, EE during walking in this study was
highly correlated with the integral of the absolute accelerometer output in the anterior-
posterior direction (r = 0.96, p<0.001) despite the major acceleration component during each
stage of walking being in the vertical direction. This study suggests that more accurate
measures of EE may be obtained during activities like walking when the anterior-posterior plane
is utilized. When all activities were included in a regression analysis, a strong linear relationship
was found between EE and the sum of the integrals of the absolute value of accelerometer
output from all three measurement directions (r = 0.95, p<0.001). According to Bouten et al.,
utilizing this relationship during sedentary activities as well as walking will provide estimates of
EE with an accuracy of about 15% (15). Despite these results, a few limitations of this study
should be taken into consideration. First, there were relatively large differences in EE between
individuals during the sedentary activities. Bouten et al. suggested these differences were due
to 1) difficulty measuring EE at low levels of activity, 2) variations in EE corresponding to the
variations in the level and performance of PA, and 3) the fact that diet induced thermogenesis
was not considered (15). Bouten et al. also proposed that the relationship between EE and
output from the triaxial accelerometer may be dependent on age, sex, and body composition
(15). In the current study, these characteristics were not well represented suggesting these
results may not be applicable to the general population during free living situations. Overall,
this study suggests that triaxial accelerometers are useful to determine EE in well controlled
laboratory settings, but further investigation may be warranted during free-living situations.

38
Campbell et al. conducted a similar study utilizing triaxial accelerometers (Tritrac-R3D)
to measure EE of various activities in 20 females (22). Each subject was instructed to complete a
choreographed routine of six different activities for five minutes/activity (walking, jogging, stair
climbing, walking on an incline, stationary cycling, and arm ergometry) while wearing a Tritrac-
R3D accelerometer and the Cosmed K4b2 portable metabolic measurement system. When
comparing the mean error scores (K4b2 - Tritrac-R3D), the Tritrac-R3D overestimated the EE
(kcals/min) of walking (-1.45) and jogging (-1.75); whereas, the Tritrac-R3D underestimated the
EE of stair climbing (2.76), stationary cycling (2.75), and arm ergometry (1.20). The lowest mean
error score was seen while subjects were asked to walk on an incline (-0.11). Moderate
correlations were demonstrated for walking (r = 0.57, P < 0.05), jogging (r = 0.67, P < 0.05), and
stairs (r = 0.50, P < 0.05). For all other activities the correlations were poor and ranged from r =
0.29 (P < 0.05) to r = 0.48 (P < 0.05). A nonlinear regression model was applied to the raw data
from the Tritrac-R3D and significantly improved the estimates of EE for walking (adjusted mean
difference = -1.11, P < 0.05), jogging (adjusted mean difference = 0.26, P < 0.05), and walking on
an incline (adjusted mean difference = 0.31, P < 0.05). The homogeneity of the participants in
this study limits these results being applied to the general population and some of the activities
that were chosen may not accurately simulate lifestyle type situations. Also, these results
indicate that there are limitations associated with triaxial accelerometers that are similar to
uniaxial accelerometers which include estimating energy that is expended from upper-body
movement and EE that is related to working with a load or force production in a stationary or
isometric condition. Campbell et al. simulated upper body work by having subjects use the arm
ergometer and found EE to be underestimated by 43% compared to indirect calorimetry (22).
Stationary cycling was also significantly underestimated due to minimal movement of the hip

39
during this activity (22). The Tritrac-R3D underestimated EE during stair climbing by 33% due to
an inability to distinguish change in vertical displacement. These results suggest that the use of
multiple accelerometers (located at the wrist and/or ankle) or multiple methods to estimate EE
may be more beneficial during lifestyle type activities to gain the most accurate estimation of
EE. It should also be noted that improvements were seen with estimates of EE when a nonlinear
regression model was applied to the raw data produced by the Tritrac-R3D, but these
improvements were only seen with certain activities suggesting activity-specific regression
equations may produce more accurate estimates of EE. However, determining regression
equations in free-living situations may be extremely challenging. Overall, this study suggests the
use of triaxial accelerometers during a controlled setting to be applicable, but use of a triaxial
accelerometer located at the hip during free-living situations may not be able to provide the
most accurate estimation of EE.
Hendelman et al. took the use of accelerometry a step further and assessed the validity
of accelerometry for the estimation of EE during moderate intensity PA in a field setting (43).
Twenty-five male and female subjects were asked to complete four bouts of over ground
walking at a range of self-selected speeds, play two holes of golf, and perform both indoor
(window washing, dusting, vacuuming) and outdoor (lawn mowing, planting shrubs) household
tasks. Indirect calorimetry was used to measure EE and body movement was captured using a
Yamax Digiwalker pedometer (walking only), a Computer Science and Application, Inc. (CSA)
accelerometer (uniaxial), and a Tritrac accelerometer (triaxial). The researchers of this study
examined the correlations between accelerometer counts and energy cost as well as developed
individual regression equations to predict METs from the accelerometer counts. These
equations were developed from the walking data and then applied to the other activities to

40
compare the relationship between counts and EE. The results of this study showed strong
correlations between accelerometer counts and EE during the walking trials for both
accelerometers. The correlation between CSA counts and measured EE was r = 0.77, whereas
the Tritrac yielded a higher correlation of r = 0.89. These results indicate that triaxial
accelerometers produce more accurate estimates of EE compared to that of uniaxial
accelerometers during walking. One could speculate that this may be due to the addition of the
triaxial accelerometers being able to capture movement in the anterior-posterior direction,
which has been shown to produce the most accurate estimation of EE during activities such as
walking (15). However, Hendelman et al. found that the anterior-posterior plane showed very
little association with overall energy costs for walking (r = 0.17) and for all other activities (r =
0.24) (43). When all activities were combined, the correlation between accelerometer counts
and EE were reduced for both the CSA accelerometer (r = 0.59) and the Tritrac accelerometer (r
= 0.62). This again suggests that accelerometers, whether uniaxial or triaxial, have limitations in
capturing all movement that occurs within different lifestyle type activities. The individual
regression equations were then applied to the indoor and outdoor household activities to
predict energy cost which was underestimated by 30-60% implying that at similar intensity
levels, the activity counts were much lower compared to walking. This study along with several
other studies concluded that the relationship between EE and accelerometer counts is
dependent on the type of activity or movement performed. Also, accelerometers (uniaxial and
triaxial) located at the waist are incapable of capturing increases in EE from upper-body
movement, load carriage, or changes in surface or terrain.
The intended use of accelerometers is to measure PA and EE over extended periods of
time in free-living situations in order to define the specific amount, type, and pattern of activity

41
that are conducive to optimal health and disease prevention. However, individuals generally
perform a wide variety of different types of movement and activities throughout the day and
several studies have discovered limitations with accelerometers in regards to capturing all forms
of movement in free-living situations (i.e. upper-body movement, stationary or isometric
movement, changes in level of terrain). Researchers have developed regression equations from
specific laboratory activities, but these equations have generally been derived from walking or
jogging on a treadmill and cannot necessarily be applied to free-living activities. Despite these
limitations, the accelerometer is the most promising method of measurement in estimating EE
and researchers are trying to utilize the advantages of this unique measuring device to increase
their accuracy and make them applicable within the general population during free-living
situations.
Simultaneous Use of Multiple Methods to Estimate EE
HR monitors and accelerometers have been used by researchers for several years to
estimate EE during PA. Both methods of measurement have their strengths as well as their
weaknesses. More recently, researchers have tried to determine if utilizing multiple
accelerometers or simultaneously utilizing both a HR monitor and multiple accelerometers will
improve the estimations of EE during PA especially during free-living situations.
Swartz et al. assessed the estimation of EE utilizing CSA accelerometers at the hip and
wrist sites in 70 subjects while they completed anywhere from one to six different activities (94).
The activities that were chosen for this study fell within one of five categories: yard work,
housework, family care, occupation, recreation, and conditioning. Each subject was equipped
with the Cosmed K4b2 to measure EE and two CSA accelerometers (one located on the wrist and

42
one located on the hip) to capture human movement during different activities. Each activity
was performed for a total of 15 minutes. Mean VO2 and mean CSA counts for the hip and wrist
were calculated for each subject from the last 10 minutes of each activity that was performed.
Regression equations were developed in order to predict EE from CSA accelerometer counts and
to be able to compare these results to that obtained by indirect calorimetry. The regression
equation for the wrist and the hip alone accounted for 3.3% and 31.7% of the variation in EE,
respectively. When the wrist and hip data were combined the regression equation accounted
for 34.3% of the variation in EE. Despite there being a statistically significant increase in percent
of variation in EE when the wrist accelerometer data was added to the hip accelerometer data,
the overall improvement in prediction of EE was rather small. Melanson and Freedson looked at
the relationship between the CSA model 5032 accelerometer counts from the hip, wrist, and
ankle and the measured EE for three different speeds of walking and jogging, and found that the
counts were significantly correlated with EE (r = 0.66-0.81) regardless of the location of the
accelerometer (65). They found that the CSA accelerometer located on the wrist accounted for
86% of the variance in EE for both walking and jogging. With the addition of either the hip or
the ankle the prediction of EE improved yielding an R2 value of 0.89. This is in major contrast to
the current study by Swartz et al. where the combined hip and wrist counts predicted EE with an
R2 value of 0.34. It is suggested that this large discrepancy may be due to the different types of
activity and activity modes in which the regression equations were based on. Despite the
difference, both studies showed improvements in estimating EE when multiple accelerometers
were utilized.
Chen et al. performed a similar study using hip- and wrist-worn accelerometers to
predict EE during a 24-hour period in 60 sedentary normal female volunteers (27). Subjects

43
were required to perform different activities that ranged from sedentary desk work to walking
and stepping at different intensities in a whole-room indirect calorimeter. Each subject was
equipped with a triaxial accelerometer located on their hip and a uniaxial accelerometer located
on their dominant wrist to assess human movement during the 24-hour period. Both
accelerometers were set to record data in 60-second epochs. Data from the accelerometers
was used to develop nonlinear regression equations to estimate EE during the different
activities that were performed. The results of this study showed that EE was accurately
estimated when the hip- and wrist-worn accelerometers were combined in the regression
equation (97.7 ± 3.2% of the measured values, P = 0.781). This result was in comparison to
using the wrist-worn accelerometer (86.0 ± 4.7%, P < 0.001) or the hip-worn accelerometer
(90.0 ± 4.6%, P < 0.001) individually. These results are not generalizable to all individuals
because only women participated in this study and these women were also sedentary with a
very high body mass index. It should also be noted that a triaxial accelerometer was worn on
the hip, but was not worn on the wrist suggesting that a greater accuracy could have been
obtained in the combined model had the wrist-worn accelerometer been able to capture human
movement in more than one direction. The activities in this study were chosen to simulate a
free-living situation; however, the results of this study may only be applicable to the activities
that were performed. Regardless of these limitations, this study provides promising data for
accurately estimating EE utilizing multiple accelerometers.
Researchers have opted to also try utilizing multiple methods such as the simultaneous
use of HR monitoring and accelerometry to estimate EE during free-living situations. Eston et al.
assessed the relationship between HR, pedometry, uniaxial accelerometry, and triaxial
accelerometry for predicting EE while 30 children walked at two speeds (2.5 and 3.7 mph), ran

44
on a treadmill (5.0 and 6.2 mph), played catch, played hopscotch, and sat and crayoned for four
minutes/activity (36). Data obtained from HR, pedometry, and accelerometry were all
compared to measures obtained from indirect calorimetry. In this study, VO2 was expressed as
a ratio of body mass raised to the power of 0.75 [scaled oxygen uptake (sVo2)] in order to be
able to compare the results of this study from children to that of adults. All activity measures
that were studied showed a strong linear relationship with the criterion measure of sVo2. Eston
et al. found that the triaxial accelerometer was the best single measure (r = 0.91) compared to
pedometry, uniaxial accelerometry, and HR monitoring and accounted for 82.5% of the variance
(36). A multiple regression analysis was used to establish the efficacy of using two measures
simultaneously. The best predictor of sVo2 compared to any other measure alone was the
combination of HR and triaxial accelerometer counts (r2 = 0.85). HR added 2.0% (p<0.01) of
variance to that already explained by the triaxial accelerometer. Based on these results, one can
conclude that the simultaneous use of a HR monitor and a triaxial accelerometer will slightly
increase the estimations of EE during a number of different activities. However, these results
may be specific to the activities that were performed and specific to the population that was
assessed.
Strath et al. conducted a similar study specifically looking at the simultaneous HR-
motion sensor technique to estimate EE in 30 men (16) and women (14) (91). Each subject was
asked to perform arm and leg work in the laboratory in order to develop individualized HR-VO2
regression equations. Subjects were then asked to complete different lifestyle type activities
while HR, VO2, and motion sensor activity were being recorded simultaneously. Each activity
was performed for 15 minutes. Eleven subjects completed housework activities, nine subjects
completed yard work activities, and ten subjects completed conditioning activities. Each subject

45
was equipped with the Cosmed K4b2, the Polar Vantage XL, a Yamax SW-701 pedometer, and
three CSA accelerometers (one located on the dominant wrist, hip, and right thigh). The mean
MET range for all activities was 2.1 to 6.1. The results showed that the Yamax SW-701
pedometer significantly underestimated the measured EE by an average of 1.2 METs or 59.2% (P
< 0.001). The relationship between predicted METs from the pedometer and the measured
METs from the Cosmed K4b2 was r2 = 0.36 for all subjects. The CSA accelerometer located on
the hip also significantly underestimated the measured MET values by an average of 1.1 METs or
29.5% (p<0.001). The relationship for all subjects between predicted MET values from the CSA
accelerometer on the hip compared to measured MET values from the Cosmed K4b2 was r2 =
0.54. The individual HR-VO2 relationship was used to predict METs from HR. The relationship
between the HR method and measured METs from the Cosmed K4b2 for all subjects was
somewhat higher compared to the pedometer and CSA-accelerometer located on the hip (r2 =
0.67). Unfortunately, the HR method significantly overestimated the measured EE by an
average of 0.4 METs or 11.1% (P < 0.001). When assessing the simultaneous use of HR and
motion sensors a ratio between arm work and leg work was used to determine which regression
equation would be used for each activity. A ratio of ≥25 was used to reflect arm work and a
ratio <25 represented leg work. There was a strong relationship for all subjects between
predicted MET values and measured MET values from the Cosmed K4b2 of r2 = 0.81. The
relationship between the simultaneous HR-motion sensor technique and VO2 was significantly
higher for all subjects compared to HR alone (P < 0.001), the hip-mounted CSA accelerometer (P
< 0.001), and the Yamax pedometer (P < 0.001). It should be noted that this study found similar
results in regards to the limitations utilizing accelerometry and HR monitoring independently.
For instance, when accelerometry is used independent of any other method and the

46
accelerometer is worn on the hip, there is an inability of the accelerometer to differentiate
between walking on a flat surface versus walking up or down hill. Hip-worn accelerometers also
fail to capture upper-body movement. HR slightly overestimated EE due to there being a
different relationship between HR and VO2 when upper body movement was incorporated into
the activities. Due to this limitation with accelerometry the investigators of this study opted to
use both an arm and leg accelerometer to help differentiate between upper and lower body
activity. This allowed the investigators to predict EE utilizing individualized arm or leg HR-VO2
regression equations to make the predictions activity specific and more accurate. One limitation
of this study regards the activities that were chosen and the short period of time in which the
activities were performed.
In a similar study, Strath et al. assessed the validity of the simultaneous HR-motion
sensor technique and the Flex HR method for measuring EE compared to indirect calorimetry
while subjects completed several different lifestyle type activities (92). The Flex HR method has
been described as an individually determined HR, measured in conjunction with VO2 that can be
used to distinguish between resting EE and activity EE (60). In this study, each subject was asked
to lay supine, sit, and stand for ten, five, and five minutes, respectively while HR and VO2 were
measured continuously. The Flex HR point was determined by taking the highest HR during rest
and the lowest HR during incremental exercise during the submaximal treadmill test. Arm and
leg work were performed in all ten subjects to develop individual HR-VO2 regression equations.
HR, VO2, and motion sensor data were collected on a continuous basis for six hours while the
subjects completed their normal daily routine either at the subject’s work place or at their
home. Some of the activities that were done during this time period included, but were not
limited to, watching television, general office work, reading, resistance training, walking,
47
jogging, cooking, light cleaning, vacuuming, washing dishes, grocery shopping, and yard work.
During the continuous six-hour monitoring period each subject was equipped with the Cosmed
K4b2 portable metabolic measurement system, the Polar Vantage NV HR Monitor, and two CSA
accelerometers—one located on the subject’s dominant wrist and the other located on the
subject’s dominant thigh. The specific placement of the CSA accelerometers was to help
determine if the activity performed was primarily an upper- or lower-body activity. In this study,
a CSA threshold of 500 counts/min. reflected a change between rest and activity. Therefore, if
both the leg and arm CSA counts produced less than 500 counts/min., the individual was
considered to be at rest (1 MET). If the leg CSA counts were <500 counts/min. and the arm CSA
counts were >500 counts/min. then measured HR was used to predict EE from the
corresponding arm regression equation and vice versa. A ratio was used if both the arm and leg
CSA counts were >500 counts/min. In the earlier study presented by Strath et al. a ratio >25
between arm and leg activity accurately reflected measured EE when using the simultaneous
HR-motion sensor technique (91). Thus, in this study a ratio of >25 between arm and leg
counts/min. was considered to represent arm activity and the arm regression equation was
utilized to determine EE. If the ratio was <25 the activity was considered to be a predominantly
lower body activity and the leg regression equation was utilized to determine EE. For this
particular subject population the Flex HR ranged from 83 to 101 bpm. During the six hour data
collection time period, any HR below an individual’s Flex HR point, EE was assumed to be one
MET. For HR values above the individual’s Flex HR point, EE was predicted utilizing the
individuals HR-VO2 leg regression equation. There was a significantly stronger relationship
between the HR-motion sensor technique (r2 = 0.81, SEE = 0.55 METs) and VO2 compared to the
Flex HR method (r2 = 0.63, SEE = 0.76 METs) and VO2 (P < 0.001). The simultaneous HR-motion

48
sensor technique did not under or overestimate EE on a minute-by-minute basis, whereas the
Flex HR method had a tendency to overestimate measured minute-by-minute EE (P < 0.001).
The results of this study also showed that the HR-motion sensor technique has the capability to
accurately reflect time spent in resting/light, moderate, and high intensity activity. The Flex HR
method was unable to differentiate between intensities and had a tendency to under predict
time spent in resting/light activity (P = 0.02) and over predict time spent in moderate intensity
activity (P = 0.02). Total EE over the six hour data collection period was accurately assessed by
the HR-motion sensor technique. The results of this study are in agreement with the results of a
previous study conducted by Strath et al. in that using both arm and leg regression equations
significantly improves the prediction of EE compared to using only a leg regression equation
(91). When only a leg regression equation was used predictions of EE via HR overestimated
measured EE by 11%. Thus, it is important to be able to incorporate upper- and lower-body
regression equations into the prediction of EE. The strength of this study is that the
measurements were taken in a field setting and in the comfort of either the subject’s work place
or their own home. It should be noted, however, that the type and time spent in different free-
living activities were not recorded. The investigators of this study suggested the use of a PA log
may have enhanced the simultaneous HR-motion sensor technique by allowing different types
of activities to be evaluated. It should be noted that even though the HR-motion sensor
technique has promising applicability to estimating EE in free-living situations, researchers need
to consider whether the increased time, cost, and effort required to manage the data are worth
the small improvements in accuracy of estimating EE during free-living situations. Despite these
limitations, the HR-motion sensor technique is more accurate compared to either method alone

49
and will currently provide individuals within the general population the most accurate estimates
of EE during free-living situations.

CHAPTER III
Methodology
The purpose of this study was to analyze the simultaneous use of HR monitoring and
multiple accelerometers to estimate EE compared to indirect calorimetry while completing ADL.
It was hypothesized that the simultaneous use of HR monitoring and multiple accelerometers
located on the dominant hip, wrist, and ankle would provide an accurate estimation compared
to indirect calorimetry. It was also hypothesized that utilizing multiple methods to estimate EE
would provide a more accurate estimation compared to the Crouter equation.
Subjects
Fourteen male and 26 female volunteers from Ball State University’s Adult Physical
Fitness Program, Ball State University Faculty/Staff & Students, as well as individuals from the
Muncie community participated in this study. Subjects were required to meet all inclusion and
exclusion criteria. Subjects were to have been 20-60 years of age, male or female, and of any
ethnicity. Subjects were excluded from the research study if they had any uncontrolled
cardiovascular and/or metabolic disease, a fracture of the lower extremity within the last three
months, history of severe arthritis, and/or an orthopedic condition precluding PA. Women who
were pregnant and individuals who started or altered a medication that would

51
have impacted outcome variables examined within the study period (i.e. medications affecting
heart rate) were excluded from the research study as well. Subjects also had to have sufficient
physical function that enabled them to walk without assistance and were able to perform
routine ADL (i.e. sedentary; housework; yard work; locomotion; and recreation). All subjects
were required to read through, understand, and sign an informed consent which was approved
by the Ball State University Institutional Review Board. The informed consent thoroughly
explained study procedures, benefits and associated risks with participation, confidentiality of
information obtained throughout the study, total time commitment, and participation in the
research study was strictly voluntary.
Visit One
The first visit included a review of the subject’s health history questionnaire (HHQ).
Upon completion and review of the subject’s HHQ, each subject had two resting blood pressure
measurements and resting HR, height, weight, and waist/hip circumference measured. Once
the measurements were completed, each subject was instructed to perform 10 ADL.
Resting Heart Rate and Resting Blood Pressure
Each subject remained seated for five minutes in a quiet environment prior to having
their resting HR and resting blood pressure measured. Two blood pressure measurements were
obtained by a trained technician using an aneroid sphygmomanometer and a stethoscope as the
subject was seated quietly in a chair with their feet flat on the floor and left arm supported at
heart level. The lowest recorded blood pressure was utilized for data analysis purposes. Resting

52
HR was then measured by palpating the radial pulse of the left wrist for 30 seconds while the
subject was seated with their feet flat on the floor.
Height and Weight Measurements
The height and weight of each subject was measured using a stadiometer and a
calibrated digital scale, respectively. Subjects removed their shoes, heavy jewelry and/or extra
clothing such as hats, jackets, sweatshirts as well as emptied their pockets in an effort to
prevent measurement error. For height measurements, subjects stood erect with their feet flat
on the floor and their heels, mid-body, and upper body touching the wall (46). The subject took
a normal breath in and held it while looking straight ahead (46).
Waist and Hip Circumference Measurements
Both waist and hip circumferences were measured using a cloth tape measure that had
a spring-loaded handle. Both measurements were made on bare skin. With the subject
standing, arms at their sides, feet together, and their abdomen relaxed, a horizontal measure
was taken at the narrowest part of the torso for each subject’s waist circumference (98). The
hip circumference was taken at the maximal circumference of the buttocks with each subject
standing upright and their feet together (98).
Activities of Daily Living
Subjects completed two activities from each of the following categories: (a) sedentary; (b)
housework; (c) yard work; (d) locomotion; and (e) recreational for a total of 10 activities. Each
activity was completed for seven minutes and done continuously. Subjects were instructed to

53
complete all of the activities at their own pace. The total time for the completion of the ADL
routine was approximately 70 minutes. The activities included:
Sedentary: watching television, reading in a chair, browsing the internet, playing cards
Housework: sweeping with a broom, doing laundry, light cleaning, washing windows
Yard Work: gardening, pulling weeds, watering plants, raking the lawn
Locomotion: walking at a normal pace, pushing a load, carrying boxes of different
weight, walking up/down stairs
Recreational: playing with a basketball, playing with a soccer ball, stationary cycling, and
dancing.
The aforementioned activities were separated into four blocks. Each block consisted of
five activities that were representative of the five different categories chosen for the study.
Each subject was randomized to complete two of the four blocks. The activities were completed
in order of increasing intensity with no rest period between each activity. Activities were
completed both indoors and outdoors and in the event of any inclement weather all activities,
except pulling weeds, were able to be completed indoors. While completing the ADL routine,
each subject wore the Cosmed K4b2 portable metabolic measurement system, three ActiGraph
GT3X+ accelerometers, and one Polar RS800CX HR Monitor.
Indirect Calorimetry
The weight of the Cosmed K4b2 is 1.5 kilograms (kg). The Cosmed K4b2 was calibrated
according to manufacturer’s instructions. This consisted of performing a room air calibration
and a reference gas calibration prior to each test using 16.01% oxygen and 5.01% carbon
dioxide. The turbine was calibrated prior to each test using a 3.00-liter syringe (Hans-Rudolph,

54
Kansas City, Missouri). Lastly, a delay calibration was performed weekly and/or when anything
was replaced on the Cosmed K4b2 to adjust for lag time that occurs between the expiratory flow
measurement and the gas analyzers (31).
The Cosmed K4b2 was fixed onto a chest harness that was worn by the subject. The
subject was then equipped with a facemask (Hans-Rudolph, Kansas City, Missouri) that covered
both their nose and mouth and was then connected to a flowmeter. In order to secure the
facemask to the subjects face a nylon mesh hairnet and Velcro straps were connected to the
facemask. The Cosmed K4b2 was used to analyze VO2, VCO2, and RER continuously throughout
the activities. The Cosmed K4b2 was used as the criterion method for the measurement of EE
during all activities. All data from the Cosmed K4b2 was downloaded to a computer at the
conclusion of each test for subsequent data analysis using the Cosmed K4b2 Software Version
8.0b.
Actigraph Accelerometers
The ActiGraph GT3X+ accelerometer (ActiGraph, Pensacola, Florida) is a small (4.6cm x
3.3cm x 1.5cm) and lightweight (0.019 kg) triaxial accelerometer that is capable of measuring
accelerations in the range of +/- 6 g’s. The GT3X+ accelerometer has a frequency range (0.25 to
2.5 Hertz (Hz)) that is able to detect normal human motion and reject changing accelerations
outside the pass band. All GT3X+ accelerometers were initialized to record data at a sampling
rate of 100 Hz. The raw accelerations were stored in a non-volatile flash memory for future
analysis. Each subject wore one ActiGraph GT3X+ accelerometer on their dominant hip (located
on the mid-thigh line), wrist (located just above the end of the ulna), and ankle (located just
above the lateral malleolus). At the conclusion of each test, the ActiGraph GT3X+

55
accelerometers were downloaded to a computer for subsequent data analysis using the ActiLife
Software Version 5.10.0.
Polar Heart Rate Monitor
The Polar RS800CX HR Monitor (Polar Electro Oy., Kempele, Finland) was used to
measure each subject’s HR while completing each activity. Each subject’s height, weight, birth
date, and gender were entered into the HR monitor prior to beginning the activities. Water was
applied to the electrode areas of the strap in order to maximize transmission. The strap was
placed directly on the subject’s bare skin on the lower part of their chest. The Polar RS800CX HR
Monitor watch was worn on the subject’s non-dominant wrist. Data from the Polar RS800CX HR
Monitor was downloaded to a computer using the Polar Pro Trainer 5 Software.
Seven-Day Physical Activity Assessment
Prior to leaving the first visit, subjects were given one ActiGraph GT3X+ accelerometer
or one ActiGraph GT3X accelerometer (ActiGraph, Pensacola, Florida) to wear for one week (7
days). The GT3X+ accelerometer was initialized at a sampling rate of 100 Hz and the GT3X was
initialized utilizing a 60-second epoch. Subjects were instructed on how to properly use and
wear the accelerometer. The GT3X+ accelerometers were downloaded in raw data form and
then converted to 60-second epochs. The accelerometer was worn on a belt or waistband on
the right hip. If the subject did not wear clothing with a belt or thick waistband, an elastic band
for use was supplied. Each subject was asked to wear the monitor upon awakening with
removal of the monitor at bedtime and during any activity involving water or high risk for
damage for a total of seven days. All subjects record any daytime periods the PA monitor was

56
not worn and/or to record any non-ambulatory activities (ex. swimming, cycling, and
housework) performed during the day. Subjects were also asked to record any unusual or
atypical activities that were performed while wearing the activity monitor. The information that
was recorded on the PA log form was included with the actual data from the accelerometer to
better estimate each subject’s current level of PA. The data was downloaded to a computer for
subsequent data analysis using ActiLife Software Version 5.10.0.
Visit Two
Visit two was scheduled within one-two weeks of visit one. Subjects began their second
visit with a resting metabolic rate (RMR) measurement to assess their resting VO2 as well as
resting EE. That measurement was followed by a dual energy x-ray absorptiometer (DXA) scan
to assess body fat percent as well as bone mineral density. Lastly, each subject performed a
submaximal exercise test to assess each subject’s level of fitness.
Resting Metabolic Rate
Subjects were asked to avoid food and drinks (except water) 3-4 hours prior to their
scheduled test time as well as avoid tobacco, caffeine, and medications. Subjects were also
asked to not engage in any strenuous PA the day prior to their scheduled test time. Subjects
were asked to lie as still as possible on a padded surface in the supine position for 30 minutes in
a quiet room with low lighting. After 30 minutes, a clear plastic hood was placed over the
subjects head and shoulders while the subject remained as still as possible in the supine position
on the padded surface. A clear plastic tube was then connected to the hood, with the other end
of the tube being connected to the TrueOne 2400 metabolic measurement system (Parvo

57
Medics, Sandy, UT). This tube allowed the measurement of each subjects resting VO2 while lying
in the supine position in a well-rested state. The clear plastic tube pulled normal room air into
the hood allowing the subject to breathe normal room air throughout the entire test. Data was
collected for approximately 15-30 minutes depending on the amount of time it took to stabilize
the FeCO2% values (0.8-1.2) for each subject.
Dual Energy X-Ray Absorptiometer (DXA) Scan
Subjects underwent a body composition measurement of total body adiposity and bone
mineral density using the Lunar intelligent dual energy x-ray absorptiometer (iDXA) (GE
Healthcare, Chicago, IL). The Lunar iDXA is a non-invasive procedure that sends a thin, invisible
beam of low dose x-rays through the body and is used to quantify bone mineral density, total fat
mass and fat-free body mass (33). Subjects were asked to remove their shoes, any metal they
were wearing or had in their pockets, any belts, watches, and glasses (if possible). Subjects had
to be still in the supine position on the Lunar iDXA platform for approximately 7-13 minutes
depending on body size.
Submaximal Exercise Test
The submaximal treadmill test was conducted utilizing the Bruce Protocol which is
described elsewhere (20). Metabolic measurements such as ventilation, VO2, and respiratory
exchange ratio were continuously assessed utilizing the TrueOne 2400 Metabolic Measurement
System (Parvo Medics, Sandy, UT). Blood pressure measurements were obtained every three
minutes and a rating of perceived exertion (RPE) was obtained every minute throughout the
test. Heart rate and ECG were continuously assessed through the General Electric Case Stress

58
System (Chicago, IL). The submaximal exercise test was terminated when the subject reached
85% of their age-predicted maximal HR or when the subject completed the fourth stage of the
Bruce protocol. The submaximal treadmill test was used to estimate each subject’s aerobic
capacity. From the test, data points for both HR and VO2 were plotted on a graph. Each
subject’s age-predicted HR max was used as the final HR point and a linear trendline was used to
determine the estimated VO2 value.
Data Analysis
An external time piece was used to synchronize the start time of the Cosmed K4b2, the
three ActiGraph GT3X+ accelerometers, and the Polar RS800CX HR Monitor. An annotation
sheet was utilized to record the start and stop time of each activity. For data analysis purposes,
minutes 4-7 of each activity were averaged to obtain mean HR, VO2, and activity counts from
each accelerometer.
Comparisons were made between actual EE (Cosmed K4b2), the multiple regression
equation developed in the current study, the Polar RS800CX HR Monitor, and the two-regression
model developed by Crouter et al. (31). EE from the Polar RS800CX HR Monitor was calculated
through the OwnCalS program that is built into the HR monitor. The OwnCalS program uses
each subject’s age, gender, height, weight, and ADL HR to determine EE. Crouter’s et al. two-
regression model was calculated using the ActiLife Software Version 5.10.0. The average METs
was then converted to EE two different ways. Crouter1 was converted from METs to VO2
(ml/kg/min) by dividing 3.5 and then converting to EE (kcals/min). Crouter2 was converted from
METs to VO2 (ml/kg/min) by dividing each subject’s resting VO2 and then converting to EE
(kcals/min).

59
Statistical Analysis
Statistical analyses were carried out using IBM SPSS Statistics 19.0 for windows (SPSS,
Chicago, IL). For all analyses, an alpha value of 0.05 was used to indicate statistical significance.
All values are reported as means ± standard deviation. Independent t-tests were used to
compare mean values for descriptive characteristics between male and female as well as
differences between different age groups. A forward stepwise regression model was employed
in order to evaluate the relationship between measured EE, HR, type of activity, and ankle-, hip-,
and wrist-worn accelerometer activity counts. Lastly, a one-way repeated-measures ANOVA
was used to compare differences in EE between the Cosmed K4b2, the regression equation, the
Polar RS800CX HR monitor, and the two-regression model developed by Crouter et al (31).
Pairwise comparisons with Bonferroni adjustments were performed to locate significant
differences for each activity category between the Cosmed K4b2, the multiple regression
equation developed in the current study, the Polar RS800CX HR Monitor, and the two-regression
model developed by Crouter et al. (31).

CHAPTER IV
Research Manuscript
This manuscript was prepared in accordance with the instructions for authors for the journal: Medicine and Science in Sports and Exercise

61
MONICA M. KIRSCHNER
ABSTRACT
Assessment of Energy Expenditure and Physical Activity Intensity through Simultaneous Use of Heart Rate Monitoring and Accelerometry
Human Performance Laboratory, Ball State University, Muncie, IN
Purpose: In order to have a complete understanding of the relationship between daily PA and health, it is essential to be able to accurately assess PA in free-living subjects. The purpose of this study was to analyze the method of using three accelerometers located on the subjects dominant ankle, hip, and wrist and a HR monitor to estimate EE compared to measured EE via indirect calorimetry while completing ADL. Methods: Forty subjects, aged 20-60 years, completed two activities from each of the following general activity categories: sedentary, housework, yard work, locomotion, and recreational. During each activity, EE was measured using a portable metabolic measurement system (Cosmed K4b2). Subjects also wore three ActiGraph GT3X+ accelerometers and one Polar RS800CX HR monitor. Correlations between EE measured by the Cosmed K4b2, activity counts recorded by the Actigraph GT3x+ accelerometers and HR recorded by the Polar RS800CX HR monitor were calculated, and a regression equation was developed to predict EE from the multi-method approach. Results: The regression equation showed a significant relationship (r2 = 0.84; P < 0.05) with EE. Together, HR and the hip-worn accelerometer explained 73.4% of the variance in EE with HR accounting for 59.3% (P < 0.05). Type of activity explained an additional 5% of the variance in EE (r2 = 0.78; P < 0.05). Both the wrist- and ankle-worn accelerometers each explained an additional 3% of the variance in EE (r2 = 0.81; r2 = 0.84, respectively) (P < 0.05). When cross-validated, the regression equation significantly overestimated sedentary activities by 0.22 ± 0.08 kcals/min (P < 0.004) and underestimated housework activities by 0.20 ± 0.08 kcals/min (P < 0.01). Conclusion: The regression equation developed is a good predictor of EE during selected ADL, and allows researchers to more accurately quantify free-living PA. Key Words: PHYSICAL ACTIVITY, INDIRECT CALORIMETRY, HEART RATE, ACCELEROMETER

62
Introduction
Various physical activity (PA) recommendations have been issued in order to combat the
high prevalence of physical inactivity and to promote healthier lifestyles. The most current PA
recommendations were provided in 2008 by the U.S. Department of Health and Human
Services. These recommendations suggest individual’s should accumulate either 150 minutes of
moderate intensity PA per week, 75 minutes of vigorous intensity PA per week or an equivalent
combination of moderate and vigorous intensity PA in bouts ≥10 minutes (1). Muscle
strengthening exercises were also recommended to be completed on at least two days/week.
These recommendations were focused on “reducing the risk of chronic disease and promoting
health-related fitness, particularly cardiovascular and muscular fitness” (1).
Assessment of PA is important; however, accurate and reliable methods are lacking.
Researchers have primarily focused on subjective methods such as surveys, logs, and
questionnaires to quantify energy expenditure (EE). There is evidence that shows PA surveys
and questionnaires are less accurate during light and moderate intensity activities compared to
vigorous intensity activities due in large part to recall error (22,29). Researchers have also found
that subjects have a tendency to misinterpret the questions being asked (29).
The potential use of objective methods—heart rate (HR) and motion sensors—to assess
EE during free-living situations has been discussed elsewhere (3,7,8,10,12,13,25). Each method
is capable of providing an estimate of EE; however, there are several limitations when each
method is used individually. HR is a physiological variable that reflects change in PA intensity;
unfortunately, it is influenced by several factors such as mental stress, ambient temperature,
hydration status, emotion, activity mode, posture, and quantity of muscle mass involved in the
activity, thus limiting its applicability (15,18,25,28). Motion sensors (i.e. accelerometers) are

63
generally worn on the hip and are growing in popularity, but are unable to capture non-
ambulatory activities (i.e. cycling, swimming, resistance training, etc.), upper-body movements,
and the external work done when lifting or pushing objects (2). Due to the limitations of each
individual method, researchers have proposed that the method of utilizing HR and motion
sensors simultaneously will improve the accuracy of estimating EE during free-living situations
(11,23,24).
Several regression equations have been developed relating accelerometer activity
counts and EE. Regression equations for estimating EE are generally developed during walking
or running using hip-worn accelerometer counts (5,12,14,17,30). Other regression equations
have been developed to predict EE during walking and jogging based on activity counts from
ankle-, hip-, and wrist-worn accelerometers combined (19). Lifestyle regression equations have
also been developed to estimate EE during moderate intensity lifestyle type activities from hip-
worn accelerometer counts (14) as well as the combination of hip- and wrist-worn
accelerometer counts (26). According to Crouter et al., these different regression equations
pose a problem for researchers during free-living situations because there is no single regression
line that has the capability to accurately predict EE or time spent in different PA intensities
across a wide range of activities (9). The most current regression approach is the two-regression
model developed by Crouter et al. based on activity counts/minute and variability in activity
counts between 10-second epochs which give the equation the capability to distinguish
between walking, running, and other lifestyle type activities (9). In the study conducted by
Crouter et al., the two-regression model was not significantly different (within 0.75 METs) for
each of the 17 activities and all activities combined as compared to measured METs (9).

64
Accurate estimates of total PA are extremely important in understanding dose-response
relationships, clarifying which dimension of activity is most strongly associated with a particular
health outcome, improving the ability to monitor secular trends in activity levels and the
compliance to intervention programs, and cross-cultural comparisons. The purpose of this study
was to analyze the method of using three ActiGraph GT3X+ accelerometers located on the
subjects dominant ankle, hip, and wrist and a Polar RS800CX HR monitor to estimate EE
compared to measured EE via indirect calorimetry while completing different activities of daily
living (ADL).
Methods
Subjects
Subjects were 20-60 years of age, male or female, and were of any ethnicity. There
were 10 subjects within each 10 year age group. The goal was to have equal gender distribution
in each 10 year age group (5 male, 5 female); however, this did not occur due to limited
recruitment time. Individuals were excluded from the study if they did not meet the following
criteria: 1) have any uncontrolled cardiovascular and/or metabolic disease, 2) have a fracture of
the lower extremity within the last three months, 3) have a history of arthritis, 4) have any
orthopedic condition precluding PA, 5) women who were pregnant, and 6) individuals who
started or altered a medication that would have impacted outcome variables examined within
the study period (i.e. medications affecting HR). Subjects were also required to have sufficient
physical function that enabled them to walk without assistance and were able to perform
routine ADL (i.e. sedentary; housework; yard work; locomotion; and recreational activities). All
subjects provided a written informed consent at the time of their first visit which was approved
65
by the Ball State University Institutional Review Board. The physical characteristics of the
participants included in this study are listed in Table 1.
Procedures
The first visit included a review of the subject’s health history questionnaire (HHQ).
Upon completion and review of the subject’s HHQ, each subject had two resting blood pressure
measurements and resting HR, height, weight, and waist/hip circumference measured. Once
the measurements were completed, each subject was monitored while they completed 10 ADL.
Each subject was then either given one ActiGraph GT3X+ accelerometer or one ActiGraph GT3X
accelerometer (ActiGraph, Pensacola, Florida) to assess each subject’s PA level for one week (7
days). Subjects then returned to the Ball State Human Performance Laboratory for a second
visit within one-two weeks of their first visit. Visit two required subjects to undergo a resting
metabolic rate measurement, a dual energy x-ray absorptiometer scan (DXA), and a submaximal
exercise test.
Visit One
Resting Heart Rate and Resting Blood Pressure
Each subject remained seated for five minutes in a quiet environment prior to having
their resting HR and resting blood pressure measured. Two blood pressure measurements were
obtained by a trained technician using an aneroid sphygmomanometer and a stethoscope as the
subject was seated quietly in a chair with their feet flat on the floor and left arm supported at
heart level. The lowest recorded blood pressure was utilized for data analysis purposes.

66
Resting HR was then measured by palpating the radial pulse of the left wrist for 30 seconds
while the subject was seated with their feet flat on the floor.
Height and Weight Measurements
The height and weight of each subject was measured using a stadiometer and a
calibrated digital scale, respectively. Subjects removed their shoes, heavy jewelry and/or extra
clothing such as hats, jackets, sweatshirts as well as emptied their pockets in an effort to
prevent measurement error. For height measurements, subjects stood erect with their feet flat
on the floor and their heels, mid-body, and upper body touching the wall (16). The subject took
a normal breath in and held it while looking straight ahead (16).
Waist and Hip Circumference Measurements
Both waist and hip circumferences were measured using a cloth tape measure that had
a spring-loaded handle. Both measurements were made on bare skin. With the subject
standing, arms at their sides, feet together, and their abdomen relaxed, a horizontal measure
was taken at the narrowest part of the torso for each subject’s waist circumference (27). The
hip circumference was taken at the maximal circumference of the buttocks with each subject
standing upright and their feet together (27).
Activities of Daily Living
Subjects completed two activities from each of the following categories: (a) sedentary; (b)
housework; (c) yard work; (d) locomotion; and (e) recreational for a total of 10 activities. Each
activity was completed for seven minutes and done continuously. Subjects were instructed to
67
complete all of the activities at their own pace. The total time for the completion of the ADL
routine was approximately 70 minutes. The activities included:
Sedentary: watching television, reading in a chair, browsing the internet, playing cards
Housework: sweeping with a broom, doing laundry, light cleaning, washing windows
Yard Work: gardening, pulling weeds, watering plants, raking the lawn
Locomotion: walking at a normal pace, pushing a load, carrying boxes of different
weight, walking up/down stairs
Recreational: playing with a basketball, playing with a soccer ball, stationary cycling, and
dancing.
The aforementioned activities were separated into four blocks. Each block consisted of
five activities that were representative of the five different categories chosen for the study.
Each subject was randomized to complete two of the four blocks. The activities were completed
in order of increasing intensity with no rest period between each activity. While completing the
ADL routine, each subject wore the Cosmed K4b2 portable metabolic measurement system,
three ActiGraph GT3X+ accelerometers, and one Polar RS800CX HR Monitor.
Indirect Calorimetry
The weight of the Cosmed K4b2 (Cosmed, Rome, Italy) is 1.5 kilograms (kg). The Cosmed
K4b2 was calibrated according to manufacturer’s instructions. This consisted of performing a
room air calibration and a reference gas calibration prior to each test using 16.01% oxygen and
5.01% carbon dioxide. The turbine was also calibrated prior to each test using a 3.00-liter
syringe (Hans-Rudolph, Kansas City, Missouri). Lastly, a delay calibration was performed weekly

68
and/or when anything was replaced on the Cosmed K4b2 to adjust for lag time that occurs
between the expiratory flow measurement and the gas analyzers (9).
The Cosmed K4b2 was fixed onto a chest harness that was worn by each subject. The
subject was then equipped with a facemask (Hans-Rudolph, Kansas City, Missouri) that covered
both their nose and mouth and was then connected to a flowmeter. In order to secure the
facemask to the subject’s face a nylon mesh hairnet and Velcro straps were connected to the
facemask. The Cosmed K4b2 analyzed VO2, VCO2, and RER continuously throughout the
activities. The Cosmed K4b2 was used as the criterion method for the measurement of EE during
all activities. All data from the Cosmed K4b2 was downloaded to a computer at the conclusion
of each test for subsequent data analysis using the Cosmed K4b2 Software Version 8.0b.
ActiGraph Accelerometers
The ActiGraph GT3X+ accelerometer (ActiGraph, Pensacola, Florida) is a small (4.6cm x
3.3cm x 1.5cm), lightweight (0.019 kg) triaxial accelerometer that is capable of measuring
accelerations in the range of +/- 6 g’s. The GT3X+ accelerometer has a frequency range (0.25 to
2.5 Hertz) that is able to detect normal human motion and reject changing accelerations outside
the pass band. All three GT3X+ accelerometers were initialized to record data at a sampling rate
of 100 Hz/second. The raw accelerations were stored in a non-volatile flash memory for future
analysis. Each subject wore one ActiGraph GT3X+ accelerometer on their dominant ankle
(located just above the lateral malleolus), hip (located on the mid-thigh line), and wrist (located
just above the end of the ulna). At the conclusion of each test, the ActiGraph GT3X+
accelerometers were downloaded to a computer for subsequent data analysis using the ActiLife
Software Version 5.10.0.

69
Polar RS800CX Heart Rate Monitor
The Polar RS800CX HR Monitor (Polar Electro Oy., Kempele, Finland) was used to
measure each subject’s HR while completing each activity. Each subject’s height, weight, birth
date, and gender were entered into the HR monitor prior to beginning the activities. Water was
applied to the electrode areas of the strap in order to maximize signal transmission. The strap
was placed directly on the subject’s bare skin on the lower part of the chest. The Polar RS800CX
HR Monitor watch was worn on the subject’s non-dominant wrist. Data from the Polar RS800CX
HR Monitor was downloaded to a computer using the Polar Pro Trainer 5 Software.
Seven-Day Physical Activity Assessment
Prior to leaving the first visit, subjects were given one ActiGraph GT3X+ accelerometer
or one ActiGraph GT3X accelerometer (ActiGraph, Pensacola, Florida) to wear for one week (7
days). The GT3X+ accelerometer was initialized at a sampling rate of 100 Hz and the GT3X was
initialized utilizing a 60-second epoch. The GT3X+ accelerometers were downloaded in raw data
form and then converted to 60-second epochs. The accelerometer was worn on a belt or
waistband on the right hip. If the subject did not wear clothing with a belt or thick waistband,
an elastic band for use was supplied. Each subject was asked to wear the monitor upon
awakening with removal of the monitor at bedtime and during any activity involving water or
high risk for damage for a total of seven days. All subjects recorded any daytime periods the PA
monitor was not worn and/or recorded any non-ambulatory activities (ex. swimming, cycling,
and housework) performed during the day. Subjects recorded any unusual or atypical activities
performed while wearing the activity monitor. The information that was recorded on the PA log
form was included with the actual data from the accelerometer to better estimate each

70
subject’s current level of PA. The data was downloaded to a computer for subsequent data
analysis using ActiLife Software Version 5.10.0.
Visit Two
Visit two was scheduled within one-two weeks of visit one. Subjects began their second
visit with a resting metabolic rate (RMR) measurement to assess their resting VO2. That
measurement was followed by a dual energy x-ray absorptiometer (DXA) scan to assess body fat
percent as well as bone mineral density. Lastly, each subject performed a submaximal exercise
test to assess each subject’s fitness level.
Resting Metabolic Rate
Subjects avoided food and drinks (except water) 3-4 hours prior to their scheduled test
time as well as avoided tobacco, caffeine, and medications. Subjects did not engage in any
strenuous PA the day prior to their scheduled test time. Subjects lied as still as possible on a
padded surface in the supine position for 30 minutes in a quiet room with low lighting. After 30
minutes, a clear plastic hood was placed over the subject’s head and shoulders while the subject
remained as still as possible in the supine position on the padded surface. A clear plastic tube
was then connected to the hood, with the other end of the tube being connected to the
TrueOne 2400 metabolic measurement system (Parvo Medics, Sandy, UT). This tube allowed for
the measurement of each subjects resting VO2 while lying in the supine position in a well-rested
state. The clear plastic tube pulled normal room air into the hood allowing the subject to
breathe normal room air throughout the entire test. Data was collected for approximately 15-

71
30 minutes depending on the amount of time it took to stabilize the FeCO2% values (0.8-1.2) for
each subject.
Dual Energy X-Ray Absorptiometer (DXA) Scan
Subjects underwent a body composition measurement of total body adiposity and bone
mineral density using the Lunar intelligent dual energy x-ray absorptiometer (iDXA) (GE
Healthcare, Chicago, IL). Subjects removed their shoes, any metal they were wearing or had in
their pockets, any belts, watches, and glasses (if possible). Subjects had to be still in the supine
position on the Lunar iDXA platform for approximately 7-13 minutes depending on body size.
Submaximal Exercise Test
The submaximal treadmill test was conducted with the Bruce Protocol which is
described elsewhere (6). Metabolic measurements such as ventilation, oxygen uptake, and
respiratory exchange ratio were continuously assessed utilizing the TrueOne 2400 Metabolic
Measurement System (Parvo Medics, Sandy, UT). Blood pressure measurements were obtained
every three minutes and a rating of perceived exertion was obtained every minute throughout
the test. HR and ECG were continuously assessed through the General Electric Case Stress
System (Chicago, IL). The submaximal exercise test was terminated when the subject reached
85% of their age-predicted maximal HR or when the subject completed the fourth stage of the
Bruce protocol. The submaximal treadmill test was used to estimate each subject’s aerobic
capacity. From the test, data points for both HR and VO2 were plotted on a graph. Each
subject’s age-predicted HR max was used as the final point for HR and a linear trendline was
used to determine the estimated VO2 value.
72
Data Analysis
An external time piece was used to synchronize the start time of the Cosmed K4b2, the
three ActiGraph GT3X+ accelerometers, and the Polar RS800CX HR Monitor precisely at a 60-
second epoch. An annotation sheet was utilized to record the start and stop time of each
activity. For data analysis purposes, minutes 4-7 of each activity were averaged to obtain mean
HR, VO2, and activity counts from each accelerometer.
Comparisons were made between actual EE (Cosmed K4b2), the multiple regression
equation developed in the current study, the Polar RS800CX HR Monitor, and the two-regression
model developed by Crouter et al. (9). EE from the Polar RS800CX HR Monitor was calculated
through the OwnCalS program that is built into the HR monitor. The OwnCalS program uses
each subject’s age, gender, height, weight, and ADL HR to determine EE. Crouter’s et al. two-
regression model was calculated using the ActiLife Software Version 5.10.0. The average MET
values were then converted to EE two different ways. Crouter1 was converted from METs to
VO2 (ml/kg/min) by dividing 3.5 and then converting to EE (kcals/min). Crouter2 was converted
from METs to VO2 (ml/kg/min) by dividing each subject’s resting VO2 and then converting to EE
(kcals/min).
Statistical Analysis
Statistical analyses were carried out using IBM SPSS Statistics 19.0 for windows (SPSS,
Chicago, IL). For all analyses, an alpha value of 0.05 was used to indicate statistical significance.
All values are reported as means ± standard deviation. Independent t-tests were used to
compare mean values for descriptive characteristics between male and female as well as
differences between different age groups. A forward stepwise regression model was employed

73
in order to evaluate the relationship between measured EE, HR, type of activity, and ankle-, hip-,
and wrist-worn accelerometer activity counts. Lastly, a one-way repeated-measures ANOVA
was used to compare differences in EE between the Cosmed K4b2, the regression equation, the
Polar RS800CX HR monitor, and the two-regression model developed by Crouter et al (9).
Pairwise comparisons with Bonferroni adjustments were performed to locate significant
differences for each activity category between the Cosmed K4b2, the multiple regression
equation developed in the current study, the Polar RS800CX HR Monitor, and the two-regression
model developed by Crouter et al. (9).
Results
Subject Characteristics
The study cohort consisted of 26 female and 14 male subjects. Descriptive
characteristics, by gender, for resting variables are displayed in Table 1. Independent t-tests
revealed no significant differences between gender for age (P = 0.85), resting HR (P = 0.56), and
resting VO2 (P = 0.59). Men significantly weighed more, had significantly higher BMI’s and had
significantly higher resting EE values compared to that of women (P < 0.05). No comparisons
were made between age groups due to an uneven distribution of male and female subjects in
each 10 year age group.
Indirect Calorimetry
As shown in Table 2, playing cards resulted in a significantly higher average VO2
compared to watching TV, computer, and reading in a chair (P < 0.05). The average VO2 for
washing windows was significantly higher compared to all other housework activities including

74
sweeping, doing laundry, and light cleaning (P < 0.05) (Table 3). Raking produced the highest
average VO2 for yard work activities, but was only significantly different from that of general
gardening and watering plants (P < 0.05) (Table 4). As shown in Table 5, walking up and down
stairs produced a significantly higher average VO2 compared to all other locomotive activities (P
< 0.05). Lastly, playing basketball produced a significantly higher average VO2 compared to
playing soccer, stationary cycling, and dancing (P < 0.05) (Table 6).
Predicted Energy Expenditure
Heart Rate. The average HR for all sedentary, housework, yard work, locomotion, and
recreational activities was 69, 86, 91, 98, and 110 bpm, respectively. The relationship between
EE and average HR was statistically significant (r2 = 0.59; P < 0.05). Moreover, these findings
indicate that the variance in EE explained by HR alone accounts for 59.3%.
Hip-Worn Accelerometer. The average counts/min. produced by the hip-worn
accelerometer for all sedentary, housework, yard work, locomotion, and recreational activities
were 4, 352, 561, 2601, and 1526 counts/min., respectively. Accounting for the hip in addition
to average HR improved the relationship (r2 = 0.73, P < 0.05) with EE compared to HR alone and
remained significant. The hip-worn accelerometer explained an additional 14.1% of variance in
EE compared to HR alone.
Type of Activity. Furthermore, when accounting for type of activity being performed
there was an even greater improvement in the relationship with EE as compared to HR alone
and the combination of HR and a hip-worn accelerometer (r2 = 0.78; P < 0.05). This relationship
indicates that an additional 5% of the variance in EE can be explained by type of activity.

75
Wrist-Worn Accelerometer. The average counts/min. for the wrist-worn accelerometer
for all sedentary, housework, yard work, locomotion, and recreational activities was 546, 5638,
4185, 2733, and 5284 counts/min., respectively. Accounting for the wrist—in addition to
average HR, the hip-worn accelerometer, and type of activity—showed further improvements in
the relationship between EE (r2 = 0.81, P < 0.05) and remained significant. Despite this
significant improvement, the wrist-worn accelerometer only provided an additional 3% of
variance in EE.
Ankle-Worn Accelerometer. The last independent variable accounted for in the forward
regression model was the ankle-worn accelerometer. The average counts/min for the ankle-
worn accelerometer for all sedentary, housework, yard work, locomotion, and recreational
activities were 8, 679, 1024, 6719, and 8346 counts/min., respectively. The addition of the
ankle-worn accelerometer further improved the relationship with EE (r2 = 0.84, P < 0.05) and
remained significant. However, the ankle-worn accelerometer only explained an additional 3%
of variance in EE.
The relationship from all variables can be predicted from a regression line of y = -1.372 +
0.065x + 0.001x2 + 0.491x3 + 0.00042x4 + 0.00024x5, where x = HR; x2 = hip-worn accelerometer;
x3 = type of activity; x4 = wrist-worn accelerometer; x5 = ankle-worn accelerometer.
Comparisons of Predicted Energy Expenditure
Comparisons were made between the Cosmed K4b2, the multiple regression equation,
the two-regression model developed by Crouter et al. (9), and the EE predicted from the Polar
RS800CX HR monitor.

76
Sedentary Activities. As shown in Figure 1, EE during sedentary activities as measured
by the Cosmed K4b2 was significantly different compared to estimated EE from the multiple
regression equation (-0.22 ± 0.08 kcals/min) and HR (1.03 ± 0.28 kcals/min) (P < 0.05).
Furthermore, HR (1.26 ± 0.28 kcals/min) and Crouter2 (0.28 ± 0.13 kcals/min) (P < 0.05)
significantly underestimated EE compared to the multiple regression equation.
Housework Activities. For housework activities (Figure 2), EE predicted by the multiple
regression equation (0.20 ± 0.08 kcals/min), HR (1.18 ± 0.28 kcals/min), and Crouter2 (0.58 ±
0.14 kcals/min) significantly underestimated EE compared to the Cosmed K4b2 (P < 0.05).
Predicted EE from the multiple regression equation was significantly different compared to HR
(0.98 ± 0.28 kcals/min) and Crouter2 (0.38 ± 0.13 kcals/min) (P < 0.05). There was no significant
difference between EE predicted from the multiple regression equation to that predicted from
Crouter1 (-0.06 ± 0.14 kcals/min) (P = 0.67).
Yard Work Activities. EE predicted by the multiple regression equation (0.07 ± 0.08
kcals/min), HR (0.43 ± 0.28 kcals/min), and Crouter1 (-0.67 ± 0.14 kcals/min) were not
significantly different compared to EE measured by the Cosmed K4b2 (P = 0.38, P = 0.13, P =
0.65, respectively) for yard work activities (Figure 3). However, EE predicted from Crouter2 was
significantly different compared to EE measured by the Cosmed K4b2 (0.41 ± 0.14 kcals/min) (P <
0.05). Furthermore, the multiple regression equation was not significantly different from EE
predicted by HR (0.36 ± 0.28 kcals/min) (P = 0.20) and Crouter1 (-0.13 ± 0.14 kcals/min) (P =
0.34). When compared to the multiple regression equation, Crouter2 significantly
underestimated EE (0.35 ± 0.13 kcals/min) (P < 0.05).
Locomotive Activities. As displayed in Figure 4, the multiple regression equation
significantly underestimated EE compared to Crouter1 (-1.87 ± 0.14 kcals/min) and Crouter2 (-

77
0.96 ± 0.13 kcals/min) (P < 0.05) during locomotive activities. When compared to the multiple
regression equation, predicted EE from HR significantly underestimated EE (-0.56 ± 0.28
kcals/min) (P < 0.05). Additionally, there were no differences in EE between the multiple
regression equation and the Cosmed K4b2 (-0.07 ± 0.08 kcals/min) (P = 0.35). Crouter1
significantly overestimate EE compared to the Cosmed K4b2 (1.80 ± 0.14 kcals/min), HR (2.43 ±
0.32 kcals/min), and Crouter2 (0.92 ± 0.07 kcals/min) (P < 0.05).
Recreational Activities. The average kcals/min expended during recreational activities
for the Cosmed K4b2, the multiple regression equation, HR, Crouter1, and Crouter2 are
displayed in Figure 5. EE predicted from the multiple regression equation was not significantly
different compared to the Cosmed K4b2 (0.06 ± 0.08 kcals/min) (P = 0.47) and Crouter1 (0.02 ±
0.14 kcals/min) (P = 0.91). Significant differences, however, were observed between the
multiple regression equation and HR (-0.78 ± 0.28 kcals/min) (P <0.05) as well as Crouter2 (0.76
± 0.14 kcals/min) (P < 0.05). The Cosmed K4b2 was significantly different compared to predicted
EE from HR (-0.84 ± 0.28 kcals/min) and Crouter2 (0.70 ± 0.14 kcals/min) (P < 0.05).
Discussion
This study describes an approach to estimating EE using multiple methods by combining
HR, type of activity, ankle-, hip-, and wrist-worn accelerometer counts. With this approach the
estimations of EE are substantially improved compared to using any of the methods
independently. The multiple regression equation developed in the current study was
significantly correlated with EE (r = 0.92) (P < 0.05).
When considering the individual variables that make up the multiple regression
equation, HR explained the majority of the variance in EE accounting for 59.3%. This result is

78
similar to that found by Strath et al. who found a correlation of 0.68 between HR and VO2 with
HR explaining 47% of the variance in VO2 (25). The current study had subjects perform
sedentary, light, and moderate intensity activities; whereas, Strath et al. only analyzed
correlations between EE and moderate intensity activities. When Strath et al. adjusted for age
and fitness level, HR became an even more accurate predictor of EE as compared to measured
EE via indirect calorimetry with a correlation of 0.87. These results are similar to the current
study which found a correlation of 0.92 between the multiple method approach and EE.
In the current study, the hip-worn accelerometer explained an additional 14.1% of the
variance in EE (r2 = 0.73; P < 0.05) to that already explained by HR alone. The results of the
current study are similar to that found by Eston et al. who predicted EE while 30 children walked
at two speeds (2.5 and 3.7 mph), ran on a treadmill (5.0 and 6.2 mph), played catch, played
hopscotch, and sat and crayoned for four minutes per activity (11). In this study, VO2 was
expressed as a ratio of body mass raised to the power of 0.75 [scaled oxygen uptake (sVo2)] in
order to be able to compare the results of this study from children to that of adults. A multiple
regression analysis was used to establish the efficacy of using two measures simultaneously.
The best predictor of sVo2 compared to any other measure alone was the combination of HR
and a hip-mounted triaxial accelerometer (r2 = 0.85). HR added 2.0% (P < 0.01) of variance to
that already explained by the hip-mounted triaxial accelerometer. These results are similar to
the present study which showed that the combination of HR and activity counts from the hip-
worn accelerometer accounted for 73.4% of the variance in EE. However, in the current study
HR accounted for 59.3% of the variance in EE and the hip-worn accelerometer accounted for an
additional 14.1% of the variance in EE to that already explained by HR which is in contrast to the
study by Eston et al. (11). One possible reason for the variation in the results of these two
79
studies may be attributed to the type of activities performed. In the current study, subjects
completed more upper body activities compared to the subjects in the study by Eston et al. (11).
There is a linear relationship for HR and VO2 during both upper- and lower-body dynamic
exercises, but upper-body dynamic exercise produces a HR that is approximately 10% higher at
any given submaximal workload compared to lower-body dynamic exercise (20). A second
possible reason for the variation in the results of the two studies can be attributed to the
different subject populations. In the current study, subjects ranged in age from 20-60 years;
whereas, Eston et al. analyzed children aged 8-10 years (11). It is well-known that there is an
age-related effect on HR, children have smaller hearts, and physically fit individuals will have a
lower HR at any given submaximal workload compared to unfit individuals due to a greater
stroke volume (20).
The strength of the relationship between HR and activity counts from the hip-worn
accelerometer compared to EE (r2 = 0.73) found in the present study is similar to that found by
Strath et al. (23). Strath et al. assessed the accuracy of the HR-motion sensor technique to
estimate EE for a variety of different activities in 30 volunteers (23). Some of the activities
included vacuuming, washing windows, light cleaning, raking, general gardening, slow walking,
and walking up/down stairs intermittently. The relationship for all subjects between predicted
MET values from the hip-worn CSA accelerometer compared to measured MET values from the
Cosmed K4b2 was r2 = 0.54. The relationship between the HR method and measured METs from
the Cosmed K4b2 for all subjects was somewhat higher compared to the hip-worn CSA
accelerometer (r2 = 0.67) which is similar to the results found for HR in the current study (r2 =
0.59). When combined, the HR-motion sensor technique was significantly related to measured
METs (r2 = 0.81). It should be noted that the results of the study conducted by Strath et al. may

80
only be applicable to the activities performed. Also, Strath et al. did not account for activity
counts from the ankle and/or wrist accelerometers which provide significant improvements in
the accuracy of estimating EE as shown in the current study.
Lifestyle type activities may include components that increase EE that are not accurately
assessed by HR or accurately captured by the hip-worn accelerometer, such as upper-body
movements and any lifting or carrying of objects. In order to address these limitations an
accelerometer was placed on each subject’s dominant wrist during all activities in the current
study. The wrist-worn accelerometer explained an additional 3% of the variance in EE for all
activities combined. This small increase may be due to the fact that some activities had little to
no arm movement (i.e. stationary cycling, walking, playing soccer, etc.). Theoretically, the wrist-
worn accelerometer may explain more of the variance in EE for activities that produce higher
activity counts such as washing windows, gardening, playing cards, etc. It may be beneficial for
researchers to determine a threshold for activity counts to determine whether or not the wrist-
worn accelerometer should be used to estimate EE.
The results of the current study are similar to that found by Swartz et al. who assessed
the estimation of EE utilizing CSA accelerometers at the hip and wrist sites in 70 subjects while
they completed anywhere from one to six different activities within six different categories: yard
work, housework, family care, occupation, recreation, and conditioning (26). The regression
equation for the wrist and the hip alone accounted for 3.3% and 31.7% of the variance in EE,
respectively. When the wrist and hip data were combined, the regression equation accounted
for 34.3% of the variance in EE. Indicating that the wrist-worn accelerometer explained an
additional 2.6% of the variance in EE to that already explained by the hip-worn accelerometer,
which is similar to the findings in the current study.

81
Another point to consider is that hip- and wrist-worn accelerometers are unable to
detect changes in level of terrain as well as some non-ambulatory activities such as stationary
cycling and swimming. Due to this inability an accelerometer was placed on each subject’s
dominant ankle to determine the relationship between activity counts and EE while subjects
completed the ADL routine in the current study. The ankle-worn accelerometer explained an
additional 3% of the variance in EE (r2 = 0.84; P < 0.05). This low variance in EE may be due to
the fact that some activities produced little or no activity counts for the ankle-worn
accelerometer (i.e. watching TV, surfing the internet, doing laundry, etc.); whereas, other
activities produced very high activity counts (i.e. stationary cycling, dancing, sweeping, etc.).
Again, it may be beneficial for researchers to determine a threshold for activity counts in order
to determine whether or not the ankle-worn accelerometer should be used to estimate EE.
Melanson and Freedson conducted a study assessing the validity of the CSA
accelerometer in 28 volunteers while walking and jogging at different speeds (19). The CSA
ankle, wrist, and hip counts were significantly correlated with EE (r = 0.66, r = 0.81, r = 0.80,
respectively, P < 0.01). The best single accelerometer model used data from the CSA wrist-worn
accelerometer, which accounted for 86% of the variance in EE. This result is in contrast to the
current study which did not find the wrist-worn accelerometer to be the best single method to
estimate EE and only explained an additional 3% of the variance in EE to that already explained
by several other methods. Melanson and Freedson found that both the CSA ankle- and hip-
worn accelerometers explained an additional 3% of variance in EE when either one was
combined with the wrist-worn accelerometer (r2 = 0.89). In the current study, the ankle- and
hip-worn accelerometers produced an additional 3% and 14.1% of the variance in EE,
respectively. The differences between the two studies may be attributed to the type of
82
activities used to develop the regression equations. Melanson and Freedson analyzed treadmill
walking and jogging; whereas, the equation developed in the current study was based on a wide
variety of activities, including both indoor and outdoor activities. However, it can be speculated
that regardless of the type of activity, the ankle-worn accelerometer may only produce a
minimal, but significant improvement in the variance of EE.
Rawson et al. estimated EE during resistance exercise using accelerometry in 30 men
and women (21). Participants wore accelerometers (ActiGraph GT1M) on the ankle, hip, and
wrist, and a portable metabolic measurement system (Cosmed K4b2). Significant correlations
were found for both the ankle (r = 0.50, P < 0.01) and waist (r = 0.77, P < 0.001) accelerometer
counts with only a trend for an association between wrist accelerometer counts (r = 0.31, P =
0.10). A forward stepwise regression analysis determined that fat-free mass explained the
greatest percentage of the variance in EE (r2 = 0.85). The addition of sex and hip accelerometer
counts improved the relationship (r2 = 0.90). Including counts from both the ankle and wrist, did
not significantly improve the prediction of EE during resistance exercise. These results are in
slight contrast to the current study which found that the ankle- and wrist-worn accelerometers
each explained an additional 3% of the variance in EE.
In the past, regression equations have been developed for walking and jogging (12,14).
These regression equations are very accurate for these specific activities; however, they tend to
underestimate the energy cost of most other activities (2,12,14). In the current study, a novel
approach was taken by including type of activity within the regression equation. Type of activity
explained an additional 5% of the variance in EE. This is significant because the multiple
regression analysis developed in the current study was based on five different activity categories
making the current multiple regression equation applicable to a broad range of activities.

83
The results of this study are in contrast to those found by Hendelman et al. who
developed a regression equation from hip-worn accelerometer counts while 25 subjects
completed different lifestyle type activities (14). Activity counts from the Tritrac accelerometer
were highly correlated with EE (r = 0.89) during walking. However, the correlation was reduced
when all activities were combined (r = 0.62). The multiple regression equation developed in the
current study was highly correlated with EE (r = 0.92) during all activities. It can be speculated
that the addition of HR as well as the ankle- and wrist-worn accelerometers were able to
capture movements of the different ADL that the hip-worn accelerometer could not capture
alone. Thus, the multiple regression equation from the current study provides a substantial
improvement in the estimations of EE for lifestyle type activities compared to the regression
equation developed by Hendelman et al (14).
The most recent regression equation developed to estimate EE during several lifestyle
type activities is a two-regression model produced by Crouter et al. (9). Similar to the current
study, forty-eight subjects were asked to perform various activities (i.e. doing computer work,
walking up/down stairs at a self-selected speed, cycling at a self-selected speed, washing
windows, washing dishes, etc.) chosen to represent sedentary, light, moderate, and vigorous
intensity activities. For each activity, the coefficient of variation (CV) for the counts per 10
seconds was calculated to determine whether the activity was walking/running or some other
type of activity. A walk/run regression was used if the CV was ≤10; whereas, a lifestyle/leisure
regression was used if the CV was >10 (9). The correlation between the two-regression model
and measured METs was r = 0.96 (P < 0.001). This result is similar to that found in the current
study which showed that the correlation between the multiple regression equation and EE was r
= 0.92 (P < 0.05). Crouter et al. suggested that no single linear model is able to predict EE for

84
lifestyle type activities; however, with the combination of multiple methods the current study
was able to accurately predict EE using a single linear regression.
Despite the multiple regression equation having a strong correlation with EE (r = 0.92, P
< 0.05), sedentary and light intensity activities were significantly different compared to actual
EE. The multiple regression equation overestimated sedentary activities by 0.22 ± 0.08
kcals/min (P < 0.004) and underestimated housework activities by 0.20 ± 0.08 kcals/min (P <
0.01). One could argue that even though these differences are statistically significant, their
clinical significance may be negligible. However, sedentary and light intensity activities are
generally performed for long periods of time which could significantly affect total EE. For
instance, the multiple regression equation predicted that one subject burned 1.25 kcals/min
while watching TV. If the individual watched TV for eight hours the total energy expended
would be 600 kcals. However, the Cosmed K4b2 showed that this same individual expended
0.94 kcals/min while watching TV, which for eight hours would equate to 451 kcals. This results
in a substantial difference of approximately 150 kcals between the Cosmed K4b2 and the
multiple regression equation. If the individual watched TV for eight hours every day, that would
result in an overestimation of 1,050 kcals/week when using the multiple regression equation.
These results are similar to several other research studies who have found significant
differences during sedentary and light intensity activities between actual EE and predicted EE
when either HR or the hip-worn accelerometer were used independently (4,7,8,10,14).
When Hendelman et al. used regression equations developed from walking data only,
the metabolic costs for the lifestyle type activities were underestimated by 30-60% (14).
Hendelman et al. concluded that the relationship between counts versus METs was dependent
on the type of activity performed, which may be due to the inability of hip-worn accelerometers

85
to detect changes in energy costs from upper-body movement, load carriage, or changes in
surface or terrain (14). The regression equation developed from the current study
overestimated EE by 18% for sedentary activities, underestimated EE by 6% for housework
activities, and did not under- or overestimate EE for yard work, locomotion, or recreational
activities. The results from the current study demonstrate a considerable improvement in
predicted EE during lifestyle type activities when a lifestyle regression equation is utilized.
As previously mentioned, Crouter et al. developed a two-regression model based on the
hip-worn accelerometer (9). When compared to actual EE and our multiple regression equation,
the Crouter1 equation significantly overestimated EE for locomotive activities by 28-29% (Figure
4). This is in contrast to the results found by Crouter et al. (9) which produced no significant
differences between the two-regression model and measured METs for all activities. The reason
for this difference may be due to the different types of locomotive activities performed in the
two studies. In the current study, more locomotive activities were performed (i.e. walking
up/down stairs, carrying boxes, pushing a cart) compared to the study conducted by Crouter et
al. (9). It should be noted that using each subject’s resting VO2 (Crouter2) to predict EE from the
two-regression model by Crouter et al. did not improve the estimations of EE for any of the
activity categories as compared to actual EE (Cosmed K4b2) and the multiple regression equation
developed in the current study.
Using the OwnCalS program, the Polar RS800CX HR Monitor was able to estimate EE for
each activity. Interestingly, EE estimated from HR in the current study was significantly different
compared to that of the Cosmed K4b2 and the multiple regression equation developed in the
current study. HR overestimated EE for recreational activities; whereas, HR underestimated EE
for sedentary, housework, and locomotion activities. As previously mentioned, type of activity
86
and fitness level of each subject could have played a pertinent role in the accuracy of estimating
EE via HR. Fitness level was not accounted for in the current study when predicting EE from HR
and as previously mentioned, Strath et al. demonstrated a significant improvement in the
correlation between HR and VO2 when age and fitness level were taken into account (r = 0.87)
(25). Studies have shown that EE predicted from HR during sedentary and light intensity
activities can be significantly different compared to measured EE (4,8,10).
In regards to the type of activity being performed, more accurate estimates of EE via HR
have been found when both arm and leg regression equations are used. Strath et al. conducted
two studies that utilized a ratio between arm and leg activity counts to reflect predicted EE
(23,24). If the ratio between arm and leg counts was >25 the activity was considered an upper-
body activity and the arm regression equation was used to predict EE. If the ratio was <25 the
activity was considered a lower body activity and the leg regression equation was used to
predict EE. In both studies conducted by Strath et al. the relationship was highly correlated (r =
0.81, SEE = 0.55 METs) (23,24). Strath et al. concluded that using both an arm and leg regression
equation significantly improves the prediction of EE compared to using only a leg regression
equation (23,24). Unfortunately, developing individual HR-VO2 regression equations for both
upper- and lower-body activities can be limiting and very time consuming preventing the use of
this technique within the general population. The current study did not utilize individual HR-VO2
arm and leg regression equations to estimate EE via HR; however, the data from Strath et al.
suggests the estimates of EE could have been greatly improved if this method was applied
(23,24).
In summary, the multiple regression equation developed in the current study is
significantly correlated with EE (r = 0.92; P < 0.05). HR explained the majority of the variance in

87
EE accounting for 59.3%. The hip-worn accelerometer explained an additional 14.1% of the
variance in EE. Type of activity, the ankle-, and wrist-worn accelerometers all provided minimal,
but significant improvements in the relationship with EE (5%, 3%, and 3%, respectively). When
comparing the multiple regression equation to the Cosmed K4b2, there were significant
differences for sedentary and housework activities when compared to actual EE (Cosmed K4b2).
The multiple regression equation developed in the current study provides researchers with an
accurate methodology to estimate EE in free-living situations and to better determine the dose-
response relationship between PA and health.

88
Table 1. Descriptive Characteristics of Study Participants by Gender.
Data presented are mean ± SD. *Significantly different (P < 0.05) between men and women.
Table 2. Measured VO2 (ml/kg/min) for Sedentary Activities.
Activity Mean VO2 (±SD) Mean kcals/min. (±SD)
Computer 3.2 (0.6) 1.08 (0.28) Reading 3.2 (0.4) 1.18 (0.33) Watching TV 2.9 (0.5) 1.12 (0.34) Playing Cards 3.8 (0.6)* 1.39 (0.26)*
Data presented are mean ± SD. *Statistically different (P < 0.05) compared to Watching TV, Reading, and Computer. Table 3. Measured VO2 (ml/kg/min) for Housework Activities.
Activity Mean (±SD) Mean kcals/min. (±SD)
Laundry 6.5 (0.9) 2.42 (0.79) Light Cleaning 8.1 (1.6) 2.72 (0.80) Sweeping 9.3 (1.3) 3.51 (0.83) Washing Windows 10.9 (1.9)* 4.07 (1.06)*
Data presented are mean ± SD. *Statistically different (P < 0.05) compared to Sweeping, Light Cleaning, Laundry.
Men (n = 14) Women (n = 26)
Age (yrs.) 39 ± 13 40 ± 11 Height (m) 1.83 ± 0.1* 1.66 ± 0.1* Weight (kg) 91.8 ± 10.5* 64.4 ± 11.1* BMI (kg/m2) 27.5 ± 3.5* 23.4 ± 3.5* Resting HR (bpm) 67 ± 12 65 ± 12 Resting VO2 (ml/kg/min) 3.0 ± 0.3 3.1 ± 0.4 Resting EE (kcals) 1879 ± 203* 1343 ± 202*

89
Table 4. Measured VO2 (ml/kg/min) for Yard Work Activities.
Activity Mean (±SD) Mean kcals/min. (±SD)
General Gardening 8.2 (2.3) 3.18 (1.08) Pulling Weeds 9.8 (1.6) 3.58 (1.19) Watering Plants 7.7 (1.4) 2.53 (1.01) Raking 10.0 (2.5)* 3.73 (0.61)*
Data presented are mean ± SD. *Statistically different (P < 0.05) compared to General Gardening and Watering Plants. Table 5. Measured VO2 (ml/kg/min) for Locomotion Activities.
Activity Mean (±SD) Mean kcals/min. (±SD)
Pushing a Cart 11.9 (1.8) 4.47 (1.32) Walking-Normal Pace 11.1 (1.8) 4.28 (1.91) Up/Down Stairs 15.1 (2.8)* 5.79 (1.35)* Carrying Boxes 11.8 (2.2) 4.01 (1.17)
Data presented are mean ± SD. *Statistically different (P < 0.05) compared to Pushing a Cart, Walking-Normal Pace, and Carrying Boxes. Table 6. Measured VO2 (ml/kg/min) for Recreational Activities.
Activity Mean (±SD) Mean kcals/min. (±SD)
Basketball 20.5 (6.8)* 8.01 (2.98)* Soccer 12.7 (4.5) 4.81 (1.93) Dancing 12.2 (3.9) 4.16 (1.33) Stationary Cycling 12.5 (3.5) 4.96 (2.05)
Data presented are mean ± SD. *Statistically different (P < 0.05) compared to Soccer, Dancing, and Stationary Cycling.

90
Figure 1. Comparison of Measured Energy Expenditure (Mean ± SD) during Sedentary Activities to a 3-accelerometer + HR Method and to Previously Developed Methods.
*Significantly different from the Cosmed K4b2 (P < 0.05). †Significantly different from the Multiple Regression Equation (P < 0.05).
0
0.2
0.4
0.6
0.8
1
1.2
1.4
1.6
1.8
Cosmed K4b2 MultipleRegression
Heart Rate Crouter 1 Crouter 2
Ene
rgy
Exp
en
dit
ure
(kca
ls/m
in)
Sedentary Activities
*
* †
†
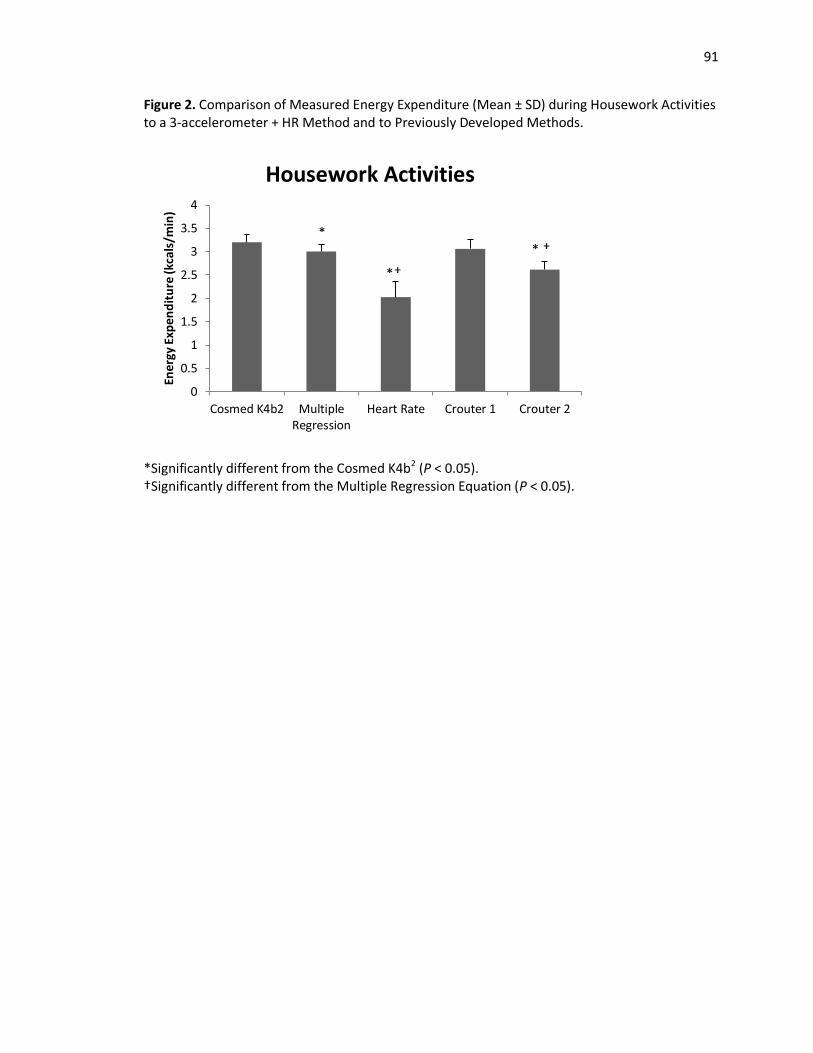
91
Figure 2. Comparison of Measured Energy Expenditure (Mean ± SD) during Housework Activities to a 3-accelerometer + HR Method and to Previously Developed Methods.
*Significantly different from the Cosmed K4b2 (P < 0.05). †Significantly different from the Multiple Regression Equation (P < 0.05).
0
0.5
1
1.5
2
2.5
3
3.5
4
Cosmed K4b2 MultipleRegression
Heart Rate Crouter 1 Crouter 2
Ene
rgy
Exp
en
dit
ure
(kca
ls/m
in)
Housework Activities
* *
* †
†

92
Figure 3. Comparison of Measured Energy Expenditure (Mean ± SD) during Yard Work Activities to a 3-accelerometer + HR Method and to Previously Developed Methods.
*Significantly different from the Cosmed K4b2 (P < 0.05). †Significantly different from the Multiple Regression Equation (P < 0.05).
0
0.5
1
1.5
2
2.5
3
3.5
4
Cosmed K4b2 MultipleRegression
Heart Rate Crouter 1 Crouter 2
Ene
rgy
Exp
en
dit
ure
(kca
ls/m
in)
Yard Work Activities
† *

93
Figure 4. Comparison of Measured Energy Expenditure (Mean ± SD) during Locomotion Activities to a 3-accelerometer + HR Method and to Previously Developed Methods.
*Significantly different from the Cosmed K4b2 (P < 0.05). †Significantly different from the Multiple Regression Equation (P < 0.05)
0
1
2
3
4
5
6
7
8
Cosmed K4b2 MultipleRegression
Heart Rate Crouter 1 Crouter 2
Ene
rgy
Exp
en
dit
ure
(kca
ls/m
in)
Locomotion Activities
*
†
†
†
*
*

94
Figure 5. Comparison of Measured Energy Expenditure (Mean ± SD) during Recreational Activities to a 3-accelerometer + HR Method and to Previously Developed Methods.
*Significantly different from the Cosmed K4b2 (P < 0.05). †Significantly different from the Multiple Regression Equation (P < 0.05).
0
1
2
3
4
5
6
7
Cosmed K4b2 MultipleRegression
Heart Rate Crouter 1 Crouter 2
Ene
rgy
Exp
en
dit
ure
(kca
ls/m
in)
Recreational Activities
* †
† *

95
REFERENCES
1. U.S. Department of Health and Human Services. 2008 Physical Activity Guidelines for Americans. 2008. http://www.health.gov/PAGuidelines.
2. Bassett DR, Jr., Ainsworth BE, Swartz AM, Strath SJ, O'Brien WL, and King GA. Validity of four motion sensors in measuring moderate intensity physical activity. Med Sci Sports Exerc. 2000;32(9 Suppl):S471-80.
3. Bouten CV, Koekkoek KT, Verduin M, Kodde R, and Janssen JD. A triaxial accelerometer and portable data processing unit for the assessment of daily physical activity. IEEE Trans Biomed Eng. 1997;44(3):136-47.
4. Bradfield RB. A technique for determination of usual daily energy expenditure in the field. Am J Clin Nutr. 1971;24(9):1148-54.
5. Brage S, Wedderkopp N, Franks PW, Andersen LB, and Froberg K. Reexamination of validity and reliability of the CSA monitor in walking and running. Med Sci Sports Exerc. 2003;35(8):1447-54.
6. Bruce RA, Blackmon JR, Jones JW, and Strait G. Exercising Testing in Adult Normal Subjects and Cardiac Patients. Pediatrics. 1963;32:SUPPL 742-56.
7. Campbell KL, Crocker PR, and McKenzie DC. Field evaluation of energy expenditure in women using Tritrac accelerometers. Med Sci Sports Exerc. 2002;34(10):1667-74.
8. Christensen CC, Frey HM, Foenstelien E, Aadland E, and Refsum HE. A critical evaluation of energy expenditure estimates based on individual O2 consumption/heart rate curves and average daily heart rate. Am J Clin Nutr. 1983;37(3):468-72.
9. Crouter SE, Clowers KG, and Bassett DR, Jr. A novel method for using accelerometer data to predict energy expenditure. J Appl Physiol. 2006;100(4):1324-31.
10. Dauncey MJ, and James WP. Assessment of the heart-rate method for determining energy expenditure in man, using a whole-body calorimeter. Br J Nutr. 1979;42(1):1-13.
11. Eston RG, Rowlands AV, and Ingledew DK. Validity of heart rate, pedometry, and accelerometry for predicting the energy cost of children's activities. J Appl Physiol. 1998;84(1):362-71.
12. Freedson PS, Melanson E, and Sirard J. Calibration of the Computer Science and Applications, Inc. accelerometer. Med Sci Sports Exerc. 1998;30(5):777-81.
13. Freedson PS, and Miller K. Objective monitoring of physical activity using motion sensors and heart rate. Res Q Exerc Sport. 2000;71(2 Suppl):S21-9.
14. Hendelman D, Miller K, Baggett C, Debold E, and Freedson P. Validity of accelerometry for the assessment of moderate intensity physical activity in the field. Med Sci Sports Exerc. 2000;32(9 Suppl):S442-9.
15. Hilloskorpi H, Fogelholm M, Laukkanen R, Pasanen M, Oja P, Manttari A, and Natri A. Factors affecting the relation between heart rate and energy expenditure during exercise. Int J Sports Med. 1999;20(7):438-43.
16. Kaminsky LA. ACSM's Health-Related Physical Fitness Assessment Manual. 3rd ed. Philadelphia: Wolters-Kluwer; 2010.
17. Leenders NY, Nelson TE, and Sherman WM. Ability of different physical activity monitors to detect movement during treadmill walking. Int J Sports Med. 2003;24(1):43-50.
18. Li R, Deurenberg P, and Hautvast JG. A critical evaluation of heart rate monitoring to assess energy expenditure in individuals. Am J Clin Nutr. 1993;58(5):602-7.

96
19. Melanson EL, Jr., and Freedson PS. Validity of the Computer Science and Applications, Inc. (CSA) activity monitor. Med Sci Sports Exerc. 1995;27(6):934-40.
20. Nieman DC. Exercise testing and prescription: A health-related approach. Mountain View: Mayfield Publishing; 1999.
21. Rawson ES, and Walsh TM. Estimation of resistance exercise energy expenditure using accelerometry. Med Sci Sports Exerc. 2010;42(3):622-8.
22. Richardson M, Ainsworth B, Jacobs D, and Leon A. Validity of the Godin Physical Activity Questionnaire in assessing leisure time physical activity. Med Sci Sports Exerc. 1996;28:S32.
23. Strath SJ, Bassett DR, Jr., Swartz AM, and Thompson DL. Simultaneous heart rate-motion sensor technique to estimate energy expenditure. Med Sci Sports Exerc. 2001;33(12):2118-23.
24. Strath SJ, Bassett DR, Jr., Thompson DL, and Swartz AM. Validity of the simultaneous heart rate-motion sensor technique for measuring energy expenditure. Med Sci Sports Exerc. 2002;34(5):888-94.
25. Strath SJ, Swartz AM, Bassett DR, Jr., O'Brien WL, King GA, and Ainsworth BE. Evaluation of heart rate as a method for assessing moderate intensity physical activity. Med Sci Sports Exerc. 2000;32(9 Suppl):S465-70.
26. Swartz AM, Strath SJ, Bassett DR, Jr., O'Brien WL, King GA, and Ainsworth BE. Estimation of energy expenditure using CSA accelerometers at hip and wrist sites. Med Sci Sports Exerc. 2000;32(9 Suppl):S450-6.
27. Thompson WR, Gordon NF, Pescatello LS (Eds.) (2010). ACSM’s guidelines for exercise testing and prescription. Philadelphia: Lippincott Williams & Wilkins.
28. Washburn RA, Montoye MJ. Reliability of the heart rate response to submaximal upper and lower body exercise. Res Q Exerc Sport. 1985;56:166-9.
29. Welk G. Physical Activity Assessments for Health-Related Research. Champaign: Human Kinetics Publishers Inc. ; 2002.
30. Yngve A, Nilsson A, Sjostrom M, and Ekelund U. Effect of monitor placement and of activity setting on the MTI accelerometer output. Med Sci Sports Exerc. 2003;35(2):320-6.

Chapter V
Summary and Conclusions Recommendations for Future Research
Summary
The current study analyzed the method of using multiple accelerometers and a HR
monitor to estimate EE while subjects completed different lifestyle type activities. Specifically,
each subject wore three ActiGraph GT3X+ Accelerometers, one Polar RS800CX HR Monitor, and
the Cosmed K4b2 portable metabolic measurement system. One accelerometer was worn on
each subject’s dominant ankle, hip, and wrist. The Cosmed K4b2 was used as the criterion
method for the measurement of EE during all activities. Activities were divided into five
different categories: sedentary, housework, yard work, locomotion, and recreational activities.
Each subject was randomly assigned to perform two activities from each of the five categories
for a total of ten activities. Each activity was performed for seven minutes and done
continuously. Subjects were instructed to complete all of the activities at their own pace and
the activities were completed in order of increasing intensity with no rest period in between
each activity.
All devices were synchronized to an external time piece to ensure that data from the
Cosmed K4b2, data from the ActiGraph GT3X+ accelerometers, and data from the Polar RS800CX
HR Monitor were collected simultaneously. An annotation sheet was used to record the start
and stop time of each activity. HR (bpm), accelerometer counts/minute, and VO2 (ml/kg/min)

98
for minutes 4-7 of each activity were averaged and used for data analysis purposes. A forward
stepwise regression model was employed in order to evaluate the relationship between
measured EE, HR, type of activity, and ankle-, hip-, and wrist-worn accelerometer activity
counts.
HR demonstrated the strongest relationship explaining 59.3% of the variance in EE (r2 =
0.59) (P < 0.05). The hip worn-accelerometer significantly improved the correlation between EE
(r2 = 0.73) (P < 0.05) and explained an additional 14.1% of the variance in EE. The current study
accounted for type of activity performed and found there to be a significant improvement in the
correlation with EE (r2 = 0.78) (P < 0.05). Type of activity explained an additional 5% of the
variance in EE to that already explained by HR and the hip-worn accelerometer. Both the wrist-
and ankle-worn accelerometers explained an additional 3% of the variance in EE. The
relationship can be predicted from a regression line of y = -1.372 +0.065x + 0.001x2 + 0.491x3 +
0.00042x4 + 0.00042x5, where x = HR; x2 = hip-worn accelerometer; x3 = type of activity; x4 =
wrist-worn accelerometer; and x5 = ankle-worn accelerometer.
The multiple regression equation significantly overestimated sedentary activities (-0.22
± 0.08 kcals/min) and significantly underestimated housework activities (0.20 ± 0.08 kcals/min)
(P < 0.05) as compared to actual EE (Cosmed K4b2). The differences were statistically significant,
but their clinical significance may be negligible. However, sedentary and light intensity activities
are generally performed for long periods of time which could significantly affect total EE. For
instance, the multiple regression equation predicted that one subject expended 1.25 kcals/min
while watching TV. If the individual watched TV for eight hours the total energy expended
would be 600 kcals. The Cosmed K4b2 showed that this same individual expended 0.94
kcals/min while watching TV, which for eight hours would equate to 451 kcals. This results in a

99
substantial difference of approximately 150 kcals between the Cosmed K4b2 and the multiple
regression equation. No significant differences were found between actual (Cosmed K4b2) and
predicted EE from the multiple regression equation for yard work, locomotion, and recreational
activities.
When compared to the recently developed two-regression model by Crouter et al., the
multiple regression equation significantly underestimated locomotion activities (1.87 kcals/min)
(P < 0.05) (31). It should be noted that the Crouter et al. equation was also significantly
different compared to actual EE for locomotion activities (1.80 kcals/min) (P < 0.05) suggesting
the multiple regression equation is more accurate for those specific activities (i.e. walking at a
normal pace, walking up/down stairs, carrying boxes of different weight, and pushing a cart).
No significant differences were found for all other activity categories between the multiple
regression equation and Crouter1.
Crouter2 significantly underestimated EE (kcals/min) for housework (0.58), yard work
(0.41), and recreational activities (0.70); whereas, it significantly overestimated EE (kcals/min)
for locomotion (0.89) activities as compared to the Cosmed K4b2 (P < 0.05). As compared to the
multiple regression equation, Crouter2 significantly underestimated EE (kcals/min) for sedentary
(0.28), housework (0.38), yard work (0.35), and recreational activities (0.76); whereas, it
significantly overestimated EE (kcals/min) for locomotion (0.96) activities (P < 0.05).
The Polar RS800CX HR Monitor OwnCalS program significantly underestimated EE
(kcals/min) for sedentary (1.26 and 1.03), housework (0.98 and 1.18), and locomotion (0.56 and
0.63) activities, and significantly overestimated EE for recreational (0.78 and 0.84) (P < 0.05)
activities as compared to the multiple regression equation and the Cosmed K4b2, respectively.

100
No significant differences were found for EE (kcals/min) predicted via HR for yard work activities
as compared to the Cosmed K4b2 (0.43) and the multiple regression equation (0.36).
Conclusion
The multiple method approach analyzed in the current study is a valid method for
estimating EE during free-living situations. The combination of HR, type of activity and activity
counts from the hip-, ankle-, and wrist-worn accelerometers was strongly correlated (r = 0.92; P
< 0.05) to measured EE. There was a small, but significant increase in the explained variance of
EE for both the wrist-worn (3%) and ankle-worn accelerometers (3%). This low variance in EE
may be due to the fact that some activities produced little or no activity counts for the wrist-
worn (i.e. stationary cycling, walking, playing soccer) and ankle-worn accelerometers (i.e.
watching TV, surfing the internet, doing laundry, etc.). It may be beneficial for researchers to
determine a threshold for activity counts in order to determine whether or not the ankle-
and/or wrist-worn accelerometers should be used to estimate EE. While this small increase may
be statistically significant, the clinical and practical significance may not outweigh the cost of the
accelerometers, the increased time and effort it will take to download and manage the data,
and the burden of requiring subjects to wear two more accelerometers. However, the current
study has developed a regression equation that can be utilized in research studies to help better
define the amount of PA needed in order to gain certain health benefits.
Future Research
There is a well-known association that exists between PA and health, and the
measurement of PA behavior is central in defining the dose-response relationship. Additionally,
101
PA assessments are beneficial in providing individual feedback as well as assessing the
effectiveness of programs and interventions. Valid and reliable methods are an integral part in
understanding the dose-response relationship. Currently, both subjective and objective
methods are being used to estimate EE in free-living situations. Unfortunately, limitations exist
with each method and with different combinations of these methods that are driving
researchers to consider other avenues of estimating EE in free-living situations. Future research
recommendations include:
Refining Regression Models: Linear regression models have been proven to be
accurate for specific activities such as walking and running, but researchers suggest
these linear regression models are not applicable for lifestyle type activities. Thus,
two-regression and non-linear regression models have been developed to overcome
the limitation of linear regression models; however, more research is needed to
determine the accuracy of these models with several different lifestyle type activities
and for longer periods of time in free-living situations. It also may be beneficial for
researchers to determine specific cut-points to help differentiate between upper- and
lower-boy activities, as well as to help differentiate between sedentary, light-,
moderate-, and vigorous-intensity activities.
PA Pattern Recognition: Accelerometers are unable to detect two activities that
produce similar total acceleration counts, but expend different amounts of energy
(21). Knowing the different types of activities individuals are performing and the
energy costs for specific activities will enable researchers to better define individual
PA patterns. Probabilistic artificial neural networks and quadratic discriminant
analyses have been used to classify PA patterns as well as duration and intensity for

102
specific activities (48,108,109); however, further research is warranted for free-living
situations.
Global Positioning Systems (GPS): These systems would be beneficial because they
can provide information in regards to the context of PA. The GPS unit is able to
provide accurate assessments of speed during walking and fast running as well as
other biomechanical parameters (84,97). The drawbacks to the GPS unit would be the
inability to capture stationary exercise and exercises performed indoors. Studies
should analyze the use of the GPS unit to estimate total PA in free-living situations as
well as utilizing this method in combination with other methods such as
accelerometry and/or HR monitoring.
Wearable Digital Cameras: In combination with accelerometry and/or HR monitoring,
a wearable digital camera could provide a better understanding of an individual’s
physical activities throughout the day (42). Studies should analyze the effectiveness
of these digital cameras in determining PA patterns and the ability of these digital
cameras to increase the accuracy of estimating EE in free-living situations.

103
REFERENCES
1. U.S. Department of Health and Human Services. 2008 Physical Activity Guidelines for Americans. 2008. http://www.health.gov/PAGuidelines.
2. American College of Sports Medicine. Position Stand: The recommended quantity and quality of exercise for developing and maintaining cardiorespiratory and muscular fitness in healthy adults. Med Sci Sports Exerc. 1990;22(2):265-74.
3. Andrews RB. Net heart rate as a substitute for respiratory calorimetry. Am J Clin Nutr. 1971;24(9):1139-47.
4. Armstrong N, and Bray S. Physical activity patterns defined by continuous heart rate monitoring. Arch Dis Child. 1991;66(2):245-7.
5. Atallah LLB, King R, Yang GZ. Sensor placement for activity detection using wearable accelerometers. International Conference on Body Sensor Networks. 2010, pp. 24-9.
6. Baranowski T. Validity and reliability of self-report measures of physical activity: An information-processing perspective. Research Quarterly for Exercise and Sport. 1988;59:314-27.
7. Bassett DR, Jr., Ainsworth BE, Swartz AM, Strath SJ, O'Brien WL, and King GA. Validity of four motion sensors in measuring moderate intensity physical activity. Med Sci Sports Exerc. 2000;32(9 Suppl):S471-80.
8. Batty D. Walking and mortality in older men. N Engl J Med. 1998;338(22):1622-3. 9. Berggren G, and Christensen E. Heart rate as a means of measuring metabolic rate in
man. Arbeitsphysiologie. 1950;14:255-60. 10. Blair SN, Franks AL, Shelton D, Livengood JR, Hull FL, and Breedlove B. Physical Activity
and Health: A Report of the Surgeon General. Atlanta, GA; 1996. 11. Blair SN, Kohl HW, Gordon NF, and Paffenbarger RS, Jr. How much physical activity is
good for health? Annu Rev Public Health. 1992;13:99-126. 12. Booyens J, and Hervey GR. The Pulse Rate as a Means of Measuring Metabolic Rate in
Man. Canadian Journal of Biochemistry and Physiology. 1960;38(1):1301-9. 13. Bouten CV, Koekkoek KT, Verduin M, Kodde R, and Janssen JD. A triaxial accelerometer
and portable data processing unit for the assessment of daily physical activity. IEEE Trans Biomed Eng. 1997;44(3):136-47.
14. Bouten CV, Sauren AA, Verduin M, and Janssen JD. Effects of placement and orientation of body-fixed accelerometers on the assessment of energy expenditure during walking. Med Biol Eng Comput. 1997;35(1):50-6.
15. Bouten CV, Westerterp KR, Verduin M, and Janssen JD. Assessment of energy expenditure for physical activity using a triaxial accelerometer. Med Sci Sports Exerc. 1994;26(12):1516-23.
16. Bradfield RB. A technique for determination of usual daily energy expenditure in the field. Am J Clin Nutr. 1971;24(9):1148-54.
17. Brage S, Wedderkopp N, Franks PW, Andersen LB, and Froberg K. Reexamination of validity and reliability of the CSA monitor in walking and running. Med Sci Sports Exerc. 2003;35(8):1447-54.
18. Brandon LJ, Ross DA, Sanford JA, and Lloyd A. Predicting oxygen uptake in older adults using lower-limb accelerometer measures. J Rehabil Res Dev. 2004;41(6A):861-70.
19. Brubaker P, Kaminsky LA, and Whaley M. Coronary Artery Disease: Essentials of prevention and rehabilitation programs. Champaign: Human Kinetics; 2002, 364 p.

104
20. Bruce RA, Blackmon JR, Jones JW, and Strait G. Exercising Testing in Adult Normal Subjects and Cardiac Patients. Pediatrics. 1963;32:SUPPL 742-56.
21. Butte NF, Ekelund U, and Westerterp KR. Assessing physical activity using wearable monitors: measures of physical activity. Med Sci Sports Exerc. 2012;44(1 Suppl 1):S5-12.
22. Campbell KL, Crocker PR, and McKenzie DC. Field evaluation of energy expenditure in women using Tritrac accelerometers. Med Sci Sports Exerc. 2002;34(10):1667-74.
23. Caspersen CJ, K.E. Powell, and G.M. Christenson. Physical Activity, exercise, and physical fitness. Definitions and distinctions for health related research. Public Health Rep. 1985;110:126-31.
24. Cavagna G, Saibene F, and Margaria R. A three-directional accelerometer for analyzing body movements. J Appl Physiol. 1961;16:191.
25. Centers for Disease Control and Prevention. Trends in leisure-time physical inactivity by age, sex, and race/ethnicity--United States, 1994-2004. MMWR Morb Mortal Wkly Rep. 2005;54(39):991-4.
26. Cessay SM PA, and Day KC. The use of heart rate monitoring in the estimation of energy expenditure: a validation study using indirect whole-body calorimetry. Br J Nutr. 1989;61:175-86.
27. Chen KY, Acra SA, Majchrzak K, Donahue CL, Baker L, Clemens L, Sun M, and Buchowski MS. Predicting energy expenditure of physical activity using hip- and wrist-worn accelerometers. Diabetes Technol Ther. 2003;5(6):1023-33.
28. Chen KY, and Sun M. Improving energy expenditure estimation by using a triaxial accelerometer. J Appl Physiol. 1997;83(6):2112-22.
29. Christensen CC, Frey HM, Foenstelien E, Aadland E, and Refsum HE. A critical evaluation of energy expenditure estimates based on individual O2 consumption/heart rate curves and average daily heart rate. Am J Clin Nutr. 1983;37(3):468-72.
30. Crouter SE, Albright C, and Bassett DR, Jr. Accuracy of polar S410 heart rate monitor to estimate energy cost of exercise. Med Sci Sports Exerc. 2004;36(8):1433-9.
31. Crouter SE, Clowers KG, and Bassett DR, Jr. A novel method for using accelerometer data to predict energy expenditure. J Appl Physiol. 2006;100(4):1324-31.
32. Dauncey MJ, and James WP. Assessment of the heart-rate method for determining energy expenditure in man, using a whole-body calorimeter. Br J Nutr. 1979;42(1):1-13.
33. Ratamess, N. (2006). ACSM'S Resource Manual for Guidelines for Exercise Testing and Prescription. Ch. 17 Body Composition Status and Assessment. Swank A (Ed.). Philadelphia: Lippincott, Williams and Wilkins.
34. Eisenmann JC, Brisko N, Shadrick D, and Welsh S. Comparative analysis of the Cosmed Quark b2 and K4b2 gas analysis systems during submaximal exercise. J Sports Med Phys Fitness. 2003;43(2):150-5.
35. Eisenmann JC, Strath SJ, Shadrick D, Rigsby P, Hirsch N, and Jacobson L. Validity of uniaxial accelerometry during activities of daily living in children. Eur J Appl Physiol. 2004;91(2-3):259-63.
36. Eston RG, Rowlands AV, and Ingledew DK. Validity of heart rate, pedometry, and accelerometry for predicting the energy cost of children's activities. J Appl Physiol. 1998;84(1):362-71.
37. Freedson PS, Melanson E, and Sirard J. Calibration of the Computer Science and Applications, Inc. accelerometer. Med Sci Sports Exerc. 1998;30(5):777-81.

105
38. Goldsmith R, Miller DS, Mumford P, and Stock MJ. The use of long-term measurements of heart rate to assess energy expenditure. Physiology. 1967;189.
39. Hahn RA, Teutsch SM, Rothenberg RB, and Marks JS. Excess deaths from nine chronic diseases in the United States, 1986. JAMA. 1990;264(20):2654-9.
40. Haskell WL, Lee IM, Pate RR, Powell KE, Blair SN, Franklin BA, Macera CA, Heath GW, Thompson PD, and Bauman A. Physical activity and public health: updated recommendation for adults from the American College of Sports Medicine and the American Heart Association. Med Sci Sports Exerc. 2007;39(8):1423-34.
41. Haymes EM, and Byrnes WC. Walking and running energy expenditure estimated by Caltrac and indirect calorimetry. Med Sci Sports Exerc. 1993;25(12):1365-9.
42. Healey J. Future possibilities in electronic monitoring of physical activity. Res Q Exerc Sport. 2000;71(2 Suppl):S137-45.
43. Hendelman D, Miller K, Baggett C, Debold E, and Freedson P. Validity of accelerometry for the assessment of moderate intensity physical activity in the field. Med Sci Sports Exerc. 2000;32(9 Suppl):S442-9.
44. Hilloskorpi H, Fogelholm M, Laukkanen R, Pasanen M, Oja P, Manttari A, and Natri A. Factors affecting the relation between heart rate and energy expenditure during exercise. Int J Sports Med. 1999;20(7):438-43.
45. John D, Tyo B, and Bassett DR. Comparison of four ActiGraph accelerometers during walking and running. Med Sci Sports Exerc. 2010;42(2):368-74.
46. Kaminsky LA. ACSM's Health-Related Physical Fitness Assessment Manual. 3rd ed. Philadelphia: Wolters-Kluwer; 2010.
47. Kesaniemi YK, Danforth E, Jr., Jensen MD, Kopelman PG, Lefebvre P, and Reeder BA. Dose-response issues concerning physical activity and health: an evidence-based symposium. Med Sci Sports Exerc. 2001;33(6 Suppl):S351-8.
48. Kiani K, Snijders CJ, and Gelsema ES. Computerized analysis of daily life motor activity for ambulatory monitoring. Technol Health Care. 1997;5(4):307-18.
49. Kohl HW, Fulton JE, and Caspersen C. The assessment of physical activity among children and adolescents: A review and synthesis. Preventive Medicine 2000;31:S54-S76.
50. Kriska A, and Caspersen C. A collection of physical activity questionnaires for health-related research. Med Sci Sports Exerc. 1997;29:S1-S205.
51. Kriska AM, Sandler RB, Cauley JA, LaPorte RE, Hom DL, and Pambianco G. The assessment of historical physical activity and its relation to adult bone parameters. Am J Epidemiol. 1988;127(5):1053-63.
52. LaPorte RE, Montoye HJ, and Caspersen CJ. Assessment of physical activity in epidemiologic research: problems and prospects. Public Health Rep. 1985;100(2):131-46.
53. Lee IM, Rexrode KM, Cook NR, Manson JE, and Buring JE. Physical activity and coronary heart disease in women: is "no pain, no gain" passe? JAMA. 2001;285(11):1447-54.
54. Leenders NY, Nelson TE, and Sherman WM. Ability of different physical activity monitors to detect movement during treadmill walking. Int J Sports Med. 2003;24(1):43-50.
55. Leenders NY, Sherman WM, and Nagaraja HN. Energy expenditure estimated by accelerometry and doubly labeled water: do they agree? Med Sci Sports Exerc. 2006;38(12):2165-72.
56. Leger L, and Thivierge M. Heart rate monitors: validity, stability, and functionality. Physician Sportsmed. 1998;16:143-51.

106
57. Li R, Deurenberg P, and Hautvast JG. A critical evaluation of heart rate monitoring to assess energy expenditure in individuals. Am J Clin Nutr. 1993;58(5):602-7.
58. Lifson N, Gordon GB, and et al. The fate of utilized molecular oxygen and the source of the oxygen of respiratory carbon dioxide, studied with the aid of heavy oxygen. J Biol Chem. 1949;180(2):803-11.
59. Lifson N, Gordon GB, and Mc CR. Measurement of total carbon dioxide production by means of D2O18. J Appl Physiol. 1955;7(6):704-10.
60. Livingstone MB, Coward WA, Prentice AM, Davies PS, Strain JJ, McKenna PG, Mahoney CA, White JA, Stewart CM, and Kerr MJ. Daily energy expenditure in free-living children: comparison of heart-rate monitoring with the doubly labeled water (2H2(18)O) method. Am J Clin Nutr. 1992;56(2):343-52.
61. Livingstone MB, Prentice AM, Coward WA, Ceesay SM, Strain JJ, McKenna PG, Nevin GB, Barker ME, and Hickey RJ. Simultaneous measurement of free-living energy expenditure by the doubly labeled water method and heart-rate monitoring. Am J Clin Nutr. 1990;52(1):59-65.
62. Macera CA, Ham SA, Jones DA, Kimsey CD, Ainsworth BE, and Neff LJ. Limitations on the use of a single screening question to measure sedentary behavior. Am J Public Health. 2001;91(12):2010-2.
63. McGinnis JM, and Foege WH. Actual causes of death in the United States. JAMA. 1993;270(18):2207-12.
64. McLaughlin JE, King GA, Howley ET, Bassett DR, Jr., and Ainsworth BE. Validation of the COSMED K4 b2 portable metabolic system. Int J Sports Med. 2001;22(4):280-4.
65. Melanson EL, Jr., and Freedson PS. Validity of the Computer Science and Applications, Inc. (CSA) activity monitor. Med Sci Sports Exerc. 1995;27(6):934-40.
66. Montoye HJ. Estimation of habitual physical activity by questionnaire and interview. Am J Clin Nutr. 1971;24(9):1113-8.
67. Montoye HJ, Kemper H, Saris WH, and Washburn RA. Measuring physical activity and energy expenditure. Champaign: Human Kinetics; 1996, 191 p.
68. Montoye HJ, Washburn R, Servais S, Ertl A, Webster JG, and Nagle FJ. Estimation of energy expenditure by a portable accelerometer. Med Sci Sports Exerc. 1983;15(5):403-7.
69. Murgatroyd PR, Shetty PS, and Prentice AM. Techniques for the measurement of human energy expenditure: a practical guide. Int J Obes Relat Metab Disord. 1993;17(10):549-68.
70. Nieman DC. Exercise testing and prescription: A health-related approach. Mountain View: Mayfield Publishing; 1999.
71. Paffenbarger RS, Jr., Hyde RT, Wing AL, and Hsieh CC. Physical activity, all-cause mortality, and longevity of college alumni. N Engl J Med. 1986;314(10):605-13.
72. Paffenbarger RS, Jr., Hyde RT, Wing AL, Lee IM, Jung DL, and Kampert JB. The association of changes in physical-activity level and other lifestyle characteristics with mortality among men. N Engl J Med. 1993;328(8):538-45.
73. Parr BB, Strath SJ, Bassett D, and Howley ET. Validation of the Cosmed K4b2 Portable Metabolic Measurement System. Med Sci Sports. 2001;33(5):S300.
74. Pate RR, Pratt M, Blair SN, Haskell WL, Macera CA, Bouchard C, Buchner D, Ettinger W, Heath GW, King AC, and et al. Physical activity and public health. A recommendation
107
from the Centers for Disease Control and Prevention and the American College of Sports Medicine. JAMA. 1995;273(5):402-7.
75. Peel C, and Utsey C. Oxygen consumption using the K2 telemetry system and a metabolic cart. Med Sci Sports Exerc. 1993;25(3):396-400.
76. Prevention CfDCa. "U.S. Physical Activity Statistics". 2010. 77. Richardson M, Ainsworth B, Jacobs D, and Leon A. Validity of the Godin Physical Activity
Questionnaire in assessing leisure time physical activity. Med Sci Sports Exerc. 1996;28:S32.
78. Rockhill B, Willett WC, Manson JE, Leitzmann MF, Stampfer MJ, Hunter DJ, and Colditz GA. Physical activity and mortality: a prospective study among women. Am J Public Health. 2001;91(4):578-83.
79. Sallis JF, and Saelens BE. Assessment of physical activity by self-report: status, limitations, and future directions. Res Q Exerc Sport. 2000;71(2 Suppl):S1-14.
80. Schoeller DA. Measurement of energy expenditure in free-living humans by using doubly labeled water. J Nutr. 1988;118(11):1278-89.
81. Schoeller DA, and Racette SB. A review of field techniques for the assessment of energy expenditure. J Nutr. 1990;120 Suppl 11:1492-5.
82. Schoeller DA, and Webb P. Five-day comparison of the doubly labeled water method with respiratory gas exchange. Am J Clin Nutr. 1984;40(1):153-8.
83. Schrack JA, Simonsick EM, and Ferrucci L. Comparison of the Cosmed K4b(2) portable metabolic system in measuring steady-state walking energy expenditure. PLoS One. 2010;5(2):e9292.
84. Schutz Y, and Herren R. Assessment of speed of human locomotion using a differential satellite global positioning system. Med Sci Sports Exerc. 2000;32(3):642-6.
85. Slater CH, Green LW, Vernon SW, and Keith VM. Problems in estimating the prevalence of physical activity from national surveys. Prev Med. 1987;16(1):107-18.
86. Spurr GB, Prentice AM, Murgatroyd PR, Goldberg GR, Reina JC, and Christman NT. Energy expenditure from minute-by-minute heart-rate recording: comparison with indirect calorimetry. Am J Clin Nutr. 1988;48(3):552-9.
87. Starling RD, Matthews DE, Ades PA, and Poehlman ET. Assessment of physical activity in older individuals: a doubly labeled water study. J Appl Physiol. 1999;86(6):2090-6.
88. Staten LK, Taren DL, Howell WH, Tobar M, Poehlman ET, Hill A, Reid PM, and Ritenbaugh C. Validation of the Arizona Activity Frequency Questionnaire using doubly labeled water. Med Sci Sports Exerc. 2001;33(11):1959-67.
89. Sternfeld B, Cauley J, Harlow S, Liu G, and Lee M. Assessment of physical activity with a single global question in a large, multiethnic sample of midlife women. Am J Epidemiol. 2000;152(7):678-87.
90. Stofan JR, DiPietro L, Davis D, Kohl HW, 3rd, and Blair SN. Physical activity patterns associated with cardiorespiratory fitness and reduced mortality: the Aerobics Center Longitudinal Study. Am J Public Health. 1998;88(12):1807-13.
91. Strath SJ, Bassett DR, Jr., Swartz AM, and Thompson DL. Simultaneous heart rate-motion sensor technique to estimate energy expenditure. Med Sci Sports Exerc. 2001;33(12):2118-23.
92. Strath SJ, Bassett DR, Jr., Thompson DL, and Swartz AM. Validity of the simultaneous heart rate-motion sensor technique for measuring energy expenditure. Med Sci Sports Exerc. 2002;34(5):888-94.

108
93. Strath SJ, Swartz AM, Bassett DR, Jr., O'Brien WL, King GA, and Ainsworth BE. Evaluation of heart rate as a method for assessing moderate intensity physical activity. Med Sci Sports Exerc. 2000;32(9 Suppl):S465-70.
94. Swartz AM, Strath SJ, Bassett DR, Jr., O'Brien WL, King GA, and Ainsworth BE. Estimation of energy expenditure using CSA accelerometers at hip and wrist sites. Med Sci Sports Exerc. 2000;32(9 Suppl):S450-6.
95. Tanasescu M, Leitzmann MF, Rimm EB, Willett WC, Stampfer MJ, and Hu FB. Exercise type and intensity in relation to coronary heart disease in men. JAMA. 2002;288(16):1994-2000.
96. Taylor HL, Jacobs DR, Jr., Schucker B, Knudsen J, Leon AS, and Debacker G. A questionnaire for the assessment of leisure time physical activities. J Chronic Dis. 1978;31(12):741-55.
97. Terrier P, Ladetto Q, Merminod B, and Schutz Y. High-precision satellite positioning system as a new tool to study the biomechanics of human locomotion. J Biomech. 2000;33(12):1717-22.
98. Thompson WR, Gordon NF, Pescatello LS (Eds.) (2010). ACSM’s guidelines for exercise testing and prescription. Philadelphia: Lippincott Williams & Wilkins.
99. Treiber FA, Musante L, Hartdagan S, Davis H, Levy M, and Strong WB. Validation of a heart rate monitor with children in laboratory and field settings. Med Sci Sports Exerc. 1989;21(3):338-42.
100. Vanhees L, Lefevre J, Philippaerts R, Martens M, Huygens W, Troosters T, and Beunen G. How to assess physical activity? How to assess physical fitness? Eur J Cardiovasc Prev Rehabil. 2005;12(2):102-14.
101. Wareham NJ, and Rennie KL. The assessment of physical activity in individuals and populations: why try to be more precise about how physical activity is assessed? Int J Obes Relat Metab Disord. 1998;22 Suppl 2:S30-8.
102. Washburn RA, and Montoye HJ. The assessment of physical activity by questionnaire. Am J Epidemiol. 1986;123(4):563-76.
103. Washburn RA, Montoye MJ. Reliability of the heart rate response to submaximal upper and lower body exercise. Res Q Exerc Sport. 1985;56:166-9.
104. Weintraub WS, Daniels SR, Burke LE, Franklin BA, Goff DC, Jr., Hayman LL, Lloyd-Jones D, Pandey DK, Sanchez EJ, Schram AP, and Whitsel LP. Value of primordial and primary prevention for cardiovascular disease: a policy statement from the american heart association. Circulation. 2011;124(8):967-90.
105. Welk G. Physical Activity Assessments for Health-Related Research. Champaign: Human Kinetics Publishers Inc. ; 2002.
106. Wenger NK, Froelicher ES, Smith LK, Ades PA, Berra K, Blumenthal JA, Certo CM, Dattilo AM, Davis D, DeBusk RF, and et al. Cardiac rehabilitation as secondary prevention. Agency for Health Care Policy and Research and National Heart, Lung, and Blood Institute. Clin Pract Guidel Quick Ref Guide Clin. 1995;(17):1-23.
107. Yngve A, Nilsson A, Sjostrom M, and Ekelund U. Effect of monitor placement and of activity setting on the MTI accelerometer output. Med Sci Sports Exerc. 2003;35(2):320-6.
108. Zhang K, Pi-Sunyer FX, and Boozer CN. Improving energy expenditure estimation for physical activity. Med Sci Sports Exerc. 2004;36(5):883-9.

109
109. Zhang K, Werner P, Sun M, Pi-Sunyer FX, and Boozer CN. Measurement of human daily physical activity. Obes Res. 2003;11(1):33-40.


![Demonstration Paper: Personalized Physical Activity ...€¦ · Expenditure Estimation Using a Cardiorespiratory Fitness Predicate. Pervasive Health 2013. in-press. [2] J.D. George](https://img.dokumen.tips/doc/110x75/5f6765087e4225618b28a852/demonstration-paper-personalized-physical-activity-expenditure-estimation-using.jpg)