Embed Size (px)
Citation preview

i
ASSESSMENT OF COFFEE QUALITY AND ITS
RELATED PROBLEMS IN JIMMA ZONE OF
OROMIA REGIONAL STATE
MSc THESIS
ANWAR ABASANBI ABADIGA
FEBRUARY 2010
JIMMA UNIVERSITY

ii
Assessment of Coffee Quality and Its Related Problems in
Jimma Zone of Oromia Regional State
By
Anwar Abasanbi Abadiga
A Thesis
Submitted to the School of Graduate Studies of Jimma
University, College of Agriculture and Veterinary Medicines
Department of Horticulture and Plant Sciences
In Partial Fulfillment of the Requirements for the Degree of
Masters of Science in Agriculture (Horticulture)
February 2010 Jimma University

iii
JIMMA UNIVERSITY
SCHOOL OF GRADUATE STUDIES
As thesis research advisors we hereby certify that we have read and evaluated the thesis
prepared under our direction by Anwar Abasanbi, entitled ‘Assessment of Coffee Quality
and Its Related Problems in Jimma Zone of Oromia Regional State' and recommend
that it be accepted as fulfilling the thesis requirement.
Kassahun Bante (PhD)
As members of the examining board of the final M.Sc. open defense, we certify that we
have read and evaluated the thesis prepared by Anwar Abasanbi entitled ‘Assessment of
Coffee Quality and Its Related Problems in Jimma Zone of Oromia Regional State’
and recommend that it be accepted as fulfilling the thesis requirement for the degree of
Master of Science in Agriculture (Horticulture)
Nigussie Kasa
Major Advisor Signature Date
Tesfaye Shimbir (PhD)
Co-Advisor Signature Date
Chairman Signature Date
Ali Mohammed (Ph.D.)
Internal examiner Signature Date Terefe Bekele(Ph.D.)
External examiner Signature Date
iv
DEDICATION
I dedicate this thesis to my family for nursing me with affections and love and their
dedicated partnership for success in my life
v
STATEMENT OF THE AUTHOR
I, the undersigned, declare that this thesis is my work and is not submitted to any
institution elsewhere for the award of any academic degree, diploma or certificate and all
sources of materials used for this thesis have been duly acknowledged. This thesis has
been submitted in partial fulfillment of the requirements for M.Sc. degree at Jimma
University, College of Agriculture and Veterinary Medicine and is deposited at the
University Library to be made available to borrowers under the rules of the library.
Brief quotations from this thesis are allowable without special permission provided that an
accurate acknowledgment of the source is made. Requests for permission for extended
quotation from or reproduction of this manuscript in whole or in part may be granted by
the Dean or Coordinator of the School of Graduate Studies or Head of the Department of
Horticulture when the proposed use of material is in the interest of scholarship. In all other
cases, however, permission must be obtained from the author.
Name: Anwar Abasanbi
Place: Jimma University, Jimma
Date of submission: February 2010
Signature: _____________

vi
BIOGRAPHICAL SKETCH
Anwar Abasanbi Abadiga was born at Abakoyi, Dedo woreda; Jimma zone on September
1 in 1963. He attended his Elementary, Junior Secondary, and High School education at
Dedo Elementary School, Jimma Junior Secondary and Agaro High School, respectively.
He joined the then Jimma College of Agriculture (now Jimma University, College of
Agriculture and Veterinary Medicine) in 1990 and 2002 and graduated on 1997 and 2007
with a diploma and B.Sc degree in general Agriculture and Horticulture, respectively.
He was employed on May 17, 1983 by CIP (Coffee Improvement Project) (now Oromia
Agriculture and Rural Development Bureau) to serve as an extension agent at Gomma
District of Jimma Zone. Since his employment, he served as extension agent, supervisor,
CIP officer and department head posted at different Districts and zone office of Oromia
until he joined the School of Graduate Studies of Jimma University on September 30,
2007 to pursue his studies for Master of Science in Agriculture (Horticulture).

vii
ACKNOWLEGEMENTS
First of all, I would like to thank my Allah for helping me to successfully complete this
work. Conducting of this thesis research from project proposal, field work, and to the final
write up of the thesis could have not been fruitful if it were not for a generous assistance
of individuals and institutions. I am particularly grateful to my major advisor, Dr.
Kassahun Bante, for his encouragement, willingness to supervise my research and his
valuable comments from early stage of proposing the research to the final thesis research
results write up, which helped me in the completion of the study. So I would like to extend
my deepest gratitude to him for his continuous technical support and commitment
throughout my research. I am also highly indebted to my co-advisor Dr. Tesfaye Shimbir
as without his encouragement, insight, guidance and professional expertise the completion
of this work would not have been possible.
I am also highly indebted to the staff of Jimma Agricultural Research Center particularly,
Panelists in Coffee processing and liquoring unit. Special thanks to Mrs. Abrar sualeh,
Nugusse Mekonin, Murad Abaraya, Birhanu Megeressa, Getu Bekele, Bahilu Atero,
Bahilu Woldesenbet, Alemseged Yilma, Asrat Mengesha and Mis Fantaye Mekonin, Mis
Fozia Kamal, for sharing their experience and analysis of samples in the laboratory.
Similarly, I am thankful to the Jimma Agricultural Research Center Ex-Director Mr.
Tadesse Eshetu for allowing me to use the transport service of the Center and analyze
samples at the Center. I would like to extend my sincere thanks also to the following staff
of Jimma University, College of Agriculture and Veterinary Medicine, especially to Mrs,

viii
Yetinayet Bekele, Adugna Dabala, Osman Rahameto, Dr. Deribew Belew, Dr. Waktole
Sori, Dr. Ali Mohamed, Mr. Mohammed Ahmed, and Miss. Hanna Ibrahim, for their
material and moral support that helped me in conducting the thesis research.
I express my sincere feelings and appreciation to Mrs. Yonas Kassa, Zenebe, Yehenew
Getachew and Wayessa Garedew of Jimma University for their comment and assistance
during data analysis. I would like to extend my thanks to Prof. Tessemma Astatike for
assistance rendered in the analysis of my data. I am also thankful to Mr. Adane Deressa of
Jimma Land and Environmental protection Office; Mr. Ragassa Kumssa, Process owner of
Agricultural Input Supply, monitoring and evaluation division of Jimma Zone Agricultural
and Rural Development Office and Mr. Tesfaye Kebede of Jimma Zone Statistics
Department head for their valuable comments.
My heartfelt appreciation also goes to my family members, Mis Mardya Usman especially
my wives Munira Abadura and Fatuma Mohammad for their constant moral support and
encouragement during the course of the study and specially, Mis Munira for her
responsibility in looking after me and family by avoiding my concern about caring of them
have contributed a lot to the success of my study. My children Tofik Anwar, Sadam
Anwar, Munawar Anwar and Bikila Mohammad are also appreciated for their patience
without seeking my material and moral support. I would like to acknowledge my Brother
Mr. Fuad Abasanbi and my ankles Jabal Abamecha Abdulnasir Abajihad and Desalegn
Oljira for their material support and Dr. Taye Kufa of Jimma Agricultural Research Center
for his literature materials support that helped me in the accomplishing of the study.

ix
My thanks and appreciations also go to Mrs. Tammirat Getachew, Abinet Dessalenyi,
Sarawit Hailemariyam, Indale kumssa staff of Gomma district ARDO and Mrs. Birhanu
Tesgaye, Oli Abadura, Gojam Belay, Assefa Tadasse and Mis Ihitnesh Belete, staff of
Manna Woreda ARDO for their assistance in data collection during the field survey. My
thanks and appreciations also go to Mrs Tsegaye Ummata, Mohamad Abarago, Tadessu
Yimer, Zelelem Yimer, Nasir Ibrahim and Siyum Itanna for their provision of transport
facility during the field survey. I am also thankful to Mrs. Yezid Abagaro, Gaddisa
Mosissa, Gonche Sisay and Yishak Baredo for their approval to join Jimma University.
My thanks and appreciations also go to Mr. Chombe Demalash of Gomma District
Finance and Economic Development Office and Mr Tammirat Getachew are
acknowledged for their monthly and timely provision of my salary on behalf of me.
Lastly but not least, I am also indebted to International Live Stock Research Institution
(ILIRI) (through IPMS project based at Gomma District) for funding my research work.
Thanks and appreciations go to staff of ILRI at Addis Ababa, particularly Dr. Azage,
ILIRI manager, Mis. Birqe secretary officer and to Mr. Yishak Baredo Gomma district
IPMS manager for their heart full support during my M.Sc. study. Oromia Agriculture and
Rural Development Bureau (Gomma District Agriculture and Rural Development Office)
for the opportunity offered to continue my graduate study with my salary and JARC for
providing working facility during sample analysis in the laboratory.
x
TABLE OF CONTENTS
DEDICATION .................................................................................................................... iv
STATEMENT OF THE AUTHOR ................................................................................... v
BIOGRAPHICAL SKETCH ............................................................................................ vi
ACKNOWLEGEMENTS ................................................................................................ vii
TABLE OF CONTENTS .................................................................................................... x
LIST OF TABLES ........................................................................................................... xiv
LIST OF FIGURES ........................................................................................................ xvii
LIST OF APPENDICES .............................................................................................. xviii
LIST OF ABBREVIATIONS .......................................................................................... xx
ABSTRACT ..................................................................................................................... xxii
1. INTRODUCTION ........................................................................................................... 1
2. LITERATURE REVIEW ............................................................................................... 5
2.1. Botanical Descriptions ............................................................................................... 5
2.2. Coffee Quality ............................................................................................................ 6
2.3. Factors Affecting Coffee Quality ............................................................................... 9

xi
2.3.1 Climatic and soil factors .................................................................................... 10
2.3.2. Pre-harvest and harvest factors ......................................................................... 12
2.3.3. Post-harvest factors ........................................................................................... 15
2.3.4. Genetic factors .................................................................................................. 19
2.3.5. Institutional factors ........................................................................................... 20
2.3.6. Socio-economic factors ..................................................................................... 22
2.4. Method of Assessing Coffee Quality ....................................................................... 25
2.4.1. Bean physical quality ........................................................................................ 25
2.4.2. Organoleptic quality .......................................................................................... 27
3. MATERIALS AND METHODS ................................................................................. 32
3.1. Description of the Study Area .................................................................................. 32
3.1.1. Gomma woreda ................................................................................................. 32
3.1.2. Manna woreda ................................................................................................... 33
3.2. Field Survey ............................................................................................................. 33
3.2.1. Sample size determination ................................................................................ 33
3.2.2. Variables studied in the survey ......................................................................... 34
3.2.2.1. Demographic factors .................................................................................. 35
3.2.2.2. Agronomic and physiological factors ........................................................ 36
3.2.2.3. Harvest and post-harvest factors ................................................................ 38
3.2.2.4. Institutional factors .................................................................................... 41
3.3. Laboratory Analysis ................................................................................................. 45
3.3.1. Experimental materials ..................................................................................... 45

xii
3.3.2. Sampling procedures ......................................................................................... 45
3.3.3. Data collection .................................................................................................. 51
3.3.4. Bean physical and organoleptic quality analysis .............................................. 51
3.3.4.1. Defect count ............................................................................................... 51
3.3.4.2. Roasting ..................................................................................................... 52
3.3.4.3. Grinding ..................................................................................................... 53
3.3.4.5. Cup tasting ................................................................................................. 54
3.3.4.6. Grading ....................................................................................................... 56
3.3.5. Experimental design .......................................................................................... 59
3.4. Statistical Analysis ................................................................................................... 59
3.4.1. Analysis of field survey .................................................................................... 59
3.4.2. Laboratory analysis ........................................................................................... 61
4. RESULTS AND DISCUSSION ................................................................................... 64
4.1. Field Survey ............................................................................................................. 64
4.1.1. Response of coffee farmers ............................................................................... 64
4.1.1.1. Analysis through descriptive statistics ....................................................... 64
4.1.1.2. Binary logit regression model .................................................................... 78
4.2. Laboratory Analysis ................................................................................................. 91
4.2.1. Cup and bean physical quality attributes .......................................................... 91
4.2.2. Coffee grades .................................................................................................... 99
5. SUMMARY AND CONCLUSIONS ......................................................................... 105
6. REFERENCES ............................................................................................................ 111
xiii
7. APPENDICES ............................................................................................................. 120
7.1. Tables ..................................................................................................................... 121
7.2. Figures .................................................................................................................... 128
7.3. Sample Questionnaires ........................................................................................... 139

xiv
LIST OF TABLES
Table 1. Definition of explanatory variables to explain adoption of CQPPHMP by farmers
............................................................................................................................ 43
Table 2. Definition of explanatory variables to explain adoption of CQPPHMP by traders
............................................................................................................................ 44
Table 3. List of coffee samples studied in the laboratory ................................................... 50
Table 4. Standard parameters and their respective values used for washed coffee raw
quality evaluation (CLU, 2007) ......................................................................... 57
Table 5. Standard parameters and their respective values used for washed coffee liquor
quality evaluation (CLU, 2007) ......................................................................... 57
Table 6. Standard parameters and their respective values used for unwashed coffee raw &
liquor quality evaluation (CLU, 2007) ............................................................... 58
Table 7. ANOVA for split plot design ................................................................................ 63
Table 8. Frequency, proportion and association (chi-square) of coffee quality with
demographic factors among sampled coffee farmers HHs ................................ 68
Table 9. Frequency, proportional distribution and association (chi-square) of coffee quality
with agronomic and physiological factors among sampled coffee farmers HHs
............................................................................................................................ 71
Table 10. Frequency, proportional distribution and association (chi-square) of coffee
quality with harvest and post harvest factors among sampled coffee farmers
HHs ..................................................................................................................... 74

xv
Table 11. Frequency, proportional distribution and association (chi-square) of coffee
quality with institutional factors among sampled coffee farmers HHs .............. 77
Table 12. Independent variables in the the maximum likelihood estimates of the binomial
logit model .......................................................................................................... 81
Table 13. Frequency, proportional distribution and association (chi-square) of coffee
quality with demographic factors among sampled traders HHs......................... 86
Table 14. Frequency, proportional distribution and association (chi-square) of coffee
quality with institutional factors among sampled coffee traders HHs ............... 88
Table 15. Frequency, proportional distribution and association (chi-square) of coffee
quality with technical factors among sampled coffee traders HHs .................... 90
Table 16. Mean squares for cup quality and bean physical quality characteristics ............ 92
Table 17. Mean values of processing methods (PM) for cup and bean physical quality
characteristics ..................................................................................................... 93
Table 18. Mean values of preparation type (PT) for cup and bean physical quality
characteristics ..................................................................................................... 94
Table 19. Mean values of processing method and preparation type for cup and bean
physical quality characteristics ........................................................................... 96
Table 20. Number and percentage of coffee samples classified in different classes of cup
quality grades for Gomma woreda ................................................................... 102
Table 21. Number and percentage of coffee samples classified in different classes of cup
quality grades for Manna woreda ..................................................................... 102

xvi
Table 22. Mean values of defects observed in 300 g green beans of dry processed coffee
prepared in recommended and local ways in both study areas (Gomma and
Manna woredas) ............................................................................................... 104

xvii
LIST OF FIGURES
Fig. 1. Sample coffee bean moisture testing using digital electronic rapid moisture tester
(HOH, Express, HE 50, Germany). .................................................................... 48
Fig. 2. Samples coffee bean grading using different screen sizes. ...................................... 49
Fig. 3. Sample coffee bean preparation for different laboratory tests, using digital bean
balance. ............................................................................................................... 52
Fig. 4. Sample coffee roasting using six cylinder roasters (PROBAT WELKE, VON
GIMBORN GMBHAN CO. KJ. Germany). ...................................................... 53
Fig. 5. Sample roasted coffee bean grinding using electrical grinder (MAHLKONIG,
Germany). ........................................................................................................... 55
Fig. 6. Professional coffee tasters of the JARC, cupping for quality evaluation. ............... 56
Fig 7. Interaction between processing method and preparation type for odor. ................... 97
Fig. 8. Interaction between processing method and preparation type for acidity. .............. 98
Fig. 9. Interaction between processing method and preparation type for flavor. ................ 99

xviii
LIST OF APPENDICES
Appendix I. Dry processed coffee green bean raw evaluation parameters for defect count
rating system as the procedures of CLU (2007) ............................................... 121
Appendix II. ANOVA for cup quality and green bean physical characteristics of 32 C.
arabica samples ................................................................................................ 122
Appendix III. Cup quality and green bean physical characteristics evaluation of 32 C.
arabica samples for grading ............................................................................. 123
Appendix IV. Variables included in multivariate binary logit regression analysis for
farmers .............................................................................................................. 124
Appendix V. Map of survey areas (Gomma & Manna Woredas), Jimma Zone, Ethiopia.
.......................................................................................................................... 128
Appendix VI. Partial view of recommended method of dry coffee processing. ............... 129
Appendix VII. Partial view of recommended method of wet coffee processing. ............. 130
Appendix VIII. Dry and wet processed green coffee beans samples. ............................... 131
Appendix IX. Manual counting of coffee defect in the laboratory. .................................. 132
Appendix X. Long-term rainfall and temperature data for Gomma woreda. .................... 133
Appendix XI. Long-term rainfall and temperature data for Manna woreda. .................... 134
Appendix XII. Standard parameters and their respective values used for unwashed coffee
raw quality evaluation and grading as per ECX (2009) ................................... 135

xix
Appendix XIII. Raw defect type & evaluation system of SCAA and Ethiopia unwashed
green coffee bean (ECX, 2009) ........................................................................ 136
Appendix XIV. Standard parameters and their respective values used for washed coffee
raw quality evaluation and grading as per ECX (2009) ................................... 137
Appendix XV. Raw defect type & evaluation system of SCAA and Ethiopia washed green
coffee bean (ECX, 2009) .................................................................................. 138

xx
LIST OF ABBREVIATIONS
ARDO Agricultural and Rural Development Office
CDMIP Coffee Development and Marketing Improvement Plan in
CFC Common Fund for Commodities CIP Coffee Improvement Project CLU Coffee Liquoring Unit
CQPPHMP Coffee Quality Pre and Post Harvest Management Practices
CSA Central Statistics Authority DA Development Agent ECEE Ethiopia Coffee Export Enterprise
ECMC Ethiopia Coffee Marketing Corporation
ECPSE Ethiopia Coffee purchase and Sale Enterprise
ECX Ethiopia Commodity Exchange
EEA Ethiopian Economic Association FAO Food and Agriculture Organization of the United Nations
FAQ Fairly Average Quality
FTC Farmers Training Center
HH Households
HPLC High Performance Liquid Chromatography IAR Institute of Agricultural Research ICO International Coffee Organization
ILRI International live stock Research institution IPM Integrated Pest Management IPMS Improving Productivity and Marketing Success
ISO International Standard Organization ITC International Trade Centre
JARC Jimma Agricultural Research Center
JUCAVM Jimma University, College of Agriculture and Veterinary

xxi
JZARDO Jimma Zone Agricultural and Rural Development Office
NCBE National Coffee Board of Ethiopia
OTA Ochratoxin A
PAS Peasant Associations
QSAE Quality and Standards Authority of Ethiopia RWH Rain Water Harvesting
SCAA Specialty Coffee Association of America
SAS Statistical Analysis System
SMS Subject Matter Specialist
SPSS Statistical Package for Social Science
WFP World Food Program

xxii
Assessment of Coffee Quality and Its Related Problems in Jimma Zone of Oromia Regional State
Research Advisors: Kassahun Bantte (Ph.D.) JUCAVM P. O. Box 307, Jimma
Tesfaye Shimbir (Ph.D.) JARC. Jimma
ABSTRACT
Arabica coffee (Coffee arabica L.) is an economically important crop, which is contributing the highest of all export revenues in Ethiopia. It is also the major cash crop of Jimma Zone and produced in eight woredas. Despite the favorable climatic conditions, variety of coffee types and long history of its production in this Zone, quality of coffee is poor due to traditional poor pre and post harvest practices. Efforts were made so far in areas of fermentation time, drying depth, time of storage and extension support, training for coffee expertise and coffee farmers on recommended technologies. But there is lack of profound assessment works to identify the specific coffee quality problems in Jimma zone and lack of adequate information on the effects of post harvest processing and handling techniques on coffee quality. Therefore, this study was conducted with the objectives of assessing the impact of pre and post harvest processing practices on the quality of both wet and dry processed coffee, identifying the inherent quality of coffee in the zone and investigating socio-economic technical and institutional factors related to coffee quality problems in the zone. For field survey, 164 household farmers were randomly selected following sample size determination procedures of probability proportional to size technique and 30 coffee traders were purposefully selected from the two woredas and interviewed in the study area from November to December 2008. The data collected from the field survey were analyzed by employing the statistical procedures of SPSS version 14.0. A binary logit model was employed for the factors affecting adoption of coffee quality pre and post harvest management practices (CQPPHMP). A total of 14 explanatory variables were used for the binary logit model out of which 6 variables were significant to affect the adoption of CQPPHMP practices by the coffee farmers whereas none of the explanatory variables for sampled traders were found to be significant in the chi-square analysis except checking quality for price. In binary logistic regression analysis of field survey obtained from coffee farmers those factors that affect coffee quality were disease prevalence in coffee field, compost application, mixing up of differently harvested coffee during selling, availability of storage, drying materials used for drying and age of coffee in the store. The findings of this study indicate that any effort in promoting and adopting of CQPPHMP practice should recognize the socio-economic, institutional, and technical factors for better adoption of CQPPHMP practices. On the other hand, a total of 32 coffee bean samples (16 from each woreda) were prepared for the laboratory analysis (organoleptic and bean physical quality characteristics) at Jimma Agricultural Research Center (JARC). The laboratory experiment was arranged in split plot design, considering the processing method as main plot and the preparation type as sub-plot in RCBD with three replications and organoleptic quality attributes were assessed by trained coffee panelists. The laboratory data analysis was computed by using general linear model (GLM) procedures of SAS version 9.2. It was observed that wet processing method resulted in high mean values for good cup quality attributes, like acidity, body and flavor, and for bean physical quality attributes, like odor as compared to dry processing method. For most of sensorial quality attributes, recommended preparation procedure outsmarted local preparation (farmers/traders) methods. For physical quality attributes, preparation methods were varied only for color and odor. Nonetheless, of the processing methods investigated in this study, it was observed that the recommended way of preparing coffee promotes the typical quality profile to the final cup quality to meet consumers’ choice that finally creates interest for the profile and competence in the international coffee market. From this result, it can be concluded that wet processing method is the best approach to obtain fine and typical flavor in the cup to meet the interest and preference of consumers. Extension intervention could be the best approach to create awareness among coffee producers towards maintaining typical coffee quality profile of their garden through processing that finally adds value to their produces.

1
1. INTRODUCTION
Coffee (Coffea arabica L.) is a non-alcoholic stimulant beverage crop that belongs to the
family Rubiaceae and genus Coffea. It is the only self–fertile with less than 10 per cent
cross-pollination, tetraploids species (2n=4x=44) while others are diploids (2n=22) and
self-incompatible (Berthaud and Charrier, 1988; Anthony et al., 2001). Among 100 Coffea
species in the genus Coffea; C. arabica is the only species naturally occurring in Ethiopia
(Anthony et al., 2001; Yigzaw, 2005).
Ethiopian coffee is an important source of coffee genetic resources for the world coffee
industry. As a matter of fact, Ethiopia is the only center of origin and diversity of arabica
coffee (C. arabica) (Anthony et al., 2001). It is cultivated in most parts of the tropics,
accounting for 80 per cent of the world coffee market, and about 70 per cent of the
production (Tadesse et al., 2002). It is also an important source of income and
employment in developing countries of Latin America, Africa and Asia (Anthony et al.,
2001).
Coffee is the major source of foreign currency for Ethiopia and contributes more than 35%
of the total export earnings (FAO/WFP, 2008). Thus, it is a cornerstone in the export
economy of the country and it supports directly or indirectly the livelihood of some 15
million people (EEA, 2001). Coffee the defining feature of the national culture and
identity, with 44% of the production consumed domestically (Mayne et al., 2002). In
Ethiopia, coffee is produced in four production systems, namely: forest, semi-forest,
garden and plantation coffee in the Western, Southern, and Southwestern parts of the
2
country (CFC, 2004). Coffee grows under diverse environmental conditions ranging from
550 m to 2600 m above sea level, with annual rainfall from 1000-2000 mm, temperature
(minimum and maximum from 8-150C, and 24-310C, respectively), requires deep, well
drained, loamy and slightly acidic soils (Paulos and Tesfaye, 2000). The estimated area of
land covered by coffee is about 600,000 hectares, whereas the estimated annual national
production of clean coffee is about 350,000 tons (Alemayehu et al., 2008).
Jimma Zone is one of coffee growing zones in the Oromia Regional State, which has a
total area of 1,093,268 hectares of land (JZARDO, 2008). Currently, the total area of land
covered by coffee in the zone is about 105,140 hectares, which includes small-scale
farmers’ holdings as well as state and private owned plantations. Out of the 40–55
thousand tons of coffee annually produced in the Zone (JZARDO, 2008), about 28-35
thousand tons is sent to the central market, while the remaining is locally consumed
(Alemayehu et al., 2008). Now a day, Jimma Zone covers a total of 21% of the export
share of the country and 43% of the export share of the Oromia Region (JZARDO, 2008).
Coffee is the major cash crop of the Zone, which is produced in the eight woredas namely,
Gomma, Manna, Gera, Limmu Kossa, Limmu Seka, Seka Chokorsa, Kersa and Dedo,
which serves as a major means of cash income for the livelihood of coffee farming
families (JZARDO, 2008). According to the report from the same source, 30-45 % of the
people in Jimma Zone are directly or indirectly benefited from the coffee industry.
Despite the favorable climatic conditions, variety of local coffee types for quality
improvement and long history of its production in Jimma Zone, coffee quality is declining

3
from time to time due to several improper pre-and post-harvest management practices.
This is still practiced by the majority of coffee farmers/traders, from which the larger
portion of the produce is obtained. These quality problems are mainly associated with poor
agronomic practices like uncontrolled shade level, lack of stumping, pruning and weeding;
poor harvesting practices, such as stripping and collecting dropped fruits from the ground;
improper post harvest processing and handling practices such as drying on bare ground,
improper storage and transportation (Desse, 2008). In addition to this, natural impediment
such as prolonged rainy weather, particularly during harvesting and drying season can also
contribute to reduced coffee quality (Desse, 2008).
For instance, Desse (2008) reported that out of Jimma coffee sent to the coffee quality
inspection center laboratory from 2003 to 2007, more than 60% of dry processed coffee
classified into grade 3 as compared to 80% of wet processed into grade 2 and grade 3. The
author indicated the problem of post harvest processing and handling in the area resulted
in poor quality as the main contributing factor. The poor quality and the subsequent drop
in earnings had severely affected coffee farmers in woredas like Gomma, Limmu Kossa,
and Manna, where coffee provides a larger portion of their annual income. On the
contrary, Jimma Zone is known for some quality coffee types such as Limmu Enaria
(Limmu) coffee, which is known for its best quality in the world market.
Though research on coffee has been conducted at the national level for more than four
decades by JARC, its target was to develop CBD (Coffee Berry Disease) resistant, high
yielding and wide adapting varieties for major coffee growing areas of the country (Getu,
2009). Therefore, so far there was no extensive coffee quality research conducted in the

4
country except on fermentation, drying depth and time of storage (Solomon and Behailu,
2006). However, there was a piece of work done by Getu (2009) and Yigzaw (2005) on
organoleptic quality traits variation with respect to genotype by environment interaction.
Furthermore, Brownbridge and Eyassu (1968) characterized coffees from Limmu Kossa,
Gera and Agaro areas based on the bean shape and other quality assessments using raw,
roasted and liquor characteristics.
Despite the favorable climatic conditions, variety of local coffee types for quality
improvement and long history of its productions, still there are gaps such as lack of
profound assessment works to identify the specific coffee quality problems in Jimma zone
and lack of adequate information on the effects of post harvest processing and handling
techniques on coffee quality. Hence, this study was designed to address the above
mentioned problems thereby forward ways and means that will help growers and
processors to produce better quality coffee in the zone.
Therefore, the objectives of this study were:
1. To assess the impact of pre and post harvest processing practices on the quality of both
wet and dry processed coffee
2. To assess the inherent quality of coffee in the zone
3. To identify socio-economic, technical and institutional factors related to coffee quality
problems in the zone.

5
2. LITERATURE REVIEW
2.1. Botanical Descriptions
Arabica coffee is an evergreen shrub of variable size. The tree grows up to 8-10 m high
and its branches are long, flexible and thin. Branches are semi-erect when young and
spreading or pendulous when old (Coste, 1992). The architecture of the coffee tree is
characteristic of a tree growing in tropical forests: a vertical (orthotropic) stem, with
horizontal (plagiotriopic) branches arising in pairs opposite to each other. The growth is
by a typical form of monopodial branching where the branches (primaries) remain
subsidiary to the main stem, which continues to grow indefinitely by extension of the
apical buds (Wrigley, 1988). The coffee plant takes approximately 3 years to develop from
seed germination to first flowering and fruit production. A well- managed coffee tree can
be productive for up to 80 years or more, but the economic life span of a coffee plantation
is rarely more than 30 years (Wintgens, 2004).
The root consists of a stout central root, often multiple, tapering more or less abruptly,
rarely extending as a recognizable until more than 30 to 40 cm from the soil surface. The
leaves born in opposite pairs on the sides of the branches are between 10-15 cm long, 4-6
cm wide, and oval-shaped and acuminate. It has white, Jasmine-scented flowers grouped
together in the axils of the paired leaves, with two to three cymes making up whorls of 8-
15 flowers. Its fruit is sub-globular, ovoid, oblong or squat-shaped. Fruits are orange-red

6
to red on ripening, 16-18 mm long and 10-15 mm wide. Fruits have a colored exocarp
(skin), a fleshy yellow-white mesocarp (pulp) and two beans joined together along their
flat sides. The calyx may or may not be pronounced as well as persistent until fruit
maturity, depending on different varieties.
The size and shape of the beans differ depending upon the variety, environmental
conditions and management practices. On average, beans are 10 mm long, 6-7 mm wide,
3-4 mm thick and weigh between 0.15 and 0.20 g. Bean color can be yellowish-grey to
slate-grey, bluish or grey-green, depending upon the variety, method of preparation and
storage condition (Coste, 1992). Bean shape may be sub-globular, ovoid, oblong, linear-
oblong, either rounded at both ends or pointed at one end and rounded at the other (FAO,
1968).
2.2. Coffee Quality
In recent years, different coffee producing countries have tremendously expanded their
production and export volume (Behailu et al., 2008). According to the current context of
overproduction and low prices of the coffee market, improvement and valorization of
coffee quality could provide the coffee chain with a new impetus (Leroy et al., 2006).
Production and supply of coffee with excellent quality seems more crucial than ever
before for coffee exporting countries. Consequently, some countries consider assessment
of coffee quality as important as disease resistance and productivity in their coffee variety
development program (ITC, 2004). In view of the present situation, making effort to

7
overcome challenges and threats only through expansion of production does not seem
visible for countries like Ethiopia. Thus, it has been repeatedly mentioned at various forum
that providing good quality coffee is the only way out and viable option to get into the
world market and to remain competitive (Behailu et al., 2008).
Coffee is the most important crop in the national economy of Ethiopia and the leading
export commodity. Ethiopia is well known not only for being the home of arabica coffee,
but also for it is very fine quality coffee acclaimed for its aroma and flavor characteristics.
The coffee types that are distinguished for such unique characteristics include Sidamo,
Yirga Chefe, Harerge, Gimbi and Limu types (Workafes and Kassu, 2000). However,
coffee produced in some parts of Ethiopia, especially from Harrar, and Yirgachefe, is
always sold at a premium price both at domestic and international coffee markets because
of its distinctive fine quality (Chifra et al., 1998; ITC, 2002) and appropriate processing
approach.
On the other hand, sun dried Jimma coffee is one of the lowest priced coffees in the
international market due to inappropriate processing as opposed to Limmu washed grade 2
which, fetches better premium price though it is produced in the same agro-ecological
zone (Desse, 2008). Limmu coffee is characterized as having excellent balanced flavor
with good acidity and medium body. It shares the winy characteristics of Harar (Getu,
2009). Furthermore, Desse (2008) reported that although the inherent flavor of Jimma
coffee is pleasantly winy, some of the common cup defects are earthy, musty with
secondary cup defects of taints in the liquor, which are mainly due to post harvest
management problems.
8
According to the International Organization for Standardization (ISO) (2000), Quality is
described as "the ability of a set of inherent characteristics of a product, system or process
to fulfill requirement of customers and other interested parties". These inherent
characteristics can also be called "attributes". For coffee, the definition of quality and the
attributes considered have probably evolved through the centuries. But nowadays, this
definition varies along the production-to-consumer chain (Leroy et al., 2006). i.e.; at the
farmer level, coffee quality is a combination of production level, price and easiness of
culture; at the exporter or importer level, coffee quality is linked to bean size, lack of
defects and regularity of provision, tonnage available, physical characteristics and price; at
the roaster level, coffee quality depends on moisture content, stability of the
characteristics, origin, price, biochemical compounds and organoleptic quality (Leroy et
al., 2006). It should be noted that each consumer market or country may define its own
organoleptic qualities; at the consumer level: coffee quality deals with price, taste and
flavor, effects on health and alertness, geographical origin, environmental and sociological
aspects (organic coffee, fair trade, etc (ISO, 2000).
More specifically, ISO (2004a) defined a standard for green coffee quality (ISO 9116
standard) as, it requires several pieces of information, like the geographical and botanic
origins of the coffee, the harvest year, the moisture content, the total defects, the
proportion of insect-damaged beans and the bean size. These ISO standards define
methods of measurements for several of these qualities such as, defects, moisture content,
bean size, some chemical compounds and preparation of samples to perform cup tasting.
According to the definition of quality and standards authority of Ethiopia (QSAE) (2000) a
quality is conformance with requirements or fitness for use in which the parties involved
9
in the industry (customer, processor, supplier, etc) should agree on the requirements and
the requirements should be clear to all stake holders involved in the process. On the other
hand, Coffee Quality control and auction Center was established with a key objective of
maintaining coffee quality control, which in turn facilitates the coffee marketing system to
be standard based, and for the betterment /proper functioning of the long coffee supply
chain of Ethiopia (Endale, 2008).
Coffee has only one value to give the consumer pleasure and satisfaction through flavor,
aroma and desirable physiological and psychological effects (Yigzaw, 2005). Therefore
coffee quality, especially liquor or cup quality, determines both the relative price and
usefulness of a given quantity of coffee (Agwanda et al., 2003). Cup quality, often
referred to as drinking quality or liquor quality, is an important attribute of coffee
(Muschler, 2001; Agwanda et al., 2003) and acts as yardstick for price determination
(Agwanda et al., 2003).
2.3. Factors Affecting Coffee Quality
Cup quality is a complex characteristic which depends on a series of factors such as the
species or variety (genetic factors), environmental conditions (ecological factors),
agronomical practices (cultivation factors), processing systems (post harvest factors),
storage conditions, industrial processing, preparation of the beverage and taste of the
consumer (Moreno et al., 1995). Coffee quality is of critical importance to the coffee

10
industry. Quality coffee is a product that has desirable characteristics such as clean raw
and roasted appearance, attractive aroma and good cup taste (Behailu et al., 2008).
However, in Ethiopia the quality of coffee produced by farmers has been deteriorating
from time to time. Moreover, factors that determine coffee quality are genotypes, climatic
conditions, and soil characteristics of the area, agronomic practices, harvesting methods
and timing, post harvest processing techniques, grading, packing, storage conditions and
transporting, all contribute either exaltation or deterioration of coffee (Behailu et al.,
2008). Similarly, Damanu (2008), reported coffee quality as a combination of the
botanical variety, topographical conditions, and climatic conditions and the care taken
during growing, harvesting, storage, exports preparation and transport. According to the
author botanical variety and topographical conditions are constant and therefore dominate
the inherent characters of a coffee where as other factors except climatic conditions can be
influenced by human being and are a key factor in determination of the end quality of a
green coffee. Furthermore, inadequate systems of harvesting, processing, storage and
transportation are responsible for the wide spread failure to maintain the inherent quality
of coffee produced in Ethiopia (Alemayehu et al., 2008).
2.3.1 Climatic and soil factors
The environment has also a strong influence on coffee quality (Decasy et al., 2003).
Altitude, daily temperature fluctuations, amount and distribution of rainfall and the
physical and chemical characteristics of the soil are very important factors. Climate,

11
altitude, and shade play an important role through temperature, availability of light and
water during the ripening period (Decasy et al., 2003). Rainfall and sunshine distributions
have a strong influence on flowering, bean expansion, and ripening (Harding et al., 1987).
The slowed-down ripening process of coffee berries at higher elevations (lower air
temperatures), or under shading, allows more time for complete bean filling (Vaast et al.,
2006), yielding beans that are denser and far more intense in flavor than their neighbors
grown at lower altitudes (or under full sunlight). The slower maturation process should
therefore play a central role in determining high cup quality, possibly by guaranteeing the
full manifestation of all biochemical steps required for the development of the beverage
quality (Silva et al., 2005). For instance, chlorogenic acids and fat content have been
found to increase with elevation in C. arabica (Bertrand et al., 2006). Besides the
beneficial effect of longer duration of the bean-filling period, a larger leaf area-to-fruit
ratio (better bean-filling capacity) may also be linked to superior cup quality (Vaast et al.,
2006).
The role of soil types has been well studied and it is generally admitted that the most
acidic coffee quality is grown on rich volcanic soils (Harding et al., 1987). The perceived
acidity of coffee brews has always been recognized as an important attribute of coffee
quality. Acidity is typically a highly valued quality especially in Central American and
some East African coffees (Yigzaw, 2005). Sourness, however, is an extreme of acidity
and can be considered as defect. Acidity has been correlated with coffees grown at very
high altitudes and in mineral rich volcanic soils. On top of this Yigzaw (2005) reported
that if other factors are kept constant, better quality coffee can be found at higher altitudes,

12
while low land coffee were found to be somewhat bland, with considerable body.
Moreover, coffee from high altitude areas was more acidic, with better aroma and flavor.
Woelore (1993) reported that for Ethiopian conditions an underwater fermentation
technique and the time for fermentation for different agro-ecologies are recommended.
According to the author mucilage degradation washed at the first, second, third, or after
the third day from pulping in the altitudinal range 1200 m and below, 1200-15000 m,
1500-1800 m and above 1800 m, respectively, for varying fermentation practices. Woelore
(1995) reported that factors such as total rainfall, relative humidity, maximum-minimum
temperatures with effect on water vapor content of the air and storage duration, greatly
influence storability and quality of stored parchment coffee. Periods of prolonged drought
may also result in lower quality beans (Wintgens, 2004). Most of the coffee tasters agree
now that there is very little or no difference in flavor at all between the Arabica pure
breeds cultivated under similar agro-climatic conditions (Wintgens, 2004).
2.3.2. Pre-harvest and harvest factors
Yigzaw (2005) reported that in South America, coffee grown with heavy application of
nitrogen fertilizer had poorer, lighter and thinner quality than that from unfertilized fields.
An excess of nitrogen increase the caffeine content, resulting in a more bitter taste of the
brew. The caffeine and chlorgenic acid contents of the beans are not affected by the levels
of phosphorus, calcium, potassium and magnesium in the soil (Wintgens, 2004). A lack of
zinc will lead to the production of small light grey-colored beans, which will produce poor

13
liquor (Wintgens, 2004). On the other hand, magnesium deficiency had an adverse effect
on cup quality (Mitchell, 1988). High concentration of calcium (>0.11%) and potassium
(>1.75%) in the beans is associated with a bitter and “hard” taste (Wintgens, 2004). Taye
(1998) reported the use of decomposed coffee husk at a rate of 10 ton ha -1 (4 kg tree -1 on
dry weight basis) was found to be superior in terms of yield performance of coffee trees. A
significant improvement in growth and yield of mature coffees was reported in response to
coffee pulp and husk compost application (Chane, 1999). On the other hand, there is no
correlation between the phosphorus content and the physical and organoleptic quality of
the bean (Wintgens, 2004) .On the contrary, repeated application of elephant grass or
livestock manure resulted in an increased percentage of undesirable brown-colored bean
and, thus, poor roasting characteristics. This effect was associated with a magnesium
deficiency induced by the high potassium content of elephant grass as well as high
concentration of potassium and calcium in manure (Wintgens, 2004). Good growth
conditions (weed control, appropriate planting density and pruning) usually have a
positive effect on bean size and flavor (Wintgens, 2004). The relationship between crop
management and total coffee quality, however, has not yet been investigated in detail.
Pests and diseases attacks can affect the cherries directly or cause them to deteriorate by
debilitating the plants, which will then produce immature or damaged fruits. Disease and
insect attack (such as leaf miner and mites) may also result in lower quality beans
(Wintgens, 2004). For instance, as reported by Wintgens (2004) the coffee berry borer
Hypothenemus hampii feeds and reproduces inside the coffee beans and causes their
quality to deteriorate. The antestia sting bug as a vector of micro-organisms damages the
bean and causes a bitter flavor. Similarly, the fly Ceratitis capitata feeds on the mucilage

14
and the cherry becomes infected with micro-organisms; the secondary bacterial infection
causes a distinct potato flavor. OTA (Ochratoxin A) is a form of mycotoxin, produced as a
metabolic product of Aspergillus ochraceus, A. carbonarius and strains of A. niger
reported to exist on coffee dried on bare ground (Eshetu and Girma, 2008).
Carvalho (1988) reported that shade trees did not improve cup quality. On the contrary,
Muschler (2001) indicated that shade improved the appearance of green and roasted coffee
beans as well as the acidity and body of the brew, especially for those produced in sub-
optimal (low altitude) coffee production zones, by promoting slower and balanced filling
and uniform ripening of berries. Furthermore, Yemane-Berhan (1998) observed that shade
increased sugar concentration, which is an important factor for creating the aroma of
coffee.
Apart from agronomic practices, cup quality is influenced by the age of the tree.
Accordingly, Yigzaw (2005) reported that samples from young trees are likely to be mild
and thin, but fine in flavor. Samples from old trees produce strong taste and a harsh
characteristic brew. Medium aged trees, 15 to 20 years old, bear beans with good flavor as
well as acidity and body (Yigzaw, 2005).
According to the results of studies by (Bertrand et al., 2006; Vaast et al., 2006), tree
physiology, plant age, and period of picking all interact to produce the final characteristics
of the product. Indeed it was found that tree age, location of the fruits within the tree, and
fruits-to-leaves ratio had a strong influence on the chemical content of green beans.
Maturation also has a strong influence on coffee quality. The main factor affecting natural

15
coffee quality is harvesting method. It is widely agreed that traditional hand-picking and
husbandry labor, as opposed to mechanical harvest, produce the best quality green coffee
by decreasing the percentage of defects in coffee batches. Bertrand et al. (2006) observed
that yellow or green cherries picked at the end of the picking season contain beans with a
higher maturity level than red cherries of C. canephora picked at the start of the picking
season. This can be seen in bean size, chemical contents, and cup quality. On the other
hand, for C. arabica in Costa Rica, early picking of red cherries gives the best coffee
(Bertrand et al., 2006).
On the other hand, Endale et al. (2008) pointed out that low caffeine content were found in
bean harvested at immature stage (unripe) and in over-ripe coffee beans with conventional
analysis using high performance liquid chromatography (HPLC). According to their
findings this could be associated with slow metabolism of caffeine and its biodegradation
at immature and over-ripe stages of fruit development, respectively.
2.3.3. Post-harvest factors
Depending on the post harvest processes, significant effects on coffee quality can be
observed (Barel and Jacquet, 1994). Processing is a very important activity in coffee
production and plays a crucial role in quality determination (Mburu, 1999). Coffee is
either processed by the wet or dry methods, which vary in complexity and expected
quality of the coffee (Wrigley, 1988). Both sun-drying as well as wet-processing methods

16
are operated in Ethiopia, which accounts for 70% and 30% of coffee produced in the
country, respectively (Jacquet et al., 2008).
According to Clifford (1985) wet processed arabica is aromatic with fine acidity and some
astringency, while dry processed arabica is less aromatic and less acidic but with greater
body. The perceived acidity of washed coffees is also significantly higher than the acidity
found in naturally (dry) processed coffees. This is likely due to an increase in the body of
naturally processed coffees relative to wet processed coffees since body masks the coffee's
acidity (Yigzaw, 2005). Selmar et al. (2001) reported that sensory evaluation of the roast
coffees revealed that the dry and washed coffees could be distinguished with high
significance (11 of 11 panel members). As their report the differences in quality of
differently processed coffees of similar original material is due to the process taking place
in the beans during processing.
In the majority of the study area coffee is prepared using a dry processing (natural sun-
dried) system, which is the first method by which the fresh cherries are harvested and sun-
dried as a whole. Generally, farmers harvest selectively red cherries by picking them by
hand; however a premature harvest can be sometimes carried out by strip picking for
needs of cash and fear of thefts (Jacquet et al., 2008). After drying the cherries are sold to
local collectors “Sabsabis”, wholesalers “Akrabis” or cooperatives, which are operating
the secondary processing facilities (CFC, 2004).
The second method is the wet processing method in which the fresh red cherries are
processed in three stages i.e. removals of the pulp and mucilage, fermentation and

17
washing, and drying of parchment coffee (CFC, 2004). The covering period during drying
and depth of parchment layer affects the total time required to dry parchment coffee to an
optimum moisture level. Solomon and Behailu (2006) identified parchment coffee dried at
the highest drying depth (5 cm) gave the lowest value of cup quality, while the other
drying depths (2, 3 and 4 cm) gave better values of cup quality. Then, parchment coffee is
dried and ready for transport to where it is sold in the auctions (still in parchment form).
Concerning its marketing, as all Ethiopian coffee, Jimma export coffee has to be
channeled through the central auctions in Addis Ababa (CFC, 2004).
In washed coffee production, final quality among others is greatly dependent upon the
fermentation process (Woelore, 1993). It has been confirmed that under-water soaking
following ‘dry’ fermentation, i.e., two-stage fermentation enhances the appearance of both
raw and roast coffees compared to ‘dry’ fermentation only (Behailu et al., 2008).
According to their report post fermentation soaking for 24 hours produced better raw and
roast appearance than either 8 or 16 hours soaking but extending the soak to 48 hours did
not cause any further improvement to the raw and actually reduced the roast quality.
On the other hand, Brownbridge and Michael (1971) have reported that the method of
removing the mucilage (dry fermentation, under water fermentation, peptic enzyme
accelerated fermentation or chemical cleaning) has no effect on the liquor quality and
there is no evidence that any one method can produce significantly better liquors than
another. The authors also indicated that high levels of coffee skins in fermenting coffee
produces inferior raw, roast and liquor qualities compared to skin-free controls, with the

18
liquors adversely affected by the development of off-flavors variously described as coarse,
bitter, fruity, or unclean.
Natural fermentation of coffee is the function of many parameters, such as environmental,
PH, temperature, micro flora and level of pollution in the water used, variety difference in
the ripe cherries used for pulping, its geographical and cultural origin, the standard of
picking and minor variations in the processing method (Behailu et al., 2008). Furthermore,
Behailu and Solomon (2006) reported that coffee fermented under shade takes more time,
shaded fermentation tanks help to achieve uniform fermentation process and better quality
coffee than unshaded one.
However, assessment made on wet-processed Jimma coffee by Brownbridge and Eyassu
(1968) revealed that it is very heterogeneous, containing beans of all shapes, sizes and
plain liquor, probably because of such a mixture types characterized by small beans of a
nice green color and exquisite aroma. As the authors reported neither plant genetics nor
the environment can be modified, but effort should be concentrated on the very critical
post harvest practices such as harvesting, processing, drying, storing and transporting of
coffee cherries, which are liable to be a major influence components of the quality of the
cup.
Length and condition of bean storage also affect cup quality (Yigzaw, 2005). Long time
storage under high relative humidity and warm conditions increase bean moisture content
and consequently reduce quality in terms of raw and roasted appearance as well as liquor
(Woelore, 1995).
19
2.3.4. Genetic factors
As harvesting method, post harvest procedures and the physiology of the plant itself affect
coffee quality, its genetic origin (species and genotype) also greatly influence coffee
quality (Leroy et al., 2006). Agwanda (1999) compared four traits (acidity, body, and
flavor) and overall standard for their suitability as selection criteria for the genetic
improvement of overall liquor quality. According to the author, based on correlation,
repeatability and sensitivity analysis, flavor rating was recommended as the best selection
criterion for genetic improvement of cup quality in Arabica coffee. The trait showed high
genetic correlation with preference, was easy to determine organoleptically and had
relatively high sensitivity in discriminating different coffee genotypes. The study of
Yigzaw (2005) also revealed that coffee quality depends on genetic make-up and genes
control the production of chemical compounds that behave as aroma agents either directly
or as aroma precursors expressed during the roasting process. Hence while selecting a
cultivar to be planted; cup quality must be the first priority to be considered (Yigzaw
(2005).
Furthermore, Owuor (1988) and Moreno et al. (1995) improved the cup quality of
different coffee genotypes with the assistance of professional coffee tasters. Both
researchers observed close similarity among liquorers in ranking various cup quality
characteristics of the cultivars, indicating that any one panel could be relied on selection
for cup quality. Similarly, Agwanda et al. (2003) reported significant genotype x

20
environment interaction effects on coffee bean and liquor quality. Walyaro (1983)
reported relatively lower genotype x environment interaction effects on quality characters.
On the contrary, Van der Vossen (1985) reported non-significant genotype x environment
interaction effects on quality characters, such as bean size and cup quality. Selvakumar
and Sreenivasan (1989) observed coffee cup quality variation ranging from good to
excellent among 54 Arabica coffee accessions collected from Keffa, Ethiopia. The
genotype is a key factor, since it determines to a great extent important characteristics such
as the size and shape of the beans as well as their color, chemical composition and flavor
(Wintgens, 2004). The shape and structure of beans (elephant, pea bean and empty beans)
are the result of both genotype and environmental factors (Wintgens, 2004).
2.3.5. Institutional factors
The National Coffee Board of Ethiopia (NCBE) was the first institution responsible for
coffee which was established in 1957 with the aim of upgrading coffee quality, stimulating
cooperative production, establishing marketing associations, conducting research and
dissemination of information on coffee production, processing and marketing. Then after,
the plantations in the southwestern part of the county were organized under southwestern
Agricultural Development organization. Eventually coffee plantations were organized
under the Ministry of Coffee and Tea Development (Gari, 2002). From 1979 to 1989,
coffee auction market had been operating under the control of the government, i.e. the
government set ceiling price, which was not competitive. After the 1990 market policy

21
reform, the auction market was made free and the individual exporters and the Ethiopia
Coffee Export Enterprise (ECEE) operate compositely by referring to the most recent
world market price for Ethiopia coffee (Admasu, 1998). In 1993, the Ethiopia Coffee
Marketing Corporation (ECMC) was restructured in to two enterprises: the Ethiopia
Coffee purchase and Sale Enterprise (ECPSE) and the Ethiopia coffee Export Enterprise
(ECEE).
Though research on coffee have been conducted nationally for more than four decades by
JARC, the target of coffee research in Ethiopia was to develop CBD (Coffee Berry
Disease) resistant, high yielding and wide adapting varieties to release for major coffee
growing areas of the country (Getu, 2009). Therefore, so far there was no extensive coffee
quality research conducted in the country except on fermentation, drying depth and time of
storage (Solomon and Behailu, 2006). Coffee Development and Marketing Improvement
Plan in Ethiopia (CDMIP) was launched since 2003 to maximize the benefits driven from
coffee by optimizing production and marketing systems of the industry (Alemayehu et al.,
2008). According to their report, the small holding coffee farmers in particular could not
able to make use of appropriate inputs and implement tools such as pruning shears, bow
saw and drying materials largely due to unavailability, poor purchasing capacity and
absence of appropriate credit systems. Effective Agricultural Extension services are of
paramount importance for farmers to get timely advices and information on the
availability, use and application of new, improved and modern agricultural inputs,
technologies and practices. The Gomma and Manna Agricultural and Rural development
offices are responsible to offer agricultural extension services. Under these offices,
different experts with different professions were organized at all levels and Development
22
Agents (DAs) at Farmers Training Center (FTC). The Development Agents at the FTC are
responsible to give extension services to the farming community and they are accountable
to the Woreda Agricultural offices.
According to Jacquet et al. (2008), prior to market liberalization washed coffee was
subjected to intensive supervision and close monitoring with the aim of keeping its quality
in respect to training and technical advices about quality cherries collection, processing,
drying and storing to concerned groups. But, currently, the intensity of supervision is
reduced because of various factors including limitation of logistics, financial and human
resources above all, there are no cherries formal market areas and legally identified coffee
purchasers, delay of collected cherries a day before delivered to washing station and
narrow price difference between different coffee grades (Jacquet et al., 2008).
2.3.6. Socio-economic factors
Factors determining the adoption of technologies are more complex in case of perennial
crops like coffee than in the case of annual crops. This is because of the difficulty in
securing the benefits associated to the technologies due to the time gaps, and the nature of
the commodity trade, which, is influenced by international markets (Admasu, 2008). On
the other hand, Mulugeta (1999) reported that access to credit, farm size, supplementary
inputs, technical and institutional support like the extension service determine the adoption
of technologies. Furthermore, Negussie et al. (2008) reported that age, gender, family size,
extension contact, attendance of training and experience in coffee farming did not
23
significantly influence farmers’ perception in survey made in Manna woreda. According
to their report adoption of improved varieties, literacy, visit and proximity to research
center positively influenced farmers’ perception.
Sex of the Household Head: Many evidences shows that female households have less
access to improved technologies, credit and extension service (Ellis and Mudhara, 1995).
On the other hand, male-headed households have better access for information than female
households that helps for adoption of improved agricultural technologies. According to the
findings of Negussie et al. (2008), only 26% of the female-headed households had access
to improved coffee varieties as compared to 88% for the male-headed and 87% of the male
respondents ever used fertilizer as compared to 55% for females in survey made in
Gomma woreda.
Education Level of the Household Head: Adoption of improved practices by farmer is
necessarily based on his/her capacity to access, process and utilize information related to
improved technologies. The finding of several studies (Dasgupta, 1989; Zemedu, 2004)
revealed that level of education is strong and significant determinant of farmers’ adoption
of improved agricultural technologies.
Karki et al., (2004) undertook a study in a mid-hill district of Nepal to assess the impact of
foreign-aided project in technology adoption and food security and to identify factors
determining adoption of improved technology in case of smallholder peasants. The result
using binomial logit model and qualitative analysis revealed the coefficient of years of
schooling was positively and significantly influenced farmers' adoption decisions on

24
improved agricultural technologies. As the education level of household head increases,
the probability of adopting technology was also found to be increased. Similarly, the
finding of Ngigi (2003) in Kobo, Ethiopia showed positive and significant association
between education level of the household and adopting of RWH technology.
Recently, Admasu (2008) reported that about 80% of the coffee producing farmers believe
in the importance of tilling coffee farm land every year, although shortage of labor, farm
tools, and fear of risk of tree die back were the reason for not plowing their coffee farm
land every year based in survey made in Gomma woreda. Similarly, as indicated by the
author about 85% and 93% of sample farmers in the same area respond to have faced cash
shortage for the purpose of hiring labor for coffee harvesting and weeding, respectively.
Furthermore, the author pointed out that about 87% of sample farmers in Gomma woreda
had shortage of farm tools for the purpose of coffee production.
In addition to this Elias (2005) reported that poor quality of coffee supplied by farmers;
poor infrastructure and inadequate facilities and lack of institutional credit were the major
problems of coffee production and marketing in the Gomma woreda. According to the
author lack of credit service was a problem reported by both the coffee growers (22%) and
the coffee traders (21%).
Even though several attempts were made and significant achievements were recorded in
transferring coffee research outputs to end-users by JARC and different actors.
Nevertheless, wider dissemination and utilization of the technologies have been
constrained by technical, socio-economic, and institutional factors (Negussie et al., 2008).

25
2.4. Method of Assessing Coffee Quality
2.4.1. Bean physical quality
Internationally, the very low coffee prices that resulted from surplus production in the late
1990s and early 2000s have brought calls for qualities to be eliminated from the market
altogether, and the ICO council has passed a resolution to this effect. Since October 1st,
2002, the International Coffee Organization (ICO) (2002) is implementing the Coffee
Quality Improvement Program with recommendations to exporting countries. According
to the program, it is not recommended to export coffee with the following characteristics:
for Arabica, in excess of 86 defects per 300 grams sample (New York green coffee
classification/Brazilian method, or equivalent); and, for Robusta, in excess of 150 defects
per 300 grams (Vietnam, Indonesia, or equivalent classification).
On the other hand in Ethiopia, the overall standard for raw and liquor quality grades of
washed coffee ranges from 1 to 5, where grade 1 = 81-100%, grade 2 = 61-80%, grade 3 =
41-60%, grade 4 = 21-40% or 1-2 defective cups, grade 5 = 20% or more than 2 defective
cups whereas, for unwashed coffee, the grades range from 1 to 5, where, grade 1 = 81-
100%, grade 2 = 63-80%, grade 3 = 50-62%, grade 4 = 31-49% or 2 cups defect, grade 5 =
15-30% or more than 2 cups defect (CLU, 2007). Recently, ECX (Ethiopia Commodity
Exchange) (2009) established a new grading system for washed and unwashed coffee that
has nine grades (Appendix XII, XIII, XIV, and XV) though this study focused on the
previous grading system of CLU.

26
The ICO’s Coffee Quality Improvement Program also asks members of producing
countries not to allow the export of Arabica or Robusta of any grade whose moisture
content is below 8% or above 12.5%. ISO (2004b) has established a standard (ISO 10470)
that describes defects as: Foreign materials of non-coffee origin: Foreign materials of non-
bean origin, such as pieces of parchment or husks: Abnormal beans for shape
regularity/integrity; Abnormal beans for visual appearance, such as black beans; Abnormal
beans for taste of the cup after proper roasting and brewing.
Bean size, defined as grade from a commercial point of view, is an important factor since
price is related to the coffee grade (small beans of the same variety can bring lower
prices). Roasting should ideally be carried out with beans of the same size. When uneven
sized beans are roasted, the smallest tend to burn and the largest tend to be under-roasted,
affecting the visual appearance of the beans and, more importantly, the cup quality (Barel
and Jacquet, 1994).
Similarly, Endale (2008) reported that green coffee is graded and classified for export with
the ultimate aim of producing the best cup quality and thereby securing the highest price.
However, there is no universal grading and classification system, due to this each
producing countries has its own minimum standards for export. But generally, grading and
classification is usually based on altitude and /or region, botanical variety, preparation
(wet or dry process), bean size (screen size, number of defects, bean weight, roast
appearance and cup quality (flavor, characteristics, cleanliness) (Endale, 2008).
27
Moisture is an important attribute and indicator of quality. Quality deterioration occurs
due to an increase of moisture content of the bean, the spoiling of the raw appearance of
the bean by loss of color fading or tainting, or to the introduction of unpleasant flavors, by
infestation of storage insects or by infection with moulds or bacteria (Behailu et al., 2008).
A market survey conducted in Europe in 1998-1999 for the common fund for commodities
concluded that for Arabica coffee beans the most important defect for a trader or a roaster
is the moisture content (CFC, 2004). A high moisture content of the beans is a loss of
material and leads to physical and sensorial defects. If the beans are too wet above 12.5 %
moisture, they will mould easily during storage, whereas, if too dry (below 8 % moisture)
they will lose flavor. The moisture content influences the way coffee roasts and the loss of
weight during roasting. Green coffee beans with low moisture content tend to roast faster
than those with high moisture content. The ICO resolution 407 recommends that coffee
should not be exported when outside of these limits as assessed by the ISO 6673 method
(ICO, 2002). It was recommended that, a cool and dry environment (10-18oC, 50-70%
RH) makes a great contribution towards preservation of coffee quality, provided the coffee
is initially well dried (Woelore, 1995). As reported by the author coffee could not be
stored in parchment form in the primary stores beyond 4 to 5 months.
2.4.2. Organoleptic quality
Cup quality assessment is done organoleptically by panels of experienced coffee tasters
(Agwanda, 1999) and is determined on the basis of the level of acidity, body and flavor of
the brew (Yigzaw, 2005). Muschler (2001) also indicated that cup quality or liquor quality

28
is an important attribute of coffee and acts as yardstick for price determination. The
Organoleptic quality is affected by the roasting, i.e. according to the profile of temperature
and length of roasting the tastes and flavors perceived in the beverage will be different.
The smell of the ground roasted coffee before water is added sometimes gives fragrance,
then, one can smell the aroma, evaluate the body and perceive the taste and flavors. To
asses’ organoleptic quality, one has to take into account that consumers have specific taste
preferences according to their nationality which leads to an unreliable definition of
organoleptic quality (Prodolliet, 2005). For example: Germans and Swedish prefer lighter
coffee and more acidic coffee than Italians; in Greece, Lebanon and northern of France,
people go for the « rio » taste (a specific taste due to a chemical compound:
trichloroanisol). In addition, organoleptic characteristics must be stable, especially for the
roaster and the consumer (Prodolliet, 2005).
Overall organoleptic quality measurement relies on sensory evaluation (Barel and Jacquet,
1994). For determination of organoleptic quality; two types of analysis are commonly
used. The first one, "hedonic analysis", evaluates the preference of consumers. It has to be
performed on a panel of at least 60 spontaneous assessors that represent the population of
which the preferences is sought. The second method, termed ‘descriptive analysis’, is
under taken by trained assessors that can discriminate coffee quality using, a triangular test
(Prodolliet, 2005). In this method, three cups of coffee are served, two cups containing the
same coffee. The assessors determine which cup is unique. Expert assessors can describe a
profile. It is a complex procedure, which uses some specific descriptors. There are some
existing glossaries (Lingle, 2001; ITC, 2002; ICO, 2004), but ISO elaborated a list of
descriptors specific for coffee (Prodolliet, 2005). Expert assessors (at least 5) have to be

29
trained to use the vocabulary. Assessment of coffee organoleptic quality is an extremely
demanding exercise; indeed.
Acidity indicates the bitter or acidic balance and the presence of a sweet caramelic after
taste (Petracco, 2000). The acid content in a brew is also greatly dependent upon the
degree of roast, type of roaster, and brewing method. Uneven roast results in poor quality
liquor (ITC, 2002). Dark roast enhance the body while light roast emphasizes acidity (ITC,
2002). High acidity gives better quality and more intense aroma to the beverage (Clifford,
1985). The pH of a coffee has been found to correlate with the perceived acidity of a
coffee. A pH of 4.9 to 5.2 is the preferred range for a ‘good cup of coffee (Yigzaw, 2005).
Body is synonymous with mouth feel or linked with density and viscosity of the brew
(Pertracco, 2000).
Flavor indicates fragrance of the liquor either by direct inhaling of the vapors arising from
the cup or nasal perception of the volatile substance evolving in the mouth (Petracco,
2000). The flavor obtained in a coffee cup is the result of multiple aromatic compounds
present in the coffee (more than 800 in the roasted coffee). Assessment of Measurement of
the composition in 800 aromatic compounds present in roasted coffee is not a viable
method to assess coffee organoleptic quality, development of indirect predictors of coffee
organoleptic quality is underway (Leroy et al., 2006) though it was not the objective of
this study. These predictors include quantification of chemical compounds present in
green coffee (sugars, lipids, proteins, chlorogenic acids, and methylxanthines) via the
traditional wet chemistry method and indirect methods like Near Infrared spectra
(Bertrand et al., 2005). The development of such easy to use and efficient tools should

30
allow large scale phenotyping; a key component towards the implementation of breeding
strategies for organoleptic quality in coffee (Bertrand et al., 2005).
The aroma of a coffee is responsible for all flavor attributes other than the mouth feel and
sweet, salt, bitter, and sour taste attributes that are perceived by the tongue. Therefore, it
might be said that the aroma is the most important attribute to specialty coffee. Even
instant coffee has the components responsible for stimulation of our taste buds. The
difference, however, is that instant coffee lacks most of the aromatic volatile compounds
causing a dramatic decrease in the overall flavor. Aroma is perceived by two different
mechanisms. It can either be sensed nasally via smelling the coffee through the nose or
retro nasally. Retro nasal perception occurs when the coffee is either presents in the mouth
or has been swallowed and aromatic volatile compounds drift upward into the nasal
passage. Yet, the perception of aroma is dependent upon both the concentration of the
compound and its odor threshold. It is probable that a relatively small group of compounds
that share both a high concentration and a low odor threshold make up the fragrance we
know as coffee aroma.
The aroma of coffee is for a large part determined by the roasting of the beans. The four
main reactions during the roasting are: Millard reaction; a reaction between nitrogen
containing substances (amino acids, proteins, as well as trigonelline and serotonin) and
carbohydrates (sugars). Degradation of individual amino acids, particularly, sulphur amino
acids, hydroxy-amino acids, and proline. Degradation of sugar resulting in caramel like
substances. Degradation of phenolic acids, particularly the quinic acid moiety. Other
reactions involve lipid degradation and hundreds of interactions between intermediate

31
decomposition products. Furans are found to be the most predominant group of
compounds amongst the coffee aromatics. They typically have caramel-like odors since
they result from the pyrolysis of sugars (‘burnt caramel). Furans also produce key aroma
notes when secondary reactions take place with sulphur containing compounds.

32
3. MATERIALS AND METHODS
3.1. Description of the Study Area
The study was conducted in Manna and Gomma woredas of Jimma zone (Appendix V)
The Zone is located in the Southwestern part of Ethiopia between Latitude 6o and 9o North
and Longitude 34o and 38o East, and between altitude ranges of 880 to 3340 meters above
sea level (ORG, 2003).
3.1.1. Gomma woreda
Gomma is one of the known coffee growing woreda, among 18 woredas of Jimma Zone. It
is located 397 km Southwest of Addis Ababa and about 50 km west of Jimma town (ORG,
2003). Its area is 1,230.2 km2 (ARDO, 2008). The annual rainfall varies between 800-
2000 mm, while the mean minimum and maximum annual temperatures of the woreda
vary between 7oC-12oC and 25oC-30oC, respectively (ARDO, 2008). Based on 15 years
weather data obtained from Gomma woreda, the average annual rainfall is 1524 mm
(Appendix X). Altitudinal range of the woreda is between 1387-2870 m. a.s.l (IPMS,
2007). The three dominant soil types in the woreda are Eutric Vertisols, Humic Alfisols
and Humic Nitosols. Nitosols are the most abundant covering about 90% of the woreda,
which is dark reddish brown in color, slightly acidic and suitable for coffee production

33
(IPMS, 2007). Agro-ecologically, this woreda is divided into 8% high land (Dega), 88 %,
intermediate high land (Weyina Dega) and 4% low land (Kolla) (IPMS, 2007).
3.1.2. Manna woreda
Manna is one of the major coffee producing woredas in Jimma zone, which is located at
368 km southwest of Addis Ababa and 20 km west of Jimma town. The total area of the
woreda is 478.98 km2 (47,898 ha) of which 12% is highland, 65% intermediate highland
and 23% lowland with altitudinal ranges between 1470–2610 m. a.s.l (ARDO, 2008). The
mean minimum and maximum temperatures are 13.00C and 24.80C, respectively (ARDO,
2008). Based on long term (15 years) weather data obtained from the nearby JARC
meteorological station, the average annual rainfall is 1523 mm (Appendix XI). Distric
Nitosols and Orthic Acrisols are the dominant soil types with slightly acidic PH, which is
suitable for coffee production found in Manna woreda (ORG, 2003).
3.2. Field Survey
3.2.1. Sample size determination
For the field survey, sample sizes were determined following the procedures of probability
proportional to size technique given by Cochran (1977) using the formula:
34
dZ pp
n 22
)1(2 −=
α
Where, n is the sample size, Z2α is the standard normal distribution atα , p is the
population proportion of Peasant associations and farmers, d is the absolute precision.
Considering limiting factors such as time, money and other facilities and coffee quality
problems two woredas (Gomma and Manna) were selected out of the six major coffees
growing woredas of Jimma Zone,. In the two selected woredas, eight PAS (peasant
associations) were selected randomly from 31 major coffee growing PAS. Then, out of
1124 farmers (721 were from Gomma and 403 were from Manna woreda) major coffee
growing farmers in the selected PAS, 164 respondents (household farmers) were randomly
selected using simple random sampling method. Besides, 30 coffee traders were
purposefully selected from the two woredas. In this study, three stage random sampling
technique was found to be appropriate as there exist three level sample units (woredas,
PAS and farm household).
3.2.2. Variables studied in the survey
The dependent variable is dichotomous random variable “have acceptable quality/have
unacceptable quality status” of coffee produced in the study area. i.e., have acceptable
quality =0, have unacceptable quality =1. Independent variables: The variables that are

35
hypothesized to influence the prediction of coffee quality status are presented in Table 1
and 2.
3.2.2.1. Demographic factors
1. Sex of household head (SHH11): This is a dummy independent variable, indicating the
sex of the household head. Household headed by male coded 1 or 2 for female. Many
evidences showed that female households have less access to improved technologies,
credit and extension service (Ellis and Mudhara, 1995). On the other hand, male-headed
households have better access for information than female households that helps for
adoption of improved agricultural technologies. Therefore, it is hypothesized that male
status of household head is positively related with adoption of coffee quality pre and post
harvest management practices (CQPPHMP).
2. Age of household head (AHH12): Farmers/traders age implies number of years since
he/she has embarked on farm/trade operations. Elder farmers/traders with longer
farming/trading experience are supposed to have better competence in assessing the
characteristics and potential benefits of new technologies than younger farmers/traders
with shorter farming/trading experience. It is hypothesized that the number of in
farming/trading years to be positively related with the use of CQPPHMP.
3. Family size (FS13): It is independent variable, indicating the number of people of the
household. It is hypothesized that household heads with large family size are more likely
36
to improve coffee quality due to more labor during pre and post harvest management. In
this study, it is hypothesized that family size is to be positively related with CQPPHMP.
4. Educational status of household head (EDHH14): It refers to the educational status
of the household head and is categorized as literate and illiterate. Adoption of improved
practices by a farmer is necessarily based on his/her capacity to acquire information about
new technologies as well as his/her capacity or knowledge to accept and apply the
improved technology. The finding of several studies (Dasgupta, 1989; Zemedu, 2004)
revealed that level of education is strong and significant determinant of farmers’ adoption
of improved agricultural technologies. It is expected that those farmers with higher formal
education be disposed to decide to participate in quality maintenance practices. Thus,
educational status is hypothesized to influence the adoption decision of farming
households positively.
3.2.2.2. Agronomic and physiological factors
1. Age of coffee trees (ACT16): It is independent variable, indicating the age of the
coffee tree. Apart from genotype, cup quality is influenced by the age of the tree. Age of
coffee trees below 20 years is coded as 1, whereas above 20 years is 2. Yigzaw (2005)
reported that samples from young trees are likely to be mild and thin, but fine in flavor.
Beans from old trees produced strong taste and a harsh characteristic brew. Medium aged
trees, 15 to 20 years old, bear beans with good flavor as well as acidity and body (Yigzaw,

37
2005). Thus, in this study the variable is hypothesized to have inversely related with
coffee quality.
2. Type of coffee weeds (TCW19): This represents the type of weeds prevalent and
dominant in the coffee field. It is expected that type of weeds dominant in the field can
lead to produce poor quality coffee than the field free of weeds. Hence, in this study if the
coffee field is infested with soft weeds coded 1, or coach grass 2, or if both coded 3. It is
hypothesized that coffee quality correlate negatively as type of weed infestation increase
from soft to both.
3. Diseases observed in coffee farm (DOCF115): This represents the incidence of any
type of diseases in the coffee field. It is expected that disease occurrence can lead to poor
quality coffee that gives off and disagreeable odor. Hence, in this study the disease
occurrence coded 1, or other wise 0. Therefore, it is hypothesized that coffee quality is
expected to be inversely related with disease incidence and severity.
4. Coffee tree pruning (CTP17): If coffee tree pruning is exercised it is coded 0, or
otherwise 1. Coffee tree pruning is an extremely important pre harvest activity for
reducing incidences of diseases, modifying air movement within the plantation, which in
turn reduces leaf drying time. Therefore, it is hypothesized that regular coffee pruning can
produce sustainable and good quality coffee and is expected to be positively related.
5. Mechanism of weed control (MWC110): It indicates mechanisms used to control
weeds in coffee field. If a weed is controlled by slashing it is coded 1, or by hand weeding

38
would be 2 Chemicals 3, cover crops 4, IPM (integrated pest management) 5. Hand
weeding can only remove annual weeds but not perennial weeds. Therefore, hand weeding
is hypothesized to be negatively correlated with coffee quality.
6. Compost application (CA112): if compost is applied to coffee farm it would be coded
0, or otherwise 1. Application of compost improves the activity of micro organisms and
improves macro–and micro- nutrient availability. Compost acts as a good soil conditioner
and improves the physical, chemical and biological properties of the soil. Thus, this
variable is hypothesized to correlate positively with coffee quality.
3.2.2.3. Harvest and post-harvest factors
1. Fruit maturity stage during harvesting (FMSH121): If coffee is harvested before the
beans are ripe or at immature stage, the end product will show color defect and will be
cause of uneven roasts, i.e. Grayish or dark grey beans which, leads to bean color and test
of coffee classified as undesirable. In this study, this variable was treated as an
independent variable coded 1 harvested at full maturity, or 2 harvested at green mature
stage or 3 harvested at immature stage. It is hypothesized that coffee quality is to be
directly correlated with stage of bean maturity.
2. Method of coffee harvesting (MCH): Different methods of coffee harvesting are
exercised by coffee farmers. If farmers harvest their coffee by selective hand picking
coded as 1, or 2 for strip method and 3 for farmers harvest their coffee from the ground. It

39
is hypothesized that coffee quality is to be correlated directly with coffee harvesting
method coded from 3 to 1.
3. Coffee mixing during selling (CMS120): It is an independent variable, indicating
mixing up of differently harvested types of coffee. A value of 1 represents if there is no
mixing of coffee while selling or otherwise 2. Apart from the age of coffee tree, cup
quality is influenced by mixing of differently harvested coffee while selling. It is
hypothesized that quality to be correlated inversely with differently harvested coffee
mixing.
4. Time of coffee storage (TCS134): During storage due attention must be given to
humidity, storage facility, location, and storage duration to prevent from spoiling or losing
quality. An acceptable odor quality (fresh and not rancid) was maintained until 7 and 15
storage days at 25 ºC and 4 ºC for coffee brews, respectively. However, taste quality was
maintained longer than odor (Dalla Rosa et al., 1990). If storage time <4 months coded as
1 and > 4 months coded as 2 As time of storage increases, quality is expected to decrease
and vice versa, which implies as storage time increased the cup quality would be
decreased as some minor components transform into other components, as a result it tastes
woody and harsh after roasting.
5. Drying material of coffee (DMC129): Coffee drying is always a delicate operation
which should be carried out carefully. It is expected that using cemented floor, bricks floor
and raised bed with mesh wire, wooden and bamboo bed can enable farmers/traders drying

40
their coffee better than farmers/traders drying on the ground. If the farmer/traders use
cemented, bricks and mesh wire for drying it is coded as 0, wooden bed and bamboo
coded as 1, and on the ground 3. It is expected that drying material (coded 3 to 0) correlate
positively with quality and vice versa.
6. Type of coffee packing materials used (TCP130): indicating type of packing
materials that farmers use for marketing and storage. A value of 1 represents jute bags, 2
plastic bags, and 3 clay pot. Apart from drying materials, cup quality is influenced by
packing materials because different packaging materials can have adverse effect on coffee
quality. Therefore, quality packaging materials (coded 3 to 1) is expected to correlate
positively with coffee quality and vice versa.
7. Storage availability (SA131): indicates availability of storage house. Because it is
expected that poor storage can lead to changes in the inherent qualities and appearance of
the green coffee as a result of potential development of moulds. The availability of storage
facility coded as 1 and 2, otherwise.
8. Sell of coffee at flowering stage (SCF137): refers to those farmers who sell their
coffee at flowering stage due to cash shortage. It is expected that selling coffee at flower
stage can lead to poor harvesting practices such as striping coffee before it is fully matured
that in turn changes in the aroma and flavor of coffee. If the farmers adopt selling their
coffee at flowering stage coded as 1 and 0, otherwise.

41
3.2.2.4. Institutional factors
1. Support from woreda agriculture and rural development office (SARDO138):
refers to the governmental support in CQPPHMP. It is a dummy variable, which takes a
value 0 if the farmers/traders household has access for any external support and 1,
otherwise. Therefore, it is expected that in areas, where there is governmental or non-
governmental assistance, farmers are encouraged to use CQPPHMP. As a result, this
variable is hypothesized to influence adoption of CQPPHMP positively.
2. Cash shortage during harvest (CSH135): It is expected that those who have better
access to credit can adopt improved CQPPHMP because it is expected that credit can
solve the financial limitation of farmers. If the farmer gets credit service coded as 0 or
otherwise 1 it is hypothesized that credit service is expected to correlate positively with
adoption of CQPPHMP.
3. Time constraint during peak harvest (TCPH122): indicates overlap of activities
during pick harvest time. It is expected that those farmers who have more time during
picking harvest time can adopt improved CQPPHM because it is expected that time
limitation can lead to strip harvesting, inappropriate drying and poor storage. If the farmer
has no time constraint coded as 0 or otherwise 1. Time constraint during peak harvest is
expected to be correlated inversely with quality.
Training access for last year (TALY140): refers to the frequency of DA visits to deliver
extension services and training for the farmers and traders to adopt a new technology. This

42
can increase the intensity of adoption. If the farmers and traders get better extension
services, they are expected to adopt way of CQPPHM. In this study this variable treated as
a dummy variable in that if they get extension service it is coded as 0 or 1 otherwise.

43
Table 1. Definition of explanatory variables to explain adoption of CQPPHMP by farmers
Variables Code Definition Category SHH11 Sex of house hold 1= if male headed house hold or 2= if female headed house hold
HHED14 Educational status of house hold 1= if illiterate or 2 if literate.AHH12 Age of house hold 1= if >48 or 2= if > 33 or 3 if >18 FS13 Family size 1= if >4 or 2= if <4 D15 District of the study 1= if Gomma or 2= if Manna ACT16 Ages of coffee tree 1= if<20 or 2. if >20 CTP17 Coffee tree pruning 0= if Yes or 1= if NoTCW19 Types coffee weed 1= if soft weed or 2 = if coach grass or 3= if both MWC110 Mechanism of weed control 1= if slashing or 2= if hand weeding CA112 Compost application 1= if Yes or 2= if No DOCF115 Disease observed in coffee farm 0= if No or 1= if Yes CMS120 Coffee mixing during selling 0= if No or 1= if YesFMSH121 Fruit maturity stage at harvesting 1= if full maturity stage or 2= if green stage or 3 =if immature stage TCPH122 Time constraint during peak harvest 0= if No or 1= if Yes WHC127 Who often harvest your coffee 1=if own family or 2= if daily laborerDMC129 Drying materials used for coffee 1=if on cemented, bricks and mesh wire or 2= if wooden bed and bamboo or 3= if on ground TCP130 Type of coffee packing materials used 1= if jute bags or 2= if plastic bags or 3= if clay pot SA131 availability of storage 1= if Yes or 2= if NoTCS134 time of coffee storage 1= if <4 months or 2= if>4 months CSH135 Cash shortage during harvest 0= if No or 1= if Yes SCF137 Sell of coffee at flower stage 0= if No or 1= if YesSARDO138 Support from ministry of agriculture 1= if Yes or 2. if NoTALY140 Training access for last year 1= if Yes or 2= if NoMCH Method of coffee harvesting1=selective hand picking 2=strip method 3=from the ground

44
Table 2. Definition of explanatory variables to explain adoption of CQPPHMP by traders Variables Code Definition Category Sex Sex of house hold 1= if male headed house hold or 2= if female headed
h h ldAge Age of house hold 1= if >48 or 2= if > 33 or 3 if >18 Family size Family size 1= if >4 or 2= if <4 Woreda Woreda of the study 1= if Gomma or 2= if Manna Type of store floor 1. Concrete 2. Wooden bed 3. Paved ground. Price decision 1. if based on radio announcement or 2.if own judgment
Availability storage availability of storage 1= if Yes or 2= if No
Moisture tester 1. If Yes or 2. If No Checking coffee quality 1. If through observation or 2. If no means of checking
Time of storage
time of coffee storage 1= if <4 months or 2= if>4 months
Extension service Extension service 1= if service is given yes or 2 = if no service is given Advisor Have their own adviser 1= if Yes or 2. If no Training Training access for last year 1= if Yes or 2= if No

45
3.3. Laboratory Analysis
3.3.1. Experimental materials
The experimental materials used for laboratory analysis were coffee samples collected from
Gomma and Manna woredas of Jimma zone. A detail of their location is given in Table 3.
3.3.2. Sampling procedures
To investigate and identify coffee quality associated factors in the study areas, a total of 32
coffee bean samples (16 from each woreda from eight PAs) were prepared for organoleptic
and bean physical quality characteristics as indicated in Table 3. A sample of 120 kg red
cherries were collected from the randomly selected eight PAS (four samples from each study
woreda for wet and dry coffee types) and the samples were further divided into two to
process using the recommended method (researcher) of dry and wet processing. During
harvesting healthy and red-ripe cherries were picked by hand from two woredas and eight
PAS. Samples were processed in both recommended wet and dry processing methods.
For comparison, in the vicinity of each selected PAs, 16 green coffee samples, (i.e., eight
from dry and another eight from wet processed coffee) were sampled from local traders’
stores of both woredas. The samples from local traders’ stores were sampled based on the

46
sampling procedures followed by the Coffee Liquoring unit (CLU) (2007) Ethiopia by
drawing 3 kg per 10 ton of marketable coffee
Dry processing steps
Drying: For the recommended dry processing method, berries were sun dried on mesh wire
for about two to three weeks depending on the unpredictable climate (Appendix I). During
drying the moisture content of the bean was measured using Electronic Rapid Moisture
Tester (HOH-Express, HE 50 Germany) to know and maintain the moisture level between
10–12% for all samples uniformly (Fig. 1).
Hulling: Fully dried coffee beans were dehulled by pounding with a pestle and mortar. The
dried pulp, the parchment skin part of the husk is removed. Mechanically undamaged beans
were used both for cup quality and green bean physical characteristics analyses.
Wet processing steps
Pulping: For the recommended wet processing method, red fully ripe cherries were manually
picked during the main harvesting season (in November, 2008), separated from foreign
materials and unripe green cherries and processed in the wet method, as described by
W/Michael (1996). The fresh cherries were pulped using a hand pulper that squeezes the
berries between fixed and moving surfaces and well washed by clean water to remove the
pulp (Appendix II).

47
Fermentation: The wet parchment coffees were put in a fermentation tank to undergo
fermentation for 40 hours to facilitate decomposition of the mucilage. Under Jimma
condition, mucilage normally takes 24 to 40 hours to become completely removed from the
bean (Woelore, 1993). Hand fill texture method is employed to check for the removal of
mucilage from the pulped coffee.
Washing: After fermentation the beans were washed using three to four changes of clean
water to remove all traces and decomposed products of the mucilage. As this stage the coffee
is referred as “parchment coffee”.
Drying: The wet parchments coffees were placed on mesh wire under sun for drying. Beans
with some defects are avoided at this stage. During drying the moisture content of the bean
was measured by moisture tester H-E50 to check and maintain the moisture level between
10–12% for all samples uniformly (Fig. 1). The dry parchment coffee was put in sample bags
and stored in a well ventilated coffee store at 60% relative humidity and 200C temperature till
cup testing (Appendix III).
Hulling: Then, it was hulled by hand and polished to remove the parchment and silver skins
from the green coffee. Both samples collected from the traders and prepared using the
recommended methods of processing were assigned an arbitrary code (an identity letters) in
order to secure an unbiased judgment as indicated in Table 3.
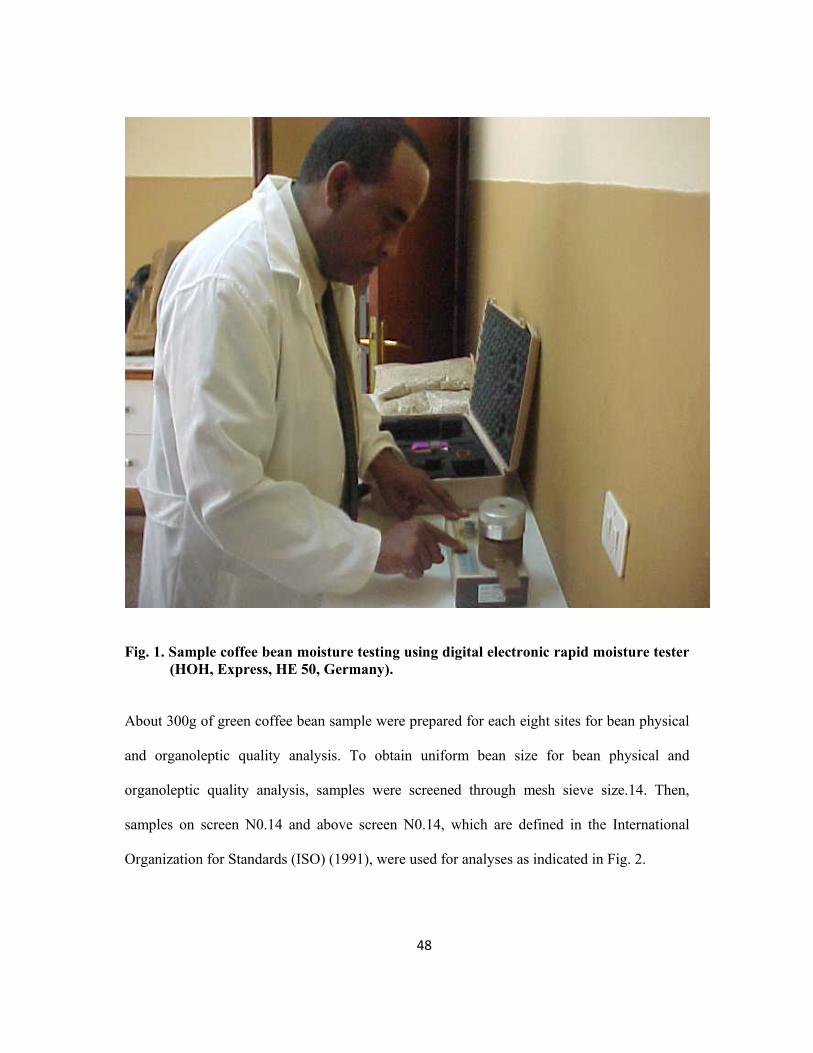
48
Fig. 1. Sample coffee bean moisture testing using digital electronic rapid moisture tester (HOH, Express, HE 50, Germany).
About 300g of green coffee bean sample were prepared for each eight sites for bean physical
and organoleptic quality analysis. To obtain uniform bean size for bean physical and
organoleptic quality analysis, samples were screened through mesh sieve size.14. Then,
samples on screen N0.14 and above screen N0.14, which are defined in the International
Organization for Standards (ISO) (1991), were used for analyses as indicated in Fig. 2.

49
Fig. 2. Samples coffee bean grading using different screen sizes.

50
Table 3. List of coffee samples studied in the laboratory
SN Woreda Sample Code
Altitude PA Processing method and preparation type
1 Gomma Brw1 1800 Bashasha Recommended Washed 2 Gomma Chrw2 1650 Chedero Recommended Washed 3 Gomma Ogrw3 1850 Omo Gurude Recommended Washed 4 Gomma Yrw4 1700 Yachi Recommended Washed 5 Manna Drw5 1700 Dowwa Recommended Washed 6 Manna Gbrw6 1755 Gudeta Bula Recommended Washed 7 Manna Hrw7 1650 Haro Recommended Washed 8 Manna Htrw8 1790 Hunda Toli Recommended Washed 9 Gomma Bruw9 1800 Bashasha Recommended Unwashed10 Gomma Chruw 10 1650 Chedero Recommended Unwashed 11 Gomma Ogruw11 1850 Omo Gurude Recommended Unwashed 12 Gomma Yruw12 1700 Yachi Recommended Unwashed 13 Manna Druw13 1700 Dowwa Recommended Unwashed 14 Manna Gbruw14 1755 Gudeta Bula Recommended Unwashed 15 Manna Hruw15 1650 Haro Recommended Unwashed16 Manna Htruw 1790 Hunda Toli Recommended Unwashed 17 Gomma Blw17 1800 Bashasha Local Washed 18 Gomma Chlw18 1650 Chedero Local Washed 19 Gomma Oglw19 1850 Omo Gurude Local Washed 20 Gomma Ylw20 1700 Yachi Local Washed 21 Manna Dlw21 1700 Dowwa Local Washed 22 Manna Gblw22 1755 Gudeta bula Local Washed 23 Manna Hlw23 1650 Haro Local Washed 24 Manna Htlw24 1790 Hunda Toli Local Washed 25 Gomma Bluw25 1800 Bashasha Local Unwashed 26 Gomma Chluw26 1650 Chedero Local Unwashed 27 Gomma Ogluw27 1850 Omo Gurude Local Unwashed 28 Gomma Yluw28 1700 Yachi Local Unwashed 29 Manna Dluw29 1700 Dowwa Local Unwashed 30 Manna Gbluw30 1650 Gudeta Bula Local Unwashed 31 Manna Hluw31 1650 Haro Local Unwashed 32 Manna Htluw 32 1790 Hunda Toli Local Unwashed

51
3.3.3. Data collection
For laboratory analysis moisture content, defect count, acidity, body, flavor, odor, shape and
make and overall quality characters were recorded as quantitative bean quality attributes. The
data were recorded as indicated in Table 4, Table 5, Table 6 and Appendix I.
3.3.4. Bean physical and organoleptic quality analysis
By following the procedures of JARC (Jimma Agricultural Research Center) and CLU
(Coffee Liquoring Unit of Ethiopia), sensorial quality analyses were carried out at JARC by
well trained cup testers.
3.3.4.1. Defect count
A 300g of each coffee sample was taken using digital bean balance as indicated in Fig. 3. The
beans were graded by size using standard screens that have different screen size, with round
holes as defined in the International Organization for Standards (ISO) (1991). Besides size
determination, under graded and broken beans were also separated from each sample during
the screening process and defect count was also made for dry processed green coffee beans
by internationally fixed standard set as indicated in Appendix I and IX (CLU, 2007). The
beans were visually inspected and evaluated for raw quality (accounting for 40% of the total
coffee quality) using the parameters shown in Table 4 and Table 6.

52
.
Fig. 3. Sample coffee bean preparation for different laboratory tests, using digital bean balance.
3.3.4.2. Roasting
The roaster machine with six cylinders (Probat BRZ6, welke, Von Gimborn Gmbhan Co.
KG) was first heated to about 1600C-2000C. About 100 g green coffee beans sample per each
site per each replication were put into the roasting cylinder and roasted for an average of
seven minutes to medium roast (Fig.4.) The medium roast coffee was tipped out into a
cooling tray and allowed to cool down (on an average for four minutes) rapidly by blowing
cold air through it. When the roast was cool it was blown to remove the loose silver skins
before grinding.
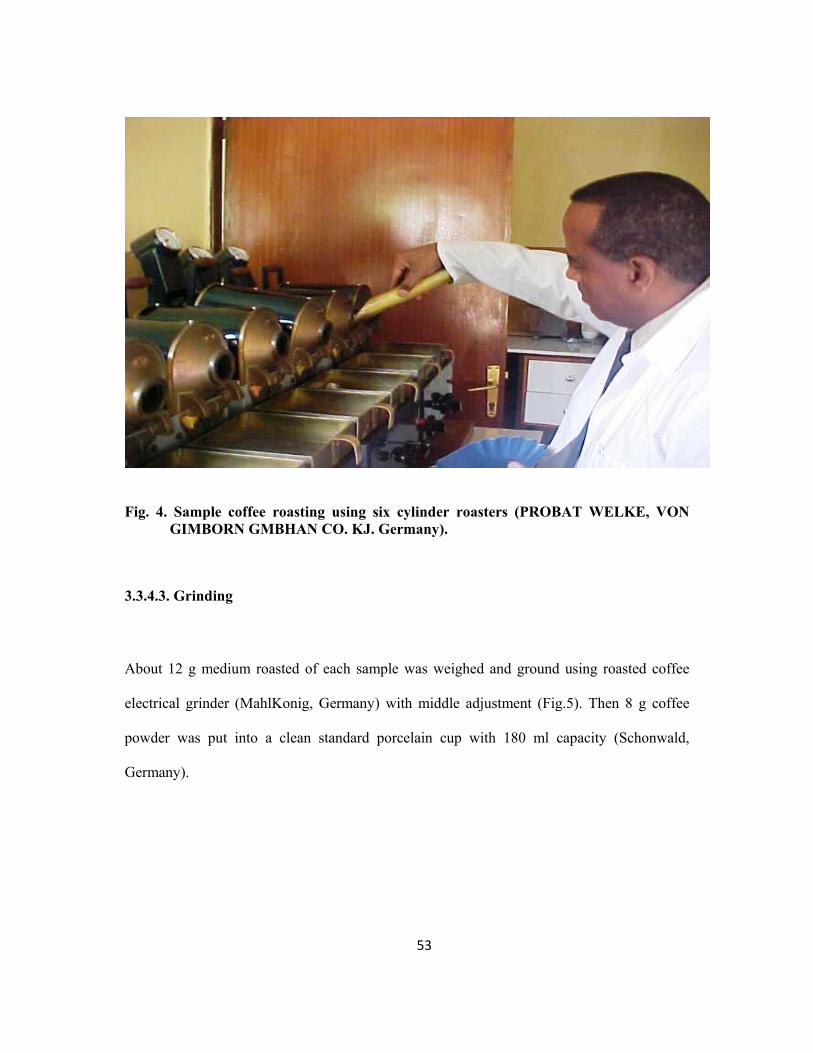
53
Fig. 4. Sample coffee roasting using six cylinder roasters (PROBAT WELKE, VON GIMBORN GMBHAN CO. KJ. Germany).
3.3.4.3. Grinding
About 12 g medium roasted of each sample was weighed and ground using roasted coffee
electrical grinder (MahlKonig, Germany) with middle adjustment (Fig.5). Then 8 g coffee
powder was put into a clean standard porcelain cup with 180 ml capacity (Schonwald,
Germany).

54
3.3.4.4. Brewing
Fresh boiled water was poured into the coffee up to about half of the cup. The ground coffee
was inspected and nosed for some undesirable smells. Then, the contents of the cup were
stirred to ensure a complete infusion of the ground coffee and the cup was filled to full
capacity with boiled water. Then, the cup was left for about three minutes, allowing the
coffee to brew. The foam was skimmed off with spoon and the cup was left to cool down to a
temperature 60oC (drinkable temperature). The brew was made ready for panelists within 8
minutes, for cup test analysis.
3.3.4.5. Cup tasting
Five cups per sample in three replications were prepared for each tasting session (Fig. 6). The
samples replicated for each sample were arranged at random. The sensory evaluation of each
sample and the cup quality was carried out by a panel of JARC three liquorers. A spoonful of
the brew was sucked with air into mouth of a taster and held at the back of the tongue
between the tongue and the roof of the mouth where the tasting glands are located. It was
held in the mouth and moved around for few (7-10) seconds for sensory evaluation, which
involved taste for cleanliness of the cup (defective cups including foul, musty, earthy,
chemical, etc.).
Cup quality evaluation consisted of raw (40%) and liquor (60%). Raw value was evaluated as
shape & make, color, and odor. Liquor was also evaluated as acidity, body and flavor. Finally

55
mean of each variable by the panel was used for statistical analysis. But, variation among
assessors for a given variable was not considered as procedures of Getu (2009). The details of
the sensorial evaluation procedure are given in Table 5 and Table 6.
Fig. 5. Sample roasted coffee bean grinding using electrical grinder (MAHLKONIG, Germany).

56
Fig. 6. Professional coffee tasters of the JARC, cupping for quality evaluation.
3.3.4.6. Grading
Green bean coffee samples evaluation and grading for both raw (40%) and liquor (60%)
quality was carried out for 32 samples following the procedures of CLU (Coffee Liquoring
Unit) (2007) as indicated in Table 4, Table 5 and Table 6. The overall standard for raw and
liquor quality grades of washed coffee range from 1 to 5, where, grade 1 = 81-100%, grade 2
= 61-80%, grade 3 = 41-60%, grade 4 = 21-40% or 1-2 defective cups, grade 5 = 20% or

57
more than 2 defect. On the other hand, the overall standard for raw and liquor quality grades
of unwashed coffee range from 1 to 5, where, grade 1 = 81-100%, grade 2 = 63-80%, grade 3
= 50-62%, grade 4 = 31-49% or 2 cups defect, grade 5 = 15-30% or more than 2 cups defect.
Besides, a standard check with known quality attributes was also included in the evaluation
for the purpose of comparison and judgment.
Table 4. Standard parameters and their respective values used for washed coffee raw quality evaluation (CLU, 2007)
Raw Value (40%)
Shape & Make Points Color Points Odor Points
Very good 15 Bluish 15 Clean 10
Good 12 Grayish 12 Trace 8
Fair/average 8 Greenish 8 Light 5
Mixed 5 Faded 5 Moderate 2
Small 2 Brownish 2 Strong 1
Grade Range: 1 = 81-100, 2 = 61-80, 3 = 41-60, 4 = 21-40 or 1-2 defective cups, 5 = 20 or more than 2 defective cups (defective cups: foul, earthy, and chemical).
Table 5. Standard parameters and their respective values used for washed coffee liquor quality evaluation (CLU, 2007)
Liquor Value (60%)
Acidity Points Body Points Flavor Points
Pointed 20 Full 20 Very good 20
Medium pointed 15 Medium Full 15 Good 15
Medium 10 Medium 10 Average 10
Light 5 Light 5 Fair 7
Lacking 2 Thin 2
Grade Range: 1 = 81-100, 2 = 61-80, 3 = 41-60, 4 = 21-40 or 1-2 defective cups, 5 = 20 or more than
2 defective cups (defective cups: foul, earthy, and chemical).
58
Table 6. Standard parameters and their respective values used for unwashed coffee raw & liquor quality evaluation (CLU, 2007)
Raw Quality (40%) Cup Quality (60%)
Defect point 30% Odor Points Acidity Points Body Points Flavour Points
Range Value 10% 20% 20% 20% V.Good Up To 70 30 Clean 10 Pointed 20 Full 20 Good 20
Good 71-90 25 Trace 8 M/Pointed 15 M/Full 15 F/Good 15
F/Good 91-120 20 Light 6 Medium 10 Medium 10 Average 10
Average 121-140 15 Moderate 4 Light 5 Light 5 Fair 5
Fair 141-160 10 Strong 2
Grade Range: 1 = 81-100%, grade 2 = 63-80%, grade 3 = 50-62%, grade 4 = 31-49% or 2 cups defect, grade 5 =15-30% or more than 2 cups defect.

59
3.3.5. Experimental design
The laboratory experiment was arranged in split-plot design in RCBD by considering the
processing method as main plot and the preparation type as sub-plot in three replications.
For each sample within a replication five cups were prepared for laboratory analysis.
Fifteen sample cups were tasted for each of the 32 samples from both preparation and
processing methods.
3.4. Statistical Analysis
3.4.1. Analysis of field survey
The data collected from the field through structured questionnaires were analyzed by
employing the statistical procedures of SPSS version 14.0 (SPSS, 2006). Using descriptive
statistics, the frequency and percentage values of variables were also computed to observe
their distribution. Pearson chi-square was also analyzed to study the relationship between
the dependent and explanatory variables. The binary logit model was used to analyze
factors which affect coffee quality and decision to adopt and practice coffee pre and post
harvest management practices (CPPHMP) by farmers.
60
Binary logistic model
There are many situations in which the response of interest is dichotomous rather than
continuous. Examples of variables that assume only two possible values are quality status
(the quality is either acceptable or unacceptable). Logistic regression can be binary or
multinomial. The binary or Binomial logistic regression is the type of regression which is
used when the dependent variable is a dichotomous and the independent variables are of
any type while Multinomial logistic regression is used when the dependent variable has
more than two categories. When multiple classes of the dependent variable can be ranked,
then ordinal logistic regression is preferred to multinomial logistic regression. Continuous
variables are not used as dependent variables in logistic regression (Hosmer and Lemshew,
1989).
Logistic regression can be used to predict a dependent variable on the basis of continuous
and/or categorical independent variables and to determine the percent of variance in the
dependent variable explained by the independent variable to rank the relative importance
of independent variables; to assess interaction effects; and to understand the impact of
covariate control variable. The logistic regression applies maximum likelihood estimation
after transforming the dependent into a logit variable (the natural log of the odds of
dependent variable occurring or not). In this way, logistic regression estimates the
probability of a certain event occurring. Note that logistic regression calculates changes in
the log odds of the dependent variable, not changes in the dependent variable itself as OLS
regression does. Hosmer and Lemshew (1989) pointed out that a logistic regression has
got advantage over others in the analysis of dichotomous outcome variables. The logistic

61
regression is also preferred from multiple regressions and discriminate analysis as it
results in a biologically meaningful interpretation, it is mathematically flexible and easily
used distribution and it requires fewer assumptions (Hosmer and Lemshew, 1989).
To accommodate this final constraint, we fit a model of the form
ee
x
x
p βα
βα
+
+
+=
1
Where p is the probability of “success”, α is the intercept of the line and β is its slope.
The expression on the right, called a logistic function, cannot yield a value that is negative
or greater than 1; consequently restricting the estimated value of p to the required range
(between 0 and 1).
Thus, modeling the probability p with logistic function is equivalent to fitting a linear
regression model in which the continuous response y has been replaced by the logarithm
of the odds of success for a dichotomous random variable.
3.4.2. Laboratory analysis
The analysis of variance (ANOVA) for the laboratory analysis was computed by using
general linear model (GLM) procedures of SAS version 9.2 (SAS Institute, 2004). Based
on the analysis of variance, statistical significance of mean square differences was
determined by Least Significance Difference (LSD) tests at 5% and 1% probability level.
Means separation using LSD were computed when the whole, subplot and interaction

62
effect found significant. Overall quality grading of the green beans for the processing
methods and preparation types were carried out by computing proportion of the green bean
physical (40%) and cup quality attributes (60%) evaluation for each sample and woreda.
The experiment was arranged in a Split-plot design by considering the method of coffee
processing as main plot and coffee preparation types as sub plots. Analysis of variance
was computed to compare the variation between wet and dry processed coffee samples and
preparation type by considering the two treatments as factor A and the two coffee
preparation type as factor B within each processing method and each treatments applied
randomly in each plot and arranged in RCBD in three replications as indicated in Table 7.
Therefore, the linear model for the split plots design is:
ετβγβγτγγτββτµ ijkijkjkikkijjiijky ++++++++= )()()()( ⎪⎩
⎪⎨
⎧
===
bkajri
,...,2,1,...,2,1,...,2,1
Where µ is the parametric mean of the population τ i , β j,and )(τβ ij
represent the
whole plot and correspond respectively to blocks (or replicates), main treatments (factor
A) and whole plot error (replicates (or blocks) XA): γ k, )(τγ ik
, and )(τβγ ijk represent
the sub plot and correspond respectively to the sub plot treatment (factor B), the replicates
or (blocks)×B and AB interaction, and the sub plot error (blocks×AB)

63
Table 7. ANOVA for split plot design
Source of variation Df SSQ MS F
Location b-1 SSQB SSQB/(b-1) MSB/MSEM
Processing type t-1 SSQTr SSQTr/(t-1) MSTR/MSEM
Error main plot (Em) (t-1)*(b-1) SSQEM SSQEM((t-1)*(b-1))
preparation type(S) s-1 SSQs SSQB/(s-1) MSs/MSEM
Sub plotsXtret(SxT) (t-1)*(s-1) SSQSXT SSQSXT/(t-1)*(s-1) MSSXT/MSEM
Error sub plot(Es) t*(b-1)*(s-1) SSQEs SSQES/( t*(b-1)*(s-1)
Total (Tol) t*b-1*s-1 SSQTOl
*where t=number of main treatment; b=number of blocks; s=number of sub plot Df =
Degree of freedom; SSQ = Sum of square; MS =Mean square; F = probability value.

64
4. RESULTS AND DISCUSSION
This study was undertaken both under field and laboratory conditions. The field survey
data were collected from respondents using structured questionnaire, while the laboratory
analysis was made using samples mentioned in the methodology part (Part 3.3.1.). Hence,
the results are separately discussed in two parts: Field survey & laboratory analysis:
4.1. Field Survey
This part is mainly concerned with the description and interpretation of information
obtained from farmers and traders.
4.1.1. Response of coffee farmers
4.1.1.1. Analysis through descriptive statistics
I. Demographic factors
In this study, some demographic parameters were collected to know their pattern of
distribution in the study areas. As indicated in Table 8, from a total of 164 respondents the
majority (96.1%) of household coffee farmers were males, whereas, the remaining were

65
females. Many evidences showed that female households have less access to improved
technologies, credit and extension service (Ellis and Mudhara, 1995). According to the
findings of Negussie et al. (2008), only 26% of the female-headed households had access
to improved coffee varieties as compared to 88% for the male-headed and 87% of the male
respondents ever used fertilizer as compared to 55% for females in survey made in
Gomma woreda. On the other hand, male-headed households have better access for
information than female households that helps for adoption of improved agricultural
technologies. Therefore, male status of household head is positively correlated with
adoption of coffee quality pre and post harvest management practices (CQPPHMP). In
terms of family size, the majority of sample farmers (92.6%) had more than four family
members, while 7.4% had less than four family members. About 17.8% of the respondents
were found in the age category of greater than 18 and less than 33 years, 43% in the age
category of greater than 33 and less than 48 years, while the remaining 39.2% were above
48 years of age (Table 8). Most of the farmers (82.2%) were found in the age category
between 33 and 48 years. The study of Senkondo et al. (2004), in Tanzania revealed that
experiences in farming were positive and significant in explaining adoption of RWH
technology.
On the other hand, in terms of labor used in coffee harvesting, the result showed that the
majority, 59.8% (98) of coffee farmers harvest their coffee by hiring daily laborers while
only 40.2% (66) respondent farmers harvested their coffee by themselves. Coffee
harvesting by daily laborers may contribute to the deterioration of coffee quality due to
careless harvesting of ripe and unripe green berry collectively.

66
In this analysis attempt was made to observe the association between adoption of pre- and
post- harvest coffee quality improving or deteriorating factors with demographic factors
such as sex, age, family size, and educational status. Chi-square test was computed and
there were no strong association observed between demographic factors and exercising
practices of coffee quality improving or deteriorating factors at less than 5% probability
level (Table 8). From the survey, it was revealed that the proportion of family headed with
male (69%) was higher than family headed with female (33%) in adopting coffee quality
improving activities. This result confirmed the prior expectation that male headed
households have more access to improved technology, updated information, credit and
extension services than female headed household. This result is consistent with other
findings. For instance, the findings of Ellis and Mudhara (1995) showed that females have
less access to any improved agricultural technologies and extension services, which
contribute to lower adoption rates. From the total sampled households, 60% (98) of coffee
farmers were literate adopting coffee quality improving factors (Table 8). The finding of
several studies (Dasgupta, 1989; Zemedu, 2004) revealed that level of education is strong
and significant determinant of farmers’ adoption of improved agricultural technologies.
Karki et al.(2004) undertook a study in a mid-hill district of Nepal to assess the impact of
foreign-aided project in technology adoption and food security and to identify factors
determining adoption of improved technology in case of small holder peasants. Their
result using binomial logit model and qualitative analysis revealed that, coefficient of
years of schooling positively influenced farmers' adoption decisions on improved
agricultural technologies. Education is very important for the farmers to understand and
interpret the information coming from any direction to them. Farmers’ education is also
pivotal for the effective work of extension personnel, because if the farmer has better

67
education status they can have a capability to understand and interpret easily the
information transferred from Development Agent (DA) to them. The finding of Ngigi
(2003) in Kobo, Ethiopia, also showed positive and significant association between
education level of the household and adopting of rain water harvest technology (RWH).
Negussie et al. (2008) reported that age, gender, family size, extension contact, attendance
of training and experience in coffee farming did not significantly influence farmers’
perception in survey made in Manna woreda.

68
Table 8. Frequency, proportion and association (chi-square) of coffee quality with demographic factors among sampled coffee farmers HHs
Independent variables
Frequency Total
%
coffee quality 2X
P-value Acceptable Un acceptable
No % No %
Sex M 297 158 96.1 109 69 49 31 .030 0.86 F 12 6 3.9 2 33 4 67
Age >48 121 64 39.2 46 28 18 11 1.234 0.54 >33 133 71 43.0 48 29 22 13 >18 55 29 17.8 19 12 11 7
Family size >4 286 152 92.6 103 63 49 30 2.17 0.14 <4 23 12 7.4 10 6 2 1
Educational status
Illiterate 271 144 88 15 9 5 3 0.457 0.50
Literate 38 20 12 98 60 46 28 Who often
harvest coffee
Daily laborer 185 98 59.8 31 19 67 41 0.044 0.83
Own family 124 66 40.2 20 12 46 28

69
II. Agronomic and physiological factors
As indicated in Table 9, among agronomic and physiological factors affecting coffee yield
and quality, age of coffee trees, pruning, weed control, disease prevalence, and application
of compost were assessed in this study. Hence, the result of the field survey showed that
among 164 coffee farmers interviewed 70.6% (116) owned old coffee trees (>20 years),
while 29.4 % (48) of them owned coffee trees less than twenty years old. This result
implies that majority of the coffee plantations in the study areas are physiologically
declining as their yield and quality might decrease as reported by Clifford (1985). Yigzaw
(2005) reported that samples from young trees are likely to be mild and thin, but fine in
flavor. Beans from old trees produced strong taste and a harsh characteristic brew.
Medium aged trees, 15 to 20 years old, bear beans with good flavor as well as acidity and
body Thus, in this study the variable is hypothesized to have inversely related with coffee
quality.
Similarly, in this survey it was observed that even though the majority of coffee
plantations in the farmers hand were greater than 20 years old, only 27.5% of respondent
coffee farmers practiced maintenance pruning. Coffee tree pruning is an extremely
important pre harvest activity for reducing incidences of diseases, modifying air
movement within the plantation, which in turn reduces leaf drying time. On top of that it
was identified that majority of coffee farmers (70.9%) and (71.2%) responded the
prevalence of disease and no application of compost in their coffee field, respectively. As
the consequence of this the quality and quantity of coffee might have decreased
considerably.
70
On the other hand, chi-square analysis indicated that there were strong association
between different agronomic and physiological factors and quality coffee production. Age
of coffee tree and disease prevalence were very strongly associated ( χ 2 = 50.20,
χ 2 = 28.70) with coffee quality at 0.1% probability level, respectively. Similarly,
agronomic factors such as coffee pruning and type of weeds prevalent in the field were
strongly associated ( χ 2 = 10.18, χ 2
= 12.97) with coffee quality at 1%
probability level, respectively. This observation was found similar with that of Yigzaw
(2005) and Wintgens (2004). Yigzaw (2005) reported that samples from young trees are
likely to be mild and thin, but fine in flavor. Beans from old trees produced strong taste
and a harsh characteristic brew. Medium aged trees, 15 to 20 years old, beans with good
flavor as well as acidity and body (Yigzaw, 2005). On the other hand, (Wintgens, 2004)
reported that disease and insect such as leaf miner and mites may also result in lower
quality beans. Moreover, compost application was associated ( χ 2 = 8.75) with coffee
quality at 5% probability level. On the contrary, mechanism of weed control was not
associated with quality in this study.

71
Table 9. Frequency, proportional distribution and association (chi-square) of coffee quality with agronomic and physiological factors among sampled coffee farmers HHs
Independent variables
Frequency Total
%
coffee quality 2X
P-value Acceptable Un acceptable
No % No %
Age of the coffee tree
>20 218 116 70.6 66 40 50 30 50.20 0.000 <20 91 48 29.4 47 29 1 1
Coffee pruning yes 85 45 27.5 20 12 25 15 10.18 0.001 no 224 119 72.5 31 19 88 54
Weed type Coach Grass 13 7 4.2 2 1 5 3 12.97
0.002 Soft weed 226 120 73.1 44 27 76 46
Both 70 37 22.7 5 3 32 19 Weed control mechanism
Slashing 269 143 87.1 46 28 97 59 0.71 0.374
Hand weeding 40 21 12.9 5 3 16 10 Compost
application yes 220 117 71.2 31 19 86 52 8.75 0.013 no 88 47 28.5 20 12 27 17
Disease observation
yes 219 116 70.9 46 28 70 43 28.70 0.000 no 90 48 28.5 5 3 43 26

72
III. Harvest and post harvest factors
As shown in Table 10, majority of the surveyed farmers were exercising better harvesting
and post-harvest management practices in terms of harvesting at full maturity stage
(75.4%), selective hand picking (61.8%), drying on wooden and bamboo made raised beds
(61.2%), and packing in jute bags (77.0%), which maintain the inherent coffee quality. On
the contrary, 51% of the interviewed farmers lacked storage facilities and 55.7% stored
their coffee for more than four months, which is considered as coffee quality deteriorating
factor. Obiero (1996) reported that storing dried parchment coffee for more than six
months resulted in woody flavor, which lowers quality. Wintgens (2004) further indicated
that green coffees stored for a longer period described as ‘aged’ may suffer a loss of their
acidity. Length and condition of bean storage also affect cup quality (Yigzaw, 2005).
Moreover, long time storage under high relative humidity and warm conditions increase
bean moisture content and consequently reduce quality in terms of raw and roasted
appearance as well as liquor (Woelore, 1995.)
Chi-square test for harvest and post harvest factors, such as mixing coffee of differently
harvested for sell, materials used for drying coffee, types of coffee packing materials used,
storage availability, revealed strong association ( χ 2 = 41.68, χ 2
= 37.64,
χ 2 = 34.39, χ 2
= 85.43) with coffee quality at 0.1% probability level. Similarly,
there was association ( χ 2 = 4.36) between storage period and coffee quality at 5%
probability level. On the other hand, method of coffee harvesting and bean maturity stage

73
at harvest were not associated with coffee quality at 5% probability level in this study.
This result could be attributed to the fact that majority of the farmers harvest their coffee
at full mature stage by selective hand picking.
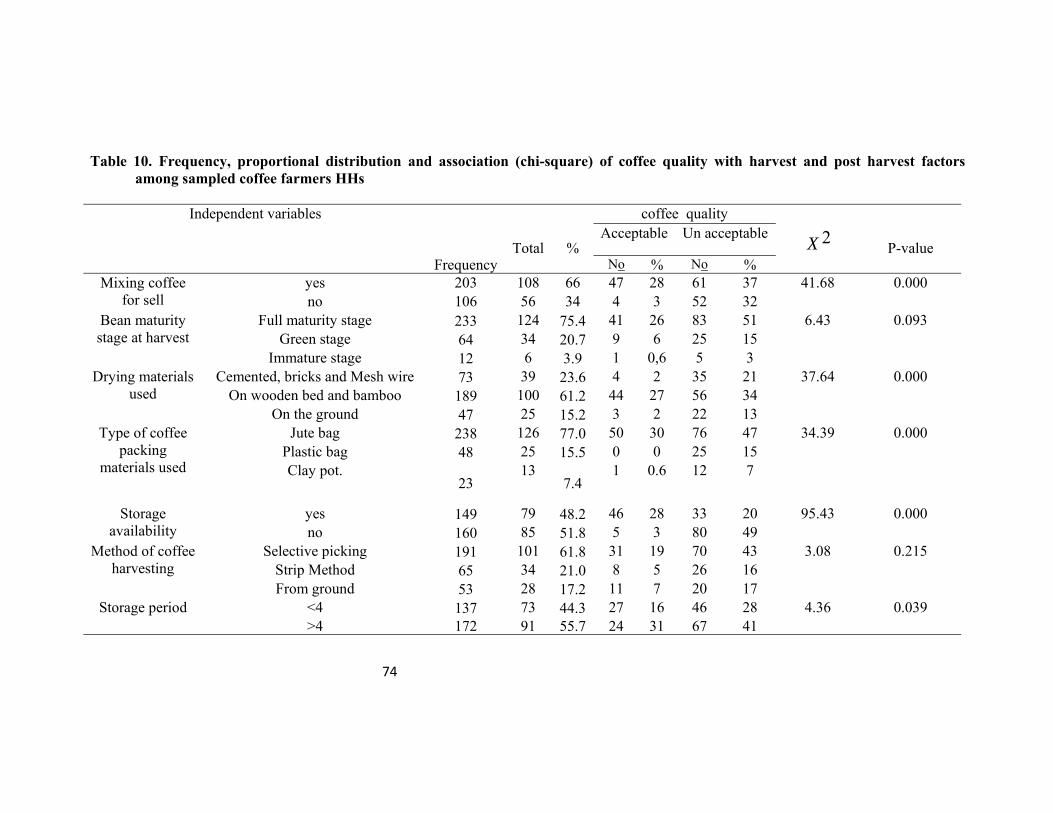
74
Table 10. Frequency, proportional distribution and association (chi-square) of coffee quality with harvest and post harvest factors among sampled coffee farmers HHs
Independent variables
Frequency
Total
%
coffee quality
2X
P-value Acceptable Un acceptable
No % No % Mixing coffee
for sell yes 203 108 66 47 28 61 37 41.68 0.000 no 106 56 34 4 3 52 32
Bean maturity stage at harvest
Full maturity stage 233 124 75.4 41 26 83 51 6.43 0.093 Green stage 64 34 20.7 9 6 25 15
Immature stage 12 6 3.9 1 0,6 5 3 Drying materials
used Cemented, bricks and Mesh wire 73 39 23.6 4 2 35 21 37.64 0.000
On wooden bed and bamboo 189 100 61.2 44 27 56 34 On the ground 47 25 15.2 3 2 22 13
Type of coffee packing
materials used
Jute bag 238 126 77.0 50 30 76 47 34.39 0.000 Plastic bag 48 25 15.5 0 0 25 15 Clay pot.
23
13 7.4
1 0.6 12 7
Storage availability
yes 149 79 48.2 46 28 33 20 95.43 0.000 no 160 85 51.8 5 3 80 49
Method of coffee harvesting
Selective picking 191 101 61.8 31 19 70 43 3.08 0.215 Strip Method 65 34 21.0 8 5 26 16 From ground 53 28 17.2 11 7 20 17
Storage period <4 137 73 44.3 27 16 46 28 4.36 0.039 >4 172 91 55.7 24 31 67 41

75
IV. Institutional factors
Descriptive statistics of the field survey study result revealed that from a total of 164
coffee farmers interviewed 14.2% (23) of them had no shortage of time, whereas, 85.8 %
(141) of them encountered shortage of time during peak coffee harvesting period (Table
11). This implies that majority of farmers are not able to harvest their own coffee on time,
probably due to other farm activities/ overlapping of operations. Furthermore, the survey
result also indicated that out of the total farmers interviewed, substantial number of
farmers (93.2 and 82.2%) were responded the provision of support (such as improved
seeds, raised coffee seedlings, etc) and training from the respective ARDO, respectively.
On the contrary, the study revealed that 77.3% of the coffee farming family suffered from
shortage of money at immature green stage of coffee, particularly, in the late month of
August and early September, whereas only 22.7% were responded differently. This might
be one of the factors that contribute to the decline in coffee quality due to premature
harvesting of coffee to ensure cash sources for their families (Table 10).
This result was in agreement with the findings of Mulugeta (1999), Elias (2005), Admasu
(2008) and Alemayehu et al. (2008). Elias (2005) reported that poor quality coffees
supplied by farmers are due to poor infrastructure and inadequacy of facilities, lack of
institutional credit and coffee production and marketing in the Gomma woreda. According
to the author lack of credit service was a problem reported by both the coffee growers
(22%) and the coffee traders (21%). Mulugeta (1999) reported that access to credit, farm
size, supplementary inputs, technical and institutional support like the extension service
determining the adoption of technologies. According to Alemayehu et al. (2008), the small

76
holding coffee farmers in particular could not be able to make use of appropriate inputs
and farm tools such as pruning shears, bowsaw and drying materials largely due to
unavailability, poor purchasing capacity and absence of appropriate credit systems. The
existence of institutions that facilitate extension services are essential for quality coffee
production. Admasu (2008) indicated about 85% and 93% of sample farmers in the
Gomma woreda respond to have faced cash shortage for the purpose of hiring labor for
coffee harvesting and weeding, respectively. Furthermore, the author reported that about
87% of sample farmers in Gomma woreda had shortage of farm tools for the purpose of
coffee production.
In this study, time constraint during harvesting and training showed very strong
association ( χ 2 = 16.85, χ 2
= 23.51) with coffee quality at 0.1% probability level,
respectively. Similarly, cash shortage and support from ARDO indicated strong
association with quality coffee production at 1% probability level (Table 11).

77
Table 11. Frequency, proportional distribution and association (chi-square) of coffee quality with institutional factors among sampled coffee farmers HHs
Total
Coffee quality 2X
P-value Acceptable Un acceptable
No % No %
Training on the last year yes 254 135 82.2 50 30 85 52 23.510 0.000 no 55 29 17.8 1 1 28 17
Cash shortage yes 239 127 77.3 46 28 81 50 11.902 0.001 no 70 37 22.7 5 3 32 19
Time constraint during harvesting
yes 265 141 14.2 50 30 91 55 16.852 0.000 no 44 23 85.8 1 1 22 14
Support from ARDO Yes 288 153 93.2 50 33 102 62 7.281 0.007 No 21 11 6.8 0 0 11 6
(Source: Computed from own survey data, 2009)
78
4.1.1.2. Binary logit regression model
The logit model was employed in this study to estimate the effects of the hypothesized
independent variables on adoption of CQPPHMP. The selection of independent variables
was begun with a careful analysis of each variable. Since the Pearson chi-square test is
asymptotically equivalent to the likelihood ratio chi-square test, it can also be used to test
the significance of univariate relationships. In univariate analysis, using Pearson chi-
square test the variables that were found to be significant in the study were ages of coffee
tree (ACT16), coffee tree pruning (CTP17), type of coffee weed (TCW19), compost
application to coffee (CA112), diseases observation in coffee farm (DOCF115), coffee
mixing during selling (CMS120), time constraint during peak harvest (TCPH122), drying
materials of coffee (DMC129), type of coffee packing materials used (TCP130), storage
availability (SA131), time of coffee storage (TCS134), cash shortage (CSH135), support
from ARDO (SARDO138), and training access of last year (TALY140) (Appendix IV).
With this regard, Degnet (1999) had summarized different empirical studies on the
association between adoption decision and factors, which influence adoption, particularly
in less developed countries into personal characteristics (such as age, education, gender,
farming experience of the head of the family), farm characteristics (availability of cash)
and supply and institutional factors (such as farmers` access to credit, agricultural
extension services, market and price of products, and access to availability of inputs).
The variables that were found significant in the chi-square were further used in the
analysis of binary Logit regression model. Fourteen independent variables that were

79
included in the model in this study were ages of coffee tree (ACT16), coffee tree pruning
(CTP17), type of coffee weed (TCW19), compost application to coffee (CA112), diseases
observation in coffee farm (DOCF115), coffee mixing during selling (CMS120), time
constraint during peak harvest (TCPH122), drying materials of coffee (DMC129), type of
coffee packing materials used (TCP130), storage availability (SA131), time of coffee
storage (TCS134), cash shortage during harvest (CSH135), support from ministry of
agriculture (SARDO138), and training access of last year (TALY140).
Interpretation of Empirical Results
The results of this study confirmed a priori expectation in that the decision to adopt or not
to adopt CQPPHMP technology was influenced by the simultaneous interaction of several
demographic, socio-economic, technical and institutional factors. Out of 14 explanatory
variables hypothesized to affect coffee quality, six were found to be statistically
significant. These factors include compost application, disease prevalence in coffee field,
mixing up of differently harvested coffee during selling, types of drying materials used,
availability of storage, and time of coffee in storage (Table 12).
Of the six significant variables, four were found to be statistically highly significant at 0.1
% probability level, while two of them were significant at 1 and 5 % probability level,
respectively. The result shows that compost application (CA112), disease prevalence in
coffee field (DOCF115), mixing up of differently harvested coffee during selling
(CMS120), drying coffee on cemented, bricks and mesh wire (DMC129), were positively
and significantly related with coffee quality, while drying coffee on ground (DMC129),
80
availability of storage (SA131), and time of coffee in storage were negatively and
significantly related with coffee quality.
The value of Pearson Chi-square test shows the overall goodness of fit of the model at less
than 1% probability level. Another measure of goodness of fit of the model is based on a
scheme that classifies the predicted value of events as one if the estimated probability of
an event is equal or greater than 0.5 and 0 otherwise. From all sample farmers, 90.6%
were correctly predicted in to either acceptable or unacceptable quality coffee categories
by the model.
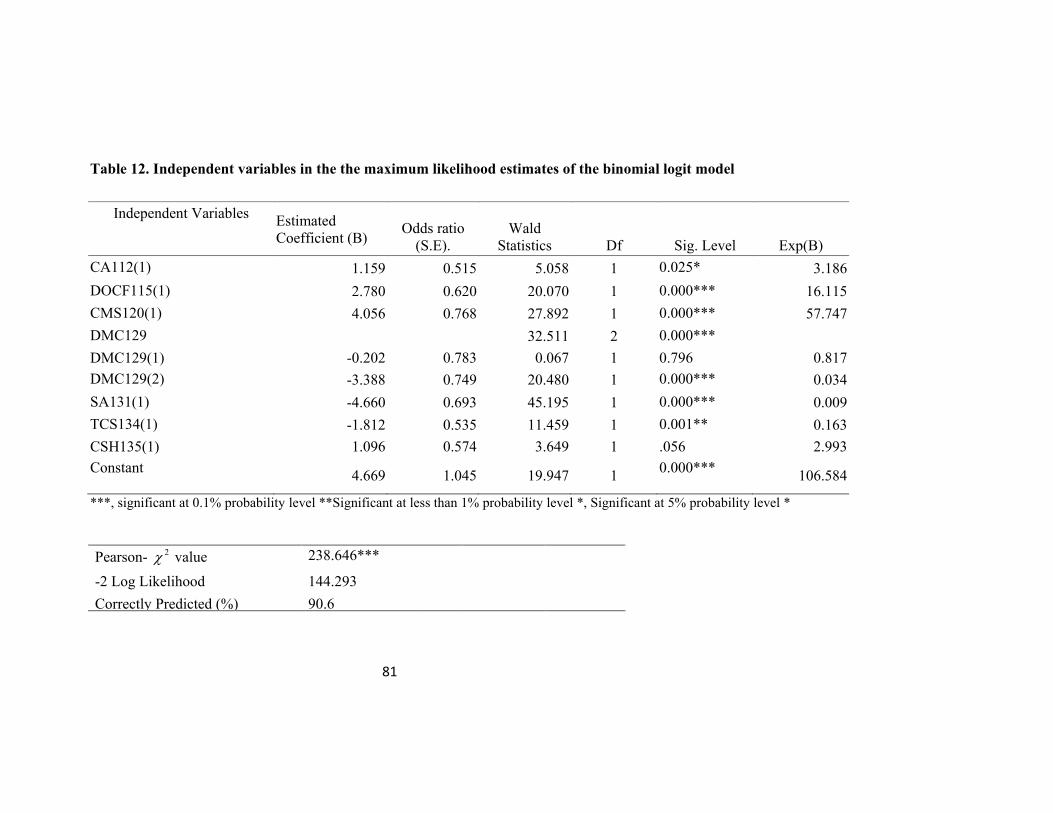
81
Table 12. Independent variables in the the maximum likelihood estimates of the binomial logit model
Independent Variables Estimated
Coefficient (B) Odds ratio (S.E).
Wald Statistics Df Sig. Level Exp(B)
CA112(1) 1.159 0.515 5.058 1 0.025* 3.186DOCF115(1) 2.780 0.620 20.070 1 0.000*** 16.115CMS120(1) 4.056 0.768 27.892 1 0.000*** 57.747DMC129 32.511 2 0.000*** DMC129(1) -0.202 0.783 0.067 1 0.796 0.817DMC129(2) -3.388 0.749 20.480 1 0.000*** 0.034SA131(1) -4.660 0.693 45.195 1 0.000*** 0.009TCS134(1) -1.812 0.535 11.459 1 0.001** 0.163CSH135(1) 1.096 0.574 3.649 1 .056 2.993Constant 4.669 1.045 19.947 1 0.000*** 106.584
***, significant at 0.1% probability level **Significant at less than 1% probability level *, Significant at 5% probability level *
Pearson- 2χ value 238.646***
-2 Log Likelihood 144.293 Correctly Predicted (%) 90.6
82
The effects of the model estimates were interpreted in relation to the significant
explanatory variables in the model as follows:
Compost application (CA112): The variable compost application in the study area
related positively and significantly (at less than 5% probability level) with maintaining
coffee quality as hypothesized earlier. The odds ratio for this variable indicate that keeping
the influences of other factors constant, the practices in favor of maintaining coffee quality
increases by a factor of 3.186 as compost application increases. Application of compost
improves the activity of micro organisms and improves macro–and micro- nutrient
availability. Compost acts as a good soil conditioner and improves the physical, chemical
and biological properties of the soil. Good growth conditions usually have a positive effect
on bean size and flavor (Wintgens, 2004). Taye (1998) reported the use of decomposed
coffee husk at a rate of 10 ton ha -1 (4 kg tree -1 on dry weight basis) was found to be
superior in terms of yield performance of coffee trees. A significant improvement in
growth and yield of mature coffees was reported in response to coffee pulp and husk
compost application (Chane, 1999). On the contrary, repeated application of elephant
grass or livestock manure resulted in an increased percentage of undesirable brown-
colored bean and, thus, poor roasting characteristics. This effect was associated with a
magnesium deficiency induced by the high potassium content of elephant grass as well as
high concentration of potassium and calcium in manure (Wintgens, 2004).
Disease observation in coffee field (DOCF115): The probability of getting farmers that
produce poor quality coffee whose coffee farms were infected with disease is 16.115 times
greater than those farmers producing acceptable quality coffee (Table 12). The disease

83
occurrence can lead to poor quality coffee that gives off and disagreeable odor Diseases
attacks can affect the cherries directly or cause them to deteriorate by debilitating the
plants, which will then produce immature or damaged fruits that affect its quality
(Wintgens, 2004). For instance, when CBD attacks the fruit in its more advanced stage of
growth causes severe damage to the crop and coffee quality (Eshetu and Girma, 2008).
Mixing up of differently harvested coffee during selling (CMS120): The odds ratio
0.768 of producing poor quality coffee indicated that keeping the influences of other
factors constant, mixing up of differently harvested coffee during selling is 57.747 times
greater than producing quality coffee. Such inferior quality is mainly due to mixing of
green, partly ripe, red and black cherries (Wintgens, 2004). Therefore, red ripe cherry
should be selectively picked from the tree to maintain the quality of the green beans.
Drying materials used (DMC129(2): The odds ratio 0.749 for this variable indicates that
keeping the influences of other factors constant, drying coffee on the ground reduces
quality of coffee 0.034 times than drying coffee on wooden and bamboo made bed. On the
other hand, the odds ratio for this variable indicates that keeping the influences of other
factors constant, drying coffee on the ground reduces quality of coffee 0.817 times than
drying coffee on cemented, bricks and mesh (Table 12). OTA (Ochratoxin A) is a form of
mycotoxin, produced as a metabolic product of Aspergillus ochraceus, A. carbonarius and
strains of A. niger reported to exist on coffee dried on bare ground (Eshetu and Girma,
2008). Therefore, drying coffee on ground can expose the product to such quality
deteriorating factor.

84
Storage availability (SA131): The odds ratio 0.693 for this variable indicates that
keeping the influences of other factors constant, farmers who had no access of storage
facilities reduces quality of coffee 0.009 times than farmers who had access of storage
facilities. Length and condition of bean storage also affect cup quality (Yigzaw, 2005). To
maintain coffee quality farmers should store their coffee for short periods of time under
cool, dry, well ventilated places protected from direct exposure to the sun and others
foreign materials.
Time of coffee in storage (TCS134): The odds ratio for this variable indicates that
keeping the influences of other factors constant, storing coffee for more than four months
reduces coffee quality 0.163 times than storing coffee for less than four months (Table
12). Obiero (1996) reported that storing dried parchment coffee for more than six months
resulted in woody flavor, which lowers quality. Wintgens (2004) further indicated that
green coffees stored for a longer period described as ‘aged’ may suffer a loss of their
acidity. Length and condition of bean storage also affect cup quality (Yigzaw, 2005). Long
time storage under high relative humidity and warm conditions increase bean moisture
content and consequently reduce quality in terms of raw and roasted appearance as well as
liquor (Woelore, 1995).

85
4.1.2. Response of coffee traders
Analysis through descriptive statistics
In the field survey study, similar to study made for farmers assessments were made for
coffee traders considering demographic, institutional and technical factors maintaining or
deteriorating coffee quality in the study areas.
Demographic factors
In terms of demographic factors out of a total of 30 sampled coffee traders the majority of
them (98.3%) (29) were male, while the remaining 1.7 % (1) were female Many evidences
showed that female households have less access to improved technologies, credit and
extension service (Ellis and Mudhara, 1995). Therefore, male status of household head is
positively correlated with adoption of coffee quality post harvest management practices
(CQPPHMP). On the other hand, the survey result showed that proportionally 21.4%,
63.2% and 15.4% sampled coffee traders were in the age group of greater than 48, 33, and
18 years old, respectively. Since substantial numbers of traders were in the age groups
between 33 and 48 years, this is probably due to their wealth accumulation through long
years of trading. Furthermore, the study also indicated that majority of sampled coffee
traders had (67.5%) greater than four family members while the rest had (32.5%) less than
four (Table 13). All demographic factors surveyed for sampled traders were not
significantly associated with the production of quality coffee at 5% probability level.
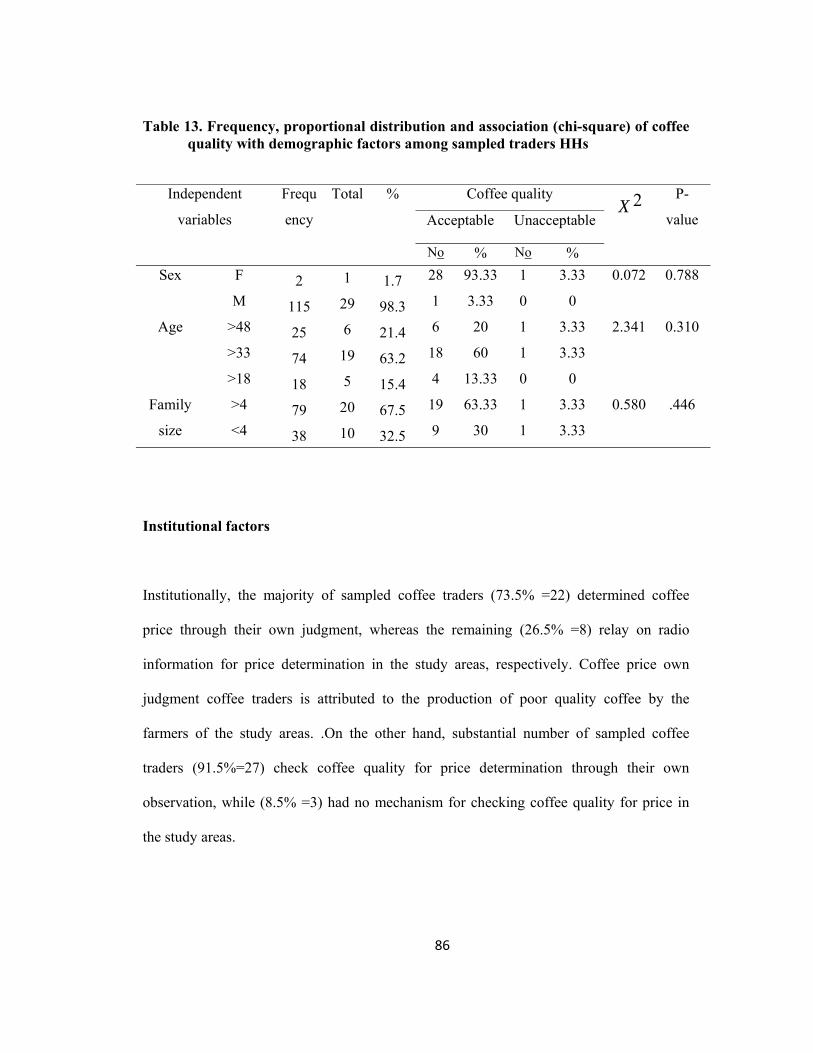
86
Table 13. Frequency, proportional distribution and association (chi-square) of coffee quality with demographic factors among sampled traders HHs
Independent
variables
Frequ
ency
Total % Coffee quality 2X
P-
value Acceptable Unacceptable
No % No % Sex F 2 1 1.7 28 93.33 1 3.33 0.072 0.788
M 115 29 98.3 1 3.33 0 0
Age >48 25 6 21.4 6 20 1 3.33 2.341 0.310
>33 74 19 63.2 18 60 1 3.33
>18 18 5 15.4 4 13.33 0 0
Family
size
>4 79 20 67.5 19 63.33 1 3.33 0.580 .446
<4 38 10 32.5 9 30 1 3.33
Institutional factors
Institutionally, the majority of sampled coffee traders (73.5% =22) determined coffee
price through their own judgment, whereas the remaining (26.5% =8) relay on radio
information for price determination in the study areas, respectively. Coffee price own
judgment coffee traders is attributed to the production of poor quality coffee by the
farmers of the study areas. .On the other hand, substantial number of sampled coffee
traders (91.5%=27) check coffee quality for price determination through their own
observation, while (8.5% =3) had no mechanism for checking coffee quality for price in
the study areas.
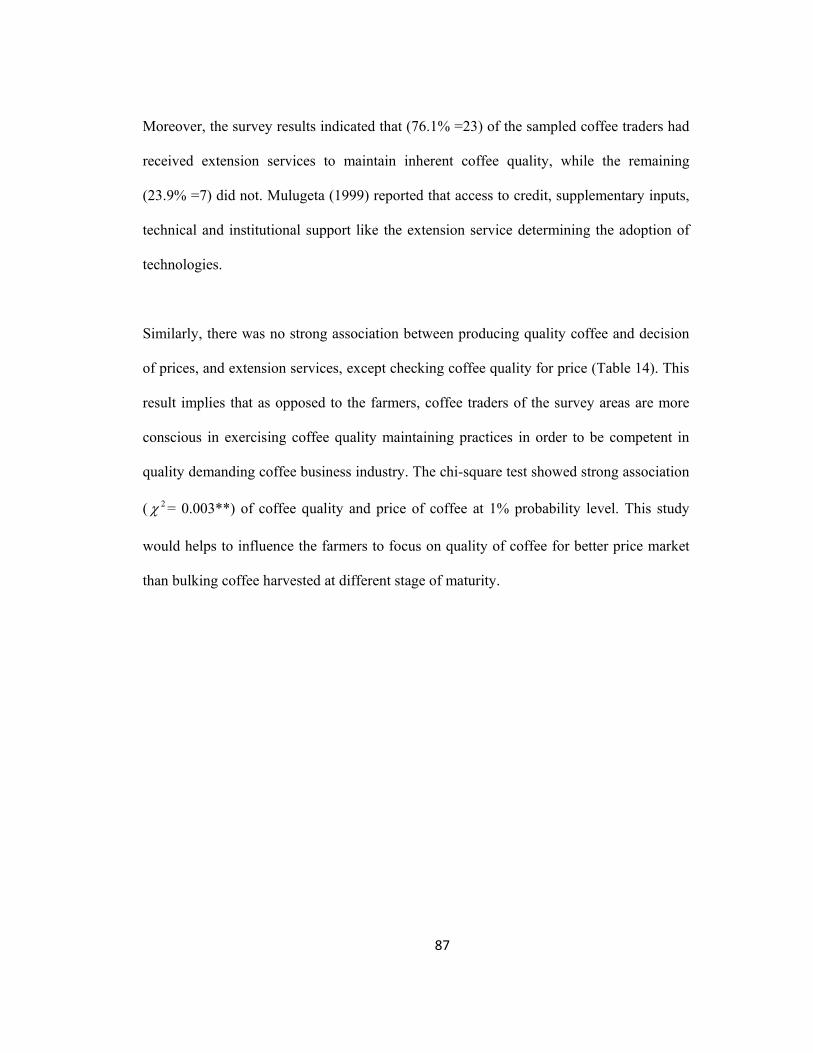
87
Moreover, the survey results indicated that (76.1% =23) of the sampled coffee traders had
received extension services to maintain inherent coffee quality, while the remaining
(23.9% =7) did not. Mulugeta (1999) reported that access to credit, supplementary inputs,
technical and institutional support like the extension service determining the adoption of
technologies.
Similarly, there was no strong association between producing quality coffee and decision
of prices, and extension services, except checking coffee quality for price (Table 14). This
result implies that as opposed to the farmers, coffee traders of the survey areas are more
conscious in exercising coffee quality maintaining practices in order to be competent in
quality demanding coffee business industry. The chi-square test showed strong association
( 2χ = 0.003**) of coffee quality and price of coffee at 1% probability level. This study
would helps to influence the farmers to focus on quality of coffee for better price market
than bulking coffee harvested at different stage of maturity.
88
Table 14. Frequency, proportional distribution and association (chi-square) of coffee quality with institutional factors among sampled
coffee traders HHs
Independent variables Frequency total % Coffee quality 2X
P-value
Acceptable Unacceptable
No % No %
Decision of price radio information 31 8 26.5 7 23 0 0 1.493 0.222
Own judgment 86 22 73.5 21 70 2 7
Checking coffee
quality for price
Through observation 107 27 91.5 26 87 1 3 9.105 0.003**
No means of checking 10 3 8.5 2 7 1 3
Extension service no 89 23 76.1 21 73 2 3 1.303 0.254
yes 28 7 23.9 7 24 0 0
(Source: Computed from own survey data, 2009)

89
Technical Factors
Similarly, the field survey results indicated that 64.1 % (19) of the sampled coffee traders
received training on maintaining inherent coffee quality, while the remaining 35.9 % (11)
did not. This may be attributed to the existence of respective ARDO in the study areas,
which is responsible for offering training on maintaining inherent coffee quality. In
addition to training offered by responsible institutions, the survey results also revealed that
42.7% (13) of coffee traders run their business by hiring business advisors. In coffee trade
industry, advisors are also pivotal for the effective work of coffee business, because if the
trader has appropriate advisor they can have a capability to understand and interpret easily
the information transferred from any source. Furthermore, 28.2 % (8) of coffee traders had
moisture tester to test moisture contents of their coffee, as opposed to 71.8% (22) of the
remaining. On the other hand, considering availability of storage facilities and type of
storage, substantial numbers (82.9%) and (89.7%) of sampled coffee traders had storage
and cemented floor type of storage, respectively. The chi-square analysis showed that
there were no strong and significant association between producing quality coffee and
training, advisors, moisture tester, storage availability and type of storage used (Table 15).
This result suggest that the majority of sampled coffee traders have better training, access
to storage and concrete type of floor storage facility that maintain the inherent quality of
coffee in the study areas.

90
Table 15. Frequency, proportional distribution and association (chi-square) of coffee quality with technical factors among sampled coffee traders HHs
Independent variables Frequency Total % Coffee quality 2X
P-
value Acceptable Unacceptable
No % No %
Training Yes 75 19 64.1 18 60 1 3.33 0.36 0.55
No 42 11 35.9 10 33.33 1 3.33
Advisor Yes 50 13 42.7 12 40 1 3 1.76 0.18
No 67 17 57.3 17 57 0 0
Moisture tester Yes 33 8 28.2 8 27 1 3 0.97 0.32
No 84 22 71.8 20 67 1 3
Storage
availability
yes 97 25 82.9 24 80 1 3 0.85 0.36
No 20 5 17.1 5 17 0 0
Type of store concrete 105 27 89.7 25 83 2 7 0.47 0.79
wooden bed 9 2 7.7 2 7 0 0
paved ground 3 1 2.6 1 3 0 0

91
4.2. Laboratory Analysis
4.2.1. Cup and bean physical quality attributes
Analysis of variance revealed that coffee sampled from different localities varied
significantly (p<0.05) for moisture content and body and highly significantly varied
(p<0.01) for shape and make in the methods of processing. This finding was in contrary
with the report of Wintgens (2004). Wintgens (2004) indicated that the shape and structure
of beans are the result of both genotype and environmental factors. On the other hand,
non–significant difference was observed for moisture content, shape and make while
variation among the samples was highly significant (p<0. 01) for body in the preparation
type. The interaction between the two processing methods and preparation types revealed
non-significant difference for moisture content, shape and make and body and, highly
significant (p<.0.01) for acidity, odor, flavor and color (Table 16).

92
Table 16. Mean squares for cup quality and bean physical quality characteristics
SV= Sources of Variation; DF=Degree of Freedom; MC = Moisture Contents; SM = Shape and Make; OD = Odor; CL = Color; AC = Acidity; BO = Body and FL = Flavor; L= Location where coffee sampled; PM=Processing Methods; PT= Preparation Types. * = significant at P<0.05 and ** = significant at P<0.01.
As indicated in Table 17, the mean separation test revealed that wet processing method
resulted in high mean values for good cup quality characters such as acidity, body and
flavor and for bean physical quality attributes, like odor, as compared to dry processing
method. However, the difference between the two processing methods was non-significant
for bean moisture content. From this result it is possible to conclude that wet processing
method is the best approach to obtain fine and typical flavor in the cup that interest
consumers according to their preference. All available evidences indicate that the liquor
characteristics have been predetermined by genetic and environmental factors prior to
processing (Brownbridge and Michael, 1971; Getu, 2009). According to Clifford (1985)
wet processed arabica is aromatic with fine acidity and some astringency, while dry
processed arabica is less aromatic and less acidic but with greater body. This result was in
agreement with Obiero (1996); Mburu (1999) and Selmar et al. (2001). Selmar et al.
(2001) reported that sensory evaluation of the roast coffees revealed that the dry and
SV DF MC SM OD CL AC BO FL
L 7 0.14 0.60 0.09 1.32 3.14 3.80 4.92
PM 1 0.35* 990.01** 1.84** 1012.73** 30.07** 19.53* 95.67**
L*PM 7 0.05 0.60 0.07 1.32 1.00 3.17 3.35
PT 1 0.18 1.68 49.20** 2** 50.85** 73.02** 95.67**
PM*PT 1 0.01 1.68 1.26** 2** 35.41** 9.03 60.53**
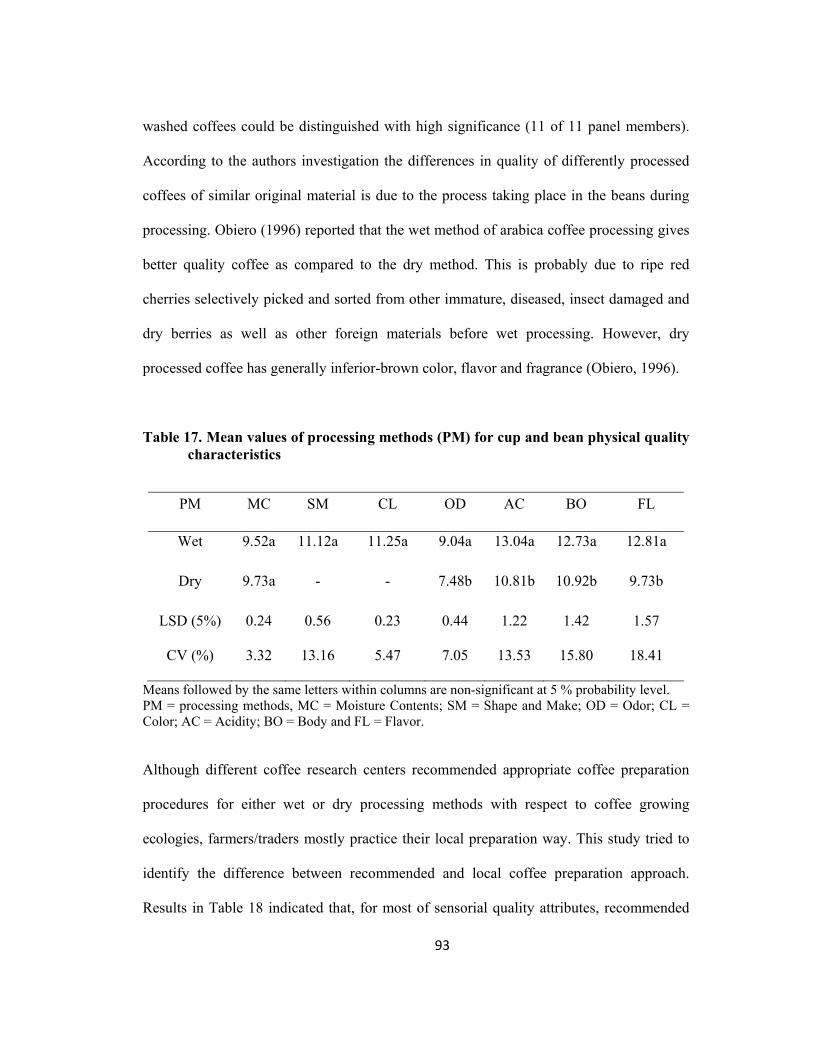
93
washed coffees could be distinguished with high significance (11 of 11 panel members).
According to the authors investigation the differences in quality of differently processed
coffees of similar original material is due to the process taking place in the beans during
processing. Obiero (1996) reported that the wet method of arabica coffee processing gives
better quality coffee as compared to the dry method. This is probably due to ripe red
cherries selectively picked and sorted from other immature, diseased, insect damaged and
dry berries as well as other foreign materials before wet processing. However, dry
processed coffee has generally inferior-brown color, flavor and fragrance (Obiero, 1996).
Table 17. Mean values of processing methods (PM) for cup and bean physical quality characteristics
PM MC SM CL OD AC BO FL
Wet 9.52a 11.12a 11.25a 9.04a 13.04a 12.73a 12.81a
Dry 9.73a - - 7.48b 10.81b 10.92b 9.73b
LSD (5%) 0.24 0.56 0.23 0.44 1.22 1.42 1.57
CV (%) 3.32 13.16 5.47 7.05 13.53 15.80 18.41
Means followed by the same letters within columns are non-significant at 5 % probability level. PM = processing methods, MC = Moisture Contents; SM = Shape and Make; OD = Odor; CL = Color; AC = Acidity; BO = Body and FL = Flavor.
Although different coffee research centers recommended appropriate coffee preparation
procedures for either wet or dry processing methods with respect to coffee growing
ecologies, farmers/traders mostly practice their local preparation way. This study tried to
identify the difference between recommended and local coffee preparation approach.
Results in Table 18 indicated that, for most of sensorial quality attributes, recommended

94
preparation procedure outsmarts local preparation method. For physical quality attributes,
preparation methods were varied only for color and odor. Nonetheless, of the processing
methods, in this study, it was observed that, recommended way of preparing coffee
promotes the typical quality profile to the final cup quality at the spot of consumer’s
choice that finally creates interest for the profile in the international coffee market.
Therefore, the two study sites represented the ignorance of using recommended coffee
processing technology that makes the areas coffee supply to be categorized under lower
quality grade. It is also possible to infer that, processing approaches are the gap to provide
typical and inherent quality profile of the area.
Table 18. Mean values of preparation type (PT) for cup and bean physical quality characteristics
Means followed by the same letters within a column are non-significant for at 5% probability level. PT = preparation type; MC = Moisture Contents; SM = Shape and Make; OD = Odor; CL = Color; AC = Acidity; BO = Body and FL = Flavor.
The interaction between factors considered in this study, showed that the combination of
wet processing method with either recommended or local (farmer/trader) way of coffee
preparation approach, ranked top for both cup and bean physical quality attributes.
Furthermore, the recommended way of dry processing approach was also comparable with
PT MC SM CL OD AC BO FL
Recommended 9.70a 5.79a 5.88a 10.04a 13.33a 13.46a 12.81a
local 9.55a 5.33a 5.38b 7.56b 10.81b 10.44b 9.35b
LSD (5%) 0.24 0.56 0.23 0.44 1.22 1.42 1.57
CV 3.32 13.16 5.47 7.05 13.53 15.8 18.41

95
the wet processing method for all of coffee quality attributes. However, local way of dry
coffee preparation approach was found to be inferior as compared to the rest combinations
for most of coffee cup quality attributes. Hence, local dry coffee preparation approach is
the main reason for lower grade value of the regions coffee quality profile as indicated in
the Table 19. In addition to this color and odor affected by wet local preparation approach.
Brownbridge and Michael (1971) have reported that the raw appearance (subsequently the
roast) improves in quality as the browning components, which are inherent in the bean,
diffuse outwards into the surrounding aqueous mass. This diffusion effect is further
facilitated under-water soaking stage following the fermentation stage. According to their
report post-fermentation soaking for 24 hours produced better raw and roast appearance of
wet processed coffee. On the contrary, Obiero, (1996) indicated that dry processed coffee
has generally inferior-brown color, flavor and fragrance. It has long been recognized by
the coffee trade that brown-colored (‘foxy’) raw beans produce inferior liquor, compared
to beans free of any such coloration (Brownbridge and Michael, 1971).

96
Table 19. Mean values of processing method and preparation type for cup and bean physical quality characteristics
PM PT MC SM CL OD AC BO FL
Wet Recommended 9.61a 11.58a 11.75a 10.08a 13.25a 13.71a 13.17a
Wet Local 9.43a 10.67b 10.75b
8.00b 12.83a 11.75a 12.46a
Dry Recommended 9.79a - - 8.75a 12.79a 13.08a 12.58a
Dry Local 9.67a - - 6.21c 8.83b 8.75b 6.88b
Means followed by the same letter within a column are non-significant at 5 % probability level. PM = processing methods; PT = preparation type; MC = Moisture Contents; SM = Shape and Make; OD = Odor; CL = Color; AC = Acidity; BO = Body and FL = Flavor.
In terms of color, it was found that the recommended wet processed coffee is significantly
better from local method (Table 19). This is probably due to lack of fermentation followed
by soaking under clean water for 24 hours that improves color of wet processed coffee.
Coffee processed in the recommended method showed superior odor than local
preparation did. Mean values for odor of both processed in recommended dry or wet way
were significantly different from the local preparation type (Table 19 and Fig. 7). But
there were no significant variations between coffees processed in the recommended dry or
wet way for odor. Brownbridge and Michael (1971) have indicated that high level of
coffee skins in fermenting coffee produces inferior raw, roast and liquor qualities
compared to skin free controls, with the liquors adversely affected by the development of
off-flavors variously described as coarse, bitter, fruity or unclean.

97
21
10.0
9.5
9.0
8.5
8.0
7.5
7.0
ProType
odor
LR
PreType
c
b
aa
Interaction Plot
Fig 7. Interaction between processing method and preparation type for odor.
L = Local preparation type; R = Recommended preparation type; 1 = wet processing method = 2= dry processing method.
On the other hand, for both processing method and preparation type no significant mean
variations observed for acidity except for dry processed coffee in local way (Table 19 and
Fig. 8).

98
21
1 4
1 3
1 2
1 1
1 0
9
P r o Ty p e
Aci
dity
LR
P r e T y p e
b
a
aa
I n te r a c t i o n P l o t
Fig. 8. Interaction between processing method and preparation type for acidity.
L = Local preparation type; R = Recommended preparation type; 1 = wet processing method = 2= dry processing method.
Similarly, for both processing method and preparation type no significant mean variation
observed for flavor except for dry processed coffee in local way (Table 19 and Fig 9).
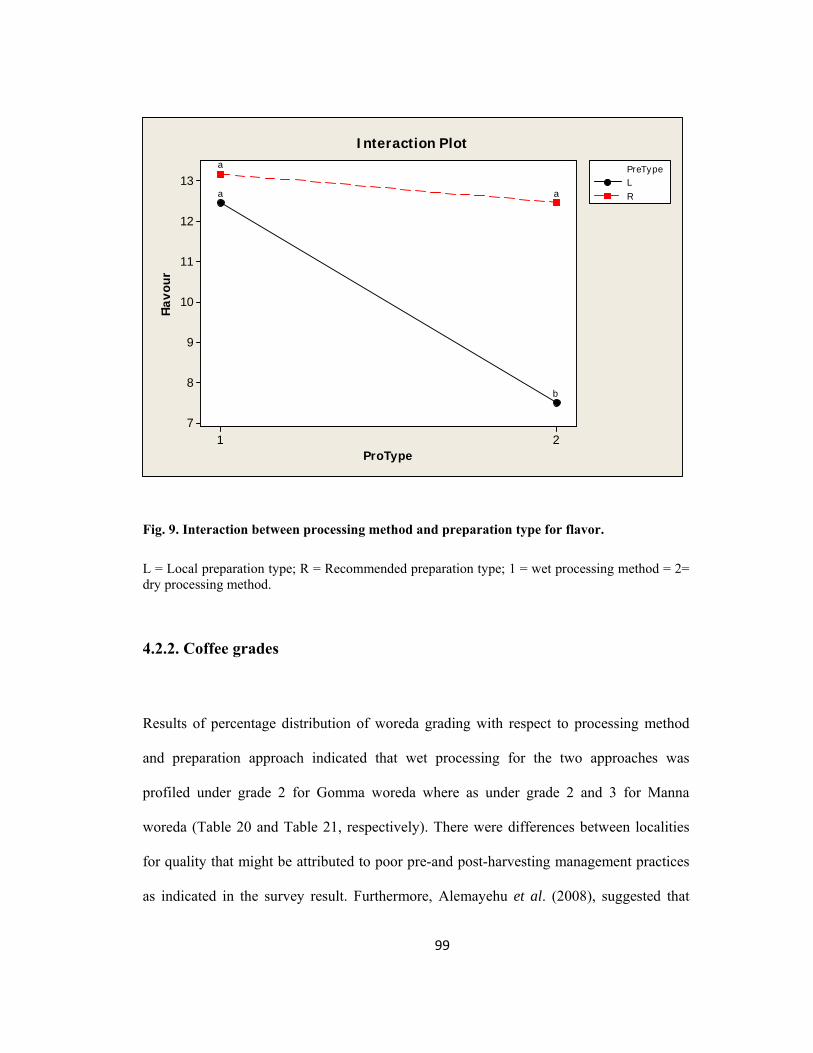
99
21
13
12
11
10
9
8
7
ProType
Flav
our
LR
PreType
b
a a
a
Interaction Plot
Fig. 9. Interaction between processing method and preparation type for flavor.
L = Local preparation type; R = Recommended preparation type; 1 = wet processing method = 2= dry processing method.
4.2.2. Coffee grades
Results of percentage distribution of woreda grading with respect to processing method
and preparation approach indicated that wet processing for the two approaches was
profiled under grade 2 for Gomma woreda where as under grade 2 and 3 for Manna
woreda (Table 20 and Table 21, respectively). There were differences between localities
for quality that might be attributed to poor pre-and post-harvesting management practices
as indicated in the survey result. Furthermore, Alemayehu et al. (2008), suggested that

100
inadequate systems of harvesting, processing, storage and transportation are responsible
for the wide spread failure to maintain the inherent quality of produced coffee in Ethiopia.
Secondly, dry processing method was affected by processing approaches. According to
this result, at Gomma woreda, local way of coffee preparation resulted in lower grade
(grade 4), which accounted for 75% of sampled materials, while the recommended
approach categorized under grade 1 (25%) and grade 2 (75%) (Table 20 and Appendix
III). With respect to Manna woreda, relatively good grade was obtained and local way of
processing accounted for 25% of grade 2 and 75% of grade 3 (Table 21 and Appendix III).
This result was in agreement with the report of Desse (2008). Desse (2008) reported that
out of Jimma coffee sent to the coffee quality inspection center laboratory from (2003-
2007), more than 60% of dry processed coffee was found to be grade 3 as compared to
80% of wet processed which grouped in to grade 2 and grade 3, this is mainly due to poor
processing of sun dried coffee. From this result it is possible to conclude that dry
processing is more sensitive to preparation approach. It is also known that high volume of
dry coffee is arriving at national auction center from Jimma zone (Desse, 2008). Thus,
special attention should be given to dry processing approach through refinement of
processing methods and provisions of, extension and training services .Generally, gap on
coffee quality management is observed between localities, and different processing
methods and approaches. Further research on pre harvest management practices and
identification of similar factors in more replicated areas would probably generate a better
recommendation.

101
Samples prepared according to the recommended way in wet preparation method showed
good physical and cup quality (2nd grade) for all sample sites, except for Gudata Bula site
in Manna woreda (Appendix III). This could be attributed to the use of red-ripe matured
cherries for sample preparation, which are selectively picked from the coffee tree,
discarding green (immature), over matured and insect damaged cherries (Wrigley, 1988).
On the contrary, samples collected from the traders store especially from Manna woreda
had inferior quality as compared to samples from Gomma woreda, for both ways of
preparation, processed by wet method (Table 20 and Table 21). Specially, locally prepared
samples scored inferior grade, which is probably due to mixed maturity and improper
fermentation (Wrigley, 1988) as indicated in Appendix III and summarized in Table 20
and Table 21. On the other hand, samples prepared according to the recommended way in
dry processing method showed good physical and cup quality for all sites, particularly for
Omo Gurede, in Gomma woreda, which scored first grade (Appendix III). The reason for
higher qualities of the samples collected from Omo Grude area might be due to its
environment, which is high land, while other samples were collected from medium
altitude ranges. This was in agreement with the report of Yigzaw (2005), who indicated
that, if other factors are kept constant, better quality coffee can be found at higher altitude,
while lowland coffees are somewhat bland, with considerable body. Moreover, coffee
from high altitude areas is more acidic, with better flavor (Yigzaw, 2005). In addition, it
has been found that beans produced at low altitude (hot and humid environment) have a
negative effect on the flavor and the structure of the fruits due to accelerated maturation
(Wintgens, 2004).
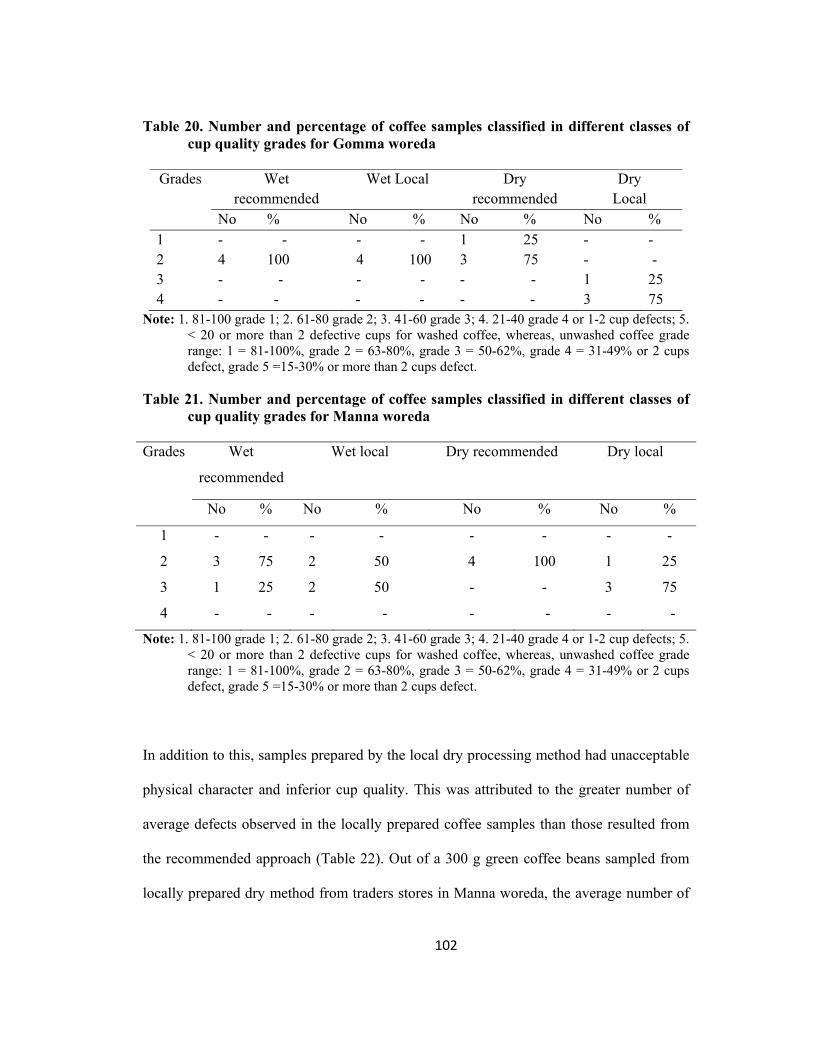
102
Table 20. Number and percentage of coffee samples classified in different classes of cup quality grades for Gomma woreda
Grades Wet
recommended Wet Local Dry
recommended Dry
Local No % No % No % No %
1 - - - - 1 25 - - 2 4 100 4 100 3 75 - - 3 - - - - - - 1 25 4 - - - - - - 3 75
Note: 1. 81-100 grade 1; 2. 61-80 grade 2; 3. 41-60 grade 3; 4. 21-40 grade 4 or 1-2 cup defects; 5. < 20 or more than 2 defective cups for washed coffee, whereas, unwashed coffee grade range: 1 = 81-100%, grade 2 = 63-80%, grade 3 = 50-62%, grade 4 = 31-49% or 2 cups defect, grade 5 =15-30% or more than 2 cups defect.
Table 21. Number and percentage of coffee samples classified in different classes of
cup quality grades for Manna woreda Grades Wet
recommended
Wet local
Dry recommended
Dry local
No % No % No % No %
1 - - - - - - - -
2 3 75 2 50 4 100 1 25
3 1 25 2 50 - - 3 75
4 - - - - - - - -
Note: 1. 81-100 grade 1; 2. 61-80 grade 2; 3. 41-60 grade 3; 4. 21-40 grade 4 or 1-2 cup defects; 5. < 20 or more than 2 defective cups for washed coffee, whereas, unwashed coffee grade range: 1 = 81-100%, grade 2 = 63-80%, grade 3 = 50-62%, grade 4 = 31-49% or 2 cups defect, grade 5 =15-30% or more than 2 cups defect.
In addition to this, samples prepared by the local dry processing method had unacceptable
physical character and inferior cup quality. This was attributed to the greater number of
average defects observed in the locally prepared coffee samples than those resulted from
the recommended approach (Table 22). Out of a 300 g green coffee beans sampled from
locally prepared dry method from traders stores in Manna woreda, the average number of

103
defects counted were 9, 8, 8, 8, 4 and 3 for foxy, pest damaged, immature, black, broken
beans and stone, respectively, as opposed to, two, each one, and, for, pest damage and
broken beans counted in recommended dry processing method (Table 22). Similarly, from
300 g sample coffee collected from local traders’ stores in Gomma woreda, the average
number of defects counted were 13, 10, 9, 11, 5 and 3, representing foxy, pest damage,
immature, black, broken beans, stone, earthy, respectively, compared to 1 broken beans
counted for recommended dry processing method (Table 22). This result was in agreement
with the report of Desse (2008). He reported that, although the inherent flavor of Jimma
coffee is pleasantly winy, some of the common cup defects are earthy, musty with
secondary cup defects of taints in the liquor, which are mainly due to post harvest
management problems. Among defects observed in this study, the major ones are black,
foxy, immature, and pest damaged beans, which have quality deteriorating effects. In most
cases black beans are associated with prolonged fermentation of cherries picked from the
ground, which then undergo a poor drying process with intermittent periods of wetting
(Wrigley, 1988). On the other hand, the foxy beans observed in locally prepared dry coffee
was probably due to in appropriate high drying temperature, prolonged drying period
extended over a long time and coffee dried on bricks floor (CLU, 2007).

104
Table 22. Mean values of defects observed in 300 g green beans of dry processed coffee prepared in recommended and local ways in both study areas (Gomma and Manna woredas)
SN
Average defects in recommended dry Average defects in locally dry
woredas Types of defect No. Types of defect No. 1 Manna Foxy Foxy 9 Pest damaged 1 Pest damaged 8 Immature Immature 8 black - black 8 broken 1 broken 4 Stone - Stone 3 earthy - earthy 2 Gomma Foxy Foxy 13 Pest damaged Pest damaged 10 Immature - Immature 9 black black 11 broken 1 broken 5 Stone - Stone 5 earthy - earthy 3
Generally, as a result of the above defects the cup test of locally prepared dry processed
coffee samples from Bashasha, Chedero and Omo Gurede sample sites were very poor
(Appendix III).
105
5. SUMMARY AND CONCLUSIONS
Arabica coffee (Coffea arabica L.) is an economically important crop, which is
contributing the highest of all export revenues in Ethiopia. Coffee being the major cash
crop of the Jimma Zone, it is produced in eight woredas, namely, Gomma, Manna, Gera,
Limmu Kossa, Limmu Seka, Seka Chokorsa, Kersa and Dedo and serves as a major means
of income for the livelihood of coffee farming families.
Despite the favorable climatic conditions, variety of local coffee types for quality
improvement and long history of coffee production in Jimma Zone, quality of the crop is
poor due to traditional and poor pre and post harvest practices, which are still used by
majority of the farmers, where the bulk of the production comes from.
Cup quality is a complex characteristic which depends on a series of factors such as
species or variety (genetic factors), environmental conditions (ecological factors),
agronomic practices (farm management), processing systems (post-harvest factors),
storage conditions, preparation of the beverage and taste/preference of the consumer.
This study was, therefore conducted in the year 2008/9 under both laboratory and field
conditions in Manna and Gomma woreda of the zone with objectives of assessing the
impact of pre-and post-harvest processing practices on the quality of both wet and dry
processed coffee, identifying the problems associated with coffee processing practices in

106
the study areas, investigating socio-economic, technical and institutional factors related to
coffee quality and drawing recommendations to alleviate the problems of the zone.
In the field survey, a total of 194 respondents (164 household farmers) were randomly
selected following sample size determination procedures of probability proportional to
size technique. Besides, 30 coffee traders were purposefully selected from the two
woredas and interviewed from November to December, 2008 to generate primary data. A
binary logit model was employed to determine factors affecting adoption of CQPPHMP
practices.
On the other hand, for the laboratory analysis a total of 32 coffee bean samples (16 from
each woreda) were prepared for organoleptic and bean physical quality characteristics at
Jimma Agricultural Research Center (JARC). The first 16 green coffee samples were
collected from the randomly selected eight PAS (8 samples from each study woreda) for
recommended wet and dry processing methods. The second 16 green coffee samples were
collected for comparison, i.e., eight from dry and another eight from wet processed coffee
for laboratory analysis from local traders store from both woredas based on the procedures
outlined by the Coffee Quality Liquoring Unit (CLU) by drawing 3 kg per 10 ton
proportion. The laboratory experiment was arranged in split plot design considering the
processing method as main plot and the preparation type as sub-plot in RCBD with three
replications.
A total of 14 explanatory variables were used for the binary logit model out of which six
variables were observed to be significant to affect the adoption of CQPPHMP practices by
107
the coffee farmers, whereas none of the explanatory variables were found to be significant
in the chi-square analysis, except checking quality for price for traders. In binary logit
regression analysis of the field survey data obtained from coffee farmers, those factors that
affect coffee quality were found to be disease prevalence in coffee fields, compost
application, mixing up of differently harvested coffee during selling, availability of
storage, drying materials and time of coffee storage.
The Laboratory analysis revealed that coffee samples from different locality varied
significantly (p<0.05) for moisture content and body as well as varied highly significantly
(p<0.01) for shape and make in the methods of processing. On the other hand, non–
significant difference was observed for moisture content, shape and make while variation
among the samples was highly significant (p<0. 01) for body in the preparation type. The
interaction between the two processing methods and preparation types revealed non-
significant difference for moisture content, shape and make and body and, highly
significant (p<.0.01) for acidity, odor, flavor and color.
Furthermore, it was revealed that wet processing method resulted in high mean values for
good cup quality (attributes like acidity, body and flavor) and bean physical quality
(attributes like odor) as compared to the dry processing method. From this result it can be
concluded that wet processing method is the best approach to obtain fine and typical
quality flavor in the cup that attract consumers according to their preference in the
international market.
108
Moreover, for most of sensorial quality attributes, recommended preparation procedure
outsmarted local preparation method. For physical quality attributes, preparation methods
were differentiated only by color and odor. Nonetheless, the processing method, in this
study indicated that recommended way of preparing coffee promotes the typical quality
profile to the final cup quality at the spot of consumers’ choice that finally creates interest
in the profile in the international coffee market. Therefore, the two study sites represented
the ignorance of using recommended coffee processing technology that makes the areas
coffee supply to be categorized under lower quality grade. It is also possible to infer that,
processing approaches are the gap to provide typical and inherent quality profile of the
area.
Of the different interaction levels of the factors considered in this study, the combination
of wet processing method with either recommended or local way of coffee preparation
approach ranked top for both cup and bean physical quality attributes.
Results of percentage distribution of woreda grading with respect to processing method
and preparation approach indicated that wet processing for the two approaches were
profiled under grade 2 for Gomma woreda but under grade 2 and 3 for Manna woreda.
There were differences between localities for quality that might be attributed to poor pre-
and post-harvesting management practices. Secondly, dry processing method was affected
by processing approaches. According to this result in Gomma woreda, local way of coffee
preparation resulted in lower grade (grade 4), which accounted for 75% of sampled
materials while the recommended approach categorized under grade 1 (25%) and grade 2
(75%) in the same woreda. With respect to Manna woreda, relatively good grading was
109
obtained where local way of processing accounted for 25% of grade 2 and 75% of grade 3.
From this result it is possible to conclude that dry processing is more sensitive to approach
of preparation. Generally, differences in coffee quality management were observed
between localities and processing methods and approaches.
According to the finding of this study, the major factors that affect the production of
quality coffee in Jimma zone were found to be pre and post harvest management practices.
Therefore, based on the major findings of the study, the following recommendations were
drawn:
1. Wet processing method should be promoted, in the zone as it exhibited high mean
values for good cup quality attributes like acidity, body and flavor and for bean physical
quality attributes like odor, as compared to dry processing method. Therefore, wet
processing method is the best approach to obtain fine and typical flavor in the cup that
attracts consumers according to their preference.
2. Although different coffee research centers recommended appropriate coffee preparation
procedures for either wet or dry processing methods with respect to coffee growing
ecologies, farmers/traders mostly practice their local preparation way. Therefore,
extension intervention could be the best possible approach to enhance awareness among
coffee producers to keep typical coffee quality profile of their garden through processing
that finally adds value to their crop.

110
3. The combination of wet processing method with either recommended (researcher) or
local (farmers/traders) way of coffee preparation ranked top for both cup and bean
physical quality attributes. Furthermore, the recommended way of dry processing
approach was also similar with the wet processing approach for most of coffee quality
attributes. Therefore, it is advisable to apply these approaches at local level. The
importance of extension intervention in the area towards improving the attitude of coffee
producing farmers/traders for quality and further refinement of the recommended
approach by researchers should also be strengthened.
4. Dry processing method was affected by processing approaches. Thus, special attention
should be given to dry processing approach through refinement of the method itself and
through extension and training. Furthermore, research on pre-and post-harvest
management practices and identification of related factors in more replicated areas would
help to come up with more conclusive recommendations.

111
6. REFERENCES
Admasu Shibru. 2008. Adoption of improved coffee production technologies in Ethiopia. In: Proceedings of A National Work Shop Four Decades of Coffee Research and Development in Ethiopia. 14-17 August 2007, EIAR, Addis Ababa, Ethiopia. pp. 357-363.
Admasu Shibru. 1998. Performance evaluation of coffee marketing in Sidama Zone. M.Sc. Thesis Submitted to Graduate Studies of Haramaya University, Haramaya, Ethiopia.
Agwanda, C.O. 1999. Flavour: an ideal selection criterion for the genetic improvement of
liquor quality in arabica coffee. In: the proceedings of 18th International Scientific Colloquium on Coffee. Helsinki, Finland. pp. 383-389.
Agwanda, C.O.,Baradat, P., Eskes, A.B., Cilas, C. and Charrier, A. 2003. Selection for
bean and liquor qualities within related hybrids of Arabica coffee in multi- local field trials. Euphytica. 131: 1-14.
Alemayehu Teshome, Esayas Kebede and Kassu Kebede. 2008. Coffee Development and
Marketing Improvement Plan. In: Proceedings of A National Work Shop Four Decades of Coffee Research and Development in Ethiopia. 14-17 August 2007, EIAR, Addis Ababa, Ethiopia. pp. 375-381.
Anthony, F. Bertrand, B.,Quiros, O., Lashermes, P., Berthaud, J. and Charrier, A. 2001. Genetic diversity of wild coffee (Coffea arabica L.) using molecular markers. Euphytica 118: 53-65.
ARDO. 2008. Annual Report of Agriculture and Rural Development Office of Gomma
woreda, for year 2007/2008, Agaro, Gomma. ARDO. 2008. Annual Report of Agriculture and Rural Development Office of Manna
woreda, for year 2007/2008, Yebbu, Manna. Barel, M. and Jacquet, M. 1994. Coffee quality: its causes, appreciation and improvement.
Plant Rech. Develop. 1:5-13.
Behailu Weldesenbet; Abrar Sualeh; Nugussie Mekonin and Solomon Indris. 2008. Coffee Processing and Quality Research in Ethiopia. In: Proceedings of a National Work Shop Four Decades of Coffee Research and Development in Ethiopia. 14-17 August 2007, EIAR, Addis Ababa, Ethiopia. pp. 307-316.

112
Behailu Weldsenbet and Solomon Endris. 2006. The Influence of Shade During Fermentation Stage of Wet Processing on the Cup Quality of Arabica Coffee 21st International Scientific Conference on Coffee science (ASIC). September 2006, Montpellier, France. pp. 549-553. 11-15
Berthaud, J. and Charrier, A. 1988. Genetic resources of Coffea. In: R.J. Clarke and R.
Macrae (Eds.), Coffee Agronomy, Elsevier Applied Science, London. pp. 1-41. Bertrand, B. , Vaast, P. , Alpizar, E. , Etienne, H. , Davrieux, F., Charmetant, P. 2006.
Comparison of bean biochemical composition and beverage quality of Arabica hybrids involving Sudanese-Ethiopian origins with traditional varieties at various elevations in Central America. Tree Physiol. 26: 1239-1248.
Bertrand, B., Etienne, H., Lashermes, P., Guyot, G. and Davrieux, F. 2005. Can near-
infrared reflectance of green coffee be used to detect introgression in Coffea
arabica cultivars J. Sci. Food Agric. 85:955-962.
Brownbridge, J.M. and Eyassu Gebregiziaber. 1968. The quality of some of main Ethiopian mild coffee. Turrialba. 18(4): 361-372.
Brownbridge, J.M. and Michael Siyum. 1971. Coffee processing research in Ethiopia. Fermentation and its effect on liquor quality, Kenya coffee August 1971.
Carvalho, A. 1988. Principles and practices of coffee plant breeding for productivity and quality factors: Coffea arabica. In: R.J. Clarke and R. Macrae (Eds.), Coffee Agronomy, pp. 129-165. Elsevier Applied Science, London.
CFC (Common Fund for Commodities). 2004. Improving coffee quality in east and central
Africa through enhanced Processing practices; A (CFC/ICO/22) Project for Rwanda and Ethiopia, Final Appraisal Report. The Netherlands, Amsterdam. pp. 10-11.
Chane Abate. 1999. Management of coffee processing by-products for improved & sustainable coffee production in Ethiopia, PhD Dissertation, University of Giessen, Germany.
Chifra, W.,Wolde-Tekle, N. and Tadesse, G. 1998. The excellence of Ethiopian coffee and the quality control mechanisms in place. Kaffa Coffee. 1: 36-40.
Clifford, MN. 1985. Chemical and physical aspects of green coffee and coffee products.
In: Clifford, M.N. and Willson, K.C (eds.), Coffee: Botany, Biochemistry and Production of Beans and Beverage. Croom Helm, London. pp. 305-374.

113
CLU. 2007. Training manual for trainee coffee cuppers, coffee quality inspection and
auction center, Addis Ababa Ethiopia, June, 2007. Cochran, W.G. 1977. Sampling Techniques. New York, John Wiley and Sons. Inc.
Coste, R. 1992. Coffee: the plant and the product. Macmillan, Hong Kong.
Dalla Rosa, M., Barbanti, D. and Lerici, C. R. 1990. Changes in Coffee brew in relation to storage temperature. Sci. Food Agric. 50: 227-235.
Damanu Tullu. 2008. Coffee production and marketing in Oromia Regional State. In:
Proceedings of a National Work Shop Four Decades of Coffee Research and Development in Ethiopia. 14-17 August 2007, EIAR, Addis Ababa, Ethiopia. pp. 382-389.
Dasgupta Satadal. 1989. Diffusion of Agricultural Innovations in Village India. Wiley Eastern Limited, New Delhi.
Decasy, F., Avelino, J., Guyot, B., Perriot, JI., Pineda, C., Cilas, C. 2003. Quality of different Honduran coffees in relation to several environments. J. Food Sci. 68:2356-2361.
Degenet Abebaw. 1999. Determinants of Adoption of High Yielding Varieties of Maize in Jimma Zone: The case of Manna and Kersa woreda. On M.Sc Thesis Presented to the School of Graduate Studies of Haramaya University.
Desse Nure. 2008. Mapping quality profile of Ethiopian coffee by origin. In: Proceedings
of a National Work Shop Four Decades of Coffee Research and Development in Ethiopia. 14-17 August 2007, EIAR, Addis Ababa, Ethiopia. pp. 328-333.
ECX. 2009. Coffee grading procedure. Quality control unit, Ethiopia Commodity
Exchange, Addis Ababa, Ethiopia. p.12.
EEA. 2001. Annual report on Ethiopian economy. 1999/2000, EEA, Addis Ababa, Ethiopia.
Elias Abebe. 2005. Economics of coffee bean marketing; a case study of Gomma woreda
in Jimma zone of Ethiopia. M.Sc. Thesis Submitted To Graduate Studies of Haramaya University, Haramaya, Ethiopia.

114
Ellis, J. and Mudhara, M. 1995. Factors Affecting the Adoption of Soil and Water Conservation Technologies in Semi-arid Zimbabwe. Bedford, United Kingdom, Silsoe Research Institute. pp. 115-175.
Endale Asfaw. 2008. Physical quality standards and grading systems of Ethiopian coffee in demand and supply chain. In: Proceedings of a National Work Shop Four Decades of Coffee Research and Development in Ethiopia. 14-17 August 2007, EIAR, Addis Ababa, Ethiopia. pp. 328-334.
Endale Taye, Behailu Weledesenbet, Bayetta Bellachew and Fabrice Davrieux. 2008.
Effects of genotypes and fruit maturity stage on caffeine and other biochemical constituents of arabica coffee. In: Proceedings of a National Work Shop Four Decades of Coffee Research and Development in Ethiopia. 14-17 August 2007, EIAR, Addis Ababa, Ethiopia. pp. 169-172
Eshetu Derso and Girma adugna. 2008. Management of moulds and mycotoxin contamination in coffee. In: Proceedings of a National Work Shop Four Decades of Coffee Research and Development in Ethiopia. 14-17 August 2007, EIAR, Addis Ababa, Ethiopia. pp. 271-278
FAO, 1968. FAO coffee mission to Ethiopian 1964 –1965. Food and Agriculture Organization of the United Nations, Rome.
FAO/WFP. 2008. Special report FAO/WFP crop and food supply assessment mission to Ethiopia, 24 January 2008.
Gari Duguma. 2002. Financial performance of dry coffee processing in Oromia region,
M.Sc. Thesis Submitted to Graduate Studies of Haramaya University, Haramaya, Ethiopia.
Getu Bekele. 2009. Genotype x environment interaction of arabica coffee (coffea arabica L.) for bean biochemical composition and organoleptic quality characteristics. M.Sc. Thesis Submitted to Graduate Studies of Haramaya University, Haramaya, Ethiopia.
Harding, P.E., Bleeker, P. and Freyne, D.F. 1987. Land suitability evaluation for rain fed arabica coffee production: Western Highlands Province, Papua New Guinea. Coffee Res. Rep. 4. Coffee Industry Corporation. p.39
Hosmer, D., and Lemeshew, S. 1989. Applied Logistic Regression. A Wiley-Inter Science
Publication. New York.
115
IPMS. 2007. Improving productivity and marketing success of Ethiopian farmers project Gomma Pilot Learning woreda Diagnosis and program Design. www.ipmsethiopia.org/content/files/Documents/PLS-DPD/goma.pdf. (Accessed: June, 2008).
ISO. 2004a. International Standard ISO 9116: Green coffee-Guidelines on methods of specification, International Standard organization.
ISO. 2004b. International Standard ISO 10470: Green coffee-Defect reference chart. International Standard organization.
ISO. 2000. International Standard ISO 9000: Quality management systems Fundamentals
and vocabulary.
ISO. 1991. International Standard ISO 4150: Available at: http://www.iso.org
ICO. 2004. All about coffee. http://www.ico.org/aico/wwd.htm.
ICO. 2002. Coffee quality – Improvement programme – Implementation, ICO Resolution No. 407, 1 February 2002.
ITC. 2002. Coffee An exporter's guide. International Trade Centre UNCTAD/WTO. Geneva. pp. 243-289.
ITC. 2004. Bitter or better future for coffee producers? International Trade Centre. The
magazine of the International Trade Centre. 2: 9-13. Jacquet, M., Getinet Kelekle, Legesse Seyoum and Teshome Menjour. 2008. Coffee sector
strategy on production, productivity, quality and marketing sector final report volume IV. Coffee Improvement Program IV, September, 2008, Addis Ababa, Ethiopia.
JZARDO. 2008. Jimma Zone Agricultural and Rural Development Office. Annual Report
for year 2007/08, Jimma.
Karki Lila; Bauer, K. and Siegfried, F. 2004. Technology adoption and impact of project intervention: A case of smallholder peasants in Nepal. Paper presented in the Deutscher Tropentag, 5 - 7 October 2004, Humboldt-University, Berlin, Germany.
Leroy, T. Ribeyre, F. Bertrand, B. Charmetant, P. Dufour, M. Montagnon, C. Marraccini,
P. and Pot, D. 2006. Genetics of coffee quality. Braz. J. Plant Physiol. 18 (1): 229-242.

116
Lingle, Ted R. 2001. The Coffee Cupper's Handbook: Systematic Guide to the Sensory Evaluation of Coffee's Flavor, 3rd edition, Specialty Coffee Association of America, Long Beach, California.
Mayne, R., Tola, A. and Kebede, G. 2002. Crisis in the birth place of coffee, Oxfam International research paper, Oxfam International.
Mburu, J. K. 1999. Notes on coffee processing procedures and their influence on quality.
Kenya coffee. 64 (750): 2861-2867.
Mitchell, H.W. 1988. Cultivation and harvesting of the arabica coffee tree. In: Clarke, R.J.
and Macrae, R. (Eds.), Coffee Agronomy, Elsevier Applied Science, London. pp.
43-90.
Moreno, G., Moreno, E. and Cadena, G. 1995. Bean characteristics and cup quality of the
Colombian variety (Coffea arabica) as judged by international tasting panels. In: the proceedings of the 16th International Scientific Colloquium on Coffee. Kyoto, Japan. pp. 574-583.
Mulugeta Enki. 1999. Determinants of adoption of soil conservation practices in centeral highlands of Ethiopia: the case of three weredas of selale.MS.c. thesis, Haramaya University.
Muschler, R.G. 2001. Shade improves coffee quality in a sub-optimal coffee zone of Costa Rica. Agro forestry systems. 51: 131-139.
Ngigi, N., Stephen. 2003. Rainwater Harvesting for Improved Food Security. Nairobi,
Kenya. pp. 213-234. Negussie Efa, Derese Teshome, Berhanu Megersa and Getachew Woldemichael. 2008.
Research center-based extension interventions on improved coffee technologies. In: Proceedings of a National Work Shop Four Decades of Coffee Research and Development in Ethiopia. 14-17 August 2007, EIAR, Addis Ababa, Ethiopia. pp. 345-356.
Obiero, S. 1996. Better coffee farming, coffee processing. Kenya Coffee. 61(716): 2231-2234.
ORG (Oromia Regional Government). 2003. Gomma district based development program: project document. Oromia economic study project office. Addis Ababa, Ethiopia.

117
Owuor, O.J.B. 1988. An assessment of the cup quality of the new disease resistant C. arabica cultivar Ruiru 11 in Kenya. Acta Horticulture. 224: 383-388.
Paulos Dubale and Tesfaye Shimber. 2000. Some ecological parameters occurring in the major coffee growing areas of south western and southern Ethiopia. In: Proceedings of the workshop on control of Coffee Berry Disease in Ethiopia. August 13-15 1999, EARO, AddisAbaba, Ethiopia. pp. 107-123.
Petracco, M. 2000. Organoleptic properties of Espresso coffee as influenced by coffee botanical varieties. In: Sera, T.; Soccol, C.R., Pandey, A. and Roussos, S. (Eds.), Coffee Biotechnology and Quality,. Kluwer academic Publishers, Dordrecht. pp. 347-355.
Prodolliet, J. 2005. Coffee Quality Assurance: Current Tools and Perspectives. In: 20th
International Scientific Colloquium on Coffee. Bangalore. pp. 120-145.
QSAE (Quality and Standards Authority of Ethiopia). 2000. Training manual on introduction to ISO 9000: Quality management system, QSAE, Addis Ababa, Ethiopia.
SAS (Statistical Analysis System). 2004. SAS user’s guide: statistics, 5th ed, Statistical Analysis System Software. Version 9.2. SAS Inst., Cary, NC.
Selmar, D., Bytof, G. and Knopp, S-E. 2001. New aspects of coffee processing: the relation between seed germination and coffee quality. In: 19th International Coffee Science Conference, ASIC, Trieste (CD-ROM)
Selvakumar, M. and Sreenivasan, M.S. 1989. Studies on morphology and quality of
Ethiopian arabica coffee. Journal of Plantation Crops. 16: 321-324. Senkondo, E., Mdoe, Y., Hatibu, N., Mahoo, H. and Gowing, J. 2004. Factors affecting
the adoption of rainwater harvesting technologies in western pare lowlands of Tanzania. Tanzania Journal for Agricultural Science 1 (1): Sokoine University of Agriculture. Tanzania.
Silva, EA.,Mazzafera, P., Brunini, O., Sakai, E., Arruda, FB.,Mattoso, LHC., Carvalho,
CRL. and Pires, RCM. 2005. The influence of water management and environmental conditions of the chemical composition and beverage quality of coffee beans. Braz. J. Plant Physiol. 17:229-238.

118
Solomon Endris and Behailu Weldsenbet. 2006. The quality of arabica coffee influenced by depth of Parching and Covering Period during drying. 21st International Scientific Conference on Coffee science (ASIC). 11-15 September 2006, Montpellier, France. pp. 544-548.
SPSS. 2006. Statistical support Algorithms http://support.spss.com/student/Documentation/algorithims/14.0/logesticregration.pdf
Tadesse Woldemariam; Manfred Denich; Demel Teketay and Vlek, P.L.G. 2002. Human impacts on Coffea arabica L. genetic pools in Ethiopia and the need for its in situ conservation. In: Engels, J.M.M. Rao, V.R. Brown, A.H.D. and Jackson, M.T. (Eds.), Managing Plant Genetic Diversity. AB International/IPGRI, Rome. pp. 237-247.
Taye Kufa. 1998. Response of arabica coffee (C. arabica L.) to various soil fertility
management. M.Sc. Thesis Submitted to Graduate Studies of Haramaya University, Haramaya, Ethiopia. ‘
Vaast, P., Bertrand, B., Perriot, JJ.,Guyot, B., Génard, M. 2006. Fruit thinning and shade
influence bean characteristics and beverage quality of C. arabica in optimal conditions. J. Sci. Food. Agric. 86: 197-204.
Van der Vossen, H.A.M. 1985. Coffee selection and breeding. In: Clifford, M.N. and
Willson, K.C (eds.), Coffee: Botany, Biochemistry and Production of Beans and Beverage. Croom Helm, London. pp. 49-96.
Walyaro, D.J.A. 1983. Considerations in breeding for improved yield and quality in
arabica coffee (C. arabica L.). A PhD thesis, Wageningen Agricultural University.
Wintgens, J.N. 2004. Coffee: Growing, Processing, Sustainable Production. A guide book for growers, processors, traders and researchers. Weinheim.
Wolde Michael, W. 1996. The effect of different methods of fermentation under different
environmental condition. IAR, National Coffee Research center, Jimma Progress Report for the period of 1991, Jimma, Ethiopia.
Woelore, W.M. 1995. Parchment arabica coffee storage. In: the proceedings of the 16th
International Scientific Colloquium on Coffee, Kyoto, Japan. pp. 565-573. Woelore, W.M. 1993. Optimum fermentation protocols for arabica coffee under Ethiopian
conditions. In: the proceedings of the 15th International Scientific Colloquium on Coffee, 6-11 June 1993.ASIC, Montpellier, France. pp. 727-733.

119
Workafes Woldetsadik and Kassu Kebede. 2000. Coffee production system in Ethiopia. In: Proceedings of Work Shop on Control of Coffee Berry Disease in Ethiopia. 13-15th August 1999, EARO, Addis Ababa, Ethiopia. pp. 99-106.
Wrigley, G. 1988. Coffee. Tropical Agricultural Series. Longman scientific and Technical,
Longman group UK Limited, England.
Yilma Yemaneberhan. 1998. Coffee production in Ethiopia. Kaffa Coffee 1: 31-35.
Yigzaw Dessalegn. 2005. Assessment of cup quality, morphological, biochemical and molecular diversity of C. arabica L. genotypes of Ethiopia. PhD thesis, University Free State. p. 97
Zemedu Worku. 2004. Socio-economic facts that limit food production in Ethiopia.
Bulletin of Forum for Social Studies. 2(1): 9-14.
120
7. APPENDICES

121
7.1. Tables
Appendix I. Dry processed coffee green bean raw evaluation parameters for defect count rating system as the procedures of CLU (2007)
Defect type Rate Defect point 1. Immature 5x1 1 2. Pest damaged 5x1 1 3. Foxy 5x1 1 4. Broken 10x1 1 5. Black 1x1 1 6. White 1x1 1 7. Pod 1x1 1 8. Husk Depends on size 1 9. Stick Big 10 Medium 5 Small 3 10. Stone Big 10 Medium 5 Small 3 11.Wanza 1x10 10 12. Earth (soil) Big 10 Medium 5 Small 3 13.Soil beans 5x1 1 Source : CLU (2007)

122
Appendix II. ANOVA for cup quality and green bean physical characteristics of 32 C. arabica samples
Parameters SV Df SS MS F P-value
MC Pa 7 1.01 0.14 1.41 0.27 Protype 1 0.35 0.35* 6.75 0.04 Pa *protyp 7 0.37 0.05 0.51 0.81 Pretyp 1 0.18 0.18 1.79 0.23 Protyp*pretyp 1 0.01 0.01 0.07 0. 80 SS Pa 7 22.44 3.21 2.18 0.10 Protype 1 14.65 14.65* 7.35 0.03 Pa *protyp 7 13.95 1.99 1.35 0.30 Pretyp 1 1.26 1.26 0.86 0.37 Protyp*pretyp 1 9.74 9.74* 6.61 0.02 SM Pa 7 4.21 0.60 1.12 0.40 Protype 1 990.01 990.01** 1647.56 <.0001 Pa *protyp 7 4.21 0.60 1,12 0.40 Pretyp 1 1.68 1.68 3.13 0.10 Protyp*pretyp 1 1.68 1.68 3,13 0.10 OD Pa 7 0.61 0.09 1.13 0.40 Protype 1 1.84 1.84** 27.48 0.001 Pa *protyp 7 0.47 0.07 0.87 0.55 Pretyp 1 49.20 49.20** 639.37 <.0001 Protyp*pretyp 1 1.26 1.26** 16.32 0.001 CL Pa 7 31.04 4.35 1.87 0.150 Protype 1 816.69 816.69** 345.06 <.0001 Pa *protyp 7 37.40 5.34 2.26 0.09 Pretyp 1 182.12 182.12** 76.95 <.0001 Protyp*pretyp 1 113.78 113.78** 48.07 <.0001 AC Pa 7 21.98 3.14 1.05 0.44 Protype 1 30.07 30.07** 10.04 0.001 Pa *protyp 7 7.01 1.00 0.33 0.93 BO Pa 7 26.61 3.80 1.23 0.35 Protype 1 19.53 19.53* 6.17 0.04 Pa *protyp 7 22.16 3.17 1.02 0.46 Pretyp 1 73.02 73.02** 23.63 0.0003 Protyp*pretyp 1 9.03 9.03 2.92 0.11 FL Pa 7 34.45 4.92 1.01 0.47 Protype 1 95.67 95.67** 28.59 0.0001 Pa *protyp 7 23.42 3.35 0.68 0.68 Pretyp 1 95.67 95.67** 19.57 0.0006 Protyp*pretyp 1 60.53 60.53** 12.38 0.0034 *, ** significant at probability level less than 5 and 1%, respectively. MC = Moisture Contents; SS = Screen Size; SM = Shape and Make; OD = Odor; CL = Color; AC = Acidity; BO = Body and FL = Flavor; SV=Source of variation; SS=Sum square, MS=mean square.

123
Appendix III. Cup quality and green bean physical characteristics evaluation of 32 C. arabica samples for grading
Number in parenthesis indicate weight of total score of sample parameters measured; DC=defect count SM = Shape and Make; OD = Odor; CL = Color; AC = Acidity; BO = Body and FL = Flavor.
Location Sample codes
Raw quality Cup quality
SM(15) CL (15)
OD(10) DC(30) AC(20) BD(20) FL(20) Overall quality
G omma Brw1 12(15) 12(15) 10(10) 15(20) 15(20) 10+(20) 2nd
G omma Chrw2 12(15) 12(15) 10(10) 15(20) 15(20) 10+(20) 2nd
G omma Ogrw3 12(15) 12(15) 10(10) 15(20) 15(20) 15(20) 2nd
G omma Yrw4 12(15) 12(15) 10(10) 10+(20) 10+(20) 10+(20) 2nd
Manna Drw5 12(15) 12−(15) 10(10) 15−(20) 10+(20) 10+(20) 2nd
Manna Gbrw6 8+(15) 12−(15) 10(10) 10+(20) 10+(20) 10+(20) 3rd
Manna Hrw7 8+(15) 8+(15) 10(10) 10+(20) 15(20) 15(20) 2nd
Manna Htrw8 12+(15) 12+(15) 10(10) 15(20) 10+(20) 15(20) 2nd
G omma Bruw9 10(10) 25(30) 10+(20) 15(20) 10+(20) 2nd
G omma Chruw 10 10(10) 25(30) 10+(20) 10(20) 10+(20) 2nd
G omma Ogruw11 10(10) 25(30) 15(20) 15(20) 15(20) 1st
G omma Yruw12 10(10) 25(30) 15−(20) 15−(20) 15−(20) 2nd
Manna Druw13 10(10) 25(30) 10+(20) 10(20) 10(20) 2nd
Manna Gbruw14 10(10) 25(30) 10+(20) 10(20) 10(20) 2nd
Manna Hruw15 10(10) 25(30) 10+(20) 10+(20) 10(20) 2nd
Manna Htruw 16 10(10) 25(30) 15(20) 15(20) 15(20) 2nd
G omma Blw17 12(15) 8(15) 8 (10) 10+(20) 10+(20) 10+(20) 2nd
G omma Chlw18 8+(15) 12(15) 8 (10) 10+(20) 10+(20) 10(20) 2nd
G omma Oglw19 12− (15) 8+(15) 8(10) 8(10) 10+(20) 15(20) 2nd
Manna Dlw21 8+(15) 8+(15) 8(10) 8(20) 10(20) 15(20) 3rd
Manna Gblw22 12− (15) 8+(15) 8(10) 15−(20) 10+(20) 15−(20) 2nd
Manna Hlw23 8+(15) 8+(15) 8(10) 10(20) 10(20) 10−( (20) 3rd
Manna Htlw24 8+(15) 12(15) 8(10) 8(20) 15(20) 15−(20) 2nd
Gomma Bluw25 6+(10) 15(30) 10−(20) 10(20) 5(20) 4th
Gomma Chluw26 8(10) 25(30) 10−(20) 10−( (20) 5(20) 4th
Gomma Ogluw27 6+(10) 15(30) 10−(20) 10(20) 5(20) 4th
Gomma Yluw28 6+(10) 15−(30) 10−(20) 5 (20) 5(20) 3rd
Manna Dluw29 10(10) 25+(30) 10+(20) 10+(20) 10+(20) 2nd
Manna Gbluw30 6+(10) 20−(30) 10(20) 10(20) 5(20) 3rd
Manna Hluw31 6+(10) 20+(30) 10+(20) 10(20) 10−( (20) 3rd
Manna Htluw32 6+(10) 20+(30) 10(20) 10+(20) 10(20) 3rd

124
Appendix IV. Variables included in multivariate binary logit regression analysis for farmers
Categorical Variables Codlings
Frequency Parameter coding (1) (2) Type of coffee bags used Jute bag 238 1.000 0.000
Plastic bag 48 0.000 1.000 clay pot 23 0.000 0.000
Where do you dry your coffee Cemented, bricks and Mesh wire
73 1.000 0.000
On wooden bed and bamboo 189 0.000 1.000
On ground 47 0.000 0.000 Training on the last year Yes 254 1.000
No 55 0.000 Age of the coffee tree <20 218 1.000
>20 91 0.000 Coffee tree pruning Yes 85 1.000
No 224 0.000 Do you apply Compost yes 220 1.000
no 89 0.000 Do you observe any disease No 88 1.000
Yes 221 0.000 Do you mix your coffee while selling
No 106 1.000 Yes 203 0.000
Time Constraint during peak coffee harvesting period
No 44 1.000 yes 265 0.000
In the last three years receiving support from ARDO
Yes 288 1.000 No 21 0.000
Cash shortage No 70 1.000 Yes 239 0.000
Time of coffee in store <=4 137 1.000 >4 172 0.000
Storage availability Yes 149 1.000 No 160 0.000
District Gomma 124 1.000 Manna 185 0.000
125
Definition of terminology according to (CLU, 2007)
Acidity
This is a desirable characteristic in coffee. It is the sensation of dryness that the coffee
produces under the edges of your tongue and on the back of your palate. The role that
acidity plays in coffee is not unlike its role as related to the flavor of wine. It provides a
sharp, bright, vibrant quality. Without sufficient acidity, the coffee will tend to taste flat.
Acidity should not be confused with sour, which is an unpleasant, negative flavor
characteristic (CLU, 2007).
.
Body
‘Body’ is the feeling that the coffee has in your mouth. It is the viscosity, heaviness,
thickness, or richness that is perceived on the tongue. Typically, Indonesian coffees
possess greater body than South and Central American coffees. Coffees with a heavier
body will maintain more of their flavor when diluted with milk (CLU, 2007).
Aroma
This is a sensation that is hard to separate from flavor. The aroma contributes to the
flavors we discern on our palates. Subtle nuances, such as ‘floral’ or ‘winy’
characteristics, are derived from the aroma of brewed coffee (CLU, 2007).

126
.
Flavor is the overall perception of the coffee in your mouth. Acidity, aroma and body are
all components of flavor. Describing the tastes and flavors of different roasts is as
subjective as putting a wine into words. In both cases there’s no substitute for your own
personal tastes (CLU, 2007).
Black beans Color defects such as black beans make the beverage taste bitter,
disagreeable, and render it generally undrinkable. The reason for this defect is attributed to
prolonged fermentation of cherries picked from the ground, which then undergo a poor
drying process with intermittent periods of wetting. The presence of black beans was rare
in wet processing, except where the cherry has been harvested from the ground (CLU,
2007).
Foxy beans: These have red coloring which is essentially due to in appropriate drying
which has been overdone. Reasons for this include high drying temperature, drying period
extended over a long time, or the beans not having been sufficiently mixed. In some cases
it has been attributed to the adherence of a thin film of reddish soil from the drying area
during hulling, if the soil has high clay content and coffee dried on bricks floor (CLU,
2007).
Broken beans: These happened due to inadequate adjustment of the hullers, or an
excessively rapid rotation of the cylinders during hulling. Breakages most frequently occur
during hulling when the coffee is too dry. Broken beans adversely affect the appearance of
the batch, but more importantly they roast faster than whole beans, and tend to become

127
charred. Their presence therefore has a negative effect on the quality of the beverage
(CLU, 2007).
Pitted beans: The surfaces of beans which have been infested by insects are more or less
riddled with small, round holes such as those produced by the berry borer. Cutting them
open reveals the pores bored by the insect (CLU, 2007).

128
7.2. Figures
Appendix V. Map of survey areas (Gomma & Manna Woredas), Jimma Zone, Ethiopia.
Jimma zone
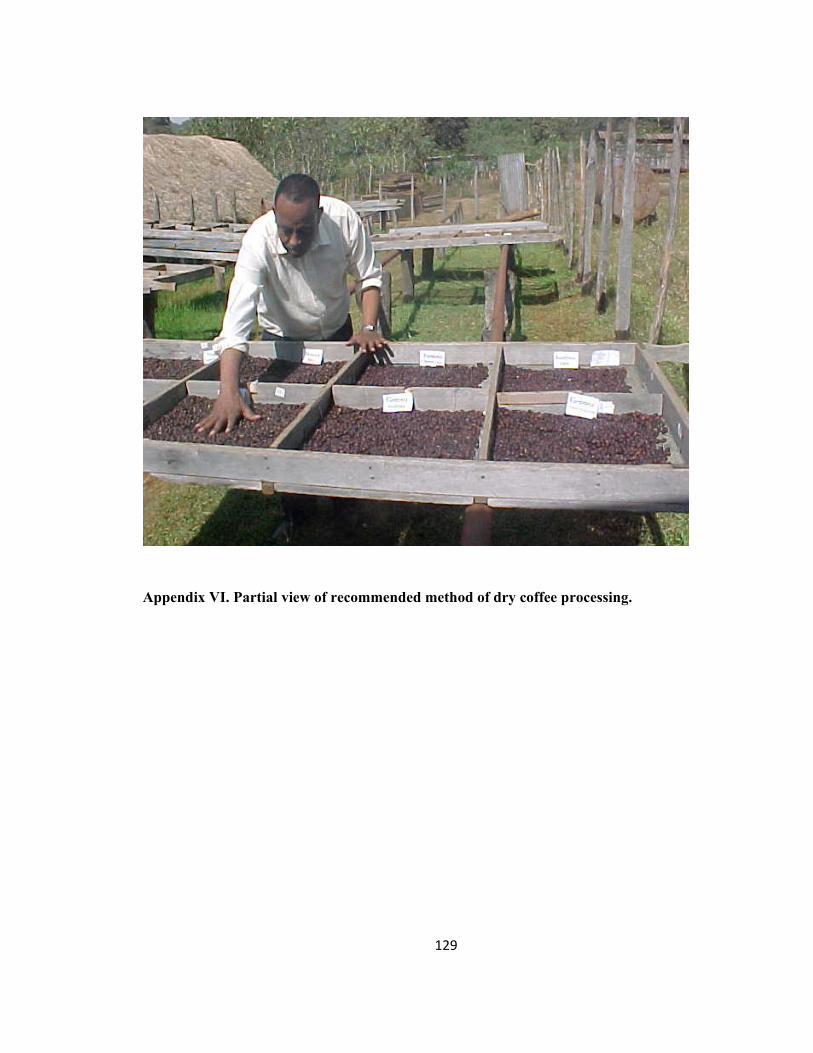
129
Appendix VI. Partial view of recommended method of dry coffee processing.

130
Appendix VII. Partial view of recommended method of wet coffee processing.
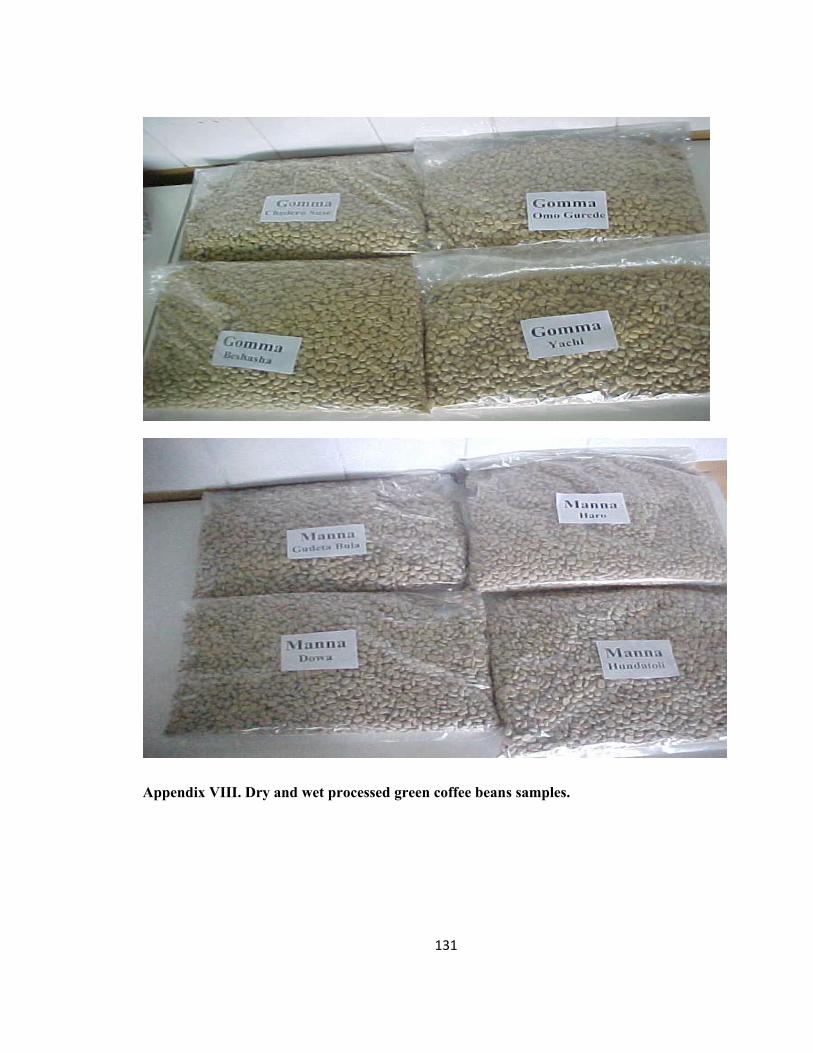
131
Appendix VIII. Dry and wet processed green coffee beans samples.

132
Appendix IX. Manual counting of coffee defect in the laboratory.

133
Appendix X. Long-term rainfall and temperature data for Gomma woreda.
0 50
100150200250300
Jan Feb Mar Apr May June July Aug Sep Oct Nov Dec
Months
Val
ues
Rainfall (mm) Minimum Temperature (0C) Maximum Temperature (0C)

134
Appendix XI. Long-term rainfall and temperature data for Manna woreda.
0
50
100
150
200
250
Jan Feb Mar Apr Mar Jun Jul Aug Sep Oct Nov Dec
Months
Values
Rainfall (mm) Minimum Temperature (0C) Maximum Temperature (0C)
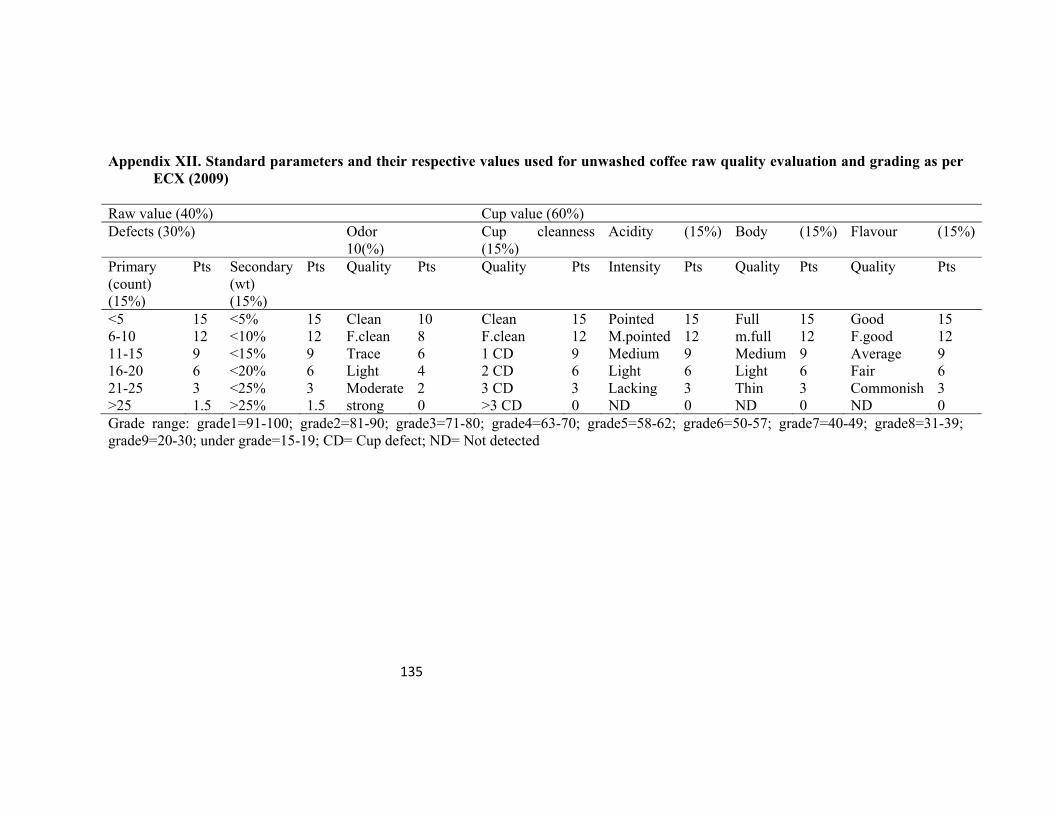
135
Appendix XII. Standard parameters and their respective values used for unwashed coffee raw quality evaluation and grading as per ECX (2009)
Raw value (40%) Cup value (60%) Defects (30%) Odor
10(%) Cup cleanness (15%)
Acidity (15%) Body (15%) Flavour (15%)
Primary (count) (15%)
Pts Secondary (wt) (15%)
Pts Quality Pts Quality Pts Intensity Pts Quality Pts Quality Pts
<5 15 <5% 15 Clean 10 Clean 15 Pointed 15 Full 15 Good 15 6-10 12 <10% 12 F.clean 8 F.clean 12 M.pointed 12 m.full 12 F.good 12 11-15 9 <15% 9 Trace 6 1 CD 9 Medium 9 Medium 9 Average 9 16-20 6 <20% 6 Light 4 2 CD 6 Light 6 Light 6 Fair 6 21-25 3 <25% 3 Moderate 2 3 CD 3 Lacking 3 Thin 3 Commonish 3 >25 1.5 >25% 1.5 strong 0 >3 CD 0 ND 0 ND 0 ND 0 Grade range: grade1=91-100; grade2=81-90; grade3=71-80; grade4=63-70; grade5=58-62; grade6=50-57; grade7=40-49; grade8=31-39; grade9=20-30; under grade=15-19; CD= Cup defect; ND= Not detected

136
Appendix XIII. Raw defect type & evaluation system of SCAA and Ethiopia unwashed green coffee bean (ECX, 2009)
Raw defects SCAA primary defects Secondary defects observations Type Bean grade SCAA 0 1 2 3 Ethiopia 0 1 2 3 Full black Partial black Foxy Full sour Partial sour Under dried Fungus Floater Over dried Foreign matter Immature Mixed Insect damaged Withered Stinkers Pod/Husk Shell Faded S. insect damaged Coated Broken Light Soiled Starved Total (Transfer to grade table) Total

137
Appendix XIV. Standard parameters and their respective values used for washed coffee raw quality evaluation and grading as per ECX (2009)
Raw value (40%) Cup value (60%) Defects (20%) Shape& make
(10%) Color (5%) Odor
5(%) Cup cleanness (15%)
Acidity (15%) Body (15%) Flavour (15%)
Primary (count) (10%)
Pts Secondary (Wt) (10%)
Pts Quality Pts Quality Pts Quality Pts Quality Pts Intensity Pts Quality Pts Quality Pts
0 10 <5% 10 V.good 10 Bluish 5 Clean 5 Clean 15 Pointed 15 Full 15 Good 151-4 8 <8% 8 Good 8 Grayish 4 F.clean 4 F.clean 12 M.pointed 12 M.full 12 F.good 12 5-6 6 <10% 6 F.good 6 Greenish 3 Trace 3 1 CD 9 Medium 9 Medium 9 Average 9 7-10 4 <12% 4 Average 4 Coated 2 Light 2 2 CD 6 Light 6 Light 6 Fair 6 11-15 2 <14% 2 Fair 2 Faded 1 Moderate 1 3 CD 3 Lacking 3 Thin 3 Commonish 3 >15 1 >14% 1 Small 1 White 0 Strong 0 >3 CD 0 ND 0 ND 0 ND 0
Grade range: grade1=91-100; grade2=81-90; grade3=71-80; grade4=63-70; grade5=58-62; grade6=50-57; grade7=40-49; grade8=31-39; grade9=20-30; under grade=15-19; CD= Cup defect; ND= Not detected

138
Appendix XV. Raw defect type & evaluation system of SCAA and Ethiopia washed green coffee bean (ECX, 2009)
Parchment observations Raw defects SCAA primary defects Secondary defects observations Type 0 1 2 3 Type 0 1 2 3 Type Bean
grade SCAA 0 1 2 3 Ethiopia 0 1 2 3
Even Under washed Full black Partial Foxy Under grade Cracked Full sour Partial Under
dried
Improper Dull Fungus Floater Over dried
Discolored Pods Foreign matter Immature Mixed Nipped Mixed fermentation Insect
damaged Withered Stinkers
Fermented Under fermentation Shell FadedLoose Long cont. water Slightly insect
damaged Coated
Brownish Light Starved total Total
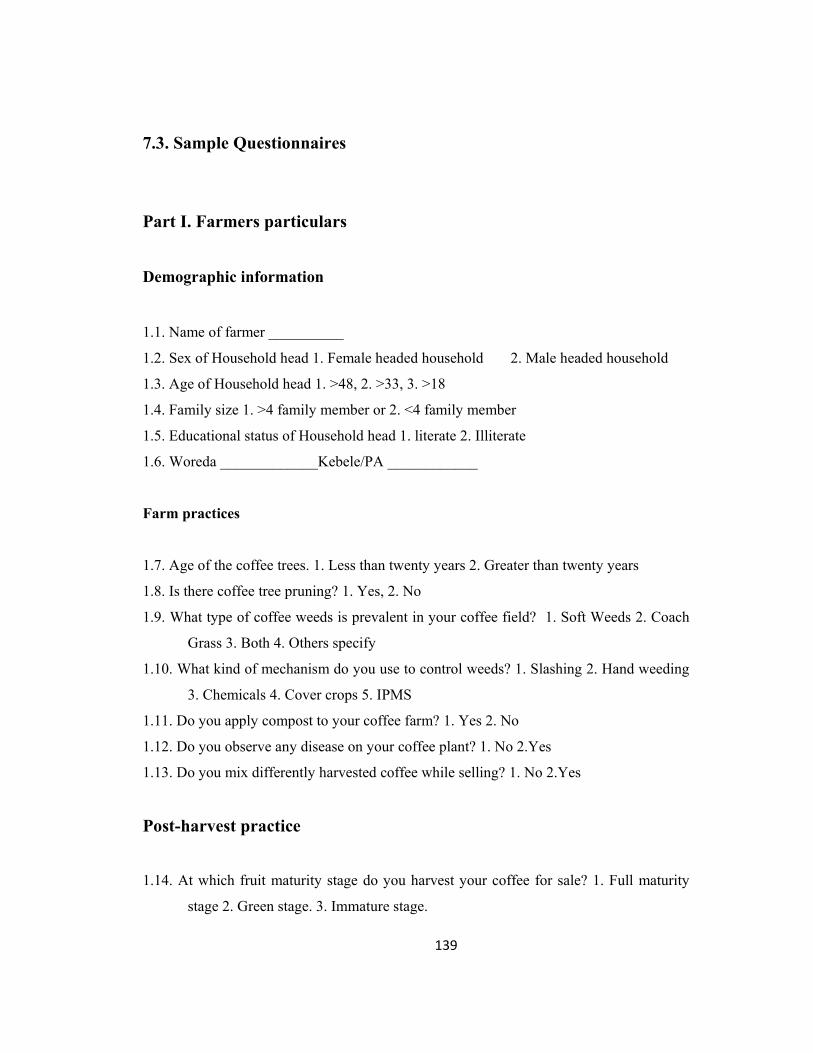
139
7.3. Sample Questionnaires
Part I. Farmers particulars
Demographic information
1.1. Name of farmer __________
1.2. Sex of Household head 1. Female headed household 2. Male headed household
1.3. Age of Household head 1. >48, 2. >33, 3. >18
1.4. Family size 1. >4 family member or 2. <4 family member
1.5. Educational status of Household head 1. literate 2. Illiterate
1.6. Woreda _____________Kebele/PA ____________
Farm practices
1.7. Age of the coffee trees. 1. Less than twenty years 2. Greater than twenty years
1.8. Is there coffee tree pruning? 1. Yes, 2. No
1.9. What type of coffee weeds is prevalent in your coffee field? 1. Soft Weeds 2. Coach
Grass 3. Both 4. Others specify
1.10. What kind of mechanism do you use to control weeds? 1. Slashing 2. Hand weeding
3. Chemicals 4. Cover crops 5. IPMS
1.11. Do you apply compost to your coffee farm? 1. Yes 2. No
1.12. Do you observe any disease on your coffee plant? 1. No 2.Yes
1.13. Do you mix differently harvested coffee while selling? 1. No 2.Yes
Post-harvest practice
1.14. At which fruit maturity stage do you harvest your coffee for sale? 1. Full maturity
stage 2. Green stage. 3. Immature stage.
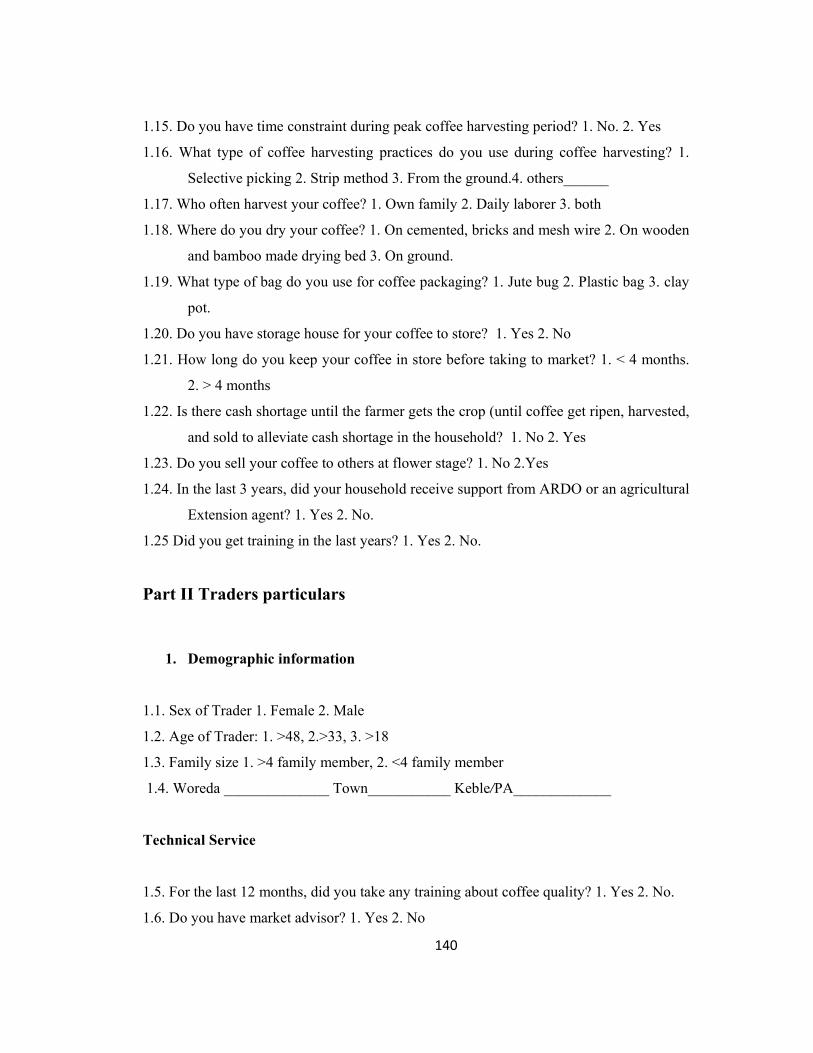
140
1.15. Do you have time constraint during peak coffee harvesting period? 1. No. 2. Yes
1.16. What type of coffee harvesting practices do you use during coffee harvesting? 1.
Selective picking 2. Strip method 3. From the ground.4. others______
1.17. Who often harvest your coffee? 1. Own family 2. Daily laborer 3. both
1.18. Where do you dry your coffee? 1. On cemented, bricks and mesh wire 2. On wooden
and bamboo made drying bed 3. On ground.
1.19. What type of bag do you use for coffee packaging? 1. Jute bug 2. Plastic bag 3. clay
pot.
1.20. Do you have storage house for your coffee to store? 1. Yes 2. No
1.21. How long do you keep your coffee in store before taking to market? 1. < 4 months.
2. > 4 months
1.22. Is there cash shortage until the farmer gets the crop (until coffee get ripen, harvested,
and sold to alleviate cash shortage in the household? 1. No 2. Yes
1.23. Do you sell your coffee to others at flower stage? 1. No 2.Yes
1.24. In the last 3 years, did your household receive support from ARDO or an agricultural
Extension agent? 1. Yes 2. No.
1.25 Did you get training in the last years? 1. Yes 2. No.
Part II Traders particulars
1. Demographic information
1.1. Sex of Trader 1. Female 2. Male
1.2. Age of Trader: 1. >48, 2.>33, 3. >18
1.3. Family size 1. >4 family member, 2. <4 family member
1.4. Woreda ______________ Town___________ Keble/PA_____________
Technical Service
1.5. For the last 12 months, did you take any training about coffee quality? 1. Yes 2. No.
1.6. Do you have market advisor? 1. Yes 2. No

141
1.7. Do you have moisture tester to estimate the level of dryness (moisture content) before
storage? 1. Yes 2. No
Basic market service
1.8. Do you have separate coffee store?1. Yes 2. No
1.9. What type of coffee store floor do you use? 1. Concrete 2. Wooden bed 3. Paved
ground.
1.10. How long do you keep your coffee in store before taking to market? 1. < 4 months.
2. > 4 months
1.11. How do you decide coffee price? 1. Based on Radio announcement 2. Own judgment
3. Following leading buyer’s Price 4. By discussing with other Akrabi 5. Based on
exporters in formation
1.12. While you buy coffee how could you check its quality? 1. through observation and
judgment 2. No means of checking 3. Others_______
1.13. Do you get extension service regularly and timely? 1 Yes 2. No