Embed Size (px)
Citation preview
ASSESSMENT OF CHESAPEAKE BAY COMMERCIAL SOFTSHELL CLAMS
Mya arenaria and Tagelus plebeius
WITH EMPHASIS ON ABUNDANCE AND DISEASE STATUS
Completion Report to the NOAA Chesapeake Bay Office Fisheries Science Program
for the period July 1, 2007 through August 30, 2011
Award NA07NMF4570326
November 25, 2011
Report prepared by:
Mark L. Homer, Christopher F. Dungan, and Mitchell L. Tarnowski (co-principal investigators)
Maryland Department of Natural Resources
Fisheries Service
Tawes State Office Building, B-2
580 Taylor Ave.
Annapolis, MD 41401

INTRODUCTION
The softshell clam, Mya arenaria, has supported an important commercial fishery in the
Maryland portion of Chesapeake Bay since the early 1950's, when harvesting of unexploited
subtidal populations by hydraulic escalator dredge began. Annual landings peaked at 680,000
bushels in 1964, remained above 500,000 bushels through 1971, subsequently falling to between
365,000 and 56,000 bushels through 1991, after which harvests declined steadily to levels less
than 1% of the 1964 peak landing. (Maryland DNR Fisheries Service Statistics, Annapolis, MD).
Since 1994, commercial landings have been in freefall, with harvests regularly negligible. While
market dynamics have contributed somewhat to declining catches, there is no doubt that this
species population has declined to “remnant” status. When American eel prices effectively
removed them as blue crab bait, clammers started, in the early 1980’s, to target the stout razor
clam, Tagelus plebeius, which are marketed as bait for eel and crab pot and trotline fisheries.
Over time, most of the commercial clam fleet has focused its efforts on harvesting razor clams.
Although, until recently, no records were kept of razor clam landings in Maryland, conversations
with commercial clammers indicate that between about 1980 and 2004, landings exceeded
softshell clam landings on a regular basis.
As softshell clam harvests declined, the value, both ex-vessel and retail, has dramatically
increased. With dockside values in excess of $80 to $100+ per bu during the last dozen years or
so (Maryland DNR Fisheries Service Statistics, Annapolis, MD), and retail values 2-3 times
greater than dockside, exploitation pressure on softshell clams persisted in spite of their declining
population levels and geographical retreat. In recent years, however, only a small fraction of the
commercial fleet targets this species. Although less valuable per bushel, razor clam production
has increasingly replaced softshell clam harvests in terms of income. There is no daily limit for
razor clams, except when prohibited or conditional areas are opened for harvest, while softshell
clams are limited to either 8 bu or 15 bu dependent on the season. Until 2004, as gleaned from
individuals in the razor clam industry, dockside process per bushel averaged between $20-25.
Since 2004 (when the population crashed as documented in this report), prices have increased
slowly to $30-35 per bu, and more recently $40+. This price increase reflects both the decline in
population abundance and the demand from the blue crab industry. Not surprisingly, increased
bait costs have contributed to higher blue crab prices. And, perhaps of the greatest importance,
the severe decline in both of these bivalves has significantly decreased the forage base of the
2

Bay’s ecosystem. Just about every taxonomic group preys upon softshell clams, from
Nemerteans to Cetaceans. Although predator-prey interactions are poorly documented for razor
clams, the softshell clam has been an important, sometimes dominant prey item for species such
as blue crabs, summer and winter flounder, Atlantic croaker, and spot (Virnstein 1977; Lipcius
and Hines 1986; Baker and Mann 1991; Homer and Boynton 1978; Homer and Mihursky 1991;
MacKenzie 1997), just to name a few. Additionally, juvenile softshell and razor clams are prey
for numerous other benthic invertebrate populations including several species of polychaetes,
snails, mud crabs, and shrimp (Haven 1970; Hidu and Newell 1989; Baker and Mann 1991).
Chesapeake Bay Mya arenaria populations are affected by several pathological
conditions that may be fatal, including disseminated neoplasia (DN) and Perkinsus sp. protozoan
infections. Disseminated [hemic] neoplasia, first described in New England M. arenaria (Brown
et al. 1977), was subsequently also reported as epizootic in some years among Chesapeake Bay
M. arenaria populations (Farley et al. 1986; Farley et al. 1991). Rapidly proliferating, anaplastic
and aneuploid cells come to dominate affected clam circulatory systems, displacing normal
hemocyte cells and their critical physiological functions. Pathology associated with this disease
has been compared to that of vertebrate leukemia (Smolowitz et al. 1989) and is fatal within 9
months of experimental transmission (House et al. 1998). With prevalences up to 58% reported
in some Chesapeake Bay clam populations (Farley et al. 1991), the impact of DN disease on
clam population mortality is projected to be significant.
Both Mya arenaria and Tagelus plebeius from Virginia waters were reported to be
infected by the lethal protozoan oyster pathogen Perkinsus marinus (= Dermocystidium
marinum) in a brief, early note (Andrews 1954). However, this parasite was not detected in four
Chester River and two Eastern Bay, Maryland M. arenaria samples examined in 1971 (Hamons,
1971), nor in diverse Maryland M. arenaria samples analyzed prior to1990 (MDDNR
pathologist Sara V. Otto, pers. comm.). Since 1990, Perkinsus sp. infections have been detected
at apparent increasing frequency among Chesapeake Bay M. arenaria populations (McLaughlin
and Faisal 2000). During 2000, Perkinsus sp. infections were detected at high prevalences (30-
100%) and intensities in all M. arenaria and T. plebeius samples examined during a CBSAC-
funded survey (Dungan et al. 2002). Mild pathology and prevalent defensive parasite
encapsulation observed in some infections are interpreted to suggest only that they may
compromise growth and reproduction of infected clams (McLaughlin and Faisal 1998).
3
However, extreme parasite densities with systemic distributions occurring in clams examined by
us indicate an acute, probably lethal, disease condition (Dungan et al. 2002).
The severe decline in softshell clam populations throughout the 1990’s (as evidenced by
harvest reports) led to the initiation of the present study. The crash of the razor clam population
in 2004 extended the effort.
Objectives.
1. To characterize the present condition of softshell and razor clam populations with respect to
distribution, abundance, and co-habitation.
2. Assess the status of diseases in softshell and razor clam populations.
METHODS
Field Sampling
Hydraulic escalator dredge
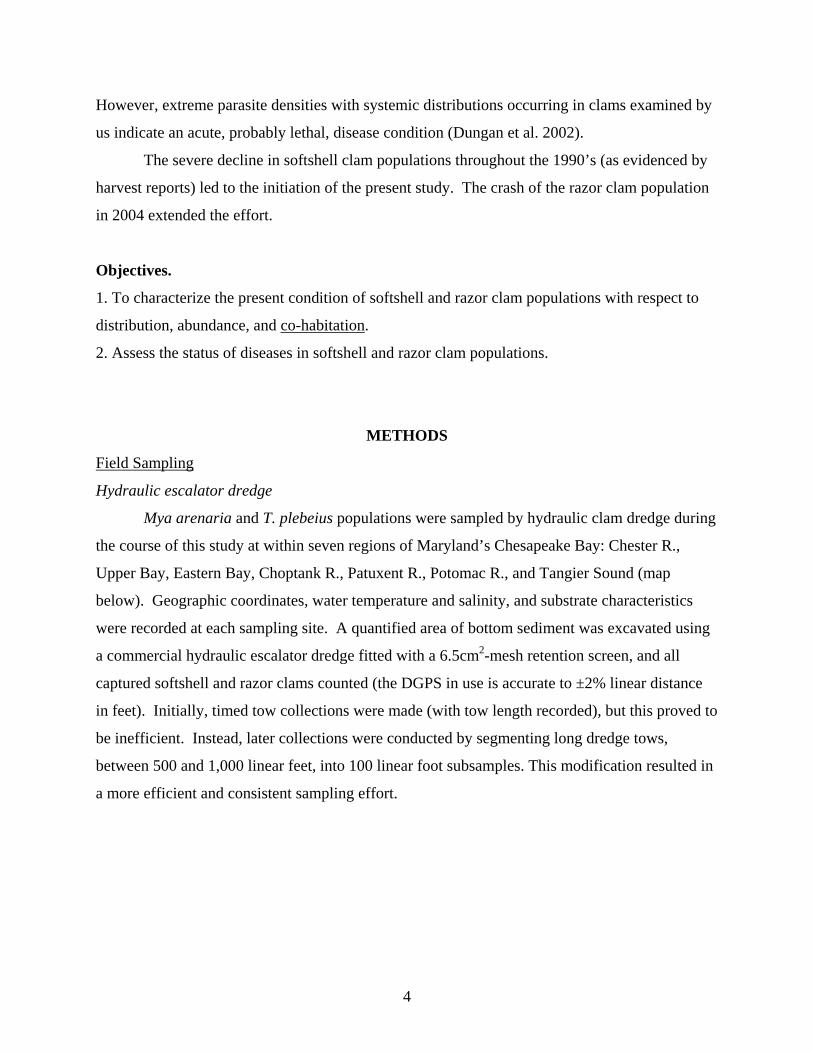
Mya arenaria and T. plebeius populations were sampled by hydraulic clam dredge during
the course of this study at within seven regions of Maryland’s Chesapeake Bay: Chester R.,
Upper Bay, Eastern Bay, Choptank R., Patuxent R., Potomac R., and Tangier Sound (map
below). Geographic coordinates, water temperature and salinity, and substrate characteristics
were recorded at each sampling site. A quantified area of bottom sediment was excavated using
a commercial hydraulic escalator dredge fitted with a 6.5cm2-mesh retention screen, and all
captured softshell and razor clams counted (the DGPS in use is accurate to ±2% linear distance
in feet). Initially, timed tow collections were made (with tow length recorded), but this proved to
be inefficient. Instead, later collections were conducted by segmenting long dredge tows,
between 500 and 1,000 linear feet, into 100 linear foot subsamples. This modification resulted in
a more efficient and consistent sampling effort.
4
5

Data recorded from each dredge tow segment included the following: distance (area)
towed, bottom type, water depth, tow time, and the number and volume of clams. Anterior-
posterior shell lengths were measured and recorded to the nearest millimeter for representative
subsamples of each species from the tow collective.
Sentinel locations were established for obtaining samples for disease analyses. As clam
“beds” are ephemeral, fixed locations were impossible to establish. Rather, sentinel sites were
set up more broadly within regions. Each sample consisted of 40 clams of either or both species
and all were delivered to the Oxford Laboratory for disease analyses. In 2004, in response to
widespread razor clam mortalities, the number of disease sample collection sites was greatly
expanded.
Bottom grab collections
A bottom grab (sampling approximately 0.10m2) was used to attempt to capture young-
of-the year (YOY) softshell clams in the following regions: Upper Bay, the Chester River, the
Choptank River, and in Tangier Sound. Samples were collected during November 2001, March
2002, and May 2002. A total of 172 grab samples were collected. Bottom grab material was
washed through a 2mm screen and all softshell clams collected, counted, and measured for shell
length. Geographic position, water temperature and salinity, and substrate characteristics were
recorded for each sample.
Laboratory assay procedures and analyses
RFTM dermo disease assays
Following receipt at Oxford Laboratory, clam samples were held for 24–72 h in flowing
ambient Tred Avon River water to allow clams to purge entrained sand and fecal matter. Thirty
live clams were selected from each sample and processed for disease analyses. Clams were
measured, shucked from their shells, and their muscular mantle margins and siphons trimmed
away. Laboratory procedures followed Ray (1966) and Dungan et al. (2002). Relative parasite
densities in tissue macerates were categorized and recorded as absent (0), or light (1) to heavy
(5) (Mackin 1961, Choi et al. 1989). For each clam sample analyzed, a Perkinsus sp. infection
intensity index was calculated as the sum of individual infected clam categorical infection
intensities, divided by the number of infected clams in the sample. Sample disease prevalences
6

were calculated as the percent of assayed sample clams affected. Duplicate RFTM-incubated
labial palp tissues from heavily infected clams were selected as inocula for parasite in vitro
isolation and propagation efforts.
Histopathological analyses.
Laboratory procedures follow Dungan et al. 2002. Histological sections were examined
for the presence, tissue distribution, and intensity of DN disease; the presence, distribution,
intensity, and host defensive response to Perkinsus sp. infections; and presence, intensity, tissue
distribution, and pathology of other infectious or parasitic conditions. Intensity of DN disease
was staged (1--5) for affected clams (Farley et al. 1986) and a DN disease intensity index was
calculated for each clam sample as the sum of individual affected clam intensity stages, divided
by the number of affected clams in the sample.
Pathogen isolation and propagation
Laboratory procedures followed Dungan and Hamilton (1995) and Bushek et al. (2000).
Clonal parasite cultures were expanded and cryopreserved for subsequent taxonomic
identification by DNA nucleotide sequencing.
7
RESULTS
Objective 1.
Stock Assessment
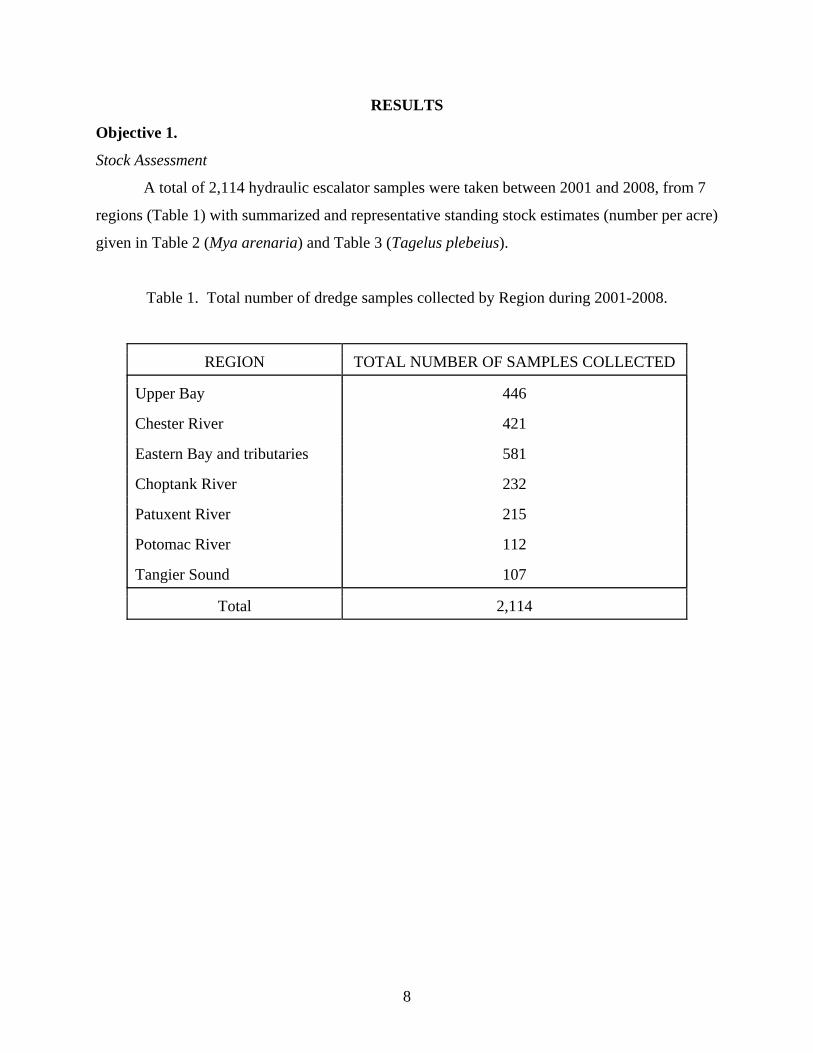
A total of 2,114 hydraulic escalator samples were taken between 2001 and 2008, from 7
regions (Table 1) with summarized and representative standing stock estimates (number per acre)
given in Table 2 (Mya arenaria) and Table 3 (Tagelus plebeius).
Table 1. Total number of dredge samples collected by Region during 2001-2008.
REGION TOTAL NUMBER OF SAMPLES COLLECTED
Upper Bay 446
Chester River 421
Eastern Bay and tributaries 581
Choptank River 232
Patuxent River 215
Potomac River 112
Tangier Sound 107
Total 2,114
8
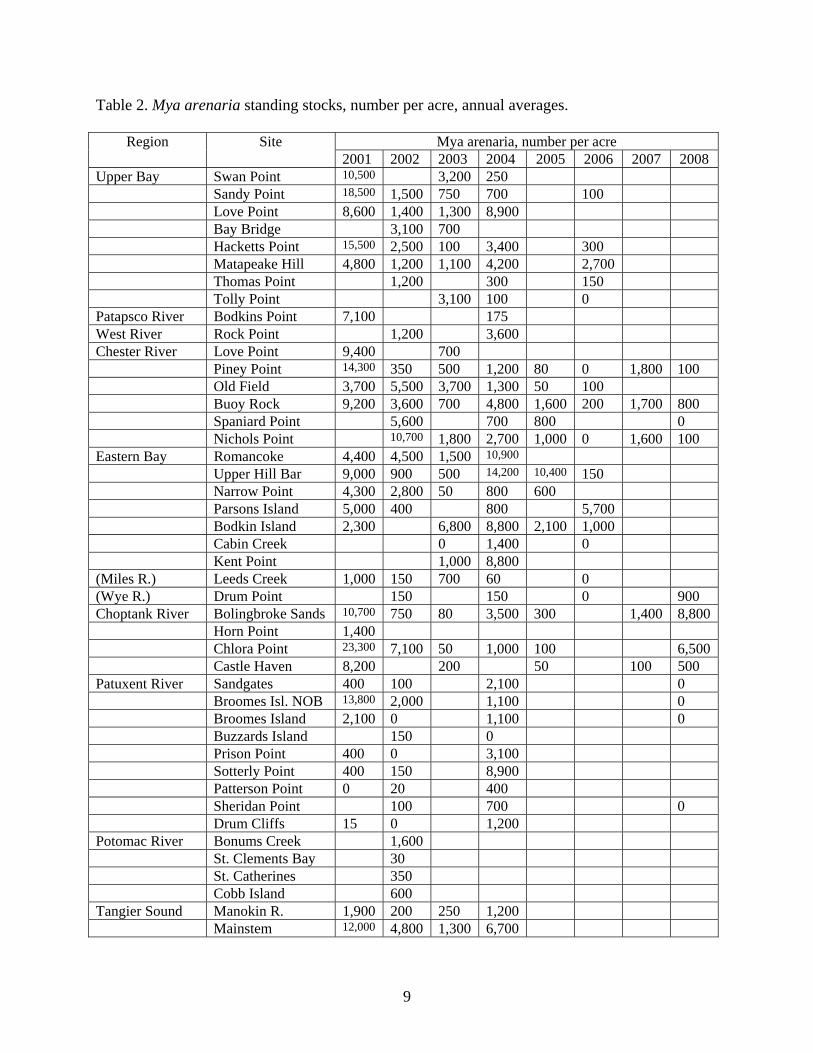
Table 2. Mya arenaria standing stocks, number per acre, annual averages.
Mya arenaria, number per acre Region Site 2001 2002 2003 2004 2005 2006 2007 2008
Upper Bay Swan Point 10,500 3,200 250 Sandy Point 18,500 1,500 750 700 100 Love Point 8,600 1,400 1,300 8,900 Bay Bridge 3,100 700 Hacketts Point 15,500 2,500 100 3,400 300 Matapeake Hill 4,800 1,200 1,100 4,200 2,700 Thomas Point 1,200 300 150 Tolly Point 3,100 100 0 Patapsco River Bodkins Point 7,100 175 West River Rock Point 1,200 3,600 Chester River Love Point 9,400 700 Piney Point 14,300 350 500 1,200 80 0 1,800 100 Old Field 3,700 5,500 3,700 1,300 50 100 Buoy Rock 9,200 3,600 700 4,800 1,600 200 1,700 800 Spaniard Point 5,600 700 800 0 Nichols Point 10,700 1,800 2,700 1,000 0 1,600 100 Eastern Bay Romancoke 4,400 4,500 1,500 10,900 Upper Hill Bar 9,000 900 500 14,200 10,400 150 Narrow Point 4,300 2,800 50 800 600 Parsons Island 5,000 400 800 5,700 Bodkin Island 2,300 6,800 8,800 2,100 1,000 Cabin Creek 0 1,400 0 Kent Point 1,000 8,800 (Miles R.) Leeds Creek 1,000 150 700 60 0 (Wye R.) Drum Point 150 150 0 900 Choptank River Bolingbroke Sands 10,700 750 80 3,500 300 1,400 8,800 Horn Point 1,400 Chlora Point 23,300 7,100 50 1,000 100 6,500 Castle Haven 8,200 200 50 100 500 Patuxent River Sandgates 400 100 2,100 0 Broomes Isl. NOB 13,800 2,000 1,100 0 Broomes Island 2,100 0 1,100 0 Buzzards Island 150 0 Prison Point 400 0 3,100 Sotterly Point 400 150 8,900 Patterson Point 0 20 400 Sheridan Point 100 700 0 Drum Cliffs 15 0 1,200 Potomac River Bonums Creek 1,600 St. Clements Bay 30 St. Catherines 350 Cobb Island 600 Tangier Sound Manokin R. 1,900 200 250 1,200 Mainstem 12,000 4,800 1,300 6,700
9

Softshell clam stocks (Table 1) may be characterized as highly variable within a site over
time and generally low, as will be shown in a later comparison of these data with survey results
conducted during the 1960s and 1970s. When recruitment did occur, with few exceptions,
standings stocks increased for only a short period, after which the effects of predation and
disease mortality became evident. In general, softshell clam populations were highly associated
with bottom type, as shown in the un-numbered table below.
Substrate/Sediment Category Hard with
structure Soft with structure
Hard (Sand, Clay)
Soft (Mud)
Percentage of softshell clams collected
71 12 12 5
As may be seen, softshell clam populations were positively associated with dense
sediment areas having overburdens of shell, cobbles, and made-made materials. Such material
affords refuge from predators, even where soft sediments are mixed with structure. By the end of
stock estimate field operations in 2008, over 95% of softshell clams collected were from hard
substrate areas with thick layers of structure covered the base sediment.
As mentioned above, contemporary abundance estimates of softshell clams were
compared with similar data collected during the 1960s and 1970s. The table below gives some
of the earlier estimates of softshell clam abundance. These data are from field sheets, hence no
reference, and include estimates deemed credible after discussions with the lead biologist at the
time. Comparisons with 2001-2008 data were made using both the Wilcoxon Rank Sum and
Kruskul-Wallis Test results evaluated at = 0.05 (Hollander and Wolfe, 1973). Nonparametric
procedures were chosen because of uncertainty regarding the underlying distribution of the
earlier data. Values in bold, in the un-numbered table below, indicate statistical differences
between the softshell clam data collected during the 1960s-1970s and contemporary data. Data
are number of clams per acre.
10
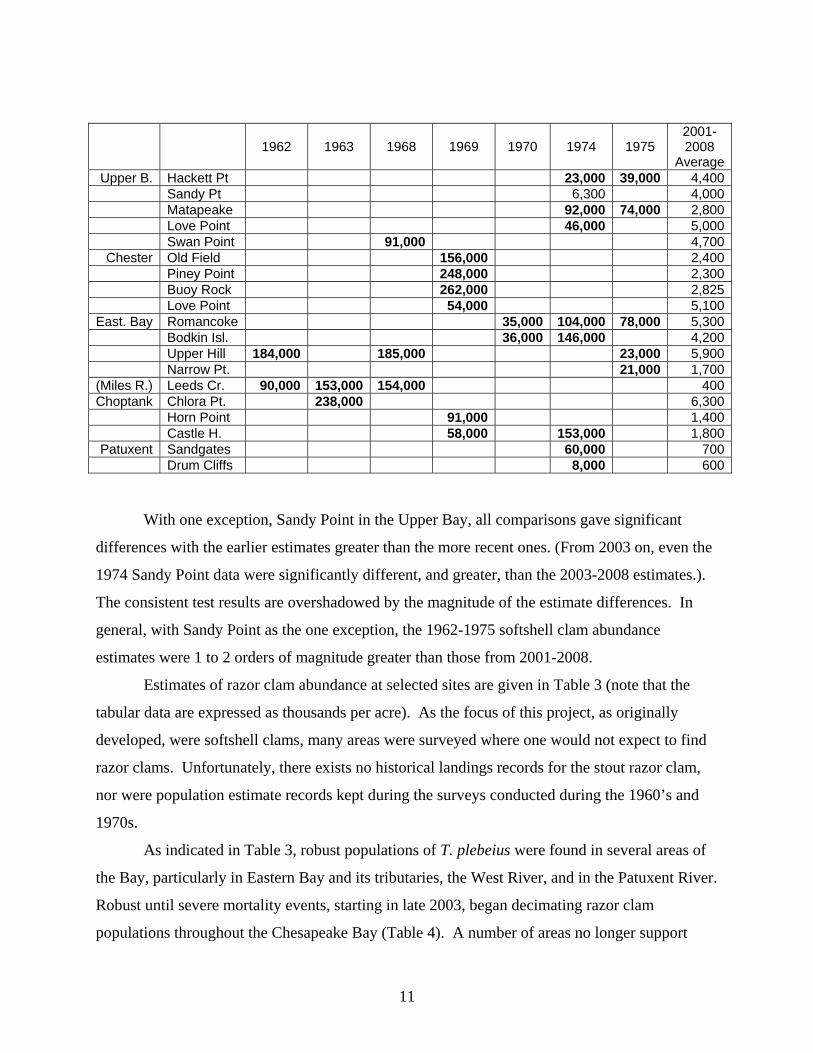
1962 1963 1968 1969 1970 1974 1975 2001-2008
AverageUpper B. Hackett Pt 23,000 39,000 4,400
Sandy Pt 6,300 4,000 Matapeake 92,000 74,000 2,800 Love Point 46,000 5,000 Swan Point 91,000 4,700
Chester Old Field 156,000 2,400 Piney Point 248,000 2,300 Buoy Rock 262,000 2,825 Love Point 54,000 5,100
East. Bay Romancoke 35,000 104,000 78,000 5,300 Bodkin Isl. 36,000 146,000 4,200 Upper Hill 184,000 185,000 23,000 5,900 Narrow Pt. 21,000 1,700
(Miles R.) Leeds Cr. 90,000 153,000 154,000 400Choptank Chlora Pt. 238,000 6,300
Horn Point 91,000 1,400 Castle H. 58,000 153,000 1,800
Patuxent Sandgates 60,000 700 Drum Cliffs 8,000 600
With one exception, Sandy Point in the Upper Bay, all comparisons gave significant
differences with the earlier estimates greater than the more recent ones. (From 2003 on, even the
1974 Sandy Point data were significantly different, and greater, than the 2003-2008 estimates.).
The consistent test results are overshadowed by the magnitude of the estimate differences. In
general, with Sandy Point as the one exception, the 1962-1975 softshell clam abundance
estimates were 1 to 2 orders of magnitude greater than those from 2001-2008.
Estimates of razor clam abundance at selected sites are given in Table 3 (note that the
tabular data are expressed as thousands per acre). As the focus of this project, as originally
developed, were softshell clams, many areas were surveyed where one would not expect to find
razor clams. Unfortunately, there exists no historical landings records for the stout razor clam,
nor were population estimate records kept during the surveys conducted during the 1960’s and
1970s.
As indicated in Table 3, robust populations of T. plebeius were found in several areas of
the Bay, particularly in Eastern Bay and its tributaries, the West River, and in the Patuxent River.
Robust until severe mortality events, starting in late 2003, began decimating razor clam
populations throughout the Chesapeake Bay (Table 4). A number of areas no longer support
11

significant populations of razor clams, although commercial abundance levels persist in the
Eastern Bay tributaries, a few Patuxent River areas, and in several areas of the Choptank River.
Unlike softshell clams, razor clam boxes remain articulated for a substantial time period,
a characteristic that can be exploited to obtain credible mortality rates (Table 4). Prior to the fall
of 2003, no records were kept of razor clam box counts, although field notes taken in 2001 and
2002 indicate that boxes made up no more than 5-6% of razor clam populations. Large numbers
of boxes were observed initially in the early fall of 2003 and, accordingly, counts were made and
recorded. During the subsequent winter, we were contacted by several watermen who reported
severe mortalities in the Eastern Bay area and in the Patuxent River. We refocused the current
project in order to investigate these reports and found them to be accurate. By the end of 2004,
we estimated that over 70% of the Bay’s razor clam population had died, even in areas that
supported only low levels of razor clam abundance.
Table 3. Abundance estimates of the stout razor clams in selected Bay areas. Data are given as thousands per acre.
Tagelus plebeius, thousands per acre Region Site
2001 2002 2003 2004 2005 2006 2007 2008 Upper Bay Matapeake Hill 0.1 6.3 4.8 0.8 0.0 West River Rock Point 24.1 8.5 Chester River Buoy Rock 0.1 0.9 3.6 0.3 0.2 0.1 0.2 Eastern Bay Romancoke 7.4 77.2 34.9 34.7 Upper Hill Bar 3.3 68.0 29.5 31.2 12.2 0.1 Narrow Point 42.1 230.3 176.3 40.2 30.3 0.1 Parsons Island 0.3 135.0 8.2 0.0 Bodkin Island 0.1 0.2 0.6 0.1 0.0 Cabin Creek 162.4 160.1 18.5 1.6 Kent Point 14.7 23.0 (Miles R.) Leeds Creek 56.2 129.5 51.5 46.9 26.8 (Wye R.) Drum Point 38.1 43.4 67.8 28.9 24.2 Choptank River Bolingbroke Sands 3.4 1.8 1.1 0.6 0.2 1.0 6.7 Chlora Point 6.0 5.2 6.7 1.6 4.0 57.7 Castle Haven 8.3 0.8 0.5 9.8 101.7 8.8 Patuxent River Sandgates 7.5 35.4 19.6 Broomes Island 8.6 30.0 45.4 Buzzards Island 43.9 1.9 Prison Point 5.9 20.8 Sotterly Point 8.4 9.7 Patterson Point 4.4 4.8 Sheridan Point 43.8 12.8 13.2 Drum Cliffs 13.0 19.5 Tangier Sound Manokin R. 2.5 2.6 1.0 4.2 Mainstem 6.3 1.8 6.2 4.6
12
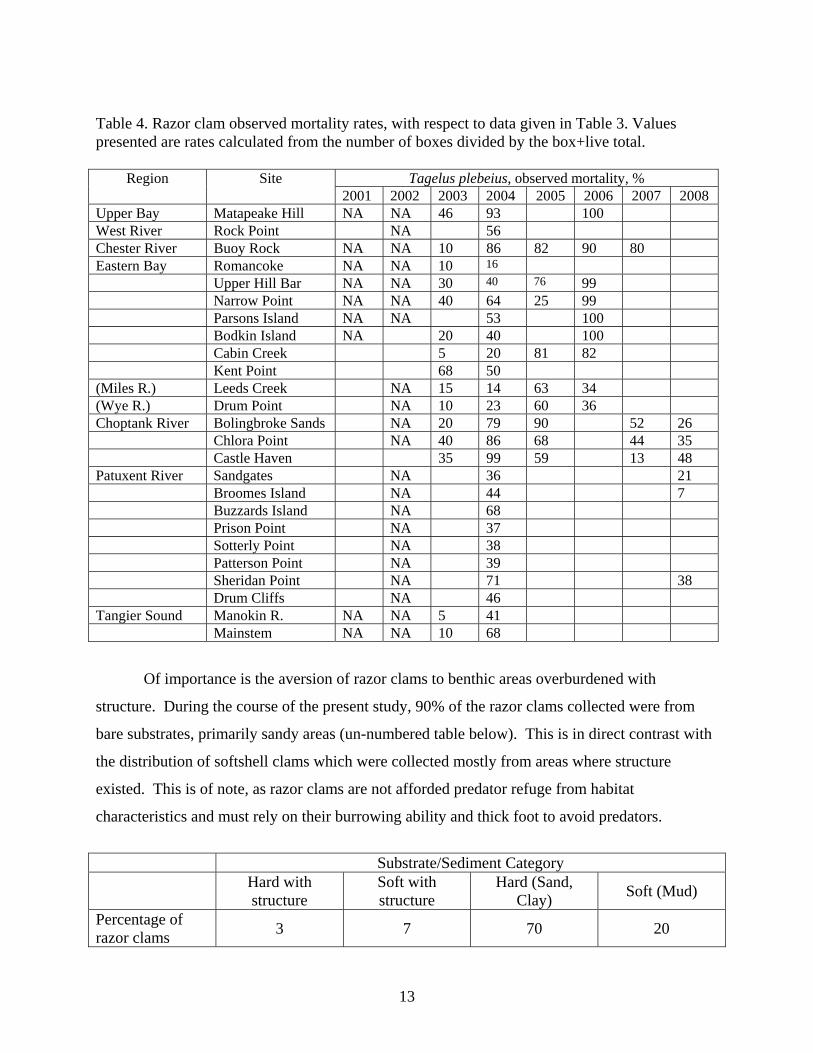
Table 4. Razor clam observed mortality rates, with respect to data given in Table 3. Values presented are rates calculated from the number of boxes divided by the box+live total.
Tagelus plebeius, observed mortality, % Region Site 2001 2002 2003 2004 2005 2006 2007 2008
Upper Bay Matapeake Hill NA NA 46 93 100 West River Rock Point NA 56 Chester River Buoy Rock NA NA 10 86 82 90 80 Eastern Bay Romancoke NA NA 10 16 Upper Hill Bar NA NA 30 40 76 99 Narrow Point NA NA 40 64 25 99 Parsons Island NA NA 53 100 Bodkin Island NA 20 40 100 Cabin Creek 5 20 81 82 Kent Point 68 50 (Miles R.) Leeds Creek NA 15 14 63 34 (Wye R.) Drum Point NA 10 23 60 36 Choptank River Bolingbroke Sands NA 20 79 90 52 26 Chlora Point NA 40 86 68 44 35 Castle Haven 35 99 59 13 48 Patuxent River Sandgates NA 36 21 Broomes Island NA 44 7 Buzzards Island NA 68 Prison Point NA 37 Sotterly Point NA 38 Patterson Point NA 39 Sheridan Point NA 71 38 Drum Cliffs NA 46 Tangier Sound Manokin R. NA NA 5 41 Mainstem NA NA 10 68
Of importance is the aversion of razor clams to benthic areas overburdened with
structure. During the course of the present study, 90% of the razor clams collected were from
bare substrates, primarily sandy areas (un-numbered table below). This is in direct contrast with
the distribution of softshell clams which were collected mostly from areas where structure
existed. This is of note, as razor clams are not afforded predator refuge from habitat
characteristics and must rely on their burrowing ability and thick foot to avoid predators.
Substrate/Sediment Category Hard with
structure Soft with structure
Hard (Sand, Clay)
Soft (Mud)
Percentage of razor clams
3 7 70 20
13
Special Tasks.
Sampling techniques.
Sampling protocols evolved over time, with changes specifically designed where
practical for compatibility with methods used for previously collected data. Initially, samples
were obtained through discrete hydraulic dredge tows, where tow length and time were recorded.
An optimal tow length was established and a modified sampling design was employed, which
consisted of a variable number of segmented tows of 100 linear feet (~25 m2). Where
exceedingly dense substrates that severely impeded tow speed were encountered, tow segments
were limited to no more than 6 minutes, regardless of tow length. In all cases, both the lengths
and durations of segments were recorded.
The number of tows constituting a sample set varied from 3-14 segments, with an
average of approximately 7 segments per set. ow number for a given set was dependent on catch
rate in the following ways.
1. Where no clams were collected after several tows, the set was fixed at 3-5 segments.
2. Where clams were very abundant, 8-14 segments constituted the sample set.
3. During periods of high razor clam mortalities, 8-12 segments were run.
Under Condition-2 (above), clams were collected from the escalator until a sufficient
number were obtained for shell length measurements and disease analyses. At that point, clams
were counted as they passed by on the escalator, keeping segment data discrete.
Condition-3 (above) was a special case. The unprecedented razor clam mortalities during 2004
necessarily shifted projected efforts towards documenting what turned out to be a major
Chesapeake Bay bivalve mortality event. The razor clam mortality event was so intense and
widespread that data acquisition by established methods and protocols was prohibitively
inefficient. A more time-efficient, but accurate (and precise) sampling procedure for estimating
razor clam mortality was quickly established and tested. This method consisted of operating the
dredge on a site, allowing the escalator to clear, establishing a beginning point on the escalator,
raising the escalator, and finally counting the number of live and dead razor clams as the
escalator cleared. This technique was evaluated by comparing results with those of the standard
sampling technique. No differences were found in the estimation of razor clam mortality
14
between the two methods. The new method took approximately 20% of the time it took to
collect the same information as did the conventional technique.
Establish a young-of-the-year index.
An attempt was made to establish a method for creating a softshell clam YOY index,
using a standard Petersen Grab. Accordingly, a total of 89 samples were collected over a 2-year
period in 3 Chesapeake Bay regions. Samples were preserved in the field and later examined
microscopically to identify and enumerate all molluscs captured in the grab.
Given the time-consuming nature and expense of the pilot effort and the lack of
significant results with respect to YOY softshell clams, this task was terminated early in 2003.
An expansion of this effort from Pilot to Project was judged to be an inefficient expenditure of
resources, in light of its marginal anticipated information returns. In addition, as softshell clam
escalator dredge catch data were accumulated, it was clear that scheduling sites for grab sample
collections would be impossible given the increasingly ephemeral nature of softshell clam
distribution.
Objective 2.
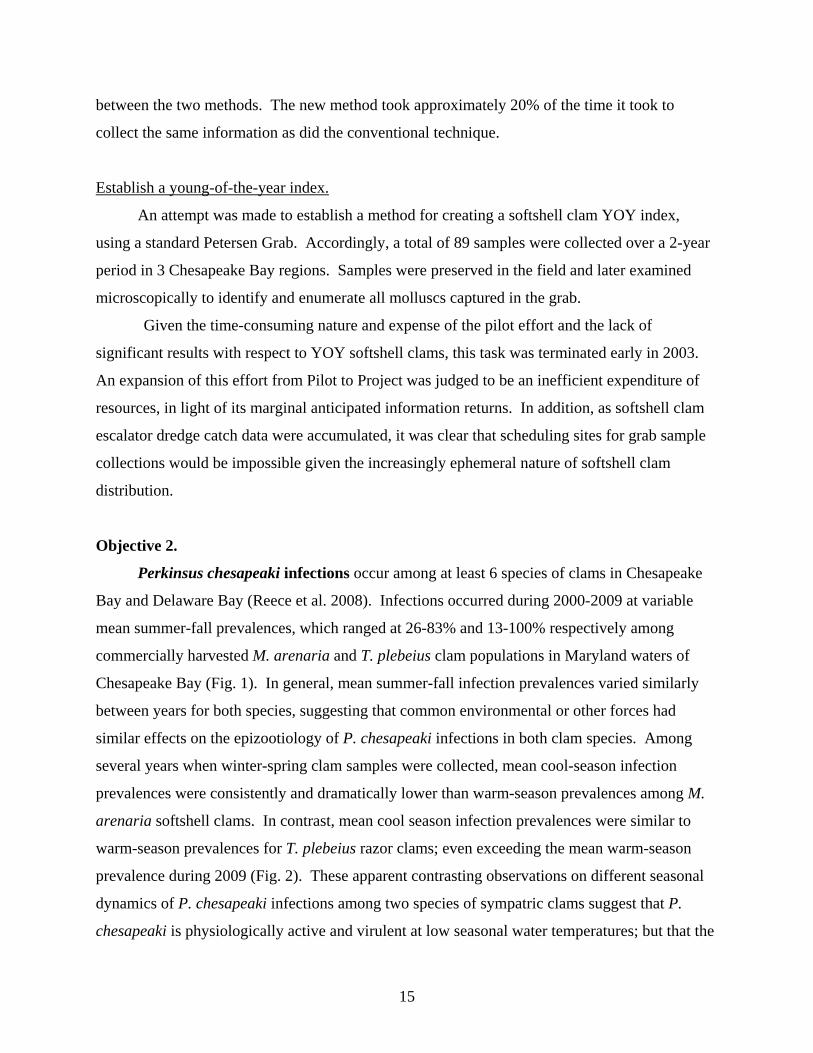
Perkinsus chesapeaki infections occur among at least 6 species of clams in Chesapeake
Bay and Delaware Bay (Reece et al. 2008). Infections occurred during 2000-2009 at variable
mean summer-fall prevalences, which ranged at 26-83% and 13-100% respectively among
commercially harvested M. arenaria and T. plebeius clam populations in Maryland waters of
Chesapeake Bay (Fig. 1). In general, mean summer-fall infection prevalences varied similarly
between years for both species, suggesting that common environmental or other forces had
similar effects on the epizootiology of P. chesapeaki infections in both clam species. Among
several years when winter-spring clam samples were collected, mean cool-season infection
prevalences were consistently and dramatically lower than warm-season prevalences among M.
arenaria softshell clams. In contrast, mean cool season infection prevalences were similar to
warm-season prevalences for T. plebeius razor clams; even exceeding the mean warm-season
prevalence during 2009 (Fig. 2). These apparent contrasting observations on different seasonal
dynamics of P. chesapeaki infections among two species of sympatric clams suggest that P.
chesapeaki is physiologically active and virulent at low seasonal water temperatures; but that the
15
defensive capabilities of M. arenaria clams may surpass those of T. plebeius clams in extirpating
P. chesapeaki infections during winter-spring periods of low water temperatures. Mean annual
infection prevalences were calculated from results of Ray’s fluid thioglycollate medium (RFTM,
Ray 1966) assays from 4,796 clams during 2000-2009.
Fig. 1. Mean summer-fall P. chesapeaki infection prevalences among two Chesapeake Bay clam species: 2000-2009
0
10
20
30
40
50
60
70
80
90
100
2000 2001 2002 2003 2004 2005 2006 2007 2008 2009
Years
Pre
vale
nce (%
)
M. arenaria T. plebeius
Fig. 2. Mean winter-spring P. chesapeaki infection prevalences among two Chesapeake Bay clam species: 2004, 2008, 2009
0
10
20
30
40
50
60
70
80
90
100
2000 2001 2002 2003 2004 2005 2006 2007 2008 2009
Years
Pre
vale
nc
e (%
)
M. arenaria T. plebeius
16

Extreme razor clam mortalities that occurred during the winter-spring months of 2004
coincided with a mean P. chesapeaki infection prevalence of 71% (sample range 7-98%) among
T. plebeius razor clam samples from that period (Fig. 2). As in all years when clam samples
were collected and analyzed for diseases during winter-spring seasons (2004, 2008, and 2009),
high prevalences of P. chesapeaki infections uniquely persisted among T. plebeius razor clam
populations during those annual cool seasons. These data suggest that prevalent P. chesapeaki
infections may cause T. plebeius razor clam mortalities during colder, winter-spring months.
Pathogen cells dispersed during springtime as a consequence of death and decomposition of
infected razor clams may infect sympatric Mya arenaria clams at the beginning of the warm
water season, when P. chesapeaki pathology is most severe among softshell clams. If the latter
inference has merit, then infected T. plebeius razor clams may function as reservoirs of P.
chesapeaki cells in benthic Chesapeake Bay clam habitats shared by both clam species, and as
potential vectors for early dispersal of infectious pathogen cells as estuarine waters warm during
spring and early-summer.
Disseminated neoplasias (DN disease) occurred among Mya arenaria clams at variable
mean annual prevalences of 2-44% (decadal mean = 16%) among 1,853 softshell clams that were
analyzed histologically during 2000-2009 (Fig. 3). Prevalences of DN disease among softshell
clams in individual samples from that decade ranged between 0-100%. High prevalences of a
lethal neoplastic disease among Chesapeake Bay clams are alarming, due to the possibility that
they may reflect the environmental presence of carcinogens in benthic estuarine habitats. The
cause of DN disease in softshell clams remains uncertain, although there is some evidence for a
potentially infectious retroviral agent (House et al. 1998), and the disease has been characterized
as transmissible among Mya arenaria clams in Chesapeake Bay, where high DN disease
prevalences in softshell clam samples have been commonly documented at 30-90% since 1983
(Farley et al. 1991, Dungan et al. 2002). Periodically or locally significant softshell clam
mortalities from DN disease in Chesapeake Bay are likely, especially when DN disease
compromises defensive capabilities among clams that are coincidentally infected by P.
chesapeaki or other microbial pathogens.
17

Fig. 3. Mean annual DN disease prevalences among Mya arenaria clams in Chesapeake Bay, 2000-2009
0
10
20
30
40
50
60
2000 2001 2002 2003 2004 2005 2006 2007 2008 2009
Years
Pre
vale
nce
(%
)
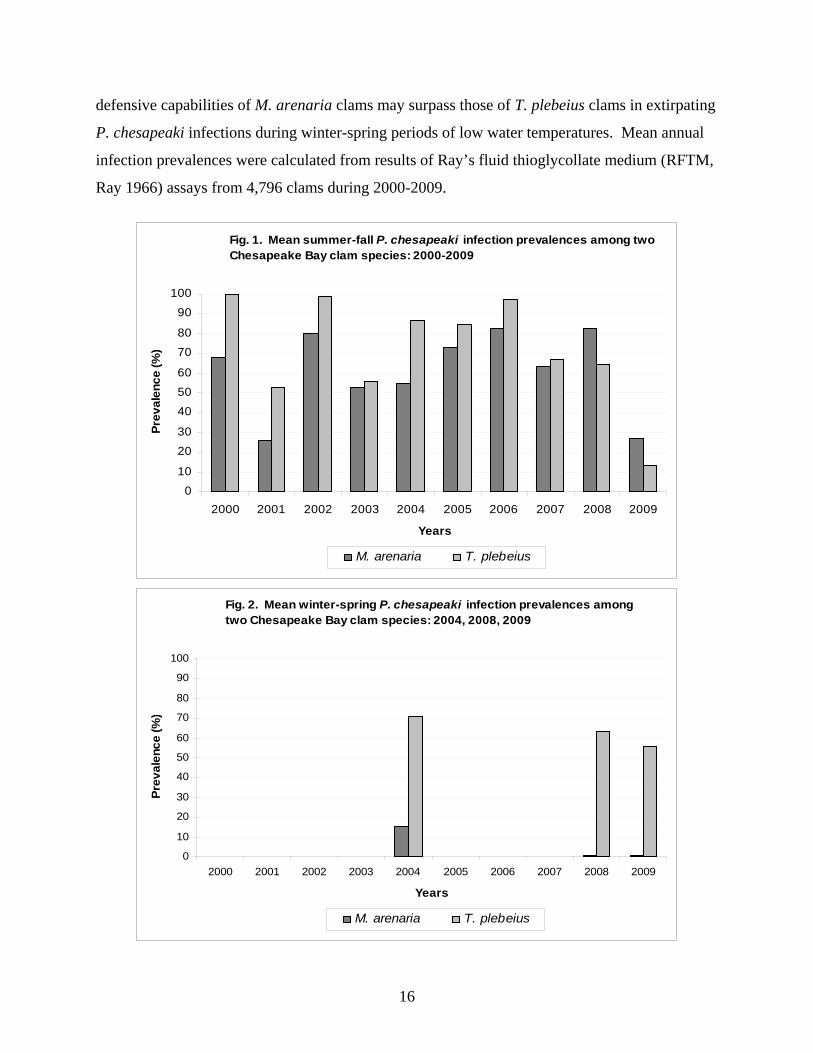
Gill epithelial cell nuclear hypertophy (GENH) disease is a previously unrecognized
virus disease that was found to be prevalent among Chesapeake Bay Mya arenaria clams during
the current investigation (Dungan et al. 2007). GENH virus infections of the nuclei of gill
epithelial cells cause pathological hypertrophy of the nuclei of infected gill epithelial cells, which
may functionally compromise infected cells. As genomic controls and functions of gill cells are
commandeered for virus replication and packaging (Fig. 4), the disease may impair the critical
feeding and respiratory functions of Mya arenaria gill tissues.
Since the first recognition and partial characterization of this new virus disease during
2005, it has been consistently diagnosed at high prevalences among Mya arenaria clams in
samples from all Chesapeake Bay clam habitats (Fig. 5). Mean annual prevalences for GENH
virus disease among 1,934 softshell clams that were analyzed during 2000-2009 ranged from 18–
90% (decadal mean = 67%), and prevalences among individual samples from that decade ranged
between 0-100%. A recent trend of elevated annual means for GENH virus infection
prevalences among Mya arenaria clams is apparent during 2006-2009, suggesting that recent
impacts of that disease have been broadly distributed and prevalent among diminished softshell
clam populations in the Maryland portion of Chesapeake Bay
18
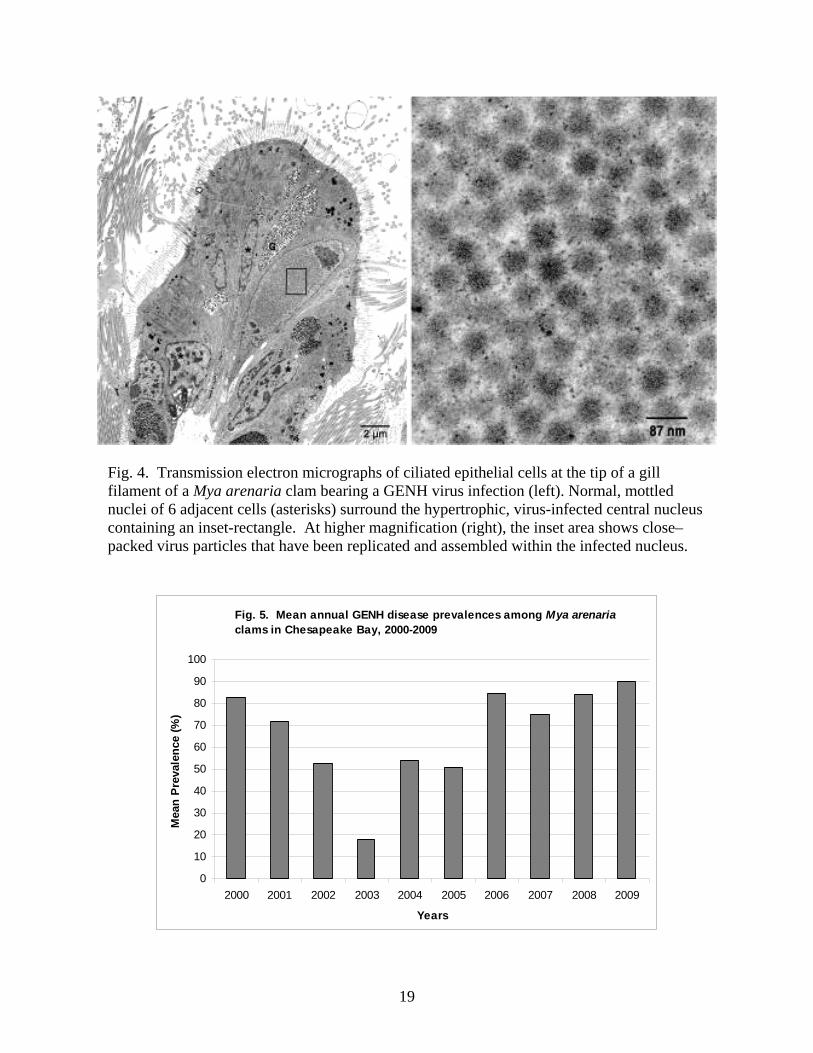
Fig. 4. Transmission electron micrographs of ciliated epithelial cells at the tip of a gill filament of a Mya arenaria clam bearing a GENH virus infection (left). Normal, mottled nuclei of 6 adjacent cells (asterisks) surround the hypertrophic, virus-infected central nucleus containing an inset-rectangle. At higher magnification (right), the inset area shows close–packed virus particles that have been replicated and assembled within the infected nucleus.
Fig. 5. Mean annual GENH disease prevalences among Mya arenaria clams in Chesapeake Bay, 2000-2009
0
10
20
30
40
50
60
70
80
90
100
2000 2001 2002 2003 2004 2005 2006 2007 2008 2009
Years
Mea
n P
reva
len
ce (
%)
19

The combined prevalences of three diseases among Mya arenaria clams in Maryland
Chesapeake Bay bottoms during 2000-2009 show that those diseases occurred at mean annual
prevalences that varied differently for each disease between years, but which occurred together
during all years (Fig. 6). All three diseases occurred simultaneously among individual clams.
Generally, DN disease was the least prevalent of the 3 diseases, with a long-term prevalence
mean of 16% for ten years with annual prevalence means that ranged between 2-44%. Mean
annual Perkinsus chesapeaki infection prevalances varied widely between 26-83% (decadal
mean = 61%) for M. arenaria clams, and between 13-100% for T. plebeius clams (decadal mean
= 72%, Fig. 1). Retrospective analyses of archived histological samples revealed that GENH
virus gill lesions did not occur among T. plebeius razor clams, but consistently occurred among
Mya arenaria softshell clams at mean annual prevalences of 18-90% (decadal mean = 67%).
Mean annual prevalences of the 3 diseases appear to vary independently between years, but all
co-occurred at relatively high prevalences during 2002. Potential interaction effects between the
three diseases are uncertain, but anecdotal observations suggest that DN disease effects may
enhance the intensities and impacts of P. chesapeaki infections by compromising hemocyte-
mediated softshell clam defensive functions that may moderate the pathological effects of such
infections.
Fig. 6. Mean annual prevalences of 3 diseases among Mya arenaria clams in Maryland Chesapeake Bay waters, 2000-2009
0
10
20
30
40
50
60
70
80
90
100
2000 2001 2002 2003 2004 2005 2006 2007 2008 2009
Year
Pre
va
len
ce
(%
)
P. chesapeak i % GENH % DN %
20
Special Task. Establish sentinel sites for developing a consistent set of data with respect to clam diseases.
The development of sentinel sites for the purposes of acquiring disease data was given a
high priority from the beginning of this project. From data collected in 2000 (DNR funded pilot
study) and discussions with commercial clammers, sentinel sites were established for the initial
grant period in 2001. As the project expanded geographically, sentinel disease sites were
established for all Chesapeake Bay regions. Over time, however, some failures occurred in the
rates of sentinel clam recruitments, and softshell clams disappeared from some sites. Subsequent
efforts were made to locate and sample populations of softshell clams that were proximate to
depleted sentinel sites.
During winter-spring months during 2004, catastrophic razor clam mortalities were
observed and reported by harvesters throughout Maryland’s Chesapeake Bay. This caused
further erosion in the established sentinel disease data set, since razor clams suffered more than
90% mortality in some areas. Nevertheless, an impressive set of disease data with some
temporal gaps has been consolidated by this project.
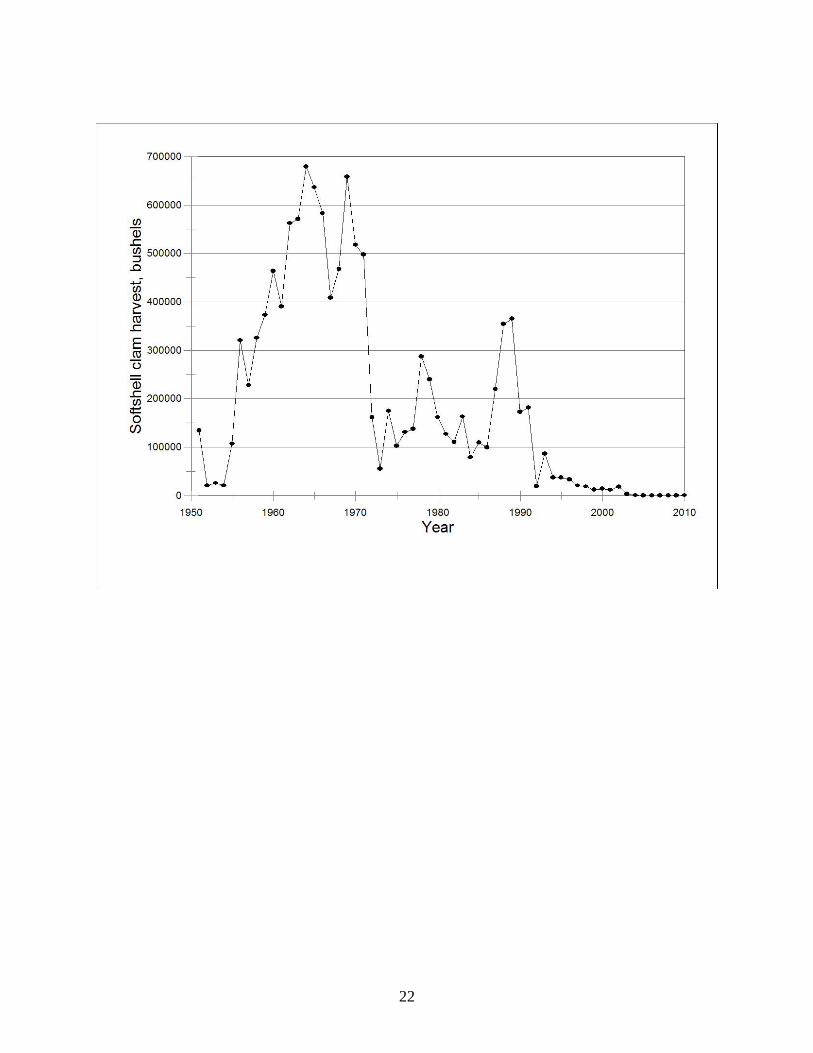
SUMMARY & DISCUSSION Given below is a graphic depiction of the softshell clam harvest record in Maryland.
Below the figure is a time line listing of events that have had significant effects on both the
fishery and the clam population.
21
22

Timeline of events significant to the softshell clam fishery and population in Maryland
Chesapeake Bay waters.
1951 Hydraulic escalator dredge first used to harvest softshell clams
1952- Various regulatory restrictions, including shoreline distances, 1958 exclusion of charted oyster bars, etc.
1954 Perkinsus sp. reported to infect Virginia softshell clams
1965 Major mortality event in Potomac River
1968 Collapse of the Virginia fishery
1971 Major mortality event in Maryland’s Chesapeake Bay
1971 Unknown hyperplasia found in clam gill tissue
1971 Bruce Decision , overturning the regulation that restricted watermen from
working in county waters other than that in which they resided
1971 Daily catch limit reduced from 40 to 25 bushels; cull size increased from 2 to 2.25
inches
1972 Tropical Storm Agnes floods Chesapeake Bay with freshwater, sewage, and
sediments
1972 Fishery closed from June 1972 until June 1973, closed again in June 1973, and re-
opened in September 1973
1973 Daily catch limit reduced to 15 bushels
1975 Cull size reduced to 2 inches
1984 Disseminated neoplasia (DN disease) found in Maryland softshell clams
1990 Perkinsus sp. found in Maryland softshell clams
2002 Major mortality event in Maryland
After the hydraulic escalator dredge was developed and first used to harvest softshell
clams in 1951, landings rapidly increased. From 1955 through 1971, annual harvests of softshell
clams averaged about 460,000 bushels (370-460 million clams per year). The effect of a series
of fishery regulatory restrictions (1952-1958) is not documented, but conversations with several
clammers who were active during the first 2 decades of the fishery indicated that without these
restrictions, harvest totals could have been 3-4 times greater. Nevertheless, it is apparent that
softshell clam populations were substantial and widespread, particularly from the Potomac River
23
north to the Upper Bay. In hindsight, several events foreshadowed later catastrophes. In 1954 a
parasite, Perkinsus sp., was reported to be infecting softshell clams in Virginia; in 1965, a major
mortality event occurred in the Potomac drainage, essentially ending commercial harvesting in
that area; in 1968, the Virginia fishery (albeit modest with respect to Maryland’s) collapsed; and
in 1971 widespread mortalities occurred in Maryland, coincident, although not necessarily
correlated with, the report of an unknown hyperplasia found in the gill tissue of softshell clams
in Maryland. It is widely assumed that TS Agnes in 1972 caused the subsequent, severe declines
in softshell clam landings, and inability of populations to return to pre-1972 levels. The report in
1971 of an unknown hyperplasia, combined with what we now know about DN disease and its
devastating effects on clam populations, does suggest an alternative or companion causal factor
to TS Agnes effects.
Numerous factors shaped the post-1972 fishery, including the reduction of the daily limit
from 40 to 25 to 15 bushels, market forces (as most softshell clams caught in Maryland are sold
in New England, there has been a long standing attempt on the part of NE states to restrict
imports in order to protect local fisheries), the establishment of the razor clam fishery in the early
1980s, and the possibility that disease was eroding population levels. After TS Agnes, the
fishery averaged about 165,000 bushels per year from 1974 through 1983. In 1984, DN disease
was documented in Maryland softshell clam populations, coincident with a sharp decline in
landings. Harvests picked up briefly from 1987 through 1991, averaging 260,000 bushels per
year. In 1990, Perkinsus sp. infections were found in Maryland populations, harvests crashed in
1992 and since then have averaged less than 17,000 bushels per year and less than 4,000 bushels
per year over the last decade.
During the course of the present study, numerous aspects of the present status of softshell
clams in Maryland have been well documented and insights have been developed regarding past
events and conditions. As compared to abundance estimates from surveys conducted between
1962 and 1975, current softshell clam populations have declined by over 90%. There has been a
significant retraction in the range of habitats populated by this species, with most softshell clams
now found only in areas with structural overburden. In more exposed areas, we found recently
recruited clams to rapidly disappear, presumably to predation. Tabulated below are examples
from two areas with little substrate structure, Upper Hill and Bodkins Point in Eastern Bay and
one with significant structure (oyster shell), Buoy Rock in the Chester River. With disease
24
pressures similar among the areas, the data point to predation as the primary difference between
the sites.
Abundance of sublegal (<50mm) softshell clams, number per acre, on two sites in Eastern Bay
and one in the Chester River in 2004 Location May June July August November Upper Hill 104,000 20,000 16,000 5,000 2,000 Bodkins Point 61,000 12,000 6,000 1,000 Buoy Rock 22,000 18,000 16,000 14,000
We have estimated that at one time, softshell clams constituted, numerically, at least 35%
of Maryland’s large bivalve population (oysters, softshell, razor, and hard clams). The loss of
this population as a forage species, the magnitude of the resuspension of sediments via their
burrowing, and filtration capacity (it’s estimated that an individual softshell clam filters as much
water as does an oyster) has had to have had a profound effect on the Bay’s ecosystem.
During the present study, a substantial database was created regarding Perkinsus
chesapeaki infections and levels of DN disease. In 2005, a previously unrecognized viral
disease, gill epithelial cell nuclear hypertophy (GENH), was discovered in Maryland softshell
clam populations. We were able to correlate the 2002 mortality event with disease analyses, and
reasonably conclude that the greatest impediment to even modest increases in Mya arenaria
abundance are a suite of diseases that show no sign of diminishing.
Unfortunately, there are no landing records nor are there previous survey abundance
estimates of the stout razor clam, Tagelus plebeius. Initially, this species was a secondary focus
of the present project, but several findings and events elevated the project status of razor clams.
In 2000, the presence of P. chesapeaki infections was discovered in razor clams and in 2001, DN
disease was found in this species. It was not until late 2003, however, when large numbers of
razor clam boxes were observed in several areas, that consideration was given to redirect some of
this project’s resources to an expansion of razor clam surveys. After reports came in from
watermen in early 2004, that a major razor clam mortality event was occurring, it was decided to
focus on razor clam populations, beginning in March 2004. During the course of the 2004
surveys, it was determined that indeed a catastrophic mortality event had occurred, decimating
razor clam populations throughout the Bay. With few exceptions, mortality rates of razor clams
exceeded 50%, and it was estimated that by the end of 2004, over 70% of the entire T. plebeius
25
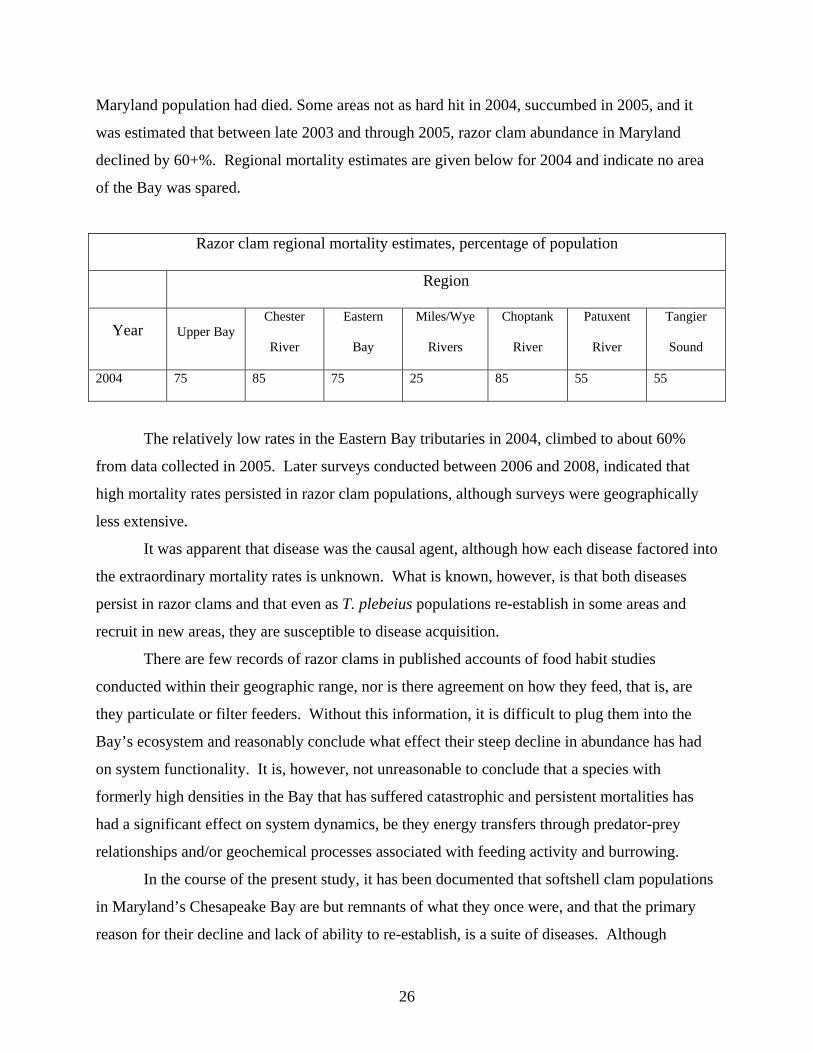
Maryland population had died. Some areas not as hard hit in 2004, succumbed in 2005, and it
was estimated that between late 2003 and through 2005, razor clam abundance in Maryland
declined by 60+%. Regional mortality estimates are given below for 2004 and indicate no area
of the Bay was spared.
Razor clam regional mortality estimates, percentage of population
Region
Year Upper Bay Chester
River
Eastern
Bay
Miles/Wye
Rivers
Choptank
River
Patuxent
River
Tangier
Sound
2004 75 85 75 25 85 55 55
The relatively low rates in the Eastern Bay tributaries in 2004, climbed to about 60%
from data collected in 2005. Later surveys conducted between 2006 and 2008, indicated that
high mortality rates persisted in razor clam populations, although surveys were geographically
less extensive.
It was apparent that disease was the causal agent, although how each disease factored into
the extraordinary mortality rates is unknown. What is known, however, is that both diseases
persist in razor clams and that even as T. plebeius populations re-establish in some areas and
recruit in new areas, they are susceptible to disease acquisition.
There are few records of razor clams in published accounts of food habit studies
conducted within their geographic range, nor is there agreement on how they feed, that is, are
they particulate or filter feeders. Without this information, it is difficult to plug them into the
Bay’s ecosystem and reasonably conclude what effect their steep decline in abundance has had
on system functionality. It is, however, not unreasonable to conclude that a species with
formerly high densities in the Bay that has suffered catastrophic and persistent mortalities has
had a significant effect on system dynamics, be they energy transfers through predator-prey
relationships and/or geochemical processes associated with feeding activity and burrowing.
In the course of the present study, it has been documented that softshell clam populations
in Maryland’s Chesapeake Bay are but remnants of what they once were, and that the primary
reason for their decline and lack of ability to re-establish, is a suite of diseases. Although
26

placement of structure in carefully chosen areas could result in establishing pockets of softshell
clams, it would be expensive and it isn’t possible to predetermine rates of success. Enhancing
either commerce or populations through aquaculture is not feasible given the virtual
impossibility of off-bottom culture (surface waters regularly attain lethal levels in the
Chesapeake Bay) and planting small clams in suitable bottom would simply provide a feeding
bonanza for a myriad of predators. The remnant fishery that currently operates in Maryland has
little known impact on softshell clam populations. This species does not appear to be heading
towards extinction in the Chesapeake Bay region, although, as it is at the southernmost limit of
its range, climate changes could result in an eventual deletion from the Bay’s species list.
The present study also documented the crash of a heretofore healthy and thriving razor
clam population. As with softshell clams, there aren’t any remedial or stabilizing techniques that
could be construed to be productive for razor clams and their disease status is chronic. Unlike
softshell clams, however, there is a degree of resilience in razor clam populations as evidenced
by both data collected during the present study and the continuing, although reduced,
commercial fishery.
LITERATURE CITED
Brown, R.S., Wolke, R.E., Saila, S.B., and Brown, C.W. 1977. Prevalence of neoplasia in ten
New England populations of the soft-shell clam. Ann. N.Y. Acad. Sci. 298:522-534.
Brown, R.S., Wolke, R.E., Saila, S.B., and Brown, C.W. 1977. Prevalence of neoplasia in ten
New England populations of the soft-shell clam (Mya arenaria). Ann. N.Y. Acad. Sci. 298:522-
534.
Burreson, E.M., K.S. Reece and C.F. Dungan 2005. Molecular, morphological, and
experimental evidence support the synonymy of Perkinsus chesapeaki and Perkinsus andrewsi.
J. Eukaryot. Microbiol. 52: 258-270.
Bushek, D., Holley, R.A., and Reece, K.S. 2000. Use of micromanipulation and ‘feeder layers’
to clone the oyster pathogen Perkinsus marinus. J. Euk. Microbiol. 47:164-166.
27
Dungan, C.F. and Hamilton, R.M. 1995. Use of a tetrazolium-based cell proliferation assay to
measure effects of in vitro conditions on Perkinsus marinus (Apicomplexa) proliferation. J. Euk.
Microbiol. 42:379-388.
Dungan, C.F., R.M. Hamilton, K.L. Hudson, C.B. McCollough and K.S. Reece 2002. Two
epizootic diseases in Chesapeake Bay commercial clams Mya arenaria and Tagelus plebeius.
Dis. Aquat. Org. 50:67-78.
Dungan, C.F., K.S. Reece, R.M. Hamilton, N.A. Stokes, and E.M. Burreson 2007.
Experimental cross-infections by Perkinsus marinus and P. chesapeaki in three species of
sympatric Chesapeake Bay oysters and clams. Dis. Aquat. Org. 76:67-75.
Dungan, C.F., E.C. Peters, and R.M. Hamilton 2007 (abstract). Virus infection associated with
nuclear hypertrophy in gill epithelial cells of Chesapeake Bay softshell clams Mya arenaria.
Presentation to the 2007 meeting of the World Aquaculture Society, San Antonio, Texas, March
2007.
Farley, C.A., Otto, S.V., and Reinisch, C.L. 1986. New occurrence of epizootic sarcoma in
Chesapeake Bay soft shell clams, Mya arenaria. Fishery Bulletin 84:851-857.
Farley, C.A., D.L. Plutschak, and R.F. Scott 1991. Epizootiology and distribution of
transmissible sarcoma in Maryland softshell clams, Mya arenaria, 1984-1988. Env. Health
Perspect. 90:35-41.
Hamons, F.L., Jr. 1971. Soft clam mortality study situation analysis preliminary report #1.
Maryland DNR Fish and Wildlife Administration, Annapolis, MD, 15pp.
Haven, D.S. 1970. A study of the hard and soft clam resources of Virginia. Virginia Inst. Mar.
Sci. Grant Rep. 69p.
28

Hidu, H. and C.R. Newell. 1989. Culture and ecology of the soft-shelled clam, Mya arenaria. In:
J.J. Manzi and M. Castegna (eds.). Clam Mariculture in North America. Elsevier, Amsterdam,
pp. 277-292.
Hollander, M. and D.A. Wolfe, 1973. Nonparametric Statistical Methods. John Wiley and Sons,
NY, NY.
Homer, M. and W.R. Boynton. 1978. Stomach analysis of fish collected in the Calvert Cliffs
Region, Chesapeake Bay-1977. Final Rep. To Md Dept. Nat. Res., Power Plant Siting Prog.,
Univ. Md, Ches. Biol. Lab. Refernce No. UMCEES 78-154-CBL.
Homer, M. and J.A. Mihursky. 1991. Spot. In S.L. Funderburk, S. Jordan, J.A. Mihursky, and D.
Riley (eds). Habitat Requirements For Chesapeake Bay Living Resources. Second Edition, Ches.
Research Consortium, Solomons, Maryland, p 11-1 to 11-19.
House, M.L., C.H. Chin, and P.W. Reno 1998. Soft shell clams Mya arenaria with
disseminated neoplasia demonstrate reverse transcriptase activity. Dis. Aquat. Org. 34:187-192.
Lipcius, R.N. and A.H. Hines. 1986. Variable functional responses of a marine predator in
dissimilar homogeneous microhabitats. Ecology 67: 1361-1371.
Mackin, J.G. 1961. Oyster disease caused by Dermocystidium marinum and other
microorganisms in Louisiana. Institute of Marine Science Publications 7:133-229.
McLaughlin, S.M. and Faisal, M. 2000. Prevalence of Perkinsus spp. in Chesapeake Bay
softshell clams, Mya arenaria Linnaeus, 1758 during 1990–1998. J. Shellfish Res. 19:349-352.
McLaughlin, S.M. and Faisal, M. 1998a Histopathological alterations associated with
Perkinsusspp. infection in the softshell clam Mya arenaria. Parasite 5:263-271.
29

30
Ray, S.M. 1966. A review of the culture method for detecting Democystidium marinum, with
suggested modifications and precautions. Proc. Natl. Shellfish. Assn. 54:55-69.
Reece, K.S., C.F. Dungan and E.M. Burreson 2008. Molecular epizootiology of Perkinsus
marinus and P. chesapeaki infections among wild oysters and clams in Chesapeake Bay, USA.
Dis. Aquat. Org. 82:237-248.
Reno, P.W. 1998. Soft shell clams Mya arenaria with disseminated neoplasia demonstrate
reverse transcriptase activity. Dis. Aquat. Org. 34:187-19
Smolowitz, R.M., Miosky, D., and Reinisch, C.L. 1989 Ontogeny of leukemic cells of the soft
shell clam. J. Invertebr. Pathol. 53:41–51.
Virnstein, R.W. 1977. The importance of predation by crabs and fishes on benthic infauna in
Chesapeake Bay. Ecology 58: 1199-1217.
Walker, C., S.A. Boettger, J. Mulkern, E. Jerszyk, M. Litvaitis, and M. Lesser 2009. Mass
culture and characterization of tumor tells from a naturally occurring invertebrate cancer
model: Applications for human and animal disease and environmental health. Biol. Bull.
216:23–39.