Embed Size (px)
Citation preview

1
ASSESSMENT OF AGRONOMIC BENEFITS OF MIXED
CROPPING SYSTEM AND SOIL HEALTH
By

2
Sher Afzal 2005-ag-1428
M.Sc. (Hons.) Agriculture
A thesis submitted in partial fulfillment of the requirements for the degree of
DOCTOR OF PHILOSOPHY
IN
AGRONOMY
DEPARTMENT OF AGRONOMY
UNIVERSITY OF AGRICULTURE
FAISALABAD
PAKISTAN
2017
Declaration

3
I hereby declare that the contents of the thesis “Assessment of agronomic benefits of mixed
cropping system and soil health.” are the product of my own research and no part has been
copied from any published source (except the references, standard mathematical or genetic
models/equations/formulate/protocols etc). I further declare that this work has not been
submitted for awards of any other diploma/degree. The university may take action if the
information provided is found inaccurate at any stage. (In case of any default the scholar
will be proceeded against as per HEC plagiarism policy).
Sher Afzal
Regd. No. 2005-ag-1428

4
The Controller of Examination,
University of Agriculture,
Faisalabad.
We, the supervisory committee, certify that the contents and the form of thesis
submitted by Mr. Sher Afzal, Regd. No. 2005-ag-1428 have been found
satisfactory and recommended that it be processed for valuation by the
External Examiner (s) for the award of degree.
SUPERVISORY COMMITTEE:
CHAIRMAN :____________________________________
(Dr. NADEEM AKBAR)

5
MEMBER :____________________________________
(Prof. Dr. RIAZ AHMAD)
MEMBER :____________________________________________
(Dr. MANSOOR HAMEED)

6
This humble effort is
Dedicated To
My Beloved
PARENTS
BROTHERS, SISTERS AND MY BETTER HALF
Whose hands are always raised in prayer for me

7
And
who are with me to feel the bud of their wishes and prayers
blooming into a flower
ACKNOWLEDGMENTS
All the praises and thanks are for Almighty ALLAH who bestowed me with
the potential and ability to contribute a little to the existing scientific knowledge. Trembling
lips and wet eyes praise for The Holy Prophet Muhammad (P.B.U.H) for enlightening
our conscience with the essence of faith in Allah, converging all His kindness and mercy
upon him.
If there were dreams to sell, merry and sad to tell and crier rings the bell, what
would you buy, I will say that “University charming days”. Actually it is impossible but it
shows my blind love to this institution, which is homeland of knowledge, wisdom and
8
intellectuality. I love my institute with the core of my heart. I am proud of being student of
this university.
The work presented in this manuscript was accomplished under the sympathetic
attitude, brotherly behavior, animate direction, observant pursuit, scholarly criticism,
cheering perspective and enlightened supervision of Dr. Nadeem Akbar, Assistant
Professor, Department of Agronomy UAF, his thorough analysis and rigorous critique
improved the quality of this dissertation. I am grateful to his ever-inspiring guidance, keen
interest, scholarly comments and constructive suggestions throughout the course of my
studies, research and in thesis completion.
I deem it utmost pleasure in expressing my gratitude with the profound thanks to
Prof. Dr. Riaz Ahmad, Department of Agronomy UAF, for providing me with strategic
command at every step. I extend deep emotions of appreciation, gratitude and indebtedness
for his valuable guidance. I offer my sincere thanks to Dr. Mansoor Hameed, Department
of Botany UAF, for his scholastic guidance and immense moral support.
Words are lacking to express my humble obligation to my affectionate Father,
Mother, Brothers and Sisters for their love, good wishes, inspirations and unceasing
prayers for me. How can I forget, my wife Areej Ihsan, who’s love, prayers and
anticipations made me to walk through the hurdles and without which the present
destination would have been mere a dream.
Friends are valuable asset. I am very thankful to my friends Qamar ud Din sahib,
Hameed ud Din sahib, Dr. Qaiser Maqsood, Dr. Irfan Akram, Dr. Aamir Iqbal, Rai
M. Ajmal, Dr. Ahmad Mustafa, Dr. Abdul Manaan Saleem, Dr. Irfan Shoukat &
Nadeem Randhawa for their moral support and making this assignment enjoyable.

9
Finally, I apologize if I have caused offence to anybody and the errors those remained
in the manuscript are mine alone.
May Allah bless all these people with long, happy and peaceful lives. (Ameen).
Sher Afzal
CONTENTS
Chapter No. Title Page No.
1 INTRODUCTION 1
2 REVIEW OF LITERATURE 7
3 MATERIALS AND METHODS 29
4 RESULTS AND DISCUSSIONS 48
5 SUMMARY 100
- REFERENCES 103

10
LIST OF CONTENTS
Sr. No. TITLE Page No.
CHAPTER 1 INTRODUCTION 1
CHAPTER 2 REVIEW OF LITERATURE 7
2.1. Cropping system 7
2.2. Agronomic benefits 20
2.3. Soil Health 21
2.4. Economic benefits 25
CHAPTER 3 MATERIALS AND METHODS 29

11
3.1. Site Characteristics 29
3.1.1. Soil Health 29
3.1.2. Soil analysis 29
3.1.3. Mechanical analysis 29
3.1.4. Chemical analysis 29
3.1.5. Meteorological data 31
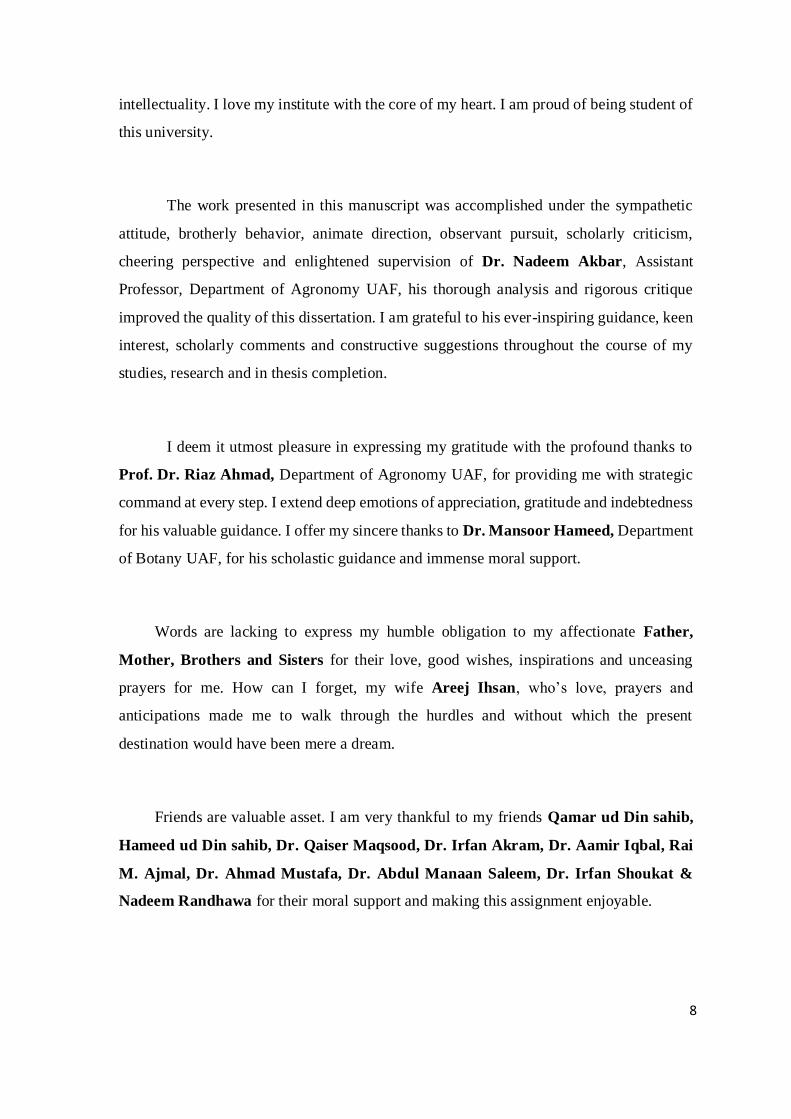
3.2. Studies on different cropping systems 31
3.3. Agronomic practices 35
3.3.1. Cropping system 1 35
3.3.1.1. Maize (Grain) during 2013 35
3.3.1.2. Wheat during 2013 35
3.3.1.3. Rice during 2014 35
3.3.1.4. Wheat during 2014 36
3.3.2. Cropping system 2 36
3.3.2.1. Maize (Grain) during 2013 36
3.3.2.2. Gram during 2013 36
3.3.2.3. Millet during 2014 37
3.3.2.4. Sarson during 2014 37
3.3.3. Cropping system 3 37
3.3.3.1. Mungbean during 2013 37
3.3.3.2. Rice during 2013 38
3.3.3.3. Wheat during 2013 38
3.3.3.4. Cotton during 2014 38
3.3.3.5. Sarson during 2014 39

12
3.3.4. Cropping system 4 39
3.3.4.1. Mungbean during 2013 39
3.3.4.2. Rice during 2013 39
3.3.4.3. Berseem during 2013 40
3.3.4.4. Maize (Grain) during 2014 40
3.3.4.5. Sesame during 2014 40
3.3.4.6. Wheat during 2014 40
3.3.5. Cropping system 5 41
3.3.5.1. Sunflower during 2013 41
3.3.5.2. Mungbean during 2013 41
3.3.5.3. Wheat during 2013 41
3.3.5.4. Jantar during 2014 42
3.3.5.5. Rice during 2014 42
3.3.5.6. Gram during 2014 42
3.3.6. Cropping system 6 42
3.3.6.1. Sunflower during 2013 42
3.3.6.2. Mungbean during 2013 43
3.3.6.3. Barley during 2013 43
3.3.6.4. Cotton during 2014 43
3.3.6.5. Wheat during 2014 44
3.4. Harvesting and Threshing 44
3.5. Data Collection 44
3.5.1. Agronomic Data 44
3.5.1.1. Plant height at maturity (cm) 44
3.5.1.2. Stem diameter (cm) 45
3.5.1.3. Grain weight per cob (g) 45

13
3.5.1.4. Cob length (cm) 45
3.5.1.5. Number of tillers m-2 45
3.5.1.6. 1000-grain weight (g) 45
3.5.1.7. Biological yield (t/ha) 45
3.5.1.8. Grain yield (t/ha) 45
3.6. Analysis of Data 46
3.6.1. Cost of production of various cropping systems 46
3.6.2. Gross income 46
3.6.3. Net profit 46
3.6.4. Productivity System 46
3.6.5. Statistical Analysis 47
CHAPTER 4 RESULTS AND DISCUSSION 48
4.1. Growth and yield components of maize affected by various
cropping systems 50
4.1.1. Plant height (cm) 50
4.1.2. Stem diameter (cm) 50
4.1.3. 1000 grain weight (g) 51
4.1.4. Grain weight/cob (g) 51
4.1.5. Cob length (cm) 51
4.1.6. Grain yield (t/ha) 52
4.2. Growth and yield components of rice affected by various
cropping systems 54
4.2.1. Plant height (cm) 54
4.2.2. No. of Tillers/Hill 54
4.2.3. 1000 grain weight (g) 55

14
4.2.4. No. of panicles/hill 56
4.2.5. Paddy yield (t/ha) 56
4.3. Growth and yield components of wheat affected by various
cropping systems 58
4.3.1. Plant height (cm) 58
4.3.2. No. of tillers/m2 58
4.3.3. 1000 grain weight (g) 59
4.3.4. No. of spikes/m2 59
4.3.5. Biological Yield (t/ha) 60
4.3.6. Grain yield (t/ha) 60
4.4. Growth and yield components of mungbean affected by 63
various cropping systems
4.4.1. Plant height (cm) 63
4.4.2. No. of pods/plant 63
4.4.3. 1000 grain weight (g) 64
4.4.4. Biological yield (t/ha) 64
4.4.5. Grain yield (t/ha) 65
4.5. Growth and yield components of gram affected by various
cropping systems 67
4.5.1. Plant Height (cm) 67
4.5.2. 100 grain weight (g) 67
4.5.3. Number of grains/plant 68
4.5.4. Grain yield (t/ha) 68
4.6. Growth and yield components of cotton affected by various
cropping systems 71
4.6.1. Plant height (cm) 71

15
4.6.2. Number of branches/plant 71
4.6.3. Number of bolls/plant 72
4.6.4. Cotton seed yield (t/ha) 72
4.6.5. Seed cotton yield (t/ha) 72
4.6.6. Lint yield (t/ha) 73
4.7. Growth and yield components of sarson affected by
various cropping systems 75
4.7.1. Plant height (cm) 75
4.7.2. Seed yield (kg/ha) 75
4.7.3. Biological yield (kg/ha) 76
4.8. Growth and yield components of sunflower affected by
various cropping systems 78
4.8.1. Plant height (cm) 78
4.8.2. 1000 grain weight (g) 78
4.8.3. Grain yield (g/plant) 79
4.9. Soil nitrogen status as affected by different cropping
systems 81
4.10. Soil phosphorous status as affected by different cropping
systems 83
4.11. Soil potassium status as affected by different cropping
systems 85
4.12. Soil organic matter status as affected by different cropping
systems 87
4.13. Soil C/N ratio as affected by different cropping systems 89
4.14. Soil pH as affected by different cropping systems
91
4.15. Net profit of different cropping systems 93
4.15.1. Total cost 93

16
4.15.2. Total income 93
4.15.3. Net profit 93
4.16. System productivity (SP) of different cropping systems 96
4.17. Energy equivalent 99
CHAPTER 5 SUMMARY 100
Conclusion 102
References 103
Annexures 114
LIST OF TABLES
Table
No. Title Page
3.1 Physical characteristics of soil 30
3.2 Chemical characteristics of soil 30
3.3 Crops durations and sowing dates 33
4.1 Growth and yield components of maize affected by various cropping systems 49
4.2 Growth and yield components of rice affected by various cropping systems 53
4.3 Growth and yield components of wheat affected by various cropping systems 57
4.4 Growth and yield components of mungbean affected by various cropping
systems 62
4.5 Growth and yield components of gram affected by various cropping systems 66
4.6 Growth and yield components of cotton affected by various cropping systems 70
4.7 Growth and yield components of sarson affected by various cropping systems 74
4.8 Growth and yield components of sunflower affected by various cropping
systems
77

17
4.9 Soil nitrogen status as affected by different cropping systems 80
4.10 Soil phosphorus status as affected by different cropping systems 82
4.11 Soil potassium status as affected by different cropping systems 84
4.12 Soil organic matter status as affected by different cropping systems 86
4.13 Soil C/N as affected by different cropping systems 88
4.14 Soil pH as affected by different cropping systems 90
4.15 Net profit of different cropping systems 92
4.16 Productivity system of different cropping systems 95
4.17 Energy equivalent of different crops used in different cropping systems 97
ABBREVIATIONS AND ACRONYMS
% Percentage
@ At the rate of
Cm Centimeter
G Gram
ha-1 Per hectare
t ha-1 Tons per hectare
m-2 Per square meter
Rs. Rupees
Ppm Parts per million

18
MRR Marginal rate of return
BCR Benefit cost ratio
LSD Least significant difference
DAS Days after sowing

19
ABSTRACT
Diversified cropping systems are also a major economic activity to those in rural areas,
providing principal food for majority of people and affecting their livelihoods and health
of urban and rural poor. Cropping system is a producer’s map of their approach to
production. Intensive cropping systems in irrigated areas of Punjab are cotton-wheat, rice-
wheat and mixed cropping systems having wheat as an essential crop. The mixed cropping
system does not appear to give its economic potential during kharif period. A research
work was planned to develop a cropping system under the prevailing conditions of
Faisalabad, Punjab where mixed cropping system has been adopted by most of the farmers.
Maize, Rice, Sunflower, Mungbean, Sarson (mustard), Wheat, Barley, Cotton, Gram,
Millet, Berseem, Sesame and Jantar were grown. Randomized complete block design was
used in the research with three replications. All the agronomic parameters were observed
during this study and analyzed by statistics computer program. The variances among
significant means were assessed by Least Significant Difference test at 5% probability
level. Results showed that yield and growth of key crops like wheat, cotton, maize, millet,
rice and sunflower is increased when grown after legume and restorative crops. Growth
and yield of major crops like cotton, maize, wheat, millet, sunflower and rice is decreased
when grown after non- legume and exhaustive crops. Nutrients contents in soil after
harvesting increased after growing the legume and restorative crops. More net profit and
benefit cost ratio was shown by S1 cropping systems.

20
CHAPTER 1
INTRODUCTION
Exhaustive as well as intensive agricultural systems are most of the times based on
enhancing the production of monocultures. In such systems, crop diversity is abridged to
one or very few species which are genetically homogeneous. The planting design is
uniform, balanced, and external inputs are usually supplied in huge quantities. Such systems
are commonly criticized these days for their negative environmental effects, like soil
erosion and degradation, loss of biodiversity, fossil fuel use and chemical contamination
(Tilman et al., 2002). On the other hand, multispecies cropping systems may often be
considered to be an applied application of ecological principles that are based on
biodiversity, other natural regulation mechanisms and plant interactions. According to
Singh (1972), cropping system is type and arrangement of crops grown on a specific area
of land for a specific period of time. Zandastra (1976) concluded that it could be defined as
crop production enterprise used to drive benefits from a given resource and specific
environment condition. It might be a systematic rotation of dissimilar crops in which the
crops follow a fixed order of land or it might consist of only one crop year after year on the
same land. They are expected to have potential advantages in stability of outputs,
productivity, ecological sustainability and resilience to disruption, even though they are
occasionally considered more difficult to manage. Confronted with the critical situation of
exhaustive monocultures, novel conceptual ways of making sustainable agro-ecosystems
are being considered now a days (Malézieux and Moustier, 2005b). Many agronomists
freshly proposed that old-style multispecies systems can be used as models for scheming
sustainable cropping systems (Gliessman, 2001; Altieri, 2002).
Now agricultural research has enough tool-box of models and methods for
technology advancement in mono-specific cropping systems, but then again its suitability
for more multifaceted systems is uncertain. In most of the cases methods for designing
multispecies systems hardly exist. Universal agronomy concepts (cropping system, crop
management sequences), and particularly the tools which are derived from that discipline,
barely deal with the involvedness of multispecies systems. With some degree of genetic
heterogeneity plant communities have advantages over pure stands, while debates and

21
disagreements remain on the thorough role of biodiversity in ecosystem functioning and
productivity is reported in many studies (Garcia-Barrios, 2003). Current work by many
authors has thus revealed positive associations between the richness of different species
and many ecological processes such as primary production, nutrient withholding and
bounciness after stress. However, research studies have predominantly focused on ordinary
prairie ecosystems or the studies on natural forest ecosystems (Vila et al., 2003; Kelty,
2006; Erskine et al., 2006). On cultivated ecosystems very few studies have been
concentrated. Biodiversity in agro-ecosystems, may (i) attribute to reduce the risk of crop
failure and constant biomass production in unpredictable prevailing environments, (ii)
reestablish troubled ecosystem services, such as nutrient and water cycling, and (iii)
minimize risks of invasion, diseases and pests through heightened direct control of pests or
biological control (Gurr et al., 2003).
Many definitions of soil health have been proposed. The most common to all the
soil health definitions is the ability of soils to function efficiently at present and in the future
days. An extended version of this definition grants soil quality as: “the capacity or the
ability of a certain kind of soil to function, within the natural or achieved ecosystem
boundaries, to sustain animal and plant productivity, enhance or maintain water and quality
of air, and support habitation and human health”. Nevertheless, no soil is supposed to
provide all these desired functions, some of which are the result of human modification and
some of those are present in natural ecosystems (Govaerts et al., 2006). Inherent quality of
soils as attributed to their chemical, physical and biological properties inside the restrictions
set by the climate and ecosystems, but the land manager is the ultimate determinant of soil
health (Doran, 2002). Sensitivities of what establishes a good soil fluctuate depending on
individual primacies with respect to intended land use, soil function and interest of the
desired observer (Shukla et al., 2006). Inside the framework of agricultural productivity,
good quality soil health relates to maintenance of good quality productivity without
noteworthy soil or environmental dilapidation (Govaerts et al., 2006). The evaluation of
soil quality can be considered as a principal indicator of the sustainability of land
supervision or management (Doran, 2002).

22
In the areas of small-farm situations wherever most of the intercropping is being
practiced by farmers with their limited resources, the social and economic situation is very
much different than other areas. The complication of such farming systems is basically due
to the many biological, climatological, social and economic factors that interact with each
other within the total land of small farm environment. Further-more their inter-actions and
the complexity of these factors, there is a broad range of determinations of the farm family,
which includes production of food, minimizing the risk of income and providing constancy
of productivity of food and income through as plentiful of the year as possible. With a
minimal land resource and with limited or no capital, this must all be accomplished.
Multiple cropping in most parts of the world is one of the on farms approach that
farmers use to meet these promising challenges (Swift et al., 2004). Cropping systems may
include mono cropping, double cropping, triple cropping and multiple cropping systems.
In different parts of the world mono cropping system is considered an agricultural practice
in which same type of crop is planted year after year, without resting the soil or practicing
crop rotation. Double cropping system is the practice of consecutively producing of two
crops of either like or unlike commodities on the same land within the same year. Triple
cropping system means planting and harvesting three crops in one year from the same filed.
Multiple cropping system means growing of 3 or more than 3 crops in one year on the same
field in irrigated areas of Punjab.
Faisalabad, Punjab lies in rolling flat plains of northeast part of the province, it lies
between the longitude 73°-74° East and the latitude 30°-31.5° North. It lies at an elevation
of 184 meters (604 feet) above sea level. This city of Punjab properly covers an area of
around 830 square kilometers (320 square miles). There are no distinct natural boundaries
between Faisalabad and the adjoining districts of the province. The River Chenab flows
nearly 30 km (19 miles) to the north-west direction while the River Ravi flows in the form
of meanders about 40 km (25 miles) south-east of this city. The canal lower Chenab is the
core source of irrigation water for this area, which meets the 80% requirements for
cultivated land. The soil of Faisalabad consists of alluvial deposits mixed with loess having
calcareous characteristics, making it very fertile and suitable for many crops.
Due to more evapotranspiration, this city Faisalabad features an arid climate. The
climate of this district can experience extremes, having the highest temperature in summer

23
50°C (122°F) and the lowest winter temperature of −1°C (30.2°F). The average maximum
and minimum temperature of this city in summer are 39°C (102°F) and 27°C (81°F),
respectively. In the winter season it averages at around 21°C (70°F) and 6°C (43 °F)
respectively. The summer season which is the longest season starts from April and
continues until October. The hottest months are May, June and July. The winter season
usually starts from mid of November and continues until March. The coldest months are
December, January and February. The average per annum rainfall is only about 400 mm
(16 in) and is highly seasonal most of the times with nearly half of the annual rainfall in the
two months of July and August. The wild life of this area includes Foxes, Jackals, Pigs and
Wild Cats. Among the famous birds, Dove, Tilliar, Lal Mena, Bias, Parrot, Partridge,
Pigeon, Quail, Pochard, Mallard, and Teal are found in most parts of the district. Faisalabad
district is famous for its fruit production and also un-parallel for its agricultural
productivity. Significant fruits like Malta, Fruiter, Mango, Kinno, Guava and Faalsa are
also grown here. The total area which is under fruit orchards is 34,517 acres.
This area has grown in importance as the grain belt of the province Punjab. In the
wake of colonization, prosperous towns and villages sprung up. The Kharif crops are
sugarcane, maize, rice and bajra. The crops in Rabi season are wheat, gram, barley and
barseem. There are also some other crops which are known as Zaid Kharif and Zaid Rabi
crops. The crops of Zaid Kharif are toria, raiya and sarson while the only Zaid Rabi crop is
tobacco. The use of tractors is also becoming very popular and is replacing the conventional
ploughs used for tillage. Per hectare yield of crops has been increased by the use of
improved variety of seeds, pesticides and fertilizers. In this way the prosperity is spreading
among the peasant community which has sweated for three generations to convert a barren
land into verdant fields. There is a dire need of modified suite of cropping system which
must be based on modern and scientific agricultural practices. These practices must be
economical, sustainable, viable, acceptable and less exhaustive to farming community of
the area because the currently used cropping system is out dated and insignificant returns
are obtained by the local farmers. Simultaneously such cropping system is projected to
maximize farm productivity in terms of increased farm production, to achieve maximum
water use efficiency and better water distribution and best consumption of farm machinery,

24
labor and other resources. Some of the cropping systems implemented by the farmers were
considered very exhaustive and fruitless that results not only in low yield but also causing
tenacious decline in soil production. Improved crops arrangements include improve soil
productivity, green manuring, fertility and higher economic returns that were of primary
importance to the farmers. The economic use of various resources and inputs would
definitely lower production cost, resulted in beneficial farming which was the burning need
of the farming community as the cost of inputs was very high.
Green manuring vetch and fallow treatments gave equivalent grain yield, straw
yield and plant height. When vetch biomass was picked and detached at flowering stage,
yield of bread wheat was lowered. However, when livestock production was considered,
the total farm productivity could be higher. Hence, most of the times, growing forage
legumes is preferred to fallowing the land (Belachew and Abera, 2011). The beneficial
effects of legumes in improving and maintaining soil fertility in different crop production
systems are eminent. In spite of the knowledge, legume cultivation has been reduced in
many agricultural systems, which also includes the rice based cropping systems in tropical
Asia. The waning in legume cultivation was driven by the need for staple cerealrice and
most importantly the policies of the national government to make sure the selfefficiency in
rice production. Most of the productive areas were used for multiple cropping of rice, and
the legumes were either regulated to marginal lands or not cultivated at all. As a result soil
health has been affected badly. Lessened availability and high price have caused in low per
capita feasting of grain legumes by the poor people. Although grain legumes are major
sources of protein to them in many Asian countries.
On-farm partaking research needs to be supported in our country to adopt and adapt
high-yield legume technologies (variety + agronomic management of crops). Commodities
to be produced in combination must be highly competitive in the open market not only to
compensate for the naturally limited competitive potential of nonirrigated rice but also to
generate enough economic value necessary to fuel investments for further modernization.
Chnadera and Gautam (1997) reported that net return was highest in grain-rice cropping
systems.
Apart from all above facts, till now no systematic research has been done on
cropping system. So, a comprehensive study was needed to convey the knowledge to small

25
farmers about potentially effective cropping system, and also to bring awareness among the
people about the potential use of farm resources in a better and economic way.
Also there was a need to study the impact of the legume crops and vegetables in the
cropping system. Hence this research study was proposed with the following objectives.
To evaluate the productivity of mixed cropping systems under Faisalabad (Punjab,
Pakistan) conditions and its impact on soil health.
To compare the economic analysis of different cropping systems.
The hypothesis of the research project was ‘under mixed cropping system,
leguminous crops improve soil health but compromised production, whereas, exhaustive
crops are high in production but decrease soil health’.

26
CHAPTER 2
REVIEW OF LITERATURE
The relevant research work done in the past on the various aspects of the project is
reviewed as under:-
2.1. Cropping system
Malezieux and Moustier (2005b) found that after facing the problem of intensive
monoculture system, new conceptual ways of constructing sustainable agro-ecosystems
should be sought. Several agronomists now are of the view that traditional multispecies
systems could play a role of models for developing sustainable cropping systems. Jackson
(2004) proposed replicating the structure of the grassland ecosystem, with a number of
species of different functional groups, to achieve resilience to changes in climate and water
supplies, and to control pests and other natural disturbing agents. The field experiment
conducted from 1999 to 2002 on a sandy clay loam (Inceptisol) to evaluate nine
predominant cropping systems in West Bengal, India. Productivity, energy use efficiency,
and nutrient uptake generally increased with increasing cropping intensity (Biswas et al.,
2006).
Agronomic and economic analysis indicated that including a legume crop and low
fertilizer application in low input/ sustainable system performs better under drought
condition and net returns appeared to be less variable than conventional systems (Smolik
and Dobbs, 1991). Significantly higher wheat yield was observed in fallow – wheat system
compared to wheat - mung bean system. They attributed this to low soil moisture available
after mungbean than after fallow during early growth period of wheat, however, they did
not discuss any data on soil moisture. They had reported significantly high net returns with
mungbean- wheat system (RS.784ha-1) than wheat fallow system (RS.3327ha-1) (Zahid et
al., 1991). Reduced tillage in continuous cotton resulted in slightly higher net returns than
conventional tilled cotton while using less diesel fuel. Adding wheat as a winter cover crop
to reduced tillage under continuous cotton system reduced soil erosion by approximately 5
ton acre-1 year-1 and also reduced net returns by $16 acre-1 due to increased purchase of
inputs (Bryant et al., 1992).

27
Corn - soybean-cropping systems significantly increased the yields of both crops,
Cereal-legume system positively affected plant nutrient concentration and accumulation.
Both crops maintained shoot nutrient concentrations up to adequate level. However,
nutrient accumulation and concentration in soybean was less affected than corn. They also
reported the general improvement in root function under this type of cropping system
(Copeland and Crooks, 1992).
Continuous wheat, wheat - wheat - fallow and wheat fallow had significant effect
on the proportion of phosphorus and its distribution among labile and fixed states without
N and P fertilizer application the proportion of total soil P that were sequentially extractable
with an anion exchange resin. Sodium bicarbonate (Na(HCO3)2) and sodium hydroxide
(NaOH-'Pi and Po) were reduced to an extent in continuous wheat than in rotations like
wheat - wheat - fallow and wheat - fallow rotations. The addition of inorganic P (Phosphate
fertilizer) increase total P and Pi fractions significantly with the greatest change in more
labile Pi (available forms) but had no effect on labile Po forms. Contrarily, the addition of
nitrogen fertilizer increased the proportion of P in labile Po fractions in all the concerned
rotations while it decreased the proportion of P in labile Pi forms. The combination of
fertilizers of N and P sources generally increased both labile forms of Pi and Po. Mackenzie
(1992) proposed that continuous wheat-wheat rotation coupled with fertilizer inputs
(nitrogen and phosphorus) had the most optimistic effect on cycling and transformations of
Phosphorus.
Wheat - fallow (WF) and wheat -- sorghum -- fallow (WSF) yielded more than
wheat - wheat (WW) in both years and wheat - fallow (WF) yielded more than wheat -
sorghum - fallow (WSF) in 1989. No till increased the yield of WF and WSF 1989 but cold
temperature reduced the number of spikes per square foot and yield of WSF -- no till (LT)
in 1990. Tillage did not affect WW yields. Sorghum " fallow and WSF yielded more than
sorghum - sorghum (SS) in both years sorghum -- fallow yielded less than WSF in 1989
because of lack of maturity before frost, but tillage did not affect WSF yield. Yield increase
of both crops was often accompanied by improved water use efficiencies (Norwood, 1992).
In a field experiment of five cropping systems as main plots and three levels of
water availability as sub-plots, Rodge et al. (1992) concluded that sorghum-wheat, pearl
millet-wheat, and black gram-sorghum systems resulted in 37, 52, 69, and 70% less net

28
income, respectively than the cotton-summer ground nut system. Sorghum-safflower was
the most efficient water user and economically beneficial under sub optimal conditions of
water availability.
Stevens et al. (1992) studied the effects of seven cotton cropping systems and
reported no major difference in productivity of different cropping systems during 1986. In
1987, yield decreased as a result of increase in tillage intensity but this trend was reversed
in 1988. Variation in precipitation distribution in each growing season had contributed to
this variation in yield along with fruiting response to cover crops and tillage in 1986.
Reduced tillage in cotton following wheat had 16 fruiting sites compared with 32 sites with
cotton under conventional tillage system. Reduced abscission in cotton planted in no till or
reduced tillage system into wheat offset the reduced fruiting site production. The number
of fruiting sites when averaged over years showed that reproductive branches were 11%
less with no till cotton. Fruiting of cotton without any tillage operation and with cover crops
like vetch was similar to reduced and conventional till cotton.
Urnrani et al. (1992) conducted an experiment to study the sustainability of
cropping systems under rain fed conditions and assessed that gram crop was sustainable
than sorghum and safflower. Gram included in rotation gave better results than
continuously growing sorghum or safflower. It also gave higher and sustainable yield index.
Rate of recommended level of fertilizer was reduced to one half and it was found
satisfactory compared with the recommended dose of fertilizer for sorghum and safflower
under dry farming. Hence cropping of gram in rotation with recommended level of
fertilizer, showed significant effect rather than cropping of sorghum alone at 50 kg N ha-1.
Six crop sequences viz.: maize-wheat, rice (wet land) - wheat, rice (wet
land)'berseem (Trifolium), ground nut-wheat, cotton-wheat and pearl millet'- berseem were
studied by Barar et al. (1993). Fertilizer treatments were control 10, 100 and 125% NPK.
A base application of 28 kg K ha-1was applied to each crop. Soils were sampled after ten
cropping cycles. They concluded that application of P increased Olsen extractable P in the
soil profile under all crop sequences although it was less under rice based sequences (12.5
- 14.1 ug/g soil compared with 18.8 - 20.3 ug/g soil for the other crop sequences). The
differences in the Olsen extractable P in the control and the fertilizer treated plots were
large in the top 30 cm and decreased with depth. The P uptake by crops was significantly
related to Olsen extractable P in the 0-15 cm soil depth,

29
Santos et al. (1993) tested nine cropping systems where soybean was seeded after
different winter crops (oats, barley, rapeseed, flax, and wheat) distributed in several crop
rotation systems and stated that soybean showed high values of primary yield component
sand plant height which reflected directly in grain production. In relatively dryer years,
when the winter crop residue decomposition was slower, grain yield, plant population, plant
height and insertion of first pods were affected mainly after rapeseed. The study brought
both economic and agronomic merits for farmers of the area to adopt these new production
methods.
Kurlekar et al. (1993) studied the performance of crop rotation receiving 75 and
100% recommended N, P and K fertilization and observed that gross and net returns from
sorghum-wheat green manuring (sunhemp) and soybean-wheat rotations were significantly
higher than returns from sorghum-wheat or sorghum-chickpea rotations and further added
that soil fertility was enhanced by the adoption of remunerative sequences.
A field trial was directed on rice in 1991/92 at Siruguppa, Karnataka by Setty and
Chalmabasananna, 1993. Rice cv. IR-66 was grown during the Summer [monsoon] season
followed by sunflowers cv. Morden, sesame cv. E-8, mustard [Brassica juncea] cv.
Varadan, Bengal gram (Cicer arietinum) cv. A-1, maize cv. Deccan and wheat cv. HD2189
or rice. Grain/seed yields in the rice-mustard system were 5.71 and 0.79 t/ha, respectively.
This cropping system gave the highest net return.
Wani and Umrani, 1993 conducted a field experiment in 1983-85 at Rahuri,
Maharashtra, intercropping L. Ieucocephala cv. Peru with Stylosanthes hamata, sorghum
in M-35 or cowpeas cv. EC-4216 produced mean forage yields of 17.2, 31.7 and 23.8 t ha-
1 respectively. Total forage yield increased with increase in rate (0, 50, 75 and 100 kg ha -
1), Sorghum intercropped with L. Ieucocephala and sorghum under recommended N rate
produced the highest forage yield and net returns.
Yadav et al. (1993) performed an experiment during the Summer [monsoon]
season at Indore, Madhya Pradesh. In these experiments, cotton cv. JKHY-1 and Hy-4 were
grown alone or intercropped with green gram (Vigna radiata), black gram (Vignu mungo)
or soyabeans in uniform (90 X 90 cm) o skipped (90 X60-180 cm) rows Intercropping with
green gram, black gram o soybeans gave seed cotton yields of 1566, 1507 and 1319 kg ha-
1, respectively compared with 1512 kg from sole cotton crop. Seed cotton yield was not

30
significantly changed by sowing pattern, but the yield of the intercrops was higher in
uniform rows. All the intercropping treatments gave higher net returns than the sole crop
and the highest net return was obtained with the soybeans intercrop. Ahmad (1994)
concluded that high cropping intensity could be preserve organic matter. He further
emphasized that the soil with higher organic content, retain moisture for a long period and
leguminous crops are most suitable for this purpose.
Badaruddin and Meyer (1994) reported 28% higher soil nitrate N level, following
legumes than the one following N fertilized wheat. Yield of wheat grain following grain
legumes was almost equivalent to that following a wheat crop that was fertilized with 75
kg N ha-1. Accumulation of total N by wheat following grain legumes was 9% higher than
wheat following wheat but it was almost 13% lower than those of wheat following fallow
field. Nitrogen use efficiency (NUE) for wheat following legumes, was up to 32% higher
than those for wheat- fallow and it (NUE) was up to 21% higher than those for continuous
wheat-wheat cropping system.
During the monsoon seasons, in a field experiment, Billore et al. (1994)
investigated that pigeon peas given no fertilizer and those given recommended fertilizer
(NP) gave mean seed yields of 1 .04 and 1.57 t ha-1. In another experiment soybeans were
grown in the Summer season and given the recommended fertilizer (NPK) and then
followed, in Winter [winter] seasons, by Cicer arietinum that was given 50% of the
recommended fertilizer (NP) gave mean seed yields of 1.49 and 1.14 t ha -1 respectively.
The net returns were the highest as compared to other fertilizer rat combinations.
George et al. (1994) reported that in low land rice-based cropping systems, weeds
were most effective in conserving soil nitrogen during dry to wet (DTW) period but
legumes were preferably more suitable N conserving crops as legume allowed the harvest
of the crop as an economic product or more N to recycle in a subsequent flooded rice.
In the Malaprabha Command Area, Koppad et al. (1994) reported in a summer
(monsoon), maize/Winter (winter) wheat continuous cropping system the costs and returns
relation to newly available irrigation facilities, Farms in the head, middle and tail reaches
of an irrigation canal were compared. A reduction of inputs in the middle reaches was
recommended to increase net returns, It was suggested that maize yields in the tail reaches
could be increased if adequate irrigation was applied at critical growth stages. Reynolds et
al. (1994) conducted an experiment by using legume crops for the fixation of nitrogen in

31
those soils where wheat or barley were to be sown. The leguminous crop was sown between
the rows of wheat or barley. The results showed that there was no decrease in the yields of
the main crops where legumes were grown as compared to control conditions. Grain yields
obtained were 1.4 t ha-1 whereas nearly additional two times more biomass was obtained
from the legumes. They reported that during the experiment when different legumes were
used to find out the adaptableness of the cropping system to the changing needs of the
farmers, legumes yielded dry biomass as much as 6.5 t ha-1 when they harvested fodder
crop of hairy vetch having yield of dry beans 1.4 t ha -1 and an additional 3.5 t ha-1 of biomass
in case of Vicia faba. In addition to this more nitrogen was fixed when legume crops were
inter-cropped and levels of leaf nitrogen were 3.8% which were significantly more than
when wheat crop was sown alone.
Wiese et al. (1994) evaluated the economics of conservation tillage systems for
dry land and irrigated cotton. He concluded that a lint yield of cotton in dry land was almost
390 kg ha-1 with disk harrow used in spring and it was 540 kg ha-1 in fields sprayed with
glyphosate to kill weeds. In irrigated fields, lint yield was almost 660 kg ha -1 with disk
harrow used for ploughing the field and 759 kg ha-1 with no till treatment. They further
added that a long-term profit per hectare on dry land ranged from $ 340 for disk harrow to
$ 524 for reduced tillage operations. Profit per hectare ranged from $ 707 for disk plough
alone to $ 751 when glyphosate herbicide was used after wheat harvest and followed by
disk plough and incorporation of herbicide (trifluraline) the next spring before planting
cotton in irrigated lands.
Young et al. (1994) evaluated the performance of 12 farming systems on the basis
of economics in the Palouse region of south eastern Washington, USA. They concluded
that the conservation tillage/winter wheat-spring barley-spring pea system performed much
better at maximum weed management and dominated all other agriculture systems in high
profitability and had less economic risks. In addition, this system also satisfied soil
conservation attributes. It reduced nitrogen use compared to monoculture system having
cereals (wheat). There are three potential explanations of this income-stabilizing and
optimal conservation cropping system. The conservation systems performed relatively the
best in dry periods and bore cold damage to winter planted wheat in case of severe winter.

32
These crop rotations also adopted such that to resist diseases under the high residue and
moist seedbed under conservation tillage system.
Zade et al. (1994) conducted field experiment in India, with six sequences, each
with three crops in a year (300% intensity) for four years and concluded that in comparison
to initial nutrient status plus added nutrients, NPK uptake was maximum
(82.2, 67.8 and 214.7%, respectively) in a sorghum-wheat-green gram (Vigna radiata) crop
sequence whereas it was minimum for N (47.6%) and K (79.8%) in cotton-wheatgreen
gram and for P (15.8%) in maize-gram-black gram (Vigna mungo) sequences. They further
concluded that apparent N gain was noticed in sorghum-safflower-green gram (6o/o)
sorghum and sorghum mustard-groundnut (4.6%) sequence only. Among the other
sequences, N loss was more (31.8%) with cotton-wheat-green gram. Apparent P loss was
recorded with all the sequences, which was maximum in cotton wheat-green gram. The
sequence of maize-gram-black gram showed greater apparent K gain than sorghumwheat-
green gram and cotton-wheat-green gram sequences. Among the other sequences, K loss
was more in sorghum-safflower-cowpea (Vigna unguliculata).
Diebel et al. (1995) stated that the profitability of crop rotation systems was based
on several factors, such as length and type of rotations, government policy, crop price, and
yield. An analysis of cost of production and net returns (involving maize, soybeans, wheat
and sorghum) and three alternative farming systems (including rotations involving wheat
inter-planted with clover, lucerne or lucerne inter seeded with oats) for northeast Kansas
state (USA) farm was performed once with` and then without the basic government
commodity provisions. At start of the study, constant crop yields were presumed in all the
production systems. Price, equivalent net return and yield sensitivity analyses were used to
know the sensitivity of the initial results to forage price variations and yield modulation in
wheat, maize, grain sorghum and soybeans. In order to address the possibility of reduced
yields, a unique analysis was performed under the alternative cropping systems compared
with the conventional agriculture system. The yield reduction for the crops in the alternative
agriculture systems was assessed based on reduced nitrogen uptake by the Groundwater
Loading Effects of Agricultural Management System (GLEAIVIS) model. The
significantly highest net return was obtained out of an alternative cropping system where
wheat/clover-sorghum-soybean were the crops. This highest net output was with as well as
without government commodity program participation. When the analysis was re-examined

33
considering yields, estimated N uptake and alternative forage and fodder prices, all
alternative and transitional systems were proved to be less profitable than the conventional
agriculture system.
Sesame planted in rows or broadcasted produced no significant difference in
yield. Though, this practice reduced the yield of maize by 53-69% compared with
monocropped maize (Mkamilo, 2004). Though, planting the sesame in rows is a labor
intensive method than broadcasting it. Maize yield would be significantly high using this
farming practice. Ahmed et al. (2004) conducted the experiments to know the impact of
different cultural practices on number of subterranean termites in field of wheat crop at
PostGraduate Agricultural Research Station (PARS), Faisalabad, Pakistan. Sorghum
(Sorghum bicolor) and Bajra (Pennisetum americanum) were sown in a field that was
followed by wheat crop. In another study, wheat crop was intercropped with Ajowain
(Trachyspermum ammi), cumin (Negella sativa) and Sounf (Foeniculum vulgare). One
cubic feet soil core was dug and then number of termite’s individuals was counted. The
results showed that comparative population of termites under study in sorghum and bajra
was non-significantly different (F=0.02; p=0.89). Mean of the population was significantly
different at different dates in both crops but it was son-significant for the interaction (crops
× time (F=50.83; p=0.00 and F=0.11; p=0.00, respectively).
Dogliotti et al. (2004) working at South Uruguay, proposed in his study an
explorative land use model to support the re-orientation of vegetable production systems.
They presented a new way to quantitatively integrate agricultural, socio-economic and
environmental aspects of agricultural land use. They carefully identified and quantified all
workable rotations and assessed inputs and outputs at every crop rotation scale, considering
interactions among crops. Relevant inputs and outputs of each land use activity. They
strictly followed the target-oriented approach for this study. They evaluated 336,128
suitable land use activities for different soil types having variable availability of resources
i.e., land, soil quality, capital, labor and water for irrigation. All these land use practices
produced better results in the form of maintaining soil organic matter, reducing soil erosion
and increasing farmer’s net income along with improvement in current farming systems of
the region by providing a diverse set of strategic ways for farmers in the region.

34
Nel, A. A. and H. L. Loubser (2004) conducted an experiment to know the
performance of different crops like maize and wheat in monoculture and in rotations
involving fallow, dry-bean, soya-bean and sunflower in the Eastern Free State. They also
performed second trial located in the North Western Free State where they compared mono-
cropped maize with rotations involving sunflower, groundnut and soy-bean. They
concluded that crop rotation and the associated diversification produced promising results
and increased net returns and increased risk to dramatically reduced risk depending upon
the crops involved and the net return level accepted as a disaster threshold. Compared to
monoculture, groundnut improved net returns without affecting risk. Dry-bean and
soyabean improved net returns in terms of money and reduced risks involved whereas,
sunflower most effectively reduced risk with little impact on net return. Low level of risks
in the Eastern Free State was due to improved yields. However, in the North western Free
State, risk reduction was due to the inclusion of different crops in rotation.
Becker et al. (2004) reported that rice-based cropping systems in West Africa rely
on fallow period to restore soil fertility and to prevent buildup of weeds diseases and other
insect pests. Population growth at increased level in the world and ever increasing demand
for land are now forcing many farmers to intensify their existing rice-production systems.
The farmers are trying to shorten the fallow periods and to increase the intensity of crops
they grow. The most important cropping-system alternatives may include the weed
suppression, use of site-specific practices, and using cover legumes as shortduration
fallows. In view of the poor rate of adoption of legume technology of West Africa, a multi
scale approach was needed to generate and extrapolate fallow technology. In their study,
they determined the constraints of rice production system and the yield gaps related to rice
intensification in 190 farmers' fields in three agro-ecological zones of West Africa (farm
level). They also evaluated nitrogen accumulation and weed’s suppression in 54 legume
accessions in dry season grown for 6 months under a range of hydrological and soil
conditions (plot level).
Stipešević and Kladivko (2005) reported that adding a cover crop in rotation could
increase soil physical properties those might be deteriorated from different tillage practices.
Sown in rows of cover crop, young maize plants tend to grow more in height and have
greater shoot length. Early desiccation of winter wheat and regular desiccation improves

35
maize growth. However, in drought situations, the early desiccation proved significantly
better for maize, due to the better soil water conservation.
Khan and Khaliq (2005) conducted a research on Rabi cereals sown by surface
seeding in one half of standing cotton and by conventional method in the second half after
harvest. Wheat by surface seeding produced 69% higher yield compared to sowing after
harvest of cotton. Yield of barley increased by 23% over conventional planting. Yield and
quality traits of cotton were not affected at all by the relay cropping systems. Substantially
maximum net benefits were obtained from relay cropping system compared to wheat
followed by cotton in conventional system. Among other cotton based cereal production
systems, cotton-wheat proved better.
Johnson et al. (2006) evaluated cotton-sorghum rotations in Texas under
stochastic dominance analysis techniques. The profitability of cotton and grain sorghum
production was evaluated by using Standardized Performance Analysis program at farm
level. Analysis of cotton yields in a cotton-grain sorghum rotation indicated an increase of
190.6 and 159.6 kg ha-1 following grain sorghum respectively. The rotational effects on
cotton yields from grain sorghum had a significant impact on increased cotton yield. All
rotational strategies evaluated were preferred over continuous cotton for all levels of risk
evaluated in the study. Intensification and diversification of crops may allow improving the
productivity and sustainability of agricultural production system in the Indo-Gangetic
Plains, but the choices to be made require integrated assessment of various cropping
systems.
Biswas et al. (2006) conducted a three years field experiment from 1999 to 2002
on a sandy clay loam soil to evaluate nine predominant cropping systems in West Bengal,
India. They concluded that productivity, nutrient uptake and energy use efficiency generally
increased with increasing cropping intensity. Positive effects of potato and jute crop on
yield and energy output of following crops were recorded along with maintenance or
improvement of soil physical and chemical properties such as organic matter, P and K
availability. The P availability was well for most of the systems, except for the system with
jute. However, negative K balances occurred because of complete biomass removal in all
systems. It suggested that recommended rates of applied K fertilizer were too low for
sustaining soil K supply over the longer period. Cropping systems containing potato in

36
rotation had the significantly high levels of yield, net return and energy productivity. In this
system, energy use efficiency was reduced due to higher energy consumption. Jute–wheat
and jute–rapeseed–rice systems showed significantly high energy use efficiency along with
moderate cost and net return. Based on economic situations, jute–potato–rice, rice–potato–
rice and rice–potato–sesame are recommended as better cropping system for resource-rich
growers. Systems such as jute-wheat, jute– rapeseed–rice and rice-wheat appear to be most
suitable for small and substance farms those cannot afford the high production costs of
crops such as potato.
Singh et al. (2007) conducted a study to evaluate the effects of wheat straw mulch
on intercropping of Sesbania with dry-seeded rice. Wheat straw and herbicides were used
for managing weeds of the experimental plots. The density of narrow-leaved weeds was
lower mulched plots at all stages of crop growth. The dry biomass of narrowleaved weeds
at 30 days after seeding (DAS) was significantly less with Sesbania than with mulch, but
they were almost similar at later stages. Broadleaved weed density and dry biomass was
lower with Sesbania than with the mulch used in experimental plots. It was concluded that
application of wheat straw as mulch at the rate of 4 t ha-1 and Sesbania intercropping for 30
DAS were equally effective in controlling both broadleaved and narrow-leaved weeds
associated with dry-seeded rice cultivation. However, pretilachlor with safener (500 g a.i.
ha-1) or pendimethalin (1000 g a.i. ha-1) applied as pre-emergence herbicides followed by
one hand-weeding were most effective in suppressing weeds, maximizing grain yield of
dry-seeded rice, and giving higher net return.
Klimekova et al. (2007) compared cereal crop rotation in conventional as well as
organic farming system in terms of energy inputs, production, profit and energy efficiency
evaluation in year 2003 to 2005 in south west Slovakia (near Piešťany town). Increased
energy inputs caused the increase in production of the conventional farming system being
followed in the region. The conventional system of farming was more energy demanding
(53%) in comparison with the ecological one. Such systems are usually much complex with
several species involving combinations of annual and perennial woody and non-woody
species. Agricultural research of the world now has an adequate tool-box of models and
methods for the development of technology in monospecific cropping systems. However,
its suitability and adoptability for more complex agro-ecosystems is unsure (Ewel, 2009).

37
Dogan et al. (2008) conducted a study in rain-fed conditions of Southern Marmara
Region to determine the most suitable crop rotation system(s). In this long term study
(1995-2001) on winter wheat and sunflower as main crops experiments, results were
evaluated on the basis of crop yield, soil productivity and fertility and economic aspects.
The sunflower-rapeseed-wheat, rapeseed-fodder pea + sunflower-wheat and rapeseed-
common vetch + sunflower-wheat were found to be the most suitable rotation system where
wheat was used as main the crop. The highest yield of sunflower was obtained from a fodder
pea + sunflower-wheat-fodder pea + sunflower crop rotation in the first and second year
periods when sunflower was used as main crop under rain-fed conditions. Economic
analysis of the research produced the significantly highest net returns from the rapeseed-
common vetch + sunflower-wheat and a fodder pea + sunflower-wheat-fodder pea +
sunflower crop rotation systems under rain-fed conditions. These rotation systems were
most suitable under rain-fed conditions of Turkey (Southern Marmara). Rotation systems
with common vetch and peas gave economically the highest net profit under rain-fed
conditions.
Murtaza et al. (2009) carried out two year field experiment in the Indus Basin area
of Pakistan to evaluate different irrigation and soil management options of using saline-
sodic waters (SSW) and soils for reclamation and for growing salt-tolerant cultivars of rice
(SSRI-8) and wheat (SIS-32). These soils have variable levels of salinity and sodicity (ECe
9–44 dS m-1 and SAR 83–319). The treatments on both the sites were the same and
consisted of: (1) Irrigation with SSW, (2) Irrigation with freshwater (FW),
(3) Soil application of gypsum at 100 % gypsum requirement of soil + SSW (G + SSW),
(4) G + one irrigation with SSW and one with FW (G + 1SSW + 1FW), (5) G + two
irrigations with SSW and one with FW (G + 2SSW + 1FW), (6) Farm manure at 25 Mg ha-
1 each year before rice + one irrigation with SSW and one with FW (FM + 1SSW + 1FW)
and (7) FM + two irrigations with SSW and one with FW (FM + 2SSW + 1FW). Rice was
grown as the first crop. After harvesting final wheat crop (fourth in sequence), maximum
decrease in bulk density and increase in infiltration rate was observed with G + 1SSW +
1FW while FM + 1SSW + 1FW treatment showed higher decrease in pHs and ECe.
Significantly the highest decrease in SAR occurred at both sites with G + 1SSW + 1FW.
Maximum yields of rice and wheat were generally observed with G + 1SSW + 1FW. The

38
crop yield and economic benefits with treatments showed a positive correlation with that
of improvement in soil physical and chemical properties. Overall, the greatest net benefit
was obtained from G + 1SSW + 1FW treatment. They also found that the farmers’
management skills were crucial in the overall success in improving crop yields during
reclamation of saline-sodic soils. Based on the results of this study, they proposed that SSW
could be used to reclaim saline-sodic soils by using a rice–wheat rotation and a site-specific
combination of soil amendments and water application strategies. The rapid increase in
population and consequent pressure for food was driving agriculture towards greater
intensification in West Africa.
Ajeigbe et al. (2009) tested various options including double and triple cropping,
with and without irrigation for intensification to succeed. Double and triple cropping
options with irrigation in Sudan and Sahel savannas and without irrigation in the northern
Guinea savanna zones of West Africa were explored as possible options for intensification
in these areas. A total of 8-10 ton of grain/ha/annum was obtained in the Sudan and Sahel
savanna with irrigation. These were made up of 2-4 tons/ha wheat, 0.91.5 ton/ha of cowpea
grain and 4 to 4.5 ton/ha of rice. It was concluded that triple cropping was a viable option
for intensification in the Sudan and Sahel savanna where irrigation facilities are available.
In the Northern Guinea Savanna, the rain season starts in June and end in September with
a few showers in May and October. Taking advantage of extra early maturing varieties of
cowpea, farmers obtained an average of 0.7 to 1.1 t of cowpea grain/ha as first crop, 3 to 4
t of maize per ha and 0.8 to 1.3 t of cowpea/ha as third crop. Relay cropping of legumes in
cereals was tested in the Sudan and Northern Guinea savanna Zones. The total grain and
fodder (cowpea and maize) produced by the relay cropping system was higher than the sole
crops. This implies that if the cropping system of the Sudan savanna was to be intensified,
relay cropping was a potential option.
Nielsen et al. (2010) conducted an experiment to evaluate yield and precipitation
use efficiency of cropping systems where crop choice was based on several crop selection
rules incorporating a grass/broadleaf rotation scheme and crop responses to available soil
water and expected growing season precipitation. Available soil water at planting was
measured at several decision points each year and combined with three levels of expected
growing season precipitation to provide input data for water use/yield production functions.
The predicted yield from those production functions was compared against established

39
yield thresholds, and crops were retained for further consideration if the threshold yield was
exceeded. Crop choice was then narrowed by following a rule which rotated summer crops
with winter crops and grasses with broadleaf crops. Yields, gross receipts, and economic
precipitation use efficiency from the various opportunity cropping selection schemes were
compared with yields, gross receipts, and economic precipitation use efficiency from four
set rotations [wheat-fallow (conventional till), wheat-fallow (no-till), wheat-corn-fallow
(no-till), wheat-millet (no-till)]. Two of the four opportunity cropping selection schemes
resulted in higher gross receipts and economic precipitation use efficiency than the set
rotations, with the other two selection schemes resulting in lower gross receipts and
economic precipitation use efficiency than the set rotations. Cropping frequency could be
effectively increased in dry land cropping systems by use of crop selection rules based on
water use/yield production functions, measured available soil water, and expected
precipitation.
Prasad et al. (2011) conducted Field experiment under AICRP- cropping system
research project during Kharif, Rabi, and summer season (2006-07) at Raipur (C.G.). The
experiment comprised of seven cropping sequences viz., rice-wheat-fallow, rice-
mustardgreen manure, rice-coriander (green leaf)-mung, rice-pea-maize, rice-brinjal-green
manure, rice-onion- green manure and rice-potato-cowpea. The most productive system
among different cropping sequences was rice-potato-cowpea system (270.39 q ha-1 year-1)
having production efficiency of 83.97 kg ha-1 day-1 and profitability of Rs.320.36 ha-1 day-
1. This system was found with highest relative economic efficiency (199.29%) and gave
Rs.116929 ha-1 year-1 net return. Higher production efficiency and maximum gross as well
as net return was observed in vegetable based cropping sequences than a traditional one.
2.2. Agronomic Benefits
Khan and Khaliq (2005) conducted a research in which Rabi cereals were sown by
surface seeding in standing water in one half of standing cotton and by conventional method
in the second half after harvest of the cotton. Surface seeding produced 69.37% higher grain
yield when relaying wheat was sown than sowing after harvest the cotton crop. This
technique also increased in barley yield by 22.84% compared to conventional planting.
However, yield and quality traits of cotton were not affected significantly by any of the

40
relay cropping systems. Significantly higher net field and economic benefits were obtained
from relay cropping system as compared to wheat being followed by cotton. The
Standardized Performance Analysis program was used to assess the economic benefits of
cotton and grain sorghum production by using farm level data. Analysis of cotton yields in
a cotton-grain sorghum rotation showed an increase of 190.6 and 159.6 kg ha -1 following
grain sorghum 32 one and two years, respectively. The rotational effects of grain sorghum
had a significant impact on increased cotton profits and yield. All rotational strategies those
evaluated were preferred to continuous cotton for all levels of risk aversion evaluated in the
study (Johnson et al., 2006).
Reddy and Bheemaiah (1991) in a two years study on corn grain found that
cropping or cropping systems in both the years except to soils in 1983-84. Similar trend
was also observed in respect of straw yield and harvest index of maize. All the yield
components of maize such as cob length and girth, seeds per cob and test weight were not
influenced by soils and cropping systems. While under furrow irrigation cropping systems
were found superior to the conventional cotton production systems. Under dry land, it was
also found that all the cotton-cropping systems analyzed were superior to conventional
cotton practices. They concluded that the cotton cropping systems analyzed seem to be
viable alternative to current cotton production practices in the area (Segarra et al. 1991).
Nielsen et al. (2010) conducted an experiment on different cropping systems to
evaluate yield and precipitation use efficiency of crops where choice of a crop was entirely
based on different crop selection rules considering narrow and broadleaved weeds rotation
schemes. Crop responses were recorded to avail different soil, water and other forms of
seasonal precipitation. Available soil water at sowing time was recorded at several dates
each year and it was combined with three levels of expected precipitation have input data
for water use production functions. The predicted yield of the crop from those production
systems was then compared against established yield thresholds while crops were retained
in the field for further data record to see if the threshold yield exceeded or not. It helped us
in making a decision regarding crop by following a rule of rotating summer crops with
winter crops of the area along with grasses and broadleaf crops. Yields, gross receipts, and
economic precipitation use efficiency from four set rotations [wheat-fallow (conventional
till), wheat-fallow (no-till), wheat-corn-fallow (notill), wheat-millet (no-till)] was
compared with different cropping scheme opportunities. Significantly higher gross receipts

41
and economic precipitation use efficiency was recorded from two of the cropping scheme
opportunities than the set rotations while the other two selection schemes resulted in less
economic output. Crop selection rules depending on water use yield production systems
can help in increasing frequency of crops in dry land cropping systems. This system will
help us in measuring available soil water, and expected precipitation.
2.3. Soil Health
Stipešević and Kladivko (2005) reported that using a cover crop could improve soil
chemical as well as physical properties those were deteriorated from different soil tillage
systems, due to cover crop growing during the winter season. Young maize seedlings
showed better growth and taller shoot length. Early desiccation of winter wheat and regular
desiccation improves maize growth at early stage. In presence of drought, the early
desiccation proved to be significantly better for maize crop, due to the better soil water
conservation. A field study performed at the Indian Agricultural Research Institute, New
Delhi, India from 2000-2001 and 2003-2004. This study was designed to work out the
effects of cropping systems on the physical, chemical and productive features of soil.
Among all the systems studied, Rice-potato-mungbean cropping system proved to be 59–
89% higher in terms of productivity, 30–46% higher in terms of protein yield, 18–38%
higher in terms of energy output. This system also resulted in, 60% higher in fungi
population, 14% higher in microbial biomass, 15% higher in actinomycetes population, 7–
16% higher in available P and 3% higher in CO2 evolution in soil than rice-wheat cropping
system. Rice-rapeseed - mungbean cropping system was also much productive but it
followed the above one. It gave 19–26% higher protein yield, 12–15% higher productivity,
and resulted in 11–18% higher available P, 22% higher actinomycetes population, 12%
higher microbial biomass, 65% higher fungi population and 2% higher CO2 evolution in
soil than rice-wheat cropping system as reported by Sharma et al. (2009).
Lal (1990) had cited that if farmer add legumes in cropping systems of rain fed
areas would add ample organic matter in the soil and ultimately improve soil structure and
enhance nutrient and water holding capacity of soil. Soybean grown after white oats black
oats, rye grass and wheat showed no significant differences for yield, yield components

42
such as 1000 grain weight. The preceding winter crops influenced final stand, plant height
and insertion of first pods.
Prasad and Kerketta (1991) conducted an experiment to study nutrients uptake
and their fate in the soil under seven cropping sequences, comprising mono, double and
triple crop intensities and reported that Egyptian clover or berseem as individual crop
removed maximum nitrogen and phosphorous, whereas maize and cowpea removed
maximum quantity of potash. Among the cropping sequences, Deenanath grass
(Pennisetum pedicellatum L.)-Berseem-maize+cowpea removed the maximum quantities
of the three major plant nutrients.
They found that Hedgerow intercropping boosted soil fertility but did not increase
incomes sufficiently, however, mono-cropping was profitable but yields and soil fertility
declined rapidly. Mono-cropping remains popular with farmers with little and or without
tenure. Nitrogen fixation was sufficient to match off take in a moderately yielding food-
crop in these systems; more intensive production requires additional input. Singh and Singh
(2000) carried out a field experiment during 1993-94 and 1994-95 to study the effect of
green manure (Sesbania aculeata) and nitrogen levels on crop yield and economics of a
rice-wheat cropping system. S. aculeata + 100% N produced 21.5 and 20.1% more rice
grain and I .6 and 8.8% more wheat grain in the respective years than fallow (nogreen
manure) + 100% N for both rice and wheat. Yield components were also increased. Total
net return from S. aculeata + 75% N to rice and 100% N to wheat was Rs 7730 ha -1 as
compared to Rs 8063 ha-1 from fallow (no green manure) + 100% N to both rice and wheat.
The highest net returns were given by green manure + 100% N applied to both crops.
Another experiment was conducted by Belachew and Abera (2011) at SinanaDinsho
in 2001 – 2003. He evaluated the effects of short term manuring by green vetch for fallow
in “Ganna” season. In this experiment, three land preparation treatments (weedy fallow,
Vetch harvested and Vetch under ploughed) were used in the main plots having three
nitrogen rates (0, 20.5 and 41 kg N/ha) in the subplot. Crop was ploughed to add green
manure in soil after three weeks. After three weeks, a slight decrease in pH value of the soil
and available phosphorus and an increase in organic carbon contents were observed.
Adding green manuring of vetch and fallow treatments gave significantly better plant
height, straw yield and grain yield. It adversely affected yield of bread wheat when vetch

43
biomass was harvested at flowering stage. However, farm productivity could be increased
when livestock production was considered along with crop production.
Jabbar et al. (2010) conducted a research in which efficiency of intercropping was
studied biologically in direct seeded upland rice (DSR) and its impact on residual soil
fertility at University of Agriculture, Faisalabad, Pakistan. It was a two years study. The
treatments of intercropping systems comprised of rice alone, rice + sesbania, rice + maize,
rice + mungbean, rice + cowpea, rice + ricebean and rice + pigeonpea. The rice was seeded
in 75 cm spaced 4-row strips (15/75 cm) with forage in spaces between the rice strips in
row. A significant level of reduction in rice yield was observed by forage intercrops
compared to mono-cropped rice (rice alone) which varied from 11-26%. Maximum yield
increase (26%) was observed when sesbania was intercropped. This treatment was followed
by pigeonpea (17%). Minimum yield was recorded when only maize was intercropped
(11%). In terms of total rice grain yield equivalent (TRGYE), significantly highest TRGYE
(6.5 ton ha-1) was recorded for rice + forage maize intercropping system. It was followed
by rice + cowpea (5.1 ton ha-1) and rice + sesbania (4.9 ton ha-1). In this experiment, lowest
yield (4.0 ton ha-1) was obtained in monocropped rice. This experiment clearly indicated
that intercropping had great yield advantages over mono-cropping in case of rice. Similarly,
when intercropping was compared on the basis of net field benefits obtained, different
intercropping systems gave considerably higher net benefits compared against sole
cropping of rice. Maximum net benefit (Rs.42325 ha-1) was documented for rice + maize
which was 37% more than sole rice crop. This was followed by rice + cowpea (Rs.30885
ha-1) giving 14% higher net benefits than mono-cropping of rice which produced only
(Rs.26526 ha-1) of net benefits. By using the method of intercropping, residual soil nitrogen
contents and organic matter was improved in all the intercropping systems. However, this
increase was not observed in case of rice + maize intercropping system. The maximum
increase in soil nitrogen contents was 7 % that was recorded for rice + sesbania
intercropping system. Although, intercropping systems were recorded with increase in
nitrogen contents of the soil but residual soil phosphorus and potassium were depleted in
all the studied intercropping systems as compared to initial soil analysis.

44
Ahmad et al. (2010) undertook a study as a part of soil fertility management of
eroded soils in NWFP, Pakistan. The study was started in summer 2006 and continued for
four consecutive crop seasons till winter 2007, in District Swabi, NWFP, Pakistan. Soil
fertility status of the experimental site was determined before the start of the experiment.
The experiment was laid out in a factorial split plot design using two factors viz., cropping
patterns and fertilizer treatments. The cropping patterns studied were maizewheat-maize
rotation, maize-lentil-maize rotation and maize-wheat + lentil intercropmaize rotation and
these were kept in main plots whereas the fertilizer treatments included control, 50% NP,
100% NPK and 20 t ha-1 farmyard manure integrated with 50% N and 100% PK as mineral
fertilizers which were placed in sub plots. Fertilizers were applied for four seasons
continuously. At the end of winter 2007, soil samples from two depths (0-20 cm and 20-40
cm) were collected from each plot and analyzed for microbial biomass carbon (MBC) at
day 3, day 6 and day 10 incubation periods, total nitrogen (TN), microbial biomass nitrogen
(MBN), and mineralizable nitrogen (MN). Results showed significant improvement in
organic fertility of soil with fertilizer addition and cropping patterns. Combined application
of organic and inorganic fertilizers (20 t ha1 farmyard manure integrated with 50 % N and
100 % PK) showed 55, 25, 18 and 61 % increase in total N, MBN, MN, and MBC after 10
days incubation period over the control, respectively, in the surface soil whilst 100% NPK
showed 44, 15, 6 and 45 % improvement over the control treatment for the same parameters
in surface soil. Data further showed 43, 23, 19 and 60 % increase in the corresponding
microbial parameters in combined organic and inorganic fertilizer treatment over the
control treatment in sub soil whilst 100% NPK showed 39, 20, 10 and 54 % increase in TN,
MBN, MN and MBC over the control in sub soil. The cropping patterns having cereal-
legume rotation also improved organic soil fertility and showed 27 and 13% more total N
and MBC after 10 days incubation period over the cereal-cereal rotation respectively and
the improvement in MBN and MN in cereal-legume rotation over cereal-cereal rotation was
non-significant in surface soil. In the sub-surface soil cereal-legume rotation improved TN,
MBN, MN and MBC by 9, 6, 8 and 28 % over the cereal-cereal rotation. It was concluded
that there was sufficient potential to improve soil organic fertility in Pirsabak soil series,
the restoration of which on sustained basis would require at least 50% N from the organic
sources. Moreover, in the traditional cereal-cereal cropping patterns, legumes should be
included to further improve the nitrogen contents and organic fertility of these soils

45
2.4. Economic Benefits
Dogan et al. (2008) developed a study working under rain-fed conditions of
Southern Marmara Region, Turkey to device the most suitable crop rotation system(s). In
his six years study (1995-2001), two different crop rotation systems were tested: winter
wheat and sunflower as main crops experiments. Results relating to the crop yielding
ability, economic aspects and soil fertility were recorded. The sunflower-rapeseed-wheat,
rapeseed-common vetch + sunflower-wheat and rapeseed-fodder pea + sunflower-wheat
were found to be the most suitable rotation systems in rain-fed conditions. This cropping
system had multiple advantages in the first experiment where wheat was used as main the
crop. In the first and second year of study, significantly highest sunflower achene yield was
obtained from a fodder pea + sunflower-wheat-fodder pea + sunflower crop rotation
systems. In this system, sunflower was used as main crop under rain-fed conditions. A
methodology was established to design a site specific crop management (SSCM) practice
to increase nutrient use efficiency of fertilizers like nitrogen, phosphorus and potassium for
cropping system dominated by cereals. They conducted the experiment on different field
comprising an area of 95 ha, 145 ha and 240 ha with different levels of nitrogen, phosphorus
and potassium. After a long term experiment in the fields, they concluded that in our pedo-
climatic conditions, SSCM was more profitable when the surface area was large enough
and the heterogeneity in terms of nutrient of soil was greater (Bourgain et al., 2009).
Rice crop requires 30 kg N ha-1less when planted after gram and lucern than wheat
while Parkash et al. (1982) got highest average annual net return and benefit cost ratio using
rice-cluck pea rotation followed by rice-lentil, rice-field pea and rice-wheat sequences.
Jakkro and Faroque (1986) suggested that planting legumes in winter season (winter)
helped economic fertilizer use. Whereas Majid et al. (1983) concluded that ricemustard-
mung rotation gave the maximum income, which was 33% more than the standard rice-
wheat rotation.
Seth and Balyan (1985) reported that legume crop grown in summer had a
significant effect on grain yield of wheat. Their two years indicated that wheat yield of
50.5 Quintal ha-1was obtained when it was sown after cowpeas (fodder) compared to 39.49
quintal ha-1 after fallow and 41.8 quintal ha-1 after maize. This increase was attributed to

46
the fact that cowpea being a legume, fix nitrogen, which was used by succeeding crop. The
economic net return obtained with cowpeas (fodder) - wheat, fallow - wheat and maize -
wheat systems was Rs 3917, 2441, and 3319 per hectare, respectively.
Singh and Verma (1985) stated that wheat yield was significantly higher after
cowpeas, mash bean and mung bean than that obtained after pigeon pea, fallow and pearl
millet. 10.4, 13.1 and 13.8 percent with mung bean augmented the productivity of wheat in
a legume-based system, mash bean and cowpeas, respectively over fallow. In a nonlegume
system, wheat yield decreased after pearl millet by 8% as compared to fallow. In a legume
based system a net saving of residual nitrogen was observed as 37.2 kg ha-1with mung bean
41.4 kg ha-1 with mash bean and 42.2 kg ha-1 with cowpeas compared to after pearl millet.
Singh and Faroda (1985) assessed the carry over effect of phosphorus applied to
Summer legumes and its up take by succeeding wheat crop. They observed increased
concentration and uptake of phosphorus in wheat at all growth stages was observed in
legume – wheat cropping system compared to fallow - wheat system. Maintenance of soil
productive potential through appropriate management practice was very essential for
sustained development of rice production. He also suggested proper crop rotation for
maximizing the productivity of the farm with the available resources and concluded that
rice based cropping system needs a thorough review to optimize the productivity of the
system and making it more relevant to the country's priority needs (Chaudhary, 1986).
Production and feasibility of different cropping sequences and found that groundnutwheat-
mungbean gave the highest yields and gross returns compared to a fallow system. (Malavia
et al., 1986)
Negi et al. 1988 reported that sorghum following soybean out-yielded continuous
sorghum. The higher yield was attributed to the added benefits of cereal-legume rotation.
They also noticed that residual N from soybean when rotated to grain sorghum resulted in
significant savings in fertilizer inputs. The average yearly N credit from soybean in rotation
with sorghum was about 89.6 kg, this shows that a cereal could be successfully use N fixed
from a previous legume crop (Hanson et al., 1988). Phosphorus applied to maize did not
show significant residual effect on any of the yield contributing characteristics of wheat,
because wheat did not utilize residual phosphorus efficiently due to poor soil moisture and
low temperature during Winter season. However, maize responded to direct residual

47
phosphorus up to 60 kg P2O5 applied to wheat. The availability of phosphorus increased in
summer due to solubility factor.
Saini (1986) observed that farmyard manure and chemical fertilizers were the major
energy inputs for rice and wheat crop under both farmer and improved technology levels.
In terms of energy output-input ratio, wheat performed better than rice, Velayudham and
Seth (1986) reported that wheat produced more tillers, longer ears, heavier and more
grains/ear when grown after cowpeas compared to a non-legume cropping system including
maize and fallow during summer. Wheat grain yield of 40.74, 42.31 and 49.6 q/ha was
obtained after fallow, maize (fodder) and cowpeas (fodder) respectively. Cowpeas - wheat
system gave a net return of RS. 6220 compared to RS. 5259 q/ha/year in maize - wheat
system, while fallow-wheat system gave only RS. 3007/ha/year. Apart from this, fertilizer
use efficiency could be increased further if optimum schedule was adopted for cropping
system rather than for a single crop (Zia et al., 1986).
Legume based cropping systems resulted in a significant increase in wheat yield. It
was 48.1q/ha after cowpeas as green manuring, 46.4 after cowpeas (fodder) compared to
39.79q/ha when grown after maize. This increase in grain yield of wheat was associated
with residual nitrogen fixed by previous legumes. Wheat based legume cropping systems
also gave higher net returns than non-legume cropping systems (Balyan and Seth, 1989).
All legumes, except soybean significantly enhanced the dry matter production of wheat as
compared to preceding non-legume crops. Wheat grain yield was also significantly higher
following legume based cropping systems than non-legumes systems. The results on N
uptake by wheat as affected by preceding crops indicated that higher nitrogen content in
wheat straw and grain was observed when followed legume crops and was lowest after non-
legume crops. (Saeed et al., 1989)
Average yield of mung bean over six sites was 660 kg ha-1 and straw yield was 1521
kg ha-1 The net benefit of RS. 2689 ha-1, with benefit cost Ratio of 2.72 had been reported
for mung bean planted in mung bean-wheat cropping System, which was significantly
higher than fallow- wheat system (Anonymous, 1990). The effects of four conventional and
four organic cropping systems on a crop yield and yield quality and presented that the

48
average yield of barley in organic cropping varied between one quarter and half of that in
conventional cropping. The yield of winter wheat, oats and potato were about 40% of those
obtained conventionally. The yield of clover-grass hay in organic farming was similar to
those of grass hay in the conventional system. The primary reason for the poor crop growth
in organic cropping systems was apparently the acute N deficiency caused by poor
performance of legumes, low N contents of organic manures and N losses in anaerobic
condition. Pronounced soil compaction and anaerobic conditions in organic cropping
systems had harmful effect on microbiological activities of soil as well (Hannukkala et al.,
1990).
It is obvious from the above information that considerable research has been done
throughout the world in different Agro climatic conditions. However, little information is
available in Pakistan on the yield, soil fertility and system economics. Therefore, the
present study will be initiated to determine the effect of different cropping systems on the
yield and associated parameters like fertility, agronomic benefits and economics of those
cropping systems under Agro climatic condition of Faisalabad, Punjab, Pakistan.
CHAPTER 3 MATERIALS AND METHODS
3.1. Site Characteristics
This research project was designed to study the different cropping systems under
agro-climatic conditions of Faisalabad, Pakistan. The research study was conducted at
Agronomic Research Farm area, Department of Agronomy, University of Agriculture,
Faisalabad during 2013-2015. The climate of the district is semi-arid and subtropical. The
soil type on which the studies were conducted is described as sandy clay loam.
3.1.1. Soil Health
From all the three replications composite soil samples were collected before and
after harvesting from all the cropping systems at 0-30 cm depth. The samples were
examined for Nitrogen, Phosphorus and Potassium status following methods described in
Association of Official Agricultural Chemist (A.O.A.C., 1980) by micro Kjeldahl and
Olson bicarbonate extraction method for N and P respectively (Olsen and Khasawneh,
1980). Extractable K was determined by using flame photometer method (Knudsen et al.,
1982)

49
3.1.2. Soil analysis
The soil of the experimental area is fairly uniform, so a representative and
composite soil sample to a depth of 30 cm was collected with soil auger, before sowing of
the crop. Soil sample was analyzed for its various physio-chemical properties.
3.1.3. Mechanical analysis
By using one percent sodium hexa-metaphosphate as a dispersing agent, percentage
of sand, silt and clay was determined by Bouyoucos hydrometer method. Textural class was
determined by using the international textural triangle (Moodie et al., 1959).
3.1.4. Chemical analysis
Soil was analyzed for organic matter, pH, C:N, Nitrogen, Phosphorus and
Potassium contents by employing the methods as designed by Homer and Pratt (1961).
Table: 3.1. Physical characteristics of soil
Determination Unit Value
Sand % 33.80
Silt % 34.00
Clay % 32.20
Texural class clay loam
Table: 3.2. Chemical characteristics of soil
Determination Unit Value
Saturation % 37
pH 7.6
EC dS/m 1.2

50
Organic matter mg kg-1 0.74
Total nitrogen mg kg-1 620
Available phosphorus mg kg-1 7.4
Available Potassium mg kg-1 132
CaCO3 % 5

51
3.1.5. Meteorological data
The meteorological data for the raising/growing period of the crop was obtained from
the meteorological observatory of the Department of Crop Physiology, University of
Agriculture, Faisalabad, Pakistan.
3.2. Studies on different cropping systems
The experiments were designed to study the relationship of six different pre-assigned
cropping systems. The details of the pre-assigned cropping systems are given below.
S1 Maize (sp) - Maize - Wheat - Rice - Wheat
S2 Maize (sp) - Maize - Gram - Millet – Sarson (Mustard)
S3 Mungbean - Rice - Wheat - Cotton/ Sarson (Mustard)
S4 Mungbean - Rice – Berseem (GM) - Maize - Sesame – Wheat
S5 Sunflower - Mungbean - Wheat/ Jantar - Rice - Gram
S6 Sunflower - Mungbean - Barley - Cotton - Wheat
All the cropping systems were arranged in a randomized complete block design
(RCBD) with three replications. There were 18 plots in the experiment, each having size of 15
× 10 m. The experiment was initiated during February 2013 with the sowing of different pre-
assigned crops in the respective (randomized) plots. After the harvest of first phase crops, the
subsequent crops included in different systems were planted in their respective plots. Soil
analysis was also conducted before planting and after the harvesting of each crop.
According to the experimental design and description of cropping systems, different
crops were grown using standard procedures recommended for all the crops.

52
Layout Plan
Main water channel
Non experimental area
Non experimental area
Non experimental area
0.6 m
S3
(15m x
10m)
Non experimental area Non experimental area Non experimental area

53
Table: 3.3 Crops durations and sowing dates
Types of System Crops in System
S1 M-M-W-R-W
Crop Sowing Date Duration (days)
Maize 15-02-2013 122
Maize 15-07-2013 112
Wheat 10-11-2013 191
Rice 04-06-2014 151
Wheat 12-11-2014 183
S2 M-M-G-M-S
Crop Sowing Date Duration
Maize 15-02-2013 123
Maize 15-07-2013 107
Gram 10-11-2013 140
Millet 20-04-2014 102
Sarson 08-11-2014 136
S3 M-R-W-C/S
Crop Sowing Date Duration
Mungbean 15-02-2013 102
Rice 04-06-2013 147
Wheat 11-11-2013 190
Cotton 02-06-2014 150
Sarson 14-10-2014 148
S4 M-R-B-M-S-W
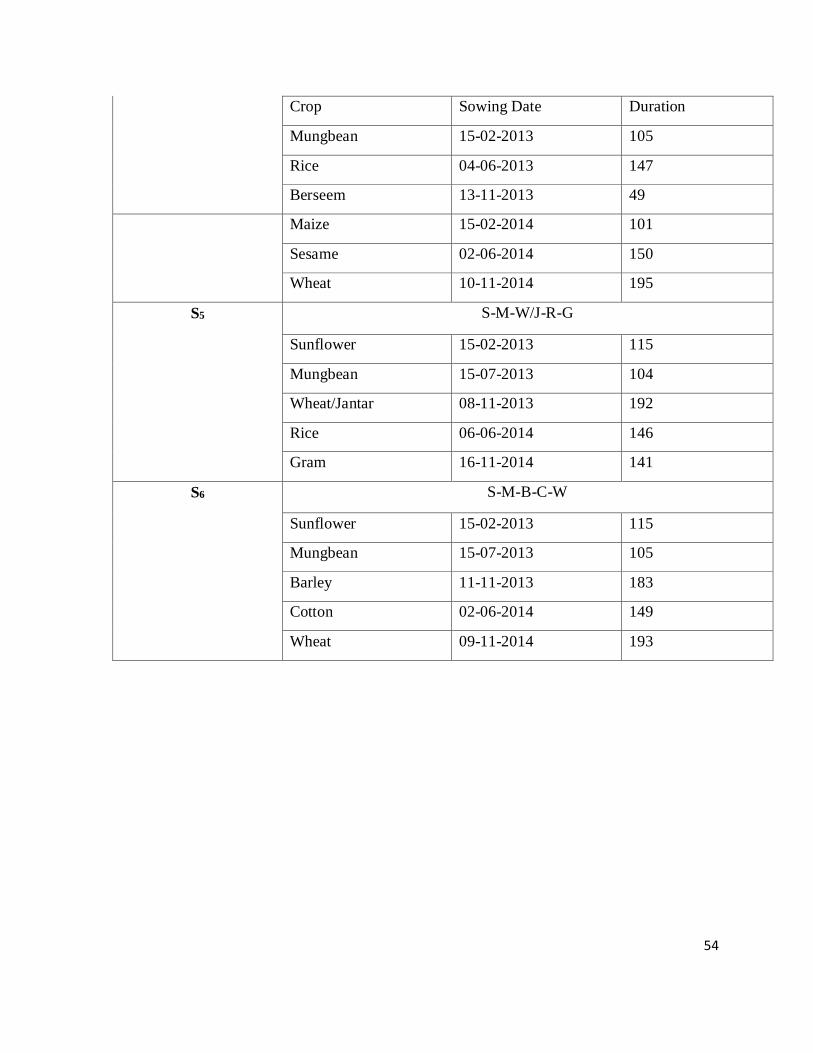
54
Crop Sowing Date Duration
Mungbean 15-02-2013 105
Rice 04-06-2013 147
Berseem 13-11-2013 49
Maize 15-02-2014 101
Sesame 02-06-2014 150
Wheat 10-11-2014 195
S5 S-M-W/J-R-G
Sunflower 15-02-2013 115
Mungbean 15-07-2013 104
Wheat/Jantar 08-11-2013 192
Rice 06-06-2014 146
Gram 16-11-2014 141
S6 S-M-B-C-W
Sunflower 15-02-2013 115
Mungbean 15-07-2013 105
Barley 11-11-2013 183
Cotton 02-06-2014 149
Wheat 09-11-2014 193

55
3.3. Agronomic practices
According to the experimental design and description of cropping systems, different
crops were grown following agronomic practices described as below.
3.3.1. Cropping system 1
S1- Maize (sp) - Maize - Wheat - Rice - Wheat
3.3.1.1. Maize (Grain) during 2013
Hybrids were used for spring (on 15 February, 2013) and seasonal (on 15 July, 2013)
planted maize in their respective plots according to the pre-assigned randomization using
recommended agronomic practices and were kept uniform. Seed rate was kept 10 kg per acre.
The crop was grown by keeping 60 cm R-R distance and 20 cm P-P distance. An inorganic
fertilizer dose @ 200 -150 -125 kg/ha was applied to get maximum yield. To control the weeds
manual labor was used and herbicide was also applied. Spring planted maize was harvested on
18 June, 2013 and seasonal planted maize was harvested on 02 November, 2013. Data were
recorded for the crops.
3.3.1.2. Wheat during 2013
Wheat was sown on 10 November, 2013. All the agronomic practices were kept
uniform in all the plots according to the pre-assigned randomization. Seed rate of 40 kg per
acre was used. The row to row distance was maintained at 22.5 cm. Nitrogen at the rate of 64
kg per acre and phosphorus at the rate of 46 kg per acre was applied. To control the weeds
herbicide was also applied at recommended dose. All the phosphorus was applied at the tilth
condition. Wheat was harvested on 20 May, 2014. Data were recorded for various parameters.

56
3.3.1.3. Rice during 2014
Rice nursery was grown on 4 June, 2014. It was transplanted in the field on 3 July,
2014 by manual laborers. All the cultural operations were kept constant in all the plots
according to the randomization. The crop was grown by maintaining 20 cm P-P distance and
22.5 cm R-R distance. Recommended dose of fertilizer was applied as nitrogen 46 kg per acre
and phosphorus 25 kg per acre. All the phosphorus was applied before transplanting the rice
nursery in the soil. To control the weeds herbicide was also applied at recommended dose. The
crop was harvested on 2 November, 2014 and data were recorded.
3.3.1.4. Wheat during 2014
Wheat was sown on 12 November, 2014. All the agronomic practices were kept
uniform in all the plots according to the pre-assigned randomization. Seed rate of 40 kg per
acre was used. The row to row distance was maintained at 22.5 cm. Nitrogen at the rate of 64
kg per acre and phosphorus at the rate of 46 kg per acre was applied. All the phosphorus was
applied at the tilth condition. To control the weeds herbicide was also applied at recommended
dose. Wheat was harvested on 24 May, 2015. Data were recorded for various parameters.
3.3.2. Cropping system 2
S2- Maize (sp) - Maize - Gram - Millet - Sarson
3.3.2.1. Maize (Grain) during 2013
Hybrids were used for spring (on 15 February, 2013) and seasonal (on 15 July, 2013)
planted maize in their respective plots according to the pre-assigned randomization using
recommended agronomic practices and were kept uniform. Seed rate was kept 10 kg per acre.
The crop was grown by keeping 60 cm R-R distance and 20 cm P-P distance. Recommended
dose of fertilizer was given to get maximum yield. To control the weeds manual labor was used
and herbicide was also applied. Spring planted maize was harvested on 18 June, 2013 and
seasonal planted maize was harvested on 2 November, 2013. Data were recorded for the crops.

57
3.3.2.2. Gram during 2013
Gram was grown on 10 November, 2013 following all the recommended procedures.
Seed rate of 25 kg per acre was used. Gram was planted by keeping 15 cm P-P distance and
45 cm R-R distance. Gram is a leguminous crop so it requires nitrogen at 12 kg per acre while
phosphorus at 25 kg per acre. To control the weeds manual labor was used and herbicide was
also applied. The crop was harvested on 5 April, 2014 and data were recorded.
3.3.2.3. Millet during 2014
The crop millet was grown on 20 April, 2014 on well prepared land. Seed rate of 4 kg
per acre was used. The seed was sown with drill by maintaining 8 cm P-P distance and 30 cm
R-R distance to maintain the required number of plants in the field. Fertilizer was also applied
at recommended dose to get the maximum yield. Nitrogen was applied at 25 kg per acre and
phosphorus was applied at 25 kg per acre. According to the researchers all the phosphorus was
applied before sowing the crop. There was no need of applying herbicide to control the weeds.
The crop was harvested on 2 August, 2014.
3.3.2.4. Sarson during 2014
Sarson was grown on 8 November, 2014 by keeping all the practices same in all the
plots. The recommended seed rate of 2.5 kg per acre was used to grow the crop. The distance
among the plants was kept 20 cm while among the rows it was maintained at 60 cm. Nitrogen
was applied at 32 kg per acre while phosphorus was applied at 32 kg per acre. Manual weeding
practice was used to control the weeds. The crop was harvested on 24 March, 2015 and data
were recorded.
3.3.3. Cropping system 3
S3- Mungbean - Rice - Wheat - Cotton/ Sarson
3.3.3.1. Mungbean during 2013
Mungbean was grown on 5 February, 2013 by keeping all the standard practices in all
the plots pre-allocated by randomization. The recommended seed rate was 8 kg per acre. To

58
achieve the desired number of plants in the field the P-P distance was maintained at 10 cm,
while R-R distance was maintained at 30 cm. As mungbean is leguminous crop and it fixes the
atmospheric nitrogen by the help of nodules, so nitrogen was applied at 10 kg per acre. The
phosphorus was applied at 25 kg per acre. All the phosphorus was applied before the sowing
of crop. To control the weeds manual labor was used and herbicide was also applied.
The crop was harvested on physiological maturity.
3.3.3.2. Rice during 2013
Rice nursery was grown on 4 June, 2013. It was transplanted in the field on 3 July,
2013 by manual laborers. All the cultural operations were kept constant in all the plots
according to the randomization. The crop was grown by maintaining 20 cm P-P distance and
22.5 cm R-R distance. Recommended dose of fertilizer was applied as nitrogen 46 kg per acre
and phosphorus 25 kg per acre. All the phosphorus was applied before transplanting the rice
nursery in the soil. To control the weeds manual labor was used and herbicide was also applied.
The crop was harvested on 1 November, 2013 and data were recorded.
3.3.3.3. Wheat during 2013
Wheat was sown on 11 November, 2013. All the agronomic practices were kept
uniform in all the plots according to the pre-assigned randomization. Seed rate of 40 kg per
acre was used. The row to row distance was maintained at 22.5 cm. Nitrogen at the rate of 64
kg per acre and phosphorus at the rate of 46 kg per acre was applied. All the phosphorus was
applied at the tilth condition. To control the weeds manual labor was used and herbicide was
also applied. Wheat was harvested on 22 May, 2014. Data were recorded for various
parameters.
3.3.3.4. Cotton during 2014
Cotton crop was sown on 2 June, 2014 by keeping in view all the standard practices to
have maximum yield of cotton crop in all the plots. Seed rate of 10 kg per acre was used. The
P-P distance of 30 cm and R-R distance of 60 cm was maintained. Recommended fertilization
was applied as, nitrogen at 46 kg per acre and phosphorus at 23 kg per acre. All the phosphorus

59
was applied before sowing the crop. To control the weeds manual labor was used and herbicide
was also applied. The crop was harvested on 2 November, 2014.
3.3.3.5. Sarson during 2014
Sarson was sown as relay crop in the standing cotton crop. The seed was sown by
keeping the P-P distance of 20 cm and R-R distance of 60 cm. All the other recommended
practices were used to grow this crop. Nitrogen was applied at the rate of 32 kg per acre and
phosphorus was applied at 32 kg per acre. To control the weeds manual labor was used and
herbicide was also applied. All the phosphorus was applied before sowing of the crop. The
crop was harvested on 14 March, 2015.
3.3.4. Cropping system 4
S4- Mungbean - Rice – Berseem (GM) - Maize - Sesame – Wheat
3.3.4.1. Mungbean during 2013
Mungbean was grown on 5 February, 2013 by keeping all the standard practices in all
the plots pre-allocated by randomization. The recommended seed rate was 8 kg per acre. To
achieve the desired number of plants in the field the P-P distance was maintained at 10 cm,
while R-R distance was maintained at 30 cm. As mungbean is leguminous crop and it fixes the
atmospheric nitrogen by the help of nodules, so nitrogen was applied at 10 kg per acre. The
phosphorus was applied at 25 kg per acre. All the phosphorus was applied before the sowing
of crop. To control the weeds manual labor was used and herbicide was also applied.
The crop was harvested on physiological maturity.
3.3.4.2. Rice during 2013
Rice nursery was grown on 4 June, 2013. It was transplanted in the field on 3 July,
2013 by manual laborers. All the cultural operations were kept constant in all the plots
according to the randomization. The crop was grown by maintaining 20 cm P-P distance and

60
22.5 cm R-R distance. Recommended dose of fertilizer was applied as nitrogen 46 kg per acre
and phosphorus 25 kg per acre. All the phosphorus was applied before transplanting the rice
nursery in the soil. To control the weeds manual labor was used and herbicide was also applied.
The crop was harvested on 1 November, 2013 and data were recorded.
3.3.4.3. Berseem during 2013
Berseem was sown on 13 November, 2013. It was broadcasted in the field at the rate
of 2 kg per acre. Only nitrogen was applied at 10 kg per acre. To control the weeds manual
labor was used only. The crop was green manured in the field on 1 January, 2014.
3.3.4.4. Maize (Grain) during 2014
Hybrids were used for maize crop on 15 February, 2014 in their respective plots
according to the pre-assigned randomization using recommended agronomic practices and
were kept uniform. Seed rate was kept 10 kg per acre. The crop was grown by keeping 60 cm
R-R distance and 20 cm P-P distance. Recommended dose of fertilizer was given to get
maximum yield. To control the weeds manual labor was used and herbicide was also applied.
The maize crop was harvested on 26 May, 2014 at physiological maturity. Data were recorded
for the crop.
3.3.4.5. Sesame during 2014
Sesame was sown on 2 June, 2014 in their respective plots according to assigned
randomization. All the recommended practices were followed to achieve maximum yield. The
seed rate of 2 kg per acre was used. The P-P distance of 10 cm and R-R distance of 45 cm was
maintained to have the desired plant population. Nitrogen was applied at 24 kg per acre, while
phosphorus was applied at 24 kg per acre. All the phosphorus was applied before sowing of
crop. To control the weeds manual labor was used and herbicide was also applied.
The crop was harvested on 2 November, 2014.

61
3.3.4.6. Wheat during 2014
Wheat was sown on 10 November, 2014. All the agronomic practices were kept
uniform in all the plots according to the pre-assigned randomization. Seed rate of 40 kg per
acre was used. The row to row distance was maintained at 22.5 cm. Nitrogen at the rate of 64
kg per acre and phosphorus at the rate of 46 kg per acre was applied. All the phosphorus was
applied at the tilth condition. To control the weeds manual labor was used and herbicide was
also applied. Wheat was harvested on 25 May, 2015. Data were recorded for various
parameters.
3.3.5. Cropping system 5
S5- Sunflower - Mungbean - Wheat/ Jantar - Rice - Gram
3.3.5.1. Sunflower during 2013
Sunflower was sown on 15 February, 2013 in the respective plots according to the pre-
assigned randomization, using recommended agronomic practices. Seed rate was kept 3 kg per
acre. The crop was grown by keeping 60 cm R-R distance and 20 cm P-P distance.
Recommended dose of fertilizer was given to get maximum yield. Nitrogen was applied at 40
kg per acre and phosphorus was applied at 30 kg per acre. All the phosphorus was
applied at the sowing time. To control the weeds manual labor was used and herbicide was also
applied.
Sunflower was harvested at physiological maturity on 10 June, 2013.
3.3.5.2. Mungbean during 2013
Mungbean was grown on 15 July, 2013 by keeping all the standard practices in all the
plots pre-allocated by randomization. The recommended seed rate was 8 kg per acre. To
achieve the desired number of plants in the field the P-P distance was maintained at 10 cm,
while R-R distance was maintained at 30 cm. As mungbean is leguminous crop and it fixes the
atmospheric nitrogen by the help of nodules, so nitrogen was applied at 10 kg per acre. The
phosphorus was applied at 25 kg per acre. All the phosphorus was applied before the sowing
of crop. To control the weeds manual labor was used and herbicide was also applied.

62
The crop was harvested on 30 October, 2013 at physiological maturity.
3.3.5.3. Wheat during 2013
Wheat was sown on 8 November, 2013. All the agronomic practices were kept uniform
in all the plots according to the pre-assigned randomization. Seed rate of 40 kg per acre was
used. The row to row distance was maintained at 22.5 cm. Nitrogen at the rate of 64 kg per
acre and phosphorus at the rate of 46 kg per acre was applied. All the phosphorus was applied
at the tilth condition. To control the weeds manual labor was used and herbicide was also
applied. Wheat was harvested on 20 May, 2014. Data were recorded for various parameters.
3.3.5.4. Jantar during 2014
Jantar was sown as relay crop at last irrigation of wheat crop. It was broadcasted in the
field at the rate of 8 kg per acre. There was no need of applying herbicide.
3.3.5.5. Rice during 2014
Rice nursery was grown on 6 June, 2014. It was transplanted in the field on 4 July,
2014 by manual laborers. All the cultural operations were kept constant in all the plots
according to the randomization. The crop was grown by maintaining 20 cm P-P distance and
22.5 cm R-R distance. Recommended dose of fertilizer was applied as nitrogen 46 kg per acre
and phosphorus 25 kg per acre. All the phosphorus was applied before transplanting the rice
nursery in the soil. To control the weeds manual labor was used and herbicide was also applied.
The crop was harvested on 2 November, 2014 and data were recorded.
3.3.5.6. Gram during 2014
Gram was grown on 16 November, 2014 following all the recommended procedures.
Seed rate of 25 kg per acre was used. Gram was planted by keeping 15 cm P-P distance and 45
cm R-R distance. Gram is a leguminous crop so it requires nitrogen at 12 kg per acre while
phosphorus at 25 kg per acre. To control the weeds manual labor was used and herbicide was
also applied. The crop was harvested on 7 April, 2015 and data were recorded.

63
3.3.6. Cropping system 6
S6- Sunflower - Mungbean - Barley - Cotton - Wheat
3.3.6.1. Sunflower during 2013
Sunflower was sown on 15 February, 2013 in the respective plots according to the pre-
assigned randomization, using recommended agronomic practices. Seed rate was kept 3 kg per
acre. The crop was grown by keeping 60 cm R-R distance and 20 cm P-P distance.
Recommended dose of fertilizer was given to get maximum yield. Nitrogen was applied at 40
kg per acre and phosphorus was applied at 30 kg per acre. All the phosphorus was
applied at the sowing time. To control the weeds manual labor was used and herbicide was also
applied.
Sunflower was harvested at physiological maturity on 10 June, 2013.
3.3.6.2. Mungbean during 2013
Mungbean was grown on 15 July, 2013 by keeping all the standard practices in all the
plots pre-allocated by randomization. The recommended seed rate was 8 kg per acre. To
achieve the desired number of plants in the field the P-P distance was maintained at 10 cm,
while R-R distance was maintained at 30 cm. As mungbean is leguminous crop and it fixes the
atmospheric nitrogen by the help of nodules, so nitrogen was applied at 10 kg per acre. The
phosphorus was applied at 25 kg per acre. All the phosphorus was applied before the sowing
of crop. To control the weeds manual labor was used and herbicide was also applied.
The crop was harvested on 30 October, 2013 at physiological maturity.
3.3.6.3. Barley during 2013
Barley was sown on 11 November, 2013 in the respective plots according to the
preassigned randomization, using recommended agronomic practices. Seed rate was kept 10
kg per acre. The crop was grown by keeping 60 cm R-R distance. Recommended dose of
fertilizer was given to get maximum yield. Nitrogen was applied at 40 kg per acre and
phosphorus was applied at 30 kg per acre. All the phosphorus was applied at the sowing time.

64
To control the weeds manual labor was used and herbicide was also applied. Barley was
harvested at physiological maturity on 14 May, 2014.
3.3.6.4. Cotton during 2014
Cotton crop was sown on 2 June, 2014 by keeping in view all the standard practices to
have maximum yield of cotton crop in all the plots. Seed rate of 10 kg per acre was used. The
P-P distance of 30 cm and R-R distance of 60 cm was maintained. Recommended fertilization
was applied as, nitrogen at 46 kg per acre and phosphorus at 23 kg per acre. All the phosphorus
was applied before sowing the crop. To control the weeds manual labor was used and herbicide
was also applied. The crop was harvested on 1 November, 2014.
3.3.6.5. Wheat during 2014
Wheat was sown on 9 November, 2014. All the agronomic practices were kept uniform
in all the plots according to the pre-assigned randomization. Seed rate of 40 kg per acre was
used. The row to row distance was maintained at 22.5 cm. Nitrogen at the rate of 64 kg per
acre and phosphorus at the rate of 46 kg per acre was applied. All the phosphorus was applied
at the tilth condition. To control the weeds manual labor was used and herbicide was also
applied. Wheat was harvested on 22 May, 2015. Data were recorded for various parameters.
3.4. Harvesting and Threshing
Each crop was harvested manually at physiological maturity, bundles were tied and sun
dried.
3.5. Data Collection
Data was collected on agronomic and economic aspects of different crops to assess the
performance of different cropping systems under irrigated condition.
3.5.1. Agronomic Data
The data was collected for each crop included in the study. However, the major
emphasis was given to the monetary returns of the unlike cropping systems. The data was
recorded on yield of each crop in a cropping system. In addition to that, soil fertility (N and P)

65
status was also be observed during the length of cropping sequences. Methods and procedures
used to obtain such data are given below:
3.5.1.1. Plant height at maturity (cm)
The plant height of 10 randomly selected plants from each plot at maturity was taken
from the visible node above the ground to the top with the help of meter rod. Finally, the
average plant height was calculated accordingly.
3.5.1.2. Stem diameter (cm)
The plants were randomly selected and stem diameter was measured for 10 plants from
every plot at maturity by using measuring tape. Finally, the average stem diameter was
calculated accordingly.
3.5.1.3. Grain weight per cob (g)
Ten plants were selected and total grain weight on each cob per plant from each plot
were recorded with digital electronic balance at the time of harvest and then averaged.
3.5.1.4. Cob length (cm)
The plants were randomly selected and cob length was measured for 10 plants from
each plot at maturity by using measuring tape. Finally, the average stem cob length was
recorded accordingly.
3.5.1.5. Number of tillers m-2
Number of tillers per m2 were calculated for wheat and rice.
3.5.1.6. 1000-grain weight (g)
From the grain lot of ten randomly selected cobs of each plot and grains for the other
crops, a representative sample of 1000-grains was made when moisture level was 10-12 % and
weight was recorded by digital weighing balance.

66
3.5.1.7. Biological yield (t/ha)
At maturity the biological yield of each plot was measured by taking the weight of all
plant matter along with grains. Readings were taken by digital balance and then converted into
tonnes per hectare.
3.5.1.8. Grain yield (t/ha)
After sun drying of cobs and other grains for 15 days the cobs of each plot were shelled
mechanically with maize sheller while other grains were threshed accordingly. Grains per plot
were weighed by digital balance and then converted into tonnes per hectare.
3.6. Analysis of Data
Data obtained was analyzed for,
Partial budget analysis
a) Cost of production of various cropping systems.
b) Gross income
c) Net profit
d) Benefit cost ratio
3.6.1. Cost of production of various cropping systems
All the expenses occurred during the research was recorded and cost of production
involved in growing all those crops were calculated and summed up for all cropping systems.
3.6.2. Gross income
The economic part of all the crops were measured and sold at the prevailing market
rate. All the income was summed up to calculate the gross income.
3.6.3. Net profit
Gross benefits were calculated as

67
Net Benefits = Gross Income – Total Cost
3.6.4. Productivity System
Productivity system for each of the cropping system was calculated by using the
following formula:
Gross Income
PS = ------------------------------
Total Cost
3.6.5. Statistical Analysis
Data collected from different cropping systems were analyzed statistically by
employing the Fisher analysis of variance technique (Steel et al., 1997) and treatment means
were compared by using Least Significance Difference (LSD) test at 5% probability level.
68
CHAPTER 4 RESULTS AND DISCUSSION
Diversified cropping systems are also a major economic activity to those in rural areas,
providing chief/staple food for millions of people and affecting the livelihoods as well as health
of both urban and rural poor. Cropping system is a producer’s map of their approach to
production. Intensive cropping systems in irrigated areas of Punjab are cottonwheat, rice-wheat
and mixed-wheat cropping systems. The mixed cropping system seems like deficient in giving
its economic potential during Kharif season. A research work was planned to develop a
cropping system under agro-climatic conditions of Faisalabad where mixed cropping system
is being followed. The experiment was designed to study the relationship of six different pre-
assigned cropping systems. The details of the pre-assigned cropping systems are given below.
S1 Maize (sp) - Maize - Wheat - Rice - Wheat
S2 Maize (sp) - Maize - Gram - Millet - Sarson
S3 Mungbean - Rice - Wheat - Cotton/ Sarson
S4 Mungbean - Rice – Berseem (GM) - Maize - Sesame – Wheat
S5 Sunflower - Mungbean - Wheat/ Jantar - Rice - Gram
S6 Sunflower - Mungbean - Barley - Cotton – Wheat
All the cropping systems were arranged in a randomized complete block design
(RCBD) with three replications. There were 18 plots in the experiment, each having size of 15
× 10 m. The experiment was initiated during February 2013 with the sowing of different pre-
assigned crops in the respective (randomized) plots. Analysis of soil was conducted before and
after the harvesting of each crop. All the agronomic parameters were observed during this study
and analyzed by statistics computer program. The differences among significant means will be
assessed by Least Significant Difference test at 5% probability level. The descriptions of results
are given below;

69
Table: 4.1 Growth and yield components of maize affected by various cropping systems
Cropping
Systems
Plant
height
(cm)
Stem
diamete
r (cm)
1000 grain
weight (g)
Grain
weight/cob
(g)
Cob length
(cm)
Grain yield
(t/ha)
S1 172.4 c 0.8 c 249.50 c 109.00 bc 12.00 4.9 bc
S2 178.8
b
0.9 b 260.00 b 112.50 b 12.75 5.00 b
S4 184.6 a 1.0 a 272.75 a 125.25 a 13.87 5.9 a
Significance * * * * NS *
* = Significant at p 0.05
NS = Non significant
S1 Maize (sp) - Maize - Wheat - Rice - Wheat
S2 Maize (sp) - Maize - Gram - Millet - Sarson
S4 Mungbean - Rice - Berseem (GM) - Maize - Sesame - Wheat

70
4.1. Growth and yield components of maize affected by various cropping
systems
Table (4.1) showed detailed comparison of effects of different cropping systems on
growth and yield components of maize.
4.1.1. Plant height (cm)
Results regarding (Table-4.1) showed that cropping system had significant effect on
plant height of maize. It was observed that maximum plant height (184.6 cm) was noticed in
S4 (Mungbean – Rice Berseem (GM) - Maize - Sesame – Wheat) cropping system, followed
by S2 (Maize (sp) - Maize - Gram - Millet – Sarson) and minimum plant height (172.4cm) was
observed in S1 (Maize (sp) - Maize - Wheat - Rice – Wheat) cropping system. More plant
height in S4 (Mungbean – Rice Berseem (GM) - Maize - Sesame – Wheat) cropping system is
due to growing of maize after leguminous crops and rice. These (Mungbean – Rice Berseem
(GM) are restorative crops that improved the soil nutrient status and physical properties of soil.
That is why after these crops maize plant growth is improved. Singh et al., 2003 and Singh et
al., 2011 also reported the beneficial effect of including legumes and restorative crops in
sequence on soil health and yield of succeeding crop due to favorable effect of growing
legumes on soil health.
4.1.2. Stem diameter (cm)
It was observed that stem diameter of maize was significantly affected by different
cropping systems (Table-4.1). In S4 (Mungbean – Rice Berseem (GM) - Maize - Sesame –
Wheat) cropping system maximum stem diameter (1.0 cm) was observed and minimum stem
diameter (0.8 cm) was shown by S1 (Maize (sp) - Maize - Wheat - Rice – Wheat) cropping
system. More stem diameter in S4 (Mungbean – Rice Berseem (GM) - Maize - Sesame –
Wheat) cropping system is due to this cropping system included green manuring crop and
leguminous crops that promoted the soil health and fertility of soil. Due to this reason stem
diameter of maize is more in S4 (Mungbean – Rice Berseem (GM) - Maize - Sesame – Wheat).
These results can be correlated with work of Singh et al. (2011).

71
4.1.3. 1000 grain weight (g)
Results showed that cropping systems significantly affected the 1000 grain weight of
maize (Table-4.1). Data revealed more 1000 grain weight (272.75 g) was given by S4
(Mungbean - Rice Berseem (GM) - Maize - Sesame - Wheat) cropping system and minimum
was shown by S1 (Maize (sp) - Maize - Wheat - Rice - Wheat) cropping system. More 1000
grain weight in S4 (Mungbean - Rice Berseem (GM) - Maize - Sesame - Wheat) cropping
system is due to growing of maize after leguminous crops and rice. These (Mungbean - Rice
Berseem (GM) are restorative crops that improved the soil nutrient status and physical
properties of soil. That is why after these crops maize plant growth is improved.
Seth and Balyan (1985) reported that legume crop grown in summer had a significant effect on
yield and yield parameters of wheat. This increase was attributed to the fact that cowpea being
a legume, fix nitrogen, which was used by succeeding crop. The economic net return obtained
with cowpeas (fodder) - wheat, fallow - wheat and maize - wheat systems was Rs 3917, 2441,
and 3319 per hectare, respectively.
4.1.4. Grain weight/cob (g)
Results regarding (Table-4.1) showed that cropping system had significant effect on
grain weight of maize. It was observed that maximum grain weight/ cob (125.25 g) was noticed
in S4 (Mungbean – Rice Berseem (GM) - Maize - Sesame – Wheat) cropping system, followed
by S2 (Maize (sp) - Maize - Gram - Millet – Sarson) and minimum grain weight/ cob was
observed in S1 (Maize (sp) - Maize - Wheat - Rice – Wheat) cropping system. More grain
weight/cob in S4 (Mungbean – Rice Berseem (GM) - Maize - Sesame – Wheat) cropping
system is due to this cropping system included green manuring crop and leguminous crops that
promoted the soil health and fertility of soil. Due to this reason grain weight/cob of maize is
more in S4 (Mungbean – Rice Berseem (GM) - Maize - Sesame – Wheat). These results are
similar with findings of Singh et al. (2003)
4.1.5. Cob length (cm)
It was observed that cob length of maize was non- significantly affected by different
cropping systems (Table-4.1). But in S4 (Mungbean – Rice Berseem (GM) - Maize - Sesame –

72
Wheat) cropping system maximum cob length was observed and minimum was shown by S1
(Maize (sp) - Maize - Wheat - Rice – Wheat) cropping system. Similar results were also
reported by Singh and Verma (1985).
4.1.6. Grain yield (t/ha)
Results showed that cropping systems significantly affected the grain yield of maize
(Table-4.1). Data revealed more grain yield (5.9 t/ha) was given by S4 (Mungbean – Rice
Berseem (GM) - Maize - Sesame – Wheat) cropping system and minimum (4.9 t/ha) was shown
by S1 (Maize (sp) - Maize - Wheat - Rice – Wheat) cropping system. More grain yield in S4
(Mungbean – Rice Berseem (GM) - Maize - Sesame – Wheat) cropping system is due to
growing of maize after leguminous crops and rice. These (Mungbean – Rice Berseem (GM)
are restorative crops that improved the soil nutrient status and physical properties of soil. That
is why after these crops maize plant yield is improved. Singh and Verma (1985) stated that
wheat yield was significantly higher after cowpeas, mash bean and mung bean than that
obtained after pigeon pea, fallow and pearl millet. 10.4, 13.1 and 13.8 percent with mung bean
augmented the productivity of wheat in a legume-based system, mash bean and cowpeas,
respectively over fallow. In a non-legume system, wheat yield decreased after pearl millet by
8% as compared to fallow. In a legume based system a net saving of residual nitrogen was
observed as 37.2 kg ha-1with mung bean 41.4 kg ha-1 with mash bean and 42.2 kg ha -1 with
cowpeas compared to after pearl millet The rotating payback of legume on following crop is
in line with the results as reported by Kuo & Jellum, (2002) and Shah et al., (2003). Likewise,
many researchers have testified that Nitrogen is an important factor in the rejoinder of cereals
succeeding legumes compared with cereals succeeding non-legumes (Evans et al., 1991; Chalk
et al., 1993; Smiley et al., 1994).

73
Table: 4.2 Growth and yield components of rice affected by various cropping systems
Cropping
Systems
Plant
height
(cm)
No. of
Tillers/Hill
1000 grain
weight (g)
No. of
panicles/hill
Paddy yield (t/ha)
S1 80 c 17 c 33 c 16 8.4
S3 82 b 19 b 35 b 17 8.5
S4 82.3 b 20 b 35.5 b 17 8.54
S5 85 a 23 a 38 a 18 8.6
Significance * * * NS NS
* = Significant at p 0.05
NS = Non significant
S1 Maize (sp) - Maize - Wheat - Rice - Wheat
S3 Mungbean - Rice - Wheat - Cotton/ Sarson
S4 Mungbean - Rice - Berseem (GM) - Maize - Sesame - Wheat S5
Sunflower - Mungbean - Wheat/ Jantar - Rice - Gram
4.2. Growth and yield components of rice affected by various cropping
systems
Effect of different cropping systems on growth and yield components of rice is
presented in Table-4.2

74
4.2.1. Plant height (cm)
Results regarding (Table-4.2) showed that cropping system had significant effect on
plant height of rice. It was observed that maximum plant height (85 cm) was noticed in S5
(Sunflower -Mungbean - Wheat/ Jantar - Rice – Gram) cropping system, followed by S4
(Mungbean – Rice Berseem (GM) - Maize - Sesame – Wheat), followed by S3 (Mungbean -
Rice - Wheat - Cotton/ Sarson) and minimum plant height (80 cm) was observed in S1 (Maize
(sp) - Maize - Wheat - Rice – Wheat) cropping system. S4 (Mungbean – Rice Berseem (GM)
- Maize - Sesame – Wheat) and S3 (Mungbean - Rice - Wheat - Cotton/ Sarson) are statistically
at par with each other for plant height. Less plant height in S1 (Maize (sp) - Maize - Wheat -
Rice – Wheat) cropping system is because in this cropping system rice is grown after maize
and wheat crops. These both crops are exhaustive crops. So rice grown after these crops gave
low plant height as compared to other cropping systems. It was observed that S5 (Sunflower -
Mungbean - Wheat/ Jantar - Rice – Gram) cropping system gave better plant height as
compared to other cropping system, reason is that in this cropping system rice was grown after
mungbean and green manuring crop (jantar). These crops are restorative crops and enhance the
soil fertility status of soil. So rice grown in this cropping system produced more plant height.
These results are in agreement with work of Akbar et al. (2000). They reported that leguminous
crops increased the nitrogen content of soil and enhanced vegetative growth of next sowing
crops.
4.2.2. No. of Tillers/Hill
It was observed that number of tillers/hill was significantly affected by different
cropping systems (Table-4.2). In S5 (Sunflower -Mungbean - Wheat/ Jantar - Rice – Gram)
cropping system maximum number of tillers/hill (23) were recorded, followed by S4
(Mungbean – Rice Berseem (GM) - Maize - Sesame – Wheat), followed by S3 (Mungbean -
Rice - Wheat - Cotton/ Sarson) and minimum (17) were observed in S1 (Maize (sp) - Maize -
Wheat - Rice – Wheat) cropping system. S4 (Mungbean – Rice Berseem (GM) - Maize -
Sesame – Wheat) and S3 (Mungbean - Rice - Wheat - Cotton/ Sarson) are non-significant to
each other for number of tillers/hill. Less number of tillers/hill in S1 (Maize (sp) - Maize -

75
Wheat - Rice – Wheat) cropping system is because in this cropping system rice is grown after
maize and wheat crops. These both crops are exhaustive crops. So rice grown after these crops
gave low number of tillers/hill as compared to other cropping systems. It was observed that S5
(Sunflower -Mungbean - Wheat/ Jantar - Rice – Gram) cropping system gave better plant
height as compared to other cropping system, reason is that in this cropping system rice was
grown after mungbean and green manuring crop (jantar). These crops are restorative crops and
enhance the soil fertility status of soil. So rice grown in this cropping system produced more
number of tillers/hill. Similar results were also observed by (Singh and Singh, 2000).
4.2.3. 1000 grain weight (g)
Results showed that cropping systems significantly affected the 1000 grain weight of
rice (Table-4.2). Data revealed more 1000 grain weight (38 g) was recorded in S5 (Sunflower
-Mungbean - Wheat/ Jantar - Rice – Gram) cropping system followed by S4 (Mungbean –
Rice Berseem (GM) - Maize - Sesame – Wheat), followed by S3 (Mungbean - Rice - Wheat -
Cotton/ Sarson) and minimum (33 g) was observed in S1 (Maize (sp) - Maize - Wheat - Rice -
Wheat) cropping system. S4 (Mungbean - Rice Berseem (GM) - Maize - Sesame - Wheat) and
S3 (Mungbean - Rice - Wheat - Cotton/ Sarson) are at par to each other for 1000 grain weight.
Less 1000 grain weight in S1 (Maize (sp) - Maize - Wheat - Rice – Wheat) cropping system is
because in this cropping system rice is grown after maize and wheat crops. These both crops
are exhaustive crops. So rice grown after these crops gave low 1000 grain weight as compared
to other cropping systems. It was observed that S5 (Sunflower -Mungbean - Wheat/ Jantar -
Rice - Gram) cropping system gave better 1000 grain weight as compared to other cropping
system, reason is that in this cropping system rice was grown after mungbean and green
manuring crop (jantar). These crops are restorative crops and enhance the soil fertility status
of soil. So rice grown in this cropping system produced more1000 grain weight. Our results
are in line with work of Chandra and Gautam, 1997. They reported the rice gave more 1000
grain weight when planted after leguminous crops.

76
4.2.4. No. of panicles/hill
Results regarding (Table-4.2) showed that cropping system had non-significant effect
on number of panicles per hill but S5 (Sunflower -Mungbean - Wheat/ Jantar - Rice – Gram)
cropping system produced maximum number of panicles, followed by S4 (Mungbean – Rice
Berseem (GM) - Maize - Sesame – Wheat), followed by S3 (Mungbean - Rice - Wheat -
Cotton/ Sarson) and minimum were observed in S1 (Maize (sp) - Maize - Wheat - Rice –
Wheat) cropping system. These results can be correlated with work of Chandra and Gautam
(1997).
4.2.5. Paddy yield (t/ha)
Results showed that cropping systems had no-significant effect on paddy yield of rice
(Table-4.2) but maximum paddy yield was recorded in S5 (Sunflower -Mungbean - Wheat/
Jantar - Rice – Gram) cropping, followed by S4 (Mungbean – Rice Berseem (GM) - Maize -
Sesame – Wheat), followed by S3 (Mungbean - Rice - Wheat - Cotton/ Sarson) and minimum
was observed in S1 (Maize (sp) - Maize - Wheat - Rice – Wheat) cropping system. More plant
height in S4 (Mungbean – Rice Berseem (GM) - Maize - Sesame – Wheat) cropping system is
due to this cropping system contains more restorative crops that improved the soil nutrient
status and physical properties of soil. That is why after these crops wheat plant height is
improved. Our results are in line with work of Chandra and Gautam, 1997. They reported the
rice gave more yield when planted after leguminous crops.
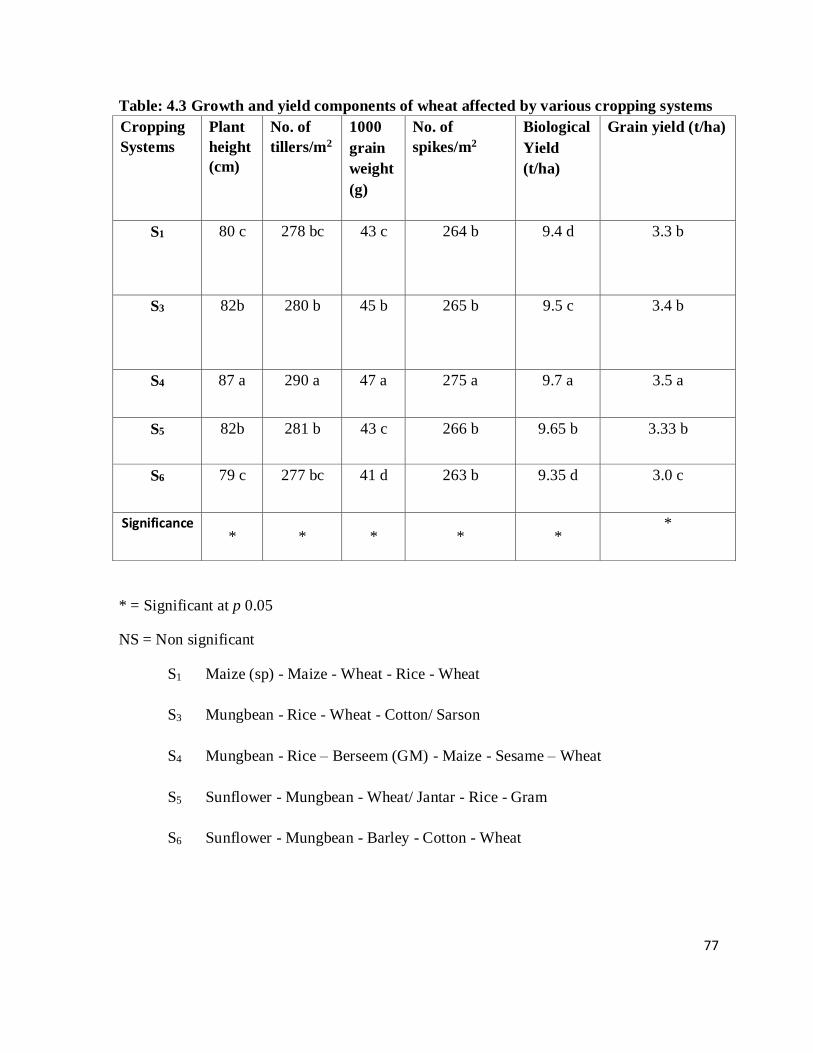
77
Table: 4.3 Growth and yield components of wheat affected by various cropping systems
Cropping
Systems
Plant
height
(cm)
No. of
tillers/m2
1000
grain
weight
(g)
No. of
spikes/m2
Biological
Yield
(t/ha)
Grain yield (t/ha)
S1 80 c 278 bc 43 c 264 b 9.4 d 3.3 b
S3 82b 280 b 45 b 265 b 9.5 c 3.4 b
S4 87 a 290 a 47 a 275 a 9.7 a 3.5 a
S5 82b 281 b 43 c 266 b 9.65 b 3.33 b
S6 79 c 277 bc 41 d 263 b 9.35 d 3.0 c
Significance * * * * *
*
* = Significant at p 0.05
NS = Non significant
S1 Maize (sp) - Maize - Wheat - Rice - Wheat
S3 Mungbean - Rice - Wheat - Cotton/ Sarson
S4 Mungbean - Rice – Berseem (GM) - Maize - Sesame – Wheat
S5 Sunflower - Mungbean - Wheat/ Jantar - Rice - Gram
S6 Sunflower - Mungbean - Barley - Cotton - Wheat

78
4.3. Growth and yield components of wheat affected by various cropping
systems
Effect of different cropping systems on growth and yield components of wheat is
presented in Table-4.3
4.3.1. Plant height (cm)
Results regarding (Table-4.3) showed that cropping system had significant effect on
plant height of wheat. It was observed that maximum plant height (87 cm) was shown by S4
(Mungbean – Rice Berseem (GM) - Maize - Sesame – Wheat) cropping system while minimum
(79 cm) was observed in S6 (Sunflower - Mungbean - Barley - Cotton – Wheat) cropping
system. S5 (Sunflower -Mungbean - Wheat/ Jantar - Rice – Gram) and S3 (Mungbean - Rice -
Wheat - Cotton/ Sarson) cropping system are at par to each other for plant height and also S1
(Maize (sp) - Maize - Wheat - Rice – Wheat) cropping system is statistically at with S6
(Sunflower - Mungbean - Barley - Cotton – Wheat) cropping system for plant height. Minimum
plant height in S1 (Maize (sp) - Maize - Wheat - Rice – Wheat) cropping system is due this
cropping system mostly contains exhaustive crops that reduces the soil fertility and ultimately
plant height of wheat. Similar results were observed by Akbar et al. (2000). They reported that
inclusion of leguminous crops in cropping system increased the nitrogen content of soil and
ultimately improved the growth and growth parameters of plant. While inclusion of exhaustive
crops reduced the nitrogen and organic matter content of soil and ultimately decreased the
growth and growth components of plants.
4.3.2. No. of tillers/m2
Data presented in (Table-4.3) revealed that different cropping systems showed different
response for number of tillers/m2 of wheat. Results showed that highest number of tillers (290)
was given by S4 (Mungbean – Rice Berseem (GM) - Maize - Sesame – Wheat) cropping system
while lowest (277) was observed in S6 (Sunflower - Mungbean - Barley - Cotton – Wheat)
cropping system. Cropping system S5 (Sunflower -Mungbean - Wheat/ Jantar - Rice – Gram)
and S3 (Mungbean - Rice - Wheat - Cotton/ Sarson) are at par to each other for number of
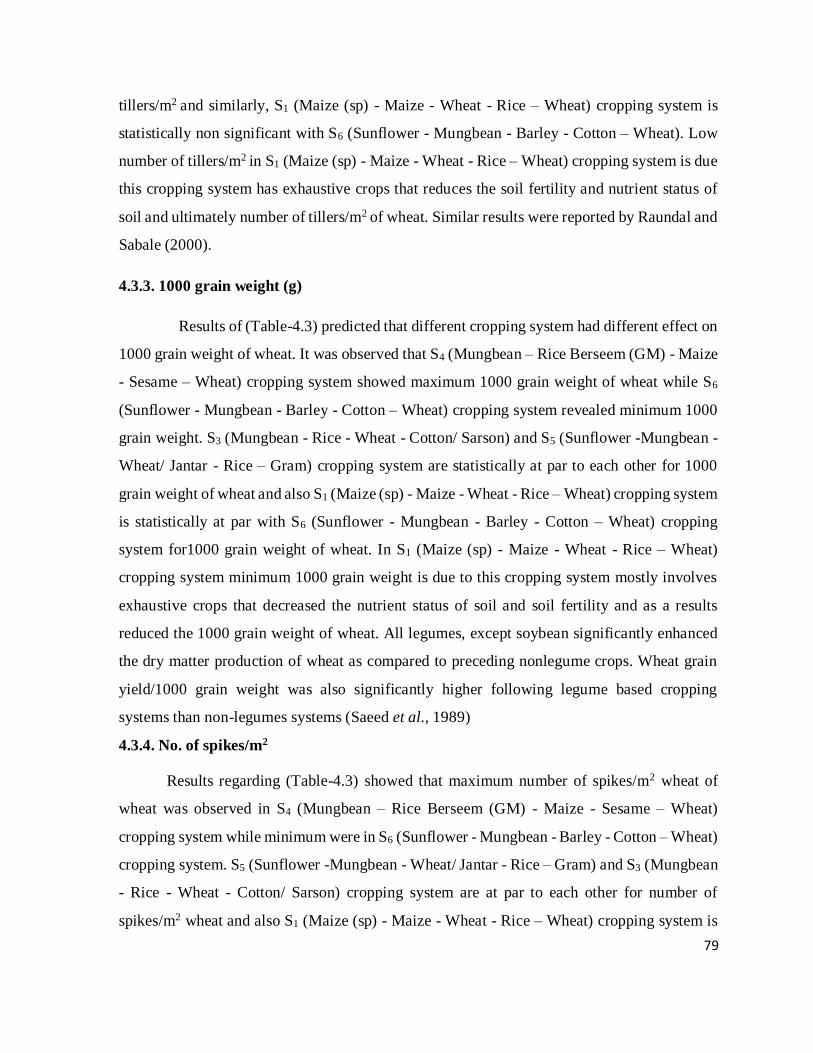
79
tillers/m2 and similarly, S1 (Maize (sp) - Maize - Wheat - Rice – Wheat) cropping system is
statistically non significant with S6 (Sunflower - Mungbean - Barley - Cotton – Wheat). Low
number of tillers/m2 in S1 (Maize (sp) - Maize - Wheat - Rice – Wheat) cropping system is due
this cropping system has exhaustive crops that reduces the soil fertility and nutrient status of
soil and ultimately number of tillers/m2 of wheat. Similar results were reported by Raundal and
Sabale (2000).
4.3.3. 1000 grain weight (g)
Results of (Table-4.3) predicted that different cropping system had different effect on
1000 grain weight of wheat. It was observed that S4 (Mungbean – Rice Berseem (GM) - Maize
- Sesame – Wheat) cropping system showed maximum 1000 grain weight of wheat while S6
(Sunflower - Mungbean - Barley - Cotton – Wheat) cropping system revealed minimum 1000
grain weight. S3 (Mungbean - Rice - Wheat - Cotton/ Sarson) and S5 (Sunflower -Mungbean -
Wheat/ Jantar - Rice – Gram) cropping system are statistically at par to each other for 1000
grain weight of wheat and also S1 (Maize (sp) - Maize - Wheat - Rice – Wheat) cropping system
is statistically at par with S6 (Sunflower - Mungbean - Barley - Cotton – Wheat) cropping
system for1000 grain weight of wheat. In S1 (Maize (sp) - Maize - Wheat - Rice – Wheat)
cropping system minimum 1000 grain weight is due to this cropping system mostly involves
exhaustive crops that decreased the nutrient status of soil and soil fertility and as a results
reduced the 1000 grain weight of wheat. All legumes, except soybean significantly enhanced
the dry matter production of wheat as compared to preceding nonlegume crops. Wheat grain
yield/1000 grain weight was also significantly higher following legume based cropping
systems than non-legumes systems (Saeed et al., 1989)
4.3.4. No. of spikes/m2
Results regarding (Table-4.3) showed that maximum number of spikes/m2 wheat of
wheat was observed in S4 (Mungbean – Rice Berseem (GM) - Maize - Sesame – Wheat)
cropping system while minimum were in S6 (Sunflower - Mungbean - Barley - Cotton – Wheat)
cropping system. S5 (Sunflower -Mungbean - Wheat/ Jantar - Rice – Gram) and S3 (Mungbean
- Rice - Wheat - Cotton/ Sarson) cropping system are at par to each other for number of
spikes/m2 wheat and also S1 (Maize (sp) - Maize - Wheat - Rice – Wheat) cropping system is

80
statistically at par with S6 (Sunflower - Mungbean - Barley - Cotton – Wheat) cropping system
for number of spikes/m2 wheat. The results of Hossain et al. (1996) strongly support these
results.
4.3.5. Biological Yield (t/ha)
It was observed that cropping system significantly affected biological yield of wheat.
Results showed that S4 (Mungbean – Rice Berseem (GM) - Maize - Sesame – Wheat) cropping
system produced maximum biological yield of wheat while minimum was noticed in S6
(Sunflower - Mungbean - Barley - Cotton – Wheat) cropping system. Effect of S5 (Sunflower
-Mungbean - Wheat/ Jantar - Rice – Gram) and S3 (Mungbean - Rice - Wheat -
Cotton/ Sarson) cropping system was non-significant to each other and also S1 (Maize (sp) -
Maize - Wheat - Rice – Wheat) cropping system is statistically at par with S6 (Sunflower -
Mungbean - Barley - Cotton – Wheat) cropping system for biological yield of wheat. Minimum
biological yield of wheat in S1 (Maize (sp) - Maize - Wheat - Rice – Wheat) cropping system
is due this cropping system mostly contains exhaustive crops that reduces the soil fertility and
ultimately biological yield of wheat of wheat. Seth and Balyan (1985) reported that legume
crop grown in summer had a significant effect on grain yield of wheat. Their two years
indicated that wheat yield of 50.5 Quintal ha-1was obtained when it was sown after cowpeas
(fodder) compared to 39.49 quintal ha-1 after fallow and 41.8 quintal ha1after maize. This
increase was attributed to the fact that cowpea being a legume, fix nitrogen, which was used
by succeeding crop. The economic net return obtained with cowpeas (fodder) - wheat, fallow
- wheat and maize - wheat systems was Rs 3917, 2441, and 3319 per hectare, respectively.
4.3.6. Grain yield (t/ha)
Results regarding (Table-4.3) showed that cropping system had significant effect on grain yield
of wheat. It was observed that maximum grain yield of wheat was shown by S4 (Mungbean –
Rice Berseem (GM) - Maize - Sesame – Wheat) cropping system while minimum was
observed in S6 (Sunflower - Mungbean - Barley - Cotton – Wheat) cropping system. S5
(Sunflower -Mungbean - Wheat/ Jantar - Rice – Gram) and S3 (Mungbean - Rice - Wheat -
Cotton/ Sarson) cropping system are at par to each other for grain yield of wheat and also S1
(Maize (sp) - Maize - Wheat - Rice – Wheat) cropping system is statistically at par with S6

81
(Sunflower - Mungbean - Barley - Cotton – Wheat) cropping system for grain yield of wheat.
Minimum grain yield of wheat in S1 (Maize (sp) - Maize - Wheat - Rice – Wheat) cropping
system is due this cropping system mostly contains exhaustive crops that reduces the soil
fertility and ultimately grain yield of wheat. Reynolds et al. (1994) conducted an experiment
by using legume crops for the fixation of nitrogen in those soils where wheat or barley were to
be sown. The leguminous crop was sown between the rows of wheat or barley. The results
showed that there was no decrease in the yields of the main crops where legumes were grown
as compared to control conditions. Grain yields obtained were 1.4 t ha-1 whereas nearly
additional two times more biomass was obtained from the legumes. They reported that during
the experiment when different legumes were used to find out the adaptableness of the cropping
system to the changing needs of the farmers, legumes yielded dry biomass as much as 6.5 t ha-
1 when they harvested fodder crop of hairy vetch having yield of dry beans 1.4 t ha -1 and an
additional 3.5 t ha-1 of biomass in case of Vicia faba. In addition to this more nitrogen was
fixed when legume crops were inter-cropped and levels of leaf nitrogen were 3.8% which were
significantly more than when wheat crop was sown alone. Singh and Verma (1985) also
reported that when the cropping system included mung bean, mash bean and cowpeas the yield
of successive grain crop wheat was significantly increased by 13.8, 13.1 and 10.4%
respectively than that of wheat grown after other crops like pearl millet, fallow or pigeon pea.
Thus the productivity of the crop wheat increased after legume-based cropping system. In other
systems which were not legume based wheat production was significantly reduced by 8% when
planted after pearl millet as compared to the crop sown after fallow. Whereas in the cropping
system where legumes were used there was significant saving of nitrogen in the form of
residues. Mash bean gave 41.4 kg ha-1, mash bean resulted in 42.4 kg ha-1 residual nitrogen
while mung bean resulted in 37.2 kg ha-1 nitrogen in the form of residues.

82
Table: 4.4 Growth and yield components of mungbean affected by various cropping
systems
Cropping
Systems
Plant
height
(cm)
No. of
pods/plant
1000
grain
weight
(g)
Biological yield
(t/ha)
Grain yield (t/ha)
S3 70 60 46b 3.1 b 1.1 b
S4 71 63 48a 3.3 a 1.2 a
S5 69 62 46b 3.08 c 1.14 b
S6 68 59 43c 3.08 c 1.08 bc
Significance NS NS * * *
* = Significant at p 0.05
NS = Non significant
S3 Mungbean - Rice - Wheat - Cotton/ Sarson
S4 Mungbean - Rice – Berseem (GM) - Maize - Sesame – Wheat
S5 Sunflower - Mungbean - Wheat/ Jantar - Rice - Gram
S6 Sunflower - Mungbean - Barley - Cotton - Wheat

83
4.4. Growth and yield components of mungbean affected by various
cropping systems
Effect of different cropping systems on growth and yield components of mungbean is
presented in Table-4.4.
4.4.1. Plant height (cm)
Results regarding (Table-4.4) showed that cropping system had non- significant effect
on plant height of mungbean. But maximum plant height (71 cm) was shown by S4 (Mungbean
– Rice Berseem (GM) - Maize - Sesame – Wheat) cropping system followed by
S3 (Mungbean - Rice - Wheat - Cotton/ Sarson), followed by S5 (Sunflower -Mungbean -
Wheat/ Jantar - Rice – Gram) while minimum (68 cm) was observed in S6 (Sunflower -
Mungbean - Barley - Cotton – Wheat) cropping system. Minimum plant height in S6 (Maize
(sp) - Maize - Wheat - Rice – Wheat) cropping system is due this cropping system mostly
contains exhaustive crops that reduces the soil fertility and ultimately plant height of wheat.
Plant height similarity was due to uniform agronomic practices and same preceding sunflower
crop in S5 (Sunflower -Mungbean - Wheat/ Jantar - Rice – Gram) and S6 (Sunflower -
Mungbean - Barley - Cotton – Wheat) cropping system and first mung bean crop in S4
(Mungbean – Rice Berseem (GM) - Maize - Sesame – Wheat) and S3 (Mungbean - Rice -
Wheat - Cotton/ Sarson) cropping system. These results are in agreement with work of Akbar
et al. (2000). They reported that leguminous crops increased the nitrogen content of soil and
enhanced vegetative growth of next sowing crops.
4.4.2. No. of pods/plant
Results related to number of pods/plant (Table-4.4) revealed that cropping system had
non- significant behavior on number of pods/plant of mungbean. However, maximum number
of pods/plant were produced by S4 (Mungbean – Rice Berseem (GM) - Maize - Sesame –
Wheat) cropping system followed by S3 (Mungbean - Rice - Wheat - Cotton/ Sarson), followed
by S5 (Sunflower -Mungbean - Wheat/ Jantar - Rice – Gram) while lowest number of
pods/plant were observed in S6 (Sunflower - Mungbean - Barley - Cotton – Wheat) cropping

84
system. Lowest number of pods/plant in S6 (Maize (sp) - Maize - Wheat - Rice – Wheat)
cropping system is due this cropping system involves exhaustive crops that reduces the soil
fertility and ultimately number of pods/plant of mung bean. Number of pods/plant similarity
was due to uniform agronomic practices and same preceding sunflower crop in S5 (Sunflower
-Mungbean - Wheat/ Jantar - Rice - Gram) and S6 (Sunflower - Mungbean - Barley - Cotton -
Wheat) cropping system and first mung bean crop in S4
(Mungbean – Rice Berseem (GM) - Maize - Sesame - Wheat) and S3 (Mungbean - Rice - Wheat
- Cotton/ Sarson) cropping system. Similar results were observed by Akbar et al. (2000). They
reported that inclusion of leguminous crops in cropping system increased the nitrogen content
of soil and ultimately improved the growth and growth parameters of plant. While inclusion of
exhaustive crops reduced the nitrogen and organic matter content of soil and ultimately
decreased the growth and growth components of plants.
4.4.3. 1000 grain weight (g)
Results regarding (Table-4.4) showed that cropping system had significant effect on
1000 grain weight of mungbean. Maximum 1000 grain weight was shown by S4 (Mungbean –
Rice Berseem (GM) - Maize - Sesame – Wheat) cropping system followed by S3
(Mungbean - Rice - Wheat - Cotton/ Sarson), followed by S5 (Sunflower -Mungbean -
Wheat/ Jantar - Rice – Gram) while minimum was observed in S6 (Sunflower - Mungbean -
Barley - Cotton – Wheat) cropping system. Minimum 1000 grain weight in S6 (Maize (sp) -
Maize - Wheat - Rice – Wheat) cropping system is due this cropping system mostly contains
exhaustive crops that reduces the soil fertility and ultimately 1000 grain weight of mung bean.
All legumes, except soybean significantly enhanced the dry matter production of wheat as
compared to preceding non-legume crops. Wheat grain yield/1000 grain weight was also
significantly higher following legume based cropping systems than non-legumes systems
(Saeed et al., 1989)
4.4.4. Biological yield (t/ha)
It was observed that biological yield of mung bean was significantly affected by
cropping systems (Table-4.4). S4 (Mungbean - Rice Berseem (GM) - Maize - Sesame - Wheat)
cropping system produced maximum biological yield followed by S3 (Mungbean - Rice -

85
Wheat - Cotton/ Sarson), followed by S5 (Sunflower -Mungbean - Wheat/ Jantar - Rice – Gram)
while S6 (Sunflower - Mungbean - Barley - Cotton - Wheat) cropping system showed minimum
biological yield. In S6 (Maize (sp) - Maize - Wheat - Rice - Wheat) cropping system minimum
biological yield is due to this cropping system mostly contains less restorative crops and more
exhaustive crops that declined the soil fertility and ultimately biological yield of mung bean.
Seth and Balyan (1985) reported that legume crop grown in summer had a significant effect on
yield and yield parameters of wheat. This increase was attributed to the fact that cowpea being
a legume, fix nitrogen, which was used by succeeding crop. The economic net return obtained
with cowpeas (fodder) - wheat, fallow - wheat and maize - wheat systems was Rs 3917, 2441,
and 3319 per hectare, respectively.
4.4.5. Grain yield (t/ha)
Results regarding grain yield of mungbean (Table-4.4) showed that maximum grain
yield was observed in S4 (Mungbean - Rice Berseem (GM) - Maize - Sesame - Wheat) cropping
system followed by S3 (Mungbean - Rice - Wheat - Cotton/ Sarson), followed by S5 (Sunflower
-Mungbean - Wheat/ Jantar - Rice - Gram) while minimum was observed in S6 (Sunflower -
Mungbean - Barley - Cotton - Wheat) cropping system. Minimum grain yield in S6 (Maize (sp)
- Maize - Wheat - Rice - Wheat) cropping system is due to this cropping system mostly contains
exhaustive crops that reduces the soil fertility and ultimately grain yield of mung bean. Singh
and Verma (1985) stated that wheat yield was significantly higher after cowpeas, mash bean
and mung bean than that obtained after pigeon pea, fallow and pearl millet. 10.4, 13.1 and 13.8
percent with mung bean augmented the productivity of wheat in a legume-based system, mash
bean and cowpeas, respectively over fallow. In a nonlegume system, wheat yield decreased
after pearl millet by 8% as compared to fallow. In a legume based system a net saving of
residual nitrogen was observed as 37.2 kg ha-1with mung bean 41.4 kg ha-1 with mash bean
and 42.2 kg ha-1 with cowpeas compared to after pearl millet.

86
Table: 4.5 Growth and yield components of gram affected by various cropping systems
Cropping
Systems
Plant
height
(cm)
100 grain
weight (g)
Number of
grains/plant
Grain yield t/ha)
S2 65 b 26 b 85 b 1.8 b
S5 71 a 28 a 91 a 1.9 a
Significance * * * *
* = Significant at p 0.05
NS = Non significant
S2 Maize (sp) - Maize - Gram - Millet - Sarson
S5 Sunflower - Mungbean - Wheat/ Jantar - Rice - Gram

87
4.5. Growth and yield components of gram affected by various cropping
systems
Effect of different cropping systems on growth and yield components of gram is
presented in Table-4.5.
4.5.1. Plant Height (cm)
Data of (Table-4.5) showed that cropping system significantly affected the plant height
of gram. Results showed that maximum plant height (71 cm) was observed in S5 (Sunflower -
Mungbean - Wheat/ Jantar - Rice - Gram) while minimum plant height (65 cm) was observed
in S2 (Maize (sp) - Maize - Gram - Millet - Sarson) cropping system. Maximum plant height
in S5 (Sunflower -Mungbean - Wheat/ Jantar - Rice - Gram) is due to, in this cropping system,
gram was grown after green manuring and rice crop. These crops are restorative crops and
enhance nutrient status of soil and stimulate the plant growth promoting bacteria in soil that
enhance plant growth through different direct and indirect mechanisms. Minimum plant height
in S2 (Maize (sp) - Maize - Gram - Millet - Sarson) cropping system is because in this cropping
system gram was grown after maize crops. This maize crop is exhaustive crop and reduced the
fertility status of soil and ultimately decreased plant height of the next crop. Similar results
were observed by Akbar et al. (2000). They reported that inclusion of leguminous crops in
cropping system increased the nitrogen content of soil and ultimately improved the growth and
growth parameters of plant. While inclusion of exhaustive crops reduced the nitrogen and
organic matter content of soil and ultimately decreased the growth and growth components of
plants.
4.5.2. 100 grain weight (g)
It was observed that cropping system had significant effect on 100 grain weight of
gram (Table-4.5). Maximum 100 grain weight was shown by S5 (Sunflower -Mungbean -
Wheat/ Jantar - Rice - Gram) while minimum was observed in S2 (Maize (sp) - Maize - Gram
- Millet - Sarson) cropping system. Maximum 100 grain weight in S5 (Sunflower -Mungbean
- Wheat/ Jantar - Rice - Gram) is due to, in this cropping system, after green manuring and rice

88
crop, gram was grown. Green manuring and rice crop enhance nutrient status of soil and
stimulate the plant growth promoting bacteria in soil that enhance plant growth through
different direct and indirect mechanisms. Minimum 100 grain weight in S2 (Maize (sp) - Maize
- Gram - Millet - Sarson) cropping system is because in this cropping system gram was grown
after maize crops. This maize crop reduced the fertility status of soil and ultimately affected
the next crop growth and yield. Wheat grain yield/1000 grain weight was also significantly
higher following legume based cropping systems than non-legumes systems (Saeed et al.,
1989) 4.5.3. Number of grains/plant
Results regarding (Table-4.5) showed that maximum number of grains/plant were
produced by S5 (Sunflower -Mungbean - Wheat/ Jantar - Rice - Gram) while minimum in S2
(Maize (sp) - Maize - Gram - Millet - Sarson) cropping system. Maximum number of
grains/plant in S5 (Sunflower -Mungbean - Wheat/ Jantar - Rice - Gram) is due to, in this
cropping system, gram was grown after green manuring and rice crop. As green manuring and
rice crops are restorative crops. These crops enhance nutrient status of soil and promoted the
plant growth promoting bacteria in soil that improved the plant growth through siderophores
production, nutrient solubilization and phytohormones production. In S2 (Maize (sp) - Maize -
Gram - Millet - Sarson) cropping system minimum number of grains/plant is because in this
cropping system, maize crop was grown before gram crop sowing. This crop is exhaustive crop
and declined the fertility status of soil and ultimately affected the next crop. Wheat grain
yield/1000 grain weight was also significantly higher following legume based cropping
systems than non-legumes systems (Saeed et al., 1989).
4.5.4. Grain yield (t/ha)
Results regarding (Table-4.5) showed that cropping system had significant effect on grain yield
of gram. Maximum grain yield was shown by S5 (Sunflower -Mungbean - Wheat/ Jantar - Rice
- Gram) while minimum was observed in S2 (Maize (sp) - Maize - Gram -
Millet - Sarson) cropping system. Maximum grain yield in S5 (Sunflower -Mungbean - Wheat/
Jantar - Rice - Gram) is due to in this cropping system gram was grown after green manuring
and rice crop. These crops are restorative crops and enhance nutrient status of soil and stimulate
the plant growth promoting bacteria in soil that enhance plant growth through different direct

89
and indirect mechanisms. Minimum grain yield in S2 (Maize (sp) - Maize - Gram - Millet -
Sarson) cropping system is because in this cropping system gram was grown after maize crops.
This maize crop is exhaustive crop and reduced the fertility status of soil and ultimately
affected the next crop. Reynolds et al. (1994) conducted an experiment by using legume crops
for the fixation of nitrogen in those soils where wheat or barley were to be sown. The
leguminous crop was sown between the rows of wheat or barley. The results showed that there
was no decrease in the yields of the main crops where legumes were grown as compared to
control conditions. Grain yields obtained were 1.4 t ha-1 whereas nearly additional two times
more biomass was obtained from the legumes. They reported that during the experiment when
different legumes were used to find out the adaptableness of the cropping system to the
changing needs of the farmers, legumes yielded dry biomass as much as 6.5 t ha-1 when they
harvested fodder crop of hairy vetch having yield of dry beans 1.4 t ha-1 and an additional 3.5
t ha-1 of biomass in case of Vicia faba. In addition to this more nitrogen was fixed when legume
crops were inter-cropped and levels of leaf nitrogen were
3.8% which were significantly more than when wheat crop was sown alone.

90
Table: 4.6 Growth and yield components of cotton affected by various cropping systems
Cropping
Systems
Plant
height
(cm)
Number of
branches/plant
Number of
bolls/plant
Cotton
seed yield
(t/ha)
Seed cotton
yield (t/ha)
Lint
yield
(t/ha)
S3
119 a 14 a 20 a 1.10 a 1.80 a 0.87 a
S6
112 b 11 b 16 b 0.83 b 1.2 b 0.65 b
Significance
* * * * *
*
* = Significant at p 0.05
NS = Non significant
S3 Mungbean - Rice - Wheat - Cotton/ Sarson
S6 Sunflower - Mungbean - Barley - Cotton - Wheat

91
4.6. Growth and yield components of cotton affected by various cropping
systems
Effect of different cropping systems on growth and yield components of cotton is presented
in Table-4.6.
4.6.1. Plant height (cm)
Plant height of cotton showed that cropping system had significant effect on plant
height of cotton (Table-4.6). S3 (Mungbean - Rice - Wheat - Cotton/ Sarson) showed maximum
plant height (119 cm) and in S6 (Sunflower - Mungbean - Barley - Cotton - Wheat) cropping
system minimum plant height was observed. Maximum plant height in S3 (Mungbean - Rice -
Wheat - Cotton/ Sarson) is due to this cropping system included two restorative crops before
cotton crops while minimum plant height in S6 (Sunflower - Mungbean - Barley - Cotton -
Wheat) cropping system is due to two exhaustive crops were sown before cotton sowing.
Similar results were observed by Akbar et al. (2000). They reported that inclusion of
leguminous crops in cropping system increased the nitrogen content of soil and ultimately
improved the growth and growth parameters of plant. While inclusion of exhaustive crops
reduced the nitrogen and organic matter content of soil and ultimately decreased the growth
and growth components of plants.
4.6.2. Number of branches/plant
Data (Table-4.6) showed that cropping system significantly affected the number of
branches/plant of cotton. Results showed that maximum number of branches/plant were shown
by S3 (Mungbean - Rice - Wheat - Cotton/ Sarson) and minimum was observed in S6
(Sunflower - Mungbean - Barley - Cotton - Wheat) cropping system. More number of
branches/plant in S3 (Mungbean - Rice - Wheat - Cotton/ Sarson) as compared to other
cropping system is due to this cropping system included two restorative crops such as
mungbean and rice before cotton crops sown while minimum number of branches/plant in S6
(Sunflower - Mungbean - Barley - Cotton - Wheat) cropping system is due to two exhaustive
crops were sown before cotton sowing. Yadav et al. (1993) also reported similar results.

92
4.6.3. Number of bolls/plant
Results (Table-4.6) revealed that maximum number of bolls /plant were observed in S3
(Mungbean - Rice - Wheat - Cotton/ Sarson) and minimum were observed in S6 (Sunflower -
Mungbean - Barley - Cotton - Wheat) cropping system. Maximum number of bolls /plant in S3
(Mungbean - Rice - Wheat - Cotton/ Sarson) is due to this cropping system included two
restorative crops before cotton crops sown while minimum number of bolls /plant in S6
(Sunflower - Mungbean - Barley - Cotton - Wheat) cropping system is due to two exhaustive
crops were sown before cotton sowing. These results can be correlated with work of Yadav et
al. (1993).
4.6.4. Cotton seed yield (t/ha)
Cotton seed yield is important parameter for cotton crops. Data (Table-4.6) showed that
cropping system showed different response against cotton seed yield of cotton. However, more
cotton seed yield was shown by S3 (Mungbean - Rice - Wheat - Cotton/ Sarson) as compared
to other cropping system. Maximum cotton seed yield in S3 (Mungbean - Rice - Wheat -
Cotton/ Sarson) is due to this cropping system included two restorative crops before cotton
crops sown while minimum cotton seed yield in S6 (Sunflower - Mungbean - Barley - Cotton
- Wheat) cropping system is due to two exhaustive crops were sown before cotton sowing.
These findings are similar with work of Babu et al. (1996).
4.6.5. Seed cotton yield (t/ha)
Results regarding (Table-4.6) showed that cropping system had significant effect on
seed cotton yield of cotton. Maximum seed cotton yield was shown by S3 (Mungbean - Rice -
Wheat - Cotton/ Sarson) and minimum was observed in S6 (Sunflower - Mungbean - Barley -
Cotton - Wheat) cropping system. Maximum seed cotton yield in S3 (Mungbean - Rice - Wheat
- Cotton/ Sarson) is due to this cropping system included two restorative crops before cotton
crops while minimum seed cotton yield in S6 (Sunflower - Mungbean - Barley - Cotton -
Wheat) cropping system is due to two exhaustive crops were sown before cotton sowing. These
findings are similar with work of Babu et al. (1996).

93
4.6.6. Lint yield (t/ha)
It was observed that maximum lint yield was shown by S3 (Mungbean - Rice - Wheat
- Cotton/ Sarson) and minimum was observed in S6 (Sunflower - Mungbean - Barley - Cotton
- Wheat) cropping system (Table-4.6). In S3 (Mungbean - Rice - Wheat - Cotton/ Sarson)
Maximum lint yield is due to this cropping system involved two restorative crops before cotton
crops sown while minimum lint yield in S6 (Sunflower - Mungbean - Barley - Cotton - Wheat)
cropping system is due to two exhaustive crops were sown before cotton sowing.
These findings are similar with work of Babu et al. (1996).
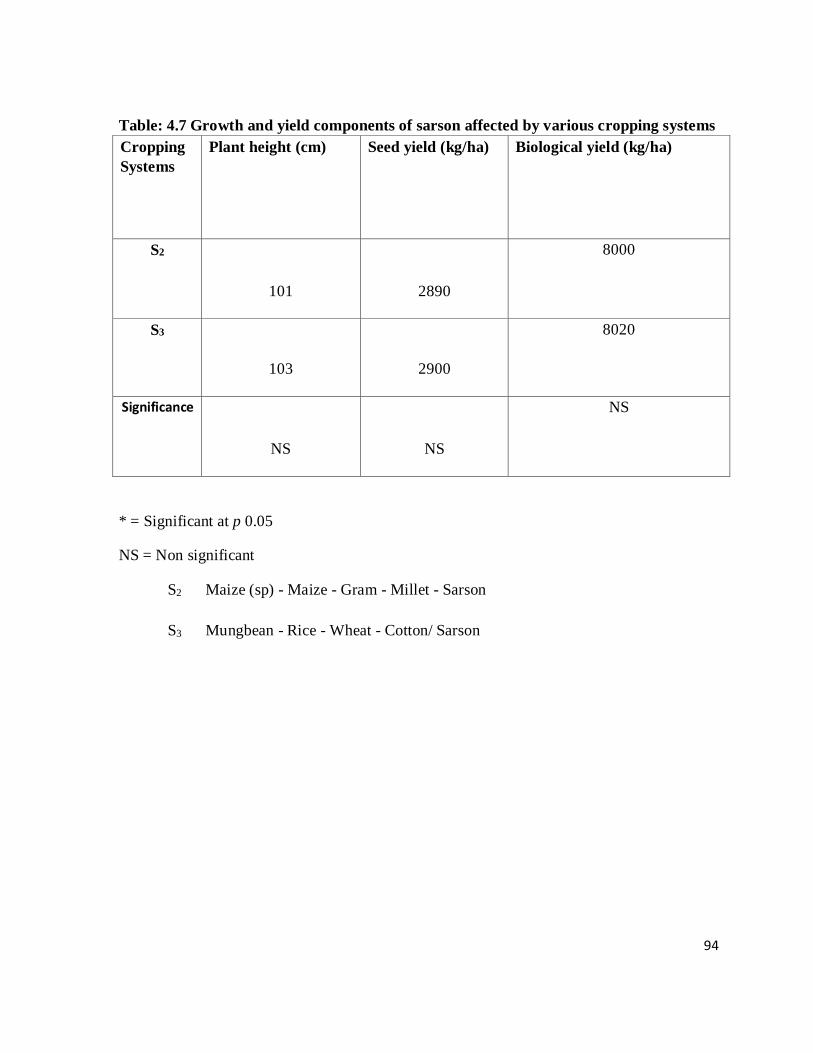
94
Table: 4.7 Growth and yield components of sarson affected by various cropping systems
Cropping
Systems
Plant height (cm) Seed yield (kg/ha) Biological yield (kg/ha)
S2
101 2890
8000
S3
103 2900
8020
Significance
NS NS
NS
* = Significant at p 0.05
NS = Non significant
S2 Maize (sp) - Maize - Gram - Millet - Sarson
S3 Mungbean - Rice - Wheat - Cotton/ Sarson

95
4.7. Growth and yield components of sarson affected by various cropping
systems
Effect of different cropping systems on growth and yield components of cotton is
presented in Table-4.7
4.7.1. Plant height (cm)
Data presented in (Table-4.7) showed that cropping system had non-significant effect
on plant height of sarson but maximum plant height (103 cm) was shown by S3 (Mungbean -
Rice - Wheat - Cotton/ Sarson) and minimum was observed in S2 (Maize (sp) - Maize - Gram
- Millet - Sarson) cropping system. Maximum plant height in S3 (Mungbean - Rice - Wheat -
Cotton/ Sarson) is due to this cropping system included two restorative crops before sarson
crops while minimum plant height in S2 (Maize (sp) - Maize - Gram - Millet - Sarson) cropping
system is due to two exhaustive crops were sown before sarson sowing. Similar results were
observed by Akbar et al. (2000). They reported that inclusion of leguminous crops in cropping
system increased the nitrogen content of soil and ultimately improved the growth and growth
parameters of plant. While inclusion of exhaustive crops reduced the nitrogen and organic
matter content of soil and ultimately decreased the growth and growth components of plants.
4.7.2. Seed yield (kg/ha)
Results regarding (Table-4.7) showed that cropping system had non-significant effect
on seed yield of sarson but maximum seed yield was shown by S3 (Mungbean - Rice - Wheat
- Cotton/ Sarson) and minimum was observed in S2 (Maize (sp) - Maize - Gram - Millet -
Sarson) cropping system. Maximum seed yield in S3 (Mungbean - Rice - Wheat - Cotton/
Sarson) is due to this cropping system included two restorative crops before cotton crops while
minimum seed yield in S2 (Maize (sp) - Maize - Gram - Millet - Sarson) cropping system is
due to two exhaustive crops were sown before sarson sowing. Seth and Balyan (1985) reported
that legume crop grown in summer had a significant effect on yield and yield parameters of
wheat. This increase was attributed to the fact that cowpea being a legume, fix nitrogen, which
was used by succeeding crop. The economic net return obtained with cowpeas (fodder) - wheat,
96
fallow - wheat and maize - wheat systems was Rs 3917, 2441, and 3319 per hectare,
respectively.
4.7.3. Biological yield (kg/ha)
Results regarding (Table-4.7) showed that cropping system had non-significant effect on
biological yield of sarson but maximum seed yield was shown by S3 (Mungbean - Rice - Wheat
- Cotton/ Sarson) and minimum was observed in S2 (Maize (sp) - Maize - Gram - Millet -
Sarson) cropping system. Maximum biological yield in S3 (Mungbean - Rice - Wheat - Cotton/
Sarson) is due to this cropping system included two restorative crops before cotton crops while
minimum biological yield in S2 (Maize (sp) - Maize - Gram - Millet - Sarson) cropping system
is due to two exhaustive crops were sown before sarson sowing. Reynolds et al. (1994)
conducted an experiment by using legume crops for the fixation of nitrogen in those soils where
wheat or barley were to be sown. The leguminous crop was sown between the rows of wheat
or barley. The results showed that there was no decrease in the yields of the main crops where
legumes were grown as compared to control conditions. Grain yields obtained were 1.4 t ha -1
whereas nearly additional two times more biomass was obtained from the legumes. They
reported that during the experiment when different legumes were used to find out the
adaptableness of the cropping system to the changing needs of the farmers, legumes yielded
dry biomass as much as 6.5 t ha-1 when they harvested fodder crop of hairy vetch having yield
of dry beans 1.4 t ha-1 and an additional 3.5 t ha-1 of biomass in case of Vicia faba. In addition
to this more nitrogen was fixed when legume crops were intercropped and levels of leaf
nitrogen were 3.8% which were significantly more than when wheat crop was sown alone.

97
Table: 4.8 Growth and yield components of sunflower affected by various cropping
systems
Cropping
Systems
Plant height
(cm)
1000 grain weight (g) Grain yield (g/plant)
S5 120 48 27
S6
118
47 26
Significance NS NS NS
NS = Non significant
S5 Sunflower - Mungbean - Wheat/ Jantar - Rice - Gram
S6 Sunflower - Mungbean - Barley - Cotton - Wheat

98
4.8. Growth and yield components of sunflower affected by various
cropping systems
Effect of different cropping systems on growth and yield components of sunflower is
presented in Table-4.8
4.8.1. Plant height (cm)
Results regarding (Table-4.8) showed that cropping system had non-significant effect
on plant height of sunflower but maximum plant height shown by S5 (Sunflower - Mungbean
- Wheat/ Jantar - Rice - Gram) and minimum was observed in S6 (Sunflower - Mungbean -
Barley - Cotton - Wheat) cropping system. Similarity between both cropping system is due to
in both cropping system sunflower was grown as a first crop. Similar results were observed by
Akbar et al. (2000). They reported that inclusion of leguminous crops in cropping system
increased the nitrogen content of soil and ultimately improved the growth and growth
parameters of plant. While inclusion of exhaustive crops reduced the nitrogen and organic
matter content of soil and ultimately decreased the growth and growth components of plants.
4.8.2. 1000 grain weight (g)
Results regarding (Table-4.8) showed that cropping system had non-significant effect
on 1000 grain weight of sunflower but maximum 1000 grain weight shown by S5 (Sunflower
- Mungbean - Wheat/ Jantar - Rice - Gram) and minimum was observed in S6 (Sunflower -
Mungbean - Barley - Cotton - Wheat) cropping system. Similarity between both cropping
systems is due to in both cropping system sunflower was grown as a first crop. Seth and Balyan
(1985) reported that legume crop grown in summer had a significant effect on yield and yield
parameters of wheat. This increase was attributed to the fact that cowpea being a legume, fix
nitrogen, which was used by succeeding crop. The economic net return obtained with cowpeas
(fodder) - wheat, fallow - wheat and maize - wheat systems was Rs 3917, 2441, and 3319 per
hectare, respectively.

99
4.8.3. Grain yield (g/plant)
Results regarding (Table-4.8) showed that cropping system had non-significant effect on grain
yield of sunflower but maximum grain yield shown by S5 (Sunflower - Mungbean - Wheat/
Jantar - Rice - Gram) and minimum was observed in S6 (Sunflower - Mungbean - Barley -
Cotton - Wheat) cropping system. Similarity between both cropping systems is due to in both
cropping system sunflower was grown as a first crop. Reynolds et al. (1994) conducted an
experiment by using legume crops for the fixation of nitrogen in those soils where wheat or
barley were to be sown. The leguminous crop was sown between the rows of wheat or barley.
The results showed that there was no decrease in the yields of the main crops where legumes
were grown as compared to control conditions. Grain yields obtained were 1.4 t ha -1 whereas
nearly additional two times more biomass was obtained from the legumes. They reported that
during the experiment when different legumes were used to find out the adaptableness of the
cropping system to the changing needs of the farmers, legumes yielded dry biomass as much
as 6.5 t ha-1 when they harvested fodder crop of hairy vetch having yield of dry beans 1.4 t ha -
1 and an additional 3.5 t ha-1 of biomass in case of Vicia faba. In addition to this more nitrogen
was fixed when legume crops were inter-cropped and levels of leaf nitrogen were 3.8% which
were significantly more than when wheat crop was sown alone.

Table:
100
4.9 Soil nitrogen status as affected by different cropping systems
System
Code
Cropping System Nitrogen content (mg/kg)
Before
planting
After Planting
S1 Maize (sp) - Maize - Wheat - Rice – Wheat 620 625-628-633-650-635
S2 Maize (sp) - Maize - Gram - Millet – Sarson 620 630-632-655-635-633
S3 Mungbean - Rice - Wheat - Cotton/ Sarson 620 656-663-640-643-642
S4 Mungbean - Rice – Berseem (GM) - Maize -
Sesame – Wheat
620 652-666-670-638-648-
634
S5 Sunflower - Mungbean - Wheat/ Jantar - Rice
– Gram
620 625-654-636-666-656-
670
S6 Sunflower - Mungbean - Barley - Cotton –
Wheat
620 623-656-640-638-637
4.9. Soil nitrogen status as affected by different cropping systems
Data regarding (Table-4.9) showed all cropping systems S1 (Maize (sp) -
Wheat - Rice – Wheat), S2 (Maize (sp) - Maize - Gram - Millet – Sarson), S3 (Mungbean
Rice - Wheat - Cotton/ Sarson), S4 ( Mungbean - Rice – Berseem (GM) - Maize - Sesame –

Maize -
-
101
Wheat), S5 (Sunflower - Mungbean - Wheat/ Jantar - Rice – Gram) and S6 (Sunflower
Mungbean - Barley - Cotton – Wheat) showed variation in soil nitrogen content after
harvesting the each crops. It is clear from the data nitrogen content was increased after
harvesting the leguminous, green manuring and other restorative crops while nitrogen content
reduced after exhaustive crops like maize, sunflower, sarson and wheat. It was observed that
over all more nitrogen content was observed in S4 (Mungbean - Rice – Berseem (GM) - Maize
- Sesame – Wheat) cropping system while minimum was observed in S1 (Maize (sp) -
Maize - Wheat - Rice – Wheat) cropping system. More nitrogen in S4 (Mungbean - Rice –
Berseem (GM) - Maize - Sesame – Wheat) cropping system is due to this cropping system
included the mostly restorative crops that enhance the fertility status of soil and stimulate the
plant growth promoting bacteria, nitrogen fixing bacteria and nutrient solubilizing bacteria in
soil that ultimately improved the nutrient content in soil. Kanwarkamla (2000) found that
farming of legume crops was observed more as a soil fertility enhancer than as individual crops
grown for their grain yield. This is due to the reason that legume crops are self-reliant in N
supply. Singh et al. (1997) testified that multiple cropping systems with legume crops offer
special benefit to farmer. Parallel results have also been conveyed by Saroch et al. (2005). At
the start of experiment the nitrogen level in all the plots was about the same because before
planting the crops homogenous cropping system was being used.
4.10 Soil phosphorous status as affected by different cropping systems
System
Code
Cropping System P content (mg/kg)
Before
planting
After Planting

Table:
102
S1 Maize (sp) - Maize - Wheat - Rice - Wheat 7.4 7.45-7.43-7.45-
7.70-7.5
S2 Maize (sp) - Maize - Gram - Millet - Sarson 7.4 7.44-7.46-7.50-
7.51-7.48
S3 Mungbean - Rice - Wheat - Cotton/ Sarson 7.4 7.5-7.78-7.48-7.44-
745
S4 Mungbean - Rice – Berseem (GM) - Maize -
Sesame - Wheat
7.4 7.47-7.78-7.59-7.5-
7.46-7.50
S5 Sunflower - Mungbean - Wheat/ Jantar - Rice -
Gram
7.4 7.43-7.47-7.54-7.7-
7.52
S6 Sunflower - Mungbean - Barley - Cotton -
Wheat
7.4 7.45-7.50-7.48-
7.50-7.48

Maize -
-
-
-
103
4.10. Soil phosphorous status as affected by different cropping systems
Data regarding (Table-4.10) showed all cropping systems S1 (Maize (sp) - Wheat -
Rice - Wheat), S2 (Maize (sp) - Maize - Gram - Millet – Sarson), S3 (Mungbean Rice - Wheat
- Cotton/ Sarson), S4 (Mungbean - Rice - Berseem (GM) - Maize - Sesame
Wheat), S5 (Sunflower - Mungbean - Wheat/ Jantar - Rice - Gram) and S6 (Sunflower
Mungbean - Barley - Cotton - Wheat) showed variation in soil P content after the harvesting
of each crops. It is clear from the data P content was increased after harvesting rice crops then
leguminous, green manuring and other restorative crops while P content reduced after
exhaustive crops like maize, sunflower, sarson and wheat. It was observed that over all more
P content was observed in S4 (Mungbean - Rice - Berseem (GM) - Maize - Sesame - Wheat)
cropping system while minimum was observed in S1 (Maize (sp) - Maize - Wheat - Rice -
Wheat) cropping system. More P in S4 ( Mungbean - Rice - Berseem (GM) - Maize - Sesame
- Wheat) cropping system is due to this cropping system included the mostly restorative crops
that enhance the fertility status of soil and stimulate the plant growth promoting bacteria,
Phosphorous solubilizing bacteria and nutrient solubilizing bacteria in soil that ultimately
improved the nutrient content in soil. Similar results have also been reported by Saroch et al.
(2005). At the start of the experiment the phosphorus level in all the plots was about the same
because before planting the crops homogenous cropping system was being used.
4.11 Soil potassium status as affected by different cropping systems

Table:
104
System
Code
Cropping System Potassium content (mg/kg)
Before
planting
After Planting
S1 Maize (sp) - Maize - Wheat - Rice - Wheat 132 135-134-136-137-
137
S2 Maize (sp) - Maize - Gram - Millet - Sarson 132 134-134-135-137-
136-135
S3 Mungbean - Rice - Wheat - Cotton/ Sarson 132 137-136-135-134-
125
S4 Mungbean - Rice – Berseem (GM) - Maize -
Sesame – Wheat
132 136-137-140-136-
137-135
S5 Sunflower - Mungbean - Wheat/ Jantar - Rice
– Gram
132 133-137-136-141-
143
S6 Sunflower - Mungbean - Barley - Cotton -
Wheat
132 134-135-134-136-
135
4.11. Soil potassium status as affected by different cropping systems
Data regarding (Table-4.11) showed all cropping systems S1 (Maize (sp) - Wheat -
Rice – Wheat), S2 (Maize (sp) - Maize - Gram - Millet - Sarson), S3 (Mungbean
Rice - Wheat - Cotton/ Sarson), S4 ( Mungbean - Rice - Berseem (GM) - Maize - Sesame
Wheat), S5 (Sunflower - Mungbean - Wheat/ Jantar - Rice - Gram) and S6 (Sunflower
Mungbean - Barley - Cotton - Wheat) showed variation in soil K content after harvesting the
each crops. It is clear from the data K content was increased after harvesting leguminous, green

Maize -
-
-
-
105
manuring and other restorative crops while K content reduced after exhaustive crops like
maize, sunflower, sarson and wheat. It was observed that over all more K content was observed
in S4 (Mungbean - Rice - Berseem (GM) - Maize - Sesame - Wheat) cropping system while
minimum was observed in S1 (Maize (sp) - Maize - Wheat - Rice - Wheat) cropping system.
More K in S4 (Mungbean - Rice - Berseem (GM) - Maize - Sesame - Wheat) cropping system
is due to this cropping system included the mostly restorative crops that enhance the fertility
status of soil and stimulate the plant growth promoting bacteria, Potassium solubilizing
bacteria and nutrient solubilizing bacteria in soil that ultimately improved the nutrient content
in soil. Similar results have also been reported by Saroch et al. (2005). At the start of
experiment the potassium level in all the plots was about the same because before planting the
crops homogenous cropping system was being used.

Table:
106
4.12 Soil organic matter status as affected by different cropping
systems
System
Code
Cropping System O.M content (mg/kg)
Before
planting
After Planting
S1 Maize (sp) - Maize - Wheat - Rice - Wheat 0.74 0.747-0.743-0.75-
0.76-0.746
S2 Maize (sp) - Maize - Gram - Millet - Sarson 0.74 0.748-0.744-0.77-
0.75-0.748
S3 Mungbean - Rice - Wheat - Cotton/ Sarson 0.74 0.77-0.76-0.749-
0.75-0.746
S4 Mungbean - Rice – Berseem (GM) - Maize -
Sesame - Wheat
0.74 0.79-0.78-0.787-
0.75-0.749
S5 Sunflower - Mungbean - Wheat/ Jantar - Rice
– Gram
0.74 0.74-0.78-0.757-
0.75-0.77
S6 Sunflower - Mungbean - Barley - Cotton –
Wheat
0.74 0.743-0.78-0.755-
0.75-0.76
4.12. Soil organic matter status as affected by different cropping systems
Data regarding (Table-4.12) showed all cropping systems S1 (Maize (sp) - Maize Wheat
- Rice - Wheat), S2 (Maize (sp) - Maize - Gram - Millet - Sarson), S3 (Mungbean
Rice - Wheat - Cotton/ Sarson), S4 ( Mungbean - Rice - Berseem (GM) - Maize - Sesame
Wheat), S5 (Sunflower - Mungbean - Wheat/ Jantar - Rice - Gram) and S6 (Sunflower
Mungbean - Barley - Cotton - Wheat) showed variation in soil O.M content after harvesting
the each crops. It is clear from the data 0.M content was increased after harvesting leguminous,
green manuring and other restorative crops while O.M content reduced after exhaustive crops
like maize, sunflower, sarson and wheat. It was observed that over all more
O.M content was observed in S4 (Mungbean - Rice - Berseem (GM) - Maize - Sesame -

-
-
-
-
107
Wheat) cropping system while minimum was observed in S1 (Maize (sp) - Maize - Wheat -
Rice - Wheat) cropping system. More O.M in S4 (Mungbean - Rice - Berseem (GM) - Maize
- Sesame - Wheat) cropping system is due to this cropping system included the mostly
restorative crops that enhance the fertility status of soil and stimulate the plant growth
promoting bacteria, Potassium solubilizing bacteria and nutrient solubilizing bacteria in soil
that ultimately improved the nutrient content in soil. At the start of experiment, the organic
matter level in all the plots was about the same because before planting the crops homogenous
cropping system was being used.
4.13 Soil C/N ratio as affected by different cropping systems
System
Code
Cropping System C/N ratio
Before
planting
After Planting
S1 Maize (sp) - Maize - Wheat - Rice - Wheat 11 10.8-10.9-10.710.9-
11
S2 Maize (sp) - Maize - Gram - Millet - Sarson 11 10.7-11-10.7-10.9-
11.2
S3 Mungbean - Rice - Wheat - Cotton/ Sarson 11 10.6-11.1-10.9-
10.8-11.1

Table:
108
S4 Mungbean - Rice – Berseem (GM) - Maize -
Sesame – Wheat
11 10.7-11-10.4-10.9-
11
S5 Sunflower - Mungbean - Wheat/ Jantar - Rice
– Gram
11 10.6-10-10.9-10.9-
10
S6 Sunflower - Mungbean - Barley - Cotton –
Wheat
11 10.8-10.3-10.710.9-
11
4.13. Soil C/N ratio as affected by different cropping systems
Data regarding (Table-4.13) showed all cropping systems S1 (Maize (sp) - Maize Wheat
- Rice - Wheat), S2 (Maize (sp) - Maize - Gram - Millet - Sarson), S3 (Mungbean
Rice - Wheat - Cotton/ Sarson), S4 (Mungbean - Rice - Berseem (GM) - Maize - Sesame
Wheat), S5 (Sunflower - Mungbean - Wheat/ Jantar - Rice - Gram) and S6 (Sunflower
Mungbean - Barley - Cotton - Wheat) showed variation in soil C/N ratio after harvesting the
each crops. It is clear from the data C/N ratio was decreased after harvesting leguminous, green
manuring and other restorative crops while C/N ratio rise after exhaustive crops like maize,
sunflower, sarson and wheat. It was observed that over all less C/N ratio was observed in S4
(Mungbean - Rice - Berseem (GM) - Maize - Sesame - Wheat) cropping system while
maximum was observed in S1 (Maize (sp) - Maize - Wheat - Rice - Wheat) cropping system.
At the start of experiment, the C/N in all the plots was about the same because before planting
the crops homogenous cropping system was being used.

-
-
-
-
109
4.14 Soil pH as affected by different cropping systems
System
Code
Cropping System Nitrogen content
(mg/kg)
Before
planting
After Planting
S1 Maize (sp) - Maize - Wheat - Rice – Wheat 7.6 7.6-7.62-7.61-7.53-
7.6
S2 Maize (sp) - Maize - Gram - Millet – Sarson 7.6 7.6-7.63-7.61-7.58-
7.6
S3 Mungbean - Rice - Wheat - Cotton/ Sarson 7.6 7.6-7.55-7.60-7.57-
7.62
S4 Mungbean - Rice – Berseem (GM) - Maize -
Sesame – Wheat
7.6 7.63-7.55-7.61-
7.57-7.64
S5 Sunflower - Mungbean - Wheat/ Jantar - Rice
– Gram
7.6 7.62-7.59-7.60-
7.56-7.62
S6 Sunflower - Mungbean - Barley - Cotton –
Wheat
7.6 7.6-7.61-7.60-7.59-
7.6

Table:
110
-
111
4.14. Soil pH as affected by different cropping systems
Data regarding (Table-4.14) showed all cropping systems S1 (Maize (sp) - Maize
Wheat - Rice - Wheat), S2 (Maize (sp) - Maize - Gram - Millet - Sarson), S3 (Mungbean -
Rice - Wheat - Cotton/ Sarson), S4 (Mungbean - Rice - Berseem (GM) - Maize - Sesame -
Wheat), S5 (Sunflower - Mungbean - Wheat/ Jantar - Rice - Gram) and S6 (Sunflower -
Mungbean - Barley - Cotton - Wheat) showed very low variation in soil pH after harvesting
the crops. But it is clear from the data that significant reduction in soil pH was observed after
rice crop harvesting. Reduction in soil pH after harvesting the rice is due to as rice crop require
flooding due to flooding soil pH is reduced. At the start of experiment, the pH level in all the
plots was about the same because before planting the crops homogenous cropping system was
being used.
Economic analysis

112
Table: 4.15 Net profit of different cropping systems
System
Code
Cropping System Total cost
(Rs)
Total income
(Rs)
Net profit (Rs)
S1 Maize (sp) - Maize - Wheat -
Rice - Wheat
321000 834000 513000
S2 Maize (sp) - Maize - Gram -
Millet – Sarson
316000 683250 367250
S3 Mungbean - Rice - Wheat -
Cotton/ Sarson
312000 742000 430000
S4 Mungbean - Rice – Berseem
(GM) - Maize - Sesame –
Wheat
314000 719000 405000
S5 Sunflower - Mungbean -
Wheat/ Jantar - Rice – Gram
296000 724190 428190
S6 Sunflower - Mungbean -
Barley - Cotton – Wheat
302000 739752 437752

113
Economic analysis
4.15. Net profit of different cropping systems
4.15.1. Total cost
The cost involved in raising a crop from sowing till harvesting and that directly
generates revenue is known as cost of production. Cost of production of purposed crops was
calculated. The cost of production of each crop was calculated separately on current rate basis.
Then total cost of production of all cropping systems was calculated by summing up the cost
of all the crops in the cropping systems and presented in table-4.15. More cost of production
was observed in S1 and low cost of production was observed in S5 as shown in table-15.
4.15.2. Total income
It was observed that more total income was shown by S1 and lowest total income was
observed in S2.
4.15.3. Net profit
It was observed that more net profit was shown by S1 and lowest net profit was observed
in S2. More net profit in S1 is due to more cash crops in this cropping system. Dogan et al.
(2008) under rain-fed conditions of Southern Marmara Region, Turkey, developed a study to
notice the most appropriate crop rotation system(s). In this research study (1995-2001), two
dissimilar crop rotation systems were used: sunflower and winter wheat as main crops
experiments. Results were assessed in terms of crop production ability, economic aspects and
soil fertility. The sunflower-rapeseed-wheat, rapeseed-common vetch + sunflower-wheat and
rapeseed-fodder pea + sunflower-wheat were recorded, the most appropriate rotation systems
because of their various returns in the first experiment in which wheat was used as major crop.
The maximum sunflower seed harvests were gained from a fodder pea + sunflower-wheat-
fodder pea + sunflower crop rotation system both in the first and second three year periods in
which sunflower was used as core crop under rain-fed conditions. A procedure was established
to study the productivity of site specific crop management (SSCM) of fertilizers N, K and P
for cropping system subjugated by cereals in Haute-Normandie. They imitated the fertilization

114
for inconstant surface areas (95 ha, 145 ha, 240 ha) and for dissimilar heterogeneity levels of
N, K and P. The direct boundaries calculated for a uniform application and with precision
agriculture (PA) showed that, in our pedo-climatic conditions, SSCM was more gainful when
the surface area was greater and the heterogeneity was more (Bourgain et al., 2009).

115
Table: 4.16 Productivity system of different cropping systems
System
Code
Cropping System Total cost
(Rs)
Total income
(Rs)
Productivity system
(Rs)
S1 Maize (sp) - Maize - Wheat -
Rice - Wheat
321000 834000 2.6
S2 Maize (sp) - Maize - Gram -
Millet – Sarson
316000 683250 2.2
S3 Mungbean - Rice - Wheat -
Cotton/ Sarson
312000 742000 2.4
S4 Mungbean - Rice - Berseem
(GM) - Maize - Sesame –
Wheat
314000 719000 2.3
S5 Sunflower - Mungbean -
Wheat/ Jantar - Rice - Gram
296000 724190 2.4
S6 Sunflower - Mungbean -
Barley - Cotton - Wheat
302000 739752 2.4

116
4.16. System productivity (SP) of different cropping systems
It was observed that more SP was shown by S1 and lowest SP was observed in S2. More SP
in S1 is due to more cash crops in this cropping system. The field research was performed by the
Prasad et al. (2011) at Research and Instructional Farm of Indira Gandhi Krishi Vishwavidyalaya,
Raipur (C.G.) during Kharif, Rabi, and summer season of 2006-07 under AICRP- cropping system
research project. The treatments were comprised of seven cropping sequences viz., rice-
mustardgreen manure, rice-wheat-fallow, rice-pea-maize, rice-coriander (green leaf)-mung, rice-
oniongreen manure, rice-brinjal green manureand rice-potato-cowpea. Among dissimilar cropping
systems evaluated rice-potato-cowpea system was identified to be most productive with rice
equivalent yield of (270.39 q ha -1 year-1), production efficiency (83.97 kg ha-1 day-1), profitability
(Rs.320.36 ha-1 day-1), relative economic efficiency (199.29%) and net return of higher Rs.116929
ha-1 year-1. Cropping sequences based on vegetable also showed high production efficiency, grass
and net returns than a traditional system.

117
Table: 4.17 Energy equivalent of different crops used in different cropping systems
Particulars Unit Energy equivalent (MJ unit_1)
A. Inputs
Human labor H 1.92
Machinery H 62.70
Diesel fuel L 56.31
Chemical fertilizers
Nitrogen (N) Kg 66.14
Phosphate (P2O5) Kg 12.44
Potassium (K2O) Kg 11.15
Chemical
Herbicide L 238
Pesticide L 199
Fungicide L 92
Water for irrigation M3 1.02
Seeds (Wheat) Kg 20.1
Seeds (Barley) Kg 14.7
Seeds (maize) Kg 50.0
Seeds (rice) Kg 14.57
Seeds (cotton) Kg 11.8
Seeds (mungbean) Kg 13.5
Seeds (Sunflower ) Kg 3.6
Seeds (gram) Kg 14.7
Seeds (sesame) Kg 15.2
Millet Kg 50.0
Sarson Kg 15.2
B. Outputs
Grains yield (Wheat) Kg 14.48
Grains yield (Barley) Kg 14.70
Grains yield (maize) Kg 14.70
Grains yield (rice) Kg 14.70
Grains yield (cotton) Kg 11.8
Grains yield
(mungbean)
Kg 14.7
Grains yield
(Sunflower )
Kg 25.0
Grains yield (gram) Kg 14.7

118
Grains yield (sesame) Kg 25.0
Grains yield (millet) Kg 14.7
Grains yield (sarson) Kg 25.0
Energy equivalent of output (grain yield) of different cropping systems
System
Code
Cropping System Energy equivalent (MJ unit_1)
S1 Maize (sp) - Maize - Wheat - Rice – Wheat 73.06
S2 Maize (sp) - Maize - Gram - Millet – Sarson 83.8
S3 Mungbean - Rice - Wheat - Cotton/ Sarson 55.68
S4 Mungbean - Rice – Berseem (GM) - Maize -
Sesame – Wheat
83.58
S5 Sunflower - Mungbean - Wheat/ Jantar - Rice –
Gram
83.58
S6 Sunflower - Mungbean - Barley - Cotton –
Wheat
80.68

119
4.17. Energy equivalent
Different cropping systems had variable response for energy equivalent. Data showed
that S2 (Maize (sp) - Maize - Gram - Millet - Sarson) cropping system had more energy
equivalent as compared to other cropping system while S3 (Mungbean - Rice - Wheat - Cotton/
Sarson) revealed low energy equivalent as compared to other cropping systems.

120
CHAPTER 5 SUMMARY
Diversified cropping systems are also a major economic activity to those in rural areas,
providing staple food for millions of people and affecting the livelihoods and health of both
urban and rural poor. Cropping system is a producer’s map of their approach to production.
Intensive cropping systems in irrigated areas of Punjab are rice-wheat, cottonwheat and mixed-
wheat cropping systems. The mixed cropping system seems deficient in giving its economic
potential during Kharif season. A research work was planned to develop a cropping system
under agro-climatic conditions of Faisalabad where mixed cropping system was being
followed. The experiment was designed to study the relationship of six different pre-assigned
cropping systems. The details of the pre-assigned cropping systems are given below.
S1 Maize (sp) - Maize - Wheat - Rice - Wheat
S2 Maize (sp) - Maize - Gram - Millet - Sarson
S3 Mungbean - Rice - Wheat - Cotton/ Sarson
S4 Mungbean - Rice – Berseem (GM) - Maize - Sesame - Wheat
S5 Sunflower - Mungbean - Wheat/ Jantar - Rice - Gram
S6 Sunflower - Mungbean - Barley - Cotton – Wheat
All the cropping systems were arranged in a randomized complete block design (RCBD) with
three replications. There were 18 plots in the experiment, each having size of 15 × 10 m. The
experiment was initiated during February 2013 with the sowing of different pre-assigned crops
in the respective (randomized) plots. After the harvest of first phase crops, the subsequent crops
included in different systems were planted in their respective plots. Soil analysis was conducted
before and after the harvest of each crop. All the agronomic parameters were observed during
this study and analyzed by statistics computer program.
The differences among significant means will be assessed by Least Significant Difference test at
5% probability level. The summary of results is given below;
121
Growth and yield of major crops like cotton, maize, wheat, millet, sunflower and rice is
increased approximately 40% when grown after legume and restorative crops.
Growth and yield of major crops like cotton, maize, wheat, millet, sunflower and rice is
decreased about 34% when grown after non- legume and exhaustive crops.
Nutrients contents in soil after harvesting increased 70% after growing the legume and
restorative crops.
More net profit of Rs. 513000 was shown by S1 cropping system while minimum of Rs.
367250 was obtained in cropping system S2.
The productivity system analysis showed highest value of Rs. 2.6 for the S1 cropping
system and minimum value of Rs. 2.1 was observed in S2.
Energy equivalent of different cropping systems showed that maximum value of 83.8 was
observed in S2 while minimum value of 55.68 was observed in S3.
Negligible differences in nitrogen contents of the soil were observed. Maximum increase
was found in cropping systems in which legume crops were involved. Cropping system
S5 was the best N restoring cropping system which showed a maximum increase of 8.2
percent from initial N level of 620 mg/Kg.
Similarly, the differences in phosphorous contents in the soil were also negligible. The
cropping system S5 showed a mixmum increase of 2 percent from an intial level of 7.4
mg/kg. In case of potassium (K), the increase was not significant. Here again cropping
system S5 showed some increase in soil potassium at the end in restoring fertility status
of soil.

122
CONCLUSION
In the view of present studies, this can be suggested that maize (sp)- maize- wheat- rice-
wheat is the best combination of crops in mixed cropping zone. This cropping system gave
maximum net returns and productivity as compared to all other cropping systems.
Janter, berseem and mung bean based cropping systems improved the fertility status of the soil
so it is recommended that these crops should be included in our cropping systems especially
under Faisalabad conditions.

123
LITERATURE CITED
Ahmad, R. 1994. Need for improving irrigation practices. DRIP Monthly Newsletter. Drainage and
Reclamation Institute of Pakistan, Tandojam. 15(2).
Ahmad, W., F. Khan and M. Naeem. 2010. Impact of cropping patterns and fertilizer treatments
on the organic fertility of slightly eroded Pirsabak soil series in NWFP, Pakistan, Soil
& Environ. 29(1): 53 – 60.
Ajeigbe, H. A., A. Y. Kamara and D. Chikoye. 2009. Potential of triple and double cropping
with and without irrigation in the Sudan and Northern Guinea Savanna zones of West
Africa. African Crop Sci. Conf. Proc., 9: 197- 200.
Akbar, M.A., M.S. Islam and M.S.U. Bhuiya. 2000. Integration of fodder legumes into
ricebased cropping systems in Bangladesh. Proc. 9th Cong. Asia-Australasian Assoc.
Animal Prod. Soc. and 23rd Biennial Conf. Australian Soc. Animal Prod. 3-7 July,
2000, Sydney, Australian J. Animal Sci. 13: 526-528.
Altieri, M.A. 2002. Agroecology: the science of natural resource management for poor farmers in
marginal environments, Agr. Ecosyst. Environ. 93, 1-24.
Anonymous. 1990. To increase cropping in Fatehjang area with the introduction of mungbean in
wheat-fallow-wheat system. Annual Report, Food Legumes improvement Programme,
1989-1990, NARC, Islamabad. 148-185.
Babu, R., M. V. H. Raoand, S. Muralikrishna.1996. Cotton based multiple cropping systems for
sustained yield. Indian J. Agric. Sci., 66 (10): 577-580.
Badaruddin, M., and D.W. Meyer. 1994. Grain legume effects on soil-nitrogen, grain yield, and
nitrogen nutrition of wheat. Crop Sci. 34(5): 1304-1309.
Balyan, J.S. and J. Seth. 1989. Effect of cropping systems on maize production and their residual
effect on succeeding wheat. Ind. J. Agron. 34(1): 57-60.
124
Barik, A.K., D.P. Tiwari and R.S. Tripathi. 1997. Effect of intercropping winter season forage crops
on their yield and nodulation. Ind. J. Agric. Sci. 67(6): 253-255.
Becker, M., D.E. Johnson and Z.J. Segda. 2004. The role of legume fallows in intensified
upland rice-based systems of West Africa. The Inter. Develop. Res. Centre, Canada.
http://www.idrc.ca/fr/ev-31917-201-1-DO_TOPIC.html, 15-36.
Belachew, T. and Y. Abera. 2011. Effect of green manuring in combination with nitrogen on
soil fertility and yield of bread wheat (Triticum aestivum) under double cropping
system of Sinana-dinsho, Southeast Ethiopia. J. of Biodiver. and Environ. Sci. (JBES)
1(1): 1-11.
Billore, S.B., K Singh and M. Bargale. 1994. Fertilizer management in cropping system under
rainfed conditions. J. Maharashtra Agric, Univ. 19(2): 297-299.
Biswas, B., D.C. Ghosh, M.K. Dasgupta, N. Trivedi, J. Timsina and A. Dobermann. 2006.
Integrated assessment of cropping systems in the Eastern Indo-Gangetic Plain. Field
Crop Research. 99:35-47.
Bourgain, O. and J. M. L. Lorens. 2009. Methodology to estimate economic levels of
profitability of precision agriculture: simulation for crop systems in HauteNormandie
EFITA Conf. Proc. 9:91-91
Bryant, K.J., S.M. Masud, R D. Lacewell, and J.W. Keeling. 1992. Profit, cost and soil erosion
implication of dry land crop production systems - Texas High-Plains. J. Prod. Agric.
5(3): 307-312.
Copeland, P.J., and R.K. Crookston. 1992. Crop sequence of ects. nutrient composition of corn and
soybean grown under high fertility. Agron. J. 84:503–509.
Chandra, S and RC, Gautam. 1997. Effect of preceding crops and nitrogen rates on rice yields and
economics of its rotation. Annals Agric. Res. 18(4): 454-459.

125
Chaudhary, M.Y. 1986. Problems and prospects of rice cultivation in Pakistan. Progressive Farming,
PARC, Islamabad 6(1): 6-11.
Diebel, P.L., J.R. Williams, and R.V. Llewelyn. 1995. “An economic comparison of
conventional and alternative cropping systems for a representative northeast Kansas
farm. Review of Agricultural Economics 17(3): 120–127.
Dogan, R., T. A. Goksoy, K. Yagdi, and M. Z. Turan. 2008. Comparison of the effects of
different crop rotation systems on winter wheat and sunflower under rain-fed
conditions. Afric. J. Biotec. 7 (22):4076-4082.
Dogliotti, S., W. A. H. Rossing and M. K. V. Ittersum. 2004. Systematic design and evaluation
of crop rotations enhancing soil conservation, soil fertility and farm income: a case
study for vegetable farms in South Uruguay. J. Agri. Sys. 80: 277– 302.
Doran, J.W. 2002. Soil health and global sustainability: translating science into practice. Agric.
Ecosystems and Environ. 88: 119-127.
Erskine, P.D., D. Lamb and M. Bristow. 2006. Tree species diversity and ecosystem fonction:
can tropical multi-species plantations generate greater productivity? Forest Ecol.
Manag. 233, 205–210.
Ewel J.J. (1999) Natural systems as models for the design of sustainable systems of land use,
Agroforest. Syst. 45, 1–21.
Garcia-Barrios, L. (2003). Plant-plant interactions in tropical agriculture, in: Vandermeer J. (Ed.),
Tropical Agroecosystems, CRC Press, pp. 11–58.
George, T., J.K. Ladha., D.P. Garrity., and R.J. Buresh. 1994. Legumes as nitrate catch crops during
the dry-to-wet transition in lowland rice cropping systems. Agron. J. 86(2):
267-273.
Gliesmann S.R. (2001) Agroecosystem sustainability: developing practical strategies, CRC Press,
Boca Raton, Florida, USA.

126
Govaerts, B., K.D. Sayre and J. Deckers. 2006. A minimum data set for soil quality assessment
of wheat and maize cropping in the highlands of Mexico. Soil and Tillage Res. 87:163-
174.
Gurr, G.M., S.D. Wratten and J.M. Luna. 2003. Multi-function agricultural biodiversity: pest
management and other benefits, Basic Appl. Ecol. 4, 107–116.
Hanson, R.G., J.A. Sleeker and S.R. Meledy. 1988. Effect of soybean rotation on the response of
sorghum to fertilizer nitrogen. J. Prod. Agric. 318-321.
Hannukkala, A.O., J. Korva and E. Tapio. 1990. Conventional and organic cropping systems
at Suitia.1. Experimental design and summaries. J. Agric. Sci. in Finland. 62(4): 295-
307.
Hossain, S. A., W. M. Strong, S. A. Waring, R C. Dalal and E. J. Weston. 1996. Comparison
of legume-based cropping systems at Warn, Queensland. 2. Mineral nitrogen
accumulation and availability to the subsequent wheat crop. Australian J. Soil Res.
34(2): 289-297.
Jabbar, A., R. Ahmad, I. H. Bhatti1, A. Rehman, Z. A. Virk and S. N. Vains. 2010. Effect of
different rice-based intercropping systems on rice grain yield and residual soil
fertility. Pak. J. Bot. 42(4): 2339-2348.
Jackson, W. 2004. Natural systems agriculture: a truly radical alternative, Agr. Ecosyst. Environ. 88,
111–117.
Jakkro, A. A. and G. Faroque. 1986. Number of tillers, nitrogen concentration and grain yield of
Summer rice crops as influenced by dubari crops and nitrogen level. IRRN. 7(6):
22-23.
Johnson, P. J., J. Blackshear, and E. Segarra. 2006. “Economics of Irrigated Cotton-Grain
Sorghum Rotations in the Southern High Plains of Texas.” Southwestern Economic
Review, 33: 161-172.

127
Kelty, M.J. 2006. The role of species mixtures in plantation forestry, Forest Ecol. Manag. 233, 195-
204.
Khan, M. B. and A. Khaliq. 2005. Production of winter cereals as relay crops by surface seeding in
cotton based cropping system. J. of Res. Sci. 16(2): 79-86.
Klimekova, M. and Z. Lehocka. 2009. Analyze of different cropping systems and year conditions
on grain yields and thousand-kernel weight of pea (Pisum sativum L.). J.
Agric. 18:33-39.
Koppad, M. B., H. S. S. Khan and H. G. Shatlkarrnurthy. 1994. Economic analysis of
maizewheat farming system (irrigated) in Malaprabha Command Area
(Karnataka)locationwise study, Farming Systems l0(1-2): 16-19.
Kurlekar, V.G., V.C. Kele, S.R. Nagorgoge, RM. Vislmupurikar, P.S. Joshi, and B.B. Lat, R.
1990. Tillage and crop production in the Tropics. Soil physics application under stress
environments. Barani Agric, Res. and Development Project (BARD), PARC,
Islamabad
Lal, R.1990. Soil erosion in the tropics: principles and management. McGraw-Hill, newyork.
Li, J. G., X. G. Qing and Y. P. Li. 1995. A study of gradient differences in rice fields and the
economic effect of some cropping system models. Acta Agric. Shanghai. 11(4):55-
67.
Mackenzie, R. H., J. W. B. Stewart, J. F. Domlaar, and G. B. Schaalje. 1992. Long-term crop-
rotation and fertilizer effects on phosphorus transformations in a chernozemic soil.
Canadian J. Soil Sci. 72(4): 569-579.
Majid, A. M., S. Iqbal, and H. U. Rehman. 1983. Release of a new early maturing and medium
grain rice variety, KS-282 and its impact on cropping systems. Paper presented at
National seminar on rice research and production, Islamabad.
128
Malavia, D. D., M. P. Sinha, M. N. Vyas, J. C. Patel and K. K. Kalaria. 1986. Production
potential and economic feasibility of different crop sequences. Indian J. Agron. 31(1):
75-78.
Malézieux, E., & Moustier, P. (2005). La diversification dans les agricultures du Sud: à la
croisée de logiques d’environnement et de marché. II. Niveaux d’organisation,
méthodes d’analyse et outils de recherche, Cah. Agr. 14:375–382.
Mkamilo, G. S. 2004. Maize-sesame intercropping in Southeast Tanzania: Farmers' Practices
and Perceptions, and Intercrop Performance. PhD Thesis, Wageningen University,
Netherlands.
Murtaza, G., A. Ghafoor, G. Owens, M. Qadir & U. Z. Kahlon. 2009. Environmental and
Economic Benefits of Saline-Sodic Soil Reclamation Using Low-quality Water and
Soil Amendments in Conjunction with a Rice–Wheat Cropping System, J. Agron. &
Crop Sci. 124:136.
Narayanpur, MN. and G.S. Sulikeri. 1996. Economics of companion cropping system in turmeric
(Curcuma longa L,). Indian Cocoa, Arecanut and Spices J. 20(3) 77-79.
Negi, S.C., K.K. Singh and R C. Thakur. 1988. Response of maize-wheat cropping sequence to
phosphorus and farm yard manure. Indian J. Agron. 33(3): 270-273.
Nel, A. A. and H. L. Loubser. 2004. The impact of crop rotation on profitability and production risk
in the eastern and north western free state. J. Agrekon. 43:101-111.
Nielsen, D. C., M. F. Vigil and J. G. Benjamin. 2010. Evaluating decision rules for dryland rotation
crop selection. Field Crops Res. 120:254-261.
Norwood, C. A. 1992. Tillage and cropping system effects on winter wheat and grain- sorghum. J.
Prod. Agric. 5(1): 120-126.

129
Olson, S.R, C.V. Cole, F.S. Watanabe and L.A. Dean. 1954. Estimation of available phosphorus in
soil by extraction with sodium bicarbonate. USDA circular. 939.
Parkash, V., V.S. Chauhar, and J.P. Tandon. 1982. Economics of rain fed upland rice based cropping
systems in north western Himalayas. IRRN. 7(6): 22.
Prasad, D., J. S. Urkurkar, S. K. Bhoi and N. Nag. 2011. Production Potential and Economic
Analysis of Different Rice Based Cropping Systems in Chhattisgarh Plains, Res. J.
of Agri.Sci. 2011, 2(1): 36-39
Prasad, N. K. and R. Kerketta. 1991. Nutrients harvest and soil fertility in sequential cropping
systems. Indian J. Agron. 36: 68-73.
Rao, A. V., J. C. Tarafdar, S. K. Sharma, P. Kumar, and R. K. Aggarwal. 1995. Influence of
cropping systems on soil biochemical properties in an arid rain fed environment. J.
Arid Environ. 31(2): 237-244.
Raundal, P. U. and R. N. Sabale. 2000. Grain quality and economics of green gram-wheat cropping
system. J. Maharashtra Agric. Univ. 25(1): 98-99.
Reddy, K. A. and G. Bheemaiah. 1991. Effects of cropping systems and soil types on yield of maize.
Indian J. Agron. 36(2): 139-142.
Reynolds, M. P., K. D. Sayre and H. E. Vivar. 1994. Intercropping wheat and barley with N'
fixing legume species - A method for improving ground cover, N-use efficiency and
productivity in low input systems. J. Agric. Sci. 123(2): 175-183.
Saeed. M., K. H. Shah and S. H. Siddiqui. 1989. Effect of different cropping sequences on N
uptake and productivity of succeeding wheat crop. Pak. J. Sci. Ind. Res. 32(6): 410
412.
Saini, A. S. 1986. Energy use in rice-based farming system in India. IRRN, 11 (4): 42-43.

130
Santos H. P. D., R. P. Zentner, F. Selles and I. Ambrosi. 1993. Effect of crop rotation on yields,
soil chemical characteristics, and economic returns of zero-till barley in southern
Brazil. Soil and Tillage Research Volume 28(2): 141-158.
Segarra, E., J. W. Keeling and J. R Abernathy. 1991. Tillage and cropping system effects on
cotton yield and profitability on the Texas southern high plains. J. Prod. Agric. 4(4):
566-571.
Seth, J. and J. S. Balyan. 1985. Plant residue management in some cropping systems. Indian J.
Agron. 30(4): 483-487.
Setty, R. A. and A. S. Channabasavanna. 1993. Rice based cropping systems and its economics.
Farming Systems, 9(3-4): 115-118.
Sharma, A. R. 1995. Fertiliser use in rice and rice-based cropping system. Fertilizer News, 40(5):
29-41.
Sharma, K. N., A. L. Bhandari, M. L. Kapur and D. S. Rana. 1985. Influence of growing
various crops in five different fixed rotations on the changes in nitrate and total
nitrogen content of soils. J. Agric. Sci. 104:3.
Sharma, S. N., R Prasad and S. Singh. 1995, New multiple cropping systems for higher production
and profit. Indian J. Agric. Sci. 65(4): 237-241.
Sharma, S. N., R. Prasad, M. K. Dwivedi, S. Kumar, M. R. Davari and M. Ram.2009. E ect
of cropping system on production and chemical and biological properties of soil.
Archives of Agronomy and Soil Science 55(4): 429-438.
Shukla, M.K., R. Lal and M. Ebinger. 2006. Determining soil quality indicators by factor analysis.
Soil Till. Res. 87:194-204.

131
Singh S., J.K. Ladha, R.K. Gupta, Lav Bhushan, A.N. Rao, B. Sivaprasad, P.P. Singh. 2007.
Evaluation of mulching, intercropping with Sesbania and herbicide use for weed
management in dry-seeded rice (Oryza sativa L.) Crop Protection, 518-524.
Singh, A. 1972. Conceptual and experimental basis of cropping patterns. In. Proc. Sym. Cropping
patterns. CAR, New Delhi, 271-274.
Singh, V., S. K. Sharma, R. K. Siag and B. L. Verma. 1995. Economics of legume-wheat
(Triticum aestivum L.) cropping systems under different levels of irrigation. Indian J.
Agric. Sci. 65(10): 712-716.
Singh, S. B. and B. S. Verma. 1985. Effect of Summer grain legumes on nitrogen economy in
succeeding crop of wheat. Indian J. Agron. 30(4): 397-400.
Singh, R. C. and A. S. Faroda. 1985. Effect of summer pulses residual and direct phosphorus
application of the phosphorus uptake by succeeding wheat. Indian J. Agron. 30(3):
329-333.
Singh, R., D.S. Rana, A, Bhandari and R. S. Barar. 1996. Nutrient uptake in typic Ustochrept. Ind.
J. Agril. Scis. 66(1): 7-10.
Smolik, J. D. and T. L. Dobbs. 1991. Crop yields and economic returns accompanying the transition
to alternative farming systems. J. Prod. Agric. 4: 153-161.
Steel, R.G.D., J.H. Torrie and D. Dickey. 1997. Principles and Procedures of Statistics: A
Biometrical Approach. 3rd Ed. pp: 172-177 McGraw Hill Book Co. Inc. New York,
USA.
Stevens, W. E., J. R Johnson, J. J. Varco and J. Parkman. 1992. Tillage and winter cover management
effects on fertilizing and yield of cotton. J. Prod. Agric. 5(4): 570-575.
Stipešević B. and E. J. Kladivko. 2005. Effects of winter wheat cover crop desiccation times on
soil moisture, temperature and early maize growth. Plant Soil Environ. 51(6):

132
255–261.
Swift M.J., Izac A.M.N., Van Noordwijk M. (2004) Biodiversity and ecosystem services. Are we
asking the right questions? Agr. Ecosyst. Environ. 104, 113–134.
TAC, CGIAR.1978. Farming systems research at International Agricultural Research Centre, Rome,
Italy, Agric. Deptt. FAO, 8-12.
Tanaka, D. L., J. M. Krupinsky, M. A. Liebig, S. D. Merrill, R. E. Ries, J. R. Hendrickson, H.
A. Johnson, and J. D. Hanson. 2002. Dynamic Cropping Systems: An adaptable
approach to crop production in the Great Plains. Agron. J. 94:957-961.
Tilman, D., Cassman, K., Matson, P., Naylor, R., & Polasky, S. (2002). Agricultural sustainability
and intensive production practices, Nature 418: 671–677.
Urnrani, N. K., C. B. Gaikwad and B. N. Gare. 1992. Sustainability of cropping systems under dry
land conditions of vertisol. Indian J. Agron. 37(4): 645-649.
Velayudham, K. and J. Seth. 1986. Effect of preceding crops of cowpea and maize on the yield of
wheat. Indian J. Agric. Sci. 56(4): 263-266.
Vila, M., J. Vayreda, C. Gracia and J.J. Ibanez. 2003. Does tree diversity increase wood production
in pine forests? Oecologia 135, 299-303.
Warn, A.G. and N.K. Umrani. 1993. Production potential and economics of Leucaena leucocephala
forage inter-cropping system under nitrogen fertilization. Indian J.
Dryland Agric. Res. and Development: 8(I): 23-29.
Whitmore, A. P. 2000. The biological management of soil fertility project. Netherlands J.
Agric. Sci. 48(1): 115-122.
Wiese, A. F., W. L. Harman and C. Regier. 1994. Economic evaluation of conservation tillage
systems for dry land and irrigated cotton in southern great-plains. Weed Sci. 42(2):
316-321.

133
Xiao, Y. L., Y. Z. Zhang and R. Z. Hu. 1997. Effect of rice-based cropping system on organic matter
status in soils. Pedosphere 7(4): 349-354.
Yadav, K. S., S. C. Jain and H. S. Kushwaha. 1993. Effect of cropping system in relation to
planting pattern on growth and yield of cotton, Agric. Sci. Digest Karna 13(3-4): 181
184.
Young, D. L., T. J. Kwon and F. L. Young. 1994, Profit and risk for integrated conservation farming
systems in the Palouse. J. Soil and Water Conservation, 49(6): 601-606.
Zahid, M. S., M. A. Khokhar., H. R. Khan., A. Razzaq and A. Majid. 1991. Cropping system
interventions in the FSR target area Fatehjang (Pakistan). J, Appl. Pure Sci. 1(2): 99-
102.
Zade. K. B., S. G. Kharche, R. T. Patil, V. A. Deshrnukh and P. D. Deshmukh. 1994. Major
nutrients and its balance in crop sequences under vertisol soils. Annals of Plant
Physiol. 8:1.
Zhang, J. H., A. S. Hamill, and S. E. Weaver. 1996. Corn yield after 10 years of different
cropping sequences and weed management practices. Canadian J. Plant Sci. 76(4):
795-797.
Zia, M., M. Sharif, M. Ashraf and M. Aslam. 1986. Fertilizer management in rice-based cropping
system. Progressive farming, PARC, Islamabad. 6(1): 43-48.
ANNEXURES
Income (Rs) Yield/acre EXPENSES
36000/- 40 munds 3000/- Ploughing/Land
preparation/acre
4800/- DAP/acre
2800/- UREA/acre

134
2500/- Labour
cost/acre
Maize
2400/- Water
application/acre
2000/- Seeds/acre
6000/- Harvesting/acre
Income (Rs) Yield/acre EXPENSES
Maize
54000/- 60 munds 3000/- Ploughing/Land
preparation/acre
4800/- DAP/acre
2800/- UREA/acre
2500/- Labour
cost/acre
2400/- Water
application/acre
2000/- Seeds/acre
6000/- Harvesting/acre
Income (Rs) Yield/acre EXPENSES
55000/- 43 munds 3500/- Ploughing/Land
preparation/acre
3600/- DAP/acre
2100/- UREA/acre

135
1000/- Labour
cost/acre
Wheat
1400/- Water
application/acre
2500/- Seeds/acre
4000/- Harvesting/acre
Income (Rs) Yield/acre EXPENSES
Rice
40000/- 45 munds 1600/- Ploughing/Land
preparation/acre
3600/- DAP/acre
2100/- UREA/acre
7000/- Labour
cost/acre
3000/- Water
application/acre
1500/- Seeds/acre
4000/- Harvesting/acre
Income (Rs) Yield/acre EXPENSES
Sarsoo
42000/- 18 munds 1600/- Ploughing/Land
preparation/acre
2400/- DAP/acre
1400/- UREA/acre
800/- Labour
cost/acre

136
900/- Water
application/acre
300/- Seeds/acre
3000/- Harvesting/acre
Income (Rs) Yield/acre EXPENSES
Millet
20000/- 18 munds 1600/- Ploughing/Land
preparation/acre
2400/- DAP/acre
1400/- UREA/acre
800/- Labour
cost/acre
700/- Water
application/acre
300/- Seeds/acre
5000/- Harvesting/acre
Income (Rs) Yield/acre EXPENSES
Sunflower
43000/- 25 munds 2400/- Ploughing/Land
preparation/acre
4800/- DAP/acre
2800/- UREA/acre
1800/- Labour
cost/acre

137
1100/- Water
application/acre
3000/- Seeds/acre
5000/- Harvesting/acre
Income (Rs) Yield/acre EXPENSES
Barley
32000/- 18 munds 1800/- Ploughing/Land
preparation/acre
4200/- DAP/acre
1400/- UREA/acre
1100/- Labour
cost/acre
1200/- Water
application/acre
1800/- Seeds/acre
4000/- Harvesting/acre
Income (Rs) Yield/acre EXPENSES
Cotton
60000/- 20 munds 3000/- Ploughing/Land
preparation/acre
4200/- DAP/acre
3000/- UREA/acre
4000/- Labour
cost/acre

138
2400/- Water
application/acre
3000/- Seeds/acre
4000/- Harvesting/acre
Income (Rs) Yield/acre EXPENSES
Gram
32000/- 18 munds 1000/- Ploughing/Land
preparation/acre
2400/- DAP/acre
1400/- UREA/acre
300/- Labour
cost/acre
700/- Water
application/acre
1500/- Seeds/acre
3000/- Harvesting/acre