Embed Size (px)
Citation preview

Assessment, benchmarking and stress-testing resilience of critical infrastructures: A novel, indicator-based approach
developed in the EU project SmartResilience
A. Jovanovic1,2, K. Øien3
1 EU-VRi, Stuttgart, Germany
2 Steinbeis Advanced Risk Technologies, Stuttgart, Germany
3 SINTEF, Trondheim, Norway
Abstract
The contribution highlights the practical/implementation aspects of new EU project SmartResilience and its
application in terms of resilience assessment, resilience benchmarking and stress-testing. The project is
fully aware of the limitations and pitfalls of quantitative approaches when assessing complex, time-
dependent issues such as resilience of critical infrastructures. The project proposes to rely on the concept
of “resilience matrix”, redefined in such a way that it encompasses also the early (e.g. emerging risks re-
lated considerations), on one side, and the final process of learning and adaptation on the other side, i.e.
other wend of the resilience cycle. In particular, the project looks also at the aspects related to the fact that
modern critical infrastructures are becoming increasingly “smarter” and that this “making the infrastructures
smarter” usually means making them smarter in normal operation and use. This is, however, an issue to
be verified, if smart critical infrastructures will behave “smartly” and be “smartly resilient” also when ex-
posed to extreme threats, especially the new one such as extreme weather disasters or, e.g., terrorist
attacks. The paper focusses onto two main issues. The first being the indicator-based approach which
comprises the identification of existing indicators suitable for assessing resilience of SCIs, identification of
the new “smart” resilience indicators including those from Big Data, development of the new advanced
resilience assessment methodology based on smart RIs (“resilience indicators cube”, including the resili-
ence matrix). The second one is the application of the methodology and the approach developed in the
project, onto eight case studies in Europe. Beside the resilience assessment, the approach and the meth-
odology are intended to be applied for benchmarking and stress-testing, in the later stages of the project.
Acknowledgments
The paper is based on the Grant Agreement No. 700621 supporting the work on the SmartResilience
project provided by the Research Executive Agency (REA) ('the Agency'), under the power delegated by
the European Commission ('the Commission'). This support is gladly acknowledged here, as well as the
collaboration of all the partners and their representatives (persons) involved.

Smart Resilience Indicators for Smart Critical Infrastructures
Assessment, benchmarking and stress-testing resilience of critical infrastructures: A novel, indicator-based approach developed in the EU project SmartResilience
A. Jovanovic, K. Øien
Steinbeis Advanced Risk Technologies, Stuttgart, GermanyUniversity of Stuttgart – ZIRIUS, Stuttgart, Germany
EU-VRi – European Virtual Institute for Integrated Risk Management, Stuttgart, GermanySINTEF, Norway
CIPRE Conference, Den Haag 2017

Dependencies > interdependencies > stress testing(in critical infrastructures)
Framework: a. Characteristics: upstream, internal, downstream
b. Classes: physical, cyber, geographic, and logical
c. Dimensions: operating environment, coupling and response behavior, type of failure, infrastructure characteristics, and state of operations
“Smart” Critical Infrastructures (the SmartResilience project)
Practical Method
(expected) Results / Applications
Abstract - keywords

Smart Resilience Indicators for Smart Critical Infrastructures
“Smart” Critical Infrastructures
(the SmartResilience project)

Smart Critical Infrastructures(in SmartResilience project)
Fina
ncia
l, Ca
se “
ALPH
A”U
NIT
ED K
ING
DO
M
Airp
ort,
Case
“D
ELTA
”H
UNG
ARY
Prod
uctio
n, C
ase
“ECH
O”
SERB
IA
Wat
er, C
ase
“FO
XTRO
T”SW
EDEN
Health Care, Case “CHARLIE” AUSTRIA integrated European virtual Case “INDIA”: Benchmarking–Comparison–Lessons learned
Ener
gy, C
ase
“HO
TEL”
FIN
LAN
D
“Smart City” Integrated, virtual European case “BRAVO” GERMANY
Dynamic Test Scenario: Man – madeUrban flood
(“Tainted flood”) disaster
FloodCase “GOLF”
IRELAND
<<< smart
resilience indicators
(RIs) >>>
<<< smart
resilience indicators
(RIs) >>>
<<< smart
resilience indicators
(RIs) >>>
<<< smart
resilience indicators
(RIs) >>>

Smart Resilience Indicators for Smart Critical Infrastructures
Interdependencies > Stress testing

Map the safety/security landscape…(the SmartResilience project example)
Safety
SafetySecurity
Safety
Security
SafetySecurity
Reservoir Water supply infrastructure
Reserves
ECHO:Production
Emergency services
CHARLIE:Health Care
Traffic lights
Transport infrastructure
DELTA:Transportation (airport)
Number of passengers
Power plants
HOTEL:Energy supply
FOXTROT:Water supply
GOLF:Government (flood)
Emergency servicesCooperationReserves
Financial infrastructureOnline banking
ATMInsurance companies
ALFA:Financial system
Underground storage
Storage
Level of toxicity
Crisis management
Power suply
1
Medicine supply
ACCIDENT:man-caused
release of toxic aromatic liquids
21
1
2 2
3
4
4
5
Drinking water supply
BRAVO:Smart City
5
SYSTEMIC RISKS

Smart Resilience Indicators for Smart Critical Infrastructures
Dependencies > interdependencies > systemic risks (in critical infrastructures)

Smart Resilience Indicators for Smart Critical InfrastructuresThe Framework: Characteristics:
upstream, internal, downstreamClasses:
physical, cyber, geographic, and logicalDimensions:
operating environment, coupling and response behavior, type of failure, infrastructure characteristics, and state of operations

Stress-testing: resilience of interdependent infrastructure (systems)?
100%
Syst
em P
erfo
rman
ce
Scenario #A
Threat #1
threshold
[4] Adaptive Behavior
[1] Robust Behavior
[2] “Ductile” Behavior
[3] “Collapsing”
Behavior
Resilience
1 Week 4 Weeks
No. of other dept./plants affected
100% capacity recovered in 4 weeks
Improved protection control system in 3 months for passengers
50% capacity recovered in 1 week
Thurner, Hanle, Klimek et al. 2016
Acatech, Recil-Tech, 2016

Smart Resilience Indicators for Smart Critical Infrastructures
Practical MethodConventional Indicators

What when the “risk happens”?
Linkov et al. 2014, ANL 2012

Resilience matrixDimensions” of the Resilience
Linkov Error! Reference source not
found. 4 dimensions
T1.2: 5 dimensions
Comments
1. Physical
1. System / physical Includes technological aspects of the given infrastructure, as well as the physical/technical networks being part of a given infrastructure, interconnectedness with other infrastructures and systems
2. Information / data Includes also the technical systems dealing with information/data
2. Information (Data)
3. Organizational / business
Includes business-related aspects, financial and HR aspects as well as different types of respective organizational networks
3. Cognitive (Decision Making)
4. Societal / political Includes the broader societal and social context, also stakeholders not directly involved in the operation and/or use of the infrastructure (e.g. social networks)
4. Social 5. Cognitive / decision-making
Includes the perception aspects (e.g. perceptions of threats and vulnerabilities)
Phases vs.
Dimensions
1. U
nder
stan
d ris
ks
2. A
ntic
ipat
e / p
repa
re
3. A
bsor
b / w
ithst
and
4. R
espo
nd /
reco
ver
5. A
dapt
/ le
arn
1. System / physical
2. Information / data
5×5
3. Organizational / business
4. Societal / political
5. Cognitive / decision-making

Resilience cube in the context
Accidents, Adverse events
EnergyWater
TransportSupply
FinancesHealth
GovernmentSmart city
TerrorCyber
TechnologySocial
Extreme Weather
ThreatsSC
Is
RESILIENCE – CRITICAL ELEMENTS OF THE SCI
1
2
RATING & BENCHMARKING
RESILIENCE MATRIX
RESILIENCE CUBE

AnticipationRisk under-standing
CSF 1:Risk
Awareness
Risk/hazard identification(Hazid, …)
Reporting of incidents, near-misses and
accidents
Information about the quality of barriers(technical safety)
Make sure that risk awareness is maintained (avoid underestimation of risk)
How do we achieve knowledge and experience about risk/hazards? What can we expect?
Information about risk through e.g. courses & doc. (Hazop, QRA, ...)
Learn from own experiences &
accidents
Learn from other’s experiences &
accidents
Understand – anticipate – and monitor
System knowledge
1.1 1.2
1.1.1
1.1.2
1.1.3
1.1.4
1.2.1
1.2.2
1.2.3
What is anticipation?How do we know what to expect?
Example

Resilience Matrix: Phases/dimensions + issues & indicators
Phases/(dimensions) – Issues – Indicators
Issue 1.1
Issue 1.k
Indicator 1.k.1
Indicator 1.1.1
Indicator 1.k.2
1. Understand risks 2. Anticipate/prepare 3. Absorb/withstand 4. Respond/recover 5. Adapt/learn
1. System/physical
2. Information/data
3. Organizational/ business
4. Societal/political
5. Cognitive/ decision-making
DimensionsPhases
Dimensions are used for structuring the issues and indicators
(and support identification of issues)
• What would tell us that we are doing well (or have problems) with issue ‘k’?
• How well (or bad) are we doing with issue ‘k’?
• How do we achieve "risk understanding", etc.?• What is important for each of the phases?

Outline of assessment methodology Simple, transparent and easily understood …
"Smart black boxes are not smart" (Reviewer 3, D1.2).
Issue 1
Issue k
Indicator k.1
Indicator 1.1
Indicator k.2
1. Understand risks 2. Anticipate/prepare 3. Absorb/withstand 4. Respond/recover 5. Adapt/learn
1. System/physical
2. Information/data
3. Organizational/ business
4. Societal/political
5. Cognitive/ decision-making
Overall resilience
Critical infrastructures
DimensionsPhases
Dimensions are used for structuring the issues and indicators
(and support identification of issues)
• What would tell us that we are doing well (or have problems) with issue ‘k’?
• How well (or bad) are we doing with issue ‘k’?
• How do we achieve "risk understanding", etc.?• What is important for each of the phases?
Threats
Level 1
Level 2
Level 3
Level 4
Level 5
Level 6

ICT, Cascading effects & Smartness: NOT ONLY infrastructures are interdependent… also threats!
Smartness vulnerability 1.1
Smartness opportunity 1.2
Indicator 1.2.1
Indicator 1.1.1
1. Understand risks 2. Anticipate/prepare 3. Absorb/withstand 4. Respond/recover 5. Adapt/learn
1. System/physical2. Information/data3. Organizational/ business4. Societal/political5. Cognitive/ decision-making
City
DimensionsPhases
Threats
Critical infrastructures
Overall resilience
ICT* Energy Transport
Terror attack Cyber attack
...
...
Other issues 1.k
Indicator 1.k.1
Smartness vulnerability 2.1
Smartness opportunity 2.2
Indicator 2.2.1
Indicator 2.1.1
Other issues 2.k
Indicator 2.k.1
Smartness vulnerability 3.1
Smartness opportunity 3.2
Indicator 3.2.1
Indicator 3.1.1
Other issues 3.k
Indicator 3.k.1
Smartness vulnerability 4.1
Smartness opportunity 4.2
Indicator 4.2.1
Indicator 4.1.1
Other issues 4.k
Indicator 4.k.1
Smartness vulnerability 5.1
Smartness opportunity 5.2
Indicator 5.2.1
Indicator 5.1.1
Other issues 5.k
Indicator 5.k.1
Cascading effects
...
...
* ICT has an overarching role, affecting other CIs

1. Select the area, e.g. a smart city – Level 1
2. Select the relevant critical infrastructures (CIs) – Level 2
3. Select relevant threats for each CI, i.e. define the "scenario" – Level 3
4. Consider each phase (in the resilience matrix) for each threat – Level 4
5. Define the issues within each phase (structured/categorized according to the dimensions in the resilience matrix) – Level 5
6. Search for the appropriate indicators for each issue – Level 6
7. Determine best and worst values for each indicator
8. Assign real values to the indicators
9. Run the calculation and save the "assessment"
10. Use results/compare: (a) to previous assessment ("trend"), (b) to other assessments ("benchmarking"), or (c) to set criteria ("stress test")
Proposed SmartResilience method steps

Run calculations in database, save and use results
1. Define scenario 2. Use scenario 3. Save results report 4. Compare/benchmark
Stress-test definition Stress-test! Stress-test report RST?
Template
R2R1?
Criteria

Smart Resilience Indicators for Smart Critical Infrastructures
Big Data Indicators

From Big Data to interconnectedness indicators

1. degree centrality
2. betweenness centrality
3. closeness centrality,
4. eigenvector centrality (Bonacich 1972)
5. Bonacich power centrality (Bonacich 1987),
6. flow betweenness centrality (Freeman 1991)
7. fragmentation centrality (Borgatti 2006),
8. reach centrality (Scholtes et al. 2016)
9. proximal betweenness (Borgatti et al. 2013),
10. mutual information (Jin et al. 2012)
11. local clustering coefficient (Jin et al. 2012)
12. modularity centrality (Newman 2004)
13. Katz prestige
Examples of measures: Centrality, betweenness, Katz

Indicator development

Example: Communication network
Network 1 Network 2

Communication network - Summary
Day 1 Day 2

Communication network - Clusters
Day 1 Day 2Stronger clustering on day 1 than on day 2
Participants briefed for events Participants not briefed

Betweenness centrality Katz prestige
Proposed Resilience Indicators

Communication networks
Each circle represents an organization, each connection (link) an information flow between the two organizations

Results – Validation of the indicators
Each point is a disruptive events with participants being either prepared (red) or unprepared (blue)

Smart Resilience Indicators for Smart Critical Infrastructures
Results / Applications

Down to practical problems…
Infrastructure (CI) / Scenarios
Terrorist attack
Cyber attack
Extreme weather incl. NaTech
events
IC-specific events
Cross-cutting issues
1. Smart cities(Germany, UK, Ireland) () Social unrest,
urban floods
Insu
ranc
e, la
w e
nfor
cem
ents
, leg
islat
ion,
…
1. Smart health care (hospitals, Austria) () ()
Massive breach of
privacy
1. Smart energy supply systems (Finland) () ()
Solar storms (space
weather)
1. Smart industrial/production plants (new and refurbished plants, Industry 4.0 plants)
Interruptions in the critical supply chains
1. Smart transportation (airports; Hungary) Border control

Smart Resilience Indicators for Smart Critical Infrastructures
Use of Big Data

World Input Output Network
Supply-use network between sector X in country A and sector Y in country B, 1995 (left) and 2011 (right)
Cerina F, Zhu Z, C
hessa A, Riccaboni M
(2015) World
Input-Output N
etwork. PLoS O
NE 10(7): e0134025.
doi:10.1371/journal.pone.0134025

Xi ... Output („supply“) of sector i
Aij ... Technical coefficient: € of input from sector i needed to produce € output in j (input-output network)
Di ... Final consumption („use“) in sector i
Assume standard Leontief economy: X=AX+D
Absorb: Apply shock δ to sector k: Bij = Aij(1-δ) if i=k or j=k.
Recover: Assume that after shock there will be investments in rebuilding the infrastructure of size Σj Akjδ
WIOD ...

1 2 3 4 5 6 7 8 9 100.86
0.88
0.9
0.92
0.94
0.96
0.98
1USA: Activities auxiliary to financial services and insurance activities
USA: Activities auxiliar...
USA: Computer programmin...
USA: Printing and reprod...USA: Financial service a...
USA: Administrative and ...
USA: Scientific research...
USA: Legal and accountin...USA: Advertising and mar...
USA: Other professional,...USA: Architectural and e...
USA: Postal and courier ...
USA: Telecommunications
CYP: Administrative and ...
USA: Insurance, reinsura...
USA: Warehousing and sup...
USA: Publishing activiti...
CYP: Water transport
ROW: Administrative and ...
IRL: Insurance, reinsura...
USA: Real estate activit...
Example: Financial Crisis 2008
Area = resilience loss

RIs are directly related to size of output fluctuations across individual sectors of a country!
Validation of Resilience Indicators
Resilience loss
0 0.05 0.1 0.15
log.
out
put f
luct
uatio
ns
-5
-4
-3
-2
-1USA, = 0.54, p = 0.00002
Resilience loss
0 0.05 0.1 0.15
log.
out
put f
luct
uatio
ns
-2.5
-2
-1.5
DNK, = 0.45, p = 0.00066
Resilience loss
0 0.05 0.1 0.15
log.
out
put f
luct
uatio
ns
-2.5
-2
-1.5
DEU, = 0.40, p = 0.00269
Resilience loss
0 0.05 0.1 0.15 0.2
log.
out
put f
luct
uatio
ns
-2.5
-2
-1.5
-1
-0.5IRL, = 0.60, p = 0.00001
Resilience loss
0 0.05 0.1 0.15
log.
out
put f
luct
uatio
ns
-2.5
-2
-1.5
-1
-0.5LTU, = 0.53, p = 0.00004
Resilience loss
0 0.05 0.1 0.15 0.2
log.
out
put f
luct
uatio
ns-3.5
-3
-2.5
-2
-1.5
-1TWN, = 0.50, p = 0.00011

ALPHA: Financial infrastructure UK

CHARLIE: Health infrastructure Austria
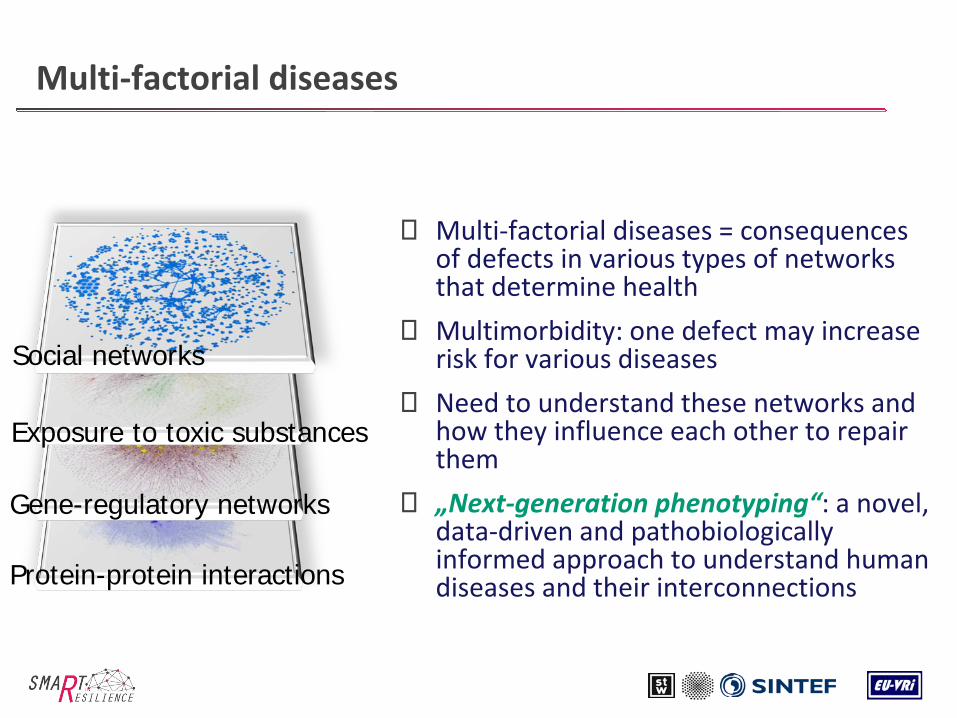
Multi-factorial diseases
Multi-factorial diseases = consequences of defects in various types of networks that determine health
Multimorbidity: one defect may increase risk for various diseases
Need to understand these networks and how they influence each other to repair them
„Next-generation phenotyping“: a novel, data-driven and pathobiologically informed approach to understand human diseases and their interconnections
Exposure to toxic substances
Gene-regulatory networks
Protein-protein interactions
Social networks

Comorbidity networks
patients with diabetes patients with pancreatic cancer
patients with diabetes and pancreatic cancer
diabetes
pancreatic cancer
• nodes = diseases• links = diseases are often co-
occurring• size of nodes = disease
prevalence

Comorbidity networks
0-8 years
9-16 years
17-24 years
25-32 years
33-40 years
41-48 years
49-56 years
57-64 years
65-72 years

Predict incidences using comorbidity networks
population-wide forecast of 85%-95% of all disease incidences within the next ten life years
Chmiel A, Klimek P, Thurner S, New J Phys 16, 115013 (2014)

Comorbidity networks and prevention
Prevention of this disease hard
Prevention easy
Probability of causation: 0.73
€1,000€10
Identify comorbidities Check causation Treat causing diseases

Zoom-In on diabetes: personalized health risks
Klimek P, Kautzky-Willer A, Chmiel A, Schiller-Frühwirt I, Thurner S, PLoS Comput Biol 11(4): e1004125 (2015)
• Check diabetes for all possible known or unknown comorbidities – equivalent to 40k single epidemiological experiments ≈100 highly significant comorbidities
• Confirmed controversial relation between diabetes and Parksinon‘s Disease.
• Strong gender effects: Lower risk for hypertension for females in fertile age, for example.
• Can partially check whether comorbidity relation is causative of consequential
• Type 1 diabetes typically present before onset of depressions.
• Schizo-affective disorders often lead type 2 diabetes drug interaction?
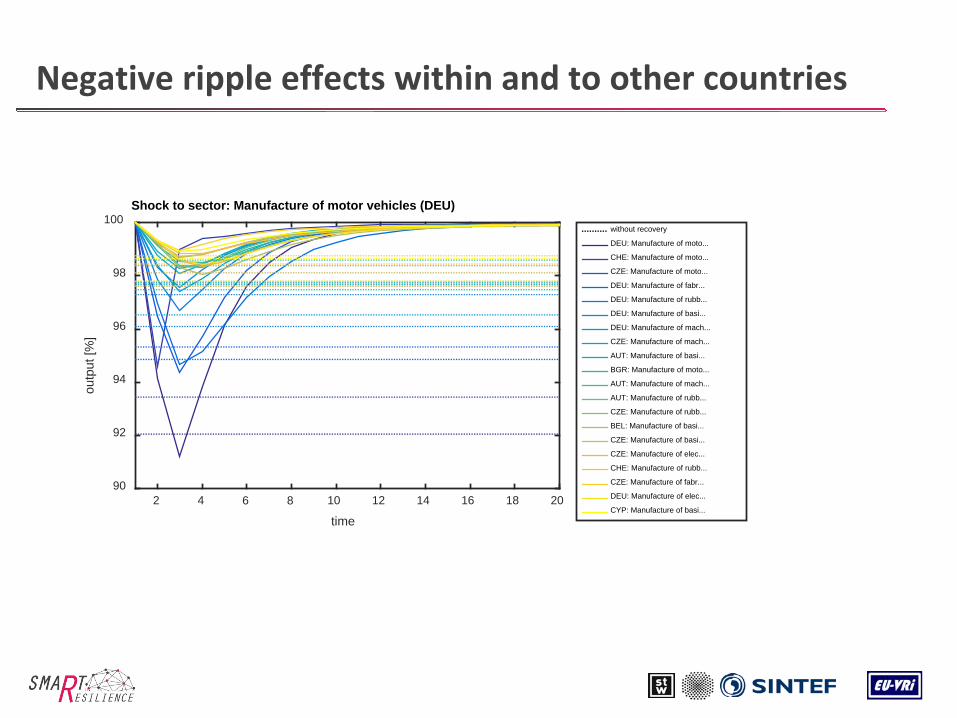
Negative ripple effects within and to other countries
time2 4 6 8 10 12 14 16 18 20
outp
ut [%
]
90
92
94
96
98
100Shock to sector: Manufacture of motor vehicles (DEU)
without recovery
DEU: Manufacture of moto...
CHE: Manufacture of moto...
CZE: Manufacture of moto...
DEU: Manufacture of fabr...
DEU: Manufacture of rubb...
DEU: Manufacture of basi...
DEU: Manufacture of mach...
CZE: Manufacture of mach...
AUT: Manufacture of basi...
BGR: Manufacture of moto...
AUT: Manufacture of mach...
AUT: Manufacture of rubb...
CZE: Manufacture of rubb...
BEL: Manufacture of basi...
CZE: Manufacture of basi...
CZE: Manufacture of elec...
CHE: Manufacture of rubb...
CZE: Manufacture of fabr...
DEU: Manufacture of elec...
CYP: Manufacture of basi...

time2 4 6 8 10 12 14 16 18 20
outp
ut [%
]
99
99.5
100
100.5
101
101.5
102Shock to sector: Manufacture of textiles (DEU)
without recovery
AUT: Manufacture of text...
CZE: Manufacture of text...
CHE: Manufacture of text...
SVK: Manufacture of text...
DEU: Other professional,...POL: Manufacture of text...
LUX: Manufacture of text...
HUN: Manufacture of text...
NLD: Manufacture of text...
DNK: Manufacture of text...
BEL: Manufacture of text...
SWE: Manufacture of text...
FRA: Manufacture of text...
SVN: Manufacture of text...
ITA: Manufacture of text...
DEU: Repair and installa...DEU: Wholesale trade, ex...
LVA: Manufacture of text...
HRV: Manufacture of text...
DEU: Retail trade, excep...
Shock in DEU -> AUT profits

Smart Resilience Indicators for Smart Critical Infrastructures
Conclusions – Take awayHuman thinking is (mainly!) 1-dimensional and
linear – resilience data are multin-dimensional and highly
nonlinear
A (global) “bridge” is needed!

Practical Conclusions
Give a new meaning to a SINGLE INDICATOR for RESILIENCE of an “infrastructure-of-infrastructures”
Where are the indicators? Make clear how the network-based measures can be used as resilience indicators
Visualization: align numbers with feeling (e.g. by means of intuitive visualization!)
Make sure that the use of “big-data-indicators” will be aligned and integrated with the use of conventional indicators

Conclusions - Resilience: Emerging and Systemic Risks Challenge 0: In theory, we all talk about
INTERdependencies, but, in practice, we hardly DEPENDENCIES
Challenge 1: Intuitively, we incapable to understand the dependencies above “3rd level” and can have only a gut feeling about INTERdependencies. Visualization: can help to align numbers with feeling (e.g. intuitive visualization!)
Challenge 2: The swarm of theblack swans systemic risks!
Challenge 3: How to make sure that the use of “big-data-indicators” is not misused (e.g. “used” for fake news)
Challenge 4: Know the limits of methods and tools (“radars”, including the big data ones!)
Challenge 5: Know the limits: Sky/world are NOT always the right limit!

Conclusions: Resilience radar?

© 2016-2019 This document and its content are the property of the SmartResilience Consortium. All rights relevant to this document are determined by the applicable laws. Access to this document does not grant any right or license on the document or its contents. This document or its contents are not to be used or treated in any manner inconsistent with the rights or interests of the SmartResilience Consortium or the Partners detriment and are not to be disclosed externally without prior written consent from the SmartResilience Partners. Each SmartResilience Partner may use this document in conformity with the SmartResilience Consortium Grant Agreement provisions. The research leading to these results has received funding from the European Union’s Horizon 2020 Research and Innovation Programme, under the Grant Agreement No 700621.
Legal note - Acknowledgment

The research leading to these results has received funding from the European Union’s Horizon 2020 Research and Innovation Programme, under the Grant Agreement No 700621.The views and opinions in this document are solely those of the authors and contributors, not those of the European Commission.
Contact
Contact: [email protected]