Embed Size (px)
Citation preview

ASSESSMENT AND PREDICTION OF SPEECH QUALITY IN TELECOMMUNICATIONS

Assessment and Prediction of Speech Quality in Telecommunications
by
Sebastian Möller Institut für Kommunikationsakustik (IKA)
SPRINGER-SCIENCE+BUSINESS MEDIA, B.V.

A c.I.P. Catalogue record for this book is available from the Library ofCongress.
ISBN 978-1-4419-4989-9 ISBN 978-1-4757-3117-0 (eBook) DOI 10.1007/978-1-4757-3117-0
Printed on acid-free paper
All Rights Reserved © 2000 Springer Science+Business Media Dordrecht Originally published by Kluwer Academic Publishers in 2000 Softcover reprint ofthe hardcover 1st edition 2000 No part of the material protected by this copyright notice may be reproduced or utilized in any form or by any means, electronic or mechanical, including photocopying, recording or by any information storage and retrieval system, without written permission from the copyright owner.

DES MENSCHEN AUGE HAT NIE GEHÖRT, DES MENSCHEN OHR NIE GESEHEN; DES MENSCHEN HAND KANN NICHT SCHMECKEN; SEINE ZUNGE NICHT BEGREJFEN NOCH SEIN HERZ BERICHTEN, WAS MEIN TRAUM WAR.
Ein Sommemach,.'raum. IV . I

Contents
Definitions and Abbreviations Acknowledgements Summary
1. INTRODUCTION
Xl
XVll
XIX
2. CONSIDERATIONS ON QUALITY 7 1. Speech Quality 7 2. Quality in the Context of Telecommunications 11
3. FACTORS INFLUENCING THE QUALITY OF SERVICE 17 1. Perceptive Factors 18
1.1 Loudness 19 1.2 Articulation 26 1.3 Effects of Bandwidth Restr. and Frequency Distortion 27 1.4 Perception of Sidetone 28 1.5 Perception of Echo 30 1.6 Perception of Circuit Noise 32 1.7 Perception of Ambient Noise 33 1.8 Effects of Transmission Delay 34
2. Configuration of a Telephone Connection 35 3. Simulation of a Telephone Connection for Quality Assessment
Purposes 38 4. Classification of Transmission and Service Parameters 43 5. Summary 45
4. QUALITY ASSESSMENT IN TELECOMMUNICATIONS 47 1. Choice of Test Subjects 50 2. Articulation and Intelligibility Tests 51 3. Listening-Only and Conversation Opinion Tests 51
3.1 Listening-Only Tests Using Absolute Category Rating 52 3.2 Listening-Only Tests Using Paired Comparison Techn. 54 3.3 Multidimensional Analysis 56 3.4 Talking and Listening Tests 58
vii

viii ASSESSMENT AND PREDICTION OF TELEPHONE-SPEECH QUALITY
3.5 Conversation Tests 59 4. Performance Tests 60 5. User Surveys 61 6. Usability Evaluation 63 7. Assessment of Cost-Related Factors 65 8. Scaling 66
8.1 Ratio Scaling 68 8.2 Absolute Category Scaling 68 8.3 Category-Ratio Scaling 72
9. Development of Conversation Test Scenarios 75 9.1 Requirements for Conversation Test Scenarios 75 9.2 Experiences with two Different Types of Scenario 78 9.3 Scenarios for Special Applications 81
10. Classification of Assessment Methods 85 11. Summary 85
5. MODELS FOR PREDICTING SPEECH COMM. QUALITY AND SERVICE-RELATED MODELS 89
1. Mouth-to-Ear Models U sing Parameters in the Frequ. Domain 91 2. Mouth-to-Ear Models Using Scalar Parameters 94
2.1 The Additivity Property of the E-Model 96 2.2 Description of the E-Model 99
3. Instrumental Models for Single Transmission Aspects 102 4. Call Set-Up and Call Completion Models 104 5. Customer Behavior Models 108 6. Application and Classification of Prediction Models 7. Summary
6. RELATIONS BETWEEN FACTORS GOVERNING THE QUALITY
109 111
OF SERVICE 115 1. 'Relative' Quality versus 'Absolute' Quality 116 2. References and Normalization 121 3. Assessment in Listening-Only and Conversation Tests 129 4. Expectation 133 5. Influence of the Cost Factor 141 6. Multidimensional Assessment of Voice Transmission Quality 145 7. Existence of an Integral "Psychological Quality Scale" 147 8. Summary 155
7. QUALITY OF PREDICTION MODELS 159 1. Prediction for Single Perceptive Types of Impairment 160 2. Prediction for Combinations of Different Types of Impairment 167 3. Impairment Factor Principle for Low-Bitrate Codecs 172 4. Prediction of Frequency Characteristics 176 5. Measurement of the Input Parameters 184

6. Accuracy of Quality Predictions, Limitations 7. Summary
8. FINAL DISCUSSION AND CONCLUSIONS
Appendices A- Glossary B- Perceptive Characteristics
Resulting from New Technologies 1. Impact of New Technologies and Equipment 2. Classification for Modeling Purposes
C- Discussion of Articulation and Intelligibility Test Methodologies
Contents ix
185 186
189
197 197 199
199 201 205
D- Graeco-Latin-Square Test Design 207 E- SCT Scenarios 209
I. Examples of SCT Scenarios 209 2. Explanations of the SCT Dialog Structure Given to the Test
Subjects 213 F- Closing Questionnaire Given after Laboratory Tests 215 G- E-Model Algorithm 217 H- Test Conditions and Results 221
1. Test Conditions of the Isopreference Test 221 2. Relation between E-Model Predictions and Test Results 222 3. Comparison of SUBMOD Model Predictions and Test Results 225
Bibliography 227
Index 241
Definitions and Abbreviations
Definitions
Aw a,b B' B~ B~E bo ßo
ß's D DLOI
d dM DELSM
%Diff
J, fk F s
Fw (f).f)c G 9 GL
%GoB ho I,Itot Id
Ie Iq 18
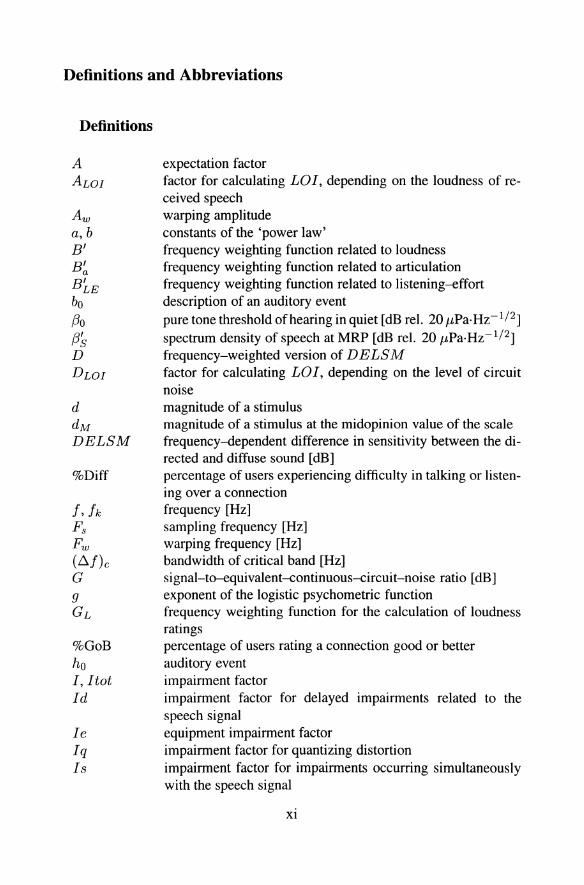
expectation factor factor for calculating LOI, depending on the loudness of received speech warping amplitude constants of the 'power law' frequency weighting function related to loudness frequency weighting function related to articulation frequency weighting function related to listening-effort description of an auditory event pure tone threshold ofhearing in quiet [dB rel. 20 J.LPao Hz- 1/ 2]
spectrum density of speech at MRP [dB Tel. 20 J.LPao Hz-1/ 2]
frequency-weighted version of DELSM factor for ca1culating LOI, depending on the level of circuit noise magnitude of a stimulus magnitude of a stimulus at the midopinion value of the scale frequency--dependent difference in sensitivity between the directed and diffuse sound [dB] percentage of users experiencing difficulty in talking or listening over a connection frequency [Hz] sampling frequency [Hz] warping frequency [Hz] bandwidth of critical band [Hz] signal-to-equivalent-continuous-circuit-noise ratio [dB] exponent of the logistic psychometric function frequency weighting function for the ca1culation of loudness ratings percentage of users rating a connection good or better auditory event impairment factor impairment factor for delayed impairments related to the speech signal equipment impairment factor impairment factor for quantizing distortion impairment factor for impairments occurring simultaneously with the speech signal
Xl

XlI ASSESSMENT AND PREDICTION OF TELEPHONE-SPEECH QUALITY
IQoS K k
Kc
lmax Le Lst LME, LRME,
LUME
L RME, LUME
A, AR, AU LOI LSTR L o (ßl)c M
m mse n(k) N
Ne Nfor Np No OLR P,Pr, Ps P(Z) Pa(Z) Pr
Ps
%PoW Q
GSM quality of service index factor for calculating Yc from YLE
exponent of the relation between subjective rating and apparent magnitude allowance to the threshold of hearing of complex tones in quiet [dB] frequency weighting function for alternatively calculating loudness ratings point of maximum excitation on the basilar membrane measured from the helicotrema due to atone at fk [mm] totallength of the basilar membrane [mm] frequency-dependent loss of the talker echo path [dB] frequency-dependent loss of the sidetone path [dB] air-to-air transmission loss from mouth reference point to ear reference point [dB] weighted average mouth-to-ear loss [dB] impression of loudness listening opinion index listener sidetone rating [dB] constant factor for calculating loudness ratings criticallength [mm] shift in hearing threshold attributable to the presence of noise [dB] exponent of the growth function Q(Z) mean squared error sampled noise signal total number of frequency bands for calculating loudness ratings circuit noise level [dBmOp] noise floOf level [dBmp] perceptual magnitude total equivalent circuit noise level [dBmOp] overallloudness rating between MRP and ERP [dB] mean normalized opinion for an impairment growth function of Z related to listening-effort growth function of Z related to articulation A-weighted sound pressure level of room noise at receive side [dB(A)] A-weighted sound press ure level of room noise at send side [dB(A)] percentage of users rating a connection poor or worse signal-to-quantizing-noise ratio [dB]
Q(Z) qdu r R Ree
Res
R' w Ro RLR
RLRset So SJE
SmeST
SRNST
SLR
SLRset STMR t T Ta
Tr TELR %TME Ve, VL
Wi WEPL x(k)
Definitions and Abbreviations X111
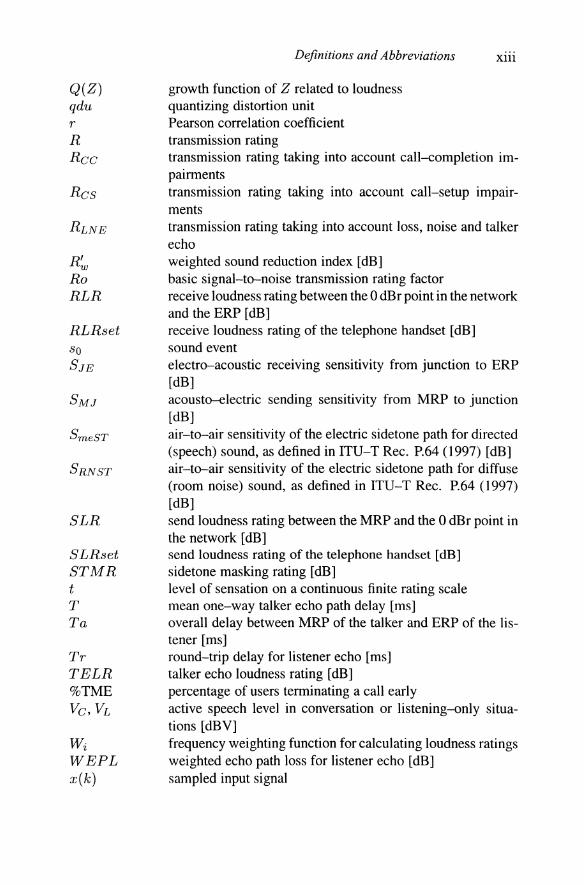
growth function of Z related to loudness quantizing distortion unit Pearson correlation coefficient transmission rating transmission rating taking into account call-completion impairments transmission rating taking into account call-setup impairments transmission rating taking into account loss, noise and talker echo weighted sound reduction index [dB] basic signal-to-noise transmission rating factor receive loudness rating between the 0 dBr point in the network and the ERP [dB] receive loudness rating of the telephone handset [dB] sound event electro-acoustic receiving sensitivity from junction to ERP [dB] acousto-electric sending sensitivity from MRP to junction [dB] air-to-air sensitivity ofthe electric sidetone path for directed (speech) sound, as defined in ITU-T Rec. P.64 (1997) [dB] air-to-air sensitivity of the electric sidetone path for diffuse (room noise) sound, as defined in ITU-T Rec. P.64 (1997) [dB] send loudness rating between the MRP and the 0 dBr point in the network [dB] send loudness rating of the telephone handset [dB] sidetone masking rating [dB] level of sensation on a continuous finite rating scale mean one-way talker echo path delay [ms] overall delay between MRP of the talker and ERP of the Iistener [ms] round-trip delay for listener echo [ms] talker echo loudness rating [dB] percentage of users terminating a call early active speech level in conversation or Iistening-only situations [dBV] frequency weighting function for calculating loudness ratings weighted echo path 10ss for Iistener echo [dB] sampled input signal
XIV ASSESSMENT AND PREDICTION OF TELEPHONE-SPEECH QUALITY
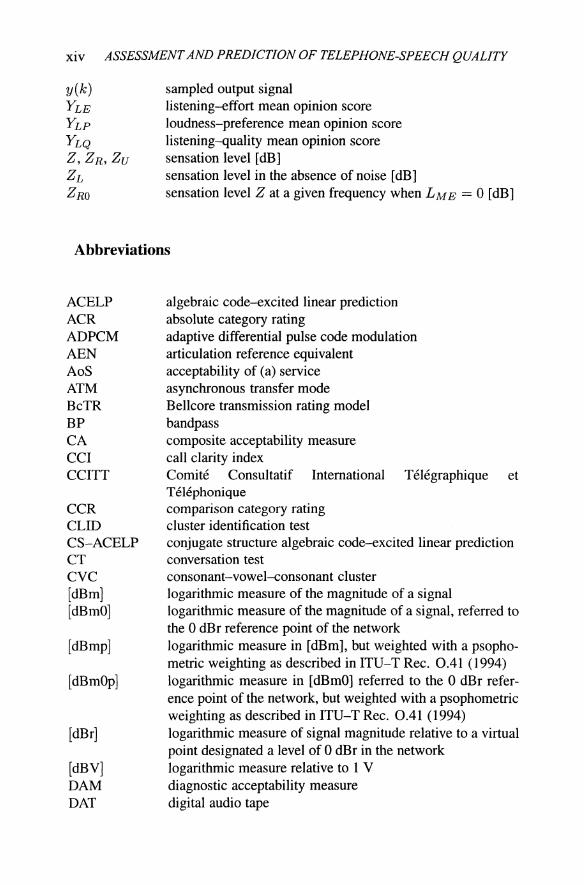
y(k) YLE YLP YLQ Z,ZR,ZU ZL ZRO
sampled output signal listening-effort mean opinion score loudness-preference mean opinion score listening-quality mean opinion score sensation level [dB] sensation level in the absence of noise [dB] sensation level Z at a given frequency when LME = 0 [dB]
Abbreviations
ACELP ACR ADPCM AEN AoS ATM BcTR BP CA CCI CCITT
CCR CLID CS-ACELP CT CVC [dBm] [dBmO]
[dBmp]
[dBmOp]
[dBr]
[dBV] DAM DAT
algebraic code-excited linear prediction absolute category rating adaptive differential pulse code modulation articulation reference equivalent acceptability of (a) service asynchronous transfer mode Bellcore transmission rating model bandpass composite acceptability measure call clarity index Comite Consultatif International Telegraphique et Telephonique comparison category rating cluster identification test conjugate structure algebraic code-excited linear prediction conversation test consonant-vowel-consonant cluster logarithmic measure of the magnitude of a signal logarithmic measure of the magnitude of a signal, referred to the 0 dBr reference point of the network logarithmic measure in [dBm], but weighted with a psophometric weighting as described in ITU-T Rec. 0.41 (1994) logarithmic measure in [dBmO] referred to the 0 dBr reference point of the network, but weighted with a psophometric weighting as described in ITU-T Rec. 0.41 (1994) logarithmic measure of signal magnitude relative to a virtual point designated a level of 0 dBr in the network logarithmic measure relative to 1 V diagnostic acceptability measure digital audio tape

DC DCME DCR DECT DRT DSP EC ERP ETSI FIFO GLS GSM GSM-FR GSM-HR GSM-EFR HATS HFT HP IKA INDSCAL INMD IP IRS
ISDN ISO ITU ITU-T
LD-CELP LOT LP MCS ME MELP MNRU
MOS MRP MRT OPINE PBS
Definitions and Abbreviations xv
direct current digital circuit multiplexing equipment degradation category rating digital European cordless telecommunication diagnostic rhyme test digital signal processor echo canceller ear reference point as defined in ITU-T Rec. P.64 (1997) European Telecommunications Standards Institute first-in first-out Graeco-Latin square global system for mobile communications GSM full rate codec GSM half rate codec GSM enhanced fuH rate codec head and torso simulator hands-free terminal highpass Institute of Communication Acoustics individual differences scaling in-service non-intrusive measurement device internet protocol intermediate reference system as defined in ITU-T Rec. PA8 (1989) integrated services digital network International Organization for Standardization International Telecommunication Union International Telecommunication Union - Telecommunication Standardization Sector low-delay code-excited linear prediction listening-only test lowpass mobile communication system magnitude estimation mixed excitation linear prediction modulated noise reference unit as defined in ITU-T Rec. P.810 (1996) mean opinion score (often used synonymously to YLQ or Yc) mouth reference point as defined in ITU-T Rec. P.64 (1997) modified rhyme test overall performance index model for network evaluation packet based system

XVI ASSESSMENT AND PREDICTION OF TELEPHONE-SPEECH QUALITY
PC PCM PR PSQM
PSTN QoS nns RPE-LTP SCT SNR SRAEN
SSRCT SUBMOD TFW TIPHON
TOSQA TTS UPT VAD VoIP VSELP
paired comparison technique pulse code modulation paired rating technique perceptual speech "quality measure according to ITU-T Rec. P.861 (1996) public switched telephone network quality of (a) service root mean square regular pulse excitation long tenn prediction short conversation test signal-to-noise ratio systeme de reference pour la detennination de I' affaiblissement equivalent pour la nettete single stimulus rating conversation test subjective model time and frequency warping telecommunication and internet protocol harmonization over networks Telekom objective speech quality assessment text-to-speech universal personal telecommunication voice activity detection voice over internet protocol vector sum excited linear prediction
Acknowledgements
The present work was performed during my occupation at the Institute of Communication Acoustics, Ruhr-University Bochum. It would not have been possible without the help of many supporters. Especially, I would like to thank the following:
my colleague Dr. Ute Jekosch for many fruitful discussions, help and support over the years,
the head ofthe institute, Prof. Dr.-Ing. Dr. techno h.c. Jens BIauert forenabling this work and supporting it with interest and advice,
Prof. Dr.-Ing. Ulrich Heute for kindly taking over the co-supervision, and for his interest in my work,
my long-term student co-worker Joachim Riedel for his work on the test organization and his comprising support,
Susanne Krause and Sabine Jekosch for the organization and run of numerous auditory experiments,
many other colleagues of the Institute of Communication Acoustics for providing a very good working atmosphere, and for a fruitful and friendly collaboration,
Carol HilI, Dr. Ute Jekosch and Dr.-Ing. Klaus Rateitschek for reviewing the manuscript,
Stephan Wiegelmann, Ralf Plücker, Joachim Riedel and Paul Darmoe for their work on diploma thesis and study projects related to this work,
the system administrators of the institute's computer network and the members of our office, for providing and maintaining their resources,
DrAng Jens Berger and other colleagues within the ITU-T Study Group 12 for their interest and critics in my work, and
my family and many friends for supporting me over the last years.
Prof. Gunnar Borg kindly agreed the reproduction of his CR-lO scale which is copyrighted by hirn. Figure 3.5 is an extract ofITU-T Rec. G.I07 (1998) and has been reproduced with the kind authorization ofthe ITU who is the copyright holder. The sole responsibility for selecting extracts for reproduction lies with the author alone and can in no way be attributed to the ITU. The implementation of the SUBMOD model was kindly provided by British Telecom. The citation is a reproduction of Ralf Königs "Jago".
XVll

Summary
The quality of a telecommunication voice service is largely inftuenced by the quality of the transmission system. Nevertheless, the analysis, synthesis and prediction of quality should take into account its multidimensional aspects. Quality can be regarded as a point where the perceived characteristics and the desired or expected ones meet. A schematic is presented which classifies different entities which contribute to the quality of a service, taking into account conversational, user as weIl as service related contributions.
Starting from this concept, perceptively relevant constituents of speech communication quality are identified. The perceptive factors result from elements of the transmission configuration. A simulation model is developed and implemented which allows the most relevant parameters of traditional transmission configurations to be manipulated, in real time and for the conversation situation. Inputs into the simulation are instrumentally measurable quality elements commonly used in transmission planning of telephone networks. A reduced set of these quality elements forms a basis for models which aim at predicting mouth-to-ear quality as it would be perceived by a user of the system. These models are an important tool for the planner of telecommunication networks, as they allow the expected quality to be estimated in advance, even before the network has been set up. Two well-known models (the SUBMOD and the E-model) are analyzed in more detail, with an emphasis on the psychoacoustic and psychophysical backgrounds.
Valid measurements of speech communication quality and usability can only be obtained by performing tests with human subjects. More precisely, the assessment of speech communication quality requires a conversation situation. In order to avoid the drawbacks of traditional conversation tests, a more economical method called 'short conversation test' (SeT) is developed. Tests carried out using SCT scenarios are a powerful tool for assessing integral speech communication quality, provided that appropriate scaling methods are available. Considering some major disadvantages of the traditional 5-point quality scale (MOS scale), a proposal is made for scaling on an impairment scale, which shows several similarities to the scale which forms the basis of the E-model. For the first time, the method allows E-model 'impairment factors' for new types of equipment to be measured in a direct way.
U sing the real-time simulation of the telephone transmission implemented in this work, a large number of auditory experiments is carried out in order to investigate the interdependence of factors goveming the quality of a service. Results show that the user background (expectation, references) has a strong inftuence on quality that is interpreted at an 'absolute' level. The quality of prediction models is further investigated by comparing instrumentally predicted quality to the results of the performed auditory tests. It turns out that model
XIX

xx ASSESSMENT AND PREDICTION OF TELEPHONE-SPEECH QUAUTY
predictions are satisfactory for many types of degradations. For other impairments, the models can still be improved by modifying the model algorithm, or with the help of other instrumental models (e.g. for codecs). Proposals are made for this in order to achieve more valid quality predictions for modem and future telecommunication scenarios.