Embed Size (px)
Citation preview

PIIE Briefi ng
16-6 Assessing Trade Agendasin the US Presidential CampaignMarcus Noland, Gary Clyde Hufbauer, Sherman Robinson, and Tyler Moran
SEPTEMBER 2016
© 2016 Peterson Institute for International Economics. All rights reserved.
The Peterson Institute for International Economics is a private nonpartisan, nonprofit institution for rigorous, intellectually open, and indepth study and discussion of international economic policy. Its purpose is to identify and analyze important issues to make globalization beneficial and sustainable for the people of the United States and the world, and then to develop and communicate practical new approaches for dealing with them. Its work is funded by a highly diverse group of philanthropic foundations, private corporations, and interested individuals, as well as income on its capital fund. About 35 percent of the Institute’s resources in its latest fiscal year were provided by contributors from outside the United States. A list of all financial supporters for the preceding six years is posted at https://piie.com/sites/default/files/supporters.pdf.
CONTENTS
Preface 3
1 Could a President Trump Shackle Imports? 5 Gary Clyde Hufbauer
2 Impact of Clinton’s and Trump’s Trade Proposals 17 Marcus Noland, Sherman Robinson, and Tyler Moran
3 A Diminished Leadership Role for the United States 40 Marcus Noland
Appendix A Disaggregation Methodology 45

3
Preface
International trade is a more prominent issue in this year’s presidential campaign than it has been in de-cades, if ever. Certainly, some of this attention is due to the combination of stagnating average incomes in the United States over the long term and the severe damage wrought by the American financial crisis of 2008–10. These calamities, however, are largely the result of domestic US failures. So while it is understand-able that politicians can find support blaming foreign actions and playing into fears of economic change, doing so is also profoundly wrong and short-sighted. There are solid reasons why successive American presi-dents, both Democrat and Republican, have not succumbed before to this temptation to pander to popular falsehoods about trade.
Make no mistake, the proposed trade policies of both Hillary Clinton and Donald J. Trump, the 2016 Democratic and Republican Party candidates for president, would deeply harm the American economy. Furthermore, they would primarily hurt average American households on modest incomes, and especially many of the individuals and communities that were already hard hit by the crisis. Curbing trade will worsen rather than solve the problem of American income stagnation by reducing families’ purchasing power, and by further slowing productivity growth. In fact, our analysis shows the recession that the belligerent trade policies proposed by Trump would cause would devastate viable American businesses and their vicinities. Backing out of the Trans-Pacific Partnership (TPP) agreement with our allies, as both candidates currently promise to do, would weaken our alliances in Asia, and embolden our rivals, thus eroding American national security.
There is a longstanding tradition of nonpartisan think tanks evaluating the major party candidates’ economic and foreign policies, usually starting with their tax and budget proposals. Since international economic policy has largely been an area of continuity and bipartisanship, at least since World War II, there has not been the need to examine trade in previous elections. In this election, however, the need is pressing for an unbiased, transparent, and evidence-based analysis.
Such an analysis is presented in this Peterson Institute for International Economics Briefing. We evalu-ate the Clinton and Trump trade proposals at face value. Where their statements have varied over time—and on these issues, they have done so less than on some others—we have relied on what views they return to and what their official campaign websites and documents state. It is not for us to guess at candidates’ motivations whether, say, a proposal is actually a threat to China for negotiating purposes or whether in someone’s heart of hearts they recognize the case for TPP. The public arguments made by presidential can-didates, let alone by presidents, matter. It is simple reality that threats must be possible to put into action for them to be credible in influencing any deal. We must presume that what candidates running for office say

4
they will do is at least close to what they will actually try to do. Our analysis shows that the next president could do almost all of what he or she proposes, at least temporarily.
Our analytical contribution in this Briefing is to work through empirically in detail the two candidates’ proposed trade policies in terms of what legally the president can do on her or his authority, what the impact would be on specific American industries and communities as well as on the economy as a whole, and what the foreign policy fallout would be, particularly in the Asia-Pacific. Our analysis is fact-based and transpar-ent, with data, sources, and methods publicly available on the Institute’s website. The analysis underlying all of our assessments is thus reproducible—and in this instance, we also provide the ability for interested individuals to look at how the candidates’ trade policies would directly affect the economic well-being of any chosen industry, county, or state in the United States. Like all indepth Peterson Institute studies, this research was reviewed by external academic experts prior to publication.
We have no partisan goal with this research publication. Our objective is to prevent severe economic policy mistakes by the next president of the United States, whether by getting the two candidates to change their positions or by raising enough public awareness and congressional opposition to prevent such mis-guided policies from coming into effect. Our concern is about the policies, not the candidates or the parties. Had both candidates remained within the justified bipartisan consensus on trade policy that ran through the administrations of Presidents George W. Bush and Barack Obama, we would not have undertaken this project.
That said, our analysis shows that the two candidates’ proposed policies are not equivalent in the harm they would do to the US economy if implemented. Clinton’s proposed trade and international economic policies would damage American well-being, primarily but not solely due to her stated opposition to TPP and to further economic integration. The policies proposed by Trump are another matter altogether. His stated approach to the global economy of waging trade war and protecting uncompetitive special interests would be disastrous for American economic well-being and national security. Being independent and non-partisan means that the Peterson Institute has to convey what our analysis reveals. We should not and will not play the common media game of saying that there are two sides to everything, or that if one candidate is bad, then the other must be equally bad, so as to convey false evenhandedness out of fear of being attacked. We call them as we see them: While Clinton’s stated trade policy would be harmful, Trump’s stated trade policy would be horribly destructive.
We hope that this research publication will generate greater public scrutiny of the two candidates’ posi-tions on international trade and refocus the debate on what is economically justified. Such a return from misleading claims to reality, and the more sensible trade policies that should result, would better serve the interests of the vast majority of Americans—including those most vulnerable to the fluctuations of the US economy.
Adam S. PosenPresident
Peterson Institute for International EconomicsSeptember 2016

5
Gary Clyde Hufbauer is the Reginald Jones Senior Fellow at the Peterson Institute for International Economics. Many helpful comments were received from R. Michael Gadbaw, adjunct professor at Georgetown Law School and former official in the US Treasury Department and Office of the US Trade Representative; Douglas A. Irwin, John Sloan Dickey Third Century Professor at Dartmouth College; and Philip I. Levy, senior fellow at the Chicago Council on Global Affairs and previously a White House and State Department economist.
CHAPTER 1
Could a President Trump Shackle Imports?Gary Clyde Hufbauer
In a presidential campaign season filled with anxiety about the effects of globalization on American jobs, Donald J. Trump, the Republican candidate, has gone farther than any other candidate.1 He has head-lined proposals aimed at reversing many years of trade liberalization embraced by both Democratic and Republican presidents. Trump has, for example, variously proclaimed that he would “rip up” existing trade agreements,2 renegotiate the North American Free Trade Agreement (NAFTA),3 and impose a 35 percent tariff on imports from Mexico and a 45 percent tariff on imports from China.4 In total, the United States has signed free trade agreements (FTAs) with 20 countries,5 all of them embodying the reciprocal reduction of tariffs and other barriers to trade and investment. A Trump presidency could terminate these FTAs and impose high tariffs on designated countries. In addition, Trump has suggested he might “pull out” of the World Trade Organization (WTO), the core framework for US commerce with 163 countries.6
1. For a collection of Trump’s pronouncements on trade, see www.ontheissues.org/2016/Donald_Trump_Free_Trade.htm.
2. See Vicki Needham, “Trump vows to ‘rip up’ all trade agreements,” The Hill, March 3, 2016, http://thehill.com/policy/finance/271723-trump-vows-to-rip-up-all-trade-agreements. Elaborating, Walid Phares, a foreign policy advisor to Trump, asserted that Trump may wish to “go back to ground zero” on all FTAs the United States has signed over the years. See Catherine Putz, “Despite Trump’s Rhetoric, GOP Senators Try to Reassure South Korea,” The Diplomat, June 3, 2016, http://thediplomat.com/2016/06/despite-trumps-rhetoric-gop-senators-try-to-reassure-south-korea.
3. See Vicki Needham, “Trump says he will renegotiate or withdraw from NAFTA,” The Hill, June 28, 2016, http://thehill.com/policy/finance/285189-trump-says-he-will-renegotiate-or-withdraw-from-nafta-without-changes.
4. See Simon Johnson, “Trump’s tariff proposal would gut US export jobs,” Boston Globe, June 27, 2016, www.bostonglobe.com/opinion/2016/06/26/johnson/ZE8JJbSqqJb4pP2hE6rohM/story.html.
5. See US Trade Representative, “Free Trade Agreements,” https://ustr.gov/trade-agreements/free-trade-agreements.
6. “Then we’re going to renegotiate or pull out. These trade deals are a disaster. The World Trade Organization is a

6
Since the legislation to implement NAFTA and other FTAs, as well obligations under the WTO, was enacted by Congress, which also approved normal trade relations with China upon its accession to the WTO in 2001,7 the question arises whether a President Trump could unilaterally carry out his threats. The short answer, at least in the short term, is “yes,” both because of the president’s constitutional power over foreign affairs and because multiple statutes enacted by Congress over the past century authorize the president to impose tariffs or quotas on imports and regulate foreign commerce in other ways as well (see table 1.1).
disaster.” See Ian Mount, “Donald Trump Says It Might Be Time for the U.S. To Quit the WTO,” Fortune, July 25, 2016, http://fortune.com/2016/07/25/donald-trump-free-trade-wto.
7. Normal trade relations are also known as most-favored-nation (MFN) treatment, meaning that US imports from China pay the same tariffs, and are entitled the same rights, as imports from any other member of the WTO. MFN tariffs are what countries promise to impose on imports from other members of the WTO, unless the country is also part of an FTA or another preferential trade agreement, in which case the tariffs are lower than MFN rates, often essentially zero. Thus in practice, MFN rates are the highest (most restrictive) that WTO members charge one another. Some countries impose higher tariffs on countries that are not part of the WTO. For WTO and FTA partners, the United States has scheduled maximum tariffs that it will impose on imports for nearly all of the 17,000 10-digit product lines in the Harmonized Tariff Schedule of the United States (HTS). These maximum tariffs are “bound” under agreements with WTO and FTA partners, who do likewise for imports from the United States.
Table 1.1 Summary of statutes available for presidential control of foreign
commerce
Name of statute Authorization trigger Presidential powers
Trade agreements
NAFTA Implementation Act of 1993 Proclamation of tariffs Proclaim return to MFN tariffs on imports from Canada and Mexico
Maintain general level of reciprocal concessions with Mexico and Canada
Proclaim additional duties following consultations with Congress
Limited statutes
Trade Expansion Act of 1962, Section 232(b)
Finding of an adverse impact on national security from imports
Impose tariffs or quotas as needed to offset the adverse impact
Trade Act of 1974, Section 122 Large and serious US balance of payments deficit
Impose tariffs up to 15 percent, or quantitative restrictions, or both for up to 150 days against one or more countries with large balance of payments surpluses
Trade Act of 1974, Section 301 Foreign country denies the United States its FTA rights or carries out practices that are unjustifiable, unreasonable, or discriminatory
Retaliatory actions, at presidential discretion, including tariffs and quotas
Almost unlimited statutes
Trading with the Enemy Act of 1917 During time of war All forms of international commerce, plus the power to freeze and seize foreign-owned assets of all kinds
International Emergency Economic Powers Act of 1977
National emergency All forms of international commerce, plus the power to freeze foreign-owned assets of all kinds
FTA = free trade agreement; MFN = most favored nation; NAFTA = North American Free Trade Agreement

7
In the longer term, however, as self-inflicted damage to the US economy became evident and wide-spread, Trump would face vigorous court challenges by adversely affected US firms and possibly some states, arguing that the president had exercised powers and invoked statutes in ways that the Constitution or Congress never intended. In addition, Congress would debate new bills to revoke powers delegated to the president under previous statutes, such as the Trading with the Enemy Act of 1917, the International Emergency Economic Powers Act of 1977, or Section 122 of the Trade Act of 1974.
Any effort to block Trump’s actions through the courts, or amend the authorizing statutes in Congress, would be difficult and would certainly take time. There is practically no chance that Congress can enact appropriate amendments before the next president is inaugurated, and even less chance that congressional action could surmount a presidential veto if Trump is elected. Thus, at least for a few years, a President Trump would have the stronger legal hand and his actions would very likely survive challenges in the US courts and Congress. US citizens and firms should not rely on the US courts or Congress to shield them from the consequences of Trump’s threats, should he carry them out.
No matter the outcome of domestic legal battles, if Trump is elected, if he actually withdraws from US trade agreements, or if he imposes high tariffs, even as a threat or tactical maneuver, foreign countries will soon retaliate. They will not patiently wait for US court proceedings or litigation in the WTO to vin-dicate their claimed rights under international law—specifically the right to export to the US market at low (bound) tariffs or duty free. Enormous economic damage to US firms, workers, and communities could ensue from a trade war long before the legal battlefield is cleared. It would be a mistake to suppose that the US courts will intervene to stop a trade war.
This essay focuses on the legal basis of Trump’s threatened actions. The first section explains how the president could terminate FTAs and increase tariffs. The next two sections enumerate five statutes that confer far-reaching powers on the president. The fourth section cites examples of preliminary injunctions against past presidential actions to assess how successful opponents of Trump’s trade threats, if he carried them out, would be.
NAFTA AND OTHER TRADE AGREEMENTS
The North American Free Trade Agreement was negotiated by President George H.W. Bush in 1992 and approved by Congress in 1993 after President Bill Clinton added side agreements for worker rights and the environment. It took effect on January 1, 1994, liberalizing trade and investment relations between the United States, Mexico, and Canada—eliminating all US and Mexican tariffs over a ten-year period, except on a handful of agricultural exports that were to be phased in over 15 years. As a result, between 1993 and 2013 (when NAFTA liberalization was fully phased in), US two-way trade in goods and services with Mexico more than quintupled in nominal terms, whereas trade with the rest of the world increased nearly four times (Hufbauer, Cimino, and Tyler 2014, tables 1 and 2). The agreement also promoted the integra-tion of the regional energy market and many specific industries, especially autos, electronics, and textiles.
But NAFTA does have an escape hatch for its signatories. Chapter 22 of NAFTA (like other FTAs) enables any member to withdraw after giving six months’ written notice to the other parties. Exercising authority over foreign affairs, a president could serve notice of cancellation of the agreement to Canada and Mexico (and other FTA partners). By itself, US withdrawal from NAFTA (or other FTAs) would not raise US tariffs on imports from Canada, Mexico, or other FTA partners from the preferential rates (mostly zero) to the (bound) most-favored-nation (MFN) rates specified in column 1 of the Harmonized Tariff Schedule

8
of the United States (HTS)—and it would certainly not implement the 35 percent rate threatened by can-didate Trump against Mexico.8
Since the first Reciprocal Trade Agreements Act of 1934, US tariffs have been lowered by presidential proclamations within the statutory limits authorized by Congress.9 By issuing a new proclamation, or by revoking President Clinton’s earlier proclamation, Trump could impose MFN rates (averaging around 3.5 percent ad valorem, but with much higher rates on items like clothing and footwear) on imports from Mexi-co.10 Preferential NAFTA tariff rates were originally proclaimed by President Clinton (Proclamation 6641, issued December 15, 1993), pursuant to Section 201 of the NAFTA Implementation Act (signed December 8, 1993). While a reversion to the higher MFN rates would be novel in US commercial history, Section 201 of the NAFTA Act, still in effect, enables the president to proclaim “additional duties”—following consulta-tions with Congress—as necessary and appropriate to maintain the general level of reciprocal concessions with Canada and Mexico.
“Consultations with Congress” are not equivalent to congressional acquiescence. If the US Trade Rep-resentative (USTR) and other cabinet members meet with the Senate Finance Committee and the House Ways and Means Committee, that should suffice. The “general level of reciprocal concessions” is fuzzy legal terminology, likewise subject to presidential interpretation. President Trump’s lawyers could argue that ter-mination of NAFTA necessitated a return to MFN rates on imports from Mexico, because Mexican exports to the United States exceed US exports to Mexico, or because Mexico imposes its value added tax on imports from the United States, but not the other way around, since there is no US value added tax.11
A similar sequence of termination, either preceded or followed by a new proclamation (or revocation of the prior proclamation), might also enable Trump to raise tariff rates on imports from other erstwhile free trade partners from the preferential rates (mostly zero) to the HTS column 1 MFN levels scheduled in the WTO as the US bound rates. However, if Trump actually “pulled out” of the WTO, the MFN tariff bindings might cease to have legal effect.12 In that event, US tariffs could conceivably revert to the onerous Depression-era Smoot-Hawley levels set forth in column 2 of the US HTS. This scenario seems far more cataclysmic than envisaged by Trump’s campaign rhetoric and is not explored further.
At this juncture, readers may be perplexed that a president has the power, without congressional con-sent, to terminate NAFTA and other FTAs—especially since Article I, Section 8 of the US Constitution confers upon Congress the power “To regulate Commerce with foreign Nations, and among the several States, and with the Indian tribes.” Only to the extent that Congress has delegated this power to the presi-
8. US MFN tariffs on imports from Mexico prior to NAFTA averaged 4.3 percent.
9. In modern times, these statutory limits are set forth in the congressional implementing legislation for GATT, WTO, and FTA agreements.
10. In 1866 the United States abrogated the Reciprocity Agreement of 1854 with Canada. However, there is no post–World War II precedent for US termination of an FTA, so the presidential use of proclamation authority (delegated by Congress) to raise US tariffs to their pre-NAFTA levels (in other words, the MFN rates) would be novel. Historically proclamation authority has been used to lower US tariffs.
11. If he wished, President Trump could exempt Canada from the higher MFN rates by honoring the tariff provisions of the Canada-US Free Trade Agreement of 1989.
12. The bound MFN tariffs were proclaimed by President Clinton pursuant to Section 111 of the Uruguay Round Agreements Act of 1994. As with termination of NAFTA, termination of US membership in the WTO would undercut the legal basis for President Clinton’s proclamation. The status of US HTS column 1 (MFN) tariffs would enter a legal dark zone.

9
dent can he or she restrict or liberalize trade with foreign countries. That’s why all presidents, from Franklin Roosevelt to Barack Obama, needed prior authority from Congress to credibly engage in negotiations with a view to lowering tariffs and otherwise regulating trade. However, for his contemplated actions, a President Trump can cite the specific delegation of congressional authority, in NAFTA and other FTAs, to proclaim tariffs, and the foreign affairs powers of the president to terminate NAFTA or other FTAs. To be sure Trump would face an avalanche of congressional criticism and court challenges, but he would have time on his side since corrective legislation and court decisions bearing on complex constitutional questions are seldom swift.
However, to raise US tariffs against Mexico to the 35 percent level threatened, Trump would very likely need to invoke another statute, since that level seems much higher than can be justified by an appeal to the “general level of reciprocal concessions”—if US courts interpret the phrase to bear some relation to Mexican tariffs on US exports (which are almost uniformly zero).
As it happens, laws long on the statute books would give a President Trump the power to impose tariffs (beyond the HTS column 1 MFN rates) or otherwise restrict imports from Mexico, China, or other coun-tries. The next two sections enumerate these statutes.
LIMITED STATUTES
Three laws that would get a President Trump part way to his high tariff goals—without “pulling out” of the WTO—may be characterized as limited statutes. The laws are Section 232(b) of the Trade Expansion Act of 1962 and Sections 122 and 301 of the Trade Act of 1974.13 The fact that the United States has subsequently bound its tariffs in the General Agreement on Tariffs and Trade (GATT), the WTO, and FTAs does not override the presidential power to invoke these statutes. But by breaching its bound tariffs, the United States would give its trading partners grounds to complain under international law and the right to retaliate.
Section 232(b). The Trade Expansion Act of 1962 was preceded by the Trade Agreements Extension Acts of 1955 and 1958; all three statutes were products of the Cold War. The 1955 Act constrained the president not to reduce tariffs on products vital to national security. The 1958 and 1962 Acts additionally enabled the president to raise tariffs or otherwise regulate imports as necessary to strengthen national security. Under the 1962 Act, upon the request of another federal department or agency, or a private party, or his own initiative, the director of the Office of Emergency Planning shall investigate the impact on national security of the im-portation of a specified article, and if he finds an adverse impact the president shall impose the necessary im-port restrictions. The statute places no limit on the nature of restrictions or the height of tariffs, if imposed.
Section 232(b) has historically been invoked to limit imports of particular items, such as industrial fasteners and machine tools (Knoll 1986). However, government lawyers cited Section 232(b) as one of
13. Conceivably President Trump might also invoke Sections 201 and 421 of the Trade Act of 1974. However, safeguard tariffs imposed pursuant to Section 201 require an affirmative finding of injury to a US industry by the US International Trade Commission (USITC) prior to presidential action; moreover, a USITC report covering a broad category of imports would take a fair amount of time. If the USITC finds no injury the president has no authority to act under Section 201. For example, in 1981 the USITC found that Japanese auto imports were not the cause of injury to the US auto industry, but rather injury was caused by a shift in consumer preference to more fuel-efficient cars. Once the USITC issues an affirmative finding of injury, the president can impose whatever restrictions he chooses—he is not bound by the USITC’s specific recommendations. Section 421 market disruption safeguards, aimed at China, were phased out in December 2013 under international law by the terms of China’s Protocol of Accession to the WTO, but Section 421 still exists on the US statute books. This is another example where an international agreement is not codified in US domestic law.

10
the legal grounds for President Richard Nixon’s 10 percent surcharge tariff imposed in 1971.14 Conceiv-ably a President Trump could instruct his officials to investigate the national security implications for the US industrial heartland resulting from thousands of Chinese and Mexican imports. Without exception, the courts defer to executive branch determinations of national security. Hence, following such an investigation, it is conceivable that President Trump could impose high tariffs on wide swaths of imported merchandise.
The foreign targets of a Section 232(b) action might bring a complaint to the WTO, which encom-passes the GATT as well as other agreements. GATT Article XXI Security Exceptions permits a member country to depart from its GATT obligations, including tariff bindings, in time of war or other emergency in international relations.15 Very few GATT challenges have been mounted against such restrictions and none have succeeded.16 Thus Section 232(b) tariffs seem immune from challenge either in the US courts or the WTO. However, trading partners might bring a case under GATT Article XXIII Nullification or Im-pairment, claiming compensation because their legitimate expectations of trade benefits had been defeated by the Article XXI action.17 Or they might simply retaliate without waiting 18 months or more for the WTO Appellate Body to adjudicate their claim.
Section 122. This section in the Trade Act of 1974 grants the president special powers “to deal with large and serious United States balance of-payments deficits.”18 Under Section 122, the president can impose a tariff of upto 15 percent or quantitative restrictions, or a combination of the two, for up to 150 days, as a remedy, either on a nondiscriminatory basis or against one or more countries selected because of their large balance of payments surpluses. Restrictions in place longer than 150 days would need new congressional authorization. It seems highly doubtful that the courts would permit the president to invoke Section 122 for 150 days, then give it a rest for 25 days, and then invoke it against the same target country or countries for another 150 days.
Of course a 15 percent tariff for 150 days would not fulfill President Trump’s stated goals. But unlike Section 232(b) of the 1962 Act, Section 122 tariffs can be imposed across the board without the need for a
14. In a subsequent legal challenge, the US Court of Customs and Patent Appeals did not rule on the merits of Section 232(b) as a basis for President Nixon’s action but supported his 10 percent surcharge tariff under the Trading with the Enemy Act of 1917.
15. The relevant language of Article XXI reads:
Nothing in this Agreement shall be construed… (b) to prevent any contracting party from taking any action which it considers necessary for the protection of its essential security interests… (iii) taken in time of war or other emergency in international relations
16. For an extensive discussion of Article XXI, see Yoo and Ahn (2016). To illustrate, in 1975, Sweden imposed national security quotas on shoe imports, arguing that this action was needed to ensure adequate supplies for its army in a potential emergency. No country brought a GATT case against Sweden, but the argument was so widely ridiculed in the GATT Council and elsewhere that the episode helped bring down the Swedish government. In 1977, Sweden terminated the quotas for leather and plastic shoes.
17. In 1986, the GATT Council debated (in the context of US sanctions against Nicaragua) whether an Article XXIII Nullification or Impairment claim could be brought against an Article XXI Security Exception action but did not reach a conclusion. See www.wto.org/english/res_e/booksp_e/gatt_ai_e/art21_e.pdf. In a later case, United States—The Cuban Liberty and Solidarity Act (WT/DS38, 18 May 1996), the European Union raised an Article XXIII complaint against the United States. That case was resolved by informal consultations in 1997.
18. Section 122 was enacted to provide explicit authority for future presidential actions akin to Nixon’s 10 percent surcharge tariffs imposed for a few months in 1971. For an authoritative history, see Irwin (2013).

11
prior national security investigation. Hence President Trump could invoke Section 122 as a prelude to more drastic measures five months later.
Plaintiffs might argue in US courts that, under its floating exchange rate regime, the United States cannot have a “large and serious balance of payments deficit,” since capital inflow surpluses always offset current account deficits. Trump’s lawyers and the plaintiffs could each draw on distinguished economists to argue the economic question. Given the historical origins of Section 122 it seems likely that the courts would equate “balance of payments deficits”—the common description of trade deficits in the 1970s and earlier—with the modern concept of “current account deficits.”
To be sure, China, Mexico, and other countries might challenge the balance of payments rationale as inconsistent with US obligations under the WTO. But a WTO case would take at least 18 months for reso-lution, and President Trump might choose to ignore an adverse decision. At best, the target countries could bring a GATT Article XXIII Nullification or Impairment case or resort to self-help.
Section 301. If President Trump decides that the main purpose of his tariffs is to retaliate for unfair trade practices abroad, his lawyers could invoke Section 301 of the Trade Act of 1974. Under this law, the USTR first determines that a foreign country is denying the United States its rights under a trade agreement or is carrying out practices that are unjustifiable, unreasonable, or discriminatory and burden or restrict US com-merce. The president can then take various retaliatory actions, including the imposition of duties or other import restrictions. The statute does not specify a timetable for invoking or lifting Section 301 measures (Bello and Holmer 1986).
Using Section 301, President Trump could impose tariffs in retaliation for a manipulated or under-valued exchange rate, market access barriers, or anything else that burdened US exports. To be sure, in the context of the Uruguay Round of multilateral trade negotiations (1986–95), in order to settle a case brought by the European Union, the United States agreed not to unilaterally invoke Section 301 prior to an affirma-tive WTO determination as to the merits of the US grievance. But the Uruguay Round Agreements Act of 1994 does not forbid the USTR from invoking Section 301; it merely gives the USTR discretion not to in-voke the statute in the wake of an adverse determination by the WTO. In other words, the US international commitment to the European Union was not codified in US law. Nothing in the statute prevents President Trump from imposing blunderbuss tariffs against one or more foreign countries,19 even though the WTO might later determine that the target country did not violate any US rights. Again, however, foreign trading partners might claim GATT Article XXIII Nullification or Impairment or simply retaliate.
ALMOST UNLIMITED STATUTES
Two other statutes would enable Trump to take quite drastic action with few limitations: the Trading with the Enemy Act of 1917 (TWEA) and the International Emergency Economic Powers Act of 1977 (IEEPA).
Trading with the Enemy Act of 1917. The mother of all presidential powers over international trade, travel, investment, and finance is the Trading with the Enemy Act of 1917, enacted when America was entering World War I. As originally written, Section 5(b) of TWEA delegated to the president broad war-time powers to regulate all forms of international commerce and to freeze and seize foreign assets. These
19. Of course the European Union could argue that this hypothetical use of Section 301 violated the settlement of its GATT case, even if it did not violate the US statute.

12
powers were not confined to commerce with the enemy nation, nor its assets—they cover the entire scope of “To regulate Commerce with foreign Nations…” to recall the language of Article 1, Section 8 of the US Constitution. The United States was not at war in 1933, but it faced a financial crisis, and as his first act President Roosevelt invoked Section 5(b) to declare a national emergency and order a bank holiday, actions at best remotely related to foreign commerce. When Congress convened, it approved and extended TWEA to cover national emergencies declared by the president (Carter 1988).
TWEA does not specifically authorize the president to raise tariffs. But in the single case in point, the US Court of Customs and Patent Appeals (526 F 2d 560) held that the 10 percent surcharge, imposed for three months as part of the “Nixon shock” in 1971, fell within the presidential power to “regulate” imports (Irwin 2013). This decision is still good law. The “national emergency” in that case was the erstwhile Ko-rean War, which ended in 1953. The reason that emergency could be cited by Nixon’s lawyers for TWEA purposes was that even though that war had long ended, the officially declared state of emergency was still in effect in 1971.20 Moreover, it should be recalled that the constitutional use of the word “regulate” in Article I, Section 8, clearly encompasses the imposition of tariffs. Without more, we might conclude that President Trump could invoke TWEA to impose any tariff rate he chose, on imports from any country he designated.
But there is more. In 1976, Congress amended TWEA to cover existing declared emergencies plus new actions solely “During the time of war.” As a companion measure in January 1977, Congress enacted the International Emergency Economic Powers Act to cover newly declared national emergencies (more on IEEPA in a moment). This flurry of legislative activity, along with the War Powers Resolution of 1973 and the National Emergencies Act of 1976, was stimulated by the widespread perception of “imperial overreach” in the Johnson and Nixon administrations.
Despite the limitation “During the time of war,” which appears in the opening language of Section 5(b), TWEA may not be a dead letter so far as Trump’s threatened tariffs are concerned. Long historical practice, stretching from the First Barbary War of 1803 to special forces now operating in Syria and Libya, and including both the Korean and Vietnam Wars (never declared by Congress in so many words), has am-ply established that no congressional declaration (pursuant to Article 1, Section 8 of the US Constitution) is required for the United States to engage in war.
If President Trump invoked TWEA to impose high tariffs on Mexico and China, he would certainly face a court challenge. The National Retail Federation as well as individual firms like Walmart and Target would seek immediate relief. The legal issue would not turn on whether war was underway with either Mexico or China: TWEA powers are not limited to commerce with the enemy. The core question would be whether the TWEA amendment in 1976, to limit the statute’s application to “During the time of war,” meant solely wars declared by Congress or included wars authorized by Congress and military actions with no prior congressional authorization. The last declared wars were those against Japan and Germany in 1941 and against Italy, Bulgaria, Hungary, and Romania in 1942. But Congress has authorized many military engagements, most recently against Afghanistan in 2001 and Iraq in 2003. Meanwhile presidents have engaged in more than 125 military actions without prior congressional approval. Because the Iraq and Afghanistan wars are still under way, and seem likely to greet the next US president when he or she takes the oath of office on January 20, 2017, citing those conflicts alone would seemingly suffice to satisfy the
20. Nixon’s lawyers could have cited the ongoing Vietnam War, but for reasons lost in history they did not.

13
predicate requirement of Section 5(b), even if the Supreme Court discounted all the current unauthorized military actions by US special forces (Libya, Somalia, Syria, Yemen, and perhaps others).
Only by holding that “During the time of war” meant solely wars declared by Congress could the Supreme Court deprive President Trump of the vast powers enumerated in TWEA. This holding seems unlikely, especially in light of America’s abundant history of authorized and unauthorized warfare and the fact that the 1976 amendment came shortly after the conclusion of the painful Vietnam War. If Congress meant such a limitation in 1976, it could easily have introduced Section 5(b) with the language “During the time of war declared by Congress.” Congress did not do so.
Assuming Trump’s TWEA tariffs survived the inevitable US court challenge, WTO litigation would not present much difficulty. Because the predicate for new TWEA actions is “time of war,” and since Trump could easily throw in a “national emergency,” and because those terms encompass “national secu-rity,” Trump’s lawyers could easily invoke GATT Article XXI Security Exceptions to defend against a WTO challenge. Again, however, US trade partners might bring a GATT Article XXIII Nullification or Impair-ment case in the WTO against the United States or might simply resort to self-help by restricting US exports of selected goods and services or expropriating the intellectual property of US firms.
International Emergency Economic Powers Act of 1977. This act is supposed to be exercised only during an “unusual and extraordinary threat.” But the courts have never questioned presidential declarations of a “national emergency,” so precedent seemingly gives President Trump a free hand. Maybe a future Supreme Court would rein in a future president, but for now the absence of cases limiting presidential authority to declare an emergency is telling.
Like TWEA, IEEPA grants the president wide powers to regulate all forms of international commerce and to freeze assets.21 Assuming the courts interpret “regulate” to include raising tariffs—as the US Court of Customs and Patent Appeals did for Nixon’s 10 percent surcharge—President Trump could invoke IEEPA to impose tariffs at rates and on imports of his choosing.
To be sure, Trump’s IEEPA tariffs would be vigorously challenged as a massive usurpation of the congressional power “To regulate Commerce with foreign Nations.” After all, IEEPA was not enacted with anything like Trump’s commercial crusade in mind. The contextual purpose of IEEPA was to give the president tools to inflict economic sanctions on America’s enemies and adversaries, thereby compensat-ing for the “During the time of war” limitation written into TWEA Section 5(b). That said, the history of liberal interpretation of “national emergencies” under TWEA argues strongly against a narrow interpreta-tion of “national emergencies” under IEEPA. Roosevelt’s use of TWEA to declare a bank holiday, Lyndon Johnson’s use to restrict direct investment, and Nixon’s use to impose a 10 percent surcharge all established precedents for broad presidential discretion. The frequent invocation of IEEPA to impose sanctions against small countries such as Nicaragua, Panama, Sierra Leone, and Somalia, in circumstances that few observers would characterize as an “unusual or extraordinary threat” to the United States, have strengthened those precedents.
As with Section 232(b) and TWEA tariffs, Trump’s lawyers could defend IEEPA tariffs against a WTO challenge by invoking GATT Article XXI Security Exceptions. But again trading partners could resort to GATT Article XXIII Nullification or Impairment or self-help.
21. However, unlike TWEA, IEEPA does not give the president the power to seize (or “vest”) assets (Carter 1988).

14
As an aside, if a future US Supreme Court held that 35 or 45 percent IEEPA tariffs for an unantici-pated commercial crusade were too great an intrusion on congressional prerogatives,22 President Trump could withdraw the tariffs and impose quantitative restrictions with much the same effect. No court has overturned any of the multiple quantitative restrictions imposed by successive US presidents over the past century.
PRELIMINARY INJUNCTIONS?
As already noted, Trump’s tariffs would arouse multiple opponents, ranging from auto companies such as GM and Chrysler to apparel firms such as Gap and Levi’s to information technology giants such as Apple and Qualcomm. These opponents would seek preliminary injunctions to prevent US Customs from collect-ing the new tariffs unless and until President Trump prevailed on the merits in the ensuing litigation, which would not reach the Supreme Court for at least a year.
In Winter v. Natural Resources Defense Council, Inc., 555 U.S. 7 (2008), the US Supreme Court laid down the requirements for obtaining a preliminary injunction: “A plaintiff seeking a preliminary injunction must establish that he is likely to succeed on the merits, that he is likely to suffer irreparable harm in the absence of preliminary relief, that the balance of equities tips in his favor, and that an injunction is in the public interest.”
“Irreparable harm” might be the easiest requirement for the corporate plaintiffs to meet. Trump’s tariffs would inflict large financial losses on contracted imports, disrupt supply chains, and probably put several firms out of business. But President Trump’s lawyers could cite multiple statutes to justify his actions, and success on the merits by these injured plaintiffs seems far from “likely.” If Trump’s lawyers decided on a “kitchen sink” strategy, the courts would have to issue preliminary injunctions against all the statutes his lawyers might cite—Section 232(b), Section 122, Section 301, TWEA, and IEEPA. This is a tall order.23 As for the “balance of equities,” government lawyers would argue—possibly citing Autor, Dorn, and Hanson (2016)—that millions of American workers have suffered long enough from Chinese and Mexican im-ports.24 Finally government lawyers would point to the promise and prominence of high tariffs in Trump’s election campaign, ratified by the voters, as the decisive declaration of the “public interest.”
Courts seldom grant preliminary injunctions against presidential actions, but they are not unknown. Two famous cases are worth summarizing, to distinguish their facts from those at issue in Trump’s hypo-thetical tariffs: Youngstown Sheet & Tube Co. v. Sawyer (1952) and Texas v. United States (2015).
In legal skirmishes leading to Youngstown Sheet & Tube Co. v. Sawyer, 343 U.S. 579 (1952), Federal District Court Judge David Andrew Pine granted a preliminary injunction because the justification the gov-
22. Article I, Section 9 of the US Constitution states that “No Tax or Duty shall be laid on Articles exported from any State.” In this context, the Supreme Court has distinguished between impermissible taxes and duties and permissible quantitative restrictions (embargoes or export controls), although economists see a rough equivalence between the measures. Conceivably the Supreme Court might similarly distinguish between tariffs and import quotas.
23. However, the United States has 94 federal judicial districts and more than 800 federal district judges. Different plaintiffs could go to different courts in an effort to find a sympathetic judge. The multiplicity of potential venues favors plaintiffs.
24. Note that Autor, Dorn, and Hanson (2016) did not attribute large and persistent US unemployment to imports from Mexico, only to imports from China. Moreover, even these authors acknowledge that the “China Shock” was a past event rather than an ongoing cause of US unemployment. Long briefs could be written arguing the employment effects (“the balance of equities”) of imposing or not imposing Trump’s hypothetical tariffs.

15
ernment lawyer offered for President Harry S. Truman’s seizure of the steel mills was a wave to “Sections 1, 2 and 3 of Article II of the Constitution and whatever inherent, implied or residual powers may flow there-from.” Judge Pine asked the lawyer whether the Constitution limited the powers of Congress and the judi-ciary but not the powers of the president, and the lawyer answered in the affirmative. This was too sweeping for Judge Pine and ultimately for the Supreme Court, which voted 6-3 to make the injunction permanent.
The big distinction between Youngstown Sheet & Tube Co. and Trump’s hypothetical tariffs is the absence of a statutory basis for Truman’s actions and the ample statutory basis for Trump’s actions. To be sure, Truman might have invoked the Taft-Hartley Act of 1947 to prevent the United Steel Workers from striking, or the Selective Service Act of 1948 to take control of the mills, but for tactical reasons Truman and his lawyers defended the seizure solely on the claim of inherent constitutional power.25 In strong contrast, Trump’s lawyers can defend his tariffs by appealing to several statutory delegations of power. They would have no reason to claim an inherent constitutional power.
In Texas v. United States (case 15-40238, filed November 25, 2015), the US Fifth Circuit Court of Appeals voted 2-1 to uphold the preliminary injunction issued by Federal District Court Judge Andrew Hanen against President Obama’s relief programs for illegal aliens, namely the Deferred Action for Parents of Americans (DAPA) and the Deferred Action for Childhood Arrivals (DACA). Texas and 25 other states claimed irreparable harm flowing from the cost of providing public services to millions of illegal aliens spared from deportation by DAPA and DACA. While the court found irreparable harm, the core question was the likelihood of Texas prevailing on the merits.
Government lawyers argued that inherent federal powers of prosecutorial discretion and efficient ad-ministration authorized the DAPA and DACA programs. Texas argued that the Immigration and National-ity Act of 1990 (INA) contained no delegation of congressional power to the president to exempt millions of illegal aliens from the statutory scheme. Fifth Circuit Court Judge Jerry Smith, writing for the majority, agreed: “The INA flatly does not permit the reclassification of millions of illegal aliens as lawfully present and thereby make them newly eligible for a host of federal and state benefits, including work authorization.”26
The Supreme Court has not yet issued its decision on the merits of the Texas suit. But as for the Fifth Circuit’s decision granting Texas a preliminary injunction, the distinction between Texas v. United States and Trump’s hypothetical tariffs is clear. Obama’s lawyers could not find a statutory basis for DAPA and DACA, but Trump’s lawyers can cite multiple statutes arguably authorizing his tariffs.
CONCLUSION
Trump’s trade threats may be no more than opening ploys to secure unilateral concessions from US trade partners or to induce US multinationals to step up their investments in the United States.27 In fact, Trump has asserted that threatened tariffs and taxes would never need to be imposed because trading partners and US firms would quickly fall into line. But if he is elected and imposes the trade restrictions of the magni-
25. The two named statutes were not popular vehicles at the time.
26. Texas v. United States, case 15-40238, filed November 25, 2015.
27. Trump has threatened company-specific tariffs or taxes (notably on Ford), but there is no statutory basis for such levies. See Steven Symes, “Trump Threatens Ford Yet Again,” Insider Car News, March 8, 2016, www.insidercarnews.com/trump-threatens-ford-yet-again-2. However, Trump could threaten duties on highly specific tariff lines, intensively utilized by Ford for its component imports, perhaps with a similar effect.

16
tudes threatened, foreign countries will soon retaliate. They will not patiently wait for US court proceedings or WTO litigation to vindicate their rights under national or international law.28 Enormous economic dam-age will ensue long before the legal battlefield is cleared.
Only congressional revocation of powers delegated by TWEA, IEEPA, and other statutes could ensure against the isolationist trade policies advocated by candidate Trump. But there is little chance that appropri-ate amendments will be enacted if Trump is elected. It would be a mistake to suppose that the US courts will intervene to stop a trade war.
REFERENCESAutor, David H., David Dorn, and Gordon H. Hanson. 2016. The China Shock: Learning from Labor Market Adjustment to Large Changes in Trade. NBER Working Paper 21906 (January). Cambridge, MA: National Bureau of Economic Research.
Bello, Judith Hippler, and Alan F. Holmer. 1986. Section 301 of the Trade Act of 1974: Requirements, Procedures, and Developments. Northwestern Journal of International Law & Business 7, no. 4 (Fall). Available at http://scholarlycommons.law.northwestern.edu/cgi/viewcontent.cgi?article=1211&context=njilb.
Carter, Barry E. 1988. International Economic Sanctions: Improving the Haphazard U.S. Legal Regime. Cambridge University Press.
Hufbauer, Gary Clyde, Cathleen Cimino, and Tyler Moran. 2014. NAFTA at 20: Misleading Charges and Positive Achievements. PIIE Policy Brief 14-13. Washington: Peterson Institute for International Economics. Available at www.piie.com/sites/default/files/publications/pb/pb14-13.pdf.
Irwin, Douglas A. 2013. The Nixon shock after forty years: The import surcharge revisited. World Trade Review 12, no. 1 (January). Available at www.dartmouth.edu/~dirwin/Nixon.pdf.
Knoll, David D. 1986. Section 232 of the Trade Expansion Act of 1962: Industrial Fasteners, Machine Tools and Be-yond. Maryland Journal of International Law 10, no. 1: 55. Available at http://digitalcommons.law.umaryland.edu/mjil/vol10/iss1/4.
Yoo, Ji Yeong, and Dukgeun Ahn. 2016. Security Exceptions in the WTO System: Bridge or Bottle-Neck for Trade and Security? Journal of International Economic Law 19, no. 2 (May): 417–77. Available at http://jiel.oxfordjournals.org/content/19/2/417.full.pdf+html.
28. President George W. Bush imposed safeguard tariffs on a large volume of US steel imports in March 2002. In November 2003, some 20 months later, the WTO Appellate Body ruled that the tariffs were inconsistent with US obligations, and Bush lifted them in December 2003. By that time, Bush had achieved his political goals, in particular congressional passage of the Trade Promotion Authority Act of 2002, which was widely welcomed abroad. It’s unlikely that US trading partners would be equally patient in the face of Trump’s attack on the world trading system.

17
CHAPTER 2
Impact of Clinton’s and Trump’s Trade ProposalsMarcus Noland, Sherman Robinson, and Tyler Moran
Since the 1930s, when a global drive to raise trade barriers deepened the Great Depression, US specialists and the public at large have shared the belief that a liberal US-led rules-based international trade regime is in the United States’ national interest. Trade policy has thus seldom, if ever, risen to a top-tier issue in electoral politics.
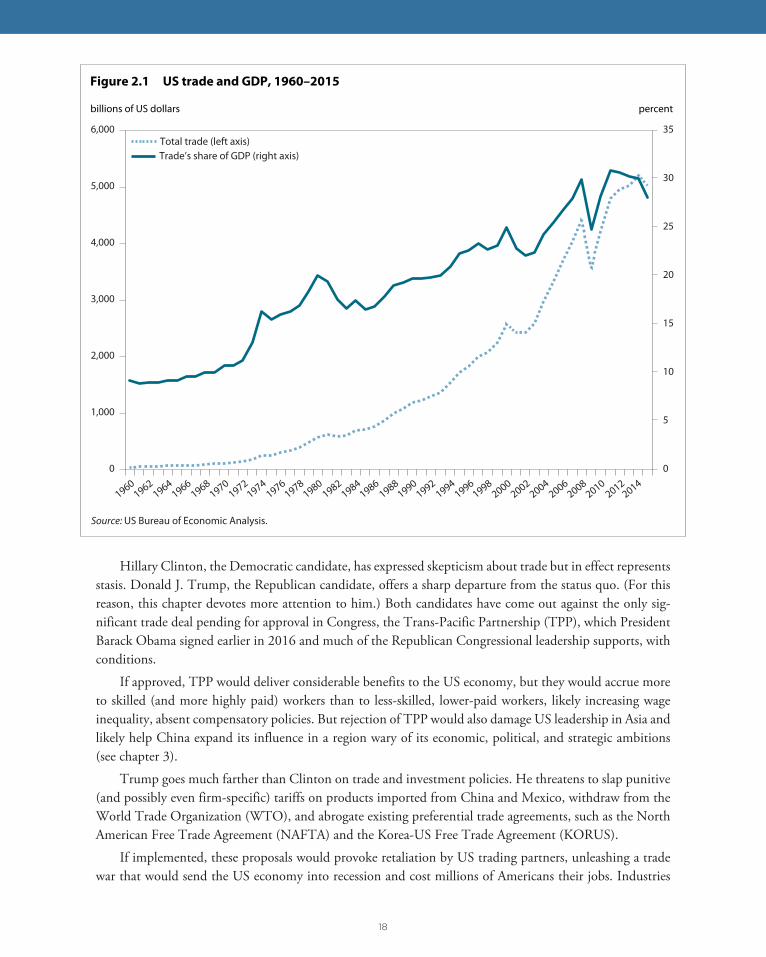
The presidential campaign of 2016 has departed from this pattern, for two reasons. First, the increasing openness of the global economy tripled the share of trade in US national income in the last 50 years (figure 2.1). Second, successive administrations have been unwilling or unable to expand safety net programs for people who have lost their jobs or seen their wages decline. These changes have occurred not only because of trade and offshoring of jobs but also because of technological innovations and increases in productivity. Trade, however, has taken most of the blame in political discourse this year, breaking the postwar consensus around the liberal order of international economic cooperation and openness (box 2.1).
This analysis assesses the main presidential candidates’ positions on trade and provides an empirically based assessment of their trade policy proposals with regard to what has become an emotionally heated issue in the election campaign.
Marcus Noland is executive vice president and director of studies at the Peterson Institute for International Economics. Sherman Robinson is a senior research fellow at the International Food Policy Research Institute (IFPRI). The views in this chapter do not represent IFPRI’s position. Tyler Moran is a former research analyst at the Peterson Institute for International Economics.
Authors’ Note: This chapter benefited significantly from comments on preliminary drafts from Fred Bergsten, Olivier Blanchard, Chad Bown, Cathleen Cimino-Isaacs, William Cline, Dieter Ernst, Caroline Freund, Michael Gadbaw, Egor Gornostay, Cullen Hendrix, Gary Hufbauer, Doug Irwin, Simon Johnson, Robert Lawrence, Phil Levy, Ted Moran, Michael Plummer, Adam Posen, Jeffrey Schott, David Stockton, and Jan Zilinsky, though none of them should be held responsible for the final product. Mark Zandi and Chris Lafakis at Moody’s Analytics were more than generous in sharing unpublished model runs. Kent Boydston provided versatile and timely research support. We thank Barbara Karni, Madona Devasahayam, and Steve Weisman and the Peterson Institute publications department for turning our writing into what you hold in your hands.
18
Hillary Clinton, the Democratic candidate, has expressed skepticism about trade but in effect represents stasis. Donald J. Trump, the Republican candidate, offers a sharp departure from the status quo. (For this reason, this chapter devotes more attention to him.) Both candidates have come out against the only sig-nificant trade deal pending for approval in Congress, the Trans-Pacific Partnership (TPP), which President Barack Obama signed earlier in 2016 and much of the Republican Congressional leadership supports, with conditions.
If approved, TPP would deliver considerable benefits to the US economy, but they would accrue more to skilled (and more highly paid) workers than to less-skilled, lower-paid workers, likely increasing wage inequality, absent compensatory policies. But rejection of TPP would also damage US leadership in Asia and likely help China expand its influence in a region wary of its economic, political, and strategic ambitions (see chapter 3).
Trump goes much farther than Clinton on trade and investment policies. He threatens to slap punitive (and possibly even firm-specific) tariffs on products imported from China and Mexico, withdraw from the World Trade Organization (WTO), and abrogate existing preferential trade agreements, such as the North American Free Trade Agreement (NAFTA) and the Korea-US Free Trade Agreement (KORUS).
If implemented, these proposals would provoke retaliation by US trading partners, unleashing a trade war that would send the US economy into recession and cost millions of Americans their jobs. Industries
Total trade (left axis)Trade’s share of GDP (right axis)
billions of US dollars percent
Figure 2.1 US trade and GDP, 1960–2015
Source: US Bureau of Economic Analysis.
0
5
10
15
20
25
30
35
0
1,000
2,000
3,000
4,000
5,000
6,000
19601962
19641966
19681970
19721974
19761978
19801982
19841986
19881990
19921994
19961998
20002002
20042006
20082010
20122014

19
that manufacture machinery used to create capital goods1 in the information technology, aerospace, and engineering sectors, which depend on exports, would be the most intensely affected. But the trade shock would also damage sectors not engaged in trade, such as wholesale and retail distribution, restaurants, and temporary employment agencies, particularly in regions where traded commodities are produced. Millions of American jobs that appear unconnected to international trade—disproportionately lower-skilled and lower-wage jobs—would be at risk.
In a full trade war scenario, Washington State would be the worst affected, suffering a 5 percent private sector job loss relative to baseline. But employment would fall by more than 4 percent in a broad swath of states, including California, Connecticut, Indiana, Illinois, Kentucky, Maryland, Massachusetts, Michi-gan, Minnesota, New Hampshire, New Mexico, New York, North Carolina, Ohio, Pennsylvania, Rhode Island, Texas, Utah, and Wisconsin. Twenty-nine counties across America would experience employment
1. Capital goods are goods, such as machinery, buildings, equipment, and tools, that are used to produce other goods and services for sale.
Box 2.1 Labor markets, trade, and adjustment: How did we get here?
The US economy experienced a tremendous increase in globalization over the past 50 years (see figure 2.1). Falling transportation and communications costs and rising incomes drove this process, but sup-portive trade policies also played a role. In the United States, expansion of trade will tend to depress the wages of low-skilled workers; increase the wages of some skilled classes; and increase the returns to capi-tal, land, and other natural resources. To the extent that the highly skilled are the predominant owners of capital and land in the United States, the net effect of these changes is likely to increase income and wealth inequality.
The consensus among economists is that technological change, not international trade, is the primary driver of labor market changes observed in recent decades, though the rapid expansion of international trade—in particular the “China shock” of the 1990s, following China’s accession to the World Trade Orga-nization and the associated granting of permanent normal trade relations—together with a period of Chinese currency undervaluation contributed to a surge in manufactured imports, with adverse conse-quences for US manufacturing employment, which has fallen by nearly one-third since 2000 (Autor, Dorn, and Hanson 2013).
That period of rapid increase in import penetration has now passed. Hicks and Devaraj (2015) decom-pose US job losses in manufacturing between 2000 and 2010 into components associated with techno-logical change, trade, and shifts in domestic demand. They find that increases in productivity accounted for 88 percent of job losses.
Although it was not the primary cause of recent job losses, international trade—or more precisely, inter-national trade agreements—have become the scapegoat of people dissatisfied with prevailing economic trends. The growing salience of immigration concerns, in the United States and elsewhere, suggests that the expressions of unease with both international trade and immigration may reflect apprehensions that run deeper than the national income accounts.
One way to deal with the problem of labor market dislocation would be to accompany trade opening with improved social safety nets, which the United States has failed to do. The existing Trade Adjustment Assistance program is widely regarded as ineffectual (Irwin 2016). Given that any number of forces (tech-nological change, international trade, tax policy) can cause labor market dislocations, a better approach would be to adopt a generalized system of wage insurance and retraining to address the needs of people displaced, regardless of the cause (Kletzer and Litan 2001), possibly by expanding the earned income tax credit, or even just expanding unemployment compensation. These proposals reward continued partici-pation in the labor market, which has declined, in part because of misuse of the social security disability program as a permanent unemployment compensation scheme. Maintenance of the Affordable Care Act (or a similar program) that begins to separate health care coverage from employment would also increase labor market flexibility.

20
declines of 7 percent or more. In absolute terms, Los Angeles county in California would be the worst af-fected (176,000 jobs), followed by Cook county, Illinois (Chicago) with 91,000 and Harris county, Texas (Houston) with 89,000.
Based on past actions in trade disputes with China and Mexico, a reciprocal response to US-imposed trade sanctions is fully plausible to assume. Scenarios milder than a full-blown trade war could also unfold, including one in which China responds to US actions by selectively ending imports of US aircraft or soy-beans or instructing state-owned enterprises to stop purchasing US business services. The casualties of these trade disputes include many low-income workers employed in sectors not normally associated with interna-tional trade as the impact of the trade disputes ripples through their communities.2
The results presented in this analysis are a conservative assessment of the damage that the trade policies advocated by candidate Trump could wreak on the US economy. Left unaddressed in the formal model-ing are Trump’s musings about withdrawing from free trade agreements and the WTO, which are difficult to address in the framework presented. If, however, the United States withdrew from the WTO, it could quickly find itself back in the Smoot-Hawley world of the Great Depression.
POSITIONS OF THE CANDIDATES
Hillary Clinton
In her long career in politics, Hillary Clinton has not taken a doctrinaire position on trade. As First Lady, she supported NAFTA, passage of which marked a significant achievement of her husband, President Bill Clinton. But while campaigning for the 2008 Democratic presidential nomination, she described NAFTA as “a mistake.”3 While representing New York in the US Senate, she voted in favor of six preferential trade deals (FTAs with Chile, Singapore, Australia, Morocco, Bahrain, and Oman); against two (the Central American Free Trade Agreement [CAFTA-DR] and the FTA with Panama); and did not vote on two others (the agreements with Jordan and Peru). She expressed opposition to the FTAs with Colombia and South Korea, which did not come to votes while she was in office. Later, while serving as secretary of state, Clinton reversed her opposition to these agreements and helped persuade Congress to pass them.
In the 2016 campaign, she has made enforcement of existing trade laws, aimed at preventing abuses by trading partners, the centerpiece of her trade policy. She wants to create a new position of chief trade pros-ecutor, reporting directly to the president; triple the number of officials devoted to monitoring implementa-tion of agreements by America’s trade partners; and create an “early warning system” to detect implementa-tion problems. She has expressed particular concern about the maintenance of labor standards, a feature of many recent trade agreements.4
With respect to China, she is against granting it “market economy status,” which would make anti-dumping trade sanctions harder to impose. She has also expressed concerns about currency manipulation by
2. Not everyone who loses a job in these trade war scenarios will find comparable employment.
3. Linda Qiu, “Clinton Voted for ‘Virtually Every’ Trade Agreement, Killing Millions of Jobs, Sanders Says,” Politifact, April 10, 2016, www.politifact.com/truth-o-meter/statements/2016/apr/10/bernie-s/clinton-voted-virtually-every-trade-agreement-kill/ (accessed on August 7, 2016).
4. This paragraph and the next two draw on Hillary Clinton, “Commentary: If Elected President, I’ll Level the Playing Field on Global Trade,” Portland Press Herald, February 23, 2016, www.pressherald.com/2016/02/23/commentary-if-elected-president-ill-level-the-playing-field-on-global-trade-clinton-says/ (accessed on August 7, 2016).
21
China and other countries (aimed at making their exports cheaper and their imports more expensive), and she backs legislation to impose countervailing duties against countries that maintain undervalued currencies to gain an unfair advantage in trade.
She has also called for changes in the tax code to discourage offshoring of jobs and “inversions,” the practice of US firms merging with smaller foreign companies to establish headquarters in jurisdictions abroad with lower costs and tax rates. She has indicated her intention to “claw back” some revenue losses from inversions and allocate $10 billion to a program to strengthen the manufacturing sector.5
The two major trade policy proposals on the US agenda are TPP, which none of the 12 participating countries has yet ratified, and the Trans-Atlantic Trade and Investment Partnership (TTIP), which remains in the negotiating stage.6 TPP calls for the removal of tariffs and quotas and other traditional border impedi-ments to trade; trade facilitation; expansion of e-commerce; protection of investor, intellectual property, and labor rights; environmental standards; and dispute settlement procedures, among many other issues.
Economic analyses of traditional market access issues estimate that gains from TPP to the US economy would reach $130 billion once the agreement is largely phased in, a process that would take about 15 years (Petri and Plummer 2016).7 The results obtained from simulation models are consistent with a large body of empirical evidence that demonstrates that international trade raises growth and productivity and that trade protection impedes both.8
The actual benefit to the US economy from TPP would likely be much larger, because the assess-ments focus only on the part of the agreement that is easiest to analyze quantitatively. The impact of other components could be large. They include steps to facilitate trade through easier customs regulations and actions to encourage e-commerce, cross-border investment flows (including productivity-enhancing inward investment flows), protection of intellectual property rights, curbs on state-owned enterprises, opening up of government procurement, and promotion of international labor and environmental standards.
Petri and Plummer (2016) find that most of the income gains accrue to relatively skilled workers. TPP could therefore contribute to both income growth and an increase in income inequality, absent compensa-tory policies. In short, the pie will get bigger, but the slices will become less equal in size.
5. The Briefing, www.hillaryclinton.com/briefing/factsheets/2016/04/01/hillary-clintons-strategy-to-make-it-in-america/ (accessed on August 23, 2016).
6. Clinton has not taken a position on TTIP, a proposed trade, investment, and economic cooperation accord between the United States and the European Union. Given the uncertainty about the viability of these negotiations post-Brexit, it is doubtful that she will.
7. The 2016 evaluation of TPP by the US International Trade Commission is an outlier. It concludes that the agreement would deliver just $57 billion in benefits to the US economy in 2032. Its lower estimate primarily reflects the fact that its analysis included only tariff cuts and other border measures that can be analyzed in a completely noncontroversial way. But even this ultraconservative analysis concluded that TPP would raise real wages in the United States and contribute to creating 128,000 jobs. See Peter A. Petri and Michael Plummer, “The International Trade Commission Report on the TPP: Solid but Too Cautious,” PIIE Trade and Investment Policy Watch blog, May 19, 2016, www.piie.com/blogs/trade-investment-policy-watch/international-trade-commission-report-tpp-solid-too-cautious (accessed on July 13, 2016).
8. On the trade-growth relationship, see Frankel and Romer (1999). On the trade-productivity link, see Bernard et al. (2007).

22
Although she supported TPP as secretary of state, calling it “the gold standard” of trade agreements, candidate Clinton has come out in opposition to it,9 as has candidate Trump.10 The Democratic Party plat-form committee rejected a proposed amendment to oppose TPP outright, however. The platform simply advocates strict protections for US workers in all trade deals.
There is fading hope among TPP advocates that the agreement could be ratified during a lame duck session (between the November election and the seating of the new Congress in January 2017). The politi-cal logic would be that confronted with a President Clinton or a President Trump, some Congressional Republicans would drop their objections to specific provisions of the agreement and work with the Obama administration and vote for passage (Lawrence 2016). However, Clinton has made her opposition to this tack clear; if she were to win the presidential election by a substantial margin, some members of Congress might be reluctant to disregard her wishes. If the United States does not ratify the agreement, the agreement will not come into force.11
If TPP does not come to a vote in the lame duck session, some observers have speculated that President Clinton could flip-flop and return to the pro-TPP position she held as secretary of state, perhaps in the context of a revitalized (and renamed) “pivot to Asia” (Francis 2016). But even this scenario has its implicit costs: Petri and Plummer (2016) estimate that each year’s delay in implementing TPP represents a $77 bil-lion to $123 billion permanent income loss for the United States, depending on the discount rate applied.
Given that Clinton supported TPP before she opposed it, proponents of the pact are hoping that if elected, she could replicate President Bill Clinton’s maneuver in the early 1990s, when he opposed NAFTA while campaigning against George H. W. Bush in 1992 and then supported its passage in office, citing the side agreements that he negotiated and the fact that he had “improved” its provisions on labor, environmen-tal, and safety regulations. In an interview with PBS NewsHour, Hillary Clinton criticized TPP for failure to include provisions relating to currency manipulation.12 She has also objected to its “rules of origin” as being insufficiently rigorous with respect to automobiles.13
One way for Clinton, if elected president, to garner congressional support for TPP (should she decide to go this route) would be to “get tough” on monetary issues by supporting the adoption in parallel of coun-
9. Lauren Carroll, “What Hillary Clinton Really Said about TPP and the ‘Gold Standard,’” October 13, 2015, Politifact, www.politifact.com/truth-o-meter/statements/2015/oct/13/hillary-clinton/what-hillary-clinton-really-said-about-tpp-and-gol/ (accessed on June 23, 2016).
10. In his trade policy speech in Monessen, Pennsylvania, on June 28, 2016, Trump described TPP as a “death blow to American manufacturing,” promised to withdraw from the agreement, and took credit for what he alleged was Clinton’s feigned opposition to the agreement. (accessed on June 28, 2016). Later that day, at a rally in Ohio, he repeatedly described TPP as “a rape of our country.” See Cristiano Limo, “Trump Calls Trade Deal ‘a Rape of our Country,” Politico, June 28, 2016 (accessed on June 29, 2016).
11. The agreement would enter force if at least six countries that together represent at least 85 percent of the total GDP of the original 12 ratified it within two years. Without the United States, reaching the GDP threshold would not be possible.
12. “Hillary Clinton says she does not support Trans-Pacific Partnership,” PBS NewsHour, October 7, 2015, www.pbs.org/newshour/rundown/hillary-clinton-says-she-does-not-support-trans-pacific-partnership/ (accessed on June 24, 2016). See Bergsten (2014, 2016).
13. The Briefing, www.hillaryclinton.com/briefing/factsheets/2016/04/01/hillary-clintons-strategy-to-make-it-in-america/ (accessed on August 23, 2016).
23
tervailing currency legislation, which is popular among some TPP opponents and which she has indicated might be considered as part of an “expanded toolbox” to address the issue.14
The currency manipulation provisions of the Trade Facilitation and Enforcement Act of 2015 could be strengthened. The law has three components: a definition of currency manipulation, a protocol for “en-hanced engagement” (i.e., consultation) with trade partners deemed currency manipulators, and a menu of remedies if consultation fails. On the first issue, the law requires the US Treasury to conduct, as part of its existing semiannual exchange rate reports, “enhanced analysis” of major trade partners that have “a significant bilateral trade surplus with the United States…a material current account surplus and…engaged in persistent one-sided intervention in the foreign exchange market.” It then mandates that “the President, through the Secretary of the Treasury, shall convene enhanced bilateral engagement with each country for which an enhanced analysis… is included in the report….” The law specifies that if, after one year, the president determines that the situation has not been rectified, he or she “shall” take “one or more” specified actions. These actions include prohibiting “the Overseas Private Investment Corporation from approving any new financing;” excluding that country from government procurement; instructing the US executive director at the International Monetary Fund to advocate for enhanced surveillance of that country; and in-structing the US Trade Representative “to take into account…in assessing whether to enter into a bilateral or regional trade agreement” with that country “the extent to which that country has failed to adopt appro-priate policies to correct” currency undervaluation and trade imbalances.
China was the centerpiece of concern in the run-up to the congressional debate. But its own adjust-ment—followed by market turbulence, a slowing of growth, and intervention to offset depreciation—means that it does not currently meet these criteria and is unlikely to be cited as a currency manipulator soon.
Might she throw her support to the pact if her currency and auto concerns were met? It is impossible to say, though Clinton seemed to close the door in what might be her “read my lips” moment, in an August 11, 2016, speech in Michigan, when she stated, “I will stop any trade deal that kills jobs or holds down wages, including the Trans-Pacific Partnership. I oppose it now, I’ll oppose it after the election, and I’ll oppose it as president.”15
Donald Trump
Assessing the prospective trade policy of Donald Trump is difficult, because, unlike his carefully scripted opponent, he has often communicated his positions extemporaneously, with none of the usual policy paper backup produced by traditional presidential candidates. In addition, some observers and analysts regard his statements as mere negotiating gambits.
Three facts suggest that Trump does indeed represent a sharp departure from the post–World War II consensus around a rules-based multilateral system. First, Trump’s campaign has forcefully blamed many of the wage and employment problems in the United States on trade in general and “disastrous” trade agree-ments in particular (see box 2.1). This narrative requires him to keep trade high on the agenda. Second, he
14. Hillary Clinton, “If Elected President, I’ll Level the Playing Field on Global Trade,” Portland Press Herald, February 23, 2016, www.pressherald.com/2016/02/23/commentary-if-elected-president-ill-level-the-playing-field-on-global-trade-clinton-says/ (accessed on August 7, 2016).
15. Jackie Calmes, “Fact-Checking Hillary Clinton’s Economic Speech,” New York Times, August 11, 2016, www.nytimes.com/2016/08/12/us/politics/hillary-clinton-fact-check.html?_r=0 (accessed on August 21, 2016).

24
has repeated these views since at least the 1980s, suggesting that he may actually hold them. Third, even if the statements are strategic, acting on them can, intentionally or not, produce escalating cycles of retaliation by trading partners. When planning a war, it is not advisable to assume that one’s adversary will surrender when the first shot is fired. For these reasons, Trump must be taken at his word.
Most analysts have focused on three of Trump’s stated positions: his vows to impose a 35 percent tariff on Mexico, impose a 45 percent tariff on China, and renegotiate existing free trade agreements. Trump has also indicated that he might withdraw from the WTO over the imposition of tariffs, possibly firm-specific, on products made in Mexico by US firms.16
Trump has repeated his plan to impose a 35 percent tariff on Mexico many times, beginning June 16, 2015, when he announced his candidacy. On several occasions—including in his June 28, 2016 trade policy speech—he has acknowledged that his policy might require abrogation of NAFTA.17
Trump has also advocated a 45 percent tariff on Chinese goods, basically as a countervailing action against alleged currency undervaluation.18 On his website he pledges to name China a currency manipulator on his first day in office and “begin a process that imposes appropriate countervailing duties on artificially cheap Chinese products,” 19 but he does not mention the 45 percent figure specifically.20
Some observers have questioned whether the president has the legal authority to implement these poli-cies. Chapter 1 by Gary Clyde Hufbauer makes clear that a President Trump could act under a variety of broadly written statutes. Adversely affected US and foreign firms could request injunctions from the federal court system, but the courts have generally deferred to the executive on these issues. Moreover, a President Trump would have just won the election after running on a platform of carrying out just these actions; he could therefore rightly claim a political mandate to do so. To block implementation, the plaintiffs would have to prevail on every justification, of which there are many; the president would need the courts to ac-quiesce on only a single rationale to sustain the policy. Appeals could go all the way to the Supreme Court. Even in the unlikely case that in the end the courts ruled against him, a President Trump would probably have at least a year or two to implement his preferred policy unilaterally.
16. Chuck Todd Interviews Donald Trump On “Meet The Press,” youtu.be/iLcL2fSxGKw (accessed on July 27, 2016).
17. “Here’s Donald Trump’s Presidential Announcement Speech,” June 16, 2015, time.com/3923128/donald-trump-announcement-speech (accessed on June 24, 2016); “Trump calls NAFTA a ‘disaster,’” September 25, 2015, www.cbsnews.com/videos/trump-calls-nafta-a-disaster (accessed on June 27, 2016). See also Trump’s trade policy speech in Monessen, Pennsylvania, June 28, 2016, www.youtube.com/watch?v=lMCVRu5m1ig (accessed on June 28, 2016), and his speech at the Republican National Convention on July 21, 2016, www.politico.com/story/2016/07/full-transcript-donald-trump-nomination-acceptance-speech-at-rnc-225974 (accessed on July 25, 2016).
18. Maggie Hoffman, “Donald Trump Says He Favors Big Tariffs on Chinese Exports,” New York Times, January 7, 2016, www.nytimes.com/politics/first-draft/2016/01/07/donald-trump-says-he-favors-big-tariffs-on-chinese-exports/?_r=0 ; audio: graphics8.nytimes.com/packages/audio/politics/011516trump/trump.mp3 (accessed on June 27, 2016).
19. “Reforming the U.S.-China Trade Relationship to Make America Great Again,” www.donaldjtrump.com/positions/us-china-trade-reform (accessed on June 24, 2016).
20. One of his advisors, economist Peter Navarro, described the 45 percent figure as “perfectly calculated.” See “Trump’s 45% Tariff on Chinese Goods Is Perfectly Calculated,” Los Angeles Times, July 21, 2016, www.latimes.com/opinion/op-ed/la-oe-navarro-trump-trade-china-tariffs-20160721-snap-story.html (accessed on August 21, 2016).

25
With regard to FTAs, one of Trump’s foreign policy advisors, Walid Phares, has expanded on Trump’s willingness to abrogate NAFTA, indicating that if elected Trump might want to “go back to ground zero” on all existing FTAs.21 Trump has decried KORUS (which became law in 2012 after negotiations by the Bush 43 and Obama administrations) as a “job-killing deal” that destroyed 100,000 American jobs.22
Rules designed to frustrate attempts to reopen trade agreements once they have entered into force re-quire that any party seeking to renegotiate must give the other party or parties 180-day notice of withdrawal. Under US law, the president has the power to make that declaration, and Trump has said he will do so.23 At that point, a new agreement could be negotiated. During the 180-day notification period, the parties could hold “consultations” (effectively renegotiating the existing agreement), but at the end of the 180-day notification period, the agreement would expire unless replaced by a new one.
Even if a new agreement were reached, it would still have to be ratified by the relevant national legis-latures. If undertaken under trade promotion authority (“fast-track”) procedures, as authorized by the US Congress, the implementing legislation for the new agreement would be subject to a simple up or down vote without amendment. If fast-track did not apply, amendment would be possible, imperiling acceptance by the other parties. Even under fast-track, the period between the conclusion of FTA negotiations and vote in the US Congress has lengthened steadily (it took the Congress more than four years to act on KORUS24). The risk of dissolution of some if not all of these pacts is therefore serious.
One reason why withdrawing from an FTA like KORUS is dangerous lies in the fact that absent an agreement, US and Korean tariffs would snap back to previously negotiated levels under regular most-favored-nation (MFN) provisions of the countries’ respective trade laws. Currently, Korean average applied tariffs, weighted according to various sectors, are 8 percent. US tariffs are just 2.2 percent.
Withdrawal from the WTO would lead to the unraveling of all tariff negotiations and the reversion of rates to the MFN level of any preexisting agreement, conceivably all the way back to the Smoot-Hawley rates that were in effect in 1934 when the Reciprocal Trade Agreements Act launched the series of negoti-ated tariff reductions that brought rates to their current levels over the past 82 years. Within a short period, US exporters could face not MFN-level tariffs, as in the example above, but higher non-MFN tariffs last seen during the Great Depression, not only in Korea or Mexico but in other major trade partners as well.
21. “Renegotiation of KORUS FTA May Dent Alliance: Seoul Officials,” Yonhap, May 16, 2016, english.yonhapnews.co.kr/national/2016/05/16/11/0301000000AEN20160516004700320F.html (accessed on June 28, 2016).
22. See Trump’s trade policy speech in Monessen, Pennsylvania, June 28, 2016, www.youtube.com/watch?v=lMCVRu5m1ig (accessed on June 28, 2016). Trump also singled out KORUS in his nomination acceptance speech at the Republican National Convention, July 21, 2016, www.politico.com/story/2016/07/full-transcript-donald-trump-nomination-acceptance-speech-at-rnc-225974 (accessed on July 25, 2016).
23. Trump’s trade policy speech in Monessen, Pennsylvania, June 28, 2016, www.youtube.com/watch?v=lMCVRu5m1ig (accessed on June 28, 2016).
24. The United States and Korea signed KORUS in April 2007. Congress ratified the agreement in October 2011, and the Korean National Assembly ratified it in November 2011. It went into effect in March 2012, nearly five years after it was signed.

26
MODELING THE IMPACT OF TRUMP’S TRADE POLICIES
To measure the economic impact on the United States of Trump’s proposed trade policies this analysis starts with simulations from a model developed by Moody’s Analytics (Zandi et al. 2016).25 This large, traditional, multiequation, econometrically estimated macroeconomic model examines different scenarios of short- to medium-term changes in GDP, employment, private consumption, investment, government demand, imports, and exports resulting from macroeconomic shocks, such as a drastic rise in trade barri-ers.26 Macro models incorporate a range of financial variables (including interest rates, exchange rates, and inflation) that affect expectations and investment. The Moody’s model, like other macro models, is demand driven, in that it allows for the possibility of unemployment, with declines in aggregate demand leading to declines in production. These real employment effects are transitory; the economy is assumed to adjust to these demand shocks over time and gradually return to a long-run growth path toward full employment—a transition that can take more than five years.27
Extending the Moody’s model, we break down the macroeconomic impact caused by trade disruptions into sectoral and state- and county-level effects, using a model organized in a social accounting matrix, and examine three “what if” scenarios:28
In the full trade war scenario, the United States imposes a 45 percent tariff on nonoil imports from China and a 35 percent tariff on nonoil imports from Mexico. China and Mexico respond symmetri-cally, imposing the same tariffs on US exports.
In the asymmetric trade war scenario, China and Mexico do not retaliate symmetrically with an across-the-board tariff. China retaliates on specific US goods and services. With the dissolution of NAFTA, Mexican tariffs on all US goods would snap back to their MFN levels, which currently average about 8 percent. The modeling in this scenario is not contingent on the Moody’s macro model or the impo-sition by the United States of across-the-board tariffs of a specific level on China and Mexico.
In the aborted trade war scenario, US tariffs are imposed for only a single year, because China and Mexico concede to US demands, the US Congress overturns the action, or President Trump loses in the courts, or the public outcry is such that the administration is forced to stand down.29
This discussion does not consider the possibilities of abrogating existing FTAs or withdrawing from the WTO, which are difficult to specify and model within the framework at hand. The results are therefore conservative, because they do not include the panoply of trade actions candidate Trump has mentioned.
25. The results of the simulations of the Moody’s model are similar to those obtained from a large-scale proprietary macro model run by another private forecaster, Oxford Economics, and therefore can be interpreted as representative of the results yielded by this class of models. The Oxford Economics study is available via subscription at www.oxfordeconomics.com/my-oxford/publications/343414.
26. The Moody’s model contains more than 1,800 variables. See Zandi and Hoyt (2015) for summary documentation.
27. Not everyone who loses a job in these trade war scenarios will find comparable employment.
28. These scenarios are based on unpublished runs provided by Moody’s that isolate the trade policy effects. They do not incorporate the impact of policy changes such as changes to the tax code or the deportation of undocumented migrants, which are accounted for in Moody’s published work.
29. Candidate Trump is comfortable with this kind of language, having remarked at a May 2016 event, “Trade war? Who the hell cares about a trade war?” www.youtube.com/watch?v=WB9PIfsvszI (accessed on July 15, 2016).

27
Figure 2.2 shows US GDP under the baseline, full trade war, and aborted trade war scenarios. In the full trade war scenario, the imposition of tariffs on China and Mexico (and their retaliation in kind) amounts to a tax on trade, discouraging both exports and imports and contributing to a long-term decline in efficiency. Rising import prices spark an uptick in inflation, and the Federal Reserve raises interest rates according to a standard reaction function that measures how the Fed changes interest rates in response to changing macroeconomic circumstances.30 The stock market declines, and uncertainty increases, as measured by the Chicago Board Options Exchange (CBOE) volatility index (VIX). Wider credit spreads and a higher cost of debt and equity capital depress investment, pushing the economy into recession in 2019. Eventually, trade is diverted to other markets (the United States begins sourcing imports from alternative suppliers and sending exports to other countries), price rises are moderated, and the economy begins to converge back to the baseline growth path. Investment is the most strongly affected macroaggregate; its suppression leads to declines in output and employment across many sectors (table 2.1).
This macroeconomic narrative generates a recession even without the supply chain and other microeco-nomic effects of Trump’s proposed policies, which could be profound. The impact of an aborted trade war, which involves a unilateral and temporary imposition of tariffs, is considerably milder.31
30. One might argue that in a world in which central banks are facing a zero lower bound and engaging in quantitative easing, the Fed’s response to an uptick in inflation would not be as forceful as historically has been the case.
31. In the short run, changes in tax policy could offset these contractionary impacts. We do not explicitly consider
16.0
16.5
17.0
17.5
18.0
18.5
19.0
19.5
20.0
20.5
21.0
2015 2016 2017 2018 2019 2020 2021 2022 2023 2024 2025 2026
trillions of 2009 US dollars
BaselineFull trade warAborted trade war
Figure 2.2 Projected US GDP under baseline, full trade war, and aborted trade war scenarios, 2015–26
Source: Authors’ calculations.
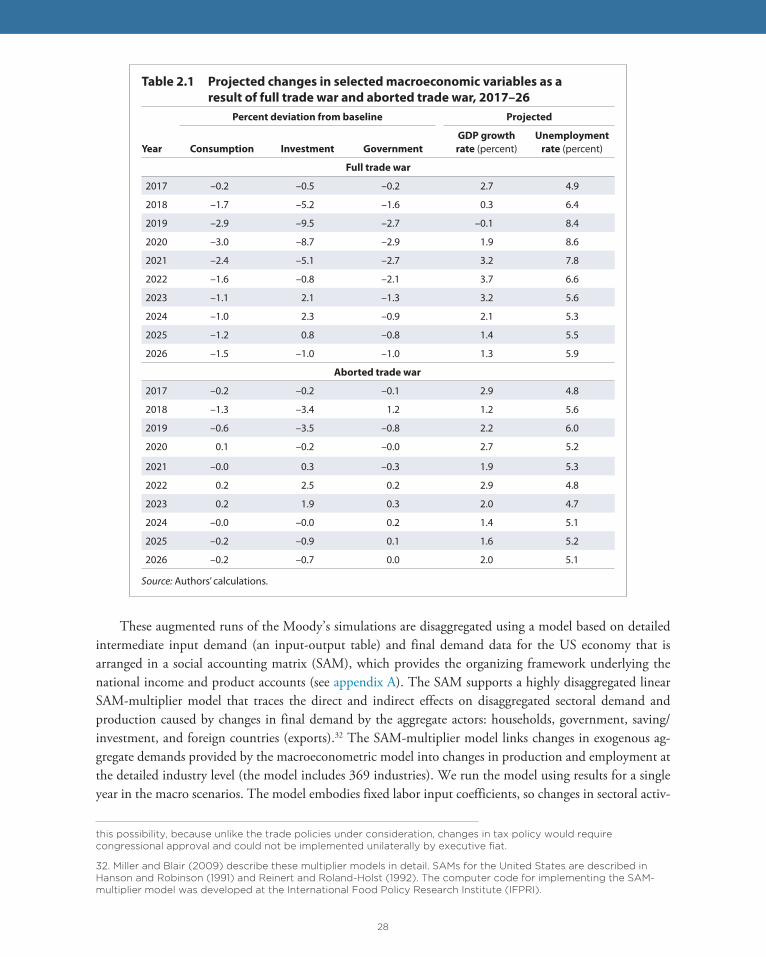
28
These augmented runs of the Moody’s simulations are disaggregated using a model based on detailed intermediate input demand (an input-output table) and final demand data for the US economy that is arranged in a social accounting matrix (SAM), which provides the organizing framework underlying the national income and product accounts (see appendix A). The SAM supports a highly disaggregated linear SAM-multiplier model that traces the direct and indirect effects on disaggregated sectoral demand and production caused by changes in final demand by the aggregate actors: households, government, saving/investment, and foreign countries (exports).32 The SAM-multiplier model links changes in exogenous ag-gregate demands provided by the macroeconometric model into changes in production and employment at the detailed industry level (the model includes 369 industries). We run the model using results for a single year in the macro scenarios. The model embodies fixed labor input coefficients, so changes in sectoral activ-
this possibility, because unlike the trade policies under consideration, changes in tax policy would require congressional approval and could not be implemented unilaterally by executive fiat.
32. Miller and Blair (2009) describe these multiplier models in detail. SAMs for the United States are described in Hanson and Robinson (1991) and Reinert and Roland-Holst (1992). The computer code for implementing the SAM-multiplier model was developed at the International Food Policy Research Institute (IFPRI).
Table 2.1 Projected changes in selected macroeconomic variables as a
result of full trade war and aborted trade war, 2017–26
Percent deviation from baseline Projected
Year Consumption Investment Government
GDP growth
rate (percent)Unemployment
rate (percent)
Full trade war
2017 –0.2 –0.5 –0.2 2.7 4.9
2018 –1.7 –5.2 –1.6 0.3 6.4
2019 –2.9 –9.5 –2.7 –0.1 8.4
2020 –3.0 –8.7 –2.9 1.9 8.6
2021 –2.4 –5.1 –2.7 3.2 7.8
2022 –1.6 –0.8 –2.1 3.7 6.6
2023 –1.1 2.1 –1.3 3.2 5.6
2024 –1.0 2.3 –0.9 2.1 5.3
2025 –1.2 0.8 –0.8 1.4 5.5
2026 –1.5 –1.0 –1.0 1.3 5.9
Aborted trade war
2017 –0.2 –0.2 –0.1 2.9 4.8
2018 –1.3 –3.4 1.2 1.2 5.6
2019 –0.6 –3.5 –0.8 2.2 6.0
2020 0.1 –0.2 –0.0 2.7 5.2
2021 –0.0 0.3 –0.3 1.9 5.3
2022 0.2 2.5 0.2 2.9 4.8
2023 0.2 1.9 0.3 2.0 4.7
2024 –0.0 –0.0 0.2 1.4 5.1
2025 –0.2 –0.9 0.1 1.6 5.2
2026 –0.2 –0.7 0.0 2.0 5.1
Source: Authors’ calculations.

29
ity levels will be mirrored in changes in sectoral employment. For this reason, in the subsequent discussion, the results are stated in terms of changes in employment. For more detailed information, see appendix A.
The results are further broken down using state- and county-level industry employment data that sup-port disaggregation of the national SAM-multiplier model. The national model has enough sectoral detail so that we can identify state and county employment in those industries, especially for product-specific retaliation scenarios where the direct employment shocks are concentrated in only a few states and coun-ties. The model also accounts for indirect losses in industries that serve households and supply intermediate inputs within affected regions. The bulk of these associated effects falls within a catchment area formed by the directly affected county and neighboring areas. Falling demand for aerospace products, for example, af-fects regions with industries that produce airplane parts and sectors that serve households that work in such industries. Large shocks reverberate across the economy, but establishments in areas more closely integrated to epicenters of economic shocks suffer larger losses.
The model tracks changes in export demand to changes in production and employment. However, it does not consider how exports are moved from place of production to the country of destination. The contemplated trade policies target two specific partners (China and Mexico) but the model does not capture geographic-specific impacts associated with particular bilateral trade flows. For example, a trade war with China would disproportionately impact the port of Long Beach, CA, while a trade war with Mexico would hit major transit points in California and Texas. For particular states and counties, these effects may be significant and would require more detailed analysis.
Three caveats should be noted. First, the role of global value or supply chains has expanded internation-al trade enormously in recent decades. Supply chains account for an estimated 80 percent of global trade, with computers, cars, and consumer electronics the most segmented industries (UNCTAD 2013). These chains are impossible to model, because only the firms involved in specific supplier relationships are aware of them (and potential alternatives). Only these firms know how they might react to the proposed policies; neither the model used here nor the Trump campaign can capture these highly nuanced relationships. It is likely that the model underestimates the disruption that would accompany the contemplated policies, because it is impossible to disaggregate the relationships to the necessary level of granularity.
Second, the model fails to capture a company’s ability to substitute production in its supply chain from one geographic location to another. Faced with high tariffs on products from Mexico or China, a firm would likely shift sourcing to other countries. With the possible exception of commodity markets, such a reallocation is likely to be difficult in the short run, however, particularly in cases of fixed plant-specific sup-plier relationships. In the longer run, companies would likely adjust, softening the effect of tariff increases. To estimate the impact of the proposed policy, one therefore has to characterize how easily and rapidly shifts in the sources of import supply can occur. Some of the underlying macro models used to create the consensus view impose a price wedge on imports sourced from other locations to capture the sand in the wheels of costless substitution.
The ubiquity of global supply chains would also have other impacts. Imposing high tariffs on Mexico or China could shut down some exporting industries in those countries. Some of that activity would return to the United States, as the Trump campaign has promised. But executives at several large multinational firms have indicated in private discussions with the authors of this study that most of that activity would be relo-cated to other foreign locations. Moreover, as one executive explained, shifting the fabrication of a product from Mexico to a third country would necessitate the shifting of other activities in the third country to yet

30
another country to make room for the shift from Mexico. The proposed policies could set off a daisy chain of production shifts. Such changes, many of them firm- and even product-line-specific, are clearly beyond the ability of existing models or the Trump campaign to predict.33
Third, in addition to the direct impact on trade policy, the uncertainty surrounding the potential im-pact of the trade disputes and renegotiations promised by Trump would harm the economy by reducing investment, particularly in trade-related activities. Investors are in the business of making irreversible bets on the future. If the future is uncertain, companies and households may postpone decisions that involve sunk costs. Evidence from previous episodes of uncertainty regarding trade relations suggests that the impact on investment is significant.34
RESULTS OF SCENARIO ANALYSIS
This section presents the quantitative results for three scenarios: a full trade war; a trade war in which China retaliates asymmetrically, initiating a “Buy No America” policy of halting purchases of specific products, such as aircraft, business services, and soybeans; and an aborted trade war that lasts one year.
Full Trade War
Together China and Mexico account for a quarter of US international trade in goods and services.35 In the full trade war scenario, employment in 2019, the trough of the recession, falls by nearly 4.8 million private sector jobs, more than 4 percent below baseline private sector employment.36 Sectors that produce capital goods are the most intensely affected, consistent with investment exhibiting the largest decline of any of the macro variables under this scenario (table 2.2). In percentage terms, high-speed drives and gear manufactur-ing (a multibillion dollar industry producing inputs used mainly in power transmission equipment) take the biggest hit, with a 10.2 percent employment decline. The damage is not limited to capital goods sectors. Iron and other metallic ore mining and aluminum production are also among the most intensely affected sectors.
In absolute terms, the largest job losses occur in nontrade service sectors, such as wholesale and retail distribution and sales, restaurants, and health care (see table 2.2).37 The trade shock is propagated to the nontrade sector because of the density of interindustry input-output relations embodied in the SAM. A
33. To understand why the disruption would likely be greater than indicated in the model, consider a US multinational firm with plants in Mexico and China that supply customized goods and services to the firm’s US plants. Without a feasible strategy for substituting for such inputs, the firm would have to continue to import the (higher-cost) goods and services from these plants for a considerable period, perhaps a year or two. Non-US multinationals that supply their US affiliates from plants in Mexico and China would be in the same position.
34. One example is Portugal’s entry into the European Union, which resolved ongoing uncertainty with respect to import tax exemptions that the European Union had been granting Portuguese firms provisionally before Portugal’s accession. Investment, entry into exporting, and exports all increased after Portugal entered the European Union, despite no change in the level of applied tariffs (Handley and Limao 2015). Another case might be of even more direct relevance: Handley and Limao (2013) find that the resolution of uncertainty associated with China’s entry into the WTO and the granting of permanent normal trade status increased China’s exports to the United States by 22–30 percent, contributing to a welfare gain for US consumers similar in magnitude to the US gain from new imported varieties for the period 1990–2001.
35. Department of Commerce, Bureau of Economic Analysis database.
36. Unlike the Moody’s Analytics simulations, we hold government sector activity constant. If the public sector were allowed to contract, the job losses would be even larger.
37. While health care is largely provided by the private sector, a portion is funded through the public sector and as a consequence the hospitals and clinics sector might not contract to the degree predicted by the model. A similar caveat would apply with respect to physicians’ offices.

31
trade shock could force the closure of a local factory serving the export market or a local plant that relies on imported inputs (the price of which is now much higher). The fall in employment and income ripples through the community, depressing demand for cars, home improvements, restaurant meals, and purchases of nonessential goods at the local mall. Establishments providing those goods and services cut hours or lay off employees, causing millions of people whose jobs are not associated with international trade to lose their jobs. The devastating effect on nonbusiness services sectors would inflict disproportionate hardship on low-skill, low-income workers. The sectoral distribution of the employment impact is largely similar (though the magnitudes are smaller) under the aborted trade war scenario.
Map 2.1 displays employment impact by state. Washington State is the worst affected, with 5 percent private sector job loss, followed by California, Massachusetts, and Michigan in the 4.5–5 percent range. A broad swath of states that includes Connecticut, Illinois, Indiana, Kentucky, Maryland, Minnesota, New Hampshire, New Mexico, New York, North Carolina, Ohio, Pennsylvania, Rhode Island, Texas, Wiscon-sin, and Utah experience private sector employment declines of more than 4 percent.38
Map 2.2 shows the worst-affected counties (with the caveat that the model does not capture the dis-proportionate impact a trade war with China and Mexico would have on locales that intermediate that
38. The impacts on California and Texas are probably underestimated and the impact on some northeastern states probably overestimated because of the model’s inability to capture the geographically specific nature of trade with China and Mexico.
Table 2.2 Sectors projected to be worst-affected by full trade war
Rank Sector
Percent of
jobs lost Rank Sector
Number of
jobs lost
1 High-speed drives and gear manufacturing
10.2 1 Nonspecified retail trade 311,000
2 Construction equipment manufacturing
10 2 Wholesale trade 257,000
2 Iron and other metal ore mining
10 3 Hospitals 192,000
4 Semiconductor equipment manufacturing
9.7 4 Full-service restaurants 182,000
5 Other metalwork manufacturing
9.6 5 Limited-service restaurants 158,000
5 Fluid power equipment manufacturing
9.6 6 Employment services 155,000
5 Plastics equipment manufacturing
9.6 7 General merchandise stores 134,000
8 Turbine manufacturing 9.5 8 Food and beverage stores 119,000
8 Truck trailer manufacturing 9.5 9 Management of companies and enterprises
101,000
10 Compressor manufacturing 9.4 10 Physicians’ offices 91,000
10 Industrial furnace and oven manufacturing
9.4
10 Aluminum production 9.4
10 Power, transmission, and transformer equipment manufacturing
9.4
Source: Authors’ calculations.

324—GRAPHICS-Trade
Map
2.1
P
erce
ntag
e pr
ivat
e se
ctor
job
loss
by
US
stat
e un
der f
ull t
rade
war
sce
nari
o
<3.
5%
3.5
–3.9
%
4.0
–4.4
9%
4.5
–4.9
%
5.0
%>

335—GRAPHICS-Trade
Map
2.2
M
ost-
affec
ted
US
coun
ties
Hig
h pe
rcen
tage
job
loss
(fu
ll tr
ade
war
sce
nario
)
Hig
h jo
b lo
ss, b
usin
ess
serv
ices
sec
tor
(asy
mm
etric
trad
e w
ar s
cena
rio)
Hig
h ab
solu
te jo
b lo
ss
(full
trad
e w
ar s
cena
rio)
Hig
h jo
b lo
ss, s
oybe
ans
sect
or
(asy
mm
etric
trad
e w
ar s
cena
rio)
Not
e: C
ount
ies
in re
d ar
e de
fined
as
thos
e in
the
top
25 c
ount
ies
with
hig
hest
per
cent
age
job
loss
in th
e fu
ll tr
ade
war
sce
nario
. Cou
ntie
s in
bla
ck a
re
defin
ed a
s th
ose
with
in th
e to
p 25
cou
ntie
s w
ith th
e gr
eate
st a
bsol
ute
job
loss
in th
e fu
ll tr
ade
war
sce
nario
. For
aer
ospa
ce (b
lue)
, bus
ines
s se
rvic
es
(pur
ple)
, and
soy
bean
(gre
en) s
ecto
rs, c
ount
ies
with
hig
h jo
b lo
ss a
re d
efine
d as
thos
e th
at fa
ll w
ithin
the
inte
rsec
tion
of c
ount
ies
with
in th
e to
p 50
aff
ecte
d in
bot
h pe
rcen
tage
and
abs
olut
e te
rms
in th
e se
ctor
-spe
cific
asy
mm
etric
trad
e w
ar s
cena
rios.
Coun
ties
with
hig
h se
ctor
-spe
cific
and
eith
er
perc
enta
ge o
r abs
olut
e jo
b lo
ss (y
ello
w) f
all w
ithin
at l
east
one
sec
tor-
spec
ific
high
job
loss
str
atum
in th
e as
ymm
etric
trad
e w
ar s
cena
rio a
nd a
t lea
st
one
high
job
loss
str
atum
in th
e fu
ll tr
ade
war
sce
nario
. Als
o in
clud
ed in
yel
low
are
cou
ntie
s w
ith m
ultip
le s
ecto
r-sp
ecifi
c hi
gh jo
b lo
ss. S
anta
Cla
ra
coun
ty (C
alifo
rnia
) is
the
only
cou
nty
that
wou
ld e
xper
ienc
e bo
th h
igh
perc
enta
ge a
nd h
igh
abso
lute
job
loss
in th
e fu
ll tr
ade
war
sce
nario
. It w
ould
al
so s
uffer
hig
h jo
b lo
ss in
the
busi
ness
ser
vice
s se
ctor
in th
e as
ymm
etric
trad
e w
ar s
cena
rio. H
igh
job
loss
, aer
ospa
ce s
ecto
r (a
sym
met
ric tr
ade
war
sce
nario
)
Hig
h jo
b lo
ss in
spe
cific
sec
tor (
asym
met
ric tr
ade
war
sce
nario
) an
d ei
ther
per
cent
age
or a
bsol
ute
job
loss
(ful
l tra
de w
ar s
cena
rio)

34
trade, such as Long Beach, California and Laredo, Texas). Twenty-nine counties across America experience employment declines of 7 percent or more. In absolute terms, Los Angeles county in California is the worst affected (176,000 jobs), followed by Cook county, Illinois (Chicago) with 91,000 jobs and Harris county, Texas (Houston) with 89,000 jobs. Map 2.2 also depicts the 25 worst-affected counties on a percentage job loss basis, all of which exhibit job losses of 7 percent or more. They appear in all regions of the country, demonstrating the breadth of damage a full trade war could wreak.
Asymmetric Trade War
There is no reason to believe that Chinese or Mexican retaliation would be limited to the imposition of across-the-board tariffs, as envisioned in the first scenario. Because of its WTO obligations, China might employ less transparent punishments that are harder to challenge through the WTO. They could include the following:
China could bar state-owned enterprises from doing business with US firms, arguing that it is no longer complying with unfavorable WTO rulings in light of US violations of its WTO obligations. Such a “Buy No America” policy could affect electronic payment services (such as Visa, MasterCard, and American Express39) and financial information services and service providers (such as Bloomberg and Thomson Reuters).40 It could also affect business software firms and other service providers.
China could deny key components to supply chains, turning a 20th century “trade war” into a 21st century “supply chain war,” severely hampering the ability of US multinational firms to shift pro-curement of customized goods and services to alternative providers. Beijing has wielded this weapon before, when it banned the export of rare earths used in electronics to Japan following a fishing boat dispute in 2010. Such a ban directed at the United States would hurt US electronics firms. China would justify it as a suspension of its WTO obligations in the face of US perfidy.41
China could terminate its purchases of particular US products.
China could terminate (or threaten to terminate) its purchases of US government bonds or dump them or other US financial instruments. China holds more than $1 trillion in US Treasury securities and more than $2 trillion in US financial assets overall. It therefore has the capacity to roil US finan-cial markets.
China could renege on or slow implementation of existing agreements on copyright violations and pi-racy of intellectual property rights in audio-visual materials, films, and pharmaceuticals, for example.42 The US-China WTO dispute over films would be an obvious target.43
39. China—Certain Measures Affecting Electronic Payment Services, Dispute 413, www.wto.org/english/tratop_e/dispu_e/cases_e/ds413_e.htm.
40. China—Measures Affecting Financial Information Services and Foreign Financial Information Suppliers, Dispute 373, www.wto.org/english/tratop_e/dispu_e/cases_e/ds373_e.htm.
41. On rare earths, see www.wto.org/english/tratop_e/dispu_e/cases_e/ds431_e.htm. For other WTO cases relating to Chinese export restrictions on raw materials, see www.wto.org/english/tratop_e/dispu_e/cases_e/ds509_e.htm and www.wto.org/english/tratop_e/dispu_e/cases_e/ds394_e.htm.
42. China—Measures Affecting the Protection and Enforcement of Intellectual Property Rights, Dispute 362, www.wto.org/english/tratop_e/dispu_e/cases_e/ds362_e.htm.
43. China—Measures Affecting Trading Rights and Distribution Services for Certain Publications and Audiovisual Entertainment Products, Dispute 363, www.wto.org/english/tratop_e/dispu_e/cases_e/ds363_e.htm.

35
Three retaliation possibilities by China are examined: ending imports of US aircraft; reducing the pur-chase of US business services, such as enterprise software and financial services, by state-owned enterprises; and ending imports of US soybeans.
Ending Chinese Imports of US Aircraft
In the manufacturing sector, aircraft would be a natural candidate for retaliation. China reportedly ac-counts for a significant share of Boeing’s order book, and Airbus presents a credible alternative to Boeing.44 US aircraft production is located in a few dozen locations, where the impact of trade retaliation would be concentrated.
Chinese termination of aircraft purchases could destroy 179,000 US jobs. The Seattle-Tacoma-Everett, Washington (King-Pierce-Snohomish counties), and Wichita, Kansas metropolitan areas (Sedgwick and Butler counties) are the worst affected (see map 2.2). Wichita, home to Spirit AeroSystems (Boeing), Air-bus, Bombardier Learjet, Cessna, Beechcraft, and others, could lose 14,000 jobs, or more than 6 percent of total private sector employment. The Seattle metropolitan area, the historic center of the Boeing produc-tion network, could lose more than 31,000 jobs, or more than 2 percent of regional private sector employ-ment. Snohomish county (Everett) could lose more than 4 percent. Other highly affected areas include the Hartford, Connecticut metropolitan area (Hartford and Middlesex counties), where aircraft engine maker Pratt-Whitney has extensive operations.45 It should be noted that the trade data distinguish between civil-ian and military sales, but the county-level production data do not. Inclusion of military production in the county-level activity matrix could change the geographical incidence—but not the numerical magnitude—of the 179,000 jobs lost. This consideration might be particularly salient with respect to Los Angeles county in California, which according to the model, would lose 14,000 jobs. This figure might be an overestimate given the prominence of military-related production in Southern California.
Ending the Purchase of US Business Services by State-Owned Enterprises in China
China could retaliate in a way that is less subject to a WTO challenge and more respectable in diplomatic circles by directing its state-owned enterprises (SOEs) to stop buying American. A variety of metrics—share of assets in the industrial sector, share of employment in business services—suggest that Chinese SOEs may account for approximately 40 percent of Chinese demand for US business service imports. (Apart from SOEs, the Chinese government might also influence managements of other businesses connected to the Chinese Communist Party.) In the example used in map 2.2, China reduces purchases of US business services. This action costs 85,000 US jobs, which are more dispersed than in the aircraft case. Los Angeles county is the worst affected, losing more than 4,000 jobs (with another 1,500 lost in neighboring Orange county), followed by King county, Washington (Seattle), which loses nearly as many. (If China retaliated by halting both aircraft purchases and purchases of business services, King county could lose more than 23,000
44. Avi Salzman “Boeing Shares Could Lose Altitude,” Barron’s, May 23, 2016, 13–14, www.barrons.com/articles/boeing-shares-could-lose-altitude-1463803448.
45. The county-level activity matrix was constructed on the basis of 2013 levels. In 2011 Boeing opened a major facility in Charleston, South Carolina, which it expanded in 2014 (the plant now employs 4,000 people). If the activity matrix included the enlarged Boeing facility, Charleston might turn up on the list of most heavily affected localities as well. That said, it seems plausible that Seattle, Wichita, Los Angeles, and Hartford would bear the brunt of this form of retaliation.
36
jobs, or more than 2 percent of private sector employment.) Other highly affected areas would include New York City and counties in its suburbs in New York, New Jersey, and Connecticut; Cook county, Il-linois (Chicago); and Harris county, Texas (Houston). The Boston metropolitan area (Suffolk, Middlesex, and Norfolk counties) and California’s Silicon Valley region (Santa Clara, San Francisco, San Mateo, and Alameda counties) would also likely be affected, as would Maricopa county, Arizona (Phoenix) and Dallas county, Texas. Indeed, the worst-affected areas of map 2.2 (the areas marked in yellow) practically consti-tutes a map of America’s high-tech centers.
Ending Chinese Imports of US Soybeans
Soybeans are a vital US agricultural export.46 One might suppose that American soybean producers could find other markets were the Chinese market to shut down. But US-China bilateral trade in soybeans ac-counts for roughly one-quarter of the global market, which a Chinese embargo would disrupt, making a smooth reorientation of trade flows unlikely.47
In a possibly comparable case, the 1980 US grain embargo against the Soviet Union, imposed after the Soviet invasion in Afghanistan, disrupted trade patterns that year, but the effects were offset by the following year (USDA 1986). The figures reported here, which assume no short-run trade diversion, may therefore exaggerate the impact.
The soybeans case would affect a belt of rural counties in Mississippi, Missouri, Tennessee, and Ar-kansas. Twenty-one counties would experience job losses exceeding 10 percent of local employment, with Sharkey county, Mississippi (40 percent), Bolivar county, Mississippi (25 percent), and Mississippi county, Missouri (21 percent) suffering the greatest relative losses.48
Aborted Trade War
Two considerations could temper the full impact of the Trump trade policies as modeled. Trump might use his threats as a club to make a deal in which he settled for market access in the partner country “equivalent” to what the United States offers. He might also settle for a revalued exchange rate, to remove even the hint of currency manipulation.
More likely, the initial impact of the policies would be so disastrous that the Trump administration would have to quickly back down. The best analogy might be the situation immediately following Sep-tember 11, when the United States closed the border with Mexico, severing supply chains and forcing the shutdown of automobile assembly plants in the United States within a week. Anguish in Detroit forced a
46. Because the Bureau of Economic Analysis data do not separate soybeans into their own account, we model this retaliation as a shock to oilseeds (IO sector 1111A0). According to the US Department of Agriculture, soybeans account for about 90 percent of US oilseed production (www.ers.usda.gov/topics/crops/soybeans-oil-crops.aspx).
47. Data from the Food and Agriculture Organization show 106 million tons of exports in 2013. The largest single item is Brazilian exports to China (32 million tons), followed by US exports to China (25 million tons).
48. In addition to embargoing particular agricultural exports, China could retaliate in other ways. Smithfield Foods, which employs 50,000 people (mostly in the United States), is owned by a Chinese firm that is reportedly subject to management control by public agencies (see www.pbs.org/newshour/bb/whos-behind-chinese-takeover-worlds-biggest-pork-producer/). It is the largest pork processor in the world, operating facilities in 26 US states, including the world’s largest meat-processing plant, in Tar Heel, North Carolina. If the Chinese government, through its state-owned banks, was willing to absorb the losses, it could probably shut down the firm.

37
reconsideration of the policy. The immediate reaction to the contemplated Trump policy package could be even more dramatic. Possible outcomes could include the following:
Shutdowns of supply chain–dependent factories in the United States, with the impact concentrated among high-paying employers.
Turbulence in the financial market, as expected earnings from major US firms plummet as a result of loss of supplies, retaliatory tariffs, and the threatened or real sell-off of US stocks and bonds by China.
Shortages and price rises of consumer products. The iPhone could be China’s secret weapon in retali-ation. Chinese value added is estimated at less than 4 percent (OECD-WTO 2016, Xing 2014), so China’s self-inflicted losses would be minimal, but cutting off supplies to Apple could severely disrupt the availability and increase the price of a beloved consumer product. In light of the ubiquity of Apple stock in 401K plans, this action could adversely affect Americans’ retirement plans as well. Kakaes (2016) concludes it would be impossible to build an iPhone from scratch in the United States, because of the lack of domestic sources of rare earths. The marginal cost of manufacturing an iPhone from components that could be made in the United States after the relevant facilities were constructed here would be about $100 per phone. Moreover, with Chinese firms moving into the smartphone market, China could disrupt not only the production of iPhones but also supply the alternative mod-els. The collective howl of pain might induce even the most ardent protectionist to reconsider.
This scenario is in essence the aborted trade war. Relative to the baseline, private sector employment falls by 1.3 million jobs, or more than 1 percent. The real risk, however, is that the initial Trump admin-istration moves could set off an escalatory cycle of retaliation that could prove difficult or impossible to wind down once set in train.49 For both diplomatic and economic reasons, this possibility is probably more relevant for US relations with China than with Mexico.
CONCLUSIONS
The United States is at the cusp of a potential turning point; the next administration could reverse course on 80 years of movement toward freer trade and enhanced multilateral cooperation. The reason is politi-cal gridlock: Expansion of trade openness over the past two generations has not been accompanied by a strengthening of the safety net to cushion the blow or provide education and training opportunities for workers who lose their jobs because of trade, technology innovations, restructuring in their industries, or other factors. The result is an unpalatable choice between liberalization without support for adjustment or no liberalization at all.
Paradoxically, the congressional caucuses of the two main political parties appear to embody more ex-treme positions on trade than their constituents. Republican voters are more skeptical of trade agreements
49. In addition to the output and employment losses outlined above, consumers would suffer from higher prices and reduced choice. Trade protection tends to disproportionately affect lower-income households. Tuerk, Bachman, and Conte (2016) analyze a scenario in which the United States imposes a 45 percent tariff on goods imported from China and Japan (a country against which candidate Trump frequently fulminates) and a 35 percent tariff on goods imported from Mexico. They conclude that such a tariff scheme would amount to a $11,100 regressive consumption tax over five years for the typical American household, with the poorest decile paying up to 18 percent of its mean after-tax income. These figures may overstate the impact, because candidate Trump has not actually advocated a 45 percent tariff on Japan. The tariffs on China and Mexico, which he has called for, account for 84 percent of the total consumer losses in this analysis, however, so the impact on US consumers could be severe even without the tariff on Japanese goods.
38
than the Republican congressional caucus, and Democratic voters are more protrade than their elected representatives (Stokes 2016). These disjunctures suggest that it might be possible to rebuild a bipartisan pro-trade coalition by bringing Congressional Democrats closer to the views of their constituents, but doing so would likely be a protracted and uncertain process.
Hillary Clinton has a nondoctrinaire track record on trade issues. She supports strengthened enforce-ment of existing rules, increased efforts to deal with currency manipulation, and changes in the tax code that eliminate tax loopholes that are subject to abuse by US firms operating abroad. She, however, opposes TPP, the only major trade agreement currently under consideration, an agreement that has been estimated to yield huge benefits to the United States.
Donald Trump advocates policies that could potentially overturn the existing US-led rules-based inter-national trade system. He has promised to slap high tariffs on China and Mexico and reconsider or abrogate US participation in existing free trade agreements and even the WTO itself. The analysis presented here shows that the trade war these policies is likely to spark would send the US economy into a recession and cost millions of Americans their jobs. The most intensely hit sectors would be manufacturing and min-ing, but the largest job losses would be in sectors such as wholesale and retail distribution, restaurants, and temporary employment agencies. His policies place at risk the livelihoods of millions of Americans, most of whom probably do not think of their jobs as tied to international trade. The American casualties in this trade war would be drawn disproportionately from the ranks of lower-income and lower-skilled workers.
Depending on the international response, some localities could experience devastating job and income losses. These adversely affected regions include high-tech centers like Silicon Valley; business service hubs like Los Angeles and New York; manufacturing centers like Everett, Washington; and rural counties in states such as Arkansas, Mississippi, Missouri, and Tennessee.
The results presented in this analysis constitute a conservative assessment of the damage to the US economy that could result from some of the trade policies advocated by candidate Trump. Other policies he has proposed—such as withdrawing from the WTO—could be cataclysmic, undermining 80 years of US economic diplomacy and pushing the United States back into the Smoot-Hawley world of the Great De-pression. The opposition of both candidates to TPP is regrettable. But Trump’s casual invocation of “trade wars” is irresponsible and reckless, jeopardizing the livelihoods of millions of Americans.
REFERENCESAutor, David H., David Dorn, and Gordon H. Hanson. 2013. The China Syndrome: Local Labor Market Effects of Im-port Competition in the United States. American Economic Review 103, no. 6: 2121–68.
Bergsten, C. Fred. 2014. Addressing Currency Manipulation through Trade Agreements. PIIE Policy Brief 14-2. Wash-ington: Peterson Institute for International Economics. Available at piie.com/publications/pb/pb14-2.pdf.
Bergsten, C. Fred. 2016. Time for a Plaza II? In International Monetary Cooperation: Lessons from the Plaza Accord after Thirty Years, ed. C. Fred Bergsten and Russell A. Green. Washington: Peterson Institute for International Eco-nomics.
Bernard, Andrew, J. Bradford Jensen, Stephen Redding, and Peter Schott. 2007. Firms in International Trade. Journal of Economic Perspectives 21, no. 3: 105–30.
Francis, David. 2016. How Clinton Can Fall in Love with Free Trade All over Again. Foreign Policy, June 16.
Frankel, Jeffrey A., and David H. Romer. 1999. Does Trade Cause Growth? American Economic Review 89, no. 3: 379–99.
Handley, Kyle, and Nuno Limao. 2013. Policy Uncertainty, Trade and Welfare: Theory and Evidence for China and the US. NBER Working Paper 19376. Cambridge, MA: National Bureau of Economic Research.

39
Handley, Kyle, and Nuno Limao. 2015. Trade and Investment under Policy Uncertainty: Theory and Firm Evidence. American Economic Journal: Economic Policy 7, no. 4: 189–222.
Hanson, Kenneth, and Sherman Robinson. 1991. Data, Linkages, and Models: U.S. National Income and Product Ac-counts in the Framework of a Social Accounting Matrix. Economic Systems Research 3, no. 3: 215–32.
Hicks, Michael, and Srikant Devaraj. 2015. The Myth and the Reality of Manufacturing in America. Muncie, IN: Center for Business and Economic Research, Ball State University.
Irwin, Douglas. 2016. What Critics Get Wrong About the Global Economy. Foreign Affairs (July/August). Washing-ton: Council on Foreign Relations.
Kakaes, Konstantin. 2016. The All-American iPhone. MIT Technology Review, June 9.
Kletzer, Lori, and Robert Litan. 2001. A Prescription to Relieve Worker Anxiety. Policy Brief 01-2. Washington: Insti-tute for International Economics and the Brookings Institution. Available at piie.com/publications/policy-briefs/prescription-relieve-worker-anxiety.
Lawrence, Robert Z. 2016. Postscript: The Risks of Non-Implementation. Postscript to Bergsten et al. In Assessing the Trans-Pacific Partnership. Vol. 2: Innovations in Trading Rules. Briefing 16-4. Washington: Peterson Institute for International Economics.
Miller, Ronald E., and Peter D. Blair. 2009. Input-Output Analysis: Foundations and Extensions, 2nd ed. Cambridge: Cambridge University Press.
OECD-WTO (Organization for Economic Cooperation and Development and World Trade Organization). 2016. Trade in Value Added Database. Available at http://stats.oecd.org and www.wto.org/miwi.
Petri, Peter and Michael Plummer. 2016. The Economic Effects of the TPP: New Estimates. In Assessing the Trans-Pacific Partnership, Volume 1: Market Access and Sectoral Issues. Washington: Peterson Institute for International Economics.
Reinert, Kenneth, and David W. Roland-Holst. 1992. A Detailed Social Accounting Matrix for the USA, 1988. Economic Systems Research 4: 173–84.
Stokes, Bruce. 2016. Trade and the American Electorate (June 22). Washington: Pew Research Center.
Tuerck, David, Paul Bachman, and Frank Conte. 2016. The Trump Tariffs: A Bad Deal for Americans. National Founda-tion for American Policy (NFAP) Policy Brief. Available at nfap.com/wp-content/uploads/2016/05/Impact-of-the-Trump-Tariffs.NFAP-Policy-Brief.May-20161.pdf.
UNCTAD (United Nations Conference on Trade and Development). 2013. Global Value Chains and Development: Investment and Value Added Trade in the Global Economy. Geneva.
USDA (United States Department of Agriculture). 1986. Embargoes, Surplus Disposal, and US Agriculture: A Sum-mary. Agriculture Information Bulletin 503. Washington: Economic Research Service.
Xing, Yuqing. 2014. Measuring Value Added in the People’s Republic of China’s Exports: A Direct Approach. ADBI Working Paper 493. Tokyo: Asian Development Bank Institute. Available at www.adb.org/publications/measuring-value-added-peoples-republic-chinas-exports-direct-approach.
Zandi, Mark, and Scott Hoyt. 2015. U.S. Macro Model Methodology. Moody’s Analytics. Available at www.economy.com/home/products/samples/macromodel.pdf.
Zandi, Mark, Chris Lafakis, Dan White, and Adam Ozimek. 2016. The Macroeconomic Consequences of Mr. Trump’s Economic Policies. Moody’s Analytics. Available at www.economy.com/mark-zandi/documents/2016-06-17-Trumps-Economic-Policies.pdf.

40
CHAPTER 3
A Diminished Leadership Role for the United StatesMarcus Noland
The impact of the trade policies advocated by Hillary Clinton and Donald Trump would extend beyond losses of US income and employment examined in the previous chapter. Both Clinton and Trump oppose the Trans-Pacific Partnership (TPP). All countries in Asia are carefully weighing the relative power and influence of China and the United States, and for the United States not to follow through on a major free trade agreement (FTA) that it initiated and pushed hard will be taken as a major indication of declining US interest and power in the region. Failure to ratify TPP would cede to China the lead in setting trade rules in the critical Asia-Pacific region. Lee Hsien Loong, the prime minister of Singapore (which already has an FTA with the United States and hence is not dependent on TPP to gain duty-free access to the US market), has observed: “An American failure to ratify TPP would bring about the very thing critics of trade deals complain about: a more empowered China and bad terms for US goods and services.” According to New Zealand’s prime minister, John Key, if the United States “abdicates leadership in the region, that role will get filled. It has to. In the end, these economies are not going to stand still.”1 The most likely candidate for filling that gap would be China.2
It is not just foreigners who have made this connection: The House Republican Task Force on National Security published a report on June 9, which noted, “By delaying the development of strong trade deals, we give our competitors time to undermine the global system of trade that the United States has worked so hard to build. Countries like China and Russia are creating their own closed trading systems.”3 Chinese ascen-dancy in trade policy making would likely be accompanied by enhanced influence in other areas requiring
1. David Ignatius, “President Trump Would Hand China the World,” Washington Post, May 31, 2016.
2. China would also benefit at US expense from other, noneconomic, components of Trump’s platform, such as the demonization of Muslims and the resulting deterioration of relations with Muslim-majority countries in the Middle East, Africa, and Asia.
3. A Better Way: Our Vision for a Confident America, House Republican Task Force on National Security, June 9, 2016, www.politico.com/f/?id=00000155-34cd-d270-ab57-f6cd1a190000 (accessed on July 5, 2016).
Marcus Noland is executive vice president and director of studies at the Peterson Institute for International Economics. He thanks Dennis Blair for helpful comments.

41
international coordination as well. The long-term costs of the United States abdicating its traditional role in rule-setting in a globalized world are likely to greatly exceed the narrow calculation of costs and benefits of the TPP agreement.
The United States is a force for stability. Weakening US influence courts disaster. A refusal to cooperate with Asian and Pacific trading partners wary of Chinese aspirations would feed perceptions of US unreliabil-ity and wavering commitment to—or, even worse, disengagement from—the region. Asian countries would likely react with gradual accommodation to China on economic issues, first, followed by accommodation on security issues as China’s economic influence grows at the expense of American economic influence and China’s military buildup continues. The consequences would be unpredictable and harmful. Initial indica-tors might be “tilts” toward China along the lines exhibited by the Japanese government when led by the Democratic Party of Japan nine years ago, or more recently in the diplomatic shifts of the Duterte govern-ment in the Philippines.
The risks associated with this trajectory could be considerable. Asia is full of rich, technologically ad-vanced states—but it is also replete with unresolved historical enmities and internal political quagmires that could tempt leaders to “wave the bloody shirt” to mobilize and maintain domestic political support. The region is in the midst of a quiet arms race: According to data from the widely respected Stockholm Inter-national Peace Research Institute, between 2010 and 2014, 9 of the top 20 arms-importing countries were in Asia.4 Multiple flash points—the Korean peninsula, the South China Sea (the Spratly Islands), the Tai-wan Strait, the East China Sea (the Senkaku Islands)—could trigger hostilities. As the report of the House Republican Task Force on National Security concludes, “In East Asia, our allies are desperate for a greater American role. Our top priority must be to counter the threat of a nuclear North Korea. And we must re-spond strategically to expansionist China’s rise, including checking its territorial ambitions. These challeng-es create opportunities to bring together Japan and South Korea while strengthening our ties with Taiwan and the Philippines. We cannot allow our alliances in East Asia and the Pacific to atrophy and must shore up our defense arrangements to deter China from tilting the global balance of power toward autocracy.”5
Withdrawal of support for TPP is bad enough, but the ramifications of Trump’s trade policies go much farther, threatening to inflame relations with China and disrupt existing alliances with free trade partners, including South Korea, Singapore, a critical partner in Southeast Asia, and longtime ally Australia. An un-named senior Korean official was quoted in Yonhap, the country’s official press agency, as indicating that abrogation of the Korea-US (KORUS) FTA would be tantamount to ending the bilateral security treaty.6 Admittedly, there may be some brinkmanship in the statement, but nevertheless a reduction in the US de-fense commitment to South Korea—real or perceived—could not only provoke aggressive action by North Korea, but also set off an unpredictable adjustment pattern in Seoul. The South Koreans could choose to
4. Chung Min Lee, “What Could Hold Rising Asia Down,” Washington Post, May 23, 2016.
5. A Better Way: Our Vision for a Confident America, House Republican Task Force on National Security, June 9, 2016, p. 14, www.politico.com/f/?id=00000155-34cd-d270-ab57-f6cd1a190000 (accessed on July 5, 2016).
6. It is normal for Korean officials to speak to the press anonymously; doing so does not signal the same lack of official imprimatur as it might in the United States. See “Renegotiation of KORUS FTA May Dent Alliance: Seoul Officials,” Yonhap, May 16, 2016, english.yonhapnews.co.kr/national/2016/05/16/11/0301000000AEN20160516004700320F.html (accessed on July 5, 2016). The House Republican Task Force on National Security implicitly agrees, noting that “trade can also play a key role in strengthening US alliances” (p. 15).
42
ally with another country (China would be one possibility) or develop an independent nuclear weapons capacity (a possibility that candidate Trump has commented upon favorably).7
A shift by South Korea away from its longtime military alliance with the United States, combined with perceptions of a reduced US commitment to preserving the security of Northeast Asia generally, could shake up the US alliance with Japan as well. Japan might then ally with another country (joining the China band-wagon, for example) or try to adopt a nonaligned or neutral stance (becoming the Switzerland or Finland of Asia) while engaging in conventional remilitarization or, in the worst case, even acquire nuclear weapons rather than relying on the US nuclear umbrella for its security—a development that Trump has also com-mented on favorably.8 A Japanese remilitarization could speed North Korea’s nuclear weapons programs or even encourage South Korea to go nuclear.
BEYOND ASIA
Trump’s oft-repeated claims that the United States is paying for the defense of others and getting nothing in return are equally destabilizing. US defense expenditures of roughly 3 percent of GDP are higher than expenditures by its allies in Asia and Europe (O’Hanlon 2016), who do not pay for the full basing costs of US troops, as Trump observes. But the conclusion that Trump derives from this situation—that the United States could save money or otherwise benefit from withdrawing its troops—is incorrect. It costs more to station troops on the US mainland than to deploy them in Japan, for example. O’Hanlon (2016, 3) makes the additional point that “homeporting an aircraft carrier battle group in Japan obviates the need to have perhaps three more carrier battle groups in the US Navy’s overall fleet (at an investment cost approaching $50 billion) to sustain the same level of presence in the broader western Pacific region. US airfields in Ger-many facilitate deployments to the Middle East and Afghanistan; the alternative to such bases could well be a need for huge numbers of additional refueling aircraft.”
What Trump’s criticism fails to realize is that the current pattern of deployment of US forces is a largely cost-effective way of sustaining alliances, strengthening American security. To be sure, the United States might seek more support from its allies and/or reconfigure deployment to save costs, but dismantling this system and encouraging nuclear proliferation in Northeast Asia would make the United States less, not more, secure.
Abrogating FTAs could further harm US interests. In the volatile Middle East, the United States has concluded FTAs with moderate countries such as Israel, Jordan, Bahrain, Morocco, and Oman. The agree-ments foster growth in a region facing severe problems with youth unemployment—and radicalization. Moreover, the agreements contribute to the economic component of broader strategic partnerships, includ-ing cooperation on anti-terrorism efforts and, in some cases, US military basing rights (Noland and Pack 2011).
7. “Full Rush Transcript: Donald Trump, CNN Milwaukee Republican Presidential Town Hall,” CNN, March 29, 2016, http://cnnpressroom.blogs.cnn.com/2016/03/29/full-rush-transcript-donald-trump-cnn-milwaukee-republican-presidential-town-hall/; “Transcript: Donald Trump Expounds on His Foreign Policy Views,” New York Times, March 26, 2016, www.nytimes.com/2016/03/27/us/politics/donald-trump-transcript.html?_r=1; “Donald Trump fights to win over women; Reince Priebus on possibility of contested GOP convention,” rush transcript from Fox News Sunday, April 3, 2016, www.foxnews.com/transcript/2016/04/03/donald-trump-fights-to-win-over-women-reince-priebus-on-possibility-contested/.
8. Ibid.

43
Similarly, the United States maintains a number of FTAs with Latin American countries, including Chile, El Salvador, Guatemala, Honduras, Nicaragua, the Dominican Republic, Peru, Costa Rica, Panama, and Colombia. As with the United States’ Middle Eastern allies, the FTAs are a component of broader ar-rays of cooperation, and the abrogation of these agreements not only would be regarded as a diplomatic slap reigniting historical wariness of the United States, but because of the geographic proximity of some of these partners, the destabilization of their economies could quickly spill over to the United States, intensifying the incentives for migration and furtherance of illicit activities.
In this regard, the oldest and most important FTA that the United States has with a Latin American partner is the FTA with neighboring Mexico through the North American Free Trade Agreement (NAF-TA). Abrogating this agreement could damage the United States politically and even strategically as well as economically.
Traditionally, the United States had problematic relations with its southern neighbor. For much of its history, Mexico was a corrupt, semiauthoritarian country ruled by a dominant single political party. Start-ing in the 1980s, the country began a period of significant economic, social, and political reforms, and in 1991, initiated the negotiation of NAFTA with the United States and Canada. The agreement was signed the following year and went into force on January 1, 1994. NAFTA and Mexico’s 1994 accession to the Organization for Economic Cooperation and Development have acted as “external anchors” establishing international norms for Mexico’s reforms and encouraging the modernization of the country’s economic institutions. In 2000, for the first time since the revolution, an opposition party candidate was elected presi-dent, evidence of the further consolidation of Mexican democracy.
Contrary to the exaggerated claims of its critics, NAFTA has contributed to the fundamental reori-entation of 150 years of contentious relations between the United States and Mexico. The agreement has not only benefitted the United States and Mexico economically but has also contributed to the long-term political and social development of Mexico.9 While it would be wrong to give primary credit for all of Mexico’s advances in the last quarter-century to NAFTA, the agreement clearly played a role in reinforcing these developments. Mexico continues to face many challenges, including the drug trade and its associated violence. But it is hard to overstate the positive impact on Mexico and its stability that has flowed from a combination of accelerated development and closer political relations with the United States. Scrapping the trade agreement that paved the way for this success would reverse this progress. Trade sanctions would redouble incentives for illicit activity and illegal migration. The upshot is that abrogation of NAFTA could increase, not decrease, the flow of drugs and illegal migrants from Mexico to the United States. Today, il-legal migration from Mexico into the United States is at its lowest level in years, and net migration is nega-tive—more people are returning to Mexico than illegally entering the United States.10 Abandoning NAFTA could reverse this trend.
Lastly, it goes without saying that the United States takes for granted placid relations with its northern neighbor, Canada. The United States has maintained an FTA with Canada since 1989. Needless to say, reopening, much less abrogating, the agreement would be met with understandable consternation there.
9. The US International Trade Commission, which is normally conservative in its assessments, concluded that NAFTA improved economic welfare in the United States (USITC 2016).
10. Ana Gonzalez-Barrera, “More Mexicans Leaving Than Coming to the U.S.,” Pew Research Center, November 19, 2015, www.pewhispanic.org/2015/11/19/more-mexicans-leaving-than-coming-to-the-u-s/.

44
CONCLUSION
Both candidates oppose TPP. Failure of this agreement would not only harm the United States economi-cally, as documented in the preceding chapter, but also damage US strategic interests. A failure of TPP would encourage China to play a dominant role in the critical Asia-Pacific region in trade policymaking and other diplomatic spheres as well. Indeed, the failure of the agreement could call into question American reliability and commitment to the region and, in the context of a perceived security vacuum, could set off a dangerous set of developments in the military realm.
But as noted in the previous chapter, the proposals of Donald Trump go farther and threaten additional damage to US interests. While the precise terms of equitable burden sharing are debatable, Trump appears to misunderstand both the nature of US military basing agreements and their budgetary implications. His proposals could both cost the United States money and disrupt a system of alliances that leverages US power and influence.
Trump’s threats to abandon existing FTAs could further harm American interests, destabilizing mod-erate Arab states and, closer to home, partners in Latin America. The most prominent of these is Mexico, where the abrogation of NAFTA could be a blow to a quarter-century of Mexican progress in the economic, political, and social realms. The upshot is that the damage to the Mexican economy and society wreaked by the policies Trump advocates could encourage more illegal migration and more illicit activity—the opposite of what the Republican nominee seeks.
REFERENCESNoland, Marcus, and Howard Pack. 2011. The Arab Economies in a Changing World, 2nd ed. Washington: Peterson Institute for International Economics.
O’Hanlon, Michael E. 2016. The Art of the Military Deal. Foreign Policy in the US Presidential Debates, May 10. Wash-ington: Brookings Institution.
USITC (United States International Trade Commission). 2016. Economic Impact of Trade Agreements Implemented under Trade Authorities Procedures. Washington.

45
APPENDIX A
Disaggregation Methodology
FROM MACRO DEMAND TO INDUSTRY SUPPLY AND EMPLOYMENT
The Moody’s model examines various scenarios of changes in consumption, investment, government, and exports. These changes in demand aggregates are then translated into changes in supply and employment at a detailed sectoral level using a model based on detailed input-output and demand data for the US economy that are organized in a social accounting matrix (SAM). Figure A.1 provides a summary display of the ac-counts in our US SAM.
A SAM is a square matrix that displays the receipt and expenditure accounts of various economic actors. Each entry is a payment by a column account to a row account. Total expenditure by each actor must equal total receipts (by the rules of double-entry bookkeeping), so row totals must equal corresponding column totals).
The first two sets of accounts (industries and commodities) show production by sector and supply of commodities to demanders (the “supply” matrix). The “use” (input-output) matrix shows industries’ demand for intermediate inputs. The US SAM includes 389 producing industries and 389 commodities.
The SAM also includes accounts for households (private consumption), government, saving/invest-ment, and foreign trade (“world”), which is disaggregated by country of origin for imports and country of destination for exports. The SAM maps the circular flow of income from production to value added (pay-ments to labor and capital) to the distribution of income to households, government, and aggregate invest-ment and back to the demand for commodities.
The “institutional” accounts (the last four columns) provide the commodity demand side of the ac-counts. They provide the link between the macroeconometric model of aggregate demand by major catego-ries that correspond to these institutions and the detailed supply side of the economy.
The SAM supports a highly disaggregated linear multiplier model that traces the direct and indirect effects on disaggregated production and total demand caused by changes in final demand by the aggregate actors.1 We derive the coefficients (which are assumed to be fixed) by dividing each entry by its column to-tal. To link with the macro model, the SAM is partitioned between endogenous and exogenous accounts. In
1. Miller and Blair (2009) provide a comprehensive description of these multiplier models and the data on which they are based.
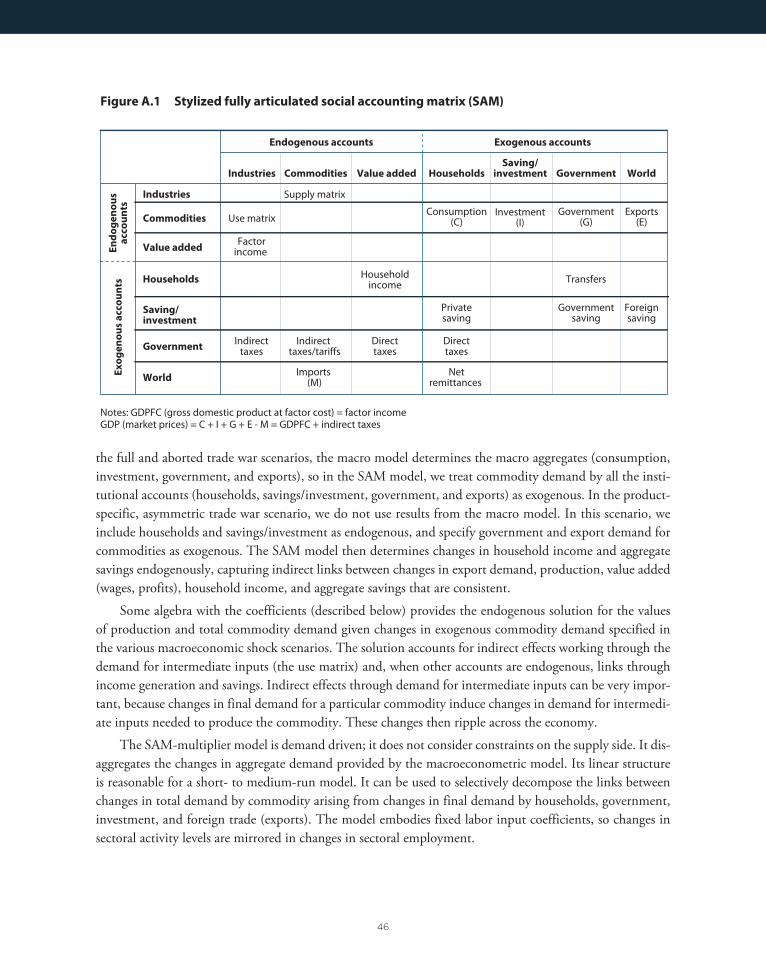
46
the full and aborted trade war scenarios, the macro model determines the macro aggregates (consumption, investment, government, and exports), so in the SAM model, we treat commodity demand by all the insti-tutional accounts (households, savings/investment, government, and exports) as exogenous. In the product-specific, asymmetric trade war scenario, we do not use results from the macro model. In this scenario, we include households and savings/investment as endogenous, and specify government and export demand for commodities as exogenous. The SAM model then determines changes in household income and aggregate savings endogenously, capturing indirect links between changes in export demand, production, value added (wages, profits), household income, and aggregate savings that are consistent.
Some algebra with the coefficients (described below) provides the endogenous solution for the values of production and total commodity demand given changes in exogenous commodity demand specified in the various macroeconomic shock scenarios. The solution accounts for indirect effects working through the demand for intermediate inputs (the use matrix) and, when other accounts are endogenous, links through income generation and savings. Indirect effects through demand for intermediate inputs can be very impor-tant, because changes in final demand for a particular commodity induce changes in demand for intermedi-ate inputs needed to produce the commodity. These changes then ripple across the economy.
The SAM-multiplier model is demand driven; it does not consider constraints on the supply side. It dis-aggregates the changes in aggregate demand provided by the macroeconometric model. Its linear structure is reasonable for a short- to medium-run model. It can be used to selectively decompose the links between changes in total demand by commodity arising from changes in final demand by households, government, investment, and foreign trade (exports). The model embodies fixed labor input coefficients, so changes in sectoral activity levels are mirrored in changes in sectoral employment.
Industries Commodities Value added HouseholdsSaving/
investment Government World
Industries Supply matrix
Commodities Use matrixConsumption
(C)Investment
(I)Government
(G)Exports
(E)
Value addedFactor
income
HouseholdsHousehold
income Transfers
Saving/investment
Privatesaving
Governmentsaving
Foreignsaving
GovernmentIndirect
taxesIndirect
taxes/tariffsDirecttaxes
Directtaxes
WorldImports
(M)Net
remittances
Figure A.1 Stylized fully articulated social accounting matrix (SAM)
Endogenous accounts Exogenous accounts
En
do
ge
no
us
ac
co
un
tsE
xo
ge
no
us
ac
co
un
ts
Notes: GDPFC (gross domestic product at factor cost) = factor incomeGDP (market prices) = C + I + G + E - M = GDPFC + indirect taxes

47
THE LINEAR MULTIPLIER MODEL
Moving from the SAM to a linear multiplier model requires a number of steps and assumptions. We first create a matrix of column coefficients, A(i, j), in which the columns sum to one and the sets i and j are identical and ordered identically. These coefficients are assumed to be constant. Given that all the columns of A sum to 1 and that row sums equal corresponding column sums in the SAM, then Ay = y, where y is a vector of account row/column sums of the SAM. We partition the A matrix and y vector into endogenous accounts i1 (or j1) and exogenous accounts i2 (or j2). The set i1 includes 389 industries and 389 commodi-ties (778 endogenous accounts). There are four exogenous macro accounts (C, I, G, E), with 13 countries of destination for exports. The SAM identity is written as follows:
y iA i j A i j y jy j y iA i j A i j
We then solve the model (solve for y1 in terms of y2):
A11 . y1 + A12 . y2 = y1A21 . y1 + A22 . y2 = y2
From the first row, noting that A11 is a square matrix:
(I – A11) . y1 = A12 . y2y1 = (I – A11)–1 . A12 . y2AMULT = (I – A11)–1 . A12y1 = AMULT . y2
where AMULT(i1,i2) is the multiplier matrix.
We solve the model for a scenario that yields changes in the endogenous variables as a function of changes in the exogenous variables: y1 = AMULT y2. The vector y1 includes all direct and induced changes in production caused by changes in exogenous demand (e.g., a change in demand for airplanes induces changes in demand for, and hence production of, airplane parts). For the full and aborted trade war scenarios, the macro shocks come from the Moody’s model, and we estimate the sectoral composition of the macro changes in household expenditure, government expenditure, and investment demand by assuming that the commodity expenditure shares are the same as in the base data. The change in export demand by commodity is based on detailed trade data by country of destination. Given the solution values of y1, we can solve for changes in employment by multiplying the change in industry output terms in y1 by labor coefficients. We estimate changes in imports using import coefficients by country of origin, which are in the A21 matrix, and multiplying the coefficients by the change in the commodity accounts in: Δy1.
DATA SOURCES AND GEOGRAPHICAL DISAGGREGATION OF DEMAND, PRODUCTION, AND EMPLOYMENT
We link the geographic clustering of economic activities to changes in demand in a three-step process. First, we map state-level data on employment by industry to the national industrial employment data us-ing the detailed specification of 389 commodities and associated industries, allocating changes in industrial

48
production and associated employment to states.2 Second, we use county-level employment data to allocate changes in employment by states to the county level. Third, industries that serve workers such as services (e.g., restaurants) will also be affected, and these effects will be geographically clustered near the producing establishments.
We calculate the subnational results using private employment data drawn from the Quarterly Cen-sus of Employment and Wages (QCEW) of the Bureau of Labor Statistics (BLS) for 2013. The QCEW provides county-level data on employment in various industries down to the county and six-digit North American Industry Classification System (NAICS) level. However, BLS suppresses data that could be used to reveal confidential information on individual employers. This practice means that there is little or no data suppression at very high levels of aggregation but substantial suppression at the most detailed level. Fortunately, data suppression does not cover the number of industry establishments at each location. Hence we are able to use the number of establishments per industry/county pair as a baseline for estimating sup-pressed values.
By design it is not possible to derive the suppressed values from available data. However, given the focus on employment, we construct a reasonable set of estimates for those values based on the following ap-proach. The variable of interest is the number of employees per industry establishment in each county. As an initial estimate, we use the average number of establishments per industry, where available. We then apply several constraints, requiring the resulting estimates to be relatively close to total private employment at the county level and total private industry employment at the state level. Our optimization approach satisfies these constraints by shifting the county/industry ratio of employees per establishment while minimizing the imposed shifts.
This procedure yields estimates of the number of individuals employed in private establishments in each six-digit NAICS industry in each US county. The direct impact of a given scenario on employment in industries by county is to take the estimated percentage change in employment for each industry and apply it to all counties with relevant employment in those industries. However, there are indirect effects at the county level as geographically linked industries (e.g., various services) will be affected as county income falls.
To capture these indirect geographic effects, we cluster the linked industries in regions that are “close” to those counties that are directly affected. We begin by applying the model’s demand shocks to each com-modity individually. The shocks result in losses for the associated industry, which we distribute across all US counties that employ people in that industry. Returning to the aerospace example, the shock to export demand for aircraft reduces production of aircraft by about 5 percent. We apply that direct shock propor-tionally to all counties with private establishments that produce aircraft, and then consider indirect effects on other industries and places that accompany the direct shock. They include relatively large shocks to relevant intermediate products (such as aircraft engines and parts) and smaller shocks to industries that are only tangentially related to the aircraft industry. We assume that the employment losses from these indirect effects fall disproportionately within the directly affected communities and communities that are highly integrated with them.
2. The SAM includes 12 construction subsectors (nonresidential repair, residential repair, healthcare structures etc.), which are aggregated into a single construction sector for the employment analysis. In addition, there are nine types of government employment that are irrelevant for the private sector employment results. Hence, the 389-sector SAM generates employment results for 369 sectors as discussed in chapter 2.

49
To distribute these effects, we turn to Census Bureau commuter data, derived from the American Community Survey.3 The bulk of the associated effects falls within a catchment area formed by the directly affected county and neighboring areas. Any residual losses are distributed across other counties in the state, and state level residual losses are distributed nationally.
As an example, consider Snohomish county, Washington, in the aerospace scenario. Direct shocks to aircraft export demand reduce production by about 5 percent; the direct shocks to aircraft engines and aircraft parts reduce production by about 6.5 percent. These direct losses are distributed proportionately, so they would reduce employment in Snohomish county by 5 percent in aircraft production and 6.5 percent in engine and parts production. The loss of 1,000 jobs in aircraft production might be associated with 200 jobs lost in aircraft engine manufacturing and a few dozen in other sectors. Taking the sum of these effects over all scenarios yields a pool of indirect job losses for each indirectly affected industry, to be distributed across nearby establishments.
Commuter data indicate that 80 percent of Snohomish workers commute locally, so we apply 80 per-cent of those indirect job losses to establishments in Snohomish. We spread the remaining 20 percent across other counties that have some level of commuter integration with Snohomish. (Similarly, Snohomish would also be subject to indirect losses from nearby counties, such as Thurston and King.)
REFERENCEMiller, Ronald E., and Peter D. Blair. 2009. Input-Output Analysis: Foundations and Extensions, 2nd ed. Cambridge: Cambridge University Press.
3. American Community Surveys, www.census.gov/programs-surveys/acs.