Embed Size (px)
Citation preview

Copyright©2014 Research Institute for Economics & Business Administration - Kobe University.
Assessing the Risk of Fraud at Olympus and
Identifying an Effective Audit Plan
HIRONORI FUKUKAWA*
Graduate School of Commerce and Management, HITOTSUBASHI UNIVERSITY
THEODORE J. MOCK
School of Business Administration, UNIVERSITY OF CALIFORNIA, RIVERSIDE
RAJENDRA P. SRIVASTAVA School of Business, THE UNIVERSITY OF KANSAS
ABSTRACT
This paper introduces an approach to the assessment of financial statement fraud risk and audit program planning and illustrates its application by simulating its use in the 1999 audit of Olympus. The approach incorporates a rigorous approach to assessing risk and current standards and conventions to fraud risk assessment not in practice during the period when a substantial financial statement fraud occurred at Olympus. The approach described in this paper illustrates a ‘what-if’ analysis that suggests the possible effectiveness of using updated standards, practice and research on detecting financial statement fraud. In the proposed approach, which is based on the Theory of Belief Functions, auditors follow three steps: (1) fraud risk assessment at the overall financial statement level, (2) fraud risk assessment at an account level, and (3) assessment of account, transaction and evidence schemes used to perpetrate fraud. In the evidential network, formal auditor belief assessments concerning evidence obtained in each audit step are aggregated by using Dempster’s rule. High aggregated assessments of belief-in-fraud or plausibility-of-fraud which exceed the thresholds established by the audit firm requires the auditors to engage in further investigation, to heighten the level of professional skepticism, and, where appropriate, to adopt a forensic audit approach. The results of analyzing the 1999 audit of Olympus demonstrate that the applications of current standards applied jointly with our approach would have likely both indicated a high plausibility and belief that fraud existed and would have likely directed the audit team to effective forensic audit procedures. JEL Classificatoin: D81; M42; M48 Key Words: Financial Statement Fraud; Forensic Audit Procedures; Design Science;
Theory of Belief Functions
* Corresponding Author. Address Graduate School of Commerce and Management, Hitotsubashi University, 2-1 Naka,Kunitachi, Tokyo, JAPAN. Telephone +81-42-580-8468
E-mail [email protected]
Received October 29, 2013; available online February 12, 2014 (Advance publication by J-STAGE) DOI: 10.11640/tjar.4.2014.01

2 The Japanese Accounting Review, 4 (2014), 1-25
1. Introduction
The main objective of this paper is to apply a modification of a fraud risk (FR) assessment framework developed by Gao (2005)1 and designed for assessing the risk of fraud to the specifics present in the Olympus financial statement fraud case. The objectives include demonstrating the application of a structured, three-phased approach to fraud risk assessment and evaluating its use in complex fraud settings.
The research approach used is that of design science (March and Smith 1995; Hevner et al. 2004; Perols 2011, 2012) which has the primary goals of creating novel frameworks (‘artifacts’) and evaluating their utility in analyzing complex problems. The assessment of financial statement fraud is clearly a complex problem that the audit profession and audit researchers have been grappling with for many years (e.g., Weil 2004).
The FR assessment framework uses an evidential reasoning approach to assess fraud risk and point to appropriate (forensic) audit procedures. The framework is evaluated by completing the three general steps sketched in Table 1 and Figure 1.
TABLE 1: BASIC FRAUD RISK ASSESSMENT STEPS AND AVAILABLE EVIDENCE
Fraud Risk (FR) Assessment Step
Key Categories and Items of Evidence [Evidence shown as (Bel-in-fraud; Bel-in-no-fraud) with ambiguity and plausibility implicit]
Prior Based on 1998 audit
E1.1: Prior fraud risk assessment: Based on posterior at the end of 1998 audit. At the end of 1998 audit (and thus prior for 1999 audit), belief-in-fraud very low and plausibility-of-fraud less than threshold. Assumed to be (0.001, 0.95) thus at the beginning of 1999 audit, plausibility of fraud starts at 0.05 and belief at 0.001.
Step 1: Compilation of overall 1999 evidence for initial assessment of FR
E1.2: Overall-level evidence gained from research into the general economic environment and other client engagement continuance considerations. Assume nothing relevant to fraud risk beyond those linked directly to fraud triangle identified. (0.0, 0.0)
Overall-level fraud triangle assessment (e.g., based on BAC 2013, JICPA Statement 240, ISA 240 and SAS 99 guidance): Based on assumed implementation of formal assessment of the three elements as part of initial analytical procedures; Engagement team discussion regarding risk of material misstatement due to fraud; Inquiries of management regarding fraud and assessment of management characteristics including integrity. Evidence specific to particular accounts considered in Step 2:
EI1.n: Evidence interpreted in terms of implications concerning ‘Incentive’ : EI1.1 Poor F/S Performance (0.1, 0.0) EO1.n: Evidence interpreted in terms of implications concerning ‘Opportunity’: EO1.1 Ineffective Monitoring by BOD (0.1, 0.0); EO1.2 Organizational Culture (0.05, 0.0); EO1.3 Authority Concentration (0.05, 0.0); EO1.4 Lack of Job Rotation (0.05, 0.0) EA1.n: Evidence interpreted in terms of implications concerning ‘Attitude’: EA1.1 Restrained Information Disclosure (0.05, 0.0); EA1.2 Possible Lack of Objectivity (0.05, 0.0)
Step 2: Compilation of specific account level evidence for FR assessment and updating of overall assessment
Specific consideration of evidence related to fraud triangle factors applied at the account level to all significant accounts; Ranking of FR by account (Illustration based on ‘Short-term Investments’ account):
EI2.n: Evidence interpreted in terms of implications concerning ‘Incentive’: EI2.1 Change in External Environment (0.1, 0.0) EI2.2 Change in Accounting Standards (0.2, 0.0) EI2.3 Amount of Short-term Investments (0.05, 0.0) EO2.n: Evidence interpreted in terms of implications concerning ‘Opportunity’: EO2.1 Lack of Financial Expertise (0.05, 0.0) EA2.n: Evidence interpreted in terms of implications concerning ‘Attitude’: (none)
Step 3: Account, transaction and evidence scheme analysis
Evaluation of specific evidence related to account schemes used to perpetrate fraud and for accounting schemes to depose of (overvalued) assets without recognizing loss:
EAS1.1 Detection of Loss Transfer Transactions (0.3, 0.0) EAS1.2 No Similar Loss Transfer Transaction (0.0, 0.7)
1 See also Gao and Srivastava (2011) and Gao et al. (2011, 2013).

Fukukawa, Mock, and Srivastava: Assessing the Risk of Fraud at Olympus and 3
Identifying an Effective Audit Plan F
IGU
RE
1: O
VE
RA
LL
EV
IDE
NT
IAL
NE
TW
OR
K F
RA
UD
RIS
K A
SS
ES
SM
EN
T
F.
Fra
ud
at
the
Ove
rall
L
evel
R1
AN
D
R3
R2
O.
Op
port
un
ity
A.
Att
itud
e I.
Ince
nti
ve
EO1 Items of evidence pertaining to Opportunities of management to commit
fraud at the Overall Level
EA1 Items of evidence pertaining to Attitude of management to commit fraud
at the Overall Level
EI1 Items of evidence pertaining to Incentives of management to commit
fraud at the Overall Level
E1.1 Baseline assessment of fraud risk at the overall level
F
raud
in
A
cco
un
t B
R1
AN
D
R3
R2
O.
Opp
ortu
nit
y
A.
Att
itud
eI.
Ince
nti
ve
EI2 Items of evidence pertaining to incentives of management to commit fraud
at specific Account B
EA2 Items of evidence pertaining to attitude of management to commit fraud
at specific Account B
EO2 Items of evidence pertaining to opportunities of management to commit
fraud at specific Account B
OR
Fra
ud
usi
ng
Acc
ou
nt
Sch
eme
B1
Fra
ud
usi
ng
Acc
ou
nt
Sch
eme
B2
Evidence related to specific Account Scheme B1
Evidence related to specific Account Scheme B2
Ste
p 2
Ste
p3
OR
Fra
ud
usi
ng
Evi
den
ce
Sch
eme
EV
1
for
Acc
ou
nt
Sch
eme
B1
Fra
ud
usi
ng
Evi
den
ce
Sch
eme
EV
2
for
Acc
ou
nt
Sch
eme
B1
Evi
den
ce r
elat
ed
to s
pec
ific
E
vid
ence
S
chem
e E
V1
for
Acc
oun
t S
chem
e B
1
Evi
den
ce r
elat
ed
to s
pec
ific
E
vid
ence
S
chem
e E
V2
for
Acc
oun
t S
chem
e B
1
Ste
p 1
4 The Japanese Accounting Review, 4 (2014), 1-25
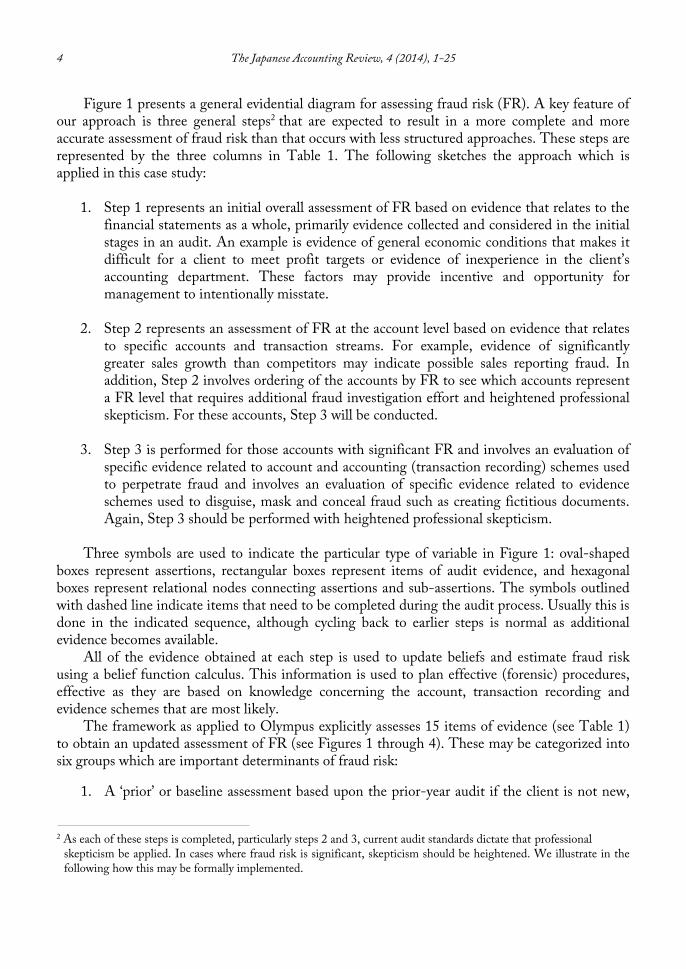
Figure 1 presents a general evidential diagram for assessing fraud risk (FR). A key feature of our approach is three general steps2 that are expected to result in a more complete and more accurate assessment of fraud risk than that occurs with less structured approaches. These steps are represented by the three columns in Table 1. The following sketches the approach which is applied in this case study:
1. Step 1 represents an initial overall assessment of FR based on evidence that relates to the
financial statements as a whole, primarily evidence collected and considered in the initial stages in an audit. An example is evidence of general economic conditions that makes it difficult for a client to meet profit targets or evidence of inexperience in the client’s accounting department. These factors may provide incentive and opportunity for management to intentionally misstate.
2. Step 2 represents an assessment of FR at the account level based on evidence that relates to specific accounts and transaction streams. For example, evidence of significantly greater sales growth than competitors may indicate possible sales reporting fraud. In addition, Step 2 involves ordering of the accounts by FR to see which accounts represent a FR level that requires additional fraud investigation effort and heightened professional skepticism. For these accounts, Step 3 will be conducted.
3. Step 3 is performed for those accounts with significant FR and involves an evaluation of
specific evidence related to account and accounting (transaction recording) schemes used to perpetrate fraud and involves an evaluation of specific evidence related to evidence schemes used to disguise, mask and conceal fraud such as creating fictitious documents. Again, Step 3 should be performed with heightened professional skepticism.
Three symbols are used to indicate the particular type of variable in Figure 1: oval-shaped
boxes represent assertions, rectangular boxes represent items of audit evidence, and hexagonal boxes represent relational nodes connecting assertions and sub-assertions. The symbols outlined with dashed line indicate items that need to be completed during the audit process. Usually this is done in the indicated sequence, although cycling back to earlier steps is normal as additional evidence becomes available.
All of the evidence obtained at each step is used to update beliefs and estimate fraud risk using a belief function calculus. This information is used to plan effective (forensic) procedures, effective as they are based on knowledge concerning the account, transaction recording and evidence schemes that are most likely.
The framework as applied to Olympus explicitly assesses 15 items of evidence (see Table 1) to obtain an updated assessment of FR (see Figures 1 through 4). These may be categorized into six groups which are important determinants of fraud risk:
1. A ‘prior’ or baseline assessment based upon the prior-year audit if the client is not new,
2 As each of these steps is completed, particularly steps 2 and 3, current audit standards dictate that professional
skepticism be applied. In cases where fraud risk is significant, skepticism should be heightened. We illustrate in the following how this may be formally implemented.

Fukukawa, Mock, and Srivastava: Assessing the Risk of Fraud at Olympus and 5
Identifying an Effective Audit Plan
on general audit firm knowledge concerning financial statement fraud frequency and on knowledge gained from academic (e.g., Messier et al. 2010) and professional research (e.g., Deloitte Forensic Center 2009). For Olympus, this would be based largely on the prior-year (1998) audit.
2. Current year general evidence at the overall financial statement level which results in a
general assessment of fraud risk [Step 1]
3. Evidence related to the likelihood of the fraud risk factors Incentives, Attitude, and Opportunities at the overall financial statement level [Step 1]
4. Evidence related to the likelihood of the fraud risk factors Incentives, Attitude, and
Opportunities being present specific to particular accounts [Step 2]
5. Evidence related to the account-based or transaction-recording-based fraud schemes which are used to manipulate account balances or financial performance results [Step 3]
6. Evidence related to the evidence-based fraud schemes which are used to deceive auditors and conceal fraud (Gao and Srivastava 2011) by creating fictitious evidence or manipulating evidence [Step 3]3
Importantly, the framework provides a way to assess in which accounts fraud could have
been perpetrated and concealed by tying the presence of opportunities, incentives and an attitude that permits fraud to be rationalized to potential fraud schemes. The framework is flexible and can be adapted to the specifics of each engagement setting. Thus, the framework can be used by audit teams as a guide to assess fraud risk and can be incorporated into firm training to educate auditors about linking planning-phase fraud risk assessments, fraud schemes, and various items of evidence.
The paper is organized as follows. Section 2 reviews prior professional and academic literature. Section 3 presents the general evidential reasoning framework for fraud risk assessment and applies it to the general context which existed during the initial years of the Olympus fraud. Section 4 illustrates how Olympus auditors could have used the framework to perform fraud risk assessment, to plan an appropriate audit program, and to evaluate audit results. Section 5 concludes with a discussion of contributions and suggested future research.
To attempt to evaluate the effects of applying the framework sketched in Figure 1, we simulate what a plausible assessment of fraud risk might have been if the actual Olympus auditors had first completed their assessment of fraud risk the year prior to the actual discovery of the fraud and then incrementally had applied the key elements of our framework. Thus we ask the research question:
RQ: “What if” the Olympus auditors had completed the three steps for enhanced
fraud risk assessment suggested by our framework?
3 In some cases, frequency information may be available to guide the FR assessment. Gao et al. (2013) utilize this
approach and a ‘conditional OR’ to weight evidence based on frequency knowledge.

6 The Japanese Accounting Review, 4 (2014), 1-25
2. Relevant Literature
In this section, we first provide background on the Dempster-Shafer (DS) theory of belief functions and then on Olympus. Although there are several publications available in the literature that provide good introductions to DS theory (e.g., see Srivastava 1993; Srivastava and Mock 2000, 2002, 2005; Srivastava and Shafer 1992), for the convenience of readers, we introduce the basic concepts of DS theory relevant to the current paper. There are three basic functions, the basic belief mass function, the belief function, and the plausibility function, which are important along with Dempster’s rule of combination.
2.1 Belief functions and Dempster’s rule DS theory (Shafer 1976) is a framework for representing and managing uncertainty (risk)
and for assessing the effect of obtained evidence on uncertainty. In this paper, it is applied to the assessment of fraud risk. It is a broader framework than probability theory and in certain situations reduces to probability theory.
Consider a situation (i.e., a question such as ‘Is there significant financial statement fraud?’) with ‘n’ possible mutually exclusive and exhaustive outcomes (i.e., answers): a1, a2, a3, . . . an. This set of outcomes is known as the frame of discernment, , with = { a1, a2, a3, . . . an }.
Suppose that we have (audit) evidence that provides knowledge that supports or disconfirms the possibilities or, is mixed in its support. Under probability theory, this situation may be expressed as probability distribution over the entire frame by assigning probabilities to each
outcome: P(a1), P(a2), . . . P(an), where 1P(ai)0, and n
=1iP(ai)= 1. There is no provision in
probability theory to assign probabilities to more than one element, that is, to combinations of the assumed mutually exclusive elements.
Under DS theory, however, we express the knowledge gained from available evidence in terms of a basic belief mass function. This function assigns m-values to all the subsets of the frame and to the entire frame, i.e., to all the single elements: m(a1), m(a2), … m(an); all the subsets with two elements, m({a1, a2}), m({a1, a3}), . .; all the subsets with three elements, m({a1, a2, a3}), m({a1, a2, a4}), . . . , and so on to the entire frame, m({}). The sum of all the belief masses
equals one, i.e., 1m(A)A
, where A represents the subsets of elements contained in the frame
or the entire frame. By definition, the m-value assigned to an empty set is zero, i.e., m() = 0. In situations where non-zero m-values are assigned only for the single elements, the DS
framework reduces to probability theory. Thus, DS theory is a broader framework for representing uncertainties and risk, and it reduces to probability theory when m-values for all the subset of elements are zero except the m-values for the single elements.
To illustrate the concept of the basic belief mass function, consider an example of fraud being present (f) or absent (~f) in the financial statements of a company. The frame of discernment is represented by = {f,~f}. Suppose we have weak audit evidence that suggests a possibility of fraud. Such evidence can be mapped in terms of the basic belief mass function as; m(f) = 0.1, m(~f) = 0, m({f,~f}) = 0.9, where m(f) = 0.1 represents that 10% of the mass is assigned to fraud-being-present on a scale of 01, and m(~f) = 0 represents that there is no evidence negating fraud. The belief mass m({f,~f}) represents the level of ambiguity or ignorance

Fukukawa, Mock, and Srivastava: Assessing the Risk of Fraud at Olympus and 7
Identifying an Effective Audit Plan
that exists given the available evidence. In this case, that would be 0.9 as we assume there is only very limited evidence available.
The Belief Function, on the other hand, represents the total belief that an outcome or a set of outcomes are true or not true considering all the evidence. In general, the total belief in a set of
elements, A, of a frame , can be written as: AB
m(B) = Bel(A) , where B represents all the
subset of elements contained in A. For the example given above, based on just one item of evidence, the belief that fraud is
present is Bel(f) = m(f) = 0.1, and the belief that fraud is not present is Bel(~f) = m(~f) = 0, whereas the belief that either fraud is present or not present is Bel({f,~f}) = m(f) + m(~f) + m({f,~f}) = 0.1 + 0 + 0.9 = 1.0.
In more complex situations where we have several items of evidence, a multi-step process is required to capture our knowledge given the available evidence. Once we have assessed the strength of all items of evidence, we would use Dempster’s rule and then use the definition of the belief function in terms of m-values as defined above to determine the total belief.
Next, we define the plausibility function. The plausibility function is defined as the maximum possible belief assigned to an element or a set of elements based on the available
evidence. Mathematically it is represented as: Pl(A) = m(B)AB , which implies that the
plausibility that the set A is true is the sum of all the m-values for subsets B that have non empty intersection with the set A.
For our simple example, the plausibility that fraud is present, based on that one piece of evidence is Pl(f) = m(f) + m({f,~f}) = 0.1 + 0.9 = 1.0, and the plausibility that fraud is not present is given by Pl(~f) = m(~f) + m({f,~f}) = 0 + 0.9 = 0.9. By definition, the plausibility of a set A is equal to one minus the belief in not-A, i.e., Pl(A) = 1 – Bel(~A).
Next, we discuss the Dempster’s rule of combination. Dempster’s rule for combining various independent items of evidence is similar to the Bayes rule of combination in probability theory. In the case of two independent items of evidence (for more than two items of evidence, see Shafer 1976), we can mathematically express the combined m-value for a non-empty subset A, i.e., m(A), under Dempster’s rule as:
K/)B2(B1)m(m = m(A) 2A=B2B1
1
, (1)
where K is the renormalization constant defined as:
=B2B1
21 )B2(B1)m(m1 =K . (2)
Equation 1 simply means that the combined m-value for a subset A is the sum of all the products of the sets of m-values that have intersection A with renormalized by the factor K. The second term in the renormalization constant K defined in (2) represents the conflict between the two items of evidence.
We illustrate the use of Dempster’s rule using the prior example. Consider the earlier

8 The Japanese Accounting Review, 4 (2014), 1-25
evidence as the first item of evidence and, as assumed earlier, we represent the assessed m-values as: m1(f) = 0.1, m1(~f) = 0, and m1({f,~f}) = 0.9. Consider a second item of audit evidence that suggests that there is no financial statement fraud which is assessed as 0.7 that fraud is not present. Assume also that this evidence says nothing about fraud being present. These judgments can be expressed in terms of the following m-values: m2(f) = 0, m2(~f) = 0.7, m2({f,~f}) = 0.3. Using Equation (2) above we get the following renormalization constant:
K = 1 – {m1(f)m2(~f) +m1(~f)m2(f)} = 1 – {0.1*0.7 + 0*0} = 1 – 0.07 = 0.93, and the combined m-values as:
m(f) = {m1(f)m2(f) + m1(f)m2({f,~f}) + m1({f,~f})m2(f)}/K = {0.1*0 + 0.1*0.3 + 0.9*0}/0.93 = 0.03/0.93 = 0.0323,
m(~f) = {m1(~f)m2(~f) + m1(~f)m2({f,~f}) + m1({f,~f})m2(~f)}/K = {0*0.7 + 0*0.3 + 0.9*0.7}/0.93 = 0.63/0.93 = 0.6774,
m({f,~f}) = m1({f,~f})*m2({f,~f})/K = 0.9*0.3/0.93= 0.27/0.93 = 0.2903. One can determine the updated beliefs and plausibilities in fraud and no-fraud using the definitions as discussed earlier:
Bel(f) = m(f) = 0.0323, Bel(~f) = m(~f) = 0.6774, Bel({f,~f}) = m(f) + m(~f) + m({f,~f}) = 0.0323 + 0.6774 + 0.2903 = 1.0, Pl(f) = m(f) + m({f,~f}) = 0.0323 + 0.2903 = 0.3226, and Pl(~f) = m(~f) + m({f,~f}) = 0.6774 + 0.2903 = 0.9677. In actual audits including fraud assessment, the available audit evidence is of course much
more complex than this example. Two basic evidential models have been extensively developed in the audit literature: the evidence ‘tree’ model and the ‘network’ model. We refer readers to Srivastava (2011) and Mock et al. (2009) for a more thorough introduction to the evidential reasoning approach used in this paper.
2.2 Olympus background The Olympus fraud was exposed in July 2011 within an article published in a journal called
Facta (Facta 2011). In September, the Chief Operating Officer (COO), Mr. Michael Woodford, sent a questionnaire letter about the issue to the Chief Executive Officer (CEO) and some other board directors and staff, but received no satisfactory response. After he was appointed CEO in October, Mr. Woodford asked PricewaterhouseCoopers in the U.K. to investigate the issue and sent a questionnaire letter again to the former CEO and the board of directors. However, on October 14, Mr. Woodford was dismissed as CEO by the board of directors. He asked the Serious Fraud Office (SFO) in the U.K. to investigate the issue. On October 20, some institutional shareholders requested that the company conduct a thorough investigation. In response to the request, the company set up a third-party committee on November 1. Then, the company issued a press release on November 11 in which it admitted that it had committed this fraud.
The fraud was a surprise to the Japanese business society and auditing profession given that the fraud had been perpetrated by a company with a high reputation over a period of more than ten years and given that the company’s financial statements had been audited by one of the Japanese Big 4 audit firms during that period. As noted and as is unfortunately the case in many frauds, the fraud was not discovered by the financial statement audit.
Olympus has two main lines of business: cameras and medical instruments, primarily endoscopes. In the 1980s, the camera business experienced a substantial downturn in demand and Olympus’ operating income declined substantially from 6.8 billion yen in 1985 to 3.1 billion

Fukukawa, Mock, and Srivastava: Assessing the Risk of Fraud at Olympus and 9
Identifying an Effective Audit Plan
yen in 1986. As one strategy to compensate for this decline, management decided to pursue a strategy of increasing non-operating income through short-term investments. From 1985 to 1999 short-term investments increased five-fold and constituted more than 20% of total assets by the late 90s, when the fraud began.
In 1990, the bubble economy in Japan which was based largely on inflated property values burst and the stock market started to decline. Rather than supplementing the bottom line, Olympus suffered unrecorded losses from the short-term investments (“securities” plus “short-term specified financial instruments”) which amounted to 126 billion yen (at the end of the fiscal year 1998) with approximately 95 billion yen accumulated by then.4 However, the company did not need to report the accrued losses in their financial statements because accounting standards at the time permitted financial instruments to continue to be valued at their historical cost until they were sold or matured.
However, in 1997 discussion began regarding new accounting standards that would require market value measurement of such financial instruments and the standards setters decided that the new standards would be in effect for the fiscal year 2001. Thus, in the late 1990s, Olympus faced a pressing incentive to somehow cover the accrued losses in short-term investments which were approximately 95 billion yen by 1998 or more than ten times the 1998 net income. Rather than book these losses, Olympus decided to implement some related-party and transaction-accounting tactics that materially misstated their financial statements.
The fraud was committed using two schemes. The first scheme called “Tobashi” resulted in transferring the losses in investments to other entities outside the company. To accomplish this, Olympus established investment funds (dummy companies) which then purchased the short-term investments at their historical cost which was significantly higher than their market value at that time. Olympus made deposits in some foreign banks and the banks provided the dummy companies with funds to purchase financial instruments from Olympus by using the deposits as collaterals. The “Tobashi” scheme was essentially completed by the year 2000.
The purpose of the second scheme was to dispose of the losses in the dummy companies which were transferred to them. In acquiring some companies, Olympus first had the investment funds purchase stock of the target companies, and then purchased those stocks from the investment funds at much higher prices than the original costs or the market value of the target companies. In addition, Olympus paid unreasonably high advisory fees to a financial advisor that had colluded with the company. The ‘profits’ of the investment funds and most of the advisory fees were then used to offset the transferred losses. As the result of these fraudulent transactions, the losses in the short-term investments had changed their form to goodwill incurred in the acquisitions and Olympus had planned on amortizing the goodwill in the future, thus postponing the recognition of the losses.
As is evident, the fraud schemes were complex and were carried out in a skillful manner, which involved establishing off balance sheet accounts and collusion with outsiders. In our analysis below, we focus on the 1999 audit and on the “Tobashi” scheme as an illustration of how our approach would have likely identified the initial fraud.
4 The case description is based on the investigation report issued by the third-party committee formed by the company
(Third-party Committee 2011) unless otherwise indicated.

10 The Japanese Accounting Review, 4 (2014), 1-25
3. Application of the Evidential Reasoning Framework to Olympus
We start our analysis with some evidence that would have been available given the Japanese auditing standards as of 1999 to obtain a baseline fraud risk assessment. Then we augment this assessment by applying the three steps sketched in Figures 1 through 4 and Table 1.
Our risk assessments focus on two measures of fraud risk: the belief-in-fraud and plausibility-of-fraud (Fukukawa and Mock 2010). The key difference in these two measures is that belief is based on actual audit evidence that directly implies the possibility of fraud whereas plausibility adds a measure of the level of unresolved uncertainty or ambiguity facing the audit team at any point in the audit. As uncertainty usually cannot be totally eliminated in a complex audit setting, plausibility usually is greater than belief. As audit evidence is accumulated, ambiguity is lowered and the measure of plausibility approaches the assessment of belief.
3.1 Assessment of Olympus fraud risk As indicated, although the Olympus fraud had been going on for a long period, there is no
evidence that the auditor had assessed fraud risk to exceed the threshold that would have resulted in changing the normal audit approach to what could be called a forensic approach where extensive fraud detection procedures would have been applied. Although it is unclear what this threshold would have been or what it normally would be in Japanese audit practice, it clearly would have been a ‘low’ level of risk.
For purposes of discussion, for the auditor’s prior at the start of the 1999 audit, we assume belief-in-fraud was 0.001. This essentially means that, particularly with continuing clients, the auditor would not expect the frequency of material intentional financial statement misstatement to exceed one in a thousand. We also assume that the prior plausibility-of-fraud was 0.05. Thus, it follows that the prior belief-in-no-fraud was 0.95 and the ambiguity level was 0.049. As the audit firm had a long period of involvement with the client, it is certainly reasonable that extensive 1998 audit evidence, summarized as E1.1 in Table 1, would have been available indicating that the financial reports were not intentionally misstated. The exact level of these priors is not critical as sensitivity analysis shows that the main results of our illustration are not sensitive to these baseline values as long as they are ‘low’ assessments of fraud risk.
The following three steps illustrates how using a rigorous, quantitative risk assessment method in conjunction with the more explicit and focused audit of fraud based on current standards could have resulted in the auditors of the 1999 Olympus financial statements discovering the fraud.
3.2 Updating the prior assessment as the three audit steps are completed Step 1: Fraud risk assessment at the overall level
Audit practice involves a complex set of client acceptance and audit planning steps. Obviously, a research paper cannot replicate all of the details of an actual audit. What we do to provide a plausible description of the Olympus 1999 audit is to discuss the three general steps in our approach; indicate some of the audit evidence that was likely available if current audit standards (BAC 2013, JICPA Statement 240, ISA 240, SAS 99) were in place and calculate how the baseline FR assessments might have been updated. Thus we are attempting to decide ‘what-

Fukukawa, Mock, and Srivastava: Assessing the Risk of Fraud at Olympus and 11
Identifying an Effective Audit Plan
if’ our approach and current standards had been applied.5 The initial assessments in Step 1 involve collecting evidence E1.2 and then integrating it
with evidence E1.1 (see Table1). As indicated above, E1.1 can be interpreted as a Bayesian prior6 based on the posterior assessment at the end of the 1998 audit. We have assumed this prior was (0.001, 0.95), that is during 1998 sufficient audit evidence had been obtained to believe at a 0.95 level that there was no significant fraud.
During the early stages of the 1999 audit, the audit team would collect some overall audit evidence such as considering general economic conditions. Current audit standards (BAC 2013, JICPA Statement 240, ISA 240, SAS 99) indicate a number of audit steps that should be used. For simplicity, we assume that these activities would not have produced any evidence either of fraud or of no-fraud and have assumed E1.2 was assessed at (0.0, 0.0). The prior evidence (E1.1) and the initial FR tests (E1.2) would be combined using Dempster’s rule. If E1.2 results in no new FR evidence, the updated assessment would equal the prior.
To next update the FR assessments, we focus on a more important feature of our approach, that is considering the fraud triangle factors (incentives, opportunities, and attitude) (BAC 2013, JICPA Statement 240, ISA 240, SAS 99) and evaluating relevant audit evidence that existed in 1999. The main difference from what the actual auditors likely did is that we utilize a formal approach to quantify risk and we apply more current audit standards’ requirements in conducting the fraud risk assessment.
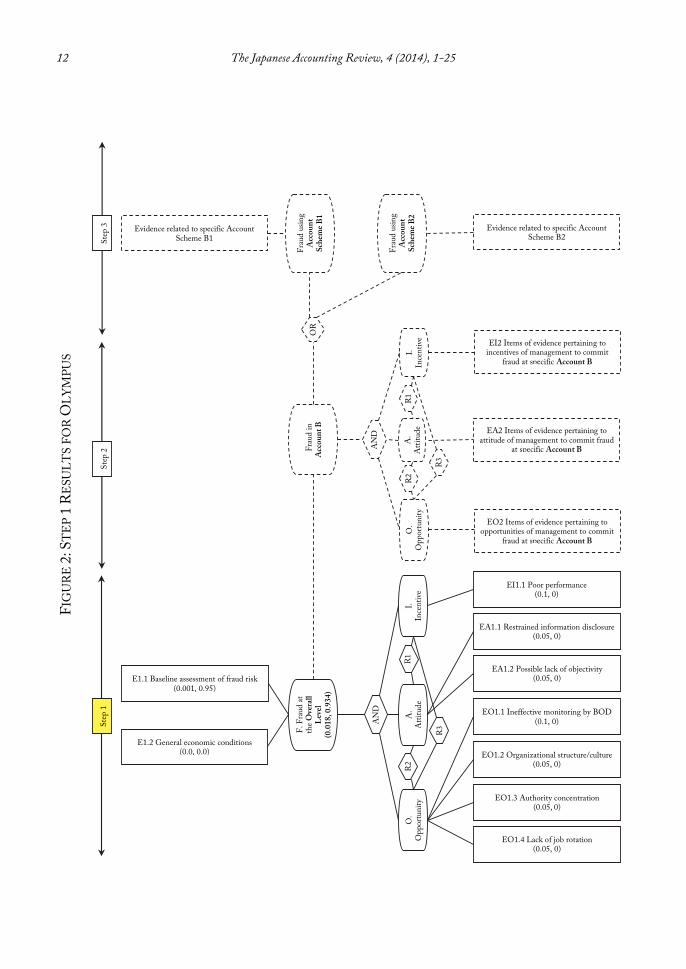
In Figure 2 and Table 1, we document the assumed additional fraud triangle evidence that would be collected during ‘Step 1’ of our approach. First we consider evidence related to possible incentives to misstate.
5 The updating has been reviewed by a practicing auditor for reasonableness, and sensitivity analysis has been
conducted to see the effects of changing these assessments. 6 It is more correct to refer to this as a Theory of Belief Functions Prior as we allow for an explicit amount of ambiguity
in the prior. Both of these ‘priors’ play the same role in each formalization in that, as new evidence becomes available, they are updated into ‘posteriors.’
12 The Japanese Accounting Review, 4 (2014), 1-25 F
IGU
RE
2: S
TE
P 1
RE
SU
LT
S F
OR
OL
YM
PU
S
F.
Fra
ud
at
the
Ove
rall
L
evel
(0
.018
, 0.9
34)
R1
AN
D
R3
R2
O.
Op
port
un
ity
A.
Att
itud
e I.
Ince
nti
ve
EO1.4 Lack of job rotation (0.05, 0)
EO1.3 Authority concentration (0.05, 0)
EO1.2 Organizational structure/culture (0.05, 0)
EO1.1 Ineffective monitoring by BOD (0.1, 0)
EA1.2 Possible lack of objectivity (0.05, 0)
EA1.1 Restrained information disclosure (0.05, 0)
EI1.1 Poor performance (0.1, 0)
E1.1 Baseline assessment of fraud risk (0.001, 0.95)
F
raud
in
A
cco
un
t B
R1
AN
D
R3
R2
O.
Op
port
unit
yI.
Ince
nti
ve
EI2 Items of evidence pertaining to incentives of management to commit
fraud at specific Account B
EA2 Items of evidence pertaining to attitude of management to commit fraud
at specific Account B
EO2 Items of evidence pertaining to opportunities of management to commit
fraud at specific Account B
OR
Fra
ud
usi
ng
Acc
ou
nt
Sch
eme
B1
Fra
ud
usi
ng
Acc
ou
nt
Sch
eme
B2
Evidence related to specific Account Scheme B1
Evidence related to specific Account Scheme B2
Ste
p 2
Ste
p3
Ste
p 1
E1.2 General economic conditions (0.0, 0.0)
A.
Att
itud
e

Fukukawa, Mock, and Srivastava: Assessing the Risk of Fraud at Olympus and 13
Identifying an Effective Audit Plan
As stated above, after experiencing the substantial decline of operating income in the late 80s, the company began pursuing profit from non-operating activities (i.e., short-term investment). This strategy continued in spite of the bubble economy burst in 1990. Significant decline in Olympus’ primary line of business and its dependence on short-term investment as a source of income in the midst of a prolonged recession clearly could have been an incentive for management to commit a fraud. Such incentives are red flags for fraud (BAC 2013, JICPA Statement 240, ISA 240, SAS 99) and should increase the auditor’s assessment of FR. To approximate this, we assign a belief-in-fraud of 0.10 to this evidence and label it as EI1.1 in Figure 2.
Next, we consider the second fraud triangle factor, opportunities, to commit fraud. We incorporate four items of evidence into our illustration.
Although not emphasized in audit practice or the standards at that time, current practice and standards emphasize corporate governance as an important safeguard to financial statement misstatement. If this aspect had been considered and investigated, the audit team would have discovered that, at the overall level, the monitoring by the board of directors was not effective in that the council of general executives, not the board of directors, had made most of the important decisions including basic policies and guidelines for its business and general corporate strategy. In addition, the corporate auditors (the audit and supervisory board members) did not attend the meetings of the council. These facts indicate that the overall effectiveness of corporate governance was doubtful. Thus, a belief-in-fraud of 0.10 is assigned to this evidence and it is labeled as EO1.1 in Figure 2.
A second aspect related to opportunity relates to governance effectiveness in that the company had adopted a divisional organizational structure. In essence, the divisions operated independently and sectionalism prevailed through the company. This fact provides additional evidence of possible ineffectiveness of monitoring and increases the opportunity for financial manipulation. We assign a belief-in-fraud of 0.05 to this evidence and label it as EO1.2.
Olympus had an organization that could be characterized by the concentration of vast authority in a few hands. For example, the top management had an authority of appointment and remuneration of board directors, and it was difficult for board directors to raise an objection to the top management. The authority concentration provides the top management with relatively greater opportunity to commit a fraud. Thus, a belief-in-fraud of 0.05 is assigned to this evidence and it is labeled as EO1.3.
Furthermore, job rotation did not work effectively especially in the finance and accounting departments. Only a few people were familiar with accounting and finance issues and the authority was concentrated in their hands. It was difficult for people outside the departments to grasp what had been done in the departments. Given that this should also increase the auditor’s belief that fraud might exist, we assign a belief-in-fraud of 0.05 to this evidence and label it as EO1.4.
Finally, we assess the attitude factor. The company was generally conservative about disclosing information to outsiders. In principle, the company did not disclose information other than that required by regulation or law. Such reluctance to disclose information is considered as reflecting the company’s general attitude toward information disclosure and can be considered to increase the possibility of a cover-up. This evidence is assigned a belief-in-fraud of 0.05 and labeled as EA1.1.
In addition, the CEO, Mr. Kishimoto, was the head of the accounting department when the

14 The Japanese Accounting Review, 4 (2014), 1-25
former CEO, Mr. Shimoyama, started to focus on short-term investments in the late 80s. In addition, Mr. Kishimoto was appointed CEO by Mr. Shimoyama in 1993. This indicates possible lack of objectivity in that it would be difficult for Mr. Kishimoto to criticize what the former CEO and he himself had done in the past. We assign a belief-in-fraud of 0.05 to this evidence and label it as EA1.2.
Note that in none of these cases do we assume that the evidence would result in the auditor increasing their belief that fraud likely would not exist. In practice, study of the client's corporate governance would likely produce such mixed evidence. Our approach does facilitate assessment of both types of evidence. The main effect of such ‘positive’ evidence of good corporate governance would be to decrease the plausibility of fraud and increase the belief that fraud does not exist.
Figure 2 shows the relationships among the items of audit evidence regarding the fraud triangle factors at the overall level that auditors would have obtained to update the preceding FR assessment. Based on the evidential network framework, the preceding assessment of fraud risk (a belief-in-fraud of 0.001 and a belief-in-no-fraud of 0.95) is updated to a belief-in-fraud of 0.018 and a belief-in-no-fraud of 0.934. The belief-in-fraud of 0.018 can be considered to be still below the threshold that would trigger a forensic-type of audit approach (assumed to be 0.05). However, the plausibility-of-fraud of 0.066 is high enough for auditors to obtain further evidence. In other words, the belief-in-no-fraud of 0.93 is considered to be still below the threshold (assumed to be 0.95) that would suggest that a forensic-type of audit approach is not appropriate.
For this situation, our approach recommends next considering any fraud risk evidence relating directly to each material account balance and transaction stream where intentional misstatement is at all likely. This evidence combined with Step 1 assessments will allow the auditor to focus on particular accounts that require additional (Step 3) audit effort.
Step 2: Fraud risk assessment at the account level In Step 2, the fraud triangle factors are assessed at the account level (see Figure 3). This step
needs to be applied to all significant accounts. Here we illustrate an application of Step 2 to the short-term investments, a material account (24% of total assets at the end of the fiscal year 1998) which had increased substantially in the early 90’s and which is at a very high level for this type of client.

Fukukawa, Mock, and Srivastava: Assessing the Risk of Fraud at Olympus and 15
Identifying an Effective Audit Plan F
IGU
RE
3: S
TE
PS
1 A
ND
2 R
ES
UL
TS
FO
R O
LY
MP
US
F.
Fra
ud
at
the
Ove
rall
L
evel
(0
.035
, 0.9
18)
R1
AN
D
R3
R2
O.
Op
port
un
ity
A.
Att
itud
e I.
Ince
nti
ve
EO1.4 Lack of job rotation (0.05, 0)
EO1.3 Authority concentration (0.05, 0)
EO2.1 Organizational structure/culture (0.05, 0)
EO1.1 Ineffective monitoring by BOD (0.1, 0)
EA1.2 Possible lack of objectivity (0.05, 0)
EA1.1 Restrained information disclosure (0.05, 0)
EI1.1 Poor performance (0.1, 0)
A. F
raud
in
S
ho
rt-t
erm
In
vest
men
ts(0
.035
, 0.9
18)
R1
AN
D
R3
R2
O.
Op
port
un
ity
I.
Ince
nti
ve
EI2.1 Change in external environment (0.1, 0)
EI2.2 Change in accounting standards (0.2, 0)
EI2.3 Amount of short-term investments (0.05, 0)
EO2.1 Lack of financial expertise (0.05, 0)
OR
Fra
ud
usi
ng
Acc
ou
nt
Sch
eme
B1
Fra
ud
usi
ng
Acc
ou
nt
Sch
eme
B2
Evidence related to specific Account Scheme B1
Evidence related to specific Account Scheme B1
Ste
p 2
Ste
p3
Ste
p 1
E1.1 Baseline assessment of fraud risk (0.001, 0.95)
E1.2 General economic conditions (0.0, 0.0)
A.
Att
itud
e

16 The Japanese Accounting Review, 4 (2014), 1-25
First, we consider three items of evidence regarding incentives. As stated, the bubble economy burst in 1990 and a substantial amount of losses had accrued in the short-term investments in the early 90’s,7 of which the auditors must have been aware if they vouched the existence and valuation of these investments. Even if the company did not need to report the losses in 1999 according to the accounting standards in force at that time, the existence of such large unreported losses can be a strong incentive to dispose of them improperly. Thus, we assign a belief-in-fraud of 0.10 to this evidence and label it as EI2.1.
Also, new fair value accounting standards had been promulgated (ASBJ 1999) that would require fair value measurement of the investments. These were known to become effective in 2001 and would have likely required the recognition of substantial losses. Such a change in GAAP can be an incentive for the company to commit a fraud because, if not addressed, the company would need to report the losses in the financial statements and suffer possible significant deterioration in earnings. Given that this seems to be a relatively stronger incentive than others discussed, we assign a belief-in-fraud of 0.20 to this evidence and label it as EI2.2.
In addition, the short-term investments amounted to more than 20% of total assets in the past three years. Such a composition of assets was not common to manufacturing companies and could have been seen as a red flag for fraud risk. Thus, this evidence is assigned a belief-in-fraud of 0.05 and labeled as EI2.3.
Next, in relation to opportunity, no members of the council of general executives, of the board of directors, or of the audit and supervisory board had significant accounting expertise, except for those who were involved with the fraud. Most specifically, none of those who were responsible for monitoring had a sufficient understanding of the accounting issues surrounding the short-term investments. This implies a possible lack of monitoring and an opportunity for management to misstate current assets. We assign a belief-in-fraud of 0.05 to this evidence and label it as EO2.1.
Figure 3 shows the fraud risk assessments updated based on the additional evidence obtained at the account level using the evidential network framework. By aggregating the additional evidence obtained at the account level, the belief-in-fraud increases from 0.018 to 0.035, the plausibility-of-fraud increases from 0.066 to 0.082, and the belief-in-no-fraud decreases from 0.934 to 0.918. A belief-in-fraud of 0.035 is probably high enough for auditors to contemplate the necessity of additional fraud risk focused investigation even if it does not exceed the threshold level. And given that the plausibility of fraud of 0.082 exceeds the threshold, we believe that the auditor should proceed to the next step.
Step 3: Assessment of account, transaction and evidence schemes When fraud risk assessments at the account level, either plausibility-of-fraud, or certainly
belief-in-fraud, exceed or are near their thresholds (assumed to be 0.10 and 0.05), the auditor should proceed to Step 3 for further investigation. Step 3 involves obtaining evidence and evaluating schemes used to perpetrate fraud or used to disguise, mask and conceal fraud such as creating fictitious documents. The audit team should continue to search for additional evidence until the plausibility-of-fraud become acceptably low (i.e., the belief-in-no-fraud is above the threshold) or they find convincing evidence of fraud.
7 The third-party committee report states that the exact amount is not clear, but as of 1995 the losses amounted to 20 –
30 billion yen.

Fukukawa, Mock, and Srivastava: Assessing the Risk of Fraud at Olympus and 17
Identifying an Effective Audit Plan
As indicated, this step involves considering account, transaction accounting and evidence schemes that may be used to promulgate and conceal fraud. Knowledge that may be relevant includes that obtained from the audit firm’s past experiences, from professional literature and academic research, from professional and regulatory quality inspection activities and from administrative actions and litigation against auditors.
Investigating fraud in the short-term investments Various fraud schemes are conceivable for the short-term investments. For an illustrative
purpose, we assume that there are two possible schemes: a “loss transfer” transaction scheme called “Tobashi” and an improper categorization scheme.8 9 While auditors need to evaluate all feasible account and transaction schemes, we focus on these two schemes. In considering these schemes, three categories of evidence should be investigated (Gao et al. 2013, BAC 2013, JICPA Statement 240, ISA 240, SAS 99): Transaction Accounting Schemes (non-GAAP methods of accounting), Evidence Schemes and Account Schemes. Each of these is discussed next.
Transaction accounting schemes Transaction accounting schemes involve implementing inappropriate accounting
transactions or entries. These may be entering fraudulent reoccurring transactions or entering unusual transactions such as end-of-period adjustments and management overrides. We begin with this category because in the actual Olympus audit in September 1999, the auditors evidently obtained information from a whistle-blower that the company had posted some questionable loss transfer transactions (“Tobashi”).10 Given this evidence, the auditors made inquiries to the head of the accounting department and some other accounting staff about the transactions. As a result, the accounting staff admitted they had posted the questionable transactions. The auditors required them to reverse the transactions, and they did so. As a result the company reported a loss of 17 billion yen related to these reversals.11
Given that there was evidence that the client has used inappropriate transaction accounting methods on this highly material account, we assume this is a moderate level of evidence that intentional misstatement may occur in this area. Thus, we assign a belief-in-fraud of 0.30 related to the short-term investments to this evidence and label it as EAS1.1. By incorporating this evidence into the evidential network, the belief-in-fraud increases from 0.035 to 0.068 (see Figure 4). Thus with just the formal assessment of this one item of evidence, our illustration shows the potential of our approach to identify material financial statement fraud.
8 The auditors must have had some knowledge about the “Tobashi” scheme because it was revealed that some securities
companies had compensated their major clients for losses caused by stock market declines by using the scheme and it was recognized as a social problem in the early 90s. For the second scheme, a company could avoid recognizing losses in short-term investments which should be valued at their market value by improperly categorizing them as long-term investments which at that time could be valued using historical cost.
9 Because the prior fraud frequency information is unavailable, our evidential network assumes “OR” relationships among audit evidence, rather than “conditional OR” relationships as adopted in Gao et al. (2013).
10 The actual information source is not known (Third-party Committee 2011). 11 When the transactions were detected, the auditor had the company cancel all of “short-term specified financial
instruments.” The 17 billion yen includes the loss in relation to the cancellation as well as the loss incurred by the reversal of the transactions.

18 The Japanese Accounting Review, 4 (2014), 1-25 F
IGU
RE
4: S
TE
PS
1, 2
, AN
D 3
RE
SU
LT
S F
OR
OL
YM
PU
S
F.
Fra
ud
at
the
Ove
rall
L
evel
(0
.045
, 0.9
08)
R1
AN
D
R3
R2
O.
Op
port
un
ity
A.
Att
itud
e I.
Ince
nti
ve
EO1.4 Lack of job rotation (0.05, 0)
EO1.3 Authority concentration (0.05, 0)
EO2.1 Organizational structure/culture (0.05, 0)
EO1.1 Ineffective monitoring by BOD (0.1, 0)
EA1.2 Possible lack of objectivity (0.05, 0)
EA1.1 Restrained information disclosure (0.05, 0)
EI1.1 Poor performance (0.1, 0)
A. F
raud
in
S
ho
rt-t
erm
In
vest
men
ts(0
.045
, 0.9
08)
R1
AN
D
R3
R2
O.
Op
port
un
ity
I.
Ince
nti
ve
EI2.1 Change in external environment (0.1, 0)
EI2.2 Change in accounting standards (0.2, 0)
EI2.3 Amount of short-term investments (0.05, 0)
EO2.1 Lack of financial expertise (0.05, 0)
OR
AS
1.
Fra
ud
usi
ng
Lo
ss T
ran
sfer
T
ran
sact
ion
s
(0.0
10, 0
.965
)
AS
2.
Fra
ud
usi
ng
Imp
rop
er
Cat
ego
riza
tio
n(0
.024
, 0.9
08)
EAS1.1 Detection of loss transfer transactions (0.3, 0.0)
Ste
p 2
Ste
p3
Ste
p 1
E1.1 Baseline assessment of fraud risk (0.001, 0.95)
E1.2 General economic conditions (0.0, 0.0)
EAS1.2 No similar loss transfer transaction in the past (0.0, 0.7)
A.
Att
itud
e

Fukukawa, Mock, and Srivastava: Assessing the Risk of Fraud at Olympus and 19
Identifying an Effective Audit Plan
Completing Step 3 would involve additional audit activities that we briefly discuss below. Any additional evidence of fraud or of risk of fraud would only increase the auditor’s belief-in-fraud. For example, given the high level of updated belief-in-fraud risk, the auditors should have become more skeptical and have increased suspicion that there might have been similar transactions. Becoming more skeptical would suggest reconsideration and perhaps discounting of other audit evidence related to this account (see below). Also, it would be prudent to clarify the whole picture of the fraudulent transactions. This would involve investigation of additional transaction accounting schemes and also account schemes and evidence schemes.
Account schemes and evidence schemes Two categories of fraud schemes have been identified and discussed by Gao et al. (2013).
Account-based fraud schemes are used by management to manipulate account balances and evidence-based fraud schemes are used by management to deceive auditors and conceal fraud by creating fictitious evidence or manipulating evidence (Gao and Srivastava 2011). Although both categories should be considered in an audit where belief-in-fraud approaches or exceeds the threshold, we focus in this illustration on evidence schemes.
Given the discovery of inappropriate accounting transactions in EAS1.1, the auditors should consider evidence schemes that clients use to cover up misstatement. For the material short-term investments accounts, all of the underlying assertions would need to be audited including existence, completeness and valuation.
To test valuation, the auditors appropriately attempted to verify the market values of “short-term specified financial instruments” at the time they were ‘sold’ and to verify the prices at which they were actually ‘sold.’ Our approach requires consideration of evidence schemes that could be used in such situations to misstate. The typical ones for this type of disposition of assets transaction involve forgery of related documents and/or collusion with outsiders.
Both forgery of evidence and collusion are extremely difficult to find and thus advanced forensic type procedures are needed. To identify forgery, it is necessary to obtain strong evidence from outside sources that are not susceptible to management manipulation. Also, to identify collusion, auditors should conduct audit tests that are not expected by the client and examine the results of audit tests with particular care (for example, in obtaining confirmation evidence, whether auditors have obtained sufficient responses to all questions that were asked). In addition, it may have been useful to consult with fraud experts within the audit firm.
In the actual audit, the auditors were given forged market-value information from Olympus and thus concluded that the market values were close to the prices at which the ‘sales’ of financial instruments were booked (The third-party committee report 2011). It is quite difficult to identify forged documents, but if the auditors had attempted to obtain corroborating valuation evidence and had investigated related evidence schemes and had discovered the forgeries, this would have provided very strong evidence to increase their belief-in-fraud.
In this illustration, we update the above belief assessments assuming first that the fraudsters were successful and the auditors accepted the valuation assertion as being appropriate. For this possibility, we assign a belief-in-no-fraud of 0.70 to this forged evidence which suggests that the client’s valuation assertion is valid. The revised, posterior beliefs given this evidence would be (0.045, 0.908), that is a 91% belief that the valuations are appropriate. Thus this demonstrates the possible effectiveness of forgery in deceiving the auditor.

20 The Japanese Accounting Review, 4 (2014), 1-25
Evidence re-assessment with heightened skepticism However, even if the updated belief-in-fraud of 0.045 did not exceed the threshold, the
plausibility of 0.092 may still be too high to issue an unqualified opinion and thus might warrant further investigation. Also, the new auditing standards regarding responses to fraud risk that were recently issued in Japan (BAC 2013) require auditors to heighten their skepticism when they make a judgment on whether there is a doubt of financial statement misstatement due to fraud. If these new standards had been applied, the Olympus auditor should have become more skeptical after obtaining evidence of fraudulent transactions.
For example, an auditor with heightened skepticism could discount evidence obtained from inside the client such as evidence concerning valuation of short-term investments. If the auditor had discounted the belief-in-no-fraud assigned the valuation evidence provided by Olympus from 0.7 as assumed above to, say, 0.4, the resulting fraud risk would be (0.055, 0.899). In this case, this belief-in-fraud assessment exceeds the threshold for belief-in-fraud which we assume to be 0.05.
The relationship between the discounting of the beliefs regarding the valuation evidence and the resulting belief-in-fraud and plausibility-of-fraud is plotted in Figure 5. This shows that if the valuation evidence is discounted from 0.70 to about 0.55 then the belief that fraud may exist exceeds the 0.05 threshold. Also, if the evidence is discounted even more to about 0.425 then the plausibility-of-fraud exceeds the 0.10 threshold. Although such precise assessments of evidential strength are certainly difficult to make, using our formal belief-based risk assessments clearly shows the potential value of our approach in alerting the audit team to possible material
FIGURE 5: RELATIONSHIP BETWEEN EVIDENCE DISCOUNT AND BELIEF-IN-FRAUD AND
PLAUSIBILITY-OF-FRAUD
0.04
0.05
0.06
0.07
0.08
0.09
0.1
0.11
0.12
0.70 0.65 0.60 0.55 0.50 0.45 0.40 0.35 0.30 0.25 0.20 0.15 0.10 0.05 0.00
Belief-in-fraud
Plausibility-of-fraud
Threshold Level1
Threshold Level2

Fukukawa, Mock, and Srivastava: Assessing the Risk of Fraud at Olympus and 21
Identifying an Effective Audit Plan
misstatement. Our approach allows formal assessment of a variety of possible evidence situations. What-if
forensic tests had shown the documents to be forged? For example, the auditors could have examined the market value of the short-term investments at the time they were sold by obtaining information from outside the company; that is evidence not as susceptible to management manipulation. If the auditors had gained evidence of forged documents and assessed the evidence as, say, (0.7, 0.0), the resulting beliefs on fraud risk would be (0.186, 0.775) with both the belief in and plausibility of financial statement fraud significantly exceeding the thresholds.
Alternatively, the auditors with heighted skepticism may reassess the evidence obtained in Step 2 as well. Suppose that the auditor reassessed the evidence regarding the change in accounting standards (EI2.2, where the initial belief-in-fraud is 0.2) as 0.4 and the evidence regarding the amount of short-term investments (EI2.3, the initial belief-in-fraud is 0.05) as 0.3. In this case, the fraud risk would be (0.083, 0.871). Again, given the high level of fraud risk, the auditors would have been prudent in investigating the outside entities that purchased the financial instruments to ascertain for what purpose they purchased them at higher prices than their market value and investigating where the funds for the purchases came from. As stated before, the entities that purchased the financial instruments were actually dummy companies (investment funds) established by Olympus. Also, the fund to purchase them was provided by the foreign banks using the deposits by Olympus as collateral.
In the actual audit, the auditors sent a confirmation to the banks which included a question about whether the deposit was used as collateral, but the responses did not respond to this part of the confirmation. If the auditors had been interested in revealing the whole picture of the detected fraudulent transactions including the fund sources to purchase the financial instruments, they would have been able to relate the confirmation test results to the fraudulent transactions and would likely have conducted further investigation into the deposits. If the auditors had found the entities that purchased the financial instruments were established by Olympus and the fund to purchase them were essentially provided by Olympus, the evidence (EAS1.3) would be very strong to indicate the existence of fraud and assessed as, say, (0.95, 0.0). For this scenario, the revised, posterior beliefs given this evidence would be (0.656, 0.327). The revised fraud risk assessments for this scenario are shown in Figure 6.

22 The Japanese Accounting Review, 4 (2014), 1-25
FIG
UR
E 6
: FR
AU
D R
ISK
RE
AS
SE
SS
ED
BY
A M
OR
E S
KE
PT
ICA
L A
UD
ITO
R
F.
Fra
ud
at
the
Ove
rall
L
evel
(0
.65
6, 0
.327
)
R1
AN
D
R3
R2
O.
Op
por
tun
ity
A.
Att
itud
e I.
Ince
nti
ve
EO1.4 Lack of job rotation (0.05, 0)
EO1.3 Authority concentration (0.05, 0)
EO2.1 Organizational structure/culture (0.05, 0)
EO1.1 Ineffective monitoring by BOD (0.1, 0)
EA1.2 Possible lack of objectivity (0.05, 0)
EA1.1 Restrained information disclosure (0.05, 0)
EI1.1 Poor performance (0.1, 0)
A. F
raud
in
S
ho
rt-t
erm
In
vest
men
ts(0
.65
6, 0
.32
7)
R1
AN
D
R3
R2
O.
Op
port
un
ity
I.
Ince
nti
ve
EI2.1 Change in external environment (0.1, 0)
EI2.2 Change in accounting standards (0.4, 0)
EI2.3 Amount of short-term investments (0.3, 0)
EO2.1 Lack of financial expertise (0.05, 0)
OR
AS
1. F
raud
usi
ng
Lo
ss T
ran
sfer
T
ran
sact
ion
s (0
.63
5, 0
.342
)
AS
2. F
raud
usi
ng
Imp
rop
er
Cat
ego
riza
tio
n(0
.00
8, 0
.327
)
EAS1.1 Detection of loss transfer transactions (0.3, 0.0)
Ste
p 2
Ste
p3
Ste
p 1
E1.1 Baseline assessment of fraud risk (0.001, 0.95)
E1.2 General economic conditions (0.0, 0.0)
EAS1.2 No similar loss transfer transaction in the past (0.0, 0.4)
EAS1.3 Existence of “Tobashi” scheme(0.95, 0.0)
A.
Att
itud
e

Fukukawa, Mock, and Srivastava: Assessing the Risk of Fraud at Olympus and 23
Identifying an Effective Audit Plan
We realize that it is difficult and somewhat unusual for auditors to conduct such additional procedures. However, current standards combined with the belief-in-fraud of 0.045 and the plausibility-of-fraud of 0.098 obtained from our evidential network (Step 3 as shown in Figure 4) would dictate that the auditors conduct additional investigation such as those illustrated above. And if the auditors had conducted such additional procedures, they likely would have detected the fraud. At least, the fraud risk assessments obtained from our evidential network implies that an unqualified opinion should not have been issued without additional evidence to make the fraud risk assessments lower.
4. Summary and Conclusions
In this study, we present an approach to auditor’s fraud risk assessment in which risk assessments are revised or updated as an auditor obtains additional evidence in each of three steps: (1) fraud risk assessment at the overall financial statement level, (2) fraud risk assessment at the account level, and (3) assessment of account, transaction and evidence schemes. The approach is rigorous in that it is based on the Theory of Belief Functions and flexible so that it is applicable to the specifics of any audit situation.
To illustrate the approach and its possible benefits, we focus on the Olympus fraud case which had an enormous impact on business and the audit profession in Japan. The approach is illustrated by assessing ‘what-if’ current professional guidance and standards and a rigorous approach to assessing risks and to integrating new audit evidence into the risk assessments had been applied to the 1999 Olympus audit. The “what-if” analysis results demonstrate that the illustrated fraud risk assessment approach would have almost certainly helped detect the Olympus financial statement fraud. As shown, if the Olympus auditor had exercised heightened professional skepticism as dictated by the explicit calculations of belief-in-fraud and plausibility-of-fraud obtained from our evidential network, they likely would have detected the fraud.
In response to the Olympus case, the Japanese standard setter (i.e., BAC) issued new auditing standards regarding responses to fraud risk assessments. The standards emphasize the importance of professional skepticism and require an auditor to heighten their skepticism when they identify the fraud triangle factors. Although the standards list examples of such fraud triangle factors, no guidance is provided about how obtained pieces of evidence are assessed and, more importantly, how their assessments of the evidence are aggregated to revise or update the fraud risk assessments. Given varying strength of audit evidence and auditors’ inability to aggregate audit evidence (e.g., Fukukawa and Mock 2012), our approach provides a useful tool for auditors to do this more rigorously and more accurately. Also, this framework and illustrations such as the Olympus case provide useful materials for training auditors within an audit firm and educating students in the classroom.

24 The Japanese Accounting Review, 4 (2014), 1-25
REFERENCES
ACCOUNTING STANDARDS BOARD OF JAPAN (ASBJ). 1999. Accounting standard for financial
instruments and its implementation guidance. ASBJ Statement 10. (in Japanese)
AMERICAN INSTITUTE OF CERTIFIED PUBLIC ACCOUNTANTS (AICPA). 2002. Consideration of
fraud in a financial statement audit. Statement on Auditing Standards 99.
BUSINESS ACCOUNTING COUNCIL (BAC). 2013. Opinion on the Standard Setting to Address Risks of
Fraud in an Audit. (in Japanese)
DELOITTE FORENSIC CENTER. 2009. Ten Things about Financial Statement Fraud - Third Edition: A
Review of SEC Enforcement Releases, 2000 - 2008.
FACTA. 2011. Olympus: Suspicion about huge losses on “foolhardy M&A”. Facta 64. (in Japanese)
FUKUKAWA H., AND T. J. MOCK. 2011. Audit risk assessments using belief versus probability.
Auditing: A Journal of Practice and Theory 30 (1): 75-99.
FUKUKAWA H., AND T. J. MOCK. 2012. Auditors’ evidence evaluation and aggregation using beliefs
and probabilities. International Journal of Approximate Reasoning 53 (2): 190-199.
GAO, L. 2005. Investigation of the perpetration and concealment process of management fraud: An
empirical analysis of fraud schemes. PhD Dissertation, University of Kansas.
GAO, L., AND R. P. SRIVASTAVA. 2011. The anatomy of management fraud schemes: Analyses and
implications. Indian Accounting Review 15 (1): 1-23.
GAO, L., T. J. MOCK, AND R. P. SRIVASTAVA. 2011. An evidential reasoning approach to fraud risk
assessment under Dempster-Shafer theory: A general framework. Proceedings of HICSS (Hawaii
International Conference on Systems Sciences) 44, Kauai, Hawaii.
GAO, L., R. P. SRIVASTAVA, T. J. MOCK, AND E. EMEIGH. 2013. A general framework for assessing
fraud risk, Working Paper, University of Kansas.
HEVNER, A. R., S. T. MARCH, J. PARK, AND S. RAM. 2004. Design science in information systems
research. MIS Quarterly 28 (1): 75-105.
INTERNATIONAL AUDITING AND ASSURANCE STANDARDS BOARD (IAASB). 2010. The auditor’s
responsibilities relating to fraud in an audit of financial statements. International Standard on
Auditing (ISA) 240. Handbook of International Quality Control, Auditing, Review, Other
Assurance, and Related Services Pronouncements (2010 Edition). IAASB: New York.
JAPANESE INSTITUTE OF CERTIFIED PUBLIC ACCOUNTANTS (JICPA). 2013. Fraud in an audit of
financial statements. JICPA Statement 240.
MARCH, S. T., AND G. SMITH. 1995. Design and natural science research on information technology.
Devision Support Systems 15 (4): 251-266.
MESSIER, W. F. JR., T. M. KOZLOSKI, AND N. KOCHETOVA-KOZLOSKI. 2010. An analysis of SEC
and PCAOB enforcement actions against engagement quality reviewers. Auditing: A Journal of
Practice and Theory 29 (2): 233-252.
MOCK, T. J., L. SUN, R. P. SRIVASTAVA, AND M. VASARHELYI. 2009. An evidential reasoning
approach to Sarbanes-Oxley mandated internal control risk assessment under Dempster-Shafer
theory. International Journal of Accounting Information Systems 10 (2): 65-78.
PEROLS, J. 2011. Financial statement fraud detection: An analysis of statistical and machine learning
algorithms. Auditing: A Journal of Practice and Theory 30 (2): 19-50.

Fukukawa, Mock, and Srivastava: Assessing the Risk of Fraud at Olympus and 25
Identifying an Effective Audit Plan
PEROLS, J. 2012. Addressing the absolute rarity, relative rarity, and data dimensionality problems in
financial statement fraud detection. Working Paper, University of San Diego.
SHAFER, G. 1976. A Mathematical Theory of Evidence. Princeton University Press: Princeton.
SRIVASTAVA, R. P. 2011. An introduction to evidential reasoning for decision making under
uncertainty: Bayesian and belief functions perspectives. International Journal of Accounting
Information Systems 12 (2): 126-135.
SRIVASTAVA, R. P., AND T. J. MOCK. 2005. Why we should consider belief functions in audit research
and practice. The Auditor's Report 28 (2): 58-65.
SRIVASTAVA, R. P., AND T. MOCK. 2002. Belief Functions in Business Decisions. Physica-Verlag,
Heidelberg, Springer-Verlag Company.
SRIVASTAVA, R. P., AND T. J. MOCK. 1999. Evidential reasoning for WebTrust assurance services.
Journal of Management Information Systems 16 (3): 11-32.
SRIVASTAVA, R. P. 1993. Belief functions and audit decisions. The Auditor’s Report 17 (1): 8-12.
SRIVASTAVA, R.P. AND G. R. SHAFER. 1992. Belief-function formulas for audit risk. The Accounting
Review 67 (2): 249-283.
THE THIRD-PARTY COMMITTEE OF OLYMPUS. 2011. Investigation Report. (in Japanese)
WEIL, J. 2004. Behind wave of corporate fraud: A change in how auditors work, The Wall Street Journal
(March 25, 2004).