Embed Size (px)
Citation preview
International Journal of Scientific and Research Publications, Volume 3, Issue 11, November 2013 1 ISSN 2250-3153
www.ijsrp.org
Assessing the quality of pipe borne water using Magnetic
Susceptibility Measurements
Bannor K. Antwi-Boasiako, Kwasi Preko and Kenny. M. Graham
Department of Physics, Kwame Nkrumah University of Science and Technology, University Post Office, PMB, Kumasi, Ghana
Abstract- Magnetic susceptibility measurements and chemical
analysis were performed on samples of water taken from the
academic and residential areas of the Kwame Nkrumah
University of Science and Technology (KNUST) campus,
Kumasi. The aim of these measurements was to see if water
delivered through metallic pipes was clean. Magnetic
susceptibility measurements were performed using the
Bartington MS2 magnetic susceptibility meter, with MS2G
single frequency sensor and the chemical analysis was performed
with the Varian SpectrAA 220FS Atomic Absorption
Spectrometer. Results of the measurements showed that the
water samples had negative magnetic susceptibility (χ) values of
the order of 10–5
and were thus diamagnetic. The χ values
obtained for the samples were between –1.3 10-6
SI and –1.23
10-5
SI for the Academic Area (sampled colleges) and –3.0
10-7
SI and –8.7 10-6
SI for the Residential Area (sampled Halls
of residence). Chemical analysis of the samples showed variation
in the concentrations of iron and zinc. Regression analysis of
their concentrations with their χ values revealed zinc to have a
strong inverse relationship with a correlation coefficient of 73%.
Although the study showed some level of metallic contamination
in the water samples of average concentration of 0.03mg/l, these
were well below the concentration of 3mg/l which is of
detrimental concern as outlined by the World Health
Organization (WHO). This makes drinking water from the study
area safe for drinking.
Index Terms- Magnetic Susceptibility, Diamagnetic, Water
sample, chemical analysis, metal contamination.
I. INTRODUCTION
ater is one of the most essential needs for the continued
existence of all living organisms on earth. The day-to-day
activities of all living organisms require water in different forms.
It is effectively and efficiently put into use by plants, animals,
microorganisms and man. In the microbial world, no single
microorganism has been discovered to be active at the extreme
lack of water and this is the singular reason that man cannot exist
without water; it is of paramount importance to monitor domestic
water supply (Sofola and Lawal, 1983). Unsafe water is a global
public health threat, placing persons at risk for a host of
diarrhoea and other diseases as well as chemical intoxication
(Hughes and Koplan, 2005). The provision of treated water to the
inhabitants of the city is a civic responsibility of the city
administration. The presence of good treated water is essential
for good health and the elimination of some water borne
diseases.
It is known that corrosion of household plumbing systems
(made mostly of metallic material) can contaminate the water
that passes through them through the release of metallic particles,
like Fe, Al, Zn amongst others. Concentrations of iron in
drinking-water are normally less than 0.3 mg/litre but may be
higher in countries where cast iron, steel, and galvanized iron
pipes are used for water distribution (WHO, 2003). High metallic
content in water can cause liver or kidney damage or high blood
pressure when one is exposed to it for a long time. Moreover,
hardness of water is caused largely by calcium and magnesium
salts and to a small extent by iron, aluminium, and other metals
(Microsoft Encarta 2009). Since water is basically used for
everything on the campus of Kwame Nkrumah University of
Science and Technology (KNUST), it became imperative to
ascertain the metallic content of pipe borne water on KNUST
campus using magnetic susceptibility and atomic absorption
spectrometry methods.
The determination of magnetic susceptibility is a useful,
sensitive and fast method and is used in mineralogy and pollution
research. Recently, magnetic susceptibility has been adapted as a
tool for the mapping of pollutant distribution (Canbay, 2010,
Canbay et al., 2009; Wang and Qin 2005). The magnetic
measurement is considered as a rapid and affordable screening
tool for the determination of the spatial distribution of
contamination level. The use of magnetic susceptibility
measurement as a proxy for the chemical method of assessing
pollution is possible because pollutants and magnetic minerals
are genetically related (Hanesch and Scholger 2002). During the
1970s and 1980s, scientists realised that magnetic properties
were useful for describing and classifying all types of
environmental materials. Many studies are available in literature
where heavy metal contamination and industrial activities
causing soil, air or water pollution were investigated (Canbay
2010; Vadiunina et al., 1972; Tite et al., 1975; Mullins et al.,
1973, 1977).
In addition, magnetic susceptibility has shown to be a highly
useful indicator of industrial pollution, gas emission into air due
to traffic and other atmospheric pollutants (Canbay 2010;
Thompson et al., 1986; Hay et al., 1997; Strzyszcz and Magiera ,
1998; Durza, 1999; Kapicka et al., 1997, 2003; Lecoanet et al.,
1999, 2001; Knab et al., 2001; Hanesch et al., 2003, 2005; Lu et
al., 2007).
This paper investigates the quality of water delivered
through metallic pipes at KNUST campus, Kumasi by using
magnetic susceptibility measurements vis-à-vis chemical
analyses.
W

International Journal of Scientific and Research Publications, Volume 3, Issue 11, November 2013 2
ISSN 2250-3153
www.ijsrp.org
II. MATERIALS AND METHODS
2.1 Project Site Description
The Kwame Nkrumah University of Science and
Technology is located in Kumasi, the Ashanti Regional capital,
bounded between latitudes 6° 41′ 15″ N and 6° 39′ 39″ and
longitude 1° 35′ 11″ W and 1° 32′ 51″ of Ghana. It is about 18
square kilometres in area, and is located about 13 km to the east
of Kumasi, with a student population of about 32,198 as at 2012.
It is the second public university established in the country. The
experiments were carried out in five halls of residence on the
campus (namely Africa Hall (established in 1967), Independence
Hall (established in 1959), Queen Elizabeth II Hall (established
in 1959), Republic Hall (established in 1961), Hall and Hall
seven (established in 2011)) and 5 colleges (namely the College
of Agriculture and Natural Resources, College of Health
Sciences, College of Art and Social Sciences, College of
Architecture and Planning, College of Engineering, and College
of Science).
Figure 1: Satellite map of KNUST campus from Google Earth, showing Residential and Academic area
2.2 Water Supply Network at KNUST The supply of water to the Kumasi Metropolis is from two
surface water treatment plants; Owabi and Barekese head works
located 10 km and 16 km respectively from Kumasi.
Figure 2: Geological Map of Kumasi Area showing the Catchment of Barekese and Owabi Reservoirs.
International Journal of Scientific and Research Publications, Volume 3, Issue 11, November 2013 3
ISSN 2250-3153
www.ijsrp.org
The supplies of water from these head works serve Kumasi
metropolis as well as surrounding communities outside the
metropolis. Treated water is pumped from Barekese and Owabi
head works through steel and iron mains for 22 km and 14 km
respectively to the Suame town where it is centrally monitored.
The quality of water is monitored in a central laboratory at
Suame and at 150 other points in the distribution system
(Blokhuis et al., 2005). Some treated water is later pumped to the
1,900,000 litres capacity reservoir located at KNUST. This
reservoir serves the KNUST campus.
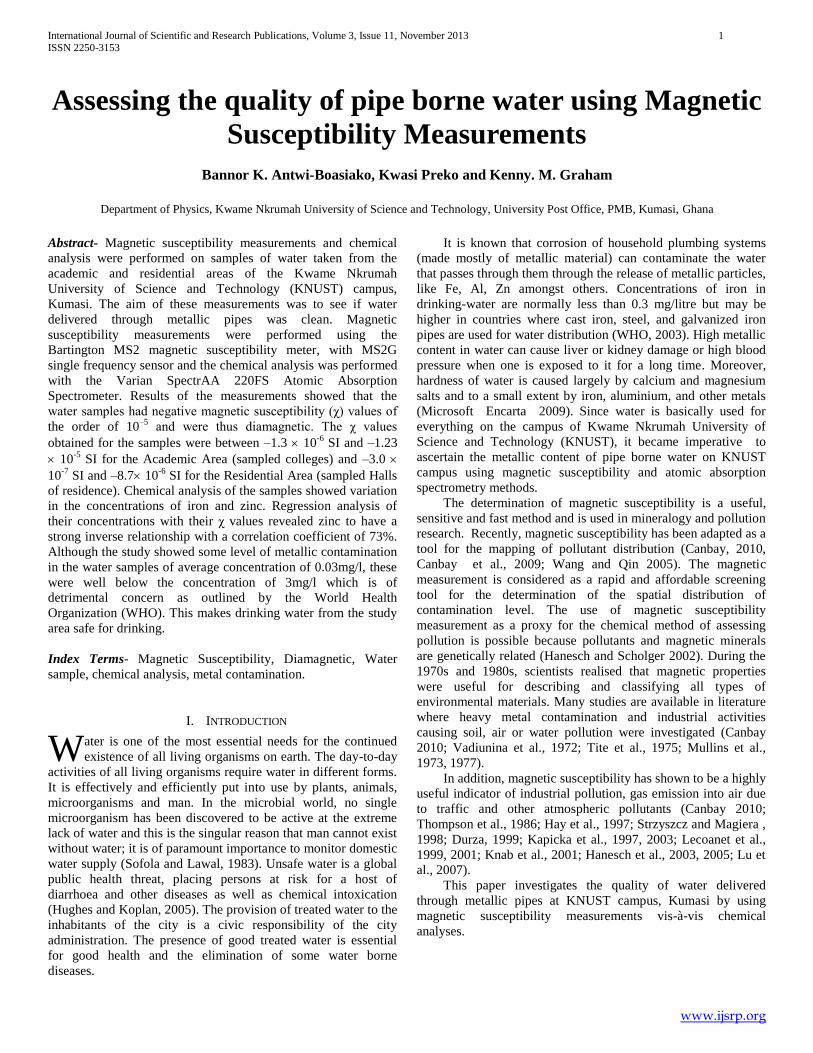
2.3 Magnetic Susceptibility Measurements
The magnetic susceptibility measurements were conducted
using the magnetic susceptibility meter (Figure 3 b, MS2,
Bartington Instruments Ltd., UK) with MS2G Single Frequency
Sensor (Figure 3 a). The set was mounted higher up on a wooden
bench to remove, as much as possible, the contaminating
influence from metallic substances like buried metallic pipes or
cables which might be present in the area.
Figure 3: (a) MS2G Single Frequency Sensor (b) Bartington MS2 meter
All sampling experiments were carried out in a way to
minimise contamination from ferrous metal, since that metallic
contamination can affect the susceptibility readings.
Furthermore, in order to minimise error in the susceptibility
readings, the 1 ml sample tubes were filled fully and with the
same volume of the samples while special care was taken in
placing the sample in the MS2G sensor. In all a total of 100
samples of 1 ml tubes were taken from the study area, with 50
samples from the academic area and remaining 50 samples from
the residential area. To enhance the quality of the readings, the
more sensitive 0.1 range on the meter was used and for each
measurement, three readings were taken and the average
recorded.
2.4 Chemical Analysis
Metallic concentrations of As, Cu, Pb, Fe, Cd, Ni, Cr and
Zn were determined for the samples by atomic absorption
spectrometry using the Varian SpectrAA 220FS Atomic
Absorption Spectrometer. The results of the chemical analysis
are shown in Table 11. It was seen that only Zn and Fe showed
variation in concentrations for the various water samples,
suggesting that the magnetic susceptibility differences recorded
were caused by the presence of these metals. Consequently,
graphs of magnetic susceptibility were plotted against metallic
concentrations for Fe and Zn with linear regression fits to
establish the relationship between the metal concentrations and
magnetic parameters of the water samples.
(b)
(a)

International Journal of Scientific and Research Publications, Volume 3, Issue 11, November 2013 4
ISSN 2250-3153
www.ijsrp.org
Figure 4: SpectrAA 220, Absorption Spectrometer
III. RESULTS AND DISCUSSION
The results of the experiment showed that samples taken at
different locations had different responses when exposed to an
externally applied magnetic field and thus had different magnetic
susceptibility values. It was observed that the magnetic
susceptibility values of the pipe borne water samples were
negative and within the range -3.00×10⁻⁷
SI to -1.23×10⁻⁵
SI.
Water samples from the Academic area were seen to be more
diamagnetic than those from the Residential area. The magnetic
susceptibility values obtained for the samples were between -
1.30×10⁻⁶
SI and -1.23 × 10⁻⁵
SI for the Academic area (i.e. water
samples from the colleges) and between -3.00 × 10⁻⁷
SI and -
8.70×10⁻⁶
SI for the Residential area ((i.e. water samples from
the halls of residence).
The average magnetic susceptibility values for the academic
area and the halls of residence were -4.9×10⁻⁶
SI and -4.8×10⁻⁶
SI, respectively. The Republic Hall recorded the highest χ value
of -3.0×10⁻⁸
SI while Hall Seven had the least susceptibility
value of -8.7 ×10⁻⁷
SI. For the academic area, College of
Agriculture had the highest susceptibility value of -1.3×10⁻⁷
SI
with the College of Architecture recording the least
susceptibility value of -1.23×10⁻⁶
SI.
It was also observed that the magnetic susceptibility values
of the samples were negative indicating that they were
diamagnetic. The magnetic susceptibility values for the samples
were however, generally, higher than the theoretical magnetic
susceptibility value of water, -9.05×10⁻⁶
SI. This suggests the
presence of some metals (like zinc or iron particles) in the water
samples. From Table 6, sample S2 from the Republic Hall had
the highest susceptibility value of-3.0×10⁻⁸
SI. This may be
attributed to the contamination of the water by magnetic
materials like iron (caused by the rusting of the iron pipe-stand).
At the College of Science, samples from the New Complex
Building (Table 1) had the least susceptibility values and these
were closer to the theoretical value than samples from the
Physics Block. The physical observation on the two buildings
showed that most of the plumbing systems at the Physics Block
looked old and rusty as compared to the New Science Complex
which had new plumbing system. Water from the Physics Block
may thus be contaminated with some amount of ironic materials.
At Hall Seven, Table 9, the measured susceptibility values were
closer to that of the theoretical value. This indicates that the
metallic content in the samples were very small amount and this
is so because Hall Seven is, relatively, a new hall with new and
clean plumbing system.
Generally, places with lower magnetic susceptibility values,
in terms of magnitude, had their pipe stands being rusty
indicating the presence of some metal content like iron or zinc in
them. This is so based on the research by Talara et al (2002)
which suggests that a high magnetic susceptibility anomaly could
be attributed to the presence of metallic components.

International Journal of Scientific and Research Publications, Volume 3, Issue 11, November 2013 5
ISSN 2250-3153
www.ijsrp.org
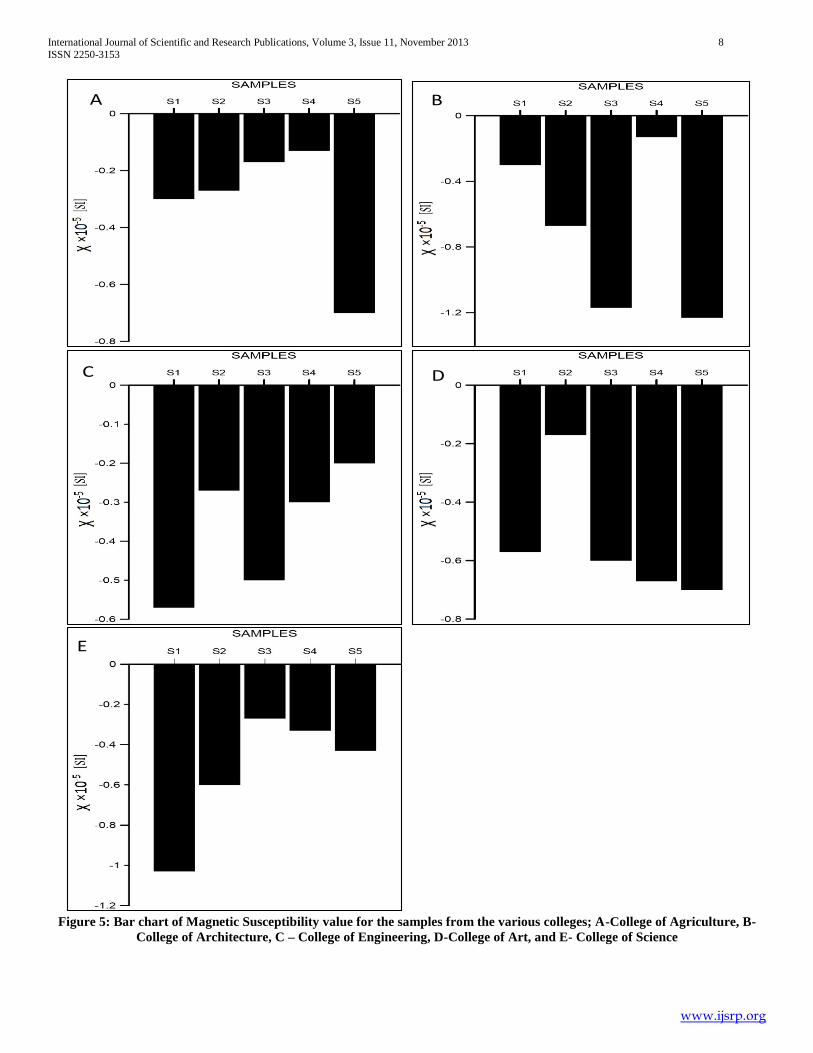
Table 1: Magnetic Susceptibility value for samples from College of Science
Sample Notation Susceptibility, χ ×10-5 SI
Goundfloor Pipe-Stand Near The Auditorium S1 -1.03
Physics Male Wash Room S2 -0.60
Physics Stand-Pipe Ground Floor S3 -0.27
Mathematics Department Male Wash Room S4 -0.33
Mathematics Department Female Wash Room S5 -0.43
Table 2: Magnetic Susceptibility value for samples from College of Agriculture
Sample Notation Susceptibility, χ ×10-5 SI
Standing Pipe S1 -0.30
Entomology Lab S2 -0.27
Plant Pathology Lab Ground Floor S3 -0.17
Natural Resource Lab S4 -0.13
Natural Resource Wash Room S5 -0.70
Table 3: Magnetic Susceptibility value for samples from College of Architecture
Sample Notation Notation
Ground Floor Male Wash Room I S1 -0.30
Ground Floor Female Wash Room I S2 -0.67
Pipe Stand (Water Was Warm) S3 -1.17
Ground Floor Male Wash Room Ii S4 -0.13
Ground Floor Female Wash Room Ii S5 -1.23
Table 4: Magnetic Susceptibility value for samples from College of Engineering
Sample Notation Susceptibility, χ ×10-5 SI
Second Floor Male Wash Room S1 -0.57
First Floor Female Wash Room S2 -0.27
Pipe Stand Adjacent Auditorium S3 -0.50
Communication Wash Room Second Floor S4 -0.30
Electrical Laboratory S5 -0.20

International Journal of Scientific and Research Publications, Volume 3, Issue 11, November 2013 6
ISSN 2250-3153
www.ijsrp.org
Table 5: Magnetic Susceptibility value for samples from College of Arts
Sample Notation Susceptibility, χ ×10-5 SI
Painting S1 -0.57
Wash Room Near Studio S2 -0.17
Nursery Poly Tank I S3 -0.60
Nursery Poly Tank II S4 -0.67
Sculpture Wash Room S5 -0.70
Table 6: Magnetic Susceptibility value for samples from Republic Hall
Sample Notation Susceptibility, χ ×10
-5 SI
Flat One S1 -0.17
SRC Ground Floor S2 -0.03
Block B S3 -0.07
Zongo Area S4 -0.70
SRC Second Floor S5 -0.53
Table 7: Magnetic Susceptibility value for samples from Africa Hall
Sample Notation Susceptibility, χ ×10
-5 SI
Ground Floor Stand-Pipe S1 -0.27
First Floor Block A S2 -0.13
Second Floor Block A S3 -0.10
First Floor Block B S4 -0.30
Second Floor Block B S5 -0.43

International Journal of Scientific and Research Publications, Volume 3, Issue 11, November 2013 7
ISSN 2250-3153
www.ijsrp.org
Table 8: Magnetic Susceptibility value for samples from Independence Hall
Sample Notation Susceptibility, χ ×10
-5 SI
Stand Pipe Near Shops S1 -0.53
Wash Room, West Of West Wing S2 -0.13
Wash Room, East Of West Wing S3 -0.67
Wash Room, West Of East Wing S4 -0.83
Wash Room, East Of East Wing S5 -0.60
Table 9: Magnetic Susceptibility value for samples from Hall Seven
Sample Notation Susceptibility, χ ×10-5
SI
Ground Floor Left-End Of M Block S1 -0.77
Ground Floor Left-End Of O Block S2 -0.63
Ground Floor Right-End Of O Block S3 -0.87
Central Pipe-Stand S4 -0.73
Ground Floor Right-End Of M Block S5 -0.80
Table 10: Magnetic Susceptibility value for samples from Queen Elizabeth II Hall
Sample Notation Susceptibility, χ ×10-5
SI
West Wing, First Floor S1 -0.13
Polytank Right-End, Zongo Area S2 -0.54
East Wing, Third Poly Tank S3 -0.43
Polytank Left-End, Zongo Area S4 -0.83
Polytank Nearest Potters' Lodge S5 -0.77
International Journal of Scientific and Research Publications, Volume 3, Issue 11, November 2013 8
ISSN 2250-3153
www.ijsrp.org
A
D C
B
E
Figure 5: Bar chart of Magnetic Susceptibility value for the samples from the various colleges; A-College of Agriculture, B-
College of Architecture, C – College of Engineering, D-College of Art, and E- College of Science

International Journal of Scientific and Research Publications, Volume 3, Issue 11, November 2013 9
ISSN 2250-3153
www.ijsrp.org
A
D C
B
E
Figure 6: Bar chart of Magnetic Susceptibility value for the samples from the various Halls of Residence; A- Republic Hall, B-
Africa Hall, C- Independence Hall, D- Hall seven, and E- Queen Elizabeth II Hall

International Journal of Scientific and Research Publications, Volume 3, Issue 11, November 2013 10
ISSN 2250-3153
www.ijsrp.org
3.1 Water Chemical Analysis
Chemical analysis was carried out to determine the metallic
concentrations of As, Cu, Pb, Fe, Cd, Ni, Cr and Zn using the
Varian SpectrAA 220FS Atomic Absorption Spectrometer. Table
11 displays the concentrations of the various heavy metals
analysed.
Table 11: Concentrations of some heavy-metal from chemical analysis
As(ppm) Cu(ppm) Pb(ppm) Fe(ppm) Cd(ppm) Ni(ppm) Cr(ppm) Zn(ppm)
Agriculture 0.003 0.006 0.003 0.026 0.003 0.003 0.003 0.023
Art 0.003 0.006 0.003 0.045 0.003 0.003 0.003 0.021
Architecture 0.003 0.006 0.003 0.012 0.003 0.003 0.003 0.035
Engineering 0.003 0.006 0.003 0.011 0.003 0.003 0.003 0.035
Science 0.003 0.006 0.003 0.021 0.003 0.003 0.003 0.035
Africa Hall 0.003 0.006 0.003 0.014 0.003 0.003 0.003 0.006
Republic Hall 0.003 0.006 0.003 0.022 0.003 0.003 0.003 0.033
Queens 0.003 0.006 0.003 0.032 0.003 0.003 0.003 0.028
Independent Hall 0.003 0.006 0.003 0.026 0.003 0.003 0.003 0.007
Hall 7 0.003 0.006 0.003 0.024 0.003 0.003 0.003 0.077
Table 12: Concentrations of Fe and Zn and the magnetic susceptibility values of water samples
Fe(ppm) Zn(ppm) Fe [mg/l] Zn [mg/l] Magnetic Susceptible Values
Average High Low
Africa 0.014 0.006 0.0140 0.0060 -0.27 -0.13 -0.43
Republic 0.022 0.033 0.0220 0.0330 -0.17 -0.03 -0.70
Hall 7 0.024 0.077 0.0240 0.0769 -0.63 -0.73 -0.87
Independent 0.026 0.007 0.0260 0.0070 0.53 -0.13 -0.83
Queens 0.032 0.028 0.0320 0.0280 -0.77 -0.13 -0.83
Agriculture 0.026 0.023 0.0260 0.0230 -0.30 -0.13 -0.70
Art 0.045 0.021 0.0449 0.0210 -0.57 -0.17 -0.70
Architecture 0.012 0.035 0.0120 0.0350 -1.17 -0.13 -1.23
Engineering 0.011 0.035 0.0110 0.0350 -0.50 -0.20 -0.57
Science 0.021 0.035 0.0210 0.0350 -0.43 -0.27 -1.03
International Journal of Scientific and Research Publications, Volume 3, Issue 11, November 2013 11
ISSN 2250-3153
www.ijsrp.org
A
D C
B
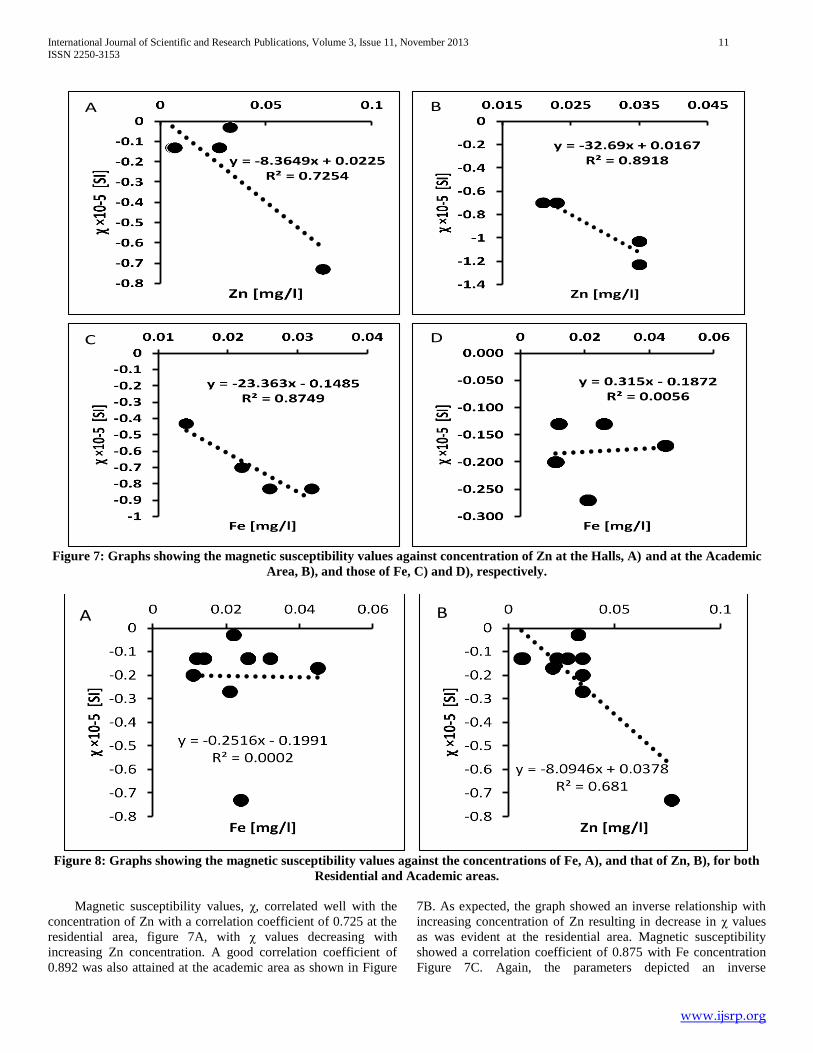
Figure 7: Graphs showing the magnetic susceptibility values against concentration of Zn at the Halls, A) and at the Academic
Area, B), and those of Fe, C) and D), respectively.
A B
Figure 8: Graphs showing the magnetic susceptibility values against the concentrations of Fe, A), and that of Zn, B), for both
Residential and Academic areas.
Magnetic susceptibility values, χ, correlated well with the
concentration of Zn with a correlation coefficient of 0.725 at the
residential area, figure 7A, with χ values decreasing with
increasing Zn concentration. A good correlation coefficient of
0.892 was also attained at the academic area as shown in Figure
7B. As expected, the graph showed an inverse relationship with
increasing concentration of Zn resulting in decrease in χ values
as was evident at the residential area. Magnetic susceptibility
showed a correlation coefficient of 0.875 with Fe concentration
Figure 7C. Again, the parameters depicted an inverse

International Journal of Scientific and Research Publications, Volume 3, Issue 11, November 2013 12
ISSN 2250-3153
www.ijsrp.org
relationship. The χ values increased with increasing
concentration of Fe at the Academic area with a weak correlation
coefficient of 0.006, Figure 7D.
Averagely for both academic and residential areas, Fe
concentration did not have a good correlation with χ values as
seen in Figure 8A, which reveals a correlation coefficient of
0.0002. This suggests that Fe may not be the main cause of the
variation in χ values of the water samples. In Figure 8B, the
concentration of Zn shows good correlation coefficient of 0.681
with χ values. The negative slope suggests an inverse
relationship. Thus, increasing concentration of the Zn results in a
decrease in the χ values. Zn concentration in drinking water is
higher as a result of the leaching of zinc from piping and fittings
in tap water (WHO, 2003).
Zinc has the potential of imparting an undesirable astringent
taste to water. According to WHO (2003), drinking water usually
makes a negligible contribution to zinc intake (Table 12) by
humans unless high concentrations of zinc occur as a result of
corrosion of piping and fittings. Given certain situations, tap
water can provide up to 10% of the daily intake. Acute toxicity
arises from the taking in of excessive amounts of zinc salts,
either accidentally or deliberately as an emetic or dietary
supplement. Consuming more than 500 mg of zinc sulphate may
cause vomiting. Drinking water containing zinc at levels above 3
mg/l tends to be opalescent, develops a greasy film when boiled,
and has an undesirable astringent taste. The concentrations of
zinc in the pipe-borne water for both the residential and academic
areas of KNUST were well below harmful levels, thus, proving
good potable water for all kinds of use.
IV. CONCLUSIONS AND RECOMMENDATIONS
Results of the measurements showed that the water samples
had negative values of magnetic susceptibility of the order of 10–
5 and were thus diamagnetic. The magnetic susceptibility values
obtained for the samples were between –1.310-6
SI and –
1.2310-5
SI for the Academic Area (sampled colleges) and
between –3.0 10-7
SI and –8.7 10-6
SI for the Residential Area
(sampled Halls of residence). These point to the fact that the
samples from the study area may contain some amount of
metallic content. The mean magnetic susceptibility values of the
samples significantly deviated from the EPA or WHO value for
water (–9.05×10⁻⁶
SI).
Chemical analysis of the samples, by absorption
spectrometry, showed varying concentrations of iron and zinc in
the water samples. Statistical analysis proved zinc concentration
to have an inverse relationship with magnetic susceptibility and a
good correlation coefficient of 0.726. Whereas, iron proved not
to be the main cause of the variation of the magnetic
susceptibility values having a poor correlation coefficient of
0.0002. The average concentration of zinc, 0.030mg/l, is well
below the amount of detrimental concern, 3mg/l (WHO, 2003),
in the pipe-borne water for both the residential and academic
areas of KNUST. Thus, making the water here potable for all
purposes and usage.
ACKNOWLEDGMENTS
We are thankful to the Physics Department of KNUST for
partly supporting the project. We appreciate the great work done
by our field personnel and acknowledge the permission granted
us by the colleges and halls from where data was taken.
REFERENCES
[1] Blokhuis, M., Brouwer, R., Hulscher, R., and Thiadens, A. (2005.). Feasibility Study Barekese Water Expansion Project, Kumasi, Ghana. Draft Report Project Number - 9R3818, 73.
[2] Canbay, M. (2008.). Magnetic Susceptibility and Magnetic Anisotropy Studies in the Armutlu Peninsula. The 18th International Geophysical Congress and Exhibition of Turkey. Turkey.
[3] Canbay M. ., Aydin A., and Kurtulus C., (2009). Magnetic susceptibility and heavy metal contamination in topsoils along the Izmit Gulf coastal area and IZAYTAS, (Turkey), Journal of Applied Geophysics, doi:10.1016/j.jappgeo.2009.11.002, Vol.70 (1), pp, 46-58.
[4] Canbay, M. (2010). Investigation of the relation between heavy metal contamination of soil and its magnetic susceptibility. International Journal of Physical Sciences, 5(5), 393-400.
[5] Durza, O. (1999). Heavy Metals Contamination and Magnetic Susceptibility in Soils around Metallurgical Plan. Phys. Chem. Earth, Part A solid Earth Geod., 24(6), 541-543.
[6] Gelioli, K., and Aydin, A. (1998). Investigation of Environmental Pollution Using Magnetic Susceptibility Measurements. European Journal of Environmental and Engineering Geophysics, 3, 53-61.
[7] Hanesch, M., and Schloger, R. (2002). Mapping of heavy metal loadings in soils by means of magnetic susceptibility measurements. Environmental Geology, 42, 857-870.
[8] Hanesch, M., Scholger, R., & Rey, D. (2003). Mapping dust distribution around an industrial site by measuring magnetic parameters of tree leaves. Atmospheric Environment, 37(36), 5125-5133.
[9] Hanesch, M., & Scholger, R. (2005). The influence of soil type on the magnetic susceptibility measured throughout soil profiles. Geophysical Journal International, 161(1), 50-56.
[10] Hatscher, S., Schilder, H., Lueken, H., and Urland, W. (2005). Practical guide to measurement and interpretation of magnetic properties (IUPAC Technical Report). Pure and Applied Chemistry, 77(No. 2), 497–511,.
[11] Hay, K., Dearing, J., Baban, S., and Loveland, P. (1997). Preliminary attempt to identify atmospherically-derived pollution particles in English topsoils from magnetic susceptibility measurements. Physics and Chemistry of the Earth, 22, 207-210.
[12] Hughes, J., and Koplan, J. (2005). Saving lives through global safe water. Journal of Emerging Infectious Disease, 11(10), 1636-1637.
[13] Kapıcka, A., Jordanova, N., Petrovský, E., and Podrazský, V. (2003). Magnetic study of weakly contaminated forest soils. Water, Air, and Soil Pollution, 148, 31–44.
[14] Kapicka, A., Petrovsky, E., and Jordanova, N. (1997). Comparıson Of In Sıtu Fıeld Measurements Of Soıl Magnetıc Susceptıbılıty Wıth Laboratory Data. Studia Geophysica et Geodaetica, 41.
[15] Knab, M., Appel, E., and Hoffmann, V. (2001). Separation of the anthropogenic portion of heavy metal contents along a highway by means of magnetic susceptibility and fuzzy c-means cluster analysis. European Journal of Environmental and Engineering Geophysics, 6, 125-140.
[16] Lecoanet, H., Lévêque, F., & Segura, S. (1999). Magnetic susceptibility in environmental applications: comparison of field probes. Physics of the Earth and Planetary Interiors, 115(3), 191-204.
[17] Lecoanet, H., Lévêque, F., & Ambrosi, J. P. (2001). Magnetic properties of salt-marsh soils contaminated by iron industry emissions (southeast France). Journal of Applied Geophysics, 48(2), 67-81.
[18] Lu, S., Bai, S., and Xue, Q. (2007). Magnetic properties as indicators of heavy metals pollution in urban topsoils. Geophysical Journal International, 171, 568-580.
[19] Microsoft ® Encarta ®. (2009). Water,. © 1993-2008 Microsoft Corporation.

International Journal of Scientific and Research Publications, Volume 3, Issue 11, November 2013 13
ISSN 2250-3153
www.ijsrp.org
[20] Mullins, C. (1977). Magnetic susceptibility of the soil and its significance in soil science. Journal of Soil Science, 28, 223-246.
[21] Mullins, C., and Tite, M. (1973). Magnetic viscosity, quadrature susceptibility and frequency dependence of susceptibility in single– domain assemblages of magnetite and maghaemite. Journal of Geophysical Research, 78, 804-809.
[22] Scholger, R. (1998-1999). Heavy Metal Pollution Monitoring by Magnetic Susceptibility Measurements Applied to Sediments of Mur (Styria, Austria). European Journal of Environmental and Engineering Geophysics, 3, 25-37.
[23] Sofola, T., and Lawal, M. (1983). Bacteriological analysis of water samples from main taps and domestic water storage tanks in metropolitan Lagos Niger. Medical Practice, 6(3), 95-98.
[24] Strzyszcz, Z., and Magiera, T. (1998). Magnetic susceptibility and heavy metals contamination in soils of Southern Poland. Physics and Chemistry of the Earth, 23(9-10), 1127-1131.
[25] Talara, M., Ungui, L., and Pamatong, L. (2002). Measuring Magnetic Susceptibility Of Iligan Bay Waters. Department of Physics, MSU-IIT: 9200 Iligan City.
[26] Thompson, R., and Oldfield, F. (1986). Environment Magnetism. London: Allen and Unwin.
[27] Tite, M., and Linington, R. (1975). Effect of climate on the magnetic susceptibility of soils. Nature, 256, 565 - 566. doi:10.1038/256565a0
[28] Vadiunina, A., and Babanin, V. (1972). Magnetic susceptibility of some soils in the U.S.S.R. Soviet. Soil Science, 6, 106-110.
[29] Wang, Z., and Qin, Y. (2005). Correlation between magnetic susceptibility and heavy metals in urban topsoil: a case study from the city of Xuzhou. Environmental Geology, 49, 10-18.
[30] World Health Organization (WHO). (1996). Guidelines for drinking-water quality. Geneva: WHO.
[31] World Health Organization (WHO). (2003). Zinc In Drinking-Water, Background document for development of WHO. Guidelines for Drinking-water Quality. WHO /SDE/WSH/03.04/17
AUTHORS
First Author – Bannor K. Antwi-Boasiako, MSc, Department of
Physics, Kwame Nkrumah University of Science and
Technology (KNUST) [email protected]
Second Author – Kwasi Preko, Senior Lecturer, KNUST,
Third Author – Kenny. M. Graham, MSc KNUST,
Correspondence Author – Bannor K. Antwi-Boasiako,
[email protected], [email protected] , +233 207032616
![(Part – 3) BiologyDiseases of Crop Plants (Seed-Borne, Soil-Borne, Air-Borne and Water-Borne Diseases)], Control of Crop Diseases, Storage of Grain, Animal Husbandry, Cattle Farming](https://img.dokumen.tips/doc/110x75/60d69e1accea32356d5e5a19/part-a-3-diseases-of-crop-plants-seed-borne-soil-borne-air-borne-and-water-borne.jpg)