Embed Size (px)
Citation preview

"Techilcal Paper 264 ",
ASSESSING THE PREVALENCE OF ILLICIT
DRUG USE IN THE ARMY
Paul HurstInstitute for Research
and
Royer F. Cook and Douglas A. RamsayArmy Research Institute for the Behavioral and Social Sciences
SOCIAL PROCESSES TECHNICAL AREA
~NOV 1 0 1x-
JUI A:
CL-
U. S. Army
Research Institute for the Behavioral and Social SciencesC_,
July 1975
Approved for public releas; distri'bvtion unlimited.
'-S•

U. S. ARMY RESEARCH INSTITUTE
FOR THE BEHAVIORAL AND SOCIAL SCIENCES
A field Operating Agency under the Jurisdiction of the
Deputy Chief of Staff for Personnel
W. C. MAUSJ.EUHLANER COLIGS
I Technical Director Commander
-4
Research accomplished
* under contract to the Department of the ArMy
4 HRB-Singer, Incorporated
*1
NOTICES
DISTRIBUTION: Primary distribution of this report has been made by ARI, Plea. address correspondenceconcerning distribution of reports to: U. S. Army Research Institute for the Behavioral and Social Sciences.ATTN: PERI-P, 1300 Wilson Boulevard, Arlington, Virginia 22209.
I
¶ FINAL DISPaSITiQN: Thic report vy�ay be destroyed when it is no longer needed. Pleas. do not return it toth� U. S. Army Research Institute for the Behavioral and Social Sciences,
IL The findings in this report are not to be construed as an official Department of the Army position,unless so designated by other euthorized documents.
I'4
.................................................... �.......... , U . U --

Unclassified
SECURiTY CLASSIPICAYION Or Tools PAGE MWen Dea £lta ____________________
"REPORT DOCUMENTATION PAGE EAD CPSTRUCTIONS MUNRT NUMER " 30VT ACCESSION NO, 8, MKCIPIENTS CATALOG NUMlieR
Techrical Paper 264 C"__
,1, TIT,1t (AndiM .. .. . . .. TYPE OF RC•, a PERIOD COVERED
ASSESSING TEPEANCOFILLICIT DRUG USEIN TH, PERFORMING ORO. REPORT NUMSERI
"44664-F1. AUTNOR(&) C, COTRACT OR GRANT NUMPER(e)
Paul HutSt, Institute for Research, andR. F. Cook and D. A. Ramsay, ARI DAHC-19-73-C-0008
9. PRAFORMIN ORG6ANIZATION NAMiE AN ADDRESS IM O*R0'IOGRM LEMENT, PROJEgCT. TASKARE A 6 WORK UNIT NUMERS
•ERB-Singer, Inc.
State College, PA 16801 2Q163101A752
II. CONTRO.LINO OFFICE HAMM LA•O ADoRESS t. REPORT OATE
Deputy Chief of Staff for Personnel July 1975VQDA DAPE-HA IS. NUMBER OF PAGES
Washington, DC 20310 32TA. MONITORING AGENCY NAME 6 ADORESSQI dillergd Iena Controlling 011`10c) IS. SECURITY CL^SS. (of this tae"o)
U.S. Army Research Institute for the Behavioral Unclassifiedaand Social Sciences1300 Wilson Blvd. 0S. OECLAS'I PICATIONIOOWNGRAOIk G
Arlinýgton, VA 22209 SCH OULE1S. DISTRISUTION STATEMENT tof, ths • eo•)• ,
Approved for public release; distribution unlimited
17. OISTIR1UTION STATEMENT (o h. e-astract ,e.nted In Block 20. it diferent howr Report)
Is, SUPIPLEMENTARY NOTES
IS. KEY WORDS (Coni•inu.e on reverse side. .• noc s.ry mnd fdonitty by blot*& .m*b)
Drug abuseIllicit drugsUrinalysisPrevalence of illicit drug use
20,. ABSTRACT (Coiilawo, on rovetee aide it hnecessary and identify by bliock ntinbor)lThe Social Processes Technical Area of ARI has developed a brief anonymous
self-report questionnaire to provide estimates of the prevalence and patternsof illicit drug use, as part of a larger effort to identify social and organi-zational factors in drug abuse in the Army. Random urinalysis (the basis ofmost official Army prevalence estimates) is a logical indicator of prevalenceof drug abuse in a system in which individuals must be identified to be cured;a questionnaire is an equally logical indicator of drug abuse'as a complex
"DD ,PO# 7,3 1473 EDIVIONOFINOVSSISOBSOLETE Unclassified
SECURITY CLASSIFICATION OF THIS PAGE (When Data Jn!ered)
A.

.47
-. - UnclassifiedSECURITY CLASS~IFCATION OF THIS PAOI(Wbm ee 004Anlf*
-.. social problem in which most individuals vary their patterns and levelsof drug use with circumstances. >I
She questionnaire was administered March-June 1973 to personnel in TOEunits in the U.S., Germany, and Korea. Usable responses (71% of total responseswere returned from 17,141 enlisted men, E1-E5, from 398 units.", A test-retestprocedure indicated sufficient reliability for the questionnaire, which asked
*- respondents to indicat.e frequency of recent use (daily; 15-30, 7-14, 3-6, 1-2,or 0 days "last month") for alcohol, marijuana, hallucinogens, amphetamines (A),barbiturates (B), other sedatives, cocaine, methadone (M), and other opiates (0).
Percentages of laboratory drug positives for A, B, M, and 0 from urinalysiswere aggregated separately for TO!E units from six posts in the U.S. and adivision in Germany, for the periods including and symmetrically bracketing thedate the questionnaire was given in each area. These figures were comparedwith the percentage of positives which could be statistically predicted fromthe self reports (adjusting for the occasional user's vulnerability to uri-nalysis detection).
-ý.The questionnaire indicated that 40% of the respondents had used marijuanawithin the previous month and 21% daily or every other day; 80% had usedalcohol within the month and a third daily or every other day. Reported use ofharder drugs within the month ranged from 15% (A) to 3% (M); reported daily oralternate-day use ranged from 2.4% (A) to 1% (M). Frequent use of hard drugsseems much less common than occasional use.
Percentages of lab positives (urinalysi were about a third of thepercentages predicted statistically from self reports. However, the greatvariation over installations and drug types suggests that more than simple self-report exaggerawion is involved; biochemical and operational factors suggestthat urinalysis data do underestimate actual use. A base comnmander's interestin deterring drug abuse on his post and in identifying and treating habituallyheavy users would encourage use of random urinalysis. Headquarters commanderswho want a reasonably accurate estimate of illicit drug use patterns andprevalence generally may be better served by use of a brief anonymous self-report questionnaire.
,Av.
Unclassified
SECURITY CLASSIFICATION OF THIS PAGE('Wh*"'Vele Enlferd)
OTI

Te, ,.lc.l Paper 264 II
ASSESSING THE PREVALENCE OF ILLICIT
DRUG USE IN THE ARMY
Paul HurstInstitute for Research
and
Royer F. Cook and Douglas A. RamsayArmy Research Institute for the Behavioral and Social Sciences
SOCIAL PROCESSES TECHNICAL AREADavid R. Segal. Chief
Submitted By: Approved By:E. Ralph Dusek, Director J. E. Uh~aner"INDIVIDUAL TRAINING & PERFORMANCE TECHNICAL DIRECTOR
RESEARCH LABORATORY
U. S. ARMY RESEARCH INSTITUTE FOR THE BEHAVIORAL AND SOCIAL SCIENCES
Office, Deputy Chief of Staff for Personnel"Department of the Army
1300 Wilson Boulevard, Arlington, Virginia 22209
July 1975
Army Project Number Institutional Change2C163101A752 DAHC 19-73-C-0008
Approved for public r eow; distr~butlon unilimtod.
.4q

ARI Rmearch Reports and Technical Papers are intended for sponsors of
R&D tasks and other research and military agencies. Any findings ready for
implementation at the time of publication are presented in the latter part of
the Brief. Upon completion of a major phase of the task, formal recommen-
dations for official action normally are conveyed to appropriate military
agencies by briefing or Disposition Form.
4, ;
44

FOREWORD
*, The Social Processes Technical Area of the Army Research Institute (ARI) is concerned withproblems of social dynamics and interactions to help the soldier better adjust to the modernArmy, to provide field commanders with techniques to increase unit competence, and to provideinformation to headquarters commanders on which they can appropriately base their decisions.Programs In the Technical Area deal with systematic research over wide areas and with immediateand specific problems, in this case the use of illicit drugs in the Army.
The present research was part of a larger effort designed to identify social and organizationaldifferences between units with high drug use rates and those with low drug use rates. A necessaryfirst step in this effort was to develop an index of drug use prevalence on which units might becompared. The purpose of the research reported in this Technical Paper was to examine a numberof potential indicators of illicit drug use and to select or develop a reliable and valid method ofestimating drug use prevalence. Work was conducted under Army R DTE Project 20163101 A752,"Drug Abuse and Discipline," FY 1974 Work Progran. Research is conducted as an In-house effortaugmented by contracts with organizatIow selected as having unique capabilities in the area ofdrug research. The present study was conducted jointly by personnel of HRB-Singer, Incorporatedand the Army Research Institute, and is responsive to special requirements of the Director ofHuman Resources Development, Office of the Deputy Chief of Staff for Personnel of the U.S.Army.
Technial Director
-I
4 *

ASSESSING THE PREVALENCE OF ILLICIT DRUG USE IN THE ARMY
BRIEF
'I* Requirement:
To emus the prevalence of Illicit drug use in the Army, and, to that and, examine potentialindicators of illicit drug uas and select or develop an accurate method of estimating diugprevalence.
Procedure:
Random urinalysis (the basis of most official Army prevalence estimates) and brief anonymousself.-report questionnaires were used to gather data. Urinalysis is a logical indicator of drug abuse ina system in which individuals must be identified to be cured; a cquestionnaire is an equally logicalIndicator of drug abuse as a complex social problem In which most individuals vary their patternsand levels of drug use with circumstances,
A brief self-report questionnaire was administered March.June 1973 to personnel in TO&Eunits in the U.S., Germany, and Korea. Usable responses (71% of total responses) were returnedfrom 17,141 enlisted men. EI.ES, from 398 units. A test-retest procedure indicated sufficient"reliability for the questionnaire, which asked respondents to indicate frequency of recent use(daily; 16-30, 7.14, 3-6. 1-2, or 0 days "last month") for alcohol, marijuana, hallucinogens,amphetamines (A), barbiturates (8), other sedatives, cocaine, methadone (M), and other opiates(0).
The percentages of laboratory drug positives for A, B, M, and 0 from urinalysis were aggregatedseparately for TO&E units from six posts in the U.S. and a division In Germany, for the periodsincluding and symmetrically bracketing the dates the questionnaire was given in each area. Thesefigures were compared with the percentage of positives which could be statistically predicted fromthe self reports (adjusting for the occasional user's vulnerability to urinalysis detection).
Findings:
The use questionnaire indicated that 40% of the respondents hod used marijuana within theprevious month and 21% daily or every other day; 80% hed used alcohol within the month and athird daily or every other day. Reported us of harder drugs within the month ranged from 16%(A) to 3% (M); reported daily or alternate-day use ranged from 2.4% (A) to 1% (M). Frequent useof hard drugs seems much less common than occasional use.
Percentages of lab positives (urinalysis) were elou one third of the percentages predicted
stftiscally from self reports. Afthough both methods carry some error, it is possible that either
the self reports were inflated or that urinalysis produced underestimates. The self-report predictionof opiate use was 2.7 to 7.7 times greater than the lab reports of opiates, depending on theinstallation; reported barbiturate use was 2 and 1.5 times greater respectively at the same posts,and methadone use 14 and 3 times greater. This amount of self-report variation suggests that tnore

**
than simple exaggeration is involved; biochemical and operational factors suggest that urinalysisdata do underestimate actual us.
Urinalysis reports may be eithvr chemical lab positives or confirmed positives which eliminateas many a 50% (false positives ised by prescription use and error and possibly some truepositives). The percentage of men ictually using identifiable drugs In a given period will be greaterthen the percentage of chemical jositives for that period since the sporadic user will not test
* positive the entire time.
In self reports of drug use the user may not know what he has been using, may be afraid to tell,and may lie or exaggerate. However, earlier studies suggest that anonymous self-reportquestionnaires may be better than any currently available nethod for estimating prevalence andpatterns of W•idt drug use, in spite of the remaining bias from exaggeration and uncertainties ofdrug Identity ancd rm ll, Self-repon methods appear to be lets snsitlve than urinalysis tosytemetic variations in enforcement practices, and their bias appears relatively constant across
posts and commands.
Utilization of Findings:
A base commander's Interest In deterring drug abuse on his post and in Identifying and treatinghabitually heavy users would encourage use of random urinalysis. Headquarters commanders whowent a rtqsonably acurate estimate of illicit drug use patterns and prevalence generally may bebetter served by use of a brief anonymous self-report questionnaire. The use of recently developedurinalysis methods (eg., radlolmmunoassay) which are considerably more sensitive than those usedduring this study is not likely to alter this situation significantly.
-4.
i..
4 i 4~4~*

ASSESSING THE PREVALENCE OF ILLICIT DRUG USE IN THE ARMY
CONTENTS
Page
POTENTIAL SOURCES FOR ESTIMATING DRUG ABUSE PREVALENCE 2
Arrest Records 2Exemption Applications 2Identification Incidental to Medical Treatment 3Urinalysis 3Self-Reported Drug Use 8
V ~METHOD 1
The Drug Use Questionnaire 11Sample 13Reliability of the Drug-Use Questionnaire 15
RESULTS 16
Drug Use Rates 16Comparison of Urinalysis with Self-Report Data 18
DISCUSSION 25
CONCLUSIONS 28
REFERENCES 29
DISTRIBUTION 31
TABLES
Table 1. Use questionnait'e sample 13
2. Percentage of use questionnaire returns byresponse-category placement 15
3. Percentage of respondents (Ex-E5, TO&E units)admitting to drug use 17
S - S -
Page
TABLES (Continued)
Table 4. Percentages of self-reported drug usecompared by location 20
5. Comparison of percent laboratory positives andpercent use-questionnaire predicted positivesat Fort A 23
6. Comparison of percent laboratory positives andpercent use-questionnaire predicted positivesat Fort B 23
7. Comparison of percent laboratory positives andpercent use-questionnaire predicted positivesat Fort C 24
-8. Comparison of percent laboratory positives andpercent use-questionnaire predicted positives"from Divisior X, Germany 24
9. Summary: Percent laboratory positives vs percent* predicted positives from use questionnaire with
k-O, by installation or division 26
FIGURES
"Figure 1. Flow chart of confirmation procedures 4
2. Reproduction of the drug use questionnaire 12
3-. Drug use rate for El-E5 in TO&E units (N - 17,141) 19
4%

ASSESSING THE PREVALENCE OF ILLICIT DRUG USE IN THE ARMY
Assessing the prevalence 'of illicit drug use is fundamental to boththe operation of a drug control program and the performance of researchon the problem. By.accurately depicting the magnitude and patterns ofdrug use, prevalence estimates can clarify the nature of the problem andcan permit the evaluation of efforts to reduce illicit use. However,accurate prevalence estimates are difficult to develop. 2' 3
The potential sources of error are so manifold that one researcherrecently stated that the "actual number of new or current drug abusersanywhere in the United States is a matter of gross speculation.e" inrecent years, the military has attempted, using several different
* methods, to estimate the prevalence of illicit use in the services. In1971 and 1972 the Department of Defense employed the questionnaire surveySom-thod to assess the level of illicit drug use in the armed services. 5, 6
S'Although the Army has also conducted surveys to determine drug use rates,official estimates of drug use prevalence have typically been based onrandom urinalysis. 7 In addition to these two major ways of derivingprevalence estimates, potential indicators are arrest records, exemption
I The term -evalence is used rather than incidence in conformance tothe literatt .t; which uses prevalence to refer to the number of cases
• • on hand at a Siven moment in time and 3ncidence as the inumber of newcases that come into being during a specified period of time.
2 BaLl, J. C., and Chamber, E. C. The epidemiology of opiate addiction
"1.A the United States* Springfield, IL: Charles C. Thomas, 1970.
3 Berg, G. H. Illicit use of dangerous drugs in the United States: Acompilaticn of studies, surveys, and polls. U.S. Department ofJustice, 1970.
4 Lavenhar, M. A. 1he dug abuse numbers gimne. American Journal of
Public Health, 1973, §1(9).
1 Fisher, A. H., Jr. Preliminary findings from the 1971 DoD-survey ofdrug use. Human Resources Research Organization, Technical Report72-8, March 1972. (AD 743 852)
Fisher, A. H., Jr. Major findings fram the 1972 survey of drug use.
Human Resources Research Organization, draft report, May 1973.
Review of military drug and alcohol programc. Hearing before the
Subcommiittee on Drug Abuse in the Military Services. Washington,DC: U.S. Government Printing Office, 1973.
*1
.... 1r -;
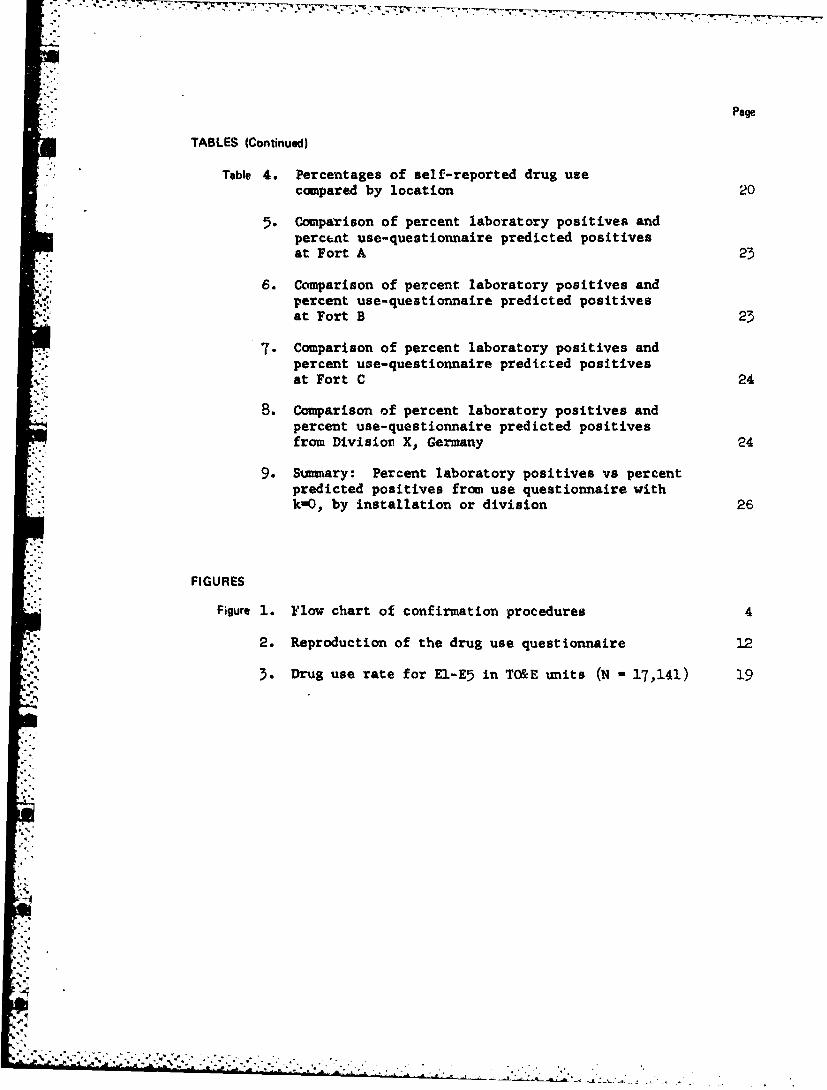
"application rates, and clinical records of drug use identification inci-dental to medical identification.
soia present research was patt of a larger etfort designed to identify"social and organizational differences between units with high drug userates and those with low drug use rates,, A nectssary first step in this"effort was to dove/ an index of drug usyp!%evalence on which unitsmight be comparea- (LThe purpose of the research reported in .this paper"was to examine number of potential indicators of illicit drug use and toselect or develop a reliable and valid method of prevalence estimation.Of specific interest was the comparison of the urinalysis method ofprevalence assessment with the self-report questionnaire method.
POTENTIAL SOURCES FOR ESTIMATING DRUG ABUSE PREVALENCE
Arrm Relodl
"Since not everyone who breaks a law is caught, arrest records mightprovide at best an esitiate of comparative prevalence. Enforcement rigorof any law Is variable, and that of drug laws seems to be especially so.Nevertheless, an initial step was to ccmpare arrest levels in variousArmy jurisdictions to see if s-ch data would reinforce the more sensitiveindices, at least to help identify "high" and "low" drug-abuse units.
The combined incidence of Provost Marshal arrests and Article 15'sfor drug charges proved to be far too low to aid in identifying "high"and "low" abuse units. Indeed, for the harder drugs, it is doubtfulwhether comparative arrest records would even discriminate between major-'comleands--even with the totally untenable assumption of no bias due todifferences in such matters as reinforcement rigor.
Exemption Applications
Although some drug users have applied for admission to drug programs,not every illicit drug user will do so. At any rate the incidence ofexemption applications may well be a better reflection of the program'sattractiveness than it is nf drug abuse. Consequently, this datasource was not pursued.
-2-
tir '- .,2 .' .--.i .2 , ". -., . , • , .. ... . .

77 7 ~-----I-.--w---.
Identiflcation Incidental to Medical Trstvnent
In general, such identification occurs too seldom to be used as an"indicator. As with arrest and exemption rates, the comparative incidencein this category may be more a function of administrators' philosophiesthan of drug use. Also, there are further sources of bias: e.g., whenhigh-grade heroin is cheap and readily available, it is usually smoked"or sniffed instead of injected, and the likelihood of identificationthrough needle tracks, abscesses, or infection decreases.
Urinalylsi
Random vs. Scheduled Urinalysis. Random urine tests h.ave one idealattribute for the purposes of this research: The exporure base (totalsample population) is known. Thus, percentages can be calculated inrelation to the population. Scheduled urinalyses are less useful.When the approximate test time is known in advance (as DEROS from South-east Asia), there is obvious reason to believe that it will not befruitful. Alternatively, the tendency to order a surprise urinalysismay reflect a high level of seal in deterring drug abuse; those who ordersuch tests most frequently may tend to be those who make the greatestoverall deterrent efforts via shakedown inspections, disciplinaryactions, etc. One cannot assume that the detection percentages fromsuch tests are comparable as epidemiological indicators to those fromrandom tests. The exposure base may look the same but in reality it isnot.
In addition to providing a known exposure base, the random testingprogram has the desirable attribute of results which are relativelyobjective in that they reflect chemical analyses performed by specifiedtechniques. Consequently, random urine tests were included as one ofthe comparison sources.
Chemical Positives vs. Confirmed Positives. For estimating drugabuse prevalence, reliance on confirmed positives has the obvious advan-tage of eliminating those false positives that occur because of either(a) legitimately prescribed use, or (b) laboratory or administrativeerror. A disadvantage is that a non-confirmed chemical positive mayrepresent a true incident of drug abuse.
When a chemically positive result is reported by a testing laboratoryand ý-he donor has no prescription to account for it, the Medical Officermay nevertheless find no definite clinical signs of drug abuse. A socialevaluation is then performed, utilizing joint inputs from counselors,etc., and the Medical Officer. If the social evaluation fails to confirmdrug abuse, in the opinion of the Unit Comnander, the donor is thenrequired to undergo urinary surveillance for a period of 8 weeks, pro-viding three samples per week. If he completes this cycle without anypositive urines, he is then "disconfirmed" and the original chemidalpositive is considered a false positive. A flow chart of the entireprocedure is given in Figure 1.
A
4 * *4

A , a. ' . . .- • * ' 7 + • ' • -- - +L - - • - , . , A- .
COLLECTION
4ETRANSPORT
ALIQ UO. .... .. I U O?
FIAT TLC(OPIATES) (AMPHETAMINES)(SARIAIIITLC )
POPULATION LIABLt FOR (METHADONE. OPIATES)" . .RANDOM URINALYSIS TST(
I LANORAAOWV TESS OF;*'+'URINE is POSITIVE "-LAS POS. RPR
CLINICAL EVALUATIONE TIV( I OFFICER)
- J DRUG AMUSE CONFIRMED
SAIITNORIZEO i [MEDICAL TREATMOFT RIOUIREDin. m m
62 NEGATIVE LAS REPORT
"SOCIAL EVALUATION L
JOIN ,,EDICAL°SOCIAL CONSULTA-o DETOXI "I
ITIONTREATMENT"'RANADILITATIONI ANDI!PRAGRAMERCDUE.NDAS REUIRDREATEN
IPRONAILE COMMANDER'S REVIEWASDTRIEP4- - -- AND DCISION DETERMINED BY MEDICAL 'SOCIAL
ADM IN ISTRATIVE CO.. . .. .
I I SUCCESSFUL J
iIFNo FURTHER UNSLVETERANS AMINITAAION
Ws------- -;---PROGRAM FOR FURTHER
(8 WEEKS) :' TREATMENT REHABILITATIONi E IIRANOTHER TII I SEPARATION FROM SERVICE
A Figure 1. Flow chart of confirmation procedures
S" • ".*A . ..' A. . ..-; ' --- "- :U ,'.. + "- -" A.. ,

Of course, someone who really had illicit drugs in his urine ot the"time of the original random test may very possibly be able to stay clean"for eight weeks. It is also possible that he may convince the MedicalOfficer, on whatever basis, that he has been falsely identified, and thetest is disconftirmed without urinary surveillance. Hence, there arereasons to believe that many nonconfirmed chemical positives are trueinstances of illicit drug use. The confirmation rate for the Armyduring the period when our data were collected was considerably lessthan 50%. Recent quality-control data from the Armed Forces Instituteof Pathology (AFIP) indicate that very few negative urine samples areidentified as drug positive due to laboratory error. As to "authorized
S. use," there are reasons to doubt that such cases can properly accountfor the low proportion of laboratory positives that are confirmed.
SAmphetamine, for example, is now appropriately prescribed only fornarcolepsy and certain childhood behavioral disturbances.
The chemical positives themselves are not without deficiencies as adata source. First, the types of drugs covered are inherently limited.Theoretically, the combined thin layer chromatography (TLC) and freeradical assay technique (FRAT) for preliminary screening will pick up alarge variety of drugs, since they are not intended to avoid falsepositives--chemical confirmation by gas-liquid chromatography (GLC) isneeded before a laboratory positive result is reported as "chemicallypositive." Only a few substances, such as cannabis derivatives(marijuana) and LSD, should be missed. However, quality-control pro-cedures by APIP check only for morphine, amphetamine, and some commonbarbiturates. A FRAT positive for morphine would be expected if thedonor had consumed "opiate" drugs such as opium, heroin, or morphine.Most synthetic "opioids" such as meperidine (Demerol) and propoxphene(Darvon) would be missed and would have to be detected by TLC, as ismethadone. Although the laboratory reporting form contains a Imethadone"category, the ability to detect methadone is not quality-controlled by
" AFIP.
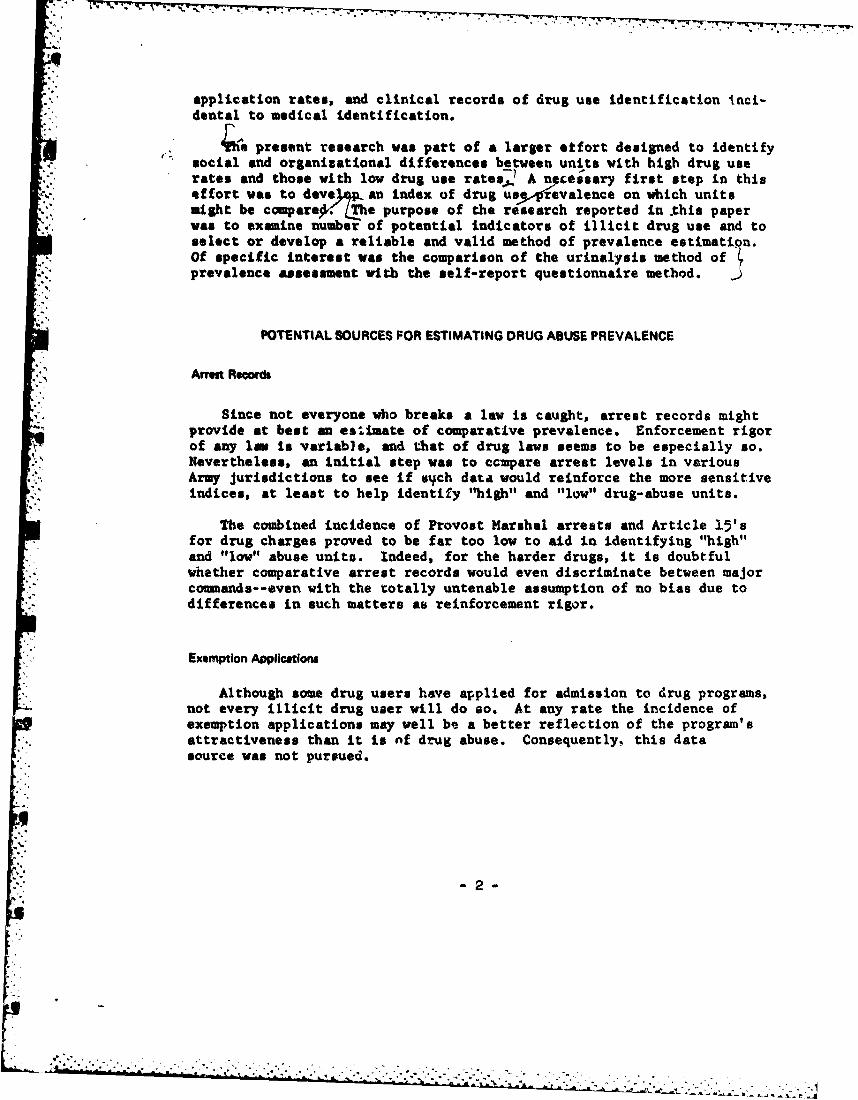
A second deficiency is the known contribution of false chemicalpositives. The AFIP quality-control statistics cited above indicate aprobability of about 0.0044 that a true negative will be identified aschemically positive. However, particularly interesting is the proba-bility that a sample identified as chemically positive was in factnegative and did not contain the drug in question. (This is also theconcern of the examining physician.) These two probabilities are notgenerally the same and can be quite different, since the second is theinverse of the first. It was decided to define the probability of a"false positive" in this second sense: that a given laboratory-reportedchemical positive came from a sample specimen that did not contain thedrug reported. This probability (the expected proportion of true neg-atives among a reported set of lab positives) is defined by Bayes'`6-io-M as:
L ;0
l-5-
where P(N) " Fiior probability of a true negativeEproportion of true negatives in the
-'.:.population, considered as those urines
"that do not contain opiates (0), am-
phetsmines (A), or barbiturates (b)]
P(+) - probability of a lab positive (proportionof all lab tests reported "positive" for
* O, A, and/or B in the population)
' - P(+IN) - probability of positive lab report giventhat neither O, A, or B is present insample
P(NI+) - probability that a reported lab positiveis false (proportion of reported labpositives that do not, in fact, contain0, A, or B)
Of the required estimates, P(+iN) can be based on APIP qualitycontrol statistics. P(+) is simply the proportion of all lab tests re-ported positive in the population sampled. It remains to estimateP(N), the true proportion of negatives in the population. To do this,we must introduce an additional term:
P(+ID) - probability that a positive lab report willbe received on a sample containing 0, A, orB at the required concentration. This canbe estimated from APIP data.
P(N) is calculated as follows:
P(+) - P(D) P(+ID) + P(N) P(+IN)
P(D) - 1 -P(N)
P()- [1 P(N)) P(+ID) + P(N) P(+IN)
P(+) - P(+ID' + P(N) [P(+IN) - P(+ID)3
P(+) P(+ID) - P(N) -P(+IN) - P(+ID)+
P(N) - P P(+)(I D P ( ID X±- ' (2)PC+IT) -P D) (+TD - P+I•N)
4 The methadone category is omitted from the calculation because thenecessary quality control data are not available and not all labora-tories test for it.
6-

Substituting this estimate of P(N) in Equation (1),
P(NI+) - P(+IN) IP(+ID) (3)1P(+) [P(+ID) - P(÷IN)]
Recent APIP estimates (lst 3 quarters 1973, all labs combined) are:
S(+1N) - 0.00"
*P(+ID) - 0.83
Now., suppose that a given population has 4% chemically positive
P(+) - 0.04
Substituting these three values in Equation (3),
PCNl+) - 0.00" (o.§13 - 0.040.04 (0.673 - 0.0044
P(NJ+) - 0.00366 - 0.105 (4)0.0347
Thus, the chance that a reported lab positive is false in this popu-lation is about 10% rather than 0.4%, the false positive rate for truenegatives. This risk factor will vary between populations because it isa function of P(D), the true chemical positive rate. In this particularexample, P(D) is estimated at .442j P(N) - 0.558 from Equation (2).
In sumnary, chemical positives should be able to provide good relativeestimates of drug abuse rates for certain opiates, amphetamines, andbarbiturates (0, A, and B).
The percent of chemical positives cannot be expected to equal thepercent of personnel using 0, A, and/or B during a given month, since theoccasional user will not have a positive urine the entire time. Chemicalpositives will provide a good relative estimate of drug abuse rates ifthree conditions are met:
1. Prescribed use is involved in only a small proportion of truechemical positives, or is relatively constant between populations thatare to be compared.
2. The incidence of false positives P(+HN) from APIP reports isnot grossly biased by the fact that APIP negative samples are "blanks,"I.e..,do not contain over-the-counter cold remedies, etc.
3. Random urinalysis is done "by the book," i.e., less than eighthours advance warning, virtual elimination of no-shows, and carefulmonitoring of the collection procedure.
-7-
! 4 *, ~
•._'•,._'~ e•., •<?•.'•,''.,.'.* , "•,. . . . . . . . ..%~

The validity of these assumptions can be better estimated when uri-nalysis results are compared with self-report data.
Self-Reported Drug Use
Potentially one of the best ways to obtain recent drug use historyis to ask about it. The user may know what he thinks he has been usingand he may be willing to tell you, if reasonable guarantees of anonymityor confidentiality are provided. However, there are several obviousproblems:
"1. The user may not know what he has been using, particularly whena blackmarket source is involved. He may know only a colloquial namethat cannot be reliably collated with generic or brand names, or theproduct may be falsely represented.
2. He may know but be afraid to tell.
3. He may know but decide, for whatever reason, to lie or exaggerate.
Several researchers have studied the validity of drug-use question-naires and interviews and the evaluation of several alternative methodsfor obtaining self-report data within the Army. Robins9 found that 97%of a sample of servicemen who had been identified as positive at DEROS(Date Expected Return from Overseas), just prior to departure from"Vietnam, admitted using narcotics in Vietnam to an interviewer who wasignorant of the subject's drug history. This suggests at least somedegree of validity for the interview technique but is not conclusive;the fact that one confesses to prior deviant behavior which has alreadybeen discovered does not mean that he will confess to current deviantbehavior which has gone undiscovered. While the same study found thatadmitted current use was higher than detected by urinalysis at the timeof the interview, the finding is less a validation of the interviewmethod than it is an indication of the limitations of non-random uri-nalysis. Another comparison of urinalysis and self-report data by"anonymous questionnaires indicated that in matched groups the re-ported use in periods immediately preceding random urinalysis wasapproximately three times greater than the chemically positive laboratoryreports. 1 0 Assuming that few respondents exaggerated their use, self-report
9 Robins, L. 14. A follow-up of Vietnam drug users. Special ActionOffice for Drug Abuse Prevention, contract Ko. HSM-42-72-75. SpecialAction Office monograph, Series A, No. 1, April 1973.
10 Research and Survey Section, Drug and Alcohol Abuse Control Program.
Drug Abuse and Morale Monitoring Survey (DAMMS) Report No. 3. FortRiley, KS. March 1972.
- - 8 -
-5--

•Jh
, data appear more sensitive to drug use than the laboratory tests. Thismay be, in part, because the 5-day detectability period assumed in thestudy (corresponding to maximal detection intervals listed in TB MED 290)is optimistic. Of course, one is still in no position to estimate theabsolute validity of questionnaire self-reports.
The most comprehensive attempt to resolve the doubts associated withdrug questionnaire surveys and to provide guidance for the collection offuture self-report data was undertaken by Brown and Harding."1 Theirstudies compared: 1) Questionnaire vs. indirect inquiry methods, 2)Questionnaire vs. personal interview, and 3) Distribution of question-naires by persons with varying images (e.g., mod civilian, Army doctor).
The questionnaire employed by Brown and Harding contained 62 items,"of which almost half dealt with the respondent's past and present in-volvement with illicit drugs. Other questions concerned military statusand experience, demographic characteristics, estimates of drug use inthe respondent's unit, and his opinions concerning Army drug policy.
The principal indirect method employed was based upon a randomizedinquiry (RI) technique originated by Warner 12 for estimating the pro-portion of a sample possessing a sensitive attribute without knowingwhether any one individual has the attribute. Subjects were given decksof 50 cards, each card containing one sensitive and one non-sensitive
* question. For example, P,% of the cards asked the question, "Have you. used marijuana or hashish during the past month?" Ps% (100 - P,%) of
* the cards asked the question, "Have you eaten a cheeseburger during thepast month?" Subjects were allowed to look at the cards and to seethat they contained these two questions. They were then asked to drawa card randomly and to answer yes or no. Then, they were instructed torepeat the procedure using a second deck of cards containing the sameitems but in different proportions. Given the proportions of both typesof questions in each deck and the proportion of respondents answeringyes or no from each deck yields two equations in two unknowns, so it ispossible to solve for the proportion of yes responses to the sensitivequestion separately from that of the non-sensitive question.
Brown and Harding collected data from 1100 subjects, including 715enlisted men (EM), in grades E1-E5, in four major Army installations. With
.> respect to EM, the results suggest that both the questionnaire and the
SBrown, G. H., and Harding, F. D. A comparison of methods of studying
illicit drug usage. Human Resources Research Organization, TechnicalReport 73-9, April 1973. (AD 760 407)
12Warner, S. L. Randomized response: A survey technique for estimatingevasive answer bias. American Statistical Association Journal, 1965,60, 63-69.
"-9-

technique provide the same estimates of drug abuse. It is not clearasether the similarity between methods results from the EM's truthfulness
on questionnaires or whether he presents the same deceptions to similarquestions using the RI technique because he fails to understand its built-in safety. The fact that a small junior officer sample appeared to reporthigher rates on drug use questions within the RI technique than onquestions presented in the questionnaire does not entirely clarify thesituation, since the difference may have occurred because the officersunderstood the RI safety factor better than the EM, or because the"officers were more concerned that questionnaire responses might damagetheir careers. However, the discrepancy between methods revealed bythe officer data paradoxically improves the validity of the question-naire for EM; when some of a population is holding back substantially onthe questionnaire for fear of identification, the RI comparison willshow discrepancies if a sizable part of the population understand theextra safety feature. Since there was no such discrepancy in the EMdata except for one drug category, this implies that relatively few ofthe EM were holding back on the anonymous questionnaire. Of course,other sources of error remain: the uncertainty of what drug has reallybeen taken, the possibility of exaggeration, and the vagaries of humanmemory.
A second study by Brown13 compared admissions of illicit drug use inanonymous questionnaires and personal interviews. Interviewers wereyoung veterans with long hair, knowledgeable about the drug culture.The data suggested that the two methods yield essentially the same re-sults. A third study ' considered the possible impact of a testadministrator's image on the validity of anonymous questionnaires.Tests given by one of five administrators who varied in appearance--young mod, conventional civilian, Army doctor, Army officer, andenlisted specialists (SP4 or SP5)--showed no significant difference inthe drug abuse rates obtained under these various conditions.
Collectively, these studies suggest that the anonymous questionnairemay be as good as any other available instrument, including urinalysis,for estimating prevalence of illicit drug use in the young enlistedpopulation. Further research is needed to estimate the bias introducedby exaggeration and uncertainties of drug identity and recall. Self-report methods have the general advantage of being apparently lesssensitive than other sources to systematic variations in enforcement
13 Brown, G. H. Methodological problems in determining the true incidenceof drug abuse. Paper presented at Military Operations Research Sym-"posium, Washington, DC, December 1972.
14 Brown, G. H. Drug usage rates as related to method of data acquisi-tion. Human Resources Research Organization, Technical Report 74-20,August 1974.
1- 0 -
. . . .. . . . . . . . . . . . . . . . . .

i -... • . . ¢ •. . .' • -•,••.. . ,. • • , .....T •,o ... .. .. T*.-, - *.. s,-. • -,----- . .. .. . . .. .
practices, urinalysis administration, etc. Whatever bias they containmay be relatively constant across posts, conunands, and minor variationsin the data collection instrumentality,
METHOD
The Drug Use Questionnuirm
Design. Based upon the review of methods described above, thedecision was made that self-reports of drug use would be the most reliablecriterion for the selection of high and low drug abuse units for study.Because a large number of units (510) had to be surveyed in a short timespan, a questionnaire rather than an interview method was selected.
use Several important considerations went into the design of the druguse questionnaire. The drug response categories had to be compatiblewith the drug categories used in the Army's random urinalysis programso that one could compare self-reports of drug use with urinalysisresults. The questionnaire also had to be easy to administer in thefield by untrained personnel while guaranteeing the respondent's
• anonymity. Finally, the questionnaire had to be brief and unambiguous.
A sample of the drug use questionnaire is shown as Figure 2. Notethat each respondent was asked to describe his use of non-prescriptiondrugs in each of nine categories over the preceding 30 days. The ques-tionnaire was prepared in two forms, A and B, and these forms weremixed randomly for administration to each unit. The two forms differedonly in the direction of the drug use frequency headings. Two formswere used to increase the respondent's perception of anonymity duringadministration. Prior to administration of the qiestionnaire, respon-dents were told that two different forms were being distributed and thatthey would probably not have the same form as the person sitting nextto them.
Pretest. The drug use questionnaire was pretested with 137 soldiersunder two conditions of administration. In one condition the question-"naire was administered by a representative from a civilian contractorand in the other condition it was administered by an E5 or an E6 inuniform. No significant differences in responses were found in any drugcategory between the civilian and military questionnaire administrations.It was concluded that the questionnaire could be administered by eithercivilian or military personnel without bias as long as anonymity wereguaranteed.
.5~
P * ~ --. 41 -- -- - - - - - - - - - - - -

DRUG USE QUES10NNAIRE
11A0KGROUND
HR31114islipr, Inc., under constrsat to the Dirpnariant of the Armay. it consductning a ta-scal pfotuan of drug remarchOne of the objecicae of the psropnam is to obtain a clear picturet of the extent of drug use in the Army. This questionnaire,which ii being, wilmnrlttskd at newre. Army Mittallautonsa in CO)NUS. Europe and the Far East. is dagsd to obtain thisInformatift.
This reserch lawagram it not asocatsed with any law enforcement activity or any drug deftection proimn, ag.theursndyus program. Fearthesisore. both the Deparment o Army and the Justice Departiment have guaranteed that none ofthe Aoalkvitt information will havne to be turneid oam to them. Therefot, none of the information which you provide canto. srd oppams you. Pleam gite complete and hontest answaer, to all of the questions. DO NOT WRITE YOUR NAME ONTHIS QOflSTHONNAIRE!
INSTRUJCTIONS
Pkcasw ditk* ft box which specifies your rank. El-ESD a"913.
Placem a check (,/) In the box which beat describes %he total number of days you have used that drug in the last monthwithout a doctor's preacription For example, if you used alcohol on eighst days during the Maet 30 days, then you wouldLdvock the column marked "med 7.14 days in last month.," We are not interested in the number or times you cusd a drugon any onet day, only ins the number of days in the Was month you used that drug.
4011 A tiwdisey tUselad150 Ured 7-1 U"" i)4 Ihgt 2 CM Not(Cr2l 06W. Last Dea on Das Mn ftvsysn Days me User
Month Larst Mornth Lai Months LasN Mantih Last Morth Lees Month
4C.71
* tcats utsnejosren., tsadhitd.TttC. .te.t
CPara ypt 1.
Seebphwtast~
d P141014i. "Iad.,"I
IC-121
IDoeos"de Mmn*e..ganMY1. ee.t
IC 13)
tC*ww oke
011hafte
Dirlne a'atc.1
Figure 2. Reproduction of the drug use questionnaire
.12

Sample
Sample Characteristics, Drug use data were collected from Army TOEcompany-size units in the United States, Germany, and Korea. A randomsample of 30 units was drawn from each of six divisions in Germany, andfrom each of six posts in the U.S. A random sample of 150 units wasdrawn from all of Korea. Table 1 indicates the size of the use-question-naire sample by theater of operation.
Table 1
USE QUESTIONNAIRE SAMPLE
Number of Number ofUnits Originally Units Returning Total
Theater Sampled Questionnaire Usable N
U.S. 180 167 7,416
Korea 150 108 5,065Germany 180 123' 4,660
Totals 510 398 17,141a
DaOa from 36 unit In Germany were received too lot* to be scored and used.
In each unit the use questionnaire was administered to every El to
E5 available for duty that day. The total sample size based on usablereturns was 17,141 enlisted men in grades El to E5 from 398 TO&E units.
Questionnaire Administration. Administration of the use question-* naire was different in each theater. In the U.S. the questionnaire was
administered by personnel from the Alcohol and Drug Control Office (ADCO)at each post, using a "ballot box" arrangement. The ADCO staff personwould visit a unit, explain the purpose of the research, distribute thequestionnaires, and collect them in a sealed box with a slit in the top.He would then return to his office, remove the questionnaires from theballot box, and package them for shipment to a private research firm.
In Germany, the research team met with representatives from each ofthe units being tested and trained them in the administration of thequestionnaire. Each representative returned to his unit and distributeda questionnaire and an envelope to every El to E5. When the respondentcompleted the questionnaire he was to seal it in the envelope and returnit to the unit representative who in turn forwarded all of the sealedenvelopes to the Division ADCO. The Division ADCO shipped all thesealed questionnaires from his division to the private research firm.
-15-

The administration procedure in Korea was similar to the procedureused in Germany, except that questionnaires were mailed directly toeach unit, and each unit returned the sealed envelopes by mail to theU.S. Army Research Unit in Korea. The U.S. Army Research Unit logged"the unit and mailed the questionnaires to the firm.
"The use questionnaires were administered in the U.S. from the firstof March 1973 through mid-April. In Korea, administration occurredduring the months of April and May. Units in Germany were administeredthe questionnaire during the month of June.
Return Rates. Extreme conservatism was used in scoring the usequestionnaire. This conservatism was dictated in part by the need tocompare the questionnaire results with urinalysis results. Returneduse questicamares were placed in one of five categories:
Category I - This category represented totally blankreturns--a questionnaire with none of thedrug categories checked.
Category 2 - This category included questionnaires inwhich the respondent checked the "UsedEvery Day in Last Month" column for everydrug (excluding alcohol and cannabis).These exaggerated returns were not used.
Category 3 - Respondents included in this categoryfailed to place a check in one or more ofthe drug categories, with the exception ofalcohol, but still checked some of the cate-gories. These incomplete returns were not used.
Category 4 - In this category were included respondentswho placed a check under two frequencyheadings in one or more of the drug cate-gories. These contradictory returns werenot used.
Category 5 - This category included usable returns whichwere all returns minus those placed incategories 1 through 4.
Table 2 indicates the percentage of use-questionnaire returns in eachof the five categories, by theater. Note that the rate of blank returnsreceived from Germany is doqble that of the U.S. or Korea, as also is therate of returns marked "everyday for every drug" (Category 2). Inter-views with enlisted men during another phase of this research suggestedseveral possible reasons for these differences. One was fear. Apparentlythe heavy anti-drug campaign under way at the time in Germany made theenlisted men extremely distrustful; many reported th-t they believedthat these questionnaires were really for coruand rather than researchpurposes. Another reason given was apathy. Many of the soldiers in
..
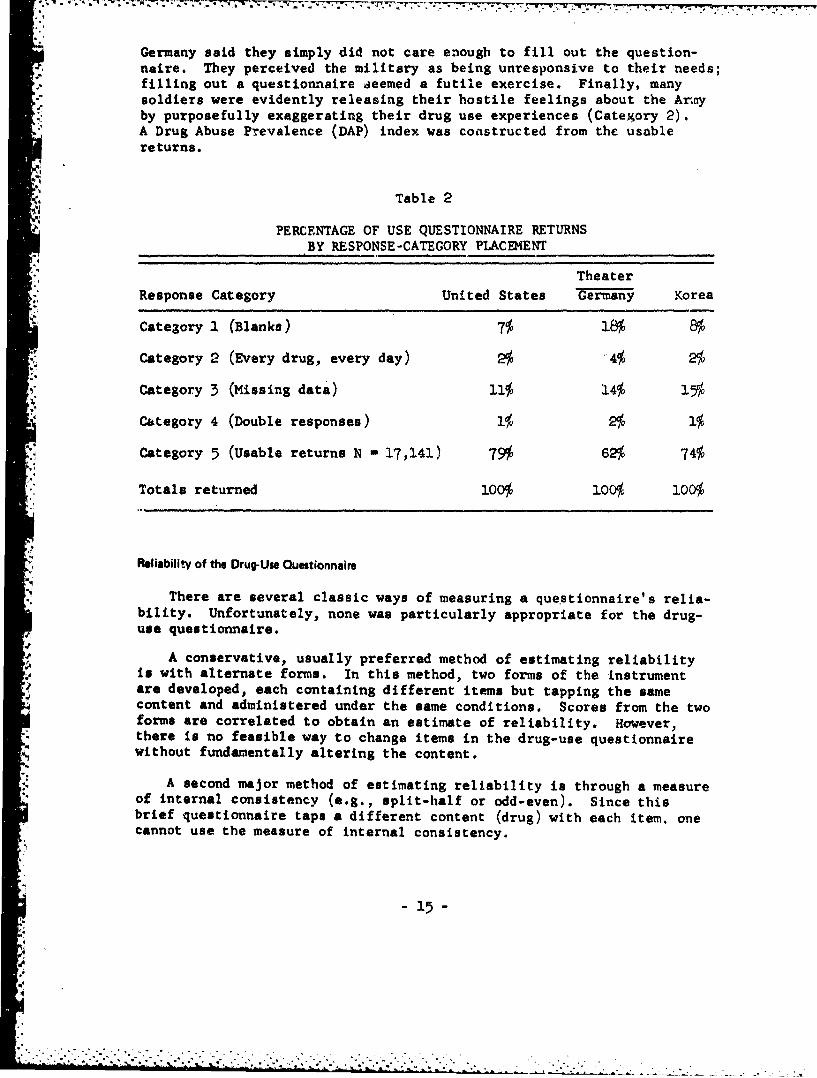
Germany said they simply did not care enough to fill out the question-naire. They perceived the military as being unresponsive to their needs;filling out a questionnaire aeemed a futile exercise. Finally, manysoldiers were evidently releasing their hostile feelings about the Armyby purposefully exaggerating their drug use experiences (Category 2).A Drug Abuse Prevalence (DAP) index was constructed from the usablereturns.
Table 2
PERCENTAGE OF USE QUESTIONNAIRE RETURNSBY RESPONSE-CATEGORY PLACEMENT
Theater* Response Category United States Germany Korea
Category I (Blanks) 7 18% 8%
"Category 2 (Every drug, every day) 2% 4% 2%
Category 3 (Missing data) 11% 14% 15%
Category 4 (Double responses) 1 2% 1%
•. Category 5 (Usable returns N - 17,141) 79% 62% 74%
Totals returned 100% 100% 100%
Reliability of the Drug-Use Questionnaire
There are several classic ways of measuring a questionnaire's relia-bility. Unfortunately, none was particularly appropriate for the drug-use questionnaire.
A conservative, usually preferred method of estimating reliabilitySis with alternate forms. In this method, two forms of the instrument
are developed, each containing different items but tapping the samecontent and administered under the same conditions. Scores from the twoforms are correlated to obtain an estimate of reliability. However,there is no feasible way to change items in the drug-use questionnairewithout fundamentally altering the content.
A second major method of estimating reliability is through a measureof internal consistency (e.g., split-half or odd-even). Since thisbrief questionnaire taps a different content (drug) with each item. onecannot use the measure of internal consistency.
-15-
The test-retest method was considered to be the best method for
assessing reliability in this case. This method is usually not the
favored reliability assessment technique because one cannot know if cne
is assessing the reliability of the instrument or the stability of the
behavior or trait being measured. it in safe to assume that in this
case a substantial portion of the error can be attributed to the
instability of drug-use rates in the units over the period of the study.
That time period was about one month for the U.S. and German units, and
"about four months for the Korea units.
Korea presented a very different test-retest situation than did the
"U.S. and Germany because of the greater time between questionnaire
"administrations. Since Korea is a l3-month tour of duty, the expected
turnover in personnel in the 4-month period would be 30%, which would
"not tend to stabilize the DAP ratings. Also, the selection ratio
(number of hi$h and low-use units selected over the total number of
units sampled) was less favorable for Korea than it was for the U.S.
and Germany. For these reasons the use questionnaire was readministered
to all units in Korea, and the reliabilities were computed separately
for Korea and for a combination of the U.S. and Germany.
There were a total of 10 retest units in Germany and the U.S. The
Pearson product moment correlation computed on DAP values for the test
and retest conditions in the U.S. and Germany combined was .81. For 22
units in Korea the correlation coefficient was .44. Thus, reported
"V drug use was relatively stable in the U.S, and Germany, and only
moderately stable in Korea over a much longer time span.
Actually, the correlation coefficient of .81 for U.S.-GermIanly sta-
bility would in itself indicate an acceptable reliability if one could
assume that no change in drug-use rates occurred during the test-retest
interval (in which case the correlation would be a more accurate estimate
of reliability). Consequently, it was concluded that the drug-use
questionnaire used in this study was of sufficient reliability.
RESULTS
Drug Use Rats
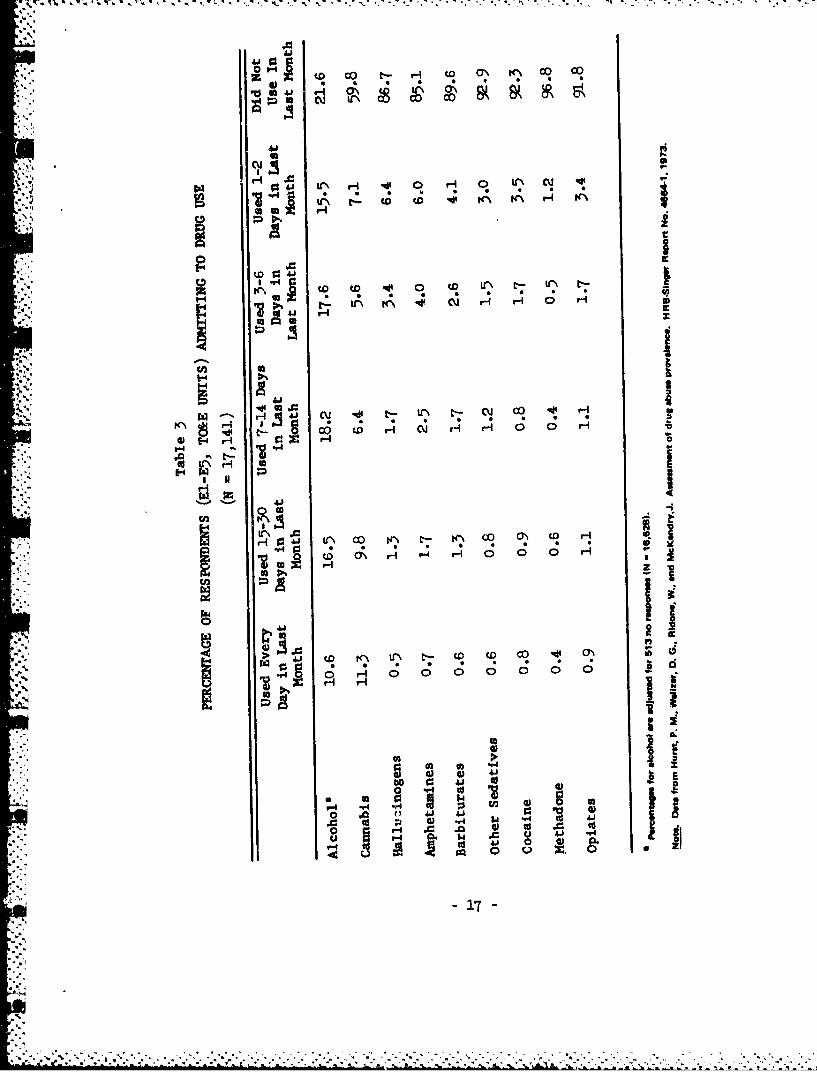
Table 3 shows the percentage of respondents admitting to drug use for
"each type of drug according to their frequency of use. Because these
data were collected from TO&E units in spe..ific locations, they are not
intended as population estimates; nevertheless, the sample is sufficiently
representative to yield valuable information on the drug use of young
enlisted men in Korea, Germany, and the United States. It is clear from
these data that the legal drug, alcohol, is still the most frequently
used by these young enlisted men. Cannabis (marijuana or hashish) is the
"most widely used illicit drug, and it is used by as many men on a daily
basis as alcohol. All other drugs are used on a relatively infrequent
basis. Indeed, the large majority of users o2 illicit drugs appear to be
z16-
Z 7,; T -; W. W. W,
.aA
~to t4 c CO co
0" I~ ,-I .' 0 H 0 Lr (1.1
C, z
to 13
K I %f tr4 CD to H H 0tH
411W N. I s1
44@A 0 ' C- tt0C- 0 O 4
044~c a\- to CO t CJ H H
E~rlI
bU r.I
41 0
01
uoing them only occasionally. This fact is graphically depicted inFigure 3. It is particularly significant that even the users of theharder drugs (especially the opiates) are for the most part occasionalusers ("chippers") and not addicted or habituated to these drugs.
In addition to indicating general prevalence and use pattera , thedrug-use questionnaire made possible the comparison of use among threelocations: The U.S., Korea, and Germany. Use rates for Korea and Germanywere compared with the U.S. use rate for each drug category (Table 4),and significance was Judged by chi-square analysis. The phi coefficientwas calculated for each significant chi-square to give an indication ofthe strength of the relationship that was found. (The large sample sizecould be expected to yield significant chi-squares even when very smalldifferences in percentages existed.)
Although 13 of 18 chi-squares indicated in Table 4 were significant,only three of the relationships were considered to be of practicalsignificance; two of these indicated a lower use rate of hallucinogensin Korea and Germany than in the U.S., and one indicated a higher userate of other sedatives (probably Mandrax) in Germany. A less substantialfinding was the lower use rate for cocaine in Korea and Germany.
Comparison of Urinslysis with Self-Report Data
Initially, the chemical urinalysis data was expected to be the mostpromising measure among the objective (not self-report) indicators ofdrug use. However, there were insufficient identifications per unit touse urinalysis as an index of drug use. The question then arose as tothe relationship between self-report data and the urinalysis. In makingthe comparisons, the use-questionnaire data were treated as the pre-dictor and the chemical positive incidences as variables to be predicted.In order to predict chemical positives from the self-report data, itwas necessary to achieve comparability of data bases. This required thefollowing restrictions:
1. Each drug category ccmouoly reported among "chemical positives"(0/opiates, A/amphetamines, B/barbiturates, and H/methadone) wasrepresented only once on the use questionnaf.re.
2. Urinalysis findings to be entered into the analyses were re-stricted to data from the types of units (roughly, those with TO&Estructure) sampled by the use questionnaire.
-18-
-AS - - - - V

.44
I--
4A'
C) ago.
Iv S
a4A
zUt
'S.- 0
= Co
;e CC
X00
C-4'
Co 40 .
an-
%&

Table 4
PERCENTAGES OF SELF-REPORTED DRUG USE COMPARED BY LO£Afl0N
United States Korea GermanyDrug Category (N - 7,416) (N - 5,065) (N - 4,660)
Alcohol 80 84 82x 30.77* 7.42
.050 .025
Cannabis 41 40 39xý 1.16 3.35
Hallucinogets 17 9 12X2 149.69* 56.43*
.110 .069
Amphetamines 15 12 18xs 26.28* 28.26*f .0116 .039
Barbiturates I1i 12 8Sa 3.50 24.84*
.045
Other Sedatives 5 3 15x 23.71* 360.63*0 .044 .173
Cocaine 10 6 6
x 4 8.45* 43.28*I .062 .060
Methadone 4 2 326.42* 11,.66*
S.046 .031
Opiates 8 7 100.58 31-23*
I .051
Nowt. Chi-•quar, anslyres comparlsons are mith U.S. figpures.
4*
p < .001
-20-
.............................................................................................................

3. The use questionnaire was restricted to El-E5 grades. That thisvery nearly coincides with the population subject to random urinalysisis clear from urinalysis reports, even though DOD directives specify anage criterion (under 29 years) rather than pay grade. This is also thepopulation that Brown and Harding's found to give "valid" responses toanonymous drug-use questionnaires, as far as the reported use prevalenceagreed with that calculated by randomized inquiry.
4. Urinalysis data, taken from installations or comiands given theuse questionnaire, were aggregated for those months symmetricallybracketing the date on which the questionnaire was administered. Here,the increased reliability for inclusion of urinalysis data (from a longertime span in months) had to be weighed against the possibility of biasdue to any non-linear shift in drug use frequency. Two alternative databases were used from most commands or installations: (a) the two-monthperid most relevant to the use questionnaire--if given in March self-reported "last month" usage refers to February and March--and (b) alonger period, depending on data availability, that synonetrically bracketedthe time period of relevance to the use questionnaire.
There was, howeVer, a conservative bias in the use questionnaire suchthat (other things being equal) it would tend to under-predict urinepositives. Being originally designed to detect high and low drug abuseunits, it included instructions to report only non-prescribed drug use.Another source of conservative bias is in the calculation of proportionsof time "vulnerable" to urinalysis detection. If a respondent reporteduse on '"W days last month, it was assumed (for prediction of vulner-ability) that this use occupied a single unbroken time span. To theextent that urinalysis will detect drugs for time periods following theday of actual last ingestion, this assumption was conservative. Intheory, a respondent could use a drug ten times per month at 3-dayintervals and be vulnerable all month. By this method, however, it wasassumed that he was vulnerable only 10/30 to 13/30 of the time.
The difference between 10/50 and 13/30 is due to different alter-native assumptions about vulnerability, which depends both on dosage andlaboratory efficiency. Alternative time constants of 0, 1, 2, and 3 daysfollowing day of last ingestion were introduced into the calculations.
Due to its multiple-choice format, the drug use questionnaire didnot specify the exact number of days per month a drug was used, except
15 Brown and Harding, 1972, op. cit.
-21-

for the "daily" and "none" categories. The other categories were 15-30days, 7-14 days, 3-6 days, and 1-2 days. When such a category waschecked, the mid-point was chosen as the estimate of days of use duringthe month specified.
Results of the Comparison. Tables 5 to 8 compare laboratory-reporteddrug positive percentages with those predicted from use questionnaire data
"4 for three U.S. installations and one separate Army division in Germany.Laboratory reports are aggregated for the immediate time frame referredto in the use questionnaire and, for the U.S. the eight-month periodbracketing this time frame. For the separate division the appropriatetime frame was April-May 1973, but data were available only from January-March and May-June. Since the numbers of tests were rather low. allthese months were aggregated for a "best estimate" even though the periodrepresented was somewhat asymmetrical about the most relevant timeinterval.
Use questionnaire data were inserted into the comparison model. Inmathematical form this is:
P loop
p - (I + kW)/N
I X, + 0.75 Xb + 0.35 Xa + 0.15 Xd + 0.05 x,
W = Xb + X, + Xd + Xe
where:P - Predicted percentage of urine samples laboratory
positive from illicit use of a given drug category
p U Predicted proportion of urine samples laboratorypositive from illicit use of a given drug category
I Expected number in group who will be using a givendrug on any randomly selected day
W - Expected number in group using given drug on agiven day excluding daily users
k - Weighting constant to predict vulnerability as afunction of days elapsed since last ingestion (notapplicable to daily users)
X. - Number of self-reported daily users
Xb Number of self-reported 15-30 times/month users
XU Number of self-reported 7-14 times/month users
Xd Number of self-reported 3-6 times/month users
X. - Number of self-reported 1-2 times/month users
N - Total number of respondents in group
-22-

Table 5
COMPARISON OF PERCENT LABORATOPY POSITIVES AND PERCENTUSE-QUESTIONNAIRE PREDICTED POSITIVES AT FORT A
Drug Category
Amphet- Barbi-Opiates amines turates Methadone
Lab Reports February-March 1973: 1.05% 2.27% 0.97% 0.08%No. of tests - 2,458
Lab Reports November '72-June '73: 0.97 1.74 1.66 0.09No. of tests - 7,615
Predicted Percent Positive from UseQuestionnaires March 1973
1,497 Respondents k"O 2.26 5.06 3.24 1.21k-1/30 2.90 5.68 3.62 1.36k-2/30 3.18 6.30 4.00 1.50k-3/30 3.46 6.92 4.39 1.64
Table 6
COMPARISON OF PERCENT LABORATORY POSITIVES ANT) PERCENTUSE-QUESTIONNAIRE PREDICTED POSITIVES AT FORT B
Drug Category
Amphet- Barbi-Opiates amines turates Methadone
Lab Reports February-March 1973: 0.34% 0.21% 0.27% 0.00%No. of tests - 4,705
Lab Reports November '72-June '73: 0.40 0.33 0.39 0.00
No. of tests - 15,414
Predicted Percent Positive from UseQuestionnaires March 1973
1,589 Respondents k-O 1.91 2.97 2.60 1.38k-1/30 2.07 3.32 2.85 1.47k-2/30 2.23 3.68 3.09 1.57k-3/30 2.39 4.04 3.34 1.67
-23-

Table 7
COMPARISON OF PERCENT LABORATORY POSITIVES AND PERCENTUSE-QUESTIONNAIRE PREDICTED POSITIVES AT FORT C
Drug Category
Amphet- Barbi-2Opiates amines turates Methadone
Lab Reports February-March 1973: 0.22% 0.48% 2.72% 0.35%No. of tests - 2,272
Lab Reports November '72-June '73: 0.33 0.41 2.20 0.36No. of tests a 6,,924
Predicted Percent Positive from UseQuestionnaire March 1973
1,002 Respondents k-O 2.45 4.78 3.30 1.01k-1/30 2.72 5.38 3.76 1.1=k-2/30 3.00 6.01 4.22 1.29
- k-3/30 3.27 6.62 4.68 1.44
-.4
Table 8
COMPARISON OF PERCENT LABORATORY POSITIVES AND PERCENT USE-QUESTIONNAIREPREDICTED POSITIVES FROM DIVISION X, GERMANY
Drug CategoryAmphet- Barbi-
Opiates amines turates Methadone
Lab Reports January-June 1973: 1.19% 1.13% 0.00% 0.00%No. of tests - 1,588
Predicted Percent Positive from UseQuestionnaire May 1973
760 Respondents kAO 3.-82 5.53 2.46 0.96k-1/30 4.21 6.15 2.81 1.03k-2/30 4.54 6.81 2.99 1.1ik-3/30 4.85 7.44 3.23 1.19
- 24 -
Results from this model are listed with alternative assumptions aboutdetectability. For example,, k -3/30 is the chance of detection in agiven month in addition to the chance of detection on the days actuallyused. Thus, this constant is added to the monthly incidence of drug use
* t for all categories of use frequency except daily users. The totalextended vulnerability from such categories in terms of man-days permonth is equal to kW.
It does not seem to matter a great deal whether one assumes a detect-ability of 'up to 3 days" or only on day of ingestion (k = 0); reportedlab positives are generally much fewer than statistically predicted fromself-reported use. Even with k - 0, the ratio of lab-reported to pre-dicted values ranged from zero to 0.67, with a median of 0.18. This isparticularly significant considering the conservative assumptions of thepredictive model: k 0 0, and only illicit use reports being considered.If self-reported illicit use were used to predict the incidence ofconfirmed drug abuse rather than of lab positives, the discrepancieswould have been even greater.
DISCUSSION
The comparison of urinalysis results with self-report data revealeda sizeable discrepancy between the two methods. Although both methodscarry some amount of error, it is probable that either the self reports"are inflated estimates or that urinalysis produces underestimates.
In order for the urinalysis data to be considered valid indicators,one must account for. the apparent exaggerations in self-report data andthe variations in urinalysis data from post to post. For example, theratio of lab-reported use of opiates to that predicted from self reportsvaries from 0.13 to 0.37 across installations, as indicated in Table 9.To the extent that urinalysis data are accurate predictors, use-question-naire respondents must have exaggerated their opiate abuse by a factorof 2•.7 at Fort A and 7.7 at Fort C, i.e., about three times as manyexaggerating respondents at Fort C as at Fort A. A similar rate ofexaggeration (3.7) would have had to occur with regard to amphetamines.The exaggeration factor for barbiturates is about 2 at Fort 1. but onlyabout 1.5 at Fort C. For methadone, the factor is 14 at Fort A but less
*• than 3 at Fort C. Such differential rates of exaggeration across drugsseem, unlikely. While there were 153 barbiturate lab positives at Fort"C, there were no barbiturate positives from Division X. In contrast tothis urinalysis variation, the self-reported barbiturate use was only1.-3 times as great at Fort C as in Division X. In short, it seemshighly unlikely that if exaggeration processes were operating, thepatterns of exaggeration could vary so grossly among installations.
On the other hand, if the self-report data are to be considered validprevalence estimates, one must account for the apparent underestimatesof the urinalysis data. The potential sources of the error most probablylie in faulty administration of the urinalysis (i.e., improper collectionof specimens) and/or in the-vagaries of biochemical processes. Some ofthe procedural loopholes of urinalysis--no-shows, excessive warning times,
-25-

"4 1;, C; ; .C
Sr4 cu' ,~' --
E.. .P'.K
.4 U
'aD
tZ KN t-- W% D CU 0 cm'
0010~7 'A" 0JC0. 0-4
1-4 ~ i Lr% * v4 %4~
""- 41 AOJH
.40 V C 0t"0 0t 0.10 0.-b " -
4j 6 A i 1A
$5 A-i' Agaj m ao
* *~*26 -
~c~Jt.-

insecure collection procedures, etc.--were described above. The mostthorpugh examination of procedural problems in urinalysis was performedby Reaser, Richards, and Hartsock'" who employed a research design whichrandomly allotted soldiers either to a urinalysis condition or a question-naire condition. In addition, a research team interviewed staff andobserved the urinalysis procedures. The comparison data showed a dis-crepancy in rates very similar to the present study, the surveys yieldingrates about 10 times those of urinalysis. In addition, gross variationswere observed in urinalysis procedures from post to post, and a number ofloopholes were documented. Reaser and his colleagues concluded that the"survey rate is a better estimate of the incidence of abuse than theurinalysis rates in that the field-implemented random screening proceduresprovide ample opportunity for the potentially identifiable user to success-fully avoid detection." Furthermore, detection effectiveness can varywith the drug. Detection is usually better for opiates than amphetamines,and least effective for methadone.
Finally, it should be recognized that prevalence estimates should,ideally, indicate which drugs are being used at what particular frequency;i.e., what the patterns of illicit drug use are, not simply how manysoldiers have recently ingested a particular drug. The drug-usagedata suggest that the use of illicit drugs is a behavioral, socialproblem of complex proportions. The data indicate 'that the greatmajority of individuals who are using illicit drugs are doing so on afairly infrequent basis--"chipping"--.nd do not appear to be dependent.Furthermore, other data"' reveal that individuals are highly variablein their patterns of drug use; over a period of months and years,individuals will greatly vary their level of use, often switching drugsand interrupting their use as circumstances dictate. Consequently,apart from the problem of sampling procedure and the vagaries of bio-chemistry, urinalysis is not an appropriate technique for assessingdrug use prevalence in the sense mentioned above. By its very nature,it places the occasional user in the same category as the addict.
S* Reaser, J., Richards, J., and Hartsock, S. The incidence of drug abusein the Army: A comparison of urinalysis and survey rates. HumanResources Research Organization, draft report, November 1973.
.'.. • Ramsay, D. A., Cook, R. F., and Hostetter, R. S. Polydrug use patterns
of U.S. Army personnel. ARI Technical Paper (in preparation).
-27-

CONCLUSIONS
The evidence from this and related research strongly suggests that",estimates of drug abuse prevalence derived from the results of random
/urinalysis are underestimates of the actual prevalence of illicit druguse in the Army. It should be recognized, however, that these resultssay nothing about the effectiveness of urinalysis as a deterrent toillicit use or as a device for detecting drug use. The use of a brief,anonymous, confidential self-report form provides rates which are mostprobably nearer the actual rates of 'illicit use, mainly because theself-report has less potential for error and because it permits drug usepatterns to be estimated over a longer period.
Note. Urinalysis was halted in the services in mid-1974, after thisstudy was completed. Plans have been announced by the Department ofDefense for the esm•mption of urinalysis in early 1975, using the radio-imnunoassay (RIA) technique exclusively for initial screening. The RIAmethod is reported to be capable of screening for opiates, barbiturates,amphetamines, and methaqualone (Sopers, Mandrax) and is more sensitivethan TLC and FRAT.1 Two consequences are expected to result from usingRIA: (1) there will be greater uniformity in quality control amongdifferent testing laboratories, and (2) because of the increase insensitivity, some individuals will be "at risk" for a longer period oftime. However, the continued requirement for clinical confirmation,including GLC confirmation of chemical positives, and the mechanics ofadministering tests should not significantly alter the conclusionsreached in this report. The primary problem of using urinalysis data toestimate prevalence is not due to faulty chemical tests but to theinteraction between the entire testing program and the dynamics of druguse by soldiers.
)•2 •sCatlin, D. W. A guide for urine testing for drugs of abuse. Special•i Action Office for Drug Abuse Prevention, contract No. DA3AA426.
Special Action Office monograph, Series B, No. 2, November 1973.
'28

REFERENCES
Ball, J. C., and Chamber, E. C. The epidemiology of opiate addiction inthe United States. Springfield, IL: Charles C. Thomas, 1970.
Berg, G. H. Illicit use of dangerous drugs in the United States: Acompilation of studies, surveys, and polls. U.S. Department of Justice,1970.
Brown, G. H. Methodological problems in determining the true incidenceof drug abuse. Paper presented at Military Operations Research Symposium,Washington, DC, December 1972.
4 Brown, G. H. Drug usage rates as related to method of data acquisition.Human Resources Research Organization, Technical Report 74-20, August1974.
Brown, G. H., and Harding, F. D. A comparison of methods of studyingillicit drug usage. Human Resources Research Organization, TechnicalReport 73-9, April 1973. (AD 760 407)
Catlin, D. W. A guide for urine testing for drugs of abuse. SpecialAction Office for Drug Abuse frevention, contract No. DA3AA426. SpecialAction Office monograph, SeriesB, No. 2, November 1397.
Fisher, A. H., Jr. Preliminary findings from the 1971 DoD survey ofdrug use. Human Resources Research Organization, Technical Report 72-8,March 1.972. (AD 743 852)
Fisher, A. H., Jr. Major findings from the 1972 survey of drug use.HuLmian Resources Research Organization, draft report, May 1M97.
Hurst, P. M., Walizer, D. G., Rindone, W., and McKendry, J. Assessmentof drug abuse prevalence. HRB-Singer Report No. 4664-1, 1973.
Lavenhar, M. A. The drug abuse numbers game. American Journal of PublicHealth, 1973, 63(9).
Ramsay, D. A., Cook, R. F., and Hostettpr, R. S. Polydrug use patterns"of U.S. Army personnel. ARI Technical Paper (in preparation).
Research and Survey Section, Drug and Alcohol Abuse Control Program.Drug Abuse and Morale Monitoring Survey (DAMMS) Report No. 3. FortRiley, KS. March 1972.
Reaser, J., Richards, J., and Hartsock, So The incidence of drug abusein the Army: A comparison of urinalysis and survey rates. HumanResources Research Organization, draft report, November 1973.
Review of military drug and alcohol programs. Hearing before the Sub-commfttee on Drug Abuse in the Military Services. Washington, DC:U.S. Government Printing Office, 1973.
- 29-

. .. r.r.. '.. ..-rrr . ... - ..
Robins, L. N. A follow-up of Vietnam drug users. Special Action Office
for Drug Abuse Prevention, contract No. HSM-42-72-75. Special Action
Office monograph, Series A, No. 1, April 1973.
Warner, S. L. Randomixed response: A survey technique for estimating
evasive answer bias. American Statistical Association Journal,, 1965,.i_, 63-69.
- 30 -


![Global illicit drug trends 2001 [U.N]](https://img.dokumen.tips/doc/110x75/586906e81a28abc92d8b9366/global-illicit-drug-trends-2001-un.jpg)