Embed Size (px)
Citation preview

Biogeosciences, 4, 481–492, 2007www.biogeosciences.net/4/481/2007/© Author(s) 2007. This work is licensedunder a Creative Commons License.
Biogeosciences
Assessing the potential long-term increase of oceanic fossil fuel CO2
uptake due to CO2-calcification feedback
A. Ridgwell1, I. Zondervan2, J. C. Hargreaves3, J. Bijma2, and T. M. Lenton4
1School of Geographical Sciences, University of Bristol, Bristol, BS8 1SS UK2Biogeosciences, Alfred Wegener Institute for Polar and Marine Research, Am Handelshafen 12, 27570 Bremerhaven,Germany3Frontier Research Center for Global Change, 3173-25 Showa-machi, Kanazawa-ku, Yokohama, Kanagawa 236-0001, Japan4School of Environmental Sciences, University of East Anglia, Norwich, NR4 7TJ, UK
Received: 27 September 2006 – Published in Biogeosciences Discuss.: 13 November 2006Revised: 27 June 2007 – Accepted: 28 June 2007 – Published: 6 July 2007
Abstract. Plankton manipulation experiments exhibit a widerange of sensitivities of biogenic calcification to simulatedanthropogenic acidification of the ocean, with the “lab rat”of planktic calcifiers,Emiliania huxleyiapparently not rep-resentative of calcification generally. We assess the implica-tions of this observational uncertainty by creating an ensem-ble of realizations of an Earth system model that encapsulatesa comparable range of uncertainty in calcification response toocean acidification. We predict that a substantial reductionin marine carbonate production is possible in the future, withenhanced ocean CO2 sequestration across the model ensem-ble driving a 4–13% reduction in the year 3000 atmosphericfossil fuel CO2 burden. Concurrent changes in ocean circula-tion and surface temperatures in the model contribute aboutone third to the increase in CO2 uptake. We find that un-certainty in the predicted strength of CO2-calcification feed-back seems to be dominated by the assumption as to whichspecies of calcifier contribute most to carbonate productionin the open ocean.
1 Introduction
Open ocean dwelling calcifying plankton, such as coccol-ithophorids and foraminifera produce shells by precipitatingthe mineral calcium carbonate (CaCO3). The continued dis-solution of fossil fuel CO2 in the surface waters of the oceanand associated decrease in ambient carbonate ion (CO2−
3 )concentration (Orr et al., 2005) and pH, termed ocean acidi-fication (Caldeira and Wickett, 2003) could adversely affectthe ability of these species of plankton to precipitate CaCO3
Correspondence to:A. Ridgwell([email protected])
(e.g., Bijma et al., 1999; Riebesell et al., 2000; Zondervanet al., 2001). A reduction in marine carbonate productionwould, in turn, increase the capacity of the surface ocean toabsorb CO2 (Barker et al., 2003; Zondervan et al., 2001).Understanding the strength of this “CO2-calcification” feed-back, by which we mean: the acceleration of CO2 uptakeby the ocean due to lower calcification rates, is important toaccurate prediction of the fate of CO2 emitted to the atmo-sphere and the extent of future climate change.
The climatic importance of biogenic production of CaCO3in the surface ocean and its subsequent removal by grav-itational settling arises because although the sum to-tal of dissolved carbon species (DIC) is reduced uponCaCO3 precipitation, the remaining carbon is re-partitionedin favor of CO2(aq). This results in a higher par-tial pressure of CO2 (pCO2) in the surface ocean by:Ca2++2HCO−
3 →CaCO3+CO2(aq)+H2O. It has been foundthat biogenic carbonate production can be suppressed asCO2 is added to the ocean (see Table 1) and the am-bient concentration of carbonate ions (CO2−
3 ) is reduced(CO2(aq)+CO2−
3 +H2O→2HCO−
3 ). This is not entirely unex-pected because in the abiotic system, the precipitation rate ofCaCO3 can be related directly to concentration[CO2−
3 ] via:
R = k × (� − 1)η (1)
where� is the saturation state (or solubility ratio) of theaqueous environment, defined as[Ca2+
]×[CO2−
3 ]/Ksp (withKsp a solubility constant), andk is an overall scaling constant(Zhong and Mucci, 1993). The power parameterη controlshow non-linear the response of calcification is to a change insaturation state (and[CO2−
3 ]) – the higher the value ofη, themore responsive calcification is to ambient saturation. Con-versely, low values ofη imply that calcification will be only
Published by Copernicus Publications on behalf of the European Geosciences Union.

482 A. Ridgwell et al.: Future CO2-calcification feedback
Table 1. Relative sensitivity to saturation changes (η) observed in different experimental calcification rate manipulations.
#1 Species Experimental details � (calcite) � (aragonite) Estimatedη2 Reference
– Calcidiscus leptoporus in vitro ∼ 2 to∼10 – n/a3 Langer et al. (2006)0 Coccolithus pelagicus in vitro ∼ 2 to∼10 – 04 Langer et al. (2006)1 Emiliania huxleyi in vitro 2.0 to 4.8 – 0.20±0.095 Zondervan et al. (2001)2 Emiliania huxleyi mesocosm bloom 2.0 to 5.3 – 0.32±0.20 Delille et al. (2005)3 Orbulina universa in vitro (high light) 1.0 to 4.1 – 0.32±0.08 Bijma et al. (1999)3 Orbulina universa in vitro (darkness) 1.7 to 4.1 – 0.49±0.23 Bijma et al. (1999)4 Gephyrocapsa oceanica in vitro 1.7 to 4.3 – 0.53±0.31 Zondervan et al. (2001)5 Mixed assemblage Ship-board incubation 1.7 to 4.4 – 0.75±0.10 Riebesell et al. (2000)6 Corals6 (various) – ∼ 1 to∼6 ∼ 1 Langdon and Atkinson (2005)7
7 None (abiotic) in vitro – – 1.9–2.8 Zhong and Mucci (1993)
1 Sorted downwards by increasing apparent sensitivity of calcification to a change in saturation state. The ID number (#) corresponds to thenumber labeling in Fig. 4.2 Mean value and standard error.3 For C. leptoporusthe observed response of the inorganic carbon content per cell to saturation state was inconsistent with Eq. (1).4 No significant carbonate production response was observed inC. pelagicus.5 In an incubation experiment withEmiliania huxleyi, Sciandra et al. (2003) found a 25% decrease in net calcification rate in response toan increase in CO2 from 400 to 700 ppm. This is a slightly larger calcification response than the 15% decrease observed by Zondervan etal. (2001) under a comparable increase inpCO2, but still rather lower than the 43% decrease in mesocosm experiments withE. huxleyi(Delille et al., 2005).6 Coral communities as well as individuals.7 Also see: Yates and Halley (2006a, b) and Schneider and Erez (2006).
weakly affected by changes in saturation. A value of zerois the same as assuming that calcification is independent ofsaturation.
Marine carbonate production thus gives rise to a negativefeedback on climate change, as by suppressing calcification,fossil fuel CO2 emissions will cause a reduction in the rate ofCO2 release from CaCO3 precipitation and accelerate the re-moval of CO2 from the atmosphere (Zondervan et al., 2001).The net impact of fossil fuel CO2 release on the climate sys-tem will therefore be reduced in the presence of this “CO2-calcification feedback”.
We address the potential importance of CO2-calcificationfeedback to the future sequestration of fossil fuel CO2 byfirst collating the calcification responses of different marineorganisms to changing CO2−
3 and then quantifying the impli-cations of our findings using an Earth system model (Ridg-well et al., 2007; Ridgwell and Hargreaves, 2007). We con-sider changes in ocean carbon cycling occurring on up toa millennial timescale, when the most important control isthe amount of fossil fuel emitted in conjunction with the im-pact of amplifying positive feedbacks between CO2 and sea-surface temperature (due to reduced CO2 solubility at highertemperatures) and ameliorating negative feedbacks such asbetween CO2 and calcification. To simplify the analysis,we ignore the net loss or gain of carbon by the land surface(Lenton et al., 2006). Neither will we consider changes in:shallower water (coral reef) or benthic calcification or the
effect of temperature on calcification (e.g. coral bleaching),or potential changes in the efficiency of export of organiccarbon to the deep sea, although we discuss their potentialroles later. We also omit the impact of the dissolution of car-bonates in deep-sea sediments as well as the enhancement ofcarbonate and silicate weathering on land under higher sur-face temperatures – such processes dominate ocean invasiononly on time-scales rather longer than ca. 1000 years (Ridg-well and Hargreaves, 2007). Our focus in this paper it thusthe direct modulating effect of changes in surface ocean cal-cification on atmospheric CO2 through the remainder of themillennium.
2 Synthesis of experimental calcifier response
The response of a number of different calcifying marine or-ganisms to changes in ambient carbonate chemistry havebeen investigated to date (summarized in Table 1). How-ever, the experimental setups and chosen manipulations ofthe carbonate system differ, hindering simple comparison.We address this by calculating the relative change in calciumcarbonate production (calcification rate) as a function of acommon variable for which we utilize the widely-used de-scription of the rate of precipitation of carbonate minerals asgiven in Eq. (1) (Zhong and Mucci, 1993).
For each set of experimental manipulations detailed inTable 1, � of calcite is calculated from mean dissolved
Biogeosciences, 4, 481–492, 2007 www.biogeosciences.net/4/481/2007/

A. Ridgwell et al.: Future CO2-calcification feedback 483
inorganic carbon and alkalinity concentrations, salinity,and temperature measured over the course of each experi-ment, and using the dissociation constants of Mehrbach etal. (1973), as refitted by Dickson and Millero (1987). ForEmiliania huxleyi(in vitro) (Zondervan et al., 2001) (#1) wecombine the two different light-dark cycle data-sets, whereasthere is sufficient experimental data to separately fit the re-sults of “high light” and “complete darkness” incubationsof the foraminiferaOrbulina universa(in vitro) (Bijma etal., 1999) (#3). For theE. huxleyimesocosm experiments(Delille et al., 2005) (#2), we fit all the individual replicatesacross the three treatments. For the ship-board incubationsof phytoplankton assemblages (Riebesell et al., 2000) (#5),we first normalize the calcification rate data to a value of 1.0at the common CO2(aq) concentration of 10µmol l−1, beforefitting the results of all 5 experiments together.
In fitting the data, we assume that Eq. (1) holds true andseek the value ofη that produces the best fit to the data.The value of the parameterη is crucial, since it representsthe degree of non-linearity of response of calcification rateto a change in ambient carbonate ion (CO2−
3 ) concentration(and thus�). A high value ofη implies that even a mod-est anthropogenically-driven reduction in ocean CO2−
3 (andpH) might drive a substantial decrease in CaCO3 production,significantly enhancing fossil fuel CO2 uptake by the ocean.We carry out 100 iterations using the Levenberg-Marquardtalgorithm to minimize the least squares misfit between thetheoretical curve and the experimental data. We report thestandard error associated with the estimated fitted value ofη
in Table 1.
3 Model configuration and calibration
The range in sensitivities exhibited by calcifying planktoncoupled with uncertainty in which plankton groups dominatepast, present, and future marine carbonate production (e.g.,Schiebel, 2002), means that a single estimate of the strengthof CO2-calcification feedback could be misleading. Instead,we have taken an ensemble approach to the problem and ex-plored a wide range of possible responses, using an ensem-ble Kalman filter (EnKF) calibration (Annan et al., 2005) ofocean carbon cycling in the GENIE-1 Earth system model.
The GENIE-1 model comprises: 3-D ocean circulationmodel, 2-D energy-moisture balance model (EMBM) ofthe atmosphere, dynamic-thermodynamic sea-ice model, andrepresentation of atmosphere-ocean-sediment carbon cycling(Ridgwell et al., 2007; Ridgwell and Hargreaves, 2007). Weuse the same relationship between calcification and satura-tion state (�) in the GENIE-1 model (Ridgwell et al., 2007)as we used to fit the calcification data (i.e., Eq. 1). In this,we apply a thermodynamically-based modifier of the rate ofcarbonate production,γ , as a function of the local surfaceocean saturation state (�):
γ = (� − 1)η for � > 1.0 (2a)
γ = 0.0 for � ≤ 1.0 (2b)
We link this to biological export production from the surfaceocean by relating the export flux of CaCO3 (F CaCO3) directlyto the POC flux (F POC) via a spatially-uniform scalar for theCaCO3:POC rain ratio (rCaCO3:POC
0 ), but modified byγ :
F CaCO3 = γ × rCaCO3:POC0 × F POC (3)
The biogenic export of CaCO3 from the surface ocean in themodel thus increases with a greater ambient environmentaldegree of super-saturation with respect to the solid carbon-ate phase (�>1.0). Carbonate production is zero at�≤1– i.e., we implicitly assume that super-saturation and ther-modynamically favorable environmental conditions are re-quired for pelagic carbonate production. However, whilethis assumption appears valid for corals, it may not hold forforaminifera. We discuss the implications of this later. In ad-dition, although coccolithophorid and foraminiferal calcifi-cation rates have been observed to respond to changes in sat-uration (e.g., Bijma et al., 1999; Riebesell et al., 2000; Zon-dervan et al., 2001; Delille et al., 2005), we do not explicitlycapture other important controls in our formulation of car-bonate production. Instead, we have implicitly collapsed the(poorly understood) ecological and physical oceanographiccontrols on marine carbonate production onto a single, purelythermodynamic dependence on�. Furthermore, while POCproduction is affected by changes in climate (such as strat-ification) in the GENIE-1 model, for simplicity, we do notadditionally modify POC production in response to changesin pH (Zondervan et al., 2001).
We utilized observed 3-D distributions of alkalinity (Keyet al., 2004) and phosphate (Conkright et al., 2002) in theocean, together with the 2-D distribution of CaCO3 contentin surface sediments (Archer, 1996) to constrain model pa-rameters controlling the marine carbon cycle using an en-semble Kalman filter (EnKF) as described in Ridgwell etal. (2007) and Ridgwell et al. (2007). The EnKF solves theKalman equation for optimal linear estimation by using theensemble statistics to define the mean and covariance of themodel’s probability distribution function. In other words, theresulting ensemble members are random samples from thisprobability distribution function. Although this method isonly formally optimal in the case of a linear model and an in-finite ensemble size, it has been shown to work well in casessimilar to ours (Hargreaves et al., 2004; Annan et al., 2005).We employ Eqs. (2–3) in calculating CaCO3 production, andcalibrate bothrCaCO3:POC
0 andη in the EnKF. Six additionalparameters controlling the rate of organic carbon export asa function of available nutrients (PO4) as well as the lengthscales of organic carbon and carbonate carbon remineraliza-tion in the ocean interior are also simultaneously calibrated,summarized in Table 2. The size of the ensemble is 54, whichis chosen primarily for computational convenience and hasno special significance.
www.biogeosciences.net/4/481/2007/ Biogeosciences, 4, 481–492, 2007
484 A. Ridgwell et al.: Future CO2-calcification feedback
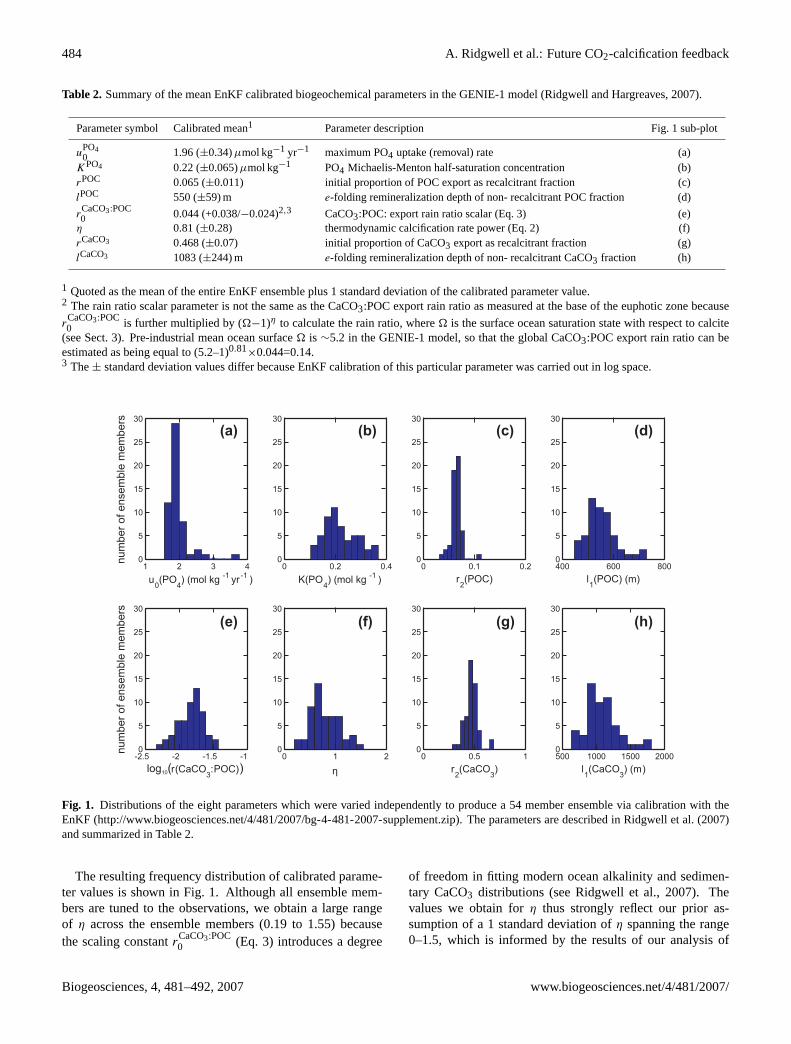
Table 2. Summary of the mean EnKF calibrated biogeochemical parameters in the GENIE-1 model (Ridgwell and Hargreaves, 2007).
Parameter symbol Calibrated mean1 Parameter description Fig. 1 sub-plot
uPO40 1.96 (±0.34)µmol kg−1 yr−1 maximum PO4 uptake (removal) rate (a)
KPO4 0.22 (±0.065)µmol kg−1 PO4 Michaelis-Menton half-saturation concentration (b)rPOC 0.065 (±0.011) initial proportion of POC export as recalcitrant fraction (c)lPOC 550 (±59) m e-folding remineralization depth of non- recalcitrant POC fraction (d)
rCaCO3:POC0 0.044 (+0.038/−0.024)2,3 CaCO3:POC: export rain ratio scalar (Eq. 3) (e)
η 0.81 (±0.28) thermodynamic calcification rate power (Eq. 2) (f)rCaCO3 0.468 (±0.07) initial proportion of CaCO3 export as recalcitrant fraction (g)lCaCO3 1083 (±244) m e-folding remineralization depth of non- recalcitrant CaCO3 fraction (h)
1 Quoted as the mean of the entire EnKF ensemble plus 1 standard deviation of the calibrated parameter value.2 The rain ratio scalar parameter is not the same as the CaCO3:POC export rain ratio as measured at the base of the euphotic zone because
rCaCO3:POC0 is further multiplied by (�−1)η to calculate the rain ratio, where� is the surface ocean saturation state with respect to calcite
(see Sect. 3). Pre-industrial mean ocean surface� is ∼5.2 in the GENIE-1 model, so that the global CaCO3:POC export rain ratio can beestimated as being equal to (5.2–1)0.81
×0.044=0.14.3 The± standard deviation values differ because EnKF calibration of this particular parameter was carried out in log space.
1 2 3 40
5
10
15
20
25
30
u0(PO
4) (mol kg
-1yr
-1)
0 0.2 0.40
5
10
15
20
25
30
K(PO4) (mol kg
-1)
0 0.1 0.20
5
10
15
20
25
30
r2(POC)
400 600 8000
5
10
15
20
25
30
l1(POC) (m)
-2.5 -2 -1.5 -10
5
10
15
20
25
30
3
0 1 20
5
10
15
20
25
30
η
0 0.5 10
5
10
15
20
25
30
r2 3
)
5000
5
10
15
20
25
30
l1 3
nu
mb
er
of
en
se
mb
lem
em
be
rsn
um
be
ro
fe
nse
mb
lem
em
be
rs
(a) (b) (c) (d)
(e) (f) (g) (h)
log10( )
Fig. 1. Distributions of the eight parameters which were varied independently to produce a 54 member ensemble via calibration with theEnKF (http://www.biogeosciences.net/4/481/2007/bg-4-481-2007-supplement.zip). The parameters are described in Ridgwell et al. (2007)and summarized in Table 2.
The resulting frequency distribution of calibrated parame-ter values is shown in Fig. 1. Although all ensemble mem-bers are tuned to the observations, we obtain a large rangeof η across the ensemble members (0.19 to 1.55) becausethe scaling constantrCaCO3:POC
0 (Eq. 3) introduces a degree
of freedom in fitting modern ocean alkalinity and sedimen-tary CaCO3 distributions (see Ridgwell et al., 2007). Thevalues we obtain forη thus strongly reflect our prior as-sumption of a 1 standard deviation ofη spanning the range0–1.5, which is informed by the results of our analysis of
Biogeosciences, 4, 481–492, 2007 www.biogeosciences.net/4/481/2007/

A. Ridgwell et al.: Future CO2-calcification feedback 485
experimental manipulations (Table 1). The relationship be-tweenr
CaCO3:POC0 andη is determined by the EnKF itself,
consistent with the ocean and sediment data. Thus, althoughthis means that we cannot deduce the most probable value forη from marine geochemical observations using our model,we can address the sensitivity of the marine carbon cycle tothe wide range of uncertainty inη by carrying out experi-ments using the full 54-member ensemble of model instances(rather than a just single model composed of the parametervalue means).
We refer readers to Ridgwell and Hargreaves (2007) forcritical assessment of the ensemble mean of this calibrationand to Ridgwell et al. (2007) for a similar calibration butomitting sediment composition. For the analysis presentedhere, the most relevant model prediction is that of pelagicCaCO3 production in the open ocean. In the calibratedmodel, mean CaCO3 export is 1.2 PgC yr−1, very close toother observational-based estimates (e.g., Feely et al., 2004;Jin et al., 2006). The GENIE-1 model also successfully cap-tures the latitudinal trends in the zonal mean of ocean satu-ration (�) with respect to calcite, although it generally pre-dicts � some∼0.5 units higher than observations and doesnot reproduce the distinct geochemistry characterizing con-tinental margin upwelling zones, as shown in Fig. 2. Theconsequence of this model-data mismatch will be a slightunder-estimate of the strength of CO2-calcification feedbackin the model because initial� is slightly further away fromthe threshold of zero calcification (�=1, as defined by Eq. 2)than it should be.
4 Future impacts of reduced marine calcification on fos-sil fuel CO2 uptake
We run the 54 member ensemble under a single illustra-tive CO2 emissions scenario, based on the assumption ofall conventional fossil fuel reserves (ca. 4000 PgC) beingused up sometime early in the 24th century (Lenton et al.,2006) (Fig. 3a), an amount slightly less than that assumedby Caldeira and Wickett (2003). The ensemble members arerun in each of four permutations of feedbacks operating: (i)no CO2-calcification or CO2-climate feedbacks, (ii) just theCO2-climate feedback, (iii) just the CO2-calcification feed-back, and (iv) both CO2-calcification and CO2-climate feed-backs. The numerical efficiency of the GENIE-1 model iscritical, as this combined sensitivity + feedback analysis rep-resents a total of: 4×54×3000=648 000 years of coupled 3-D ocean carbon cycle/climate model simulation, which weachieve in just a few days on a small computing cluster.
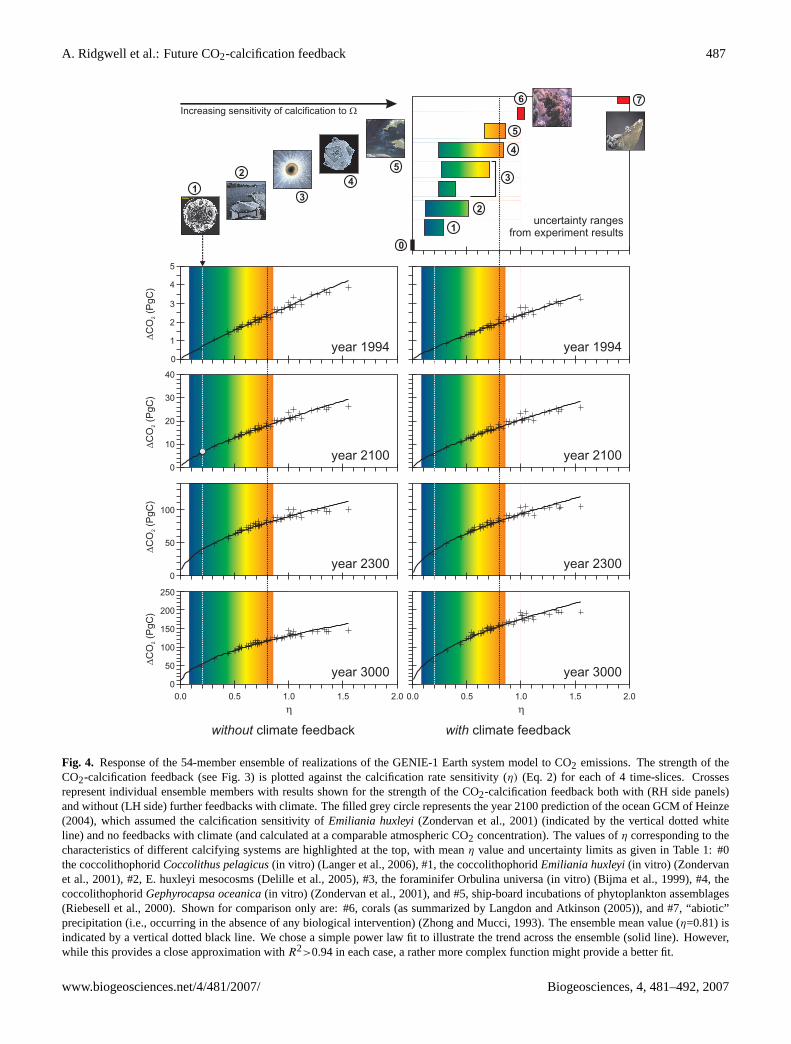
The evolution with time of the strength of the CO2-calcification feedback is shown in Fig. 3 for the ensemblemean model, and for the individual members in Fig. 4. Wefind that historical fossil fuel CO2 emissions drive an ensem-ble mean reduction in calcite saturation state (�) from 5.2 to4.5 by the year 1994, leading to a 13% decrease in marine
-180
-90
90
0
-90
90
0 2.0
1.0
-120 -060 +000 +060 +120 +180
Su
rfa
ce
oc
ea
ns
atu
rati
on
,(c
alc
ite
)�
3.0
4.0
5.0
6.0
7.0
Fig. 2. Surface ocean saturation state. The top panel showsthe observationally-derived annual average pre-Industrial saturationstate (�) for calcite, which we calculate from 3-D data-sets of DICand ALK (Key et al., 2004) together with temperature, salinity,PO4, and H4SiO4 (Conkright et al., 2002), transformed onto theGENIE-1 model 36×36 equal area model grid and integrated overthe uppermost 75 m. We use the same carbonate chemistry schemeas used in GENIE-1 (Ridgwell et al., 2007) in this calculation. Thelower panel shows the model-predicted annual average� based onthe calibrated parameter value means (Ridgwell and Hargreaves,2007) (see Table 2).
carbonate production (Fig. 3d) as a consequence of Eq. (2).The contribution to the 1994 oceanic anthropogenic CO2 in-ventory (estimated at 118±19 PgC (Sabine et al., 2004)) dueto CO2-calcification feedback (1CO2) and including climatefeedbacks in the model is no more than 3.2 PgC at this time(Fig. 4), even under the ensemble end-member with the high-est sensitivity to ocean acidification (η=1.55).
Deviations from the best fit line across the ensemble(Fig. 4) reflect the influence of factors that affect CO2 se-questration, other than differences in the value ofη. Forinstance, the ensemble exhibits initial (year 1765) globalCaCO3 export of between 1.05 and 1.59 PgC yr−1, similar torecent data-based production estimates of 0.8–1.4 PgC yr−1
(Feely et al., 2005; Jin et al., 2006). Because there is nosignificant correlation with the value ofη across the ensem-ble (R2
∼0.03), our model experiment encapsulates a sensi-tivity test of the strength of CO2-calcification feedback touncertainties in initial (pre-industrial) global carbonate pro-duction. The relatively muted scatter (R2>0.94) of the en-semble members about the best fit line (Fig. 4) indicatesthat CO2 sequestered due to ocean acidification is relativelyinsensitive to assumptions regarding initial carbonate pro-duction in the open ocean in the ensemble. Particulate or-ganic carbon (POC) export varies from 7.9 to 12.0 PgC yr−1
www.biogeosciences.net/4/481/2007/ Biogeosciences, 4, 481–492, 2007

486 A. Ridgwell et al.: Future CO2-calcification feedback
200
400
600
800
1000
1200
1400
1800 2000 2200 300026002400 2800
year
0
5
10
20
15
17
65
21
00
23
00
30
00
0
100
-100
200
Em
issio
ns
(PgC
yr
)-1
(i) no feedbacks
(ii) +climate
(iii) +CaCO3
(iv) +climate+CaCO3
0.0
0.2
0.4
0.6
0.8
1.0
Glo
balC
aC
Oexport
(PgC
yr
)3
-1
1.2
1.4
d
c
a
b
19
94
CO
(ppm
)2
�C
O2
�C
O2
Fig. 3. Atmospheric CO2 and marine carbonate production responses to fossil fuel CO2 release. In this, a single model instance employingthe ensemble mean parameter set (Table 2) rather than all individual members of the ensemble is used here to illustrate the impact ofCO2-calcification feedback.(a) Time-history of the rate of CO2 emissions to the atmosphere prescribed in the model (see Lenton et al.,2006). (b) Evolution of atmospheric CO2 in experiments with: (i) neither climate nor calcification changes (solid line), (ii) “CO2-climate”feedbacks operate (dotted line), (iii) calcification responds to atmospheric CO2 (i.e., “CO2-calcification” feedback) (dashed line), and (iv)both CO2-calcification and CO2-climate feedbacks operate (dot-dash line).(c) The impact on the evolution of atmospheric CO2 of the twofeedbacks is shown, both individually, and combined (and compared to the baseline (i.e., no feedbacks) scenario). The grey arrows illustratehow the strength of CO2-calcification feedback (1CO2) is calculated – i.e., as the difference between the atmospheric CO2 responses withand with-out calcification responding to acidification. The1CO2 values themselves are plotted in Fig. 4 for all the ensemble members,while the time-slices at which CO2 is calculated (years; 1994, 2100, 2300, 3000) are marked by vertical dotted lines.(d) The response ofglobal carbonate export under the different permutations of feedback. In the absence of any response of calcification to changing carbonatesaturation, CaCO3 export declines in response to fossil fuel emissions as a result of changes in ocean circulation (stratification) whenfeedbacks between CO2 and climate are allowed to operate. (Legend as per 1b.)
Biogeosciences, 4, 481–492, 2007 www.biogeosciences.net/4/481/2007/
A. Ridgwell et al.: Future CO2-calcification feedback 487
0.0
h0.5 1.0 1.5 2.0
0
DC
O (
)2
Pg
C
10
20
40
0
DC
O (
Pg
C)
2
100
0
1
2
3
4
DC
O (
)2
Pg
C
0
DC
O (
)2
Pg
C
50
100
Increasing sensitivity of calcification to W
150
50
5
30
200
250
h
without climate feedback with climate feedback
year 1994 year 1994
year 3000
year 2300
year 2100
year 2300
year 2100
year 3000
0.0 0.5 1.0 1.5 2.0
1
4
5
7
1
2
3
4
5
2
3
6
0
uncertainty rangesfrom experiment results
Fig. 4. Response of the 54-member ensemble of realizations of the GENIE-1 Earth system model to CO2 emissions. The strength of theCO2-calcification feedback (see Fig. 3) is plotted against the calcification rate sensitivity (η) (Eq. 2) for each of 4 time-slices. Crossesrepresent individual ensemble members with results shown for the strength of the CO2-calcification feedback both with (RH side panels)and without (LH side) further feedbacks with climate. The filled grey circle represents the year 2100 prediction of the ocean GCM of Heinze(2004), which assumed the calcification sensitivity ofEmiliania huxleyi(Zondervan et al., 2001) (indicated by the vertical dotted whiteline) and no feedbacks with climate (and calculated at a comparable atmospheric CO2 concentration). The values ofη corresponding to thecharacteristics of different calcifying systems are highlighted at the top, with meanη value and uncertainty limits as given in Table 1: #0the coccolithophoridCoccolithus pelagicus(in vitro) (Langer et al., 2006), #1, the coccolithophoridEmiliania huxleyi(in vitro) (Zondervanet al., 2001), #2, E. huxleyi mesocosms (Delille et al., 2005), #3, the foraminifer Orbulina universa (in vitro) (Bijma et al., 1999), #4, thecoccolithophoridGephyrocapsa oceanica(in vitro) (Zondervan et al., 2001), and #5, ship-board incubations of phytoplankton assemblages(Riebesell et al., 2000). Shown for comparison only are: #6, corals (as summarized by Langdon and Atkinson (2005)), and #7, “abiotic”precipitation (i.e., occurring in the absence of any biological intervention) (Zhong and Mucci, 1993). The ensemble mean value (η=0.81) isindicated by a vertical dotted black line. We chose a simple power law fit to illustrate the trend across the ensemble (solid line). However,while this provides a close approximation withR2>0.94 in each case, a rather more complex function might provide a better fit.
www.biogeosciences.net/4/481/2007/ Biogeosciences, 4, 481–492, 2007

488 A. Ridgwell et al.: Future CO2-calcification feedback
De
pth
(km
)
0
1
2
3
4
50-90 -60 -30 30 60 0-90 -60 -30 30 0-90 -60 -30 30 60 90
2250
2300
2350
2400
2450
De
pth
(km
)
0
1
2
3
4
5
Atlantic Ocean
De
pth
(km
)
0
1
2
3
4
5
YE
AR
17
65
OB
SE
RV
AT
ION
SY
EA
R2
30
0Y
EA
R3
00
0
Indian Ocean Pacific Ocean
De
pth
(km
)
0
1
2
3
4
5
0-90 -60 -30 30 60 0-90 -60 -30 30 0-90 -60 -30 30 60 90
S NS SNN
Fig. 5. Reorganization of the ocean alkalinity structure. The zonal mean distribution of alkalinity (ALK) undergoes a large-scale reorgani-zation in response to the reduction in marine carbonate production. Shown compared to observations (Key et al., 2004) (top panel) are thepredictions of the ensemble mean model (η=0.81) for the years: 1765, 2300, and 3000.
across the ensemble, but with only 2 members exhibitingPOC export greater than 9.9 PgC yr−1. The clustering inthe range∼8–10 PgC yr−1 is consistent with published inter-model variability (e.g., Aumont et al., 2003; Heinze et al.,1999; Schmittner et al., 2005).
Ocean saturation and marine carbonate production decline(Fig. 3d) until around the year 2300 when a peak atmo-spheric CO2 concentration of∼1400 ppm is reached in re-sponse to emissions. Our model ensemble predicts the addi-tional sequestration of 33–107 PgC due to CO2-calcificationfeedback at this time (Fig. 4). Although marine carbonateproduction starts to recover thereafter, the effect of CO2-calcification feedback (1CO2) continues to increase, reach-ing 62–199 PgC by the next Millennium.
The persistence of the impact of reduced calcification re-flects the time needed to establish a new alkalinity (ALK)structure in the ocean (Fig. 5). By the year 3000 a pro-found reorganization has occurred, in which the ALK gra-dients induced by nitrate uptake and remineralization startto dominate over the initially much stronger opposite effect
due to the precipitation and dissolution of CaCO3. For in-stance, ALK becomes almost as high in the deep North At-lantic compared to the North Pacific by year 3000, whereasin the modern ocean there is a very pronounced Atlantic→
Pacific gradient.
5 Discussion
Calcifying organisms studied in vitro exhibit a wide rangeof sensitivities of calcification to saturation state (e.g., Ta-ble 1). In contrast, marine ecosystem models have generallyassumed a single species (Emiliania huxleyi) is representa-tive of carbonate production in the open ocean (e.g., Mooreet al., 2002; Le Quere et al., 2005). This is problematic,because whileE. huxleyiforms large blooms over wide ar-eas of the ocean is not thought to be a particularly importantcalcifying coccolithophorid (Broerse et al., 2000; Ziveri andThunell, 2000). We find that this species also exhibits oneof the lowest observed calcification sensitivities to a changein CO2 in vitro (although it is somewhat higher in mescosms
Biogeosciences, 4, 481–492, 2007 www.biogeosciences.net/4/481/2007/

A. Ridgwell et al.: Future CO2-calcification feedback 489
– see below). Furthermore, foraminifera such asOrbulinauniversawhich appear to be rather more sensitive thanE.huxleyi, may dominate carbonate export globally (Schiebel,2002).
There are also substantial differences between the re-sults of different experimental methodologies with the samespecies – for instance, an approximate tripling of atmo-spheric CO2 concentration drove a 10–19% reduction in car-bonate production byEmiliania huxleyiwhen studied in vitro(Riebesell et al., 2000; Zondervan et al., 2001) but 42% un-der a similar CO2 change in a mesocosm bloom experiment(Delille et al., 2005). Furthermore, incubated natural phy-toplankton assemblages from the North Pacific have showndecreases in the rate of calcification of up to 83% over thissame atmospheric CO2 range (Riebesell et al., 2000).
The assemblage incubation results may reflect a delay incoccolith production (Delille et al., 2005). Differences inmethodologies also exist between the perturbation studies inhow CO2 is controlled and which could affect the deducedsensitivity of calcification: for instance Delille et al. (2005)bubbled CO2 to achieve required CO2 values whereas Riebe-sell et al. (2000) and Zondervan et al. (2001) added acid andbase in some experiments. However, we think that the ap-parent progression observed in carbonate production sensi-tivity: in vitro → mesocosms→ natural assemblages mightbe important. It could reflect either a higher calcification sus-ceptibility of un-characterized calcifying plankton species oran amplification of acidification impacts on carbonate pro-duction by ecosystem dynamics, perhaps reflecting a lowerfitness of calcifying plankton, which would result in fewerindividuals in addition to less CaCO3 production per individ-ual. If so, in making species response inter-comparison, useof a standard experimental protocol would be advantageous.
The enhancement of marine sequestration of fossil fuelCO2 by the next Millennium (Fig. 4) as a result of reducedsurface ocean calcification represents 4–13% of the atmo-spheric fossil fuel CO2 burden at this time (the anthropogenicexcess over the pre-industrial inventory). Thus, while CO2-calcification feedback reduces the peak atmospheric CO2concentration by∼15–49 ppm in our experiment, its im-portance relative to atmospheric CO2 is rather greater onthe millennial-scale (∼29–93 ppm). The inclusion of a cli-mate component (Edwards and Marsh, 2005) in the GENIE-1 Earth system model allows us to assess the importanceof changes in climate on the CO2-calcification feedback.Changes in ocean surface temperatures affect CO2 solubil-ity and ocean stratification, which in turn affects the rate ofCO2 invasion into the ocean and nutrient supply up to thesurface. This amplifies by up to one third the change in CO2sequestration that is directly driven by reduced calcification(contrast the L.H. and R.H. panels in Fig. 4).
A number of mechanisms have not been taken into ac-count in this Earth system model analysis, which could af-fect estimates of the overall importance of CO2-calcificationfeedback. For instance, the effect of ecosystem changes on
the average sinking rate and penetration depth of POC mayact in either direction depending on the species that becomemore abundant (e.g., Bopp et al., 2003), amplifying or dimin-ishing the net response of the marine carbon cycle to oceanacidification. However, we do not distinguish the contribu-tion of different phytoplankton “functional types” to total ex-port production in the current model (Ridgwell et al., 2007).There are also physiological effects of higher ambient con-centrations of dissolved CO2 (and lower pH) in driving morePOC production per cell, an effect that has been observed tobe substantial inE. huxleyiandG. oceanica(Zondervan etal., 2001). The consequential increase in the efficiency ofthe biological pump would act as a negative feedback on ris-ing atmospheric CO2. Similarly, any future decline in coralcalcification (Kleypas et al., 1999) or increase in the disso-lution of aragonite and/or high magnesium calcite, none ofwhich we consider here, would act to increase the seques-tration of fossil fuel CO2. Finally, a reduction in carbonateproduction could also affect the transport of organic matterinto the deep ocean (Ridgwell, 2003) – the ballast hypothesis(Armstrong et al., 2002). The consequence of a mechanis-tic dependence of organic carbon transport on the carbonateflux would be a reduction in the strength of CO2-calcificationfeedback (Barker et al., 2003; Heinze, 2004). However, al-ternative interpretations of sediment trap correlations do notrequire the efficiency of the organic carbon pump to be de-pendent on the CaCO3 flux (Francois et al., 2002; Passowand De La Rocha, 2006).
The caveats discussed above are all, in principal at least,accessible to model analysis. The primary source of uncer-tainty in quantifying the impact of ocean acidification on fu-ture ocean CO2 uptake lies in the model representation of thecalcification response to ocean acidification. Estimates canbe made of likely parameter values, as we have demonstratedin this paper in the context of the powerη (Table 1, Fig. 1)but the form of the most appropriate parameterization to de-scribe the calcification response is not known a priori. Herewe have assumed that calcification ceases at�=1.0 (Eq. 2),analogous to the abiotic precipitation response (Eq. 1). Forcorals, the general trend across a range studies appears con-sistent with our assumption (Langdon and Atkinson, 2005).However, organisms exerting a much stronger degree of con-trol over the calcification process, particularly foraminifera,need not be so constrained.
It is outside the scope of this paper to address formallythe importance of model structural uncertainty in quanti-fying the strength of the CO2-calcification feedback. (By“model structural uncertainty”, we mean the uncertainty inthe model representation of the mechanisms involved ratherthan due to uncertainties in observational data-sets, includ-ing those used for constraining parameter values.) Instead,we have evaluated the results of different GCM-based anal-yses of the CO2-calcification feedback. For instance, Heinze(2004) parameterized a response of the CaCO3:POC rain ra-tio to changes in surface ocean carbonate chemistry in the
www.biogeosciences.net/4/481/2007/ Biogeosciences, 4, 481–492, 2007

490 A. Ridgwell et al.: Future CO2-calcification feedback
HAMOCC ocean carbon cycle model by modifying carbon-ate production in proportion to the deviation from modernsurface ocean conditions of CO2 partial pressure. The pa-rameter values in the relationship were informed by the lab-oratory experiments onEmiliania huxleyi(Zondervan et al.,2001). We find a very comparable response when we takeour value ofη from the same calcification manipulation ex-periments (η=0.2 for Emiliania huxleyi in vitro – see Ta-ble 1) and set climate invariant. Our predicted year 2100(with 774 ppm CO2 in the atmosphere) enhancement of ma-rine CO2 sequestration due to CO2-calcification feedback is6.5 PgC (Fig. 4), almost identical to the 3.5 ppm (∼7 PgC)calculated by Heinze (2004) at year 2100 (∼800 ppm CO2 inthe atmosphere).
In a more recent model analysis, Gehlen et al. (2007)predicted a 29% smaller calcification response at 4× CO2(1112 ppm) as compared to Heinze (2004) under a similaratmospheric CO2 forcing. Gehlen et al. (2007) assumed arather different, Michaelis-Menten type formulation, but likeHeinze (2004) calibrated their calcification parameterizationmainly against the in vitro experimental response ofEmil-iania huxleyi(Zondervan et al., 2002), although mesocosmdata (Delille et al., 2003) was also included. Their curvefit can be approximated (over a range in� of 2–6) by avalue ofη of around 0.2–0.25 using our Eq. (2), from whichwe predict the additional CO2 sequestration due to CO2-calcification feedback of 6.5–7.7 PgC (Fig. 4) at∼3×CO2,compared to 5.9 PgC in Gehlen et al. (2007) at 4×CO2.
Although other model differences such as saturation-dependent water column dissolution of carbonates (Gehlenet al., 2007) prevent straight-forward inter-comparison, thespread across the 3 different models and associated parame-terizations is no more than a factor of 2 in estimating the po-tential enhancement of CO2 uptake. The greater uncertaintyin predicting future rates of fossil fuel CO2 uptake by theocean is thus the species calcification response in conjunc-tion with which species dominate pelagic carbonate produc-tion. Indeed, recent research reveals some species of coccol-ithophorid exhibit rather unexpected responses to simulatedchanges in ocean acidification in vitro, withCalcidiscus lep-toporusactually increasing CaCO3 production per cell at el-evated CO2 partial pressures (Langer et al., 2006).
6 Conclusions
Our analysis highlights the importance of the prevailing un-certainties regarding the controls on marine carbonate pro-duction and calcifier response to anthropogenic ocean acid-ification. We conclude from the experimental data cur-rently available that the response of carbonate production toa change in environmental chemistry as measured in vitrois not a good indication of the ecosystem (or global) levelresponse. We also find that the behavior of the coccol-ithophorid Emiliania huxleyi to increasing CO2 is rather
small compared to coccolithophores species such asGephy-rocapsa oceanica, foraminifera, and corals. Ecosystem mod-els that adopt this species as their “functional type” forcarbonate production may underestimate the importance ofCO2-calcification feedback on future climate change. Theimportance of the differences in species response is under-lined by our model inter-comparison, which suggests thatuncertainty in the model predictions is dominated by as-sumptions regarding the representative carbonate-producingspecies rather than the form of the relationship linking calci-fication to ocean acidification per se. Further mesocosm ex-periments and higher level manipulations of more completeecosystems, together with a better quantification of whichcalcifying species control CaCO3 production globally andthe spatial distribution and (environmental and ecological)controls on this production, will be critical in making morereliable assessments of the future impact of ocean acidifica-tion and feedback with atmospheric CO2.
Acknowledgements.AR acknowledges support from CanadaResearch Chairs, the Canadian Foundation for Climate and Atmo-spheric Sciences, and the Trusthouse Charitable Foundation. IZ’scontribution was supported by Netherlands-Bremen Cooperationin Oceanography (NEBROC II). TML’s contribution is part ofthe NERC e-Science GENIEfy project (NE/C515904). Computerfacilities for the EnKF calculations were provided by JAMSTEC.
Edited by: C. Heinze
References
Annan, J. D., Hargreaves, J. C., Edwards, N. R., and Marsh, R.:Parameter estimation in an intermediate complexity earth systemmodel using an ensemble Kalman filter, Ocean Model., 8, 135–154, 2005.
Archer, D.: An atlas of the distribution of calcium carbonate in sed-iments of the deep sea, Global Biogeochem. Cy., 10, 159–174,1996.
Armstrong, R. A., Lee, C., Hedges, J. I., Honjo, S., and Wakeham,S. G.: A new, mechanistic model for organic carbon fluxes in theocean: based on the quantitative association of POC with ballastminerals, Deep-Sea Res. II, 49, 219–236, 2002.
Aumont, O., Maier-Reimer, E., Blain, S., and Monfray, P.:An ecosystem model of the global ocean including Fe,Si, P colimitations, Global Biogeochem. Cy., 17, 1060,doi:10.1029/2001GB001745, 2003.
Barker, S., Higgins, J. A., and Elderfield, H.: The future of thecarbon cycle: review, calcification response, ballast and feedbackon atmospheric CO2, Philos. T. Roy. Soc. A, 361, 1977–1999,2003.
Bijma, J., Spero, H. J., and Lea, D.W.: Reassessing foraminiferalstable isotope geochemistry: Impact of the oceanic carbonatesystem (Experimental Results), in: Use of proxies in paleo-ceanography: Examples from the South Atlantic, edited by: Fis-cher, G. and Wefer, G., Springer-Verlag Berlin Heidelberg, 489–512, 1999.
Bopp, L., Kohfeld, K. E., Le Quere, C., and Aumont, O.: Dustimpact on marine biota and atmospheric CO2 during glacial pe-
Biogeosciences, 4, 481–492, 2007 www.biogeosciences.net/4/481/2007/

A. Ridgwell et al.: Future CO2-calcification feedback 491
riods, Paleoceanography, 18, 1046, doi:10.1029/2002PA000810,2003.
Broerse, A. T. C., Ziveri, P., Hinte, J. E. v., and Honjo, S.: Coccol-ithophore export production, seasonal species composition andcoccolith CaCO3 fluxes in the NE Atlantic (34◦ N, 21◦ W and48◦ N, 21◦ W), Deep-Sea Res. II, 47, 1877–1905 2000.
Caldeira, K. and Wickett, M. E.: Anthropogenic carbon and oceanpH, Nature, 425, p. 365, 2003.
Conkright, M. E., Antonov, J. I., Baranov, O. K., et al.: WorldOcean Database 2001, Volume 1, Introduction, edited by: Lev-itus, S., NOAA Atlas, NESDIS 42, U.S. Government PrintingOffice, Washington, D.C., 167 pp., 2002.
Delille, B., Harlay, J., Zondervan, I., et al.: Response of primaryproduction and calcification to changes ofpCO2 during experi-mental blooms of the coccolithophoridEmiliania huxleyi, GlobalBiogeochem. Cy., 19, GB2023, doi:10.1029/2004GB002318,2005.
Dickson, A. G. and Millero, F. J.: A comparison of the equilibriumconstants for the dissociation of carbonic acid in seawater media,Deep-Sea Res., 34, 1733–1743, 1987.
Edwards, N. R. and Marsh, R.: Uncertainties due to transport-parameter sensitivity in an efficient 3-D ocean-climate model,Clim. Dynam., 2, 415–433, 2005.
Feely, R. A., Sabine, C. L., Lee, K., et al.: Impact of anthropogenicCO2 on the CaCO3 system in the oceans, Science, 305, 362–366,2004.
Francois, R., Honjo, S., Krishfield, R., and Manganini, S.:Factors controlling the flux of organic carbon to the bathy-pelagic zone of the ocean, Global Biogeochem. Cy., 16, 1087,doi:10.1029/2001GB001722, 2002.
Gehlen, M., Gangstø, R., Schneider, B., Bopp, L., Aumont, O.,and Ethe, C.: The fate of pelagic CaCO3 production in a highCO2 ocean: A model study, Biogeosciences Discuss., 4, 533–560, 2007,http://www.biogeosciences-discuss.net/4/533/2007/.
Hargreaves, J. C., Annan, J. D., Edwards, N. R., and Marsh, R.:Climate forecasting using an intermediate complexity Earth Sys-tem Model and theEnsemble Kalman Filter, Clim. Dynam., 23,745–760, 2004.
Heinze, C., Maier-Reimer, E., Winguth, A. M. E., and Archer, D.:A global oceanic sediment model for long-term climate studies,Global Biogeochem. Cy., 13, 221–250, 1999.
Heinze, C.: Simulating oceanic CaCO3 export productionin the greenhouse, Geophys. Res. Lett., 13, L16308,doi:10.1029/2004GL020613, 2004.
Jin, X., Gruber, N., Dunne, J., Sarmiento, J. L., and Armstrong,R. A.: Diagnosing the contribution of phytoplankton functionalgroups to the production and export of POC, CaCO3 and opalfrom global nutrient and alkalinity distributions, Global Bio-geochem. Cy., 20, GB2015, doi:10.1029/2005GB002532, 2006.
Key, R. M., Kozyr, A., Sabine, C. L., et al.: A globalocean carbon climatology: Results from Global Data Analy-sis Project (GLODAP), Global Biogeochem. Cy., GB4031, 18,doi:10.1029/2004GB002247, 2004.
Kleypas, J. A., Buddemeier, R. W., Archer, D., et al.: Geochemicalconsequences of increased atmospheric carbon dioxide on coralreefs, Science, 284, p. 118, 1999.
Langdon, C. and Atkinson, M. J.: Effect of elevatedpCO2 on pho-tosynthesis and calcification of corals and interactions with sea-
sonal change in temperature/irradiance and nutrient enrichment,J. Geophys. Res., 110, C09S07, doi:10.1029/2004JC002576,2005.
Langer G., Geisen, M., Baumann, K.-H., Klas, J., Riebesell, U.,Thoms, S., and Young, J. R.: Species-specific responses of calci-fying algae to changing seawater carbonate chemistry, Geochem.Geophys. Geosyst., 7, Q09006, doi:10.1029/2005GC001227,2006.
Lenton, T. M., Williamson, M. S., Edwards, N. R., Marsh, R. J.,Price, A. R., Ridgwell, A. J., Shepherd, J. G., Cox, S. J., andthe GENIE team: Millennial timescale carbon cycle and climatechange in an efficient Earth system model, Clim. Dynam., 26,687–711, doi:10.1007/s00382-006-0109-9, 2006.
Le Quere, C., Harrison, S. P., Prentice, I. C., et al.: Ecosystem dy-namics based on plankton functional types for global ocean bio-geochemistry models, Glob. Change Biol., 11, 2016–2040, 2005.
Mehrbach, C., Culberson, C. H., Hawley, J. E., and Pytkow-icz, R. M.: Measurement of the apparent dissociation constantsof carbonic acid in seawater at atmospheric pressure, Limnol.Oceanogr., 18, 897–907, 1973.
Moore, J. K., Doney, S. C., Kleypas, J. A., et al.: An intermedi-ate complexity marine ecosystem model for the global domain,Deep-Sea Res. II, 49, 403–462, 2002.
Orr, J. C., Fabry, V. J., Aumont, O., et al.: Anthropogenicoceanacidification over the twenty-first century and its impact on cal-cifying organisms, Nature, 437, 681–686, 2005.
Passow, U. and De La Rocha, C. L.: Accumulation of mineralballast on organic aggregates, Global Biogeochem. Cy., 20,GB1013, doi:10.1029/2005GB002579, 2006.
Ridgwell, A. J.: An end to the ‘rain ratio’ reign?, Geochem. Geo-phys. Geosys., 4, 1051, doi:10.1029/2003GC000512, 2003.
Ridgwell, A., Hargreaves, J., Edwards, N., Annan, J., Lenton, T.,Marsh, R., Yool, A., and Watson, A.: Marine geochemical dataassimilation in an efficient Earth System Model of global biogeo-chemical cycling, Biogeosciences, 4, 87–104, 2007,http://www.biogeosciences.net/4/87/2007/.
Ridgwell, A. and Hargreaves, J. C.: An efficient Earth SystemModel of Global biogeochemical cycling: Regulation of atmo-spheric CO2 by deep-sea sediments, Global Biogeochem. Cy.,21, GB2008, doi:10.1029/2006GB002764, 2007.
Riebesell, U., Zondervan, I., Rost, B., Tortell, P. D., Zeebe, R. E.,Morel, F. M. M.: Reduced calcification of marine plankton inresponse to increased atmospheric CO2, Nature, 407, 364–367,2000.
Sabine, C. L., Feely, R. A., Gruber, N., et al.: The Oceanic Sink forAnthropogenic CO2, Science, 305, 367–371, 2004.
Schiebel, R.: Planktic foraminiferal sedimentation and the ma-rine calcite budget, Global Biogeochem. Cy., 16, 1065,doi:10.1029/2001GB001459, 2002.
Schneider, K. and Erez, J.: The effect of carbonate chemistry oncalcification and photosynthesis in the hermatypic coral Acrop-ora eurystoma, Limnol. Oceanogr., 51, 1284–1293, 2006.
Schmittner, A., Oschlies, A., Giraud, X., Eby, M., and Simmons,H. L.: A global model of the marine ecosystem for long-termsimulations: Sensitivity to ocean mixing, buoyancy forcing, par-ticle sinking, and dissolved organic matter cycling, Global Bio-geochem. Cy., 19, GB3004, doi:10.1029/2004GB002283, 2005.
Sciandra, A., Harlay, J., Lefevre, D., Lemee, R., Rimmelin, P.,Denis, M. and Gattuso, J.-P.: Response of the coccolithophorid
www.biogeosciences.net/4/481/2007/ Biogeosciences, 4, 481–492, 2007

492 A. Ridgwell et al.: Future CO2-calcification feedback
Emiliania huxleyi to elevated partial pressure of CO2 under ni-trate limitation, Mar. Ecol.-Prog. Ser., 261, 111–122, 2003.
Yates, K. K. and Halley, R. B.: CO2−
3 concentration andpCO2thresholds for calcification and dissolution on the Molokai reefflat, Hawaii, Biogeosciences, 3, 357–369, 2006a.
Yates, K. K. and Halley, R. B.: Diurnal variation in rates of calcifi-cation and carbonate sediment dissolution in Florida Bay, Estu-aries Coasts, 29, 24–39, 2006b.
Ziveri, P. and Thunell, R. C.: Coccolithophore export production inGuaymas Basin, Gulf of California: Response to climate forcing,Deep-Sea Res. II, 47, 2073–2100, 2000.
Zhong, S. J., Mucci, A.: Calcite precipitation in seawater using aconstant addition technique – a new overall reaction kinetic ex-pression, Geochim. Cosmochim. Ac., 57, 1409–1417, 1993.
Zondervan, I., Zeebe, R. E., Rost, B., and Riebesell, U.: Decreasingmarine biogenic calcification: A negative feedback on rising at-mosphericpCO2, Global Biogeochem. Cy., 15, 507–516, 2001.
Zondervan, I., Rost, B., and Riebesell, U.: Effect of CO2 con-centration on the PIC/POC ratio in the coccolithophoreEmilia-nia huxleyigrown under light-limiting conditions and differentdaylengths, J. Exp. Mar. Biol. Ecol., 272, 55–70, 2002.
Biogeosciences, 4, 481–492, 2007 www.biogeosciences.net/4/481/2007/