Embed Size (px)
Citation preview

Assessing the Physician Workforce in the United States:
National and State Initiatives
Pre-conference Session: DataThe Tenth International Medical Workforce Collaborative
Vancouver, CanadaMarch 20-24, 2006
Jean MooreDirector
Center for Health Workforce Studieshttp://chws.albany.edu

Center for Health Workforce StudiesSchool of Public Health – University at Albany, SUNY, March 2007
Overview of Presentation
Current issues and concernsNational data: the view from 30,000 feetState data collection and analysis: a more in depth understanding of state medical workforce issuesPlanning for the future

Center for Health Workforce StudiesSchool of Public Health – University at Albany, SUNY, March 2007
The Center for Health Workforce Studies at the University at Albany
A center of the School of Public Health at New York’s State University at Albany
Conducts studies of the supply, demand, use and education of the health workforce
Committed to collecting and analyzing data to understand workforce dynamics and trends
Goal to inform public policies, the health and education sectors and the public

Center for Health Workforce StudiesSchool of Public Health – University at Albany, SUNY, March 2007
Health Workforce Problems and Solutions
Problems are defined as national in scope
But the impacts are local (e.g. limited access to care in communties and facilities)
States and institutions are left to find their own solutions
Source: Tom Ricketts, Sheps Center, UNC Chapel Hill

Center for Health Workforce StudiesSchool of Public Health – University at Albany, SUNY, March 2007
Inconvenient Truths vs. The Health Professions
Inconvenient truthsThe same work can be done by different
professionsThere are less expensive ways to educate
health professionals
The health professionsPractice actsProfessional identityCredential creep
Source: Tom Ricketts, Sheps Center, UNC Chapel Hill

Center for Health Workforce StudiesSchool of Public Health – University at Albany, SUNY, March 2007
The missing dataThe missing data
Regularly collected inventories that Regularly collected inventories that yield timely projections of supply yield timely projections of supply and needand need
Rhetoricof Shortage
Reliability of Data
Source: Tom Ricketts, Sheps Center, UNC Chapel Hill

Center for Health Workforce StudiesSchool of Public Health – University at Albany, SUNY, March 2007
The missing policyThe missing policy
Support for independent, ongoing, Support for independent, ongoing, longitudinal research capacity in longitudinal research capacity in health workforce.health workforce.
Yes, money.Yes, money.
Source: Tom Ricketts, Sheps Center, UNC Chapel Hill

Center for Health Workforce StudiesSchool of Public Health – University at Albany, SUNY, March 2007
First steps to wisdomFirst steps to wisdom
How many practitioners are there?How many practitioners are there?When to they enter and leave When to they enter and leave practice?practice?Where do they practice?Where do they practice?What do they practice?What do they practice?
Source: Tom Ricketts, Sheps Center, UNC Chapel Hill

The US Health Workforce Profile

Center for Health Workforce StudiesSchool of Public Health – University at Albany, SUNY, March 2007
US Health Workforce ProfileBackground data on population demographics and health statusHealth services infrastructure data, including employment by settingSupply, trend, educational pipeline and demographic characteristics data on more than 25 health professions

Center for Health Workforce StudiesSchool of Public Health – University at Albany, SUNY, March 2007
Percent of Population 65+, 2004
14.3 to 16.9 (6)12.5 to 14.3 (22)10.8 to 12.5 (17)9.1 to 10.8 (4)6.3 to 9.1 (2)
Source: U.S. Census Bureau.

Center for Health Workforce StudiesSchool of Public Health – University at Albany, SUNY, March 2007
Number of Cancer Deaths Per 100,000 population, 2002
212 to 231 (8)194 to 212 (20)177 to 194 (14)159 to 177 (7)144 to 159 (2)
Source: National Center for Health Statistics.

Center for Health Workforce StudiesSchool of Public Health – University at Albany, SUNY, March 2007
Percentage Distribution of Employment in Health Services, 2004
Hospitals, public and private41%
Nursing and residential care facilities
21%
Offices of physicians16%
Offices of dentists6%
Outpatient care centers3%
Offices of other health practitioners
4%
Home health care services
6%
Other ambulatory health care services
2%Medical and diagnostic
laboratories1%
Source: Bureau of Labor Statistics.
Center for Health Workforce StudiesSchool of Public Health – University at Albany, SUNY, March 2007
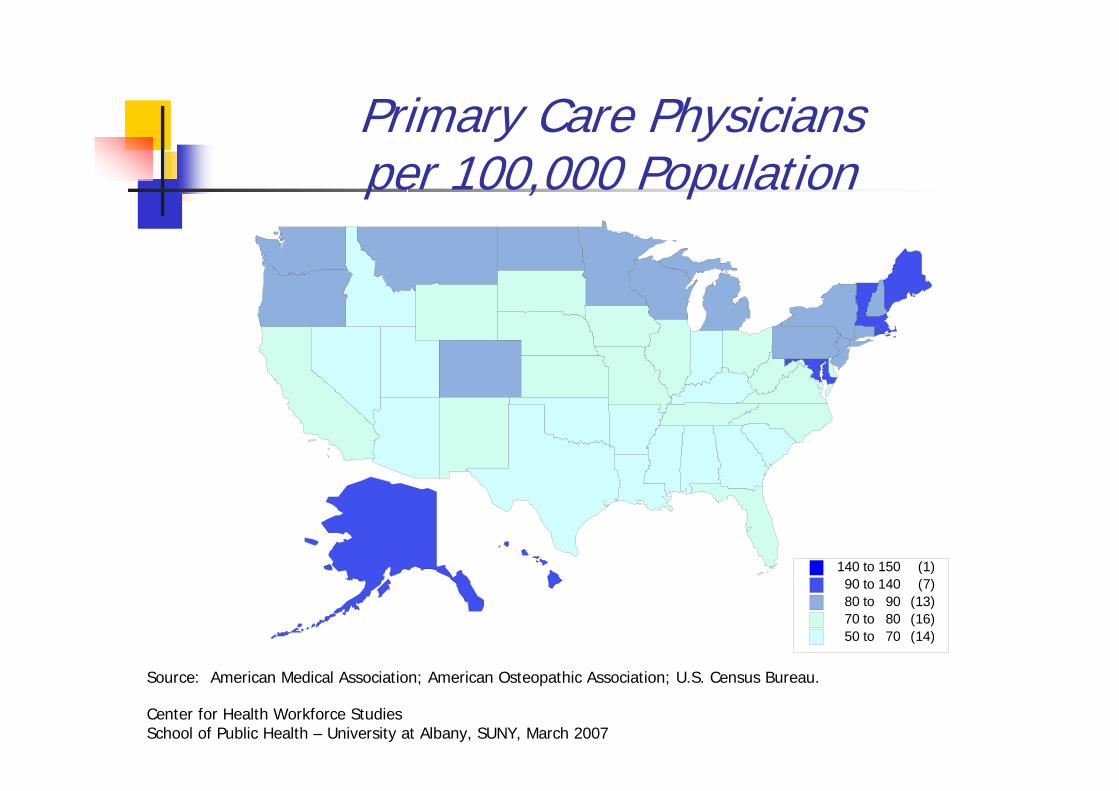
Primary Care Physicians per 100,000 Population
140 to 150 (1)90 to 140 (7)80 to 90 (13)70 to 80 (16)50 to 70 (14)
Source: American Medical Association; American Osteopathic Association; U.S. Census Bureau.

Center for Health Workforce StudiesSchool of Public Health – University at Albany, SUNY, March 2007
Location of Medical School Attended by Physicians Currently Practicing, 2004
In state29%
Other state45%
IMG26%
Source: American Medical Association; American Osteopathic Association.

Center for Health Workforce StudiesSchool of Public Health – University at Albany, SUNY, March 2007
Total Medical School Graduates per 100,000 Population, 2004
9 to 15 (9)6 to 9 (13)4 to 6 (14)2 to 4 (9)0 to 0 (5)
Source: American Medical Association; American Osteopathic Association; U.S. Census Bureau.

Center for Health Workforce StudiesSchool of Public Health – University at Albany, SUNY, March 2007
Race/Ethnicity of Medical School Degree Recipients and the Population, 2003-04
72%
11%13%
4%
68%
7% 5%
20%
0%
10%
20%
30%
40%
50%
60%
70%
80%
90%
100%
White Black/African-American
Hispanic/Latino Asian
Population
Medical school graduates
Source: National Center for Education Statistics; U.S. Census Bureau.

Center for Health Workforce StudiesSchool of Public Health – University at Albany, SUNY, March 2007
Physician Assistants per 100 Physicians, 2004
12.6 to 19.6 (6)8.7 to 12.6 (10)6 to 8.7 (16)3.8 to 6 (10)1.1 to 3.8 (9)
Source: American Academy of Physician Assistants; U.S. Census Bureau.
Center for Health Workforce StudiesSchool of Public Health – University at Albany, SUNY, March 2007
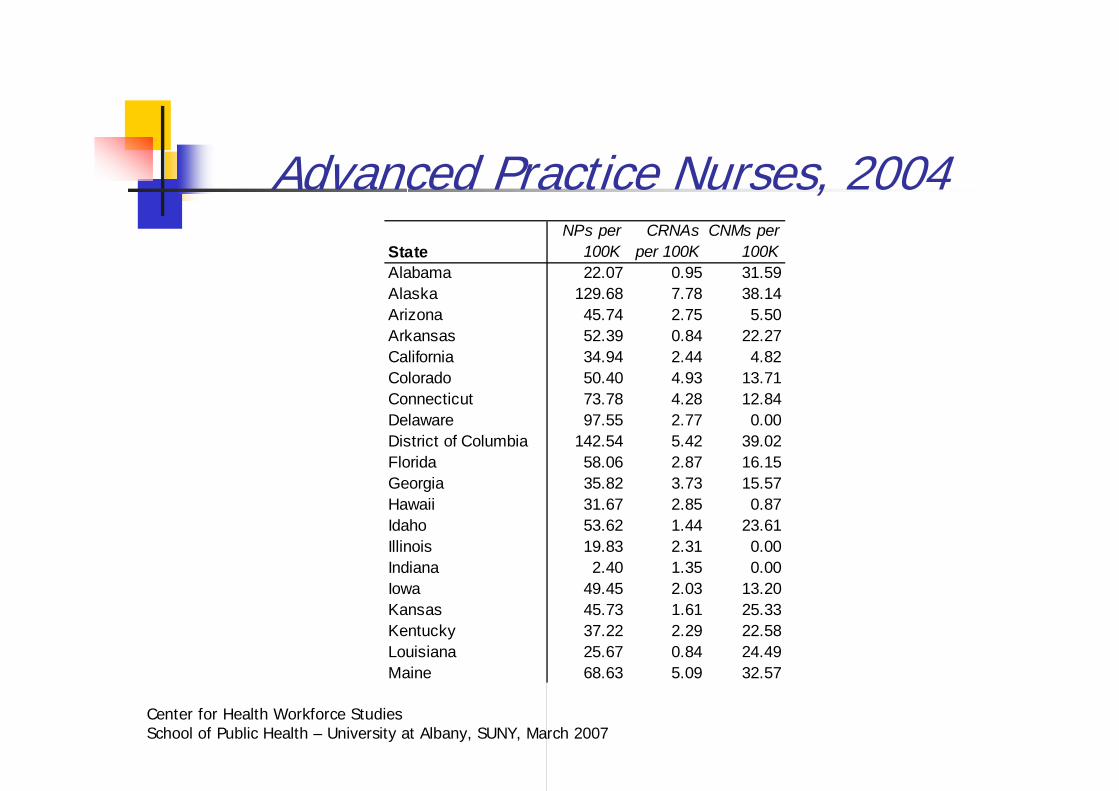
Advanced Practice Nurses, 2004State
NPs per 100K
CRNAs per 100K
CNMs per 100K
Alabama 22.07 0.95 31.59Alaska 129.68 7.78 38.14Arizona 45.74 2.75 5.50Arkansas 52.39 0.84 22.27California 34.94 2.44 4.82Colorado 50.40 4.93 13.71Connecticut 73.78 4.28 12.84Delaware 97.55 2.77 0.00District of Columbia 142.54 5.42 39.02Florida 58.06 2.87 16.15Georgia 35.82 3.73 15.57Hawaii 31.67 2.85 0.87Idaho 53.62 1.44 23.61Illinois 19.83 2.31 0.00Indiana 2.40 1.35 0.00Iowa 49.45 2.03 13.20Kansas 45.73 1.61 25.33Kentucky 37.22 2.29 22.58Louisiana 25.67 0.84 24.49Maine 68.63 5.09 32.57

The North Carolina Health Professions Data System

Components of Change, Physicians, Components of Change, Physicians, 20012001--20052005
New to file1,681
(status change 480newly licensed 1,201)
2001 16,392
Left File1,304
2002 total16,769
Net gain 377
New to file1,563
(status change 508newly licensed 1,055)
2002 16,769
Left File1,242
2003 total17,090
Net gain 384
Source: NC Health Professions Data System, with data provided by the North Carolina Medical Board.Note: Newly licensed physicians are those who are new to file with a license date in the current or previous year. Status change physicians are those who were licensed in NC in an earlier year but were either inactive or active out of state in the previous year.
New to file1,413
(status change 480newly licensed 933)
2003 17,090
Left File1,154
2004 total17,349
Net gain 259
New to file1,550
(status change 667newly licensed 883)
2004 17,349
Left File1,004
2005 total17,895
Net gain 546
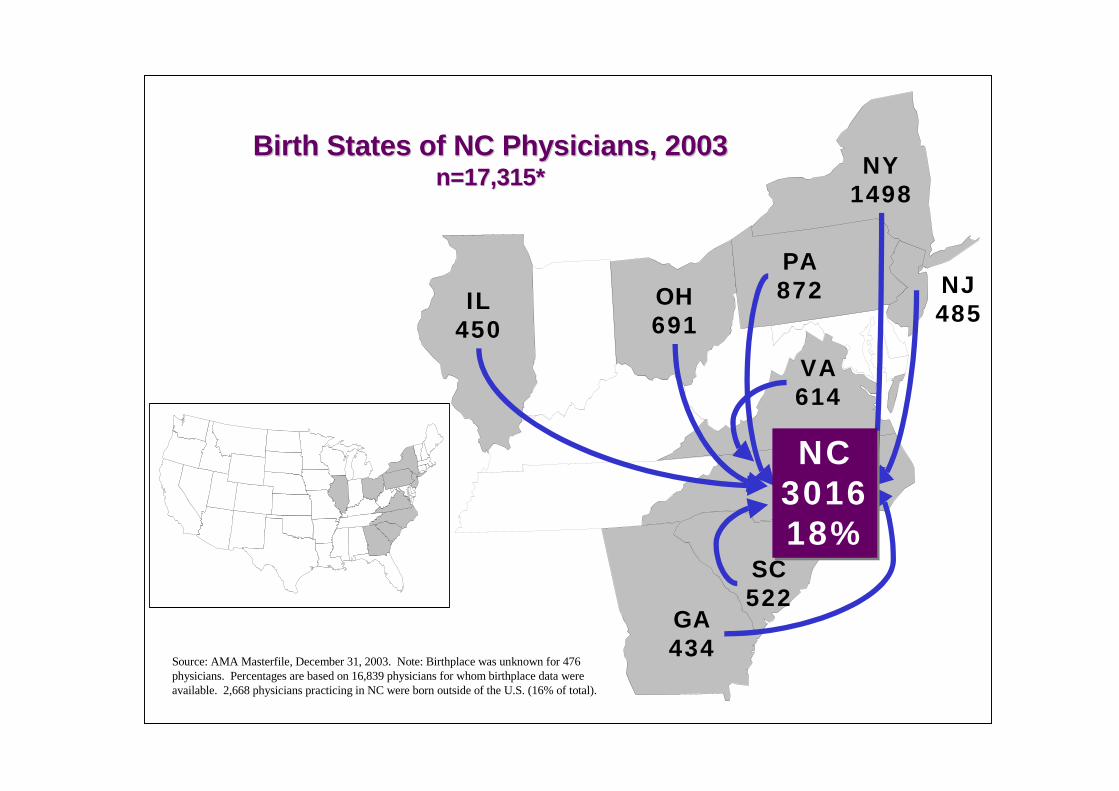
Birth States of NC Physicians, 2003Birth States of NC Physicians, 2003n=17,315*n=17,315*
SC522
GA434
OH691
IL450
VA614
NY1498
NJ485
PA872
Source: AMA Masterfile, December 31, 2003. Note: Birthplace was unknown for 476 physicians. Percentages are based on 16,839 physicians for whom birthplace data were available. 2,668 physicians practicing in NC were born outside of the U.S. (16% of total).
NC301618%
NC301618%

Where NC Physicians went to Where NC Physicians went to Medical School, Medical School, 2003 2003
n = 17,315n = 17,315
Source: AMA Masterfile, December 31, 2003. Note: 2,303 physicians practicing in NC went to medical schools outside the U.S. (13% of total).
SC524
GA520
OH652
IL430
VA807
NY900
PA817
TX435
NC477128%
NC477128%
TN463

Where NC Physicians Received Residency Where NC Physicians Received Residency Training, 2003Training, 2003
n=n=17,315* Licensed North Carolina physicians17,315* Licensed North Carolina physicians
NC584635%
NC584635%
SC598GA
462
OH631
VA828
NY1082
PA859
FL508
TX563
CA489
Source: AMA Masterfile, December 31, 2003. Note: Residency information was missing for 606 physicians. Percentages are based on 16,709 physicians for whom data were available.

10
12
14
16
18
20
22
Year
2005
2007
2009
2011
2013
2015
2017
2019
2021
2023
2025
2027
2029
Year
Baseline, not age-adjBaselineMedical Grads + 30%Recruitment + 15%
Projections: PhysiciansProjections: Physicians
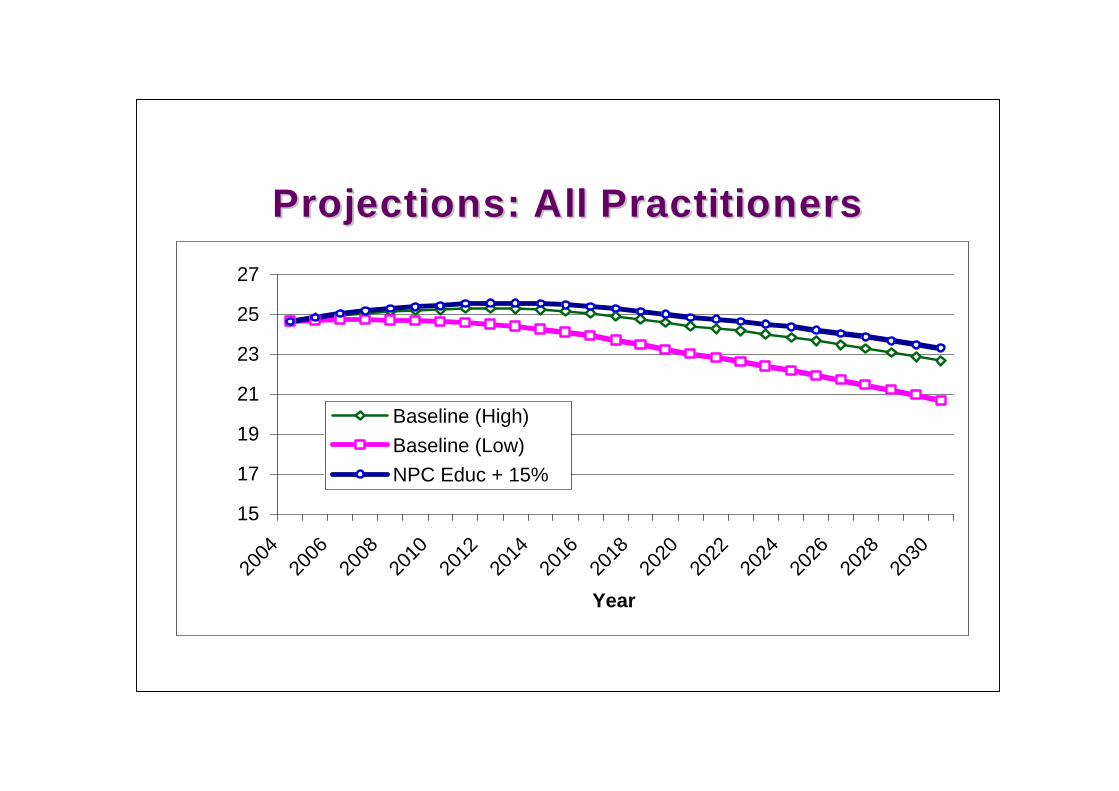
15
17
19
21
23
25
27
2004
2006
2008
2010
2012
2014
2016
2018
2020
2022
2024
2026
2028
2030
Year
Baseline (High)Baseline (Low)NPC Educ + 15%
Projections: All PractitionersProjections: All Practitioners

2006 Profile of New York State Physicians

Center for Health Workforce StudiesSchool of Public Health – University at Albany, SUNY, March 2007
The Supply and Distribution of Physicians in NY, 2005
Data drawn from the 2004-06 Physician Re-registration Survey
84% survey response rate
Based on survey responses, it is estimated that there were:
77,471 licensed physicians
61,931 active physicians

Center for Health Workforce StudiesSchool of Public Health – University at Albany, SUNY, March 2007
Overall Growth in NY Physician Supply
Between 2001 and 2005, FTE active patient care physicians per capita grew by 5%
Not all specialties experienced growth over that time period
General surgeons declined by 14%
Ob/Gyns and psychiatrists declined slightly by 1%

Center for Health Workforce StudiesSchool of Public Health – University at Albany, SUNY, March 2007
There Was Wide Regional Variation in Physician Distribution
Ratio of FTE physicians per capita highest in Long Island (323) and lowest in the Mohawk Valley (150)Some regions saw declines in physicians per capita between 2001 and 2005
Overall decline – Western NY & Finger LakesDecline in primary care physicians – North CountryDecline in non-primary care physicians – Mohawk Valley

Center for Health Workforce StudiesSchool of Public Health – University at Albany, SUNY, March 2007
Per Capita FTE Physician Supply and Change 2001 – 2005
ChangeSupplyRegion
-11%204Western NY
1%245Southern Tier
3%173North Country
2%311NYC
0%150Mohawk Valley
19%323Long Island
9%291Hudson Valley
-8%227Finger Lakes
5%230Central NY
15%248Capital District

Center for Health Workforce StudiesSchool of Public Health – University at Albany, SUNY, March 2007
Characteristics of Active Physicians in New York
Average age 51Nearly 30% women35% International Medical GraduatesNearly 30% reported primary care specialtiesMore than a third worked in a group practicePlans to reduce hours or retire varied by specialty
General surgeons, ob-gyns and neurologists were most likely to report plans to reduce hours and retire

Center for Health Workforce StudiesSchool of Public Health – University at Albany, SUNY, March 2007
New York’s Physicians are not Representative of Its Population
7% 8% 9%
28% 33% 34%
0%10%20%30%40%50%60%70%80%90%
100%
1995 2000 2004
NY URM Physicians NY URM Population
Percent URM of Active Patient Care Physicians in New York by Year

Center for Health Workforce StudiesSchool of Public Health – University at Albany, SUNY, March 2007
Characteristics of URM Physicians in New York
Half were younger than 45 years of age compared to 38% of non-URM physicians44% were women compared to 27% of non-URM physiciansMore likely to report a primary care specialtyMore likely to practice in hospitals and clinicsMore likely to serve Medicaid patientsFor those in NYC, more likely to practice in primary care shortage areas

Center for Health Workforce StudiesSchool of Public Health – University at Albany, SUNY, March 2007
Looking Ahead…..There is fragmented and limited national focus on health workforce policy
An increasing number of states want better data and information to inform policy decisions, but resources are limited
But do they ask the right questions?
Workforce researchers may need to focus on new important questions:
Given the needs of the population, what is the right mix of skills and services?
How can we support the development and effective use of interdisciplinary teams?