Embed Size (px)
Citation preview

Canada’s Specialty Food Industry – Phase 3 draft report
0
Assessing the Opportunities and Challenges
Facing Canada’s Specialty Food Industry
Prepared for: Doree Kovalio Senior Market Development Officer Ethnic and Specialty Food Division Agriculture and Agri-Food Canada
Prepared by: Martin Gooch, Claudia Schmidt,
Gary Fread and Abdel Felfel Value Chain Management Centre George Morris Centre 225-150 Research Lane
Guelph, Ontario N1G 4T2 Contact: Martin Gooch Telephone: 519-822-3929 ext. 216 Fax: 519-837-8721 Contact email: [email protected]
Date: June, 2011

Canada’s Specialty Food Industry
1
Disclaimer: The Report on Assessing the Opportunities and Challenges Facing Canada’s Specialty Food Industry, produced by the George Morris Centre, was commissioned by the Markets and Industry Services Branch of Agriculture and Agri-Food Canada, for analysis and discussion purposes. The contents and conclusions of the report do not necessarily reflect the opinions or interests of Agriculture and Agri-Food Canada, nor are the conclusions binding to any level or member of government or industry.

Canada’s Specialty Food Industry
2
Executive Summary The purpose of this report is to provide a platform for establishing a more informed debate on the nature and size of Canada’s Specialty Food sector, and how industry and government can work together to increase the sector’s long-term competitiveness. It achieves this through defining (at a high level) the size and nature of the Canadian Specialty Food sector and examples of the market opportunities that lie before it. The report also identifies challenges that, left unaddressed, could prevent the sector from taking full advantage of opportunities identified through the research. The research methods employed for this project took two forms. The first research method took the form of a comprehensive literature review to enable a picture to be developed of the Canadian Specialty Food sector. To provide insights into factors characterizing the current sector and drivers of future opportunities, the literature review was segmented into two phases: a) understanding the market; and b) understanding the consumer. The review illustrates the often incongruous definitions that have been used to define specialty food, and the reasons why such little is currently known about the size and nature of Canada’s Specialty Food sector. It also describes, at a high level, developments that have occurred in the Canadian Specialty Food sector versus those that have occurred elsewhere, particularly in the US. The review also emphasizes the extent to which immigration and more discerning consumers in general will reshape the food industry of the future. The second research method took the form of a series of in-depth interviews conducted with industry representatives and managers from businesses situated along selected value chains. The primary purpose of this research was to identify commercial industry’s perspectives of: a) important market opportunities; b) industry’s readiness to exploit identified opportunities; and c) issues and challenges that impact industry’s ability to fully exploit market opportunities. To maximize the project’s value to industry, it was decided that the researchers should focus on three distinctly different sectors. Identified through discussions with the project Steering Committee, the chosen sectors were: red meat, produced and marketed according to religious law (halal lamb and goat); grains produced, processed and marketed as gluten-free products (buckwheat and pulses); and seafood from the east and west coasts of Canada (primarily shellfish and Kazunoko). The research results illustrate that the commercial agri-food industry largely defines whether a food is a ”specialty” by the consumers who purchase a particular product, and that most specialty foods are often considered to be leading-edge innovations within already established categories. The results also show that not being mainstream means that policies, regulations and legislation, along with the manner in which they are implemented and enforced Federally and Provincially, can have an unduly negative impact on the development, production, marketing of specialty foods compared to the wider (more established) agri-food industry. Using information gathered throughout the research process, the researchers conducted a SWOT (Strengths, Weakness, Opportunities and Threats) analysis to identify opportunities facing the Canadian specialty food industry and the relative impact of factors that could prevent these opportunities from being realized. The results led to the researchers developing a series of recommendations for how industry and government can support an emerging Specialty Food sector that has tremendous potential. The recommendations are not ranked by importance or listed in any particular order.

Canada’s Specialty Food Industry
3
Regulatory overhaul1 - The current regulatory system should be reviewed in view of how the unintended
consequences of the current regulatory system negatively affect small scale operations and emerging industries. The ability to produce and market products, without the unnecessary regulatory burden that flows from the current system, would increase the ability for innovative producers and processors to exploit emerging opportunities.
- As part of the regulatory overhaul, ways should be explored to redefine the Canadian Food Inspection Agency’s (CFIA) culture and the way it interacts with individual businesses, as well as sectors, through changing how CFIA’s performance is measured. At present the majority of respondents from commercial industry consider CFIA’s ‘modus operandi’ to be more of an obstacle than a valued service provider who enables smaller innovative companies to exploit market opportunities and behaves in a manner which reflects the realities of operating in a commercial business environment.
Food safety
- Work should be undertaken to determine how Canada’s FSEP (Food Safety Enhancement Program) can be recognized as an equivalent to the Global Food Safety Initiative (GFSI) standard. That would help eliminate excessive costs and unnecessary barriers to potential export markets.
- Management support should be provided to help implement internationally recognised food safety systems (such as GFSI) for smaller plants.
Need for more market intelligence
- Some market intelligence is available on the specialty foods markets in the form of market reports. However, these market reports are typically very pricey and cannot be afforded by smaller companies. Their present form also limits their value to industry. Nevertheless, some of this information would be vital in order to exploit new market opportunities. Therefore, a platform or portal could be implemented to make this kind of information accessible at reasonable costs (for example through cost sharing) to small and medium sized producers and processors. The same information portal could be used as a forum to exchange information and address common problems that could be solved through collaboration.
- The gathering of market intelligence would be greatly assisted through establishing a process for strategically gathering market information. Currently there is no active and strategic data collection on Canada’s specialty food industry. Neither Statistics Canada nor major private consumer research companies, such as AC Nielson, collect data on
1 Throughout the report, a number of limitations due to CFIA’s regulations and enforcement activities are
identified based on statements from industry. However, the Government of Canada announced the creation of the Red Tape Reduction Commission as part of Budget 2010. It has the mandate to:
• Identify irritants to business that stem from federal regulatory requirements and review how those requirements are administered in order to reduce the compliance burden on businesses, especially small businesses. The focus is on irritants that have a clear detrimental effect on growth, competitiveness and innovation; and
• Recommend options that address the irritants and that will control and reduce the compliance burden on a long-term basis while ensuring that the environment and the health and safety of Canadians are not compromised in the process.
To hear directly from those most affected by red tape, particularly small business owners, the Commission held consultations across Canada from December 2010 to March 2011, along with an online consultation that allowed a wide range of Canadians in the business community to provide their input. As one would expect, the CFIA is heavily involved in this process. Additional details are available at: www.reduceredtape.gc.ca.

Canada’s Specialty Food Industry
4
the Canadian industry. This situation contrasts markedly with initiatives occurring in the US and other jurisdictions.
Management capability - Because of the small size of their firms, producers and processors have limited influence
on retailers. Hence, education on best management practices is needed to facilitate market/retailer access for small specialty food businesses.
- The research also identified that many respondents believe that concerted efforts need to be implemented to provide management training for producers, leading to a greater number of them possessing a business mindset. The need for a shift in producers’ ‘mentality’ was said to be particularly acute in the lamb and goat sectors.
National sector association
- A national sector association should be implemented that will focus on enabling businesses to take advantage of market opportunities through creating a platform of networking and capacity building initiatives. Furthermore, an information portal could be created that would make information more accessible for consumers on the different types of specialty food and where they could be bought.
- Such an association could provide an effective medium for enabling industry to communicate more objectively to governments on the negative impact of current regulations and policy, and its implementation; and together develop a business environment more suited to enabling market-focused innovation. This latter element would see it connected into the AAFC Value Chain Roundtables (industry-led sector working groups), along with appropriate provincial initiatives.

Canada’s Specialty Food Industry
5
Table of Contents 1 Introduction ......................................................................................................................... 8
2 Research Methods.............................................................................................................. 8
3 Introduction to Specialty Food............................................................................................. 9
3.1 Definition of Specialty Food ......................................................................................... 9
3.2 Retail and Foodservice ...............................................................................................10
3.2.1 Retail ...................................................................................................................10
3.2.2 Foodservice .........................................................................................................12
4 The US Specialty Food Sector ...........................................................................................14
4.1 Introduction.................................................................................................................14
4.2 The Focus of Food and Specialty Food Associations in the US ..................................14
4.3 Specialty Food Trends in the US.................................................................................16
5 The Canadian Environment ...............................................................................................17
5.1 Consumer trends ........................................................................................................17
5.2 Population Trends.......................................................................................................17
5.2.1 Ethnicity ...............................................................................................................17
5.2.2 Economics ...........................................................................................................18
5.3 Shopping habits of Specialty Food Consumers...........................................................19
5.4 Trends Relating to Ethnicity ........................................................................................19
5.4.1 Influences of Ethnicity on Choice .........................................................................19
5.4.2 Trends Influenced by Religious Law ....................................................................20
5.5 Trends Related to Socio-Demographics......................................................................21
5.5.1 Organics ..............................................................................................................21
5.5.2 Vegetarianism......................................................................................................22
5.5.3 Soy products........................................................................................................22
5.5.4 Food Intolerance..................................................................................................23
5.6 Industry Sub-Sectors ..................................................................................................24
5.6.1 Foods produced in compliance with religious dietary laws ...................................24
5.6.2 Ethnic food...........................................................................................................29
5.6.3 Italian Foods ........................................................................................................30
5.6.4 Mexican Foods ....................................................................................................30
5.6.5 Chinese Foods.....................................................................................................30
5.7 South Asian Foods......................................................................................................31
5.7.1 Caribbean Foods .................................................................................................31
5.8 Specialty diets.............................................................................................................31
5.8.1 “Free from” foods .................................................................................................32
5.8.2 Gourmet and Artisan............................................................................................33

Canada’s Specialty Food Industry
6
6 Value Chain Analysis .........................................................................................................34
6.1 Objective.....................................................................................................................34
6.2 Research Methods......................................................................................................34
6.3 Respondents...............................................................................................................35
6.4 Nature and Size of Businesses Consulted ..................................................................37
6.5 Analysis of the Specialty Food Value Chain................................................................37
6.5.1 Definition of “specialty foods” ...............................................................................38
6.5.2 Identification as a specialty foods producer..........................................................39
6.5.3 Certifications used ...............................................................................................40
6.5.4 Production Trends ...............................................................................................41
6.5.5 Market Opportunities............................................................................................43
6.5.6 Sources of Information.........................................................................................44
6.6 Sub-sector analysis.....................................................................................................44
6.6.1 Summary of Challenges.......................................................................................45
6.6.1a Barriers to taking advantage of market opportunities........................................45
6.6.1b Risks That Have Greatest Impact on Business Decisions ................................46
6.6.2 Summarizing the Nature of Each Sub-sector .......................................................47
6.7 Summary of findings ...................................................................................................56
6.7.1 Agriculture vs. Seafood........................................................................................56
6.7.2 Findings related to specific factors .......................................................................56
6.7.3 Potential role of Governments..............................................................................58
7 SWOT Analysis..................................................................................................................59
7.1 SWOT: Objective ........................................................................................................59
7.2 Sub-sector SWOTs.....................................................................................................60
7.2.1 Lamb ...................................................................................................................60
7.2.2 Goats (meat)........................................................................................................64
7.2.3 Buckwheat ...........................................................................................................65
7.2.4 Pulses..................................................................................................................67
7.2.5 Seafood ...............................................................................................................68
7.3 Combined (Generalized) SWOT .................................................................................70
8 Conclusion .........................................................................................................................73
8.1 Research Objective.....................................................................................................73
8.2 Recommendations......................................................................................................73
9 References ........................................................................................................................76
10 Appendixes ....................................................................................................................78
10.1 Survey Questionnaire .................................................................................................78

Canada’s Specialty Food Industry
7
10.2 Detailed Comparative Findings ...................................................................................83
List of Tables
Table 1: Retail Sales: Overall and Specialty Stores ..................................................................11
Table 2: Sales of Food at Home by Type of Outlet....................................................................15
Table 3: Visible minority population across major cities (%) ......................................................18
Table 4: Halal Outlets................................................................................................................25
Table 5: Major Halal brands in Canada .....................................................................................26
Table 6: Demand of Ethnic food................................................................................................29
Table 7: Population by selected ethnic origins, by province and territory...................................29
Table 8: Summary of survey respondents for each of the six sub-sectors .................................36
Table 9: Self-identification of specialty food producers..............................................................40
Table 10: Certifications used to identify foods as “special” ........................................................41
Table 11: Range of specialty food products for each sub-sector ..............................................42
Table 12: Production levels for each sub-sector from 2000 to 2010 .........................................42
Table 13: Market opportunities for each sub-sector..................................................................43
Table 14: Market Information Sources .....................................................................................44
Table 15: Consumption of sheep meat - top ten consuming countries and Canada (2006) ......60
List of Figures
Figure 1: Annual Growth of Overall and ‘Specialty’ Food and Beverages..................................11
Figure 2: Percent of Food Expenditures on total Personal Expenditure on Goods & Services...18
Figure 3: Domestic vs. Imported Lamb Consumed in Canada (KG, consumption) ……………. 25
Figure 4: Challenges Preventing Businesses from Fully Exploiting Market Opportunities…… 44
Figure 5: Risks That Have Greatest Influence on Business Decisions In Each Sub-Sector.......26
Figure 6: Value Chain Map - Lamb............................................................................................49
Figure 7: Value Chain Map – Goat............................................................................................50
Figure 8: Value Chain Map - Pulses.........................................................................................52
Figure 9: Value Chain Map – Buckwheat ..................................................................................53
Figure 10: Value Chain Map – Seafood ....................................................................................55
Figure 11: Ethnicity in Canada from Top Lamb Consuming Countries ......................................61

Canada’s Specialty Food Industry
8
1 Introduction Canada’s Specialty Food sector has what may amount to unique opportunities. However, very little information is available. This report constitutes a first assessment of Canada’s specialty food industry. The purpose of this project was to define the size and nature of the Specialty Food sector in Canada, and seek insights into the opportunities that lie before it. It also sought to identify the challenges that may prevent the sector from taking full advantage of identified opportunities. The objective of the research was to provide a platform for establishing a more informed debate on the nature and size of Canada’s Specialty Food sector, and how industry and government can work together to increase the sector’s long-term competitiveness. The structure of this final project report is as follows. The first section will explain the methods used. This is followed by an overview of Canada’s Specialty Food sector. Since there is a significant lack of data, the US specialty food sector is introduced and some inference drawn. Section 5 of this report provides an overview of the primary drivers of specialty food consumption and relevant trends that are resulting from changes in the Canadian population. Section 6 will introduce five selected value chains for a more in-depth analysis of the sector. The 6th section of the report presents the results of a SWOT analysis of the selected sub-sectors and the specialty foods sector in general. The report is concluded with recommendations for industry and government on how to support the emerging specialty foods sector. 2 Research Methods The research methods employed for this project were two-fold. First, a comprehensive literature and data review was conducted to develop a picture of the specialty food segment in Canada. The review was segmented into two phases: a) understanding the market; and b) understanding the consumer. To enable the researchers to better analyze market opportunities and industry’s readiness for exploiting those opportunities, the second research method took the form of consultations with industry. As described in Section 6, the purpose of the consultation process was to conduct an industry level analysis of commercial value chains operating in the Specialty Food Sector. Guided by the literature review, the subsequent analysis of results sought to identify commercial industry’s perspectives towards: a) important market opportunities; b) industry’s readiness to exploit identified opportunities; and c) challenges that impact industry’s ability to fully exploit market opportunities. Details on the research methods (designed reflected a value chain perspective), along with the findings, are detailed in Section 6. Results from the literature review and the consultative process were analysed through a series of SWOTs, the findings from which formed the basis of recommendations for the ways industry and government could work together to increase the competitiveness of Canada’s Specialty Food sector.

Canada’s Specialty Food Industry
9
3 Introduction to Specialty Food The following three sections attempt to bring clarity to the evolving issue of specialty food. Insights presented throughout the next three sections were gathered through a comprehensive literature and data review, along with initial conversations with chosen industry experts. Together the three sections reflect two broad themes:
• Characterizing the market: An initial overview of the broader markets that together comprise the Specialty Food sector. Current information is used to help forecast future trends.
• Characterizing consumers: Determine how and why the demand for specialty foods may grow through interpreting the consumption and population trends. It achieves this through seeking to understand the relationship between consumption, income and demographic trends.
Section 3 sets the scene by providing an initial overview of the markets that encompass the Canadian Specialty Food sector. It also describes how previous research and industry experts define specialty food. Later sections build on the information presented below to describe, at a high level, developments that have occurred in the Canadian Specialty Food sector versus those that have occurred elsewhere. This is achieved through Section 4, which presents a brief overview of the US Specialty Food sector and initiatives designed to assist industry to adapt to a changing market. This is followed by Section 5, which presents a more detailed description of the Canadian speciality food market, including the characteristics of consumers that are attracted to specialty foods and why.
3.1 Definition of Specialty Food The review found that current definitions of ‘specialty food’ can be quite incongruous. An example is market research company, Mintel’s (2010), definition that ’specialty food’ is anything that is above average in quality or price. The term ’average’ is meaningless without specific statistics, and those statistics will differ by market, product and the final consumer. Therefore, such a definition could defuse the importance that stakeholders place on specialty foods within the overall agri-food industry. As this report identifies, not having an objective definition impacts researchers’ ability to accurately determine the size of Canada’s Specialty Food sector. It also impacts commercial industry’s willingness to invest resources to secure market opportunities. In the absence of a clearly defined classification, we separated our definition of the Specialty Food sector into four sub-categories. The hope was that taking this approach will bring greater clarity and understanding to the term ‘Specialty Food’. For reasons described throughout the report, the four categories are:
• Foods produced in compliance with religious dietary laws • Ethnic foods • Specialty diets • Gourmet and artisan
This section begins by illustrating the perspectives of those that interact with consumers on a daily basis, retailers and foodservice operators. It describes how they define specialty food and why. Subsequent sections describe the population demographics and trends that are likely to drive growth in the Canadian Specialty Food sector, the report briefly discusses the US Specialty Food sector. The report concludes by describing each of the above four categories.

Canada’s Specialty Food Industry
10
3.2 Retail and Foodservice This section details generally available sales data, along with the results of initial enquiries made with Canadian retailers and foodservice. It begins by describing, at a high level, the similarities that exist between how they define the term ’specialty food’ and the resulting impact this has on defining the size and value of the specialty food market. Descriptions and examples are then presented on other factors that each of the sectors use to define ‘Specialty Food’. There appears to be four distinct factors which managers from the retail and foodservice sectors agree determine whether or not a product is a specialty food. They are:
• Specialty food is not a category. The term ‘specialty food’ is a relatively ad hoc ‘catch-all’ for products within each established product category that sell in lower volumes than items considered mainstream. These types of products usually (though not always) attract higher prices than mainstream items.
• Specialty food tends to appeal to defined markets for specific reasons, for example: gluten-free appeals to those with celiac disease; halal appeals to Muslims due to religious reasons.
• Specialty foods are usually branded (either by an individual supplier, or on a broader scale, as in the case of a terroir associated with a particular food – such as Parma Ham).
• Specialty food is a moving target. Products introduced as a ‘specialty item’ will often eventually become mainstream; then ultimately a commodity. An example of this is the purchase of the artisan baker ‘Ace Bakery’ by George Weston in 2010. The parent company will build the bakery into a mainstream supplier of high quality products, with the majority of its products no longer being artisanal or gourmet.
3.2.1 Retail
The fact that the retail industry does not consider specialty food to be a category in itself means that accurately defining the size of the specialty food market is an almost impossible task. Moreover, the task is made more difficult by AC Nielsen only tracking sales occurring among the larger retail and foodservice outlets as many Specialty Foods are sold in smaller stores. (Marino, 2011). In addition, with specialty food not being a category, sales can only be tracked at the level of individual items, and then only if information about the attributes that make the food a ‘specialty’ item is imbedded into the UPC code (Smith, 2011). The way Statistics Canada (StatCan) tracks sales of specialty food (and beverages) does relatively little to help accurately define market share. It defines specialty food according to the type of sales outlet from which the food was purchased. The types of retailers that StatCan considers ‘specialty’ include cheese, wine, and ethnic, though they also include fruit and vegetable stores under the same definition. It therefore appears that StatCan’s definition of ‘specialty’ would be defined as ‘specialized’ to those in the industry. Shown below in Table 1 are the overall annual Canadian retail sales figures for 2004 through to 2009 and the annual sales from ‘Specialty Stores’ for the same period.

Canada’s Specialty Food Industry
11
Table 1: Retail Sales: Overall and Specialty Stores
Year
Overall Retail Food and Beverage Sales ($1,000)
Retail Sales From Specialty Stores
Specialty Stores Retail Sales as Percentage of Overall Retail Sales
2004 82,719,992.00 3,369,397.00 4.07
2005 86,116,566.00 3,555,736.00 4.13
2006 88,743,439.00 3,803,822.00 4.28
2007 92,632,967.00 4,066,572.00 4.39
2008 97,302,279.00 4,265,870.00 4.39
2009 101,011,354.00 4,534,335.00 4.49 Source: Statistics Canada, 2010 Figure 1 compares the increases in overall retail sales of food versus ‘specialty’ retail stores. It demonstrates that the overall rate of sales among ‘specialty’ food stores increased an average of 2% per annum above that experienced by the wider industry. Figure 1: Annual Growth of Overall and ‘Specialty’ Food and Beverages
Source: Statistics Canada, 2010 Previous conversations with retailers show that they commonly define ‘specialty food’ according to the likely target market as much as the product itself (Lund, 2011). At a high level, they therefore categorize them according to those consumers to whom they will most likely appeal. Two broad categories have emerged from our initial discussions with retailers: those foods which are likely to appeal to discerning consumers; and those foods which are likely to appeal to discriminating consumers. While these are not hard and fast rules, they appear to be a useful method of categorizing the main determinants of why an individual may choose to consume specialty foods.
%

Canada’s Specialty Food Industry
12
Discerning choices are usually made voluntarily. For example, personal values about protecting the environment may lead to someone voluntarily choosing to purchase organic food; or the appeal of a certain product may be due to its perceived uniqueness. For many consumers, these types of products are likely to be chosen for a specific meal occasion. Examples of specialty foods that fit into this category include:
• Organic • Fair Trade • Natural • ‘Low-in’ (or reduced in ‘x’) • Artisan • Gourmet • Ethnic
Discriminatory choices are usually made out of necessity. For example, a biological condition such as celiac disease makes it necessary for someone to purchase gluten-free foods; or the religious beliefs which shape their lives makes it necessary for a Jewish person to choose kosher. Examples of specialty foods that fit into this category include:
• ’Free from‘ • Kosher • Halal
As can be seen from the above descriptions, there are likely to be more specialty foods that appeal to discerning consumers then discriminating consumers. However, products that fit within the ‘discriminating’ category are likely to have the greatest longevity.
3.2.2 Foodservice
As with retail, the foodservice industry does not consider specialty food to be a category. Examples of how the foodservice sector determines whether a food is a specialty item are listed below (Waddington, 2011; MacNeil, 2011). Examples are provided for each of the five characteristics:
o Geographic origin: traditional foods imported from a distinct region, though not considered a staple item (or ingredient). Examples include Thai fish sauce, hot Caribbean sauce, chipotle, scrapple and pickled herring. o Product quality: superior quality or craftsmanship makes an otherwise standard ingredient a specialty food. For example, olive oil is considered a standard ingredient, although extra high quality or extra virgin olive oils manufactured in small batches are considered a specialty.
o Species and varietals: most mushrooms are common and mainstream. Chanterelle, porcini and truffles (fungus) are specialty because they are relatively rare. By the same token, standard beef is not a specialty, though Wagyu beef fits the definition. o Production methods: not mass produced, instead the product is classified as specialty because it is produced according to fair trade, artisanal, small batch or handmade processes. Coffee is an example of this. While generic coffee is pretty standard, where suppliers who work with coffee farmers to instil fair trade practices (perhaps while
Canada’s Specialty Food Industry
13
simultaneously increasing biodiversity, reducing production emissions), and then educate consumers on the social, economic and environmental impact that product represents, that particular coffee would be considered a specialty food.
The following sections (4 and 5) provide greater detail on the drivers of change that are reshaping the food industry. The two sections also highlight differences in the level of knowledge surrounding the specialty food industries and markets of the United States versus Canada, and why more accurate insights are available in relation to the US than the Canadian specialty food market. Examples of product types widely considered to be specialty are also presented.

Canada’s Specialty Food Industry
14
4 The US Specialty Food Sector 4.1 Introduction There is little indication that the United States Department of Agriculture (USDA) provides research and statistics on the Specialty Food sector other than by indirect means such as research extension for specialty crops or as a minor reference within reports such as consumer expenditures. Thus, there appears to be gaps in research about the state of specialty food in the US by the USDA. To date, there are a number of not-for-profit and private organizations actively engaged in defining, organizing and tracking the performance of the US Specialty Food sector. The National Association For the Specialty Food Trade, Inc. (NASFT) is a not-for-profit organization established in 1952 to support trade, commerce and interest in the Specialty Food sector (National Association For The Specialty Food Trade, 2011). SPINS (Information and Services to Grow the Natural Products Industry) was established as a private company in 1995 and provides quantifiable information on the natural product industry (SPINS, 2010). The following section highlights the central focus of the USDA, NASFT and SPINS with respect to the Specialty Food sector in the US. 4.2 The Focus of Food and Specialty Food Associations in the US The USDA is responsible for developing and establishing US federal government policy on farming, agriculture and food. The USDA roles and responsibility with respect to the Specialty Food sector are spread across a number of agencies but references to the specialty food industry (other than specialty food crop research) are by the Economic Research Service (ERS) and the Foreign Agriculture Service (FAS). Of the published reports searched, the ERS reported trends related or referred to the Specialty Food sector most often. The ERS published a food Consumer Price Index (CPI) and expenditures report which showed that at home food expenditures for specialty foods purchased at specialty food stores accounted for 2.8% of total expenditure by final purchasers in 2009 (USDA, 2009). In fact, according to the ERS, US consumer expenditures for specialty food purchased at specialty food stores has remained relatively stable from 1999 through 2009 (Table 2). However, the statistics provided by the ERS do not indicate what percentage of total expenditure by final purchaser was allocated to specialty or gourmet foods as specialty food products are offered within the other outlets within the report. This is one example of the gap in USDA research and statistics on specialty foods in the US. The USDA has indicated that imported gourmet food products are increasingly demanded by American consumers as a result of increasing wealth and ethnic diversity (Brooks et al., 2009). More generally, Brooks et al. (2009) indicated that US consumers have increased demand for diversity within their diet, including products which are considered to be healthy alternatives. However, the USDA does not appear to report specifically on the state of the Specialty Food sector in the US despite the findings of the Brooks et al. (2009) report2. Despite the gaps in USDA research concerning the US Specialty Food sector, other American organizations, such as NASFT and SPINS, actively undertake industry specific research and data collection.
2 The Brooks et al. (2009) report was published by the USDA.

Canada’s Specialty Food Industry
15
Table 2: Sales of Food at Home by Type of Outlet
Year Super-markets
Convenience stores
Other grocery
Specialty food stores
Warehouse clubs and supercenters
Mass merchandisers
Other Stores
Home deliveries, mail orders
Farmers, processors, wholesalers and other
1999 57.8 2.9 10.8 2.3 7.4 2.3 10.8 4.6 1.1 2000 62.4 2.9 5.3 2.3 9.3 2.3 9.8 4.6 1.1 2001 62.8 2.9 3.5 2.3 11.7 2.2 9.6 4.1 1.0 2002 61.9 2.9 2.2 2.3 14.0 2.1 9.7 4.0 1.0 2003 58.9 2.9 4.8 2.3 15.2 1.9 9.0 3.9 1.0 2004 59.4 2.9 3.7 2.5 16.4 1.9 8.3 3.9 1.0 2005 58.7 2.9 3.5 2.5 17.3 1.8 8.7 3.8 1.0 2006 57.7 2.9 2.7 2.7 17.8 1.7 9.9 3.7 1.0 2007 57.5 2.8 3.0 2.7 17.9 1.7 9.7 3.7 1.1 2008 58.2 2.9 3.6 2.8 18.2 1.7 8.0 3.6 1.1 2009 59.7 3.0 0.7 2.8 19.2 1.5 8.7 3.3 1.1
Note: Percentages may not add to100 due to rounding (Source: USDA, 2009) The National Association for the Specialty Food Trade, Inc. The NASFT is a not-for-profit international organization which links domestic and foreign manufacturers, importers, distributors, brokers, retailers, restaurateurs, caterers and others in the specialty food business (NASFT, 2011). Currently, the NASFT reports that there are more than 2700 current member companies both domestically and abroad. Members of NASFT are provided with business-building programs, services and networking opportunities. These activities and programs include:
• The Fancy Food Shows � bi-annual event held in summer (on the east coast) and winter (on the west
coast) • Specialty Food Magazine
� official publication of the Fancy Food Shows; and is distributed to over 30,000 members of the buying trade
• Specialtyfood.com � official NASFT website; provides information and links to resources and events
• Specialty Food News � daily e-newsletter
• The Foodspring Network � provides solutions for marketing activities (e.g. website creation and e-marketing)
• Foodspring.com � directed toward consumers with information about various food varieties and
tastes, recipes, chefs, events, blogs and forums • Education
� provides downloadable resources, webinars, Fancy Food Shows’ education sessions and NASFT member-only regional share groups
There are also a number of links and resources which are supplied to members by NASFT. Some of these resources include the Federal Trade Commission, the Food Institute, FAS, Islamic Food and Nutrition Council of America, the Organic Trade Association and the USDA. NASFT also produces reports specific to the specialty sector from industry data compiled by organizations such as SPINS.

Canada’s Specialty Food Industry
16
4.3 Specialty Food Trends in the US With respect to food expenditures, consumer spending fell by 1.1% in 2009 following a 5.1% increase on food expenditures in 2008. Notably, at home food expenditures increased by 0.2% between 2008 and 2009, whereas spending on food away from home fell by 2.9% in 2009 as opposed to a 1.1% increase in 2008 (Bureau of Labor and Statistics, 2010). Presumably these trends have emerged from a 1.8% increase in consumer savings from 2008 to 2009, due to ongoing recessionary conditions within the US economy (Bureau of Economic Analysis, 2010). Regardless, according to Mintel (2010), consumer propensity to eat in may be beneficial to the Specialty Food sector as enthusiasm for healthy eating and ethnic cuisines and cultures increases. Mintel (2010) reported that specialty food consumers shop roughly two times more than the typical grocery shopper. That is mainly because these types of consumers are looking for fresh and perishable items. Younger specialty food consumers under 25 spent the least and 55 to 64 year olds spent the most on specialty food. Most specialty food consumers looked at supermarkets for buying their groceries. However, natural food stores and farmers’ markets have gained in popularity. Younger people or people with a higher income over USD$75K are especially more likely to look at different outlets. Specialty food consumers are also more likely to have more active internet accounts than the average consumer, which makes them good targets for internet-related promotions and information. In response to consumer inclinations toward diverse varieties of food products, including specialty varieties, retailers are moving to meet the demand. In 2009, NAFST estimated that there were 180,000 specialty food products being offered through marketing channels ranging from boutiques and department stores, to specialty and natural food stores, and to supermarkets and drugstores. Despite increased consumer saving, NAFST reports that sales of specialty foods through retail channels grew by 9% in real terms from 2007 to 2009. Collectively, the US market for specialty foods is estimated by Mintel (2010) to be $63 billion; approximately 80% of sales are through retail stores while the remaining 20% is through foodservice outlets. Beyond immigration-driven consumption of religious foods such as halal, the greatest growth appears to be in gluten-free foods. In 2010, the US market for gluten-free foods was estimated at USD$2.6 billion, an almost three-fold increase over the 2006 figure of USD$935 million (Leung, 2011). According to Mintel (2010), the most commonly purchased international and ethnic foods in the US are Italian, Hispanic and Asian. Young consumers and more affluent consumers that earn over USD$75K annually are most likely to purchase the ethnic foods across cuisines. Most of Mintel’s specialty food consumers were most likely to buy all natural and organic products; this was closely followed by eco-friendly and locally sourced products. Despite increasing demand for specialty foods, new product launches declined by 29% from 2008-2009 in specialty food and beverage segments tracked by Mintel (2010). Reasons for the decline were attributed to the recession by Mintel (2010), as manufacturers scaled back on the expenses and inventories of new products and retailers reduced their inventory as consumer demand declined. Furthermore, US consumers are reportedly shifting their shopping habits from supermarkets to outlets such as drug stores, supercenters, department stores and warehouse clubs. This may be concerning for the Specialty Food sector because supercenters such as Walmart and Target frequently promote value products over selection.

Canada’s Specialty Food Industry
17
5 The Canadian Environment This section begins by describing the primary drivers of specialty food consumption. It then describes relevant trends that are resulting from changes in the Canadian population. 5.1 Consumer trends The purpose of this section is to determine how the demand for specialty foods may grow, by developing an understanding of the specialty food segments and connecting this to consumption and population trends. The first issues to be explored are population trends and Canada’s overall economic environment. This is followed by descriptions and examples of selected specialty food segments. The section will conclude with an exploration of the boundaries of the term ‘specialty foods’. 5.2 Population Trends
5.2.1 Ethnicity
Canada’s population was estimated to be 34,108,752 in July, 2010 (StatCan). Currently 28% of Canadians have British roots, 23% are of French origin and, 15% are of other European origin, 2% are Amerindian, 6% Arab and 26% have a mixed background. Over 40% of Canadians are Roman Catholic, 23% are Protestants and almost 2% are Muslim (World Fact Book).
According to StatCan projections (2010), the Canadian population will become more ethnically diverse. Canada is a country that attracts many immigrants; it has a net migration rate of 5.63 migrants per 1000 population (2009 estimate). Approximately 250,000 new immigrants arrive in Canada each year. Approximately 60% of the applicants are in the economic immigration class, 26% in the family immigration class and 9% are refugees. Approximately half of immigrants come from Asia and Pacific, around 20% from Africa and the Middle East and 16% from Europe and the United Kingdom (2008 estimates). This trend has remained fairly stable since the year 2000 and is probably likely to continue. StatCan projections indicate that the population of visible minority groups could reach over 11.4 million (approximately three Canadians in 10 or 30%) in 2031 from only five million (16%) in 2006. The south Asian and the Chinese population could more than double during the next two decades and will still be the largest visible minority group. The projection indicates that the growths in Asian and Chinese populations would be over 3.2 million and over 2.4 million by 2031, respectively. Canada’s Black and Filipino populations are also projected to double in the next 25 years. The Black population alone would rise to reach over 1.6 million and the Filipino population would reach between 908,000 and 1.1 million. However, the proportion of these two groups within the visible minority will likely decline from 24% in 2006 to 22% in 2031. Although the number of Arab immigrants was modest in 2006, discussed in more detail later on in relation to trends driven by religious law, StatCan (2010) estimated that this minority group is expected to more than triple (to an estimated 1.1 million) by 2031. Table 3 compares the visible minority population across Toronto, Montreal and Vancouver. One can see that Toronto and Vancouver have a dominant share of visible minority populations, whereas Montreal’s share is almost at the national average. However, this is probably about to change as now more immigrants are arriving in Montreal than in Toronto and Vancouver.

Canada’s Specialty Food Industry
18
Table 3: Visible minority population across major cities (%)
Canada Toronto Vancouver Montreal
% Visible minority 16.2 42.9 41.7 16.5
% of visible minority from immigration
66.3 69.4 69 65.5
% of immigration last five years
24.8 16.9 14.7 27.7
Source: Caicco&Petrie (2010), Statistics Canada
5.2.2 Economics
The Canadian GDP per capita was $38,025 in 2009, down from $39,079 in 2008. The IMF (2010) predicts that our GDP will increase annually to reach $45,760 in 2015. Canada, as an economy, suffered a relatively brief recession during late 2008 and into 2009. Although the unemployment rate reached 8.3% in 2009, up from 6.1% in 2008 (IMF, 2010), it was significantly lower than in the US. Figure 2 below shows the food expenditure of Canadians as part of their total expenditure on goods and services from 1981 to 2009. Expenditure on food, beverages and tobacco has decreased from almost 20% in 1982 to 11.6% in 2009. However, taking alcohol and tobacco out of the equation, expenditures on food only declined from 12% to 8.5%. Interestingly, alcohol expenditure did not change much over the years. It declined from 3.4% to 2% in 2009. The decrease in food expenditure is based on a number of factors such as: retail consolidation and competition; overall reduced prices; reduced production costs; and an increasing amount of income spent on services. Figure 2: Percentage of Food Expenditures on total Personal Expenditure on Goods and Services
Source: Statistics Canada

Canada’s Specialty Food Industry
19
5.3 Shopping habits of Specialty Food Consumers Unfortunately, not much information is available on the shopping habits of Canadian specialty food consumers. More has been researched on the shopping habits of US specialty food consumers, for example Mintel (2010). Current information suggests that most specialty food consumers base their food choices on weight control and health reasons. Almost half of these consumers are looking for healthful and “better-for-you” choices. Interestingly, even though many specialty food products are indulgent, no fat, reduced sugar and low fat products are more popular among specialty food consumers (Mintel, 2010). The same trend has been reported for Canada. In an article from The Canadian Grocer (2010), a senior product manager at Tree of Life Canada in Surrey, B.C. mentioned that they see a significant increase in ‘lite’ offerings. For example, lite soy is more popular than regular soy, which is important for consumers watching their sodium intake. Furthermore, "Sharwoods”, a leading brand, also offers ‘lightened up’ versions of its Indian cooking sauces, while gluten-free products are also finding their way onto shelves in the ethnic section. Additionally, Tree of Life has recently added Patel's organic Indian side dishes/ready meals to its offering. The strength of the Canadian organic market, combined with the popularity of Indian foods, offers a great opportunity to boost category sales. Because of the recession in the US, more than half of the U.S. specialty food consumers have changed their spending patterns in 2009. Some specialty food consumers have also cooked more at home, thereby replacing meals at restaurants (Mintel, 2010). 5.4 Trends Relating to Ethnicity The ethnic foods category is a large contributor to a segment of the Specialty Food sector. The dictionary defines ethnic as follows: “pertaining to or characteristic of a people, especially a group (ethnic group) sharing a common and distinctive culture, religion, language, or the like.3” Ethnic food consumers can be divided into two major groups: unrestricted ethnic food consumers who seek familiar and/or genuine ingredients, forms, tastes and flavours; and restricted ethnic food consumers who must consume meat and other food products, slaughtered or processed according to religious laws, which include halal and kosher certified foods. As shown in the immigration section, Canada’s population will become even more ethnically diverse in the future. However, not just ethnic minorities buy ethnic food. In recent years, ethnic food has become quite popular. People travel more and want to re-experience the foods they have enjoyed abroad, or are just more interested in experiencing different cultures generally, with food being a major factor. These trends are likely to magnify over the next years.
5.4.1 Influences of Ethnicity on Choice
Consumers with an immigrant background are more likely to try foods reflecting the traditions of other ethnic groups. Jamal (2003) argues that consumers of different ethnic backgrounds also engage in culture swapping to sample other cultural tastes. Retailers of a different ethnic background facilitate this culture swapping and therefore play an important role in cultural intermediaries. However, for many consumers, the transition to the ‘exotic’ is only temporary.
3 http://dictionary.reference.com/browse/ethnic
Canada’s Specialty Food Industry
20
Some may argue that many ethnic food items have entered the ‘mainstream’ and no longer belong to the specialty food category. Typical examples are pasta and pizza, which have become a staple in the Canadian diet but are still considered classic Italian food. Another example is Chinese food, which entered the North American mainstream diet in the beginning of the 20th century. Barbas (2003) conducted a case study on the adoption of Chinese food in America’s kitchens and how restaurants can act as agents of culinary and cultural change. Barbas (2003) argues that Chinese restaurants encouraged Americans to try exotic foods while maintaining social and geographic boundaries. In the beginning of the 20th century, restaurants became the venue for the first steps towards cultural and culinary exchange. One important aspect was that Chinese food, as with most ethnic food, adapts easily to the western cuisine. Already in the 1920s, consumers started to use soy sauce, water chestnuts and bean sprouts. It soon became increasingly easier to prepare Chinese food at home. The case study of Chinese restaurants and Chinese American food showed that culinary preferences do not always correlate with social attitudes, which were not favourable towards the Chinese in the beginning of the 20th century.
5.4.2 Trends Influenced by Religious Law
Producing and promoting food products that target the restricted ethnic food consumer group is regarded as a less risky business opportunity. The Value Chain Management Centre and Ipsos Forward estimated that the Canadian market for halal meat products was more than $338 million in 2010. This estimation was based on interviewing a sample of national, regional, independent and ethnic distributors and retailers. We also found that Canadian Muslim consumers spend more on meat consumption than the average Canadian consumer. In 2008, the estimated retail value of kosher food products in Canada was roughly $575 million4. The Canadian kosher food sector is older than the halal sector and is supported by 348,600 Jews (2001 figure)5, Muslims and other consumers.
By 2031, nearly half of the Canadian visible minority group will be Muslims. Defined by religion, Muslims are the fastest segment of the Canadian population. The population of Canadian Muslims was estimated at 1.25 million. This estimation was based on StatCan census 1991 and 2001, the findings of which show:
• A significant majority of Canada’s Muslim population lives in Ontario - a considerably higher concentration than found in the US;
• The majority of Muslims live in Ontario (61%), followed by Quebec (19%) and British Columbia (10%)
• The vast majority of Muslims living in Ontario reside in Toronto (47%), which is followed by Mississauga (12%) and Ottawa (9%);
• The estimated annual growth rate for Canada’s Muslim population is 13%; • The annual economic impact of Muslims living in Canada is estimated to be CAD$13
billion (US$12 billion); and • Muslims will represent 7% of the Canadian population by 2031 (StatCan, March 2010).
4Source: Agri-Food Trade Service, Ethnic & Specialty Food Expo 2008 Key Industry Trends, November
2008 5 The 2001 figure is most recent official estimation available by Statistics Canada.

Canada’s Specialty Food Industry
21
Demographics that characterize Canadian Muslims include the following:
• Establishing roots: most have immigrated to Canada within the last ten years, are younger and have household income below $50,000;
• Educated: well educated with 74% having at least a post-secondary degree or diploma and 45% with a graduate degree/post-doctorate;
• Larger households: average household size – 4.4 people per household, versus 2.5 among total population; and
• Generally include meat in their diet.
Serving a Muslim consumer base also offers significant export opportunities. The vast majority of Islamic countries, with populations of about 1.5 billion, are net food-importing countries. Some Canadian companies have benefited and gained international and domestic market shares by positioning their products as Canadian Dhabiha-Halal6 meats.
5.5 Trends Related to Socio-Demographics
A number of overall trends are the result of factors described above. They also include the influence that value-laden factors, such as an increasing awareness about allergies and health, have on consumer choice. For example, a multitude of studies investigating the interconnection between food, gender, occupation and culture have been conducted. For example, Ruby and Heine (2011) reviewed arguments that consumers with healthy diets are seen as more intelligent, attractive and moral; and that the consumption of meat has been linked to the cultural conception of power and masculinity. Indeed, these perceptions influence consumers’ choices on what food items to consume.
The enablers and motivators of these trends include multiculturalism, increased affluence, time pressure, extended life spans and education.
5.5.1 Organics
A significant trend is organic food. According to AAFC (2009), organic products are promoted at specialty and ethnic food expositions. Organic food is grown and processed without synthetic chemicals, pesticides, antibiotics or fertilizers. The original concept of organic foods was to support local and small farmers. However, the organic food sector has become very successful and is supplying a growing demand. More and more organic products are becoming widely available in local grocery stores and supermarkets. The organic sector in Canada is growing at a rate of 15% to 20% annually. Consumers purchase organic products mainly in supermarket chains, where 52% of all organic food sales occurred in 2007. Canadian organic consumers were especially looking for bakery products, sweet and savory snacks, ready to eat meals, milk and frozen processed food. Organic beverages were not as important as organic package food, although they are on the rise. In 2008, $31.00 per capita was spent annually in Canada on organic food. This was a $2.10 per capita increased from the $28.90 spent on organics the previous year (AAFC, 2009).
6 Dhabiha is an Arabic word that relates to how animals should be slaughtered for the meat to be suitable for consumption by Muslims. Dhabiha is performed by cutting the jugular vein of an animal and allowing its blood to drain. It is mandated by Islamic dietary laws that all animals killed for food, except fish, must be slain via Dhabiha.

Canada’s Specialty Food Industry
22
Why do consumers purchase organics? Consumers’ social awareness is increasing and people are concerned about fair trade (AAFC, 2009). Organics competes with other health and wellness categories, for example ‘better-for-you’ products and functional foods. Increased competition has allowed for prices to decrease, resulting in the organic trend to develop not only in high income consumer groups, but in lower income consumer groups also. In particular, organic baby food has experienced growths in recent years (AAFC, 2009). Many consumers respond to food scandals and scares. Some examples include: the 1999 dioxin crisis in Belgium; the 2003 BSE crisis in Canada; the 2008 Irish pork crisis; and the current (2011) Chinese melamine case in Germany. Some consumers are also concerned about novel technologies, for example Genetically Modified or ‘GMO’ foods. In times of food crises, more and more consumers turn to organically produced foods. Hence, when people are affected by food scares, they may switch to different foods, which may belong to the ‘specialty food’ category.
5.5.2 Vegetarianism
Vegetarianism can be part of a religious diet. Hindus, for example, may choose not to consume meat as part of their diet. However, the vast majority of people decide to consume a vegetarian diet for a multitude of other reasons. Fox and Ward (2008) conducted a literature review on the motivation for consumers to consume a vegetarian diet. These reasons are personal health, animal welfare and traditional family beliefs. People may also become vegetarians because they want to identify themselves simply as part of the ‘vegetarian community’. A distinction has been made between health vegetarianism and ethical vegetarianism. While health vegetarians want to avoid meat for health reasons or to lose weight, ethical vegetarianism simply do not to want to harm animals. The former make mostly gradual changes when switching to a vegetarian diet, while the latter make more sudden changes. In the last decade, vegetarianism has become a popular dietary choice, which is also a result of the increased availability of meat-free products.
5.5.3 Soy products
Soy products are considered a specialty food in many respects as they are a representative of the ethnic food category (soy products are a staple in the diets of Asians), are mostly considered priced above average and are a suitable food choice for people that are lactose intolerant or do not want to consume animal protein. Soy products have been available for several decades but have gained more popularity in the last ten years. They are associated with health claims, ranging from the reduction of the risk of heart disease and osteoporosis to the reduction of certain types of cancer (Schyver et al., 2005). However, North Americans consume only a small amount of soy products. Schyver et al. (2005) examined the attitudes of American soy consumers and non-soy food consumers with the help of focus groups. The greatest barriers to consuming soy products were: the image of soy (some perceived soy foods, especially tofu, as ‘hippie food’); sensory characteristics (some described it as bland and flavourless); and many viewed soy products as merely substitute foods. Furthermore, many people did not know how to prepare soy foods.
Canada’s Specialty Food Industry
23
Costs also played a large role, as many identified the high costs of protein bars and convenience items as an inhibitor to experiment. However, promoters of soy food consumption encourage the perception of a general lifestyle change: the alternative to animal protein; vegetarianism; and the adoption of a healthier lifestyle. Soy products are still far removed from being considered a mainstream product. However, their importance is growing with an increasing health consciousness of the Canadian consumer. Numerous research projects have been undertaken to study the risk of certain kinds of cancers by consuming soy products, as soy products can mimic estrogen. This has influenced consumer perceptions toward soy products.
5.5.4 Food Intolerance
Food allergies are an important factor. According to Health Canada, food allergies affect as many as 6% of young children and 3% to 4% of adults. In 2007, the Canadian food intolerance market was worth over US$265 million. Health Canada implemented enhanced labeling requirements for allergens, which will contribute to the development of foods that will meet the increased market demands (AAFC, 2009). On February 4, 2011, enhanced labeling requirements for food allergen and gluten sources and added sulphites came into effect7. For example, instead of listing just an ingredient, such as “starch”, the plant name from which this ingredient was derived from must be included on a food item label as well. Or if a “contains” statement is included on the label, the product must appear in the ingredient listed. Sources for each food allergen and gluten must be listed, and the total amount of sulphites present must be shown on the label. More details can be found in the regulation amendment.
5.5.4.1 Celiac disease Celiac disease is an autoimmune disorder, where an individual’s intestinal lining can be damaged by a substance called gluten. Gluten is a protein that can be found in rye, wheat and barley. A person suffering from celiac disease has difficulty absorbing nutrients like protein, fat, carbohydrates, vitamins and minerals. Prolonged consumption of gluten could lead to long-term health complications for those suffering from celiac disease (such as chronic weight loss, fatigue, anemia, depression, etc.). Celiac disease can only be treated by following a lifelong, gluten-free diet. People that suffer from celiac disease also have a higher incidence of type 1 diabetes, Graves’ disease and sarcoidosis. The Canadian Celiac Association estimates that one in 133 persons in Canada is affected by this disease (2010), which equates to 256,463 out of 34,109,752 or 0.75% (2010 population). Among those with celiac disease, there is a great variation in sensitivity towards gluten. A person suffering from celiac disease has to be a very selective consumer, as gluten can be hidden in many packaged and processed foods (such as gravies and broths). As evidence of the increased focus on consumers with special dietary needs is the number of food products tagged ’no gluten’ having tripled between 2005 and 2008. According to AAFC (2009), gluten-free product launches increased by 86% in 2006 alone. This led to strong growth in gluten-free products in many markets, including North America, Latin America and Europe. Among the products that have been developed and brought to the market is a beer that is brewed from sorghum instead of wheat or barley. Given the rate at which gluten-free products have come onto the market compared to the number of celiac disease suffers, questions are, however, being raised that the current range of products is spawned by a passing trend that
7 Canada Gazette, Part II, Vol. 145, No. 4

Canada’s Specialty Food Industry
24
may reverse as quickly as it has become established (Leung, 20011; Barton, 2011). However, it is not just celiacs that purchase gluten-free products, but rather a rapidly growing number of people who claim they generally feel better on a gluten-free diet.
5.5.4.2 Lactose Intolerance People that are lactose intolerant lack the enzyme lactase, which is required to digest lactose into simple sugars. The causes of lactose intolerance are a lack of said enzyme or a temporary condition, where the level of lactase has fallen because of a disease such as celiac disease, inflammatory bowel disease or because of intestinal surgery (Canadian Celiac Association, 2010). However, people tolerate various levels of lactose in their diet and a small amount of lactose can be digested by most people. The lactose intolerance can be decreased over time by gradually introducing milk products into the diet. Some examples for special products for people suffering from lactose intolerance are the following: Lacteeze milk, Lactaid milk, Lactaid enzyme drops, Lacteeze yogurts and ice cream (Canadian Celiac Association, 2010). According to Bhatnagar and Aggarwal (2007), lactose intolerance is especially prevalent in Asians and American Indians, where almost 100% are affected. About 50% to 80% of people of Hispanic, South Indian, Black, and Ashkenazi Jewish origin are lactose intolerant. Only 25% of people of European descendent are affected. 5.6 Industry Sub-Sectors Building on the previous description, the following section characterizes the nature of four types of product that we believe fit under the overall specialty foods umbrella. They are:
• Foods produced in compliance with religious dietary laws • Ethnic foods • Specialty diets • Gourmet and artisan products
Where possible, each description contains examples of how each product type is defined and/or certified. Examples are also provided of the current nature and the market associated with each group of food. The following details will be expanded upon through findings gathered during Phase 2 and 3 of the research.
5.6.1 Foods produced in compliance with religious dietary laws
5.6.1.1 Halal According to the Islamic Food and Nutrition Council of America (IFANCA), Halal is an Arabic word that means lawful or permitted. The opposite of halal is haram, which means unlawful or prohibited. Halal and haram are universal terms that apply to all facets of Islamic life. In this report, these terms will be only used in relation to food products. According to Islamic laws, all foods are considered halal except the following six sub-categories: 1) Swine/Pork and its by-products; 2) Animals improperly slaughtered or dead before slaughtering; 3) Alcoholic drinks and intoxicants; 4) Carnivorous animals, birds of prey and certain other animals; 5) Foods contaminated with any of the above products; and 6) Foods containing ingredients such as gelatin, enzymes, emulsifiers, and flavors are questionable, because the origin of these ingredients is not known.

Canada’s Specialty Food Industry
25
Halal verification The Value Chain Management Center conducted a study on the North American Halal Meat Industry in 2010. With regards to the halal verification process, the study has concluded that:
o Overall, there is a universal understanding of the key requirements of halal. There is, however, significant debate regarding the use of mechanical blade slaughter – particularly in poultry8.
o Halal verification is very different between traditional retailers and ethnic retailers. Traditional retailers require Halal authentication to be engaged in the process while ethnic retailers often “self-certify through observation”.
o Regardless of whether or not a third party Halal certification organization is involved, the system is dependent on trust. While there is almost universal concern that it hurts the industry as a whole, brands/stores are routinely disparaged by competitors on suspected breeches of authenticity.
o No retailer has indicated they themselves break halal protocol, however, all knew of individuals who do, or are suspected of doing, evidenced by low pricing.
o Most ethnic retailers claimed to be certified by the state or province to sell halal meats, which references a business license and not a certification agency.
o Halal verification for ethnic retailers is predominantly based on trust. Retailers must prove to their customers that their processes meet genuine halal standards.
o When asked to estimate the costs of verification, each organization declined to provide even a directional quotation over the phone. Costs are based on type of product sold, amount of supervision required and other factors.
The report’s main focus was on halal meats, with a 2010 estimate for halal fresh meat market being between $370M and $520M. Halal fresh meat can be found in more than 8,000 outlets in Canada9 Table 4: Halal Outlets
Outlet type Number of outlets
Mainstream retail stores 6,717 - *
Ethnic (Halal) stores 700 - **
Halal restaurants/ take away 962
Total 8,379
* Number of Canadian retailers assumed to currently sell at least 5-10 halal meat products. The most prevalent is New Zealand lamb. ** Estimation based on previous interviews with distributors of Halal certified food in 2010.
8 Muslim scholars disagree on the permission of mechanical blades in poultry slaughter
9 Value Chain Management Centre, 2010, Halal Meat Industry in North America
Canada’s Specialty Food Industry
26
Table 5: Major Halal brands in Canada
Brand Fresh/Frozen Value Added processed
Deli / Wieners
Variety of chicken / beef products
Chicken wieners
Vegetarian products Chicken bologna One Turkey product Chicken roast - sliced
Al Safa
Variety of pizzas Variety of chicken products
Chicken deli Maple Lodge – Zabiha Halal
Chicken
Chicken wieners Variety of chicken products
Beef deli / wieners
Variety of beef products
Chicken deli / wieners
Crescent Premium Foods Inc.
Variety of pizzas Variety of chicken products
Madina Chicken
Variety of pizzas Spring Lamb/ Opal Valley
Lamb
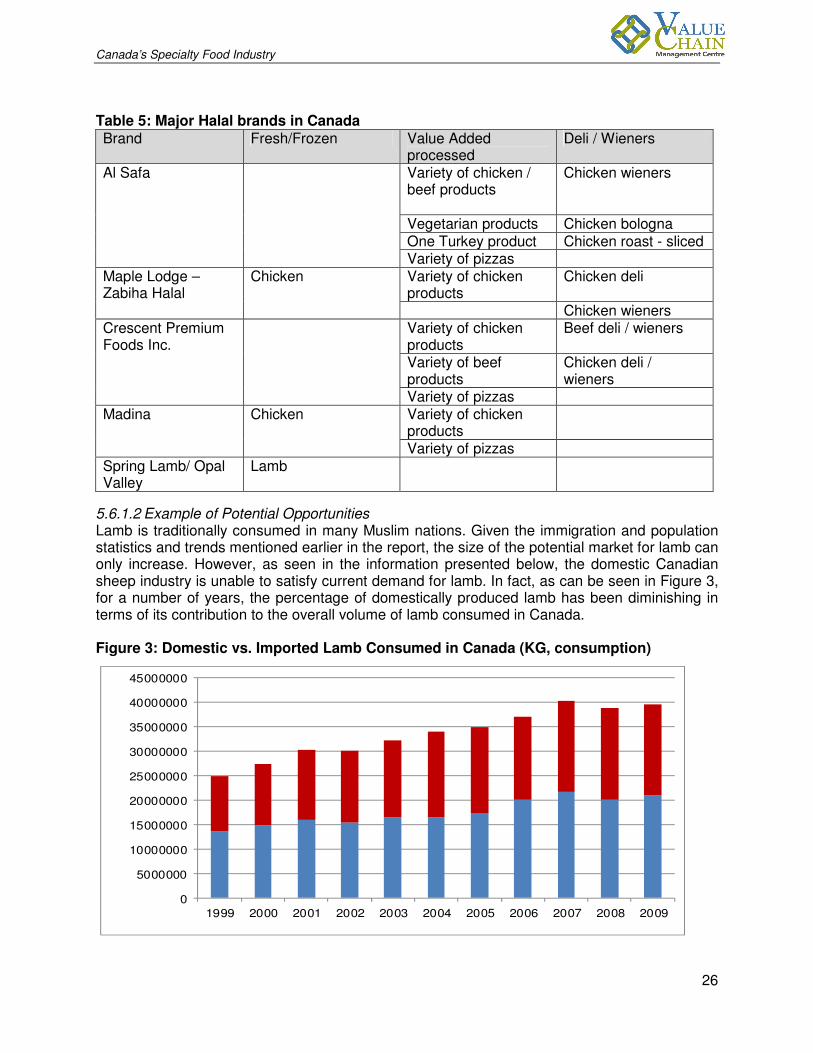
5.6.1.2 Example of Potential Opportunities Lamb is traditionally consumed in many Muslim nations. Given the immigration and population statistics and trends mentioned earlier in the report, the size of the potential market for lamb can only increase. However, as seen in the information presented below, the domestic Canadian sheep industry is unable to satisfy current demand for lamb. In fact, as can be seen in Figure 3, for a number of years, the percentage of domestically produced lamb has been diminishing in terms of its contribution to the overall volume of lamb consumed in Canada. Figure 3: Domestic vs. Imported Lamb Consumed in Canada (KG, consumption)
0
5000000
10000000
15000000
20000000
25000000
30000000
35000000
40000000
45000000
1999 2000 2001 2002 2003 2004 2005 2006 2007 2008 2009

Canada’s Specialty Food Industry
27
Source: Canadian Sheep Federation The above graph shows the amount of lamb (kilograms) annually consumed by Canadians between 1999 and 2009. The red bar represents what was produced domestically. The blue bar represents the amount of imported product. Between 2004 and 2009, the number of lambs processed in Canada reduced by 5% (775,200 and 741,800, respectively). Simultaneously, there has been a rise in slaughter and feeder lambs entering from the US. In 2009, Canada imported over 21 million kilograms of lamb, worth over $131 million. For over a decade, there has been a steady increase in the volume and value of processed lamb imported from Australia, New Zealand and elsewhere. Representing an additional missed market opportunity, the vast majority of lamb processed in the two largest exporters of lamb to Canada, New Zealand (68%) and Australia (31%) is Halal certified. Some of the lamb (exact figures are unknown) that is processed in Canada is Halal certified. Of the lamb imported into Canada, 55% was consumed in Ontario, 39% in BC and 6% in Quebec.
5.6.1.3 Kosher Kosher foods are foods that are prepared according to Jewish dietary regulations. The laws of Kashruth (Jewish dietary law) govern permissible foods and food preparations. Regulations exist that govern permissible meat, fish and dairy products, and only mammals that both chew their cud (ruminants) and are cloven-hoofed are permissible for consumption. Therefore, the meat of swine and hares (among others) is forbidden. Chicken, turkey, duck, goose, and fish with fins and scales can be consumed. Also, all shellfish are prohibited. Strict laws also apply to animal slaughter – ensuring minimal suffering – and meat preparation. According to Jewish Dietary Laws10, the general rules kosher food products rules are:
• Certain animals may not be eaten at all. This restriction includes the flesh, organs, eggs and milk of forbidden animals.
• Of the animals that may be eaten, the birds and mammals must be killed in accordance with Jewish law.
• All blood must be drained from meat and poultry or broiled out of it before it is eaten. • Certain parts of permitted animals may not be eaten. • Fruits and vegetables are permitted, but must be inspected for bugs (which cannot be
eaten). • Meat (the flesh of birds and mammals) cannot be eaten with dairy. Fish, eggs, fruits,
vegetables and grains can be eaten with either meat or dairy. (According to some views, fish may not be eaten with meat.)
• Utensils (including pots and pans and other cooking surfaces) that have come into contact with meat may not be used with dairy, and vice versa. Utensils that have come into contact with non-kosher food may not be used with kosher food. This applies only where the contact occurred while the food was hot.
• Grape products made by non-Jews may not be eaten. • There are a few other rules that are not universal.
As the number of companies seeking kosher certification rises, kosher is becoming the standard for food ingredients. According to the Kashruth Council of Canada, there are more than 45,000 products carrying its symbol “COR” surrounded by a circle. The number of available kosher products is increasing on an annual basis as well as demand. Kosher food sales in Canada are
10 http://www.jewfaq.org/kashrut.htm

Canada’s Specialty Food Industry
28
well in excess of $500 million. One kosher market industry expert11 claims that the average annual growth of the kosher market has been 15% from 2000 to 2008, and 21% of consumers now regularly or occasionally purchase kosher products because they are kosher (for instance, hot dogs). Kosher products are increasingly popular among a significant percentage of non-Jewish consumers. Muslims, Hindus and Seventh-day Adventists with similar or overlapping dietary restrictions find some kosher foods suitable. Shellfish and some fish types are not kosher, so a kosher stamp is a signal for those with shellfish allergies. For the lactose-intolerant, a product labeled ‘pareve’12 is certain to be dairy and meat-free. People with celiac disease and gluten sensitivities stock purchase "kosher for Passover" products; during Passover, wheat and other grains are restricted. In 2009, MINTEL studied the Kosher consumer in the US. Mintel found that the top three reasons consumers intentionally purchased kosher foods were quality (62%), healthfulness (51%) and food safety (34%). 14% adhered to Jewish dietary laws, while 10% followed other similar religious dietary rules. Canada’s kosher food market is small in comparison with the mainstream market. The most recent census data (2001) from StatCan shows the number of Canadians who reported their religion as Jewish was 329,995. The Alberta Ministry of Agriculture, Food and Rural Development published a study called ‘Consumer Trends in the Canadian Kosher Market’ in March 200413 and found the following:.
• In 2001, total Canadian packaged kosher food sales were estimated to have a retail market value of $575 million, a growth from $480 million in 2000. It is important to note that many foods are available only in kosher format and that this value includes a sizeable proportion of sales to those outside of the Jewish community, especially during Passover.
• Of Canadian consumers who purchase kosher products, it is estimated that approximately:
o 45% ($258.7 million) are Jewish o 25% ($143.8 million) believe kosher is safer or better o 20% ($115 million) are Muslims
• 90% of Canada’s Jewish population live in Toronto (50%), Montreal (27%), Vancouver (5%) and Winnipeg (4%).
The evidence suggests that the Canadian kosher food market is lucrative, regardless of the relative small size of the market segment. A recent study14 has shown that kosher buyers tend to be the retailer’s most valuable customers because they spend nearly 50% more than the average shopper.
11 Menachem Lubinsky is editor of Kosher Today and co-producer of the annual Kosherfest, the largest kosher food, beverage and spirits trade show in North America. 12 The term Pareve signifies products that are dairy AND meat-free, which means that products labeled pareve are be suitable to vegetarians and vegans as well. 13
http://www1.agric.gov.ab.ca/$department/deptdocs.nsf/all/sis8737 14
Public presentation by Jeremy J. Fingerman “Perspectives on the U.S. Kosher Market Hurdles and Opportunities” at SIAL Montreal 2009 2-April-09.

Canada’s Specialty Food Industry
29
5.6.2 Ethnic food
According to AAFC (2008), the ethnic food market in North America is growing at 5% annually. The increase in market growth rate is based on the US' projected visible minority population growth rate of 30% by 2020 over 2006’s population and a further growth of 52% by 2050. In addition, 31% of the American population is considered to belong to the ethnic consumer category. Between 1997 and 2002, the ethnic food market in the US grew by 69% and is projected to increase by a further 50% by 2015. As mentioned before, StatCan projections indicate that the population of visible minority groups could reach over 11.4 million (approximately three Canadians in 10 or 30%) in 2031 from only five million (16%) in 2006. This provides enormous opportunities for producers in the US and Canada. Demand for ethnic foods has grown significantly in the US in the last decade. The table below15 shows significant increases in the market values of Mexican, Asian and kosher foods (CAGR depicts the compound annual growth rate). Table 6: Demand of Ethnic food
Cuisine 2004 Market Value
2009 Market Value
2009 Portion of Total Ethnic Food Sales
CAGR '04-'09
Mexican US$17.6 million US$20.7 million 42% 3.3%
Chinese US$4.5 million US$4.7 million 10% 1.1%
Other Asian US$8.2 million US$9.1 million 18% 2.1%
Kosher US$7.4 million US$9.9 million 20% 6.0%
Other US$4.0 million US$5.1 million 10% 5.0%
Overall US$41.9 million US$49.7 million 100% 3.5%
According to StatCan16, other than the Western European ethnic majority, the major ethnic groups are Italian (singled out of Western European ethnic majority), Chinese, South Asian origins, Caribbean origins and Arab origins. The table below shows the results of the 2006 census. It should be noted that individuals could make multiple responses, reflecting Canada’s multiculturalism. Table 7: Population by selected ethnic origins, by province and territory Province/Ethnicity Italian Chinese South Asian
origins Caribbean origins
Arab origins
Canada 1,445,330 1,346,510 1,316,770 578,695 470,580 Ontario 867,980 644,460 833,315 389,980 NA Quebec 299,660 91,900 76,990 133,550 202,215
BC 143,155 432,435 265,595 NA NA Alberta 82,015 137,600 107,690 NA NA Source: Statistics Canada (2006), NA=not applicable
15
http://www.ats.agr.gc.ca/amr/4489-eng.htm 16
http://www40.statcan.gc.ca/l01/cst01/demo26a-eng.htm

Canada’s Specialty Food Industry
30
5.6.3 Italian Foods
Much evidence suggests that Italian foods are so popular in Canada that many consumers consider them non-ethnic. However, Greek, southern Italian and Spanish are categorized under the name “Mediterranean foods”. Mediterranean foods,17 cited as a major emerging ethnic cuisine in the North American marketplace, gained huge popularity in 2007. The consumer trend toward wholesome, boldly-flavoured ethnic food has grown considerably in recent years, largely due to Mediterranean cuisine having been marketed as a healthy diet option in the US since 1993. The Mediterranean cuisine is encouraging high consumption of fruits and vegetables, vegetable oils (olive oil), fish (especially fatty fish), cereals (bread and pasta), legumes and milk. A diet rich in those food products is considered very nutritious. The Mediterranean diet symbol (below) for packaged food was released in the US in April 2007 and has helped further drive the popularity of this cuisine.
5.6.4 Mexican Foods
Based on the 2006 census, Canadians of Mexican origin contributed 0.25% to the total Canadian population. Datamonitor (2005) reports that Mexican cuisine will maintain its 42% share of ethnic food sales in the US. However, beyond 2009, Datamonitor research predicts kosher to be the next largest ethnic food segment, representing approximately 20% of ethnic food sales. Mexican cuisine has remained the most popular ethnic food segment in the US over the past decade, understandably as a result of the high Mexican population in the US. In Canada, Mexican foods are noticeably popular, but nowhere near the level of the US.
5.6.5 Chinese Foods
Chinese-Canadians are one of the largest ethnic groups in Canada and are expected to grow more than the national average in the coming 20 years. Also, China is becoming a more and more valuable export market. Chinese foods are not only popular among Chinese-Canadians, they are sought after by a large percentage of Canadians of different ethnic origins. Canadian national retailers have realized the opportunities in the Chinese food market and have acquired significant market share. Chinese-inspired meals are now widespread in the Canadian marketplace. One example is Loblaws, which has developed a line of authentic, ethnic, ready-made meals for Chinese Canadians. Chinese Canadian shoppers spend $136 on groceries weekly on average, 9% higher than the benchmark for all residents of Toronto and Vancouver (Solutions Research
17
http://www.ats.agr.gc.ca/amr/4489-eng.htm

Canada’s Specialty Food Industry
31
Group 2008). The projected increase in the population represents a potential opportunity for market expansion in the Chinese food segment. 5.7 South Asian Foods The 2006 StatCan census reported 2.5 million Canadians of East and South Asian origin representing a growth rate of 27% over 2001. They are made up of different ethnic and cultural origins. In the 2001 census, 74% were East Indian, 8% were Pakistani, 6% were Sri Lankan, 5% were Punjabi and 4% were Tamil. The large majority of the Canadian population of South Asian origin is concentrated in Ontario (62% as of 2001) and British Columbia (22% as of 2001). A recent study by Solutions Research Group (2008) found that South Asian Canadians spend 23% more on groceries than an average household in Toronto and Vancouver. The higher expenditure on groceries and the increasing growth rate of population indicates opportunities for growth in the South Asian Food market. Evidence for this includes Loblaws’ launching of its President’s Choice ‘Blue Label’ Indian style frozen food.
5.7.1 Caribbean Foods
A person of Caribbean origin could come from a group of 27 countries and territories. They include Antigua and Barbuda, the Bahamas, Barbados, Belize, Dominica, Grenada, Guyana, Haiti, Jamaica, Montserrat, Saint Lucia, St. Kitts and Nevis, St. Vincent and the Grenadines, Suriname, and Trinidad and Tobago, representing a heterogeneous population. They maintain elements of the traditional diets of their country of origin. Between 1996 and 2001, the population of Canadians of Caribbean origin grew by 11%. As of 2001, 91% of Canadians of Caribbean origin lived in either Ontario or Quebec and constituted 6% and 3% of the total population in Toronto and Montreal, respectively. Based on the 2006 census, there were approximately 580,000 Canadians of Caribbean origin in Canada made up of 40% Jamaicans, 18% Haitians, 11% from Guyana, and 10% from Trinidad and Tobago. As part of the visible minority, the population of people with Caribbean origin is also expected to increase. The projected increase in population represents market opportunities for Caribbean food in Canada. Driven by a combination of immigration, the Caribbean being a popular holiday destination, and the successful Caribbean festival held in Toronto every year, the market presence of Caribbean foods appears to be increasing in Canada. However, no quantifiable evidence exists about the market size or its rate of expansion. 5.8 Specialty diets According to the Canadian Food Inspection Agency’s (CFIA) Guide to Food Labelling and Advertising18, the food for special dietary use is defined as a food that has been specially processed or formulated to meet the particular requirements of a person:
a. in whom a physical or physiological condition exists as a result of a disease, disorder or injury; or
b. for whom a particular effect, including but not limited to weight loss, is to be obtained by a controlled intake of foods.
In general, only the following foods meeting the criteria in guide section B.24.003(1) may be represented in a manner likely to create the impression that they are foods for special dietary use:
18
http://www.inspection.gc.ca/english/fssa/labeti/guide/toce.shtml

Canada’s Specialty Food Industry
32
• a formulated liquid diet; • a meal replacement; • a nutritional supplement ; • a gluten-free food; and • a food represented as:
o a protein-restricted diet; o a low-amino acid diet; or o a very low-energy diet.
For this project, the specialty diets have been categorized into two groups: “free from” and “low in”.
5.8.1 “Free from” foods
“Free from” foods are part of a category that encompass products that are, for example gluten-free, peanut-free, wheat-free, dairy-free and soya-free. It has been estimated that at least 5% of the Canadian food market could be captured by ‘free from’ foods. While there is no definitive proof, anecdotal evidence suggests that the Canadian market leader among ‘free from’ foods is gluten-free. As mentioned in the above section, the Canadian regulations regarding labelling of food allergens require that when the statement: “Allergy and Intolerance Information - Contains: . . . ’’ is used, it is also necessary to list the food allergen, gluten sources and added sulphites (at 10 ppm and above) in the food, whether allergens and gluten sources have already been declared in the ingredients list or not. The safety of oats for celiac disease sufferers has been investigated. Studies showed that a small amount of oats is safe to be consumed for some. However, these studies used pure and uncontaminated oats. The Canadian Celiac Association developed a standard for PAVENA, which would mark pure, uncontaminated oats and oat products. The problem within the “free from” category is not just in making the label clearer but also in increasing the availability of allergens/gluten-free food products. Compared to the specialty diets industry in the UK, the Canadian industry is far from satisfying special consumer demands. The major retailers such as Sainsbury’s, Tesco and Asda have established diet programs and created their own "free from" aisles to suit consumers with special dietary needs.19
5.8.1.1 “Low in” health conscious choices Also known as ‘Better-For-You’ (BFY)20, these types of premium products are positioned in the market place as offering health benefits, such as having reduced fat, sugar or salt content, while maintaining taste and texture.
Low-in-sodium and low-in-fat are believed to be the top performers of the BFY category. The BFY foods have inspired several Canadian food manufacturers, including Campbell Soups with its 36 new low-in-sodium soups varieties. The low-in-fat snack foods are also strong performers in the Canadian food market. More efforts are being made to educate the Canadian consumers regarding health problems associated with the high-fat content of traditional products. For
19
http://www.celiac.ca/Articles/PABoats.html 20
http://www.ats-sea.agr.gc.ca/info/4367-eng.htm

Canada’s Specialty Food Industry
33
example, a recent survey from StatCan found that Canadian adults consumed an average of 3,092 mg of sodium daily, well above the level recommended, and considerably higher than, the upper limit of 2,300 mg of sodium per day. Most of the sodium consumed by Canadians comes from pre-packaged, ready-to-eat foods, rather than from salt added at the table or in home cooking. The Heart & Stroke Foundation of Canada's "Health Check" Program has added criteria for sodium, fibre and sugar as well as protein, vitamins and minerals in order for a product to qualify for its Health Check program.
Evidence suggests that BFY type food products have considerable room for growth.
5.8.2 Gourmet and Artisan
While considerable anecdotal evidence exists to suggest that the demand for gourmet and artisan products in Canada has grown in the last five years, little hard data exists to support this statement; particularly compared to data from the US that was discussed earlier in the report. The drivers of growth are predominantly more informed and affluent consumers seeking unique eating experiences, or those looking for exotic/genuine flavour when entertaining family or friends, and on special occasions. An example of the research showing the importance of meal occasion for determining consumers’ interest and willingness to purchase gourmet and artisan meats was produced by the Consumer Data For Farmers initiative led by the Canadian Pork Council (George Morris Centre, 2009). Gourmet and artisan foods include a wide variety of products, including cheese, cooked and cured meats, chocolate and confections, bread, crackers and toasts, dried fruits and nuts, oil and vinegar, olives and antipasto, jam, honey and spreads. A recent Business Insights report showed that the use of the term ‘gourmet product’ has increased annually by an average of 4% between 2005 and 2008. Gourmet products tend to be artisan products or products that incorporate exotic flavor combinations. The gourmet and artisan foods are generally perceived to be produced on a small or fragmented scale. In many cases, gourmet and artisan foods also have very limited distribution channels. Also, the gourmet and artisan food consumption is driven by the impression and reputation of the food maker (manufacturer). Therefore the gourmet and artisan foods are moving targets.

Canada’s Specialty Food Industry
34
6 Value Chain Analysis This section begins by stating the objectives of the value chain analysis, data for which was gathered through consultations with industry stakeholders – the most important participants being commercial businesses. This is followed by Section 6.2, which details the research methods. Sections 6.3 and 6.4 summarize the number and characteristics of the stakeholders interviewed, and the data gathered. Section 6.5 provides an initial overview of the results, which are described in relation to each of the specific subsectors in Section 6.6. The Section concludes by summarizing factors which respondents identified as describing challenges which respondents described as impacting their ability to fully exploit identified market opportunities. Subsequent sections present results from the value chain analysis and the literature review in the form of a SWOT analysis of the specialty food industry in Canada and the selected sub-sectors, then present a series of recommendations that can be undertaken to improve the long-term competitiveness of Canada’s Specialty Food sector. 6.1 Objective Having the ability to meet customer and consumer needs is paramount to profitably capturing and retaining market opportunities over the long-term (Hughes, 2004; 2006). The objective of the consultative process was to enable an objective assessment to be made of the effectiveness of the current structure and nature of the Canadian Specialty Food sector. Including whether the sector’s structure and nature was primarily a function of factors internal to individual businesses or external factors, over which individual businesses have little to no control. This was achieved through identifying the extent and nature of market opportunities which industry stakeholders from each of the sub-sectors believe to exist, and the factors that they believe would impact their ability and motivation to exploit those opportunities. It also sought to identify what respondents viewed as the primary cause of factors impacting their ability and motivation to exploit market opportunities (for example: market size and location; business relationships; information asymmetry; management capability; technology; industry culture; or legislation). 6.2 Research Methods Each sub-sector was analysed in an identical fashion to create a comparison of the extent to which various levels of industry possess similar or opposing viewpoints on what changes could increase their readiness and motivation to exploit market opportunities that are currently being missed., This enabled the researchers to identify specific challenges which, if addressed, could lead to a stronger, more innovative and competitive Specialty Food sector. The primary research tool was a questionnaire that enabled data to be gathered from chosen respondents through the means of a semi-structured interview format. Given the extent of industry issues that the research needed to cover, in order to acquire a detailed perspective of how each of the chosen sub-sectors view the challenges and opportunities that they face in relation to the Canadian Specialty Food sector, the chosen methodology involved utilizing a survey questionnaire that encompassed issues relating to individual businesses, their relationship to customers and suppliers, and the external environment. A letter of introduction preceded the questions. Tailored to suit their specific level in the value chain, or the industry,

Canada’s Specialty Food Industry
35
the letter explained the purpose of the research activity and the type of information sought. To encourage open and frank discussion, the letter also highlighted the confidentiality of the process. The overall target was to complete 50 interviews across the 6 sub-sectors. This decision was largely made because it was felt that the production, processing, marketing and retail/foodservice elements of the Canadian Specialty Food sector might have differing views of factors affecting market opportunities and the extent of market opportunities. Similarly, it was felt that the each level of the Canadian Specialty Food sector might have different views of the challenges that must be overcome to enhance the effectiveness and efficiency of current operations in relation to market demands, including how the role that legislation or government agencies affects current practices and attitudes. The overall results were also expected to provide an insight into whether respondents from the different sub-sectors hold similar views on the challenges that are impacting their ability to capture identified market opportunities. The questionnaires were developed from information resulting from the literature review. This approach assisted in gauging the accuracy of information collected throughout the initial research phase of the project. It was also expected to provide insights into stakeholders’ views surrounding the SWOTs affecting the future international competitiveness of Canada’s lamb industry. An understanding of the needs and challenges of stakeholders, as well as the nature of relationships that existed between players operating at each level of the industry, was expected to be critical to positioning the final recommendations in a way that could encourage stakeholder buy-in, thereby maximizing the project’s long-term value to the Canadian Specialty Food sector. To ensure that a detailed synopsis could be developed of industry practices in relation to how closely they reflected end market demands, which ultimately affects competitiveness—particularly for businesses situated far from the end market (for example, primary production)—the consultation process was constructed to reflect the value chain analysis technique. This technique works up the chain, beginning with stakeholders who are operating closest to consumers and who are situated in the higher volume channels. To enhance the relevance of the findings to the wider industry and to gain a detailed understanding of drivers and issues affecting each of the major levels of the overall value chain, the research then moved to primary and secondary processors; then finally to producers. 6.3 Respondents Respondents were chosen through consultations with industry associations, including AAFC’s Value Chain Roundtable Secretariat and the project Steering Group, acknowledged industry experts, publicly available listings of primary and secondary processors, as well as recommendations from industry peers. From these sources, a list of suggested respondents was drawn up. In an effort to maximize the eventual value of the resulting information to industry, through ensuring the validity and national perspective of the research, potential respondents were then prioritized according to specific size of the operations and geographic location. The final list of potential producer, processor, distributor, foodservice and retail respondents totaled over 120 individuals and corporations. The questionnaire was developed using the methodology described above and emailed or faxed to respondents at least one day ahead of the interview. All but six interviews were conducted by telephone. The six exceptions were one questionnaire that was completed by the respondent and faxed to the researchers and five

Canada’s Specialty Food Industry
36
interviews that were conducted face-to-face. All respondents were informed of the objectives underlying the consultation process, the confidentiality of their responses, and the method by which the research results would be processed and analysed, prior to sharing with the wider industry. A copy of the survey questionnaire used for the interviews is contained in the Appendix A. To help ensure that the information gained from the research process was accurate and valuable for assessing the current state of the specialty foods industry (particularly in terms of SWOTs facing each major level of industry as well as overall), all of the respondents were assured that their exact names and individual responses would remain confidential. A total of 58 responses were received from commercial business and industry stakeholders. The research extended across six sub-sectors that together comprised three overall themes (1. halal certified red meat: goat and lamb; 2. gluten-free: pulses and buckwheat; and 3. seafood: east and west coast). Table 8 presents a summary of final respondents, including their role in the overall value chain. Table 8: Summary of survey respondents for each of the six sub-sectors Chain/ Primary occupation*
Primary producers
Processors Retailers Industry
associations Total
Buckwheat
1 2 2 3 8
Seafood - east coast
1 3 2 1 7
Seafood - west coast
1 1 2 2 6
Goats
4 3 2 2 11
Lamb
5 7 2 2 16
Pulses
2 5 2 1 10
Total
14 21 12 10 58
*A number of respondents categorized themselves as operating at more than one level of the chain.
While the research encompassed foodservice, greater effort was placed into researching and analysing the nature of value chains supplying the domestic retail sector. Research into the sub-sector most associated with foodservice (seafood) was impacted by the fact that the consultation process occurred during the annual roe and herring season, resulting in a relatively small number of responses. The most detailed analysis therefore refers to sub-sectors’ activities for supplying the domestic retail market. References to the foodservice sector are restricted to aggregated analysis and reporting.
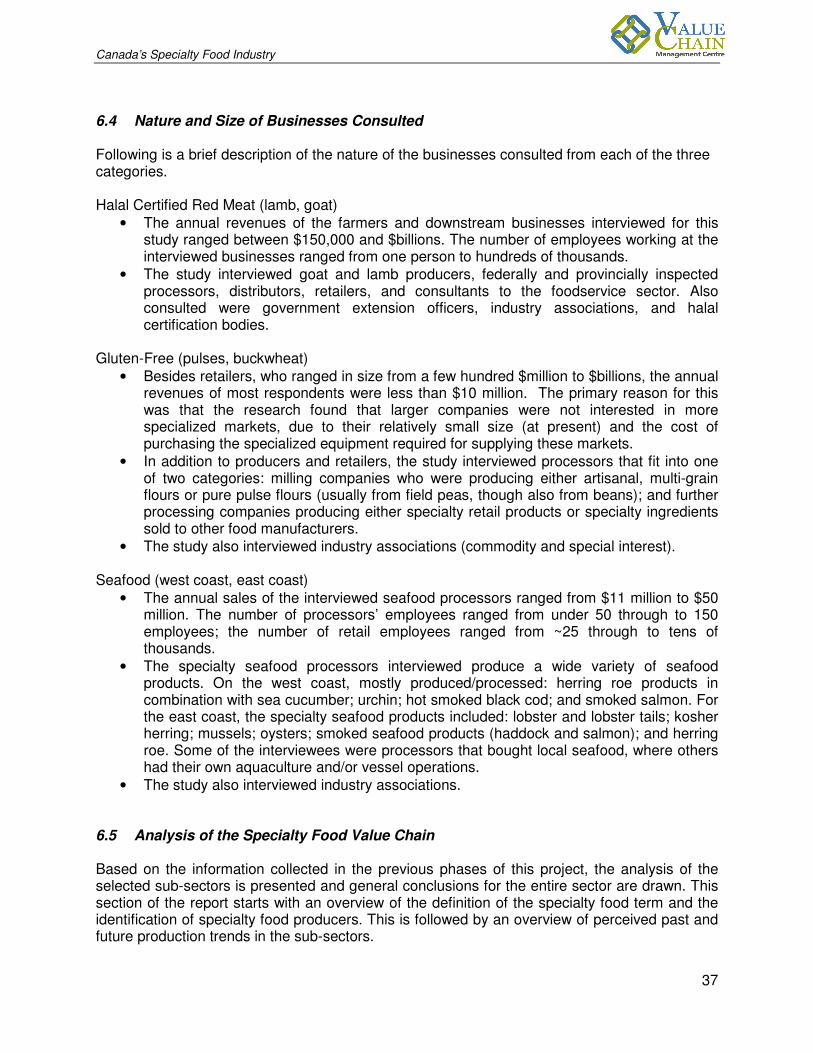
Canada’s Specialty Food Industry
37
6.4 Nature and Size of Businesses Consulted Following is a brief description of the nature of the businesses consulted from each of the three categories. Halal Certified Red Meat (lamb, goat)
• The annual revenues of the farmers and downstream businesses interviewed for this study ranged between $150,000 and $billions. The number of employees working at the interviewed businesses ranged from one person to hundreds of thousands.
• The study interviewed goat and lamb producers, federally and provincially inspected processors, distributors, retailers, and consultants to the foodservice sector. Also consulted were government extension officers, industry associations, and halal certification bodies.
Gluten-Free (pulses, buckwheat)
• Besides retailers, who ranged in size from a few hundred $million to $billions, the annual revenues of most respondents were less than $10 million. The primary reason for this was that the research found that larger companies were not interested in more specialized markets, due to their relatively small size (at present) and the cost of purchasing the specialized equipment required for supplying these markets.
• In addition to producers and retailers, the study interviewed processors that fit into one of two categories: milling companies who were producing either artisanal, multi-grain flours or pure pulse flours (usually from field peas, though also from beans); and further processing companies producing either specialty retail products or specialty ingredients sold to other food manufacturers.
• The study also interviewed industry associations (commodity and special interest). Seafood (west coast, east coast)
• The annual sales of the interviewed seafood processors ranged from $11 million to $50 million. The number of processors’ employees ranged from under 50 through to 150 employees; the number of retail employees ranged from ~25 through to tens of thousands.
• The specialty seafood processors interviewed produce a wide variety of seafood products. On the west coast, mostly produced/processed: herring roe products in combination with sea cucumber; urchin; hot smoked black cod; and smoked salmon. For the east coast, the specialty seafood products included: lobster and lobster tails; kosher herring; mussels; oysters; smoked seafood products (haddock and salmon); and herring roe. Some of the interviewees were processors that bought local seafood, where others had their own aquaculture and/or vessel operations.
• The study also interviewed industry associations. 6.5 Analysis of the Specialty Food Value Chain Based on the information collected in the previous phases of this project, the analysis of the selected sub-sectors is presented and general conclusions for the entire sector are drawn. This section of the report starts with an overview of the definition of the specialty food term and the identification of specialty food producers. This is followed by an overview of perceived past and future production trends in the sub-sectors.

Canada’s Specialty Food Industry
38
The results of the stakeholder interviews were analysed and each of the five sub-sector chains has been systematically and objectively assessed to: determine the nature of the chain; identify bottlenecks in the product and information flow; and ascertain the extent to which current policies and practices impact the innovative capacity of the industry. The results of this analysis are presented in chain maps, thereby providing a graphical representation of current product flows and information flows, from inputs to primary production through to final consumption, along with opportunities to improve performance. This report concludes with a SWOT analysis on production capacity, stakeholder collaboration and growth opportunities.
6.5.1 Definition of “specialty foods”
The views reflected below represent the value chain participants for three industry sub-sectors: red meat, produced and marketed according to religious law (halal lamb and goat); grains produced, processed and marketed as gluten-free products (buckwheat and pulses); and seafood products from the east and west coasts of Canada (primarily shellfish and Kazunoko). The survey analysis revealed some interesting similarities and themes on how the respondents define “specialty foods”. It should be mentioned, that when asked about the definition of the term “specialty foods”, more often than not, respondents hesitated with their answer. It is definitely not a definition that was on the top of everyone’s mind. The list below shows the terms most often used to define “specialty products”, along with the relevant percentage of respondents:
1. Niche/non-mainstream/differentiated/not enjoyed by all customers (56%)
2. Food that is produced and bought based on ethnicity or faith (15%)
3. Non-industrial production/lower volume/fewer competitor/low general consumer awareness (9%)
4. Consumers are willing to pay more to have it (9%)
5. Catch-all (dietary needs, ethnicity, religious significance, general healthy well-being) (7%)
6. Moving target (4%)
7. Yet to be developed (2%)
8. Not produced by average person and is not readily available at all times of the year (2%)
9. Do not know (2%)
As clearly indicated above, the greatest number of respondents stated that specialty food products are niche and differentiated and therefore not “mainstream” products. The second most mentioned responses referred to specialty food products as products that are ethnic in nature or that are consumed based on faith, such as halal and kosher products. Not surprisingly, many mentioned that specialty food products are produced in low volumes and that they are products for which consumers are willing to pay more. Some respondents also replied

Canada’s Specialty Food Industry
39
that the term “specialty food” represents a “catchall” for foods that they do not consider mainstream. One association that offers a definition for specialty foods is the Small Scale Food Processors Association (SSFPA) in British Columbia, which is Canada’s only specialty food processor and producer organisation. However, as the name suggests, its main characteristic is being small in scale. In order to become a member of the association, producers/processors must fulfill one of the following requirements21:
• Limited production: the product is not being mass-marketed to major restaurant chains or retail chains;
• Perceived by consumers as a unique product (e.g. size, colour, taste, heirloom variety, produced by an artisan, organically grown, organically processed, etc.);
• Produced in a unique way that creates a highly differentiated product;
• Perceived by consumers as being home-made from natural ingredients and processed organically;
• Fills an emerging and growing market niche; and
• Certified organic products.
Faced with the multitude of definitions, the project team decided that one or more of the following characteristics make up a specialty food product:
• natural and/or organic foods; • healthier foods (“better for you” foods); • religious nature; • food products produced in a manner that addresses consumers’ environmental concern; • culinary/artisan products; and • food products produced in a manner that addresses consumers’ ethical reasons (i.e.
animal welfare). The findings suggest that most respondents determine whether a food they produce is “specialty” by the consumers to which it appeals, rather than the product itself. The consumers which are most likely to find specialty foods appealing are, therefore, those who choose food for value-based reasons. This suggests that for many consumers the purchasing of specialty food is a discretionary spend.
6.5.2 Identification as a specialty foods producer
The previous section showed that there are problems with the definition of the term “specialty foods”. Therefore, firms that do business in the Specialty Food sector do not necessarily consider themselves as specialty food producers. Respondents of the specialty foods survey were asked if they would consider themselves as a specialty food producer or if specialty foods
21 Source: www.ssfpa.net

Canada’s Specialty Food Industry
40
are part of their business. The definitions, with which the respondents were asked to identify themselves, were as follows:
a) My business is a specialty food producer. b) My business produces food, which happens to be considered specialty.
The following table represents the responses across the sectors. As is demonstrated, more producers and processors identified themselves as a business that produces some food that is considered a specialty than a specialty foods producer per se. A trend between the different sub-sectors is difficult to determine. However, more lamb and goat producers considered themselves specialty food producers. This is especially true in the case of goat. Most seafood producers and processors did not consider themselves a specialty food producer. This is probably based on the fact that the variety of products produced and processed is greater for seafood than it is for goat. Table 9: Self-identification of specialty food producers Industry level
A B Total responses
Buckwheat 2 3 5
Seafood* 1 6 7
Goats 4 2 6
Lamb 6 5 11
Pulses 2 7 9
Total 15 23 38
* Seafood west and east have been summarized into one category
The overall results suggest that most businesses do not consider specialty food to be fundamentally important to their operations, rather it is a market opportunity that they have exploited on an almost ad hoc basis. The reasons for this will be explored in detail later in the report. For now, it is suffice to say that two of the primary factors lying behind this attitude include financial risk and the overall nature of the external (enabling) environment in which their businesses operate.
6.5.3 Certifications used
Different certifications are used by producers and processors to verify certain product characteristics and identify a product as a specialty food product. Table 10 provides an overview of certifications that are used by the 5 studied sub-sectors. All product categories have some products that are certified as kosher and the second most used certification category is halal.

Canada’s Specialty Food Industry
41
Table 10: Certifications used to identify foods as “special” Chain List of Certifications
Buckwheat Kosher, Halal, Organic (Ecocert), gluten-free
(based on CFIA standard), HACCP (Hazard Analysis Critical Control Point) and GMP (Good Manufacturing Practices)
Pulses Kosher, Halal, Organic, gluten-free (based on CFIA standard), peanut-free and nut-free
Seafood* MSC (Marine Stewardship Council), Kosher, 100% Sulphite free, Omega 3 - value added program, BAP (Best Aquatic Practices) and traceability
Goats Halal certification, Kosher, lactose-free goats milk, the Goat Producers Association Code, e.g. KCR, informal declarations (not certifications) on drug and antibiotic-free
Lamb Certifications: Halal, Kosher, and European certification (CFI); Branding: pasture fed and the Ontario Lamb Logo
* Seafood west and east have been summarized into one category
Seafood products are certified with value added certifications, such as a source of Omega 3 or sulphite-free, in the case of further processed products. However, most seafood products are certified with some form of production certification, such as MSC (Marine Stewardship Council)22 for fisheries, or BAP (Best Aquatic Practices)23 for aquaculture. While these certifications are a way for producers to distinguish themselves, many of these certified products would not be considered a specialty food product.
6.5.4 Production Trends
Producers, processors and retailers along the investigated sub-sectors were asked about their perception of trends for their particular specialty food items in comparison to the “mainstream” items they are producing. The following Table 11 provides an overview of the specialty food products produced and processed in the respective chains. Even though participants were surveyed about a particular specialty food product (“main chain”), in most cases, they also produced a number of other products.
22
http://www.msc.org/ 23
http://www.gaalliance.org/bap/standards.php
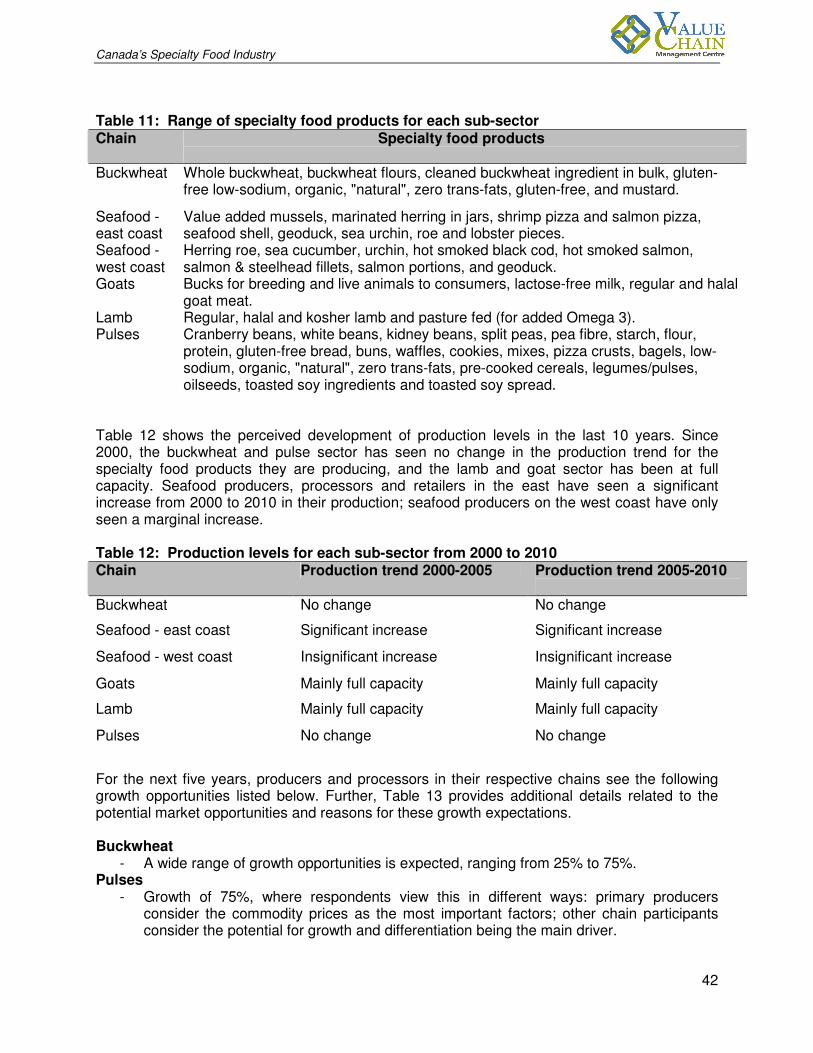
Canada’s Specialty Food Industry
42
Table 11: Range of specialty food products for each sub-sector Chain Specialty food products
Buckwheat Whole buckwheat, buckwheat flours, cleaned buckwheat ingredient in bulk, gluten-free low-sodium, organic, "natural", zero trans-fats, gluten-free, and mustard.
Seafood - east coast
Value added mussels, marinated herring in jars, shrimp pizza and salmon pizza, seafood shell, geoduck, sea urchin, roe and lobster pieces.
Seafood - west coast
Herring roe, sea cucumber, urchin, hot smoked black cod, hot smoked salmon, salmon & steelhead fillets, salmon portions, and geoduck.
Goats Bucks for breeding and live animals to consumers, lactose-free milk, regular and halal goat meat.
Lamb Regular, halal and kosher lamb and pasture fed (for added Omega 3). Pulses Cranberry beans, white beans, kidney beans, split peas, pea fibre, starch, flour,
protein, gluten-free bread, buns, waffles, cookies, mixes, pizza crusts, bagels, low-sodium, organic, "natural", zero trans-fats, pre-cooked cereals, legumes/pulses, oilseeds, toasted soy ingredients and toasted soy spread.
Table 12 shows the perceived development of production levels in the last 10 years. Since 2000, the buckwheat and pulse sector has seen no change in the production trend for the specialty food products they are producing, and the lamb and goat sector has been at full capacity. Seafood producers, processors and retailers in the east have seen a significant increase from 2000 to 2010 in their production; seafood producers on the west coast have only seen a marginal increase. Table 12: Production levels for each sub-sector from 2000 to 2010 Chain Production trend 2000-2005 Production trend 2005-2010
Buckwheat No change No change
Seafood - east coast Significant increase Significant increase
Seafood - west coast Insignificant increase Insignificant increase
Goats Mainly full capacity Mainly full capacity
Lamb Mainly full capacity Mainly full capacity
Pulses No change No change
For the next five years, producers and processors in their respective chains see the following growth opportunities listed below. Further, Table 13 provides additional details related to the potential market opportunities and reasons for these growth expectations. Buckwheat
- A wide range of growth opportunities is expected, ranging from 25% to 75%. Pulses
- Growth of 75%, where respondents view this in different ways: primary producers consider the commodity prices as the most important factors; other chain participants consider the potential for growth and differentiation being the main driver.

Canada’s Specialty Food Industry
43
Seafood
- Responses product specific. While some predict that the demand for herring roe will decrease, others see it increasing. The demand for value added products will increase because of the trend in providing more convenience products (heat-and-eat products).
Goat and Lamb - The respondents from both the goat and lab sectors expect a growth of 50+%. This
expectation is mainly based on rising immigration rates from nations where lamb and goat are consumed more commonly and in higher volumes per capita than has traditionally occurred in Canada. Specific details on the extent to which immigration may positively impact lamb consumption is described in the SWOT analysis (Section 7.2.1).
6.5.5 Market Opportunities
The majority of respondents believe that the market opportunities for specialty food will increase. As described in the forthcoming sections, many also believe that the current array of risks and challenges posed by attempting to exploit these opportunities outweigh many of the expected benefits. Therefore, they are not seeking to maximize the opportunities presented by a changing market. As can be seen below in table 13, many of the market opportunities are expected to flow from long-term trends and could therefore provide sustainable markets for Canada’s agri-food industry (as opposed to being a “fad” that lasts a few years, at best). Given the previously reported expectations for market growth, one cannot underestimate the importance of the industry’s ability and motivation to successfully respond to these market opportunities. Table 13: Market opportunities for each sub-sector Chain/role Greatest Market Opportunity
Reason
Buckwheat Healthier foods claims; sustainability claims; natural food claims; and local food claims
Consumers and rise in chronic health problems; and consumers seeking culinary experience
Pulses Healthier foods claims; sustainability and local claims; foods aimed at specific health conditions; and natural and organic
Aging population; and more concern about chronic diseases
Seafood - east coast
Domestic market Ageing population; people more concerned about healthy eating
Seafood - west coast
Domestic market for herring roe; and the Japanese market
Young people are encouraged to start eating roe, as well as the volume of the Japanese market; ageing population; and increased interest in healthy eating
Goats Domestic market ,especially Ontario; and health claims
Growing Muslim population and concentration in Ontario; diversity among consumers; and chefs promoting local producers
Lamb Domestic market: new immigrants, middle to higher income Canadians, especially Ontario
More immigrant Middle Eastern and European consumers; and more Canadians experiencing lamb when traveling overseas

Canada’s Specialty Food Industry
44
6.5.6 Sources of Information
Specialty food producers receive their market information and intelligence from a wide variety of sources. Table 14 lists the market information sources that are used by each of the sub-sectors. It should be pointed out that most of these sources are secondary, resulting in the data potentially being of questionable accuracy, aggregated, and outdated, and therefore of limited value from a commercial perspective. Table 14: Market Information Sources Chain Common source of information
Buckwheat Industry engagement (meetings, committees), industry associations, media (internet, T.V.), university and government research, trade journals, A.C. Nielsen, vendors, NSA Canada, USDA, Ag. Canada, research publications, and customers
Seafood - east coast
Customers, trade shows (San Francisco, New England, Anaheim, Belgium and Boston), trade magazines, and internet
Seafood - west coast
Customers and industry publications
Goats Word of mouth, government sources, overseas markets, customer requests and feedback, training, AC Nielson, magazines, universities, internet, and industry association updates
Lamb Word of mouth, auction prices, customers, vendors, industry associations, magazines, trade publications, grocery store reports, food market news, food shows, internet, customers, focus groups, on-line social networks, overseas markets, and Statistics Canada
Pulses Universities, magazines, internet, newspaper, government testing facilities, internet, journals, trade shows, industry organizations, marketplace, AC Neilson, internal sources and SPINS data, external (customers and market reports)
The ability and motivation of businesses (and overall sectors) to successfully respond to emerging market opportunities is intimately linked to the nature of the environment within which they operate. The report therefore moves to describing respondents’ perceptions of the external environment within which they operate. Particular attention is given to reporting factors that they believe will enable (or discourage) them from responding to these opportunities. 6.6 Sub-sector analysis This section begins by summarizing challenges which respondents stated as impacting their ability and motivation to take full advantage of emerging market opportunities. Directly reflecting respondents’ views, the challenges that they identified have been separated into barriers that prevent them from taking advantage of market opportunities, and risks which they said had the greatest impact on their business decisions. The next section then expands upon each of these factors in the context of each of the 6 subcategories. A combination of introductory overviews and industry-level value chain maps are used to describe the characteristics of each of the sub-sectors and detail why respondents said that they possess a particular viewpoint towards the present situation. Section 6.7 synthesizes the overall factors into a series of headline findings.

Canada’s Specialty Food Industry
45
6.6.1 Summary of Challenges
This section briefly presents perceived challenges that respondents stated to be negatively impacting their ability and motivation to fully exploit emerging market opportunities for specialty food. Presented in Figures 4 and 5 are the number of occasions on which each factor was raised by the respondents. Appendix B presents the same findings, though uses the Likert scoring system (where 1 was used to represent minor influence, and 5 was used to represent significant influence) to weigh each of the factors in terms of the extent to which respondents believe they will impact their future competitiveness and business decisions. Given the relatively small number of responses, the results are not statistically significant. They should therefore only be considered a guide.
6.6.1a Barriers to taking advantage of market opportunities
Shown below are the percentages of number of times that respondents mentioned the top 11 factors that limit their ability to take advantage of market opportunities in specialty food. While differences exist across each of the sub-sectors, a number of important correlations can immediately be identified. The greatest is the extent to which inconsistency (lack) in quality and supply is said to impact the success of the three largest sub-sectors analysed: pulses, goats and lamb. Figure 4: Challenges preventing businesses from fully exploiting market opportunities

Canada’s Specialty Food Industry
46
Of additional interest, is that the lack of infrastructure is not perceived to be an important factor limiting growth across any of the sub-sectors. The factors that determine the development of infrastructure (such as inter-provincial trade barriers and inconsistency in how production and food safety legislation is communicated and implemented) are viewed as having greater impact on the businesses which operate in the Specialty Food sector. These same factors were said to negatively impact businesses by creating a business environment not suited to supporting and enabling innovation, particularly in emerging sectors and markets. The same factors were also said to increase the impact that the international competitors have on the sector as a whole. This is not least due to importers not having to meet the same standards and requirements that are placed on the domestic industry, and the domestic industry often having limited to no access to a full array of pharmaceuticals and technology used by competing suppliers. These latter factors will be expanded upon in the chain maps (Section 6.5.3).
6.6.1b Risks That Have Greatest Impact on Business Decisions
Shown below in Figure 5 is the number of occasions that respondents stated a particular risk impacts their business decisions. As can be seen, seven risks in particular are associated with the Specialty Food sector. The most commonly cited risk relates to inconsistency in how government legislation is implemented and enforced, including differences across the provinces, and how government legislation increases risk through limiting smaller participants’ access to market. Government regulations, provincial and federal, are therefore viewed as having a direct impact on shaping the business environment. Among other issues, this leads to stakeholders expressing less interest in sourcing specialty food products. It also leads to market forces impacting their business decisions more than the respondents believed would otherwise occur. The results are shown as the percentage of respondents from each sub-sector who stated that a particular risk significantly impacted their business decisions. Figure 5: Risks that have greatest influence on business decisions for each sub-sector
Risks impacting business decisions occurring within each sub-sector

Canada’s Specialty Food Industry
47
6.6.2 Summarizing the Nature of Each Sub-sector
The following section describes concisely the nature of each of the three categories analysed during the research. Each description is followed by a value chain map. Graphically presenting the research results in this fashion enables a large body of information to be presented on one page. Each map shows where along the chain, factors impacting the sub-sectors’ ability and motivation to react to market opportunities emanate or influence decisions. They also identify factors impacting the overall chains’ performance.
6.6.2.1 Halal Certified Red Meat (Lamb and Goat) The research found that, for the most part, upstream suppliers (producers and processors) are smaller in the lamb and goat sectors than the beef sector, and that the current trend is for producers and processors to exit (or at least reduce their involvement) in the lamb and meat goat sector, rather than to expand. The general deduction is that the industry is tied to the current mindset that exists among many producers, and that current programs have a tendency to perpetuate rather than address challenges facing the industry’s long-term development. Another take away is the unintended consequences of the complex network of legislation and regulations that exist at the federal, provincial and municipal levels of government. A number of reasons are said to lie behind this present situation relating to industry culture. One is that many producer organizations are overseen by smaller (essentially hobby-style) and more conservative producers, who view the industry as needing to retain the status quo in order to protect the current price of domestic lamb. These same representatives are viewed as often lacking business skills or a business mindset, which impacts the policies that they develop and implement. Other cultural related factors said to be influencing the sectors’ success is that they are not viewed as traditional Canadian industries. Financial related factors impacting the sectors’ competitiveness are said to stem from a number of issues. They include legislative requirements, such as mandatory traceability for individual lambs and on-farm food safety programs, which place added costs and time constraints on producers who, for the most part, only produce a few hundred lambs annually. Additionally, because the lamb industry is not well understood or seen as an economically important sector, it was stated that municipal by-laws and government agencies are said to be less favorable to assisting the establishment of lamb operations versus beef or cropping operations. For those producers that do wish to expand, the existence of only a small high quality breeding stock is said to limit the speed and extent to which the national flock could be expanded. Other reasons said to shape the nature of Canada’s lamb and goat sectors include the fact that the jump from provincial to federal inspection is so great and expensive. Combined with limited supply, many processors are unable to access the critical mass of consistent lambs required to make investing in federally inspected processing an economically viable proposition. Yet not having federal inspection limits processors’ (and their suppliers’) market opportunities, primarily because large retailers are unwilling to deal with provincially inspected processors. The reasons for retailers’ reluctance to deal with provincially inspected processors include the challenges posed from dealing with multiple, uncoordinated small suppliers. They also view the inconsistencies that exist between the provinces’ food safety programs as creating potentially critical risks, which they cannot afford to take. The larger retailers are also fearful of becoming hindered by CFIA regulations (particularly those relating to interprovincial trade, labeling, or

Canada’s Specialty Food Industry
48
handling/ merchandizing) that, they say, are not applied with equal fervor among ethnic retailers versus ‘Canadian’ retailers. It should be noted that inconsistency in CFIA messaging and how inspectors interpret current regulations was raised as an issue by participants operating at all levels of the value chain. At the processor level, examples of inconsistency in applying CFIA regulations include inspectors reacting differently to situations that may or may not result in an animal being condemned and inspectors are clearly not acknowledging the commercial reality of business when conducting audits. At the producer level, examples of inconsistency included inspectors providing incorrect advice on the ear tags required for lambs and sheep, and the information they convey on import policies for breeder versus feeder livestock. Although inspectors primarily focus on finding fault with either processing equipment or record keeping after the fact, it would be very helpful if they suggested improvements going forward even though it is not their responsibility to specifically advise companies on how to comply with the regulations they are mandated to enforce. Perhaps AAFC could also help industry interact more effectively with CFIA in much the same way AAFC’s Pest Management Centre facilitates discussions with the Pest Management Regulatory Agency. Other demand-related factors shaping the lamb industry include a large proportion of the target market (Muslim immigrants) having lower than average incomes. The lack of a halal certification body that is recognized by the larger processors and retailers is also said to limit the market demand and opportunities for Canadian lamb. Those processors that slaughter lambs according to halal practices often sell uncertified halal lambs to smaller ethnic stores versus the mainstream chains, or sell to a ‘black market’, that, in some provinces, is said to account for 30% of overall lamb production. It was also stated that it is not just ‘physical’ factors or operations that are hampering the lamb and goat industry from exploiting the market for lamb and goat, which is thought to be increasing partly as a function of immigration. The present attitudes that exist across much of the industry (particularly at the producer level) are also said not to be conducive to significantly increasing lamb and goat production (halal or otherwise) in the near future. Attitudes said to hinder industry growth include the widely held assumption that increasing domestic lamb production would negatively impact lamb prices. This results in a general resistance to support an increase in lamb production, even though no objective data exists to show that Canadian lamb producers would suffer from such a development. In fact anecdotal evidence and previous research (Gooch & Moore, 2006; Gooch et al, 2007) suggests that the opposite could be true. As the factors impacting the lamb and goat chains (from an industry perspective) differ in certain respects, a map has been developed for each sub-sector. A primary difference facing the lamb versus goat sector is said to be due to the fact that a relatively higher supply and demand for lamb is placing a greater focus on improving the consistency of lambs and the overall sophistication of many value chain participants’ management capabilities. The primary challenge for the goat sector is establishing the building blocks of an industry believed to have considerable potential.

Canada’s Specialty Food Industry – Phase 3 draft report
49
Figure 6: Value Chain Map - Lamb

Canada’s Specialty Food Industry
50
Figure 7: Value Chain Map – Goat

Canada’s Specialty Food Industry – Phase 3 draft report
51
6.6.2.2 Gluten-Free (Buckwheat and Pulses) The value chain maps for pulses and buckwheat are depicted in Figures 8 and 9 respectively. In general, the inference is that this market is tied very much to the consumer seeking healthier foods and non-animal protein in their diet. However, the market for buckwheat in particular is limited by a lack of consumer awareness and market intelligence. Both crops are limited by a lack of funding to cover the R&D and capital costs required. The supply of gluten-free products is impacted by how current suppliers’ motivation to expand the sector (and potential suppliers’ motivation to enter the sector) is being impacted by a series of factors (starting with the most influential): • competing against cheaper imports which are not subject to the same compliance
standards as domestically produced food; • cost of purchasing specialized equipment; • current inconsistencies in quality and the lack of guaranteed volumes; and • differences in labelling regulations compared to the US discourage mainstream retailers
from investing greater effort into working with suppliers to establish a broader category for gluten-free products.
Processing into gluten-free products therefore incurs added costs. The lack of a recognised industry champion is also impacting the industry’s willingness to seriously consider buckwheat as an ingredient, particularly given that better known alternatives (e.g. varieties of rice). All but one of the processors produces ~90-100% specialty products; the one exception is an ingredient producer for whom about 50% of their products are specialty. All of the respondents therefore strongly identify themselves as producers of specialty foods. The certifications they focus on are gluten-free, nut-free, peanut-free, and kosher, halal, and organic. All but one, the specialty ingredient processor, sells the majority of their products in Canada, with a small amount exported by several to the US and parts of Asia. All but two had very little idea of how large the market was, but knew that it was growing somewhat faster than the mainstream grocery market. One estimated that the domestic market for gluten-free could be $500 million and the export markets as much as $3-5 billion, with growth in both being in the 10-12% range. Another estimated the domestic market to be as high as $1 billion and growing as much as 20% per year. The growth will continue to come from two key areas. The first is the growing awareness of the connection between diet and the main chronic illnesses present in the developed economies. This will mean products targeted at health will grow, e.g. gluten-free, allergy-free, etc. Second, there is a growing segment of the population that is decreasing its meat consumption due to concerns about the impact on health of meat-based fats and protein, concerns about the environmental impact of animal production, and concerns about humane treatment of animals. As the factors impacting the pulse and buckwheat chains (from an industry perspective) differ in certain respects, a map has been developed for each sub-sector. Not too dissimilar to the differences facing the lamb versus goat sectors, the primary challenge said to be facing the pulse sector is said to be improving quality, though also strategically aligning product development with consumer demands. The primary challenge for the buckwheat sector is establishing the building blocks of an industry where many question its very potential.

Canada’s Specialty Food Industry – Phase 3 draft report
52
Figure 8: Value Chain Map - Pulses

Canada’s Specialty Food Industry – Phase 3 draft report
53
Figure 9: Value Chain Map – Buckwheat

Canada’s Specialty Food Industry – Phase 3 draft report
54
6.6.2.3 Seafood (East Coast and West Coast) Seafood products are different from the other value chains in that they mainly serve the export market and therefore face global market competition and conditions. All other value chains evaluated in this project are based on agri-food products, where a great amount of production is destined for the domestic market. The general assumption is that Canada has a unique production environment for specialty seafood products. Canada’s specialty seafood products for the west coast include geoduck, sea urchin, sea cucumber, roe and roe products (salmon and herring roe). The east coast of Canada produces and harvests relatively more mussels and shellfish (surf clam). Despite the wide variety of seafood products available in Canada, there is still a lack of consumer knowledge about their preparation. One example investigated was herring roe, where very little is consumed domestically and almost everything is exported, the major export destination being Japan. Kazunoko (herring roe) is a very expensive delicacy for special occasions in Japan. However, processors hope that the younger generation of Japanese origin will start eating roe products other than just for special occasions. With the involvement of the Canadian Kazunoko Association, the Canadian government is funding the advertisement of Kazunoko in export markets (Japan). The Kazunoko Association is also supporting nutritional research to help ease a gradual transition from a seasonal celebratory product to more everyday consumption. Since Canada’s specialty seafood producers mainly serve export markets, the factors that prevent them from taking advantage of opportunities are global in nature, such as the US exchange rate, competition with countries that have cheaper labour, government subsidies and less stringent regulations in place. ‘Unfair’ competition is a main concern. Chile and China are main exporters of seafood products (processed from fisheries and aquaculture). Many expressed concern that the regulations are not as strict in these countries, with regards to production methods (especially aquaculture). As a consequence, products can be produced much cheaper and in greater amounts. Lack of available inputs and the cost of inputs was another commonly cited problem. Challenges include expensive fishery quotas and problems in aquaculture with site licenses, which is especially a problem in British Columbia. Alaska is a big competitor in the herring roe market as Alaskan fishermen do not have the same quota problem as in Canada and the fishing grounds are bigger in general. The same is true for Russia. Another significant difference between the seafood and the other sub-sectors is that, in all but a few exceptions, respondents viewed the CFIA as their partner. The policy environment in which the harvest and production of seafood is taking place makes a constant and expanding supply for processors difficult to access (restricted aquaculture expansion in Canada). The need to compete against cheaper imports which are not subject to the same compliance standards as domestically produced food was especially an issue in the shellfish market. Many replied that the CFIA provides valuable services in accessing export markets by issuing export certificates. However, in some cases processors mentioned that CFIA staff does not seem to have a clear understanding about which regulations are to be followed, and how they should be implemented. Given the relatively small number of responses overall and the range of products produced by all levels of the value chain (at an industry level), the findings are presented as one combined value chain map.

Canada’s Specialty Food Industry – Phase 3 draft report
55
Figure 10: Value Chain Map – Seafood

Canada’s Specialty Food Industry – Phase 3 draft report
56
6.7 Summary of findings The following section summarizes findings from across the three categories (and six sub-sectors). It begins by describing factors that the research identified as impacting the ability and motivation of businesses involved in the wider Specialty Food sector to exploit emerging market opportunities. The summary concludes by describing respondents’ suggestions on what Governments could do to assist them to address current challenges thereby increasing their desire and motivation to exploit emerging market opportunities. The subsequent section (7) presents the findings from this overall section in the form of a SWOT analysis.
6.7.1 Agriculture vs. Seafood
An interesting finding is that overall, respondents from the agri-food sub-sectors view themselves as facing greater challenges than those involved in the seafood sub-sector. While the extent to which the sub-sectors focus on the domestic versus export markets undoubtedly plays a role in this difference in viewpoint, other factors that appear to be at play include:
1. Seafood has fewer links in the chain: a. Related to factor #1: in agri-food, each link along the value chain often has
competing agendas and is impacted by provincial and federal regulations in differing ways. This increases the level of risk that many agri-food businesses associate with entering the Specialty Food sector or expanding their operations.
2. Seafood suppliers and processors have limited need to invest in specialized equipment. 3. Seafood tends to supply markets that are more aware of the products produced,
resulting in high demand: a. Demand in foreign markets is buttressed by Canadian seafood having
established an international reputation for quality and environmental stewardship. 4. Seafood does not receive the same level of income support at the primary production
level as agri-food. This has led to greater emphasis being placed on succeeding through marketing and business management and proactively working with other links in the value chain to exploit market opportunities.
6.7.2 Findings related to specific factors
The following section identifies factors found to be common across multiple sub-sectors. These factors impact businesses’ ability and motivation to exploit market opportunities for specialty food. They therefore negatively impact the competitiveness of the sub-sectors and, potentially, the overall Specialty Food sector itself. Factor 1: CFIA CFIA was criticized by the majority of respondents. No one criticized the CFIA for the role it needs to play in maintaining a safe food system. Rather, the criticisms centered on a series of factors related to its defensive nature, along with its slow, reactionary and inconsistent approach to dealing with industry issues and questions posed by managers of commercial businesses. Other commonly raised issues related to CFIA staff members’ inconsistency in interpreting, communicating and implementing its own regulations. The only respondents who viewed CFIA as a partner were seafood respondents in relation to exportation; though a number of the same respondents were also critical of CFIA’s domestic operations. These criticisms again centered on CFIA lacking a business-friendly culture, often

Canada’s Specialty Food Industry
57
being slow and reactive in its dealings with industry and showing inconsistency in staff performance. Factor 2: Lack of management capabilities Lack of management capabilities was mentioned by respondents from a number of sectors and related in particular to the agri-food industry, though also, to some extent, to seafood. Capability is said to be lacking in terms of managing quality. This leads to inconsistencies that unnecessarily increase overall production costs. They also increase individual businesses’ exposure to financial risk. Respondents from the goat sector, followed by those from the lamb sector, were most vocal in the extent to which they believed that their opportunities were being negatively impacted by an overall lack of management capabilities. This situation was said to be particularly acute among primary producers. Factor 3: Provincial versus federal regulations Inconsistencies in provincial versus federal regulations were cited as a factor impacting the competitiveness of every sub-sector to differing degrees. While the challenges are said to be most acute in the lamb and goat sectors, respondents from all sectors expressed that the complex regulatory environment creates inter-provincial trade barriers that discourage innovation. They also either discourage, or actually prevent, retailers and foodservice operators from marketing to their consumer base. An overall belief therefore exists that the current regulatory situation limits market opportunities for specialty food, much of which is produced by smaller operators with limited resources, and that it creates unnecessary costs. Another perspective on provincial versus federal regulations and policies came from those respondents (over 50% overall) who stated that many programs and policies were focused on appealing to the broader producer base, rather than assisting industry leaders to exploit market opportunities. This sentiment was particularly strong among respondents from agri-food sectors. Factor 4: Lack of a single “go-to-point” for information A number of the respondents stated that the lack of a single “go-to-point” for accurate and timely information on legislation and regularity requirements discouraged them from investing greater effort and resources into exploiting what they believed to be emerging market opportunities. Factor 5: Lack of market intelligence The lack of detailed objective information on the domestic market opportunities for specialty food was cited by the majority of respondents as a factor that negatively impacts their motivation and ability to respond to opportunities that they believe exist. Retail and foodservice respondents, not only suppliers, mentioned that having greater access to detailed accurate and objective information on market opportunities for specialty food would encourage them to seriously examine market opportunities sooner. Many also said that having greater surety about market opportunities could be expected to result in them being more prepared to invest in efforts sooner and more strategically than is presently the case. Factor 6: Human resources Respondents from all six sub-sectors and each level of the chains that operate in those sub-sectors stated that a current lack of human resources impacted their business decisions and discouraged the broader sectors from fully reacting to market opportunities. Many producers cited the difficulty they have in securing trained and capable staff. So too did processors and retailers, though generally to a lesser degree than primary producers.

Canada’s Specialty Food Industry
58
6.7.3 Potential role of Governments
Listed below are the most common responses received from respondents on the role that Government could play in assisting businesses to address the challenges described. The first two suggestions relate to the overall industry; while the others are listed under each category. Overall CFIA CFIA should be more accountable to industry, more business minded, and to influence the cultural changes necessary to make this happen. Many respondents believe that this could result in the organization being more focused on proactively serving the needs of businesses that wish to exploit domestic market opportunities. It is also felt that this change would help ensure that CFIA takes a more pragmatic approach to developing regulations and a more consistent approach to interpreting and then implementing regulations. Provincial versus Federal legislation The current array of differences that exist between provincial and federal policies and legislation should be reduced. Many respondents believe that this would result in fewer inter-provincial barriers to trade and would open up considerable market opportunities in the Specialty Food sector. They also believe that it would both motivate and enable businesses, particularly those from the agri-food sectors, to work more ardently to exploit emerging market opportunities. Specific sub-sectors Lamb and goat
• Work with industry to develop programs and systems that enable interested businesses to address the current negative impact that the federal versus provincial inspection system has on enabling and motivating small to medium processors to access mainstream markets.
• Motivate farmers to undertake business management training, perhaps through linking their participation in education programs to greater eligibility for government programs or tax incentives.
Gluten-free
• Provide funding assistance to improve consumer awareness of the health benefits of gluten-free products.
• Provide more support (e.g. SR&ED type programs) for product development and capital investment assistance.
• Strengthen the enforcement of regulations designed to ensure imported products comply with Canadian label requirements, especially products arriving from China.
Seafood
• Ensure a sustainable supply of fish (help alleviate problems with acquiring site licenses for aquaculture).
• Support small seafood processing companies to implement food safety, such as HACCP and traceability systems.
• Promote the sustainability of Canada’s fisheries and aquaculture to educate consumers. • Promote Canadian seafood products in export markets.
• Be more diligent in enforcing compliance with label requirements on imported products.

Canada’s Specialty Food Industry
59
7 SWOT Analysis This section presents the results of a SWOT analysis conducted on the production capacity, stakeholder collaboration and growth opportunities within each of the sub-sectors and the Specialty Food sector overall. The section begins by describing the purpose of the SWOT analysis. This is followed by Section 7.2, which presents SWOTs for each of the sub-categories. Section 7.3 presents a SWOT for the overall Specialty Food sector. Once the SWOTs have been presented, the following questions will be answered:
1. How can the Specialty Food sector build on its strengths and overcome its weaknesses to take advantage of the opportunities that exist?
2. What needs to be done by businesses in the industry, by industry organizations, and/or by government, in order for specialty food businesses to succeed?
The answers to these questions are presented as a series of recommendations for how Government and industry stakeholders can work towards increasing the competitiveness of the Canadian Specialty Food sector: 7.1 SWOT: Objective To conduct a SWOT analysis, the analysis must be oriented to a specific objective or desired end state. The objective developed for this analysis is as follows:
“Increase the potential to build the Canadian food industry by focusing on specialty food niches with high growth potential and opportunity for differentiation.”
The SWOT analysis followed the following framework:
Potential to Promote Objective
Potential to Hinder Objective
External Factors OPPORTUNITIES THREATS
Internal Factors STRENGTHS WEAKNESSES
The external factors are the opportunities and threats over which the industry (all stakeholders, including government) has no control. The opportunities are external factors which could help to achieve the objective, whereas the threats are external factors which could hinder achieving the objective.
Strengths and weaknesses are factors internal to Canada’s Specialty Food sector and over which some control and influence may be exerted. The strengths are internal factors that could help to achieve the objective and conversely the weaknesses are internal factors which could hinder achieving the objective. The SWOT analysis will help to identify areas of development that will help to achieve the objective of growing the Specialty Food sector in Canada.

Canada’s Specialty Food Industry
60
The SWOT analysis was conducted on a product chain basis and was then generalized to find common SWOTs for the Canada’s Specialty Food sector in its entirety. The SWOT starts with the external analysis (opportunities and threats) because, as stated above, these are factors outside of the sector’s control. The following part lists the result of the SWOT analysis for each value chain. 7.2 Sub-sector SWOTs
7.2.1 Lamb
Opportunities - Growing market through immigration
o The literature review illustrated the extent to which immigration is reshaping the food market overall. A specific example is how immigration is likely to significantly increase demand for lamb. Shown below in Table 15 is a list of different nations’ per capita consumption of lamb (kg/per person) compared to Canadian consumption in 2006. While not shown on this list, significant areas of China are higher consumers of lamb than even Western Samoa. Shown in Figure 11 is the estimated number of total immigrants from each of these same nations, overall and by the primary lamb consuming countries. Add to this the number of Chinese and Asian immigrants, immigration can be seen as having a distinct influence on expanding the domestic market opportunities for lamb.
Table 15: Consumption of sheep meat - top ten consuming countries and Canada (2006)
Country Per capita sheep meat consumption, kg/person
Western Samoa 20
Kuwait 17.2
Cyprus 15.8
Australia 14.6
United Arabic Emirates 12.8
Greece 12.4
Fiji 11.9
New Zealand 11.8
Iran 6.6
Saudi Arabia 6.4
Canada 1
Source: Meat and wool New Zealand, 2006

Canada’s Specialty Food Industry
61
0
10,000
20,000
30,000
40,000
50,000
60,000
70,000
80,000
90,000
Canada ON QU BC AB
Greece
Iran
Fiji
Australia
Saudi Arabia
Kuwait
New Zealand
United Arab Emirates
Cyprus
Figure 11: Ethnicity in Canada from top lamb consuming countries
- Culinary experience
o A second important driver of increased consumption of lamb is growing consumer interest in viewing food (and its preparation) as an experience. Previous GMC research shows lamb is benefiting from a combination of the increasing influence of food celebrities and lamb being viewed by many as an experiential meal consumed on special occasions rather than an ‘everyday’ food.
Threats - Economic downturn
o Previous studies by GMC/VCMC (Gooch et al, 2006; Gooch et al, 2009) suggest that two closely associated factors could result in lamb being more negatively impacted by the economic downturn than, for example, pork or chicken. The first is that lamb is viewed as a relatively expensive protein which is often purchased as a discretionary rather than a staple. The second is that, compared to consumption rates for other meats, lamb is relatively more likely to be consumed in restaurants rather than at home. The short to medium-term demand for lamb could therefore be negatively impacted by consumers who are changing their spending habits—either by trending away from restaurants in favour of more at-home consumption, or by replacing exotic meats with cheaper alternatives.
- Lower cost imports o Lower cost imports are coming into Canada from larger suppliers, including New
Zealand, Australia and the Americas. While overall supply of lamb is tightening, resulting in a steady increase in prices, Canadian lamb remains a higher priced item than many imports. While New Zealand lamb has historically been the leading importer in terms of domestic market share, Australian production and

Canada’s Specialty Food Industry
62
imports appear likely to continue increasing. A number of respondents also believed that the potential exists for the Americas to become an increasingly competitive supplier of lower cost imports. Nations mentioned included the US, who already supplies live and processed lamb into Canada, and countries such as Mexico, mainly due to their governments having invested in the lamb sector.
o Global prices for grain and other commodities will continue to impact the industry through raising feed and other input costs. A number of respondents also noted that continued high prices for grains and oilseeds could encourage current producers to focus on cropping rather than lamb production, and discourage those who may be considering a move into lamb production.
- Capable and sophisticated competitors o International competitors whose stakeholders are proactively working together
from a systems perspective to continually enhance their technological and management capabilities, leading to the existence of sophisticated and capable market focused value chains..
Strengths - Capacity to expand
o With domestic production being approximately 46 percent less than market demand, the Canadian lamb industry has considerable capacity for growth.
o Producers that are exiting the pork industry often possess building and infrastructure that are said to be ideal for raising sheep and lambs.
o The geographic area required to produce lambs and the environmental impact are both said to be less than other livestock.
o The hardiness of some breeds in particular means that Canada’s harsh climate is often not a limiting factor.
o That the potential profit margins for sheep and lambs are said to be higher than other non-supply managed sectors of the meat industry, should increase many producers’ willingness to start producing lamb.
- Excess processing capacity o Canada enjoys excess lamb processing capacity, although the majority of this is
not federally inspected, ‘state of the art’, or located close to the largest markets (Ontario and Quebec).
- Skilled managers throughout the chain o The industry is comprised of pockets of innovative, capable and forward thinking
individuals. However, due to the overall nature of the industry often lacking a business mindset, many of these individuals work in isolation and do not receive support that, if given, would provide them with greater opportunities and lead to a larger, more innovative and market-responsive industry.
Weaknesses
- Lack of supply o The vast majority of lamb is sold through mainstream retailers, followed by
mainstream and corporate foodservice (GMC, 2006, 2009). A fundamental requirement for securing access to these markets is for suppliers to possess the critical mass necessary to provide a consistent supply of high quality, federally inspected products in the volumes required. Without this capability, the domestic lamb industry will find it extremely difficult to directly compete against capable importers and alternative meats and fully exploit the market opportunities that exist for Canadian lamb. The lack of critical mass also extends to the size of the breeding flock and the availability of premium livestock.

Canada’s Specialty Food Industry
63
- Lack of management skills and training support
o Partly related to the small size of many sheep operations, the flock and business management skills of many producers is said to trail those of more established sectors. This is said to result in less capable and ‘business minded’ producers compared to other sectors. It is also said to impact the capability and strength of organizations that represent producers’ interests and play a critical role in enabling/championing the lamb industry’s long-term future.
- Inconsistent quality o The ability to produce consistent high quality is critical to building market share
profitably. It is also critical to reducing production, processing, marketing and distribution costs. A number of the respondents pointed to the wide range of breeds, variable sizes of operations, and variation in production methods as negatively impacting the industry’s ability to build customer and consumer loyalty through cost effectively producing consistent high quality lamb.
- Inconsistent quantity of supply o Inconsistent and limited supply is discouraging processors’ willingness to invest
in modern, federally inspected processing facilities. This, in turn, lessens the domestic industry’s ability to produce consistently high quality lamb at competitive prices.
- Small scale independently minded producers (entrepreneurial attitude) o Put in other words: industry participants would like to do things on their own.
There is a perception that the majority of Canadian lamb producers have not yet come to the realization that the industry’s long-term future rests on them working together from a production perspective, and with downstream elements of the chain from a marketing perspective.
- Regulation regarding animal health products o Canadian lamb producers are currently unable to secure medicines that enable
producers in other jurisdictions (e.g. US, NZ, UK and Australia) to cost-effectively produce lamb. The combined effects of current legislation surrounding the registration of veterinary medicines and the size of the Canadian flock (meaning that pharmaceutical companies do not consider that the process required to register medicines represents a viable investment option, given the limited size of the potential market), are said to place Canadian producers at a distinct disadvantage and be hampering the industry’s development.
- Federal versus provincial inspection o Even though not being federally inspected severely limits processors’ market
opportunities, the cost of achieving and then maintaining federal accreditation is said to be sufficiently high that the majority of Canadian lamb continues to be processed in provincially inspected plants. Lamb is said to be one of two sectors (the other being goat) of the Canadian meat industry whose market opportunities have been severely limited by this fact. The present inspection system is, therefore, said to be more of an impediment than a benefit to the industry’s long-term development.
- Uncertified halal produced lamb o Related to the size of many processing facilities, and the lack of a well-
recognised halal certification body, it was stated that considerably more lamb is produced according to halal protocols than is officially certified ‘halal’. Processors sell this type of lamb directly to Muslims or to independent ethnic stores, where certifications are not required.
- CFIA

Canada’s Specialty Food Industry
64
o Major retailers consider that the current CFIA inspection system places them at a disadvantage compared to independent retailers. They believe that CFIA inspectors scrutinize their operations more than those of smaller (often ethnic), competitors. This reduces their willingness to source products through processors that are not federally inspected and/or test market products with which regulators may not be readily familiar.
7.2.2 Goats (meat)
Opportunities - Growing market through immigration
o Similar to lamb, several respondents stated that an increasing percentage of the overall immigrants arriving in Canada are familiar with goat as a meal and menu item. This includes immigrants from the Caribbean and Middle East.
- Ethnic food experience o Increasingly, goat dishes are being featured by ethnic restaurants. This could
increase traditional Canadians’ familiarity with, and acceptance of, goat as an alternative meat, potentially increasing its long-term demand.
Threat - Import/export restrictions
o These are largely due to the limited amount of information which exists in relation to the Canadian goat industry, including a lack of objective insights surrounding the potential for phytosanitary issues to arise.
Strength - Capacity to expand
o Similar to lambs, an initial perusal of the Canadian agricultural industry, particularly the extent to which the goat milk sector has expanded over the last few years, would suggest that the capacity exists to expand the Canadian goat meat industry too.
Weaknesses
- Lack of markets for by-products o History shows that developing a viable industry relies on developing
economically viable markets for the entire product, often through the production of direct and by-products. A challenge facing the goat industry is said to be a lack of viable markets for hide and other products, not least because it increases the overall processing costs and reduces producers’ revenues.
- Breeds o The lack of proven genetics for meat goats, and the identification of management
systems suited to using those same genetics to produce consistently high quality meat, is also said to be a factor that negatively impacts the establishment of a viable goat meat industry.
- Lack of market intelligence o Currently a lack of knowledge regarding what attributes the end market’s desire
lessens the industry’s ability to develop solutions to these challenges, including how and where it can capture added value along the entire value chain by implementing changes that will enable participants to increase their profitability.
- Retail competition

Canada’s Specialty Food Industry
65
o The level of competition that has developed over recent years, partly due to the entrance of new competitors and as a result of the economic downturn, has led to retail executives being risk adverse. Retailers are therefore increasingly wary of investing resources to develop a segment of the market, unless their likely success has already been proven. There is limited interest among retailers to support goat producers and processors to develop a market for Canadian goat meat, because goat is still very much an emerging opportunity with few proven opportunities in the mainstream market.
- Lack of skills throughout the chain o A lack of capability along the value chain is said to have negatively impacted
producers’ and processors’ abilities and motivation to increase the production of goat meat in Canada. This is said to be a key factor as to why many goat producers are either exiting the industry after only a short period of time (leading to much of the industry being comprised of producers with limited management capability and commitment to supporting the industry’s long-term development) or transferring to dairy (a sector that appears to offer producers a more dependable future).
- Lack of critical mass o A lack of critical mass leads to limited processing capability and demand from
retailers. A limited dependable supply of goat meat has resulted in only a limited infrastructure being developed to process goats, particularly that which is federally inspected. A lack of federally inspected goat meat, in turn, discourages retailers from exploring market opportunities for goat.
7.2.3 Buckwheat
Opportunities - Healthier
o There are a number of medical conditions that are aggravated by gluten. Celiac disease is the leading one and has been diagnosed in about 1% of the population in Canada (although many researchers claim it is as high as 2%, but undiagnosed). There are also other types of gluten intolerances and the percentage of the population affected could be as high as 5% to 7%. As buckwheat is gluten-free, it is safe for consumption by people suffering from these conditions.
- Culinary experience o In these times, the majority of people have become much more cosmopolitan in
their taste in foods and eat a much wider variety of foods than just a generation or two ago. Buckwheat is a creative addition to many kinds of baked goods and cereals that adds a new flavour and texture which is sought by many consumers.
- Ethnic o Buckwheat is very common in the diets of many ethnic populations around the
globe, with the greatest concentration being in Chinese, Korean, and Japanese cuisines. It is also a common part of the diets of Russia, many parts of Eastern Europe, and the countries of Central Asia, as well as in the South Asian diet. With Canada being one of the most ethnically diverse countries in the world, this means there is good market potential for buckwheat domestically, as well as in certain export markets.
- Exports

Canada’s Specialty Food Industry
66
o Again, the countries named above, while growing much of their own buckwheat, also provide export potential for Canadian companies. In addition, other world markets are also looking for variety and new types of foods, such as Latin America or the Caribbean.
Threats - Pulses are a major competitor
o Pulses is the other category of foods that meet the health demands of those with gluten intolerances as they are also gluten-free. They also have an ethnic appeal, but to slightly different ethnic groups, e.g. Middle Eastern. They are more extensively grown in Canada, and therefore, more available.
- International competition o While Canada exports some of its buckwheat production, Canada also imports
buckwheat. China is the largest exporter of buckwheat in the world with production close to ten times that of Canada. Growth in demand in Canada could lead to growth in imports from China in particular.
- Alternative better known grains o While many consumers are looking for variety and new types of foods in their
diets, it should be remembered that a high percentage of consumers are not so inclined. These consumers seek products that are familiar to them, and unless they have a gluten intolerance, are from certain ethnic groups, or are looking for new variety, they may choose to stay with the grains with which they are familiar (e.g. such as wheat, oats, barley and rye).
Strength - Infrastructure
o While the Canadian market for buckwheat is still relatively small, there are millers in Canada that have the capability to mill buckwheat into flour. There is excess capacity in many of these specialty milling operations that would allow the growth of the market based on Canadian production.
o At the further processor level, there are also a number of processors, especially in the baking industry, that have the innovative and production capacity to produce specialty baked goods from buckwheat, but are not doing so at this point because the market is still a very small niche.
Weaknesses
- Lack of consumer knowledge/awareness o Despite its potential health benefits, buckwheat is generally “ignored” by
Canadian consumers (Mazurkevich, 2010). o Although Canada is a more diverse society than many other areas of the world,
there is still a general lack of knowledge about buckwheat and its culinary/sensory attributes and its health benefits. There is no doubt that this keeps some consumers from trying buckwheat-based products.
- No visible champion o Buckwheat is not a grain, nor a pulse, and is thus not promoted by the grain
grower groups and pulse grower groups. Likewise, the milling and baking industries see it as a small niche that they do not promote to any degree. This has caused some growers to move away from buckwheat as a crop. One or two visionary companies, perhaps aligned with a group like the Specialty Crops Association, may be able to create a breakthrough in buckwheat demand.

Canada’s Specialty Food Industry
67
7.2.4 Pulses
Opportunities - Healthier foods
o Pulses have a number of healthy attributes. They are high in protein, high in fibre and low in fats, as well as being gluten-free. This makes them a good addition to most consumers’ diets, especially in developed countries like Canada, where many chronic health conditions are brought on by high fat, low fibre diets. This makes pulse crops (peas, beans, lentils and chickpeas) highly desirable. They are fairly familiar to most consumers and therefore have found an opportune market base on which to be built.
- Meat protein alternative o In recent years, there has been a negative focus on animal agriculture from two
aspects in particular. The first is that livestock agriculture is viewed by certain activists and NGOs as negatively impacting the environmental. The second is a concern that meat contributes to many of the chronic health conditions prevalent in Canada. These factors have caused some consumers to begin avoiding meat in their diets and seek alternative sources of protein, such as pulses.
- Ethnic opportunities o There are certain ethnic groups that are used to having pulses, especially
chickpeas or lentils, as a mainstay of their diet. This would include people of Middle Eastern descent (Arabs, Turks and Persians) as well as South Asians. Since these groups are increasing in number in Canada, there is an opportunity to build the market for pulses.
Threat - Lack of consumer awareness
o There are a large number of consumers who are unaware of the health benefits of pulses and are not used to eating them as a normal part of their diet. This is especially true of consumers who eat a high level of meat in their diet.
Strengths - Crops are well adopted to Canadian climate
o They are not long-season crops. In particular, white and coloured beans, chickpeas and lentils are easily grown in Canada across a variety of regions.
- Opportunities to grow more o There is a growing capacity to increase production on which growers could
capitalize if the consumer demand can be increased to levels requiring such additional production.
- Strong industry support o Pulses Canada is focused on pulses of all types, and according to the
stakeholder input, is successful in promoting pulses to the processing industry and to consumers, as well as maintaining the interest of growers. This is somewhat offset by the lack of focus on pulses at the further processing level since the types of processed products cross a number of sectors (e.g. baked goods, complex prepared meals, etc.), where pulses are relatively minor ingredients.
Weaknesses - Lack of coordination in the value chain

Canada’s Specialty Food Industry
68
o Lack of coordination refers particularly to the processor level. As indicated above, other than at the producer level, there is no one particular group or groups represented by an association that is focused on pulses. Unlike the soybean category, where the membership organization, SoyFoods Canada has been established, nothing similar exists in the pulse category.
- Processing o There are several processors of pulses in Canada that produce flours (e.g. pea,
chickpea, bean) and fractions like pea fibre, starch and protein. The manufacturers include companies Parrheim Foods, NutriPea, Best Cooking Pulses, Diefenbaker Seeds and more. However, it was indicated that if the market were to grow quickly, new processing capacity would need to be added, requiring a fairly significant investment that companies may not be willing to endure. Left unaddressed, this may lead to increased imports of these products.
7.2.5 Seafood
Opportunity - Growing consumer demand
o Growing consumer demand for seafood products refers to international and domestic demand. Internationally, new export markets are continuously discovered and existing markets expanded for Canadian seafood products. For example, the Canadian Pacific Kazunoko Association24 has received funding from AAFC to promote Canadian-produced Kazunoko with a special emphasis on Japan. Canada’s products have a reputation for high quality in many export markets. Seafood is often seen as an alternative to meat and health benefits, such as the presence of Omega 3 in fish, are now well documented. Domestically, as Canadian consumers grow older, they are also becoming more health conscious thereby increasing the opportunity for the fish industry to capitalize on this demographic.
Threats - Competition from low cost countries
o Canadian seafood specialty products face competition from countries that have less stringent regulatory requirements, such as China and Chile.
- Export markets o The evaluated sub-sectors for seafood are different from the other sub-sectors
examined as most of these sub-sectors’ products are exported. Hence, seafood processors face the world market and are therefore faced with the volatility of the exchange rate. The uncertainty of the markets is also increased by other unforeseen events, such as the recent earthquake in Japan, as Japan is the major export market for Canadian Kazunoko.
Strengths
- CFIA
24
http://www4.agr.gc.ca/AAFC-AAC/display-afficher.do?id=1204743938126&lang=eng

Canada’s Specialty Food Industry
69
o As a great amount of Canada’s seafood products are exported to other countries, the CFIA is a partner to seafood processors as the agency provides export licenses.
- Sector support o A wide array of producer and processor associations is available for marine
specialty seafood products and aquaculture specialty products on a provincial and federal basis25.
Weaknesses
- Lack of supply o A lack of supply was identified for both, Fishing quotas are expensive in Canada.
Aquaculture also produces specialty seafood products. However, the expansion of aquaculture sites is difficult because of environmental regulations and regulatory difficulties in obtaining site licenses for new and expanding firms.
- Lack of coordination in the value chain o Quality of the products received from fisheries lacks consistency as fishermen
are paid based on quantity. - High costs of food safety certification
o As was mentioned in reference to the other sub-sectors, the high costs of initial food safety system implementation and their maintenance represent a burden for smaller processors and producers.
- CFIA viewed as hindering development of the domestic market o While the CFIA was mentioned many times as being a valued supporter in the
exportation of seafood products, it was also mentioned that the current CFIA inspection system places processors and major retailers at a disadvantage in the domestic market because of excessive labelling requirements and inspections. This is said to limit major retailers’ willingness to list products with which they are unfamiliar, resulting in fewer domestic market opportunities for suppliers.
- Lack of consumer knowledge/awareness o Although Canada is a more diverse society than many other areas of the world,
some specialty seafood products are still unknown to the general public. However, there are also some products that do not appeal to the general consumer, which actually makes the product a speciality item (e.g. geoduck, sea cucumber, etc.). Even for more well-known seafood species, such as sablefish (known as “black cod” on the east coast), there is still a general lack of knowledge regarding how seafood products can be prepared.
25
Examples include: http://www.bcseafoodalliance.com/BCSA/BCSA_MEMBERS.html http://www.fisheriescouncil.ca/page.cfm?ID=2 http://seafoodproducers.org/members.shtml

Canada’s Specialty Food Industry
70
7.3 Combined (Generalized) SWOT While some opportunities, threats, strengths and weaknesses are particular to the respective sub-sectors, some generalizations can be drawn. The following section summarizes the SWOT results for the general Specialty Food sector. Specialty foods producers and processors distinguish themselves from the mainstream through their inherent innovative approaches. As the specialty food sector is an emerging market segment and therefore closer to the forefront of industry development, legislative and regulative considerations may be more prevalent among those operating in the Specialty Food sector versus those operating in traditional sectors.
Opportunity - Market growth potential
o The Specialty Foods sector has a growing market potential. There is an overall desire of consumers to discover new products and culinary experiences. Furthermore, as Canada’s immigrant population continues to grow, the ethnic food sub-sectors are expected to follow suit.
Threats
- Costs o Businesses that operate in the Specialty Food sector are commonly smaller in
size than those operating in the mainstream industry and specialized equipment is often required to produce certain types of specialty food. Possessing limited financial resources, the need for expensive and often dedicated equipment creates a barrier to entry which is difficult for many smaller businesses to overcome.
o Another example for entry costs are food safety requirements: The Global Food Safety Initiative26 (GFSI) was instigated in 2000 and sets requirements for food safety schemes throughout international food supply chains. It is the acknowledged standard of grocery chains, for example in Germany and the UK. In order to export into these markets, a GFSI certification is necessary. However, the certification and upkeep of GFSI certification is costly, which presents a barrier, especially for small specialty food producers and processors.
o All sub-sectors examined in this study face lower cost competition from offshore. - Economic conditions
o There are links between consumer income and the specialty food product sectors. Specialty food products are more often premium-priced products. Hence, the purchase of specialty food products can be expected to be associated with income. In times of economic uncertainties, these products are typically the first food items that consumers cut back on.
o For producers and processors, if the volatility in the financial markets continues, the securing of financing for investments, such as processing and distribution facilities, will become more difficult to achieve.
26 http://www.mygfsi.com/

Canada’s Specialty Food Industry
71
Strengths - Capacity
o Canada has natural resources and a climate that allows the region to produce a wide range of agricultural products. Canada has one of the highest ratios of arable land per person and the largest body of available freshwater in the world. A wide variety of field crops can be grown across Canada including pulses, buckwheat, spelt and other ancient grains.
o Specialty food producers have built their niche markets from the ground up. There is no commodity association marketing specialty food products (except for the small scale food processors association in British Columbia27). Therefore, stakeholders have marketed themselves through connection with consumers. These skills are a valuable asset.
- Good research base o Canada has excellent research capabilities for conducting pure and applied
research. If harnessed to serve the industry’s needs, these capabilities could provide an excellent basis for supporting the development of an innovative consumer-focused Specialty Food sector.
Weaknesses
- Lack of consumer awareness o While growing consumer interest is an opportunity for the sector. There is still a
lack of consumer knowledge and awareness toward a number of specialty food products.
- Lack of research coordination o While, as mentioned above, Canada has excellent research capabilities, much of
these research efforts are not sufficiently connected to providing solutions to challenges faced by industry. Disconnects that exist between commercial businesses and research institutions represent a weakness that undermines the overall sector’s ability to innovate in response to changing consumer demands.
- Commercialization value chain (poor) o A further disconnect that appears to exist in relation to Canada’s Specialty Food
sector is its limited ability to commercialize science into new innovative products and processes. Research shows that the majority of commercially significant innovation flows from direct interaction between businesses (that may or may not involve academic institutions). Our consultations with the gluten-free sub-sector in particular suggest that the level of interaction necessary to enable greater commercialization of specialty food products is currently lacking.
- Lack of market knowledge, intelligence and lack of coordination o Specialty foods do not encompass a specific group of commodities for which
market intelligence can be gathered and distributed per se. However, sub-sectors of the specialty foods industry face a common denominator of threats, such as the current regulatory system (domestic and globally, in the area of food safety) and lack of processing capacity and coordination etc., for which a platform is needed.
o There is currently no specialty foods association in Canada which could provide a means for coordination and exchange of information.
27
http://www.ssfpa.net/

Canada’s Specialty Food Industry
72
- Lack of marketing activity o Respondents stated that a lack of knowledge about specialty food markets has
resulted in less marketing activities than that which occurs in other jurisdictions, including Europe, Australia and the US, where gluten–free products are more prevalent than in Canada.
- Current regulatory system o Inconsistency in advice given by the CFIA on regulations poses a significant
problem. This includes inconsistent messaging on what is required to meet regulations related to inputs (e.g. feed and medication), production and marketing (e.g. labelling requirements), and/or what is possible within current regulations. These factors confuse and demotivate producers and processors to proactively work to enhance their own management capabilities and work with other stakeholders to develop an internationally competitive industry.
o In general, industry feels that regulations do not consider niches. More flexibility is needed in order for these small sub-sectors to compete successfully.

Canada’s Specialty Food Industry
73
8 Conclusion This report constitutes a first assessment of Canada’s Specialty Food sector and provides a unique perspective of its size and nature. The follow section begins by restating the purpose of the project. This is followed by a series of recommendations (Section 8.2) to increase the competitiveness of Canada’s Specialty Food sector. 8.1 Research Objective The purpose of this project was to provide an overview of Canada’s Specialty Food sector and to provide recommendations for industry and government on how to define and support the sector. To meet this purpose, a literature review and data collection exercise was undertaken, and interviews with industry stakeholders were conducted to gain a more in-depth understanding of six selected value chains. The SWOT analysis section provided some detail around the key external and internal factors that could play a role in meeting the following objective:
“Increase the potential to build the Canadian food industry by focusing on specialty food niches with high growth potential and opportunity for differentiation.”
Driven by changing demographics, a number of which are fueled by immigration, the research identified that tremendous opportunities exist to expand the Canadian specialty food industry, domestically and internationally. The research also identified that, compared to the mainstream agri-food industry, specialty food is an emerging sector comprised of smaller businesses. With limited resources at the forefront of industry development, many of the businesses which comprise this emerging industry appear to be impacted more by legislative and regulative considerations than those operating in more established sectors of the agri-food industry. This fact increases the risks faced by specialty food producing businesses, and discourages or prevents them from taking full advantage of market opportunities. It also discourages other businesses from considering an entry into the Specialty Food sector. Presented below are a series of recommendations that have been designed to assist in addressing hurdles which the research found to be negatively impacting the competitiveness of Canada’s Specialty Food sector. A number of the recommendations will require strategic partnerships to be established between industry and government in order to be acted upon. Some will only be achievable through collaboration between provincial and federal levels of government.
8.2 Recommendations The following recommendations resulted from the analysis of information and input gathered throughout the research. The recommendations are not ranked by importance or listed in any particular order. Regulatory overhaul
- The current regulatory system (for example, Provincial versus Federal Inspection and labelling regulations) should be reviewed to identify how the unintended consequences of the current regulatory system, which effect small scale operations and industries the most, could be avoided. The ability to produce and market products, without the

Canada’s Specialty Food Industry
74
unnecessary regulatory burden that many respondents associate with the current system, would increase the ability for innovative producers and processors to exploit emerging opportunities.
- As part of the regulatory overhaul, ways should be explored to redefine the Canadian Food Inspection Agency’s (CFIA) culture and the way it interacts with individual businesses, as well as sectors, through changing how CFIA’s performance in measured. At present the majority of respondents from commercial industry consider CFIA’s ‘modus operandi’ to be more of an obstacle, than a valued service provider who enables smaller innovative companies to exploit market opportunities and behaves in a manner which reflects the realities of operating in a commercial business environment .
- CFIA employees interviewed subsequent to the industry consultations stated that the current situation was partly an outcome of CFIA policies and programs having to reflect a complex and sometimes conflicting series of Acts and Regulations implemented by AAFC, Industry Canada, and Health Canada. Therefore, while industry’s attention is focused on CFIA, in reality some issues that respondents place at the foot of CFIA appear to be symptoms of the extent to which the regulatory system needs overhauling.
Food safety
- Work should be undertaken to determine how Canada’s FSEP (Food Safety Enhancement Program) can be recognized as an equivalent to the Global Food Safety Initiative (GFSI) standard. That would help eliminate excessive costs and unnecessary barriers to potential export markets.
- Management support should be provided to help implement internationally recognised food safety systems (such as GFSI) for smaller plants.
Need for more market intelligence
- Some market intelligence is available on the specialty foods markets in the form of market reports. However, these market reports are typically very pricey and cannot be afforded by smaller companies. Nevertheless, some of this information would be vital in order to exploit new market opportunities. Therefore, a platform or portal could be implemented to make this kind of information accessible at reasonable costs (e.g. through cost sharing) to small and medium sized producers and processors. The same information portal, particularly if coordinated by industry associations, could be used as a forum for enabling commercial businesses to exchange information and address common problems that could be solved through collaboration.
- The gathering of market intelligence would be greatly assisted through establishing a process for strategically gathering market information. Currently there is no active and strategic data collection on Canada’s specialty food industry. Neither Statistics Canada nor major private consumer research companies, such as AC Nielson, collect data on the Canadian industry. This situation contrasts markedly with initiatives occurring in the US and other jurisdictions.
- The gathering and sharing of market data, which commercial businesses and industry as a whole could use to make informed decisions, would be aided by objectively defining specialty food from a business perspective. The majority of commercial businesses interviewed for the research stated that they largely define specialty food by the consumers who purchase the product. These are consumers who buy a particular type of product for a specific reason, often related to dietary or religious belief. Using this terminology could take a lot of subjectivity out of the discussions about what defines a specialty food, and what businesses constitute the specialty food sector or industry. It would also highlight the need for government and industry to focus on helping businesses adapt to a rapidly changing consumer market.

Canada’s Specialty Food Industry
75
Management capability
- Because of the small size of their firms, producers and processors have limited influence on retailers. Hence, education on best management practices is needed to facilitate market/retailer access for small specialty food businesses.
- The research also identified that many respondents believe that concerted efforts need to be implemented to provide management training for producers, leading to a greater number of them possessing a business mindset. The need for a shift in producers’ ‘mentality’ was said to be particularly acute in the lamb and goat sectors.
National enabling program - A national program should be implemented that will focus on enabling businesses to
take advantage of market opportunities through creating a platform of networking and capacity building initiatives. Furthermore, an information portal could be created that would make information more accessible for consumers on the different types of specialty food and where they could be purchased.
- Such a program could provide a medium for enabling industry to more objectively communicate to governments on the negative impact of current legislation and policy, and its implementation; and, together, develop a business environment more suited to enabling market-focused innovation. This latter element would see it connected into the AAFC Value Chain Roundtables, along with appropriate provincial initiatives.
- The endeavor that we are proposing could be financed by industry through membership fees. A secondary source of income could come from delivering programs on behalf of governments. As an organization would face an initial financial hurdle in organizing specialty food producers and processors without having an income source, government support could play a role during its formation. The perceived organization would be solely focused on supporting and enabling innovation in products and processes, as well as federal and provincial legislation and policy. It would not be a lobbying organization.

Canada’s Specialty Food Industry
76
9 References AAFC [Agriculture and Agri-food Canada]. (2008). “United States Ethnic Food Market: Opportunities for Canadian Agri-Food Exporters” http://www.ats.agr.gc.ca/amr/4489-eng.htm
AAFC [Agriculture and Agri-food Canada]. (2008). “Health and Wellness Trends for Canada and the World” http://www.ats-sea.agr.gc.ca/info/4367-eng.htm
AAFC [Agriculture and Agri-food Canada]. (2009). Health and Wellness Trends for Canada and the World. http://www.ats.agr.gc.ca/info/4367-eng.htm
Barbas, S. (2003). “I'll Take Chop Suey”: Restaurants as Agents of Culinary and Cultural Change. In: The Journal of Popular Culture, vol: 36, issue 4, p 669- 686.
Barton, A., (2011). The Great Gluten Debate; Globe Life; Globe and Mail; pp L1; February 2.
Bhatnagar,S. and Aggarwal, R.2007.Lactose intolerance. BMJ ,Vol 334.
Brooks, N.; A. Regmi and A. Jerardo. (2009). "U.S. Food Import Patterns, 1998-2007," Journal. [e-journal] http://www.ers.usda.gov/publications/fau/2009/08aug/fau125/fau125.pdf
Bureau of Economic Analysis. (2010). "Overview of the Economy: Table," Journal. [e-journal] http://www.bea.gov/newsreleases/xls/glance.xls
Bureau of Labor and Statistics. 2010. "Consumer Expenditures - 2009," Journal. [e-journal] http://www.bls.gov/news.release/pdf/cesan.pdf
Canadian Grocer.(2010). Eye on Ethnic Foods. Toronto: Mar 2010. Vol. 124, Iss. 2; p. 51.
Canadian Food Inspection Agency. “Guide to Food Labelling and Advertising”. http://www.inspection.gc.ca/english/fssa/labeti/guide/toce.shtml
Caicco, P and Petrie, M.(2010).The Ethnic Consumer in Canada. CIBC Institutuional Equity Research Industry Update.
Dillingham,B.(2009).Making the Connection.Food in Canada. Vol. 69, Iss. 5; pg. 35
Fox, N. and K.J.Ward. (2008).You are what you eat? Vegetarianism, health and identity. In: Social Science & Medicine Vol. 66, p. 2585-2595.
Gooch M & Moore T. (2006) Developing a Sustainable Market for Locally Produced Prince Edward County Agri-Food Products. George Morris Centre
Grainger, L. (2009) Canadian grocery chains put more emphasis on local produce. National Post. August 19. http://www.nationalpost.com/life/story.html?id=1909733
Heslop, L.A. (2007); Literature Review of Canadian Consumer Attitudes and Perceptions Toward Domestic Marketing and Branding of Food; Eric Sprott School of Business; Carlton University.
Jamal.(2003). Retailing in a multicultural world: the interplayof retailing, ethnic identity and consumption. Journal of Retailing and Consumer Services 10, p. 1–11.
Leung, W., (2011); Gluten-Free Goes Maintsream – But How Long Will It Last?; Globe Life; Globe and Mail; pp L5; February 2.

Canada’s Specialty Food Industry
77
Lund, M. (2011). Personal Communication, Sobeys Ontario
Marino, A., (2011). Personal Coomunication, AC Neilsen.
MacNeil, L. (2011). Personal Communication, Gordon’s Food Service
Mazurkevich, N. (2010): Buckwheat: A healthy Canadian Grain we ignore. The Ontario Agrologist, Fall, 2010.
MINTEL. (2010). Nasft: State of the Specialty Food Industry Report. Chicago, IL.
National Association For The Specialty Food Trade. (2011). "About Nasft," National Association For The Specialty Food Trade, Inc. http://www.specialtyfood.com/about-nasft/
Ruby,M.B., and Heine,S.J. (2011). Meat,morals,andmasculinity. Appetite (2011), doi:10.1016/ j.appet.2011.01.018.
Sampson, S. (2010) “Kosher food market growing”; The Toronto Star; March 26, 2010; http://www.thestar.com/living/food/article/785423--kosher-food-market-growing
Schyver.T and Smith, C. (2005). Reported Attitudes and Beliefs toward Soy Food Consumption of Soy Consumers versus Nonconsumers. In: Natural Foods or Mainstream Grocery Stores Journal of Nutrition Education and Behavior Vol. 37 Number 6.
Smith, G. (2011). Personal Coomunication, AC Neilsen.
SPINS. (2010a). "Business Unit Overview," http://www.spins.com/assets/public/Business_Unit_Overview.pdf
SPINS (2010b). "Spins Natural Products Library," Library Features. http://www.spins.com/services/libfeatures.php
SPINS (2010c). "The Spins Network," http://www.spins.com/spins-network/network.php
Statistics Canada. (2010a). Projections of the diversity of the Canadian population. http://www.statcan.gc.ca/daily-quotidien/100309/dq100309a-engl.htm.
Statistics Canada. (2010b). “Population by selected ethnic origins, by province and territory (2006 Census)”. http://www40.statcan.gc.ca/l01/cst01/demo26a-eng.htm
Tellström, R., Gustafsson, I., Mossberg, L (2006). Consuming Heritage: The use of local food culture in branding. Place Branding, 2(2), 130-143.
Thilmany, D., Bond, C.A., Bond, J.K.. (2008). Going Local: Exploring Consumer Behaviour and Motivations For Direct Food Purchases; Agricultural and Applied Economics Association; Number 2008 (5), 1303-1309.
United States Department of Agriculture. (2009). "Sales of Food at Home by Type of Outlet," Food CPI and Expenditures: Measuring the ERS Food Expenditure Series. http://www.ers.usda.gov/briefing/cpifoodandexpenditures/Data/Expenditures_tables/
Waddington, A. (2011). Personal Communication, fsStrategy

Canada’s Specialty Food Industry
78
10 Appendixes 10.1 Survey Questionnaire Assisting The Specialty Food Industry To Grow Dear….., The Specialty Food sector is demonstrating consistent growth. Few details are however known about the sector in terms of its capabilities, market opportunities, or the challenges that could impact its long term success. Agriculture and Agri-Food Canada (AAFC) has engaged the Value Chain Management Centre and the George Morris Centre to clarify potential market opportunities in the Specialty Food arena and the drivers of those opportunities. This will enable a picture to be developed of future trends. Simultaneously, we are also seeking to identify factors that businesses operating in the Specialty Food sector believe to be impacting their ability to take advantage of current and emerging opportunities. One of the products that we have been asked to examine are…………….. As an industry expert, we would be extremely grateful for your advice and participation. In particular, we would appreciate your views on the sector’s ability to create and capture value in relation to changing consumer behaviour and expected market trends. Please note that all the information gathered during our research will be treated with the strictest confidentiality. Your anonymity is assured. Each questionnaire will be given an identification number and all responses will be aggregated during the analysis. No names or titles of people or organizations will be used in the reporting. Furthermore, all the individual responses will be destroyed at the end of the research. A member of our research team will contact you by telephone to determine when you are available for an interview which we expect will take 20-25 minutes of your time. If time does not permit an interview, you are welcome to complete the survey and return it by email or fax (519) 837-8721 before March 04, 2011. Please advise if another individual from your organization would be more appropriate to address the nature of this study. Thank you in advance for your participation. If you have any questions about this study, please feel free to contact me at the number below. Sincerely, Claudia Schmidt 519-822-3929 x 207

Canada’s Specialty Food Industry
79
Specialty Food Survey
Name, Position and Organization
Mailing Address
Telephone and Email
Annual sales
Number of employees
Location, nature and capacity of operations
General Perspectives
1) Please describe your business in general terms
2) In one sentence what do you consider the term Specialty Food (SF) to mean?
3) Please indicate which of these statements most closely reflects your opinion, and
why:
a) My business is a Specialty Food producer. b) My business produces food, which happens to be considered Specialty.

Canada’s Specialty Food Industry
80
Production Trends
4) Using the table below, please state the percentage of your overall food production that you consider to be Specialty Food (vs. non-SF), and whether this amount has changed over the last decade?
2000 2005 2010 % of SF % of non-SF
5) Please list or describe the Specialty Food products that you produce.
6) Do you use any certifications or quality marks to verify that your products or processes conform to certain markets’ or individuals’ perceptions of specialty?
I.e. religious certification such as Kosher or Halal, or gluten-free quality mark.
Marketing
7) From where do you obtain information on Specialty Food markets and trends?
8) To which markets do you supply Specialty Food?
8a) Domestic

Canada’s Specialty Food Industry
81
8b) Export (please list specific countries)
9) What would you estimate is the size of each of these Specialty Food markets?
10) By how much have each of these markets grown over the last 5 years?
What do you think is driving growth in each of these markets?
11) Five years from now, in which markets do you expect to have seen the greatest growth in Specialty Food – and why?
Limiting Factors,
12) What factors could prevent you from taking full advantage of these opportunities?
Please rate the relative impact each factor on a scale of 1-5 (where 1 reflects
minimal impact, 5 reflects immense impact).

Canada’s Specialty Food Industry
82
Factors you may wish to consider include availability of supply, quality, legislation, human
resources, market intelligence, or other
13) What risks have greatest influence on your business decisions?
Please rank each risk (on a scale of 1-5; where 1 is little, 5 is extreme) according to its influence on shaping your business decision.
Risks you may wish to consider include financial risk, and/or risks associated with quality, food safety, legislation that is not clearly defined, or other
14) What could your suppliers / customers do differently to help you more effectively manage each of the risks you identified in Q.13?
15) What could government do to help you more effectively manage the risks you identified in Q.13?
Thank you for your participation and interest in this project.

Canada’s Specialty Food Industry
83
Appendix B
10.2 Detailed Comparative Findings Buckwheat Factors preventing businesses from taking full advantage of market opportunities
Risks that have greatest influence on business decisions

Canada’s Specialty Food Industry
84
Pulses Factors preventing businesses from taking full advantage of market opportunities
Risks that have greatest influence on business decisions

Canada’s Specialty Food Industry
85
Goats Factors preventing businesses from taking full advantage of market opportunities
Risks that have greatest influence on business decisions

Canada’s Specialty Food Industry
86
Lamb Factors preventing businesses from taking full advantage of market opportunities
Risks that have greatest influence on business decisions
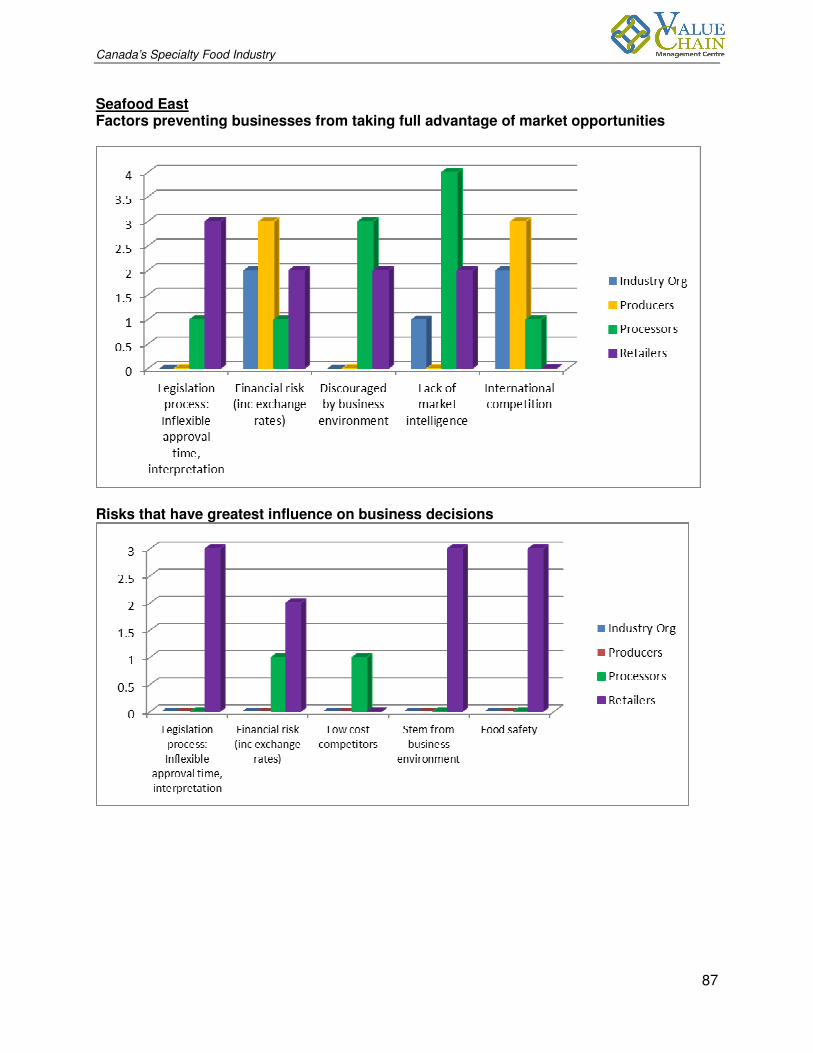
Canada’s Specialty Food Industry
87
Seafood East Factors preventing businesses from taking full advantage of market opportunities
Risks that have greatest influence on business decisions

Canada’s Specialty Food Industry
88
Seafood west Factors preventing businesses from taking full advantage of market opportunities
Risks that have greatest influence on business decisions
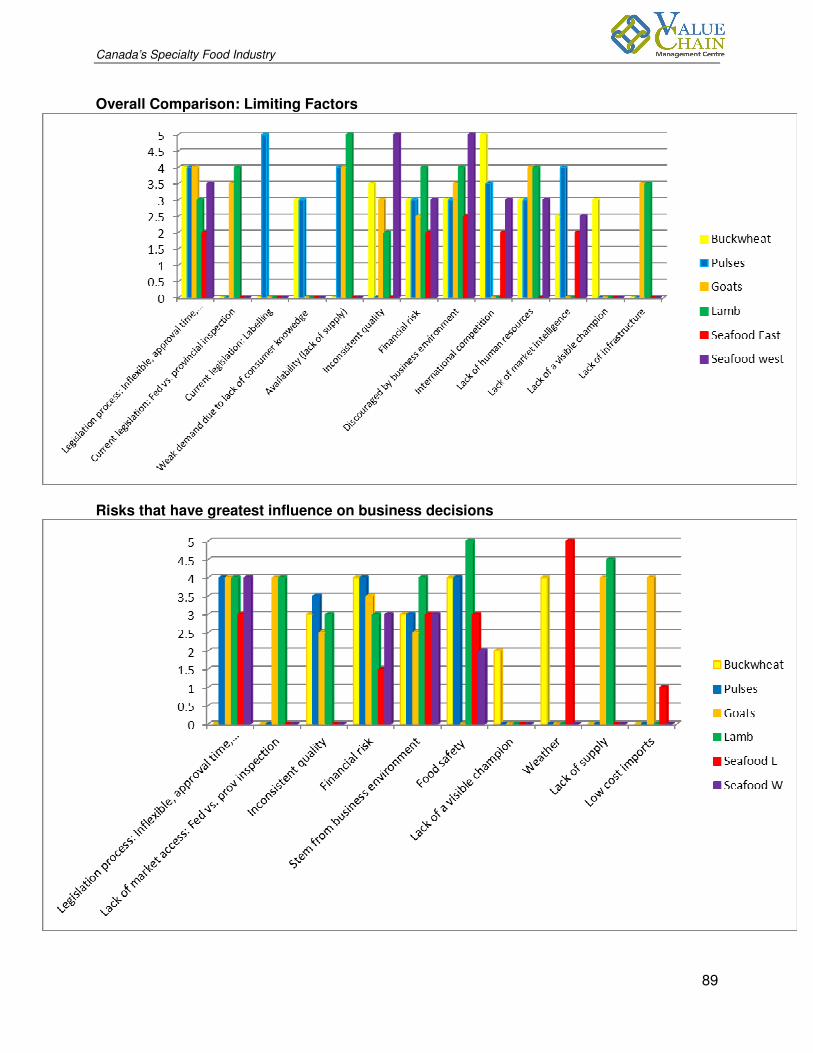
Canada’s Specialty Food Industry
89
Overall Comparison: Limiting Factors
Risks that have greatest influence on business decisions