Embed Size (px)
Citation preview

Full Terms & Conditions of access and use can be found athttps://www.tandfonline.com/action/journalInformation?journalCode=nurw20
Urban Water Journal
ISSN: 1573-062X (Print) 1744-9006 (Online) Journal homepage: https://www.tandfonline.com/loi/nurw20
Assessing the mitigation effect of deep tunnels onurban flooding: a case study in Guangzhou, China
Huabing Huang, Lin Zhang, Lin Liu, Xianwei Wang, Xina Wang, Cuilin Pan &Dashan Wang
To cite this article: Huabing Huang, Lin Zhang, Lin Liu, Xianwei Wang, Xina Wang, Cuilin Pan &Dashan Wang (2019): Assessing the mitigation effect of deep tunnels on urban flooding: a casestudy in Guangzhou, China, Urban Water Journal, DOI: 10.1080/1573062X.2019.1669186
To link to this article: https://doi.org/10.1080/1573062X.2019.1669186
Published online: 23 Sep 2019.
Submit your article to this journal
Article views: 12
View related articles
View Crossmark data

CASE REPORT
Assessing the mitigation effect of deep tunnels on urban flooding: a case study inGuangzhou, ChinaHuabing Huanga,b,c, Lin Zhanga,b, Lin Liu c,d, Xianwei Wanga,b, Xina Wange, Cuilin Pana,b and Dashan Wanga,b
aCenter of Integrated Geographic Information Analysis, School of Geography and Planning, Sun Yat-sen University, Guangzhou, China;bGuangdong Provincial Engineering Research Center for Public Security and Disasters, Guangzhou, China; cDepartment of Geography, University ofCincinnati, Cincinnati, OH, USA; dCenter of Geographic Information Analysis for Public Security, School of Geographic Sciences, GuangzhouUniversity, Guangzhou, China; eGuangdong Eco-Engineering Polytechnic, Guangzhou, China
ABSTRACTThere are growing demands of deep tunnels to mitigate the severe urban flooding by providing a largestorage capacity for excess storm runoff. This study aims to assess the flooding mitigation effect ofa deep tunnel system proposed in the old downtown of Guangzhou, China, and to quantify theflooding volume difference by two storm hyetographs, the Chicago curve and the Improved Huffcurve. Results show that the flooding volume is significantly reduced by a minimum of 19% anda maximum of 42% under design storms of 10- and 0.5-year return periods, respectively, when thedeep tunnel system is constructed. There is a distinct spatial pattern for the mitigation effect. The bestmitigation is in the west and the immediate north of the main tunnel, whereas the east does not showsignificant mitigation. Moreover, the actual flooding risk is likely underestimated when the Chicagocurve is employed to design the storms.
ARTICLE HISTORYReceived 27 August 2018Accepted 9 September 2019
KEYWORDSDeep tunnel; urban flooding;storm hyetograph; ImprovedHuff; SWMM; Guangzhou
1. Introduction
Urban flooding is becoming a severe problem in cities acrossthe globe in the context of climate change and rapid urbani-zation (Cherqui et al. 2015; Huang et al. 2018; Rosbjerg 2017;Zheng et al. 2016). Increases in the frequency of extremerainfalls and impervious surface area are imposing ever-highercapacity-related demands on urban drainage networks (ODonnell, Lamond, and Thorne 2017; Price et al. 2016).However, the drainage networks in operation were con-structed according to old codes and, therefore, can not meetcurrent drainage requirements. To reduce the flooding risk,such measures as pipe upsizing and the installation of newpump stations are frequently undertaken (Alves et al. 2018;Kang et al. 2016; Liu and Jensen 2017). Nevertheless, thesemeasures may not be effective in coastal cities and lakeregions owing to the low terrain in these areas. In suchcases, a large amount of extra capacity is needed to storeexcess surface runoff generated during storm events, anddeep tunnel systems are an alternative to making improve-ments to shallow drainage networks (Owusu et al. 2013).
Deep tunnel systems have been applied in many cities acrossthe globe, including Chicago (Fore 2013; Scalise and Fitzpatrick2012), Indianapolis (Morgan 2012), Kuala Lumpur (Bambridgeet al. 2005), and Hong Kong (Young 2010). Guangzhou is thefirst city inmainland China to build deep tunnels to reduce urbanflooding (Wu et al. 2016). The deep tunnel system in Guangzhouis located in the old downtown of the city, and consists of onemain tunnel and six subordinate tunnels with a planned storagecapacity of 1.652millionm3 in total. As one of the six subordinatetunnels, the 1.77 km-long pilot project in the DongHao Creek
catchment has been constructed since 2014, and its designedstorage capacity is 63, 000m3. Empirical knowledge derived fromthis pilot project is critical to the design and construction of theremaining deep tunnels planned for Guangzhou, and for similarprojects in other regions.
The mitigation effect of drainage facilities on urban flood-ing depends not only on the designed capacity, but also onfeatures of the rainfall, such as average intensity and temporaldistribution (Guan, Sillanpää, and Koivusalo 2016; Isidoro, deLima, and Leandro 2012; Ten Veldhuis et al. 2018; Zhu andChen 2017). The intensity of rainfall in Guangzhou has chan-ged significantly over the past two decades (GBWA 2011), anda new code for average storm intensity has thus been formu-lated. The storm hyetograph describes the temporal distribu-tion of rainfall depth during a storm event, thus determiningthe peak runoff in a catchment, especially in an urban catch-ment where over half of rainfalls turn into runoffs (Ewea et al.2016; Gong et al. 2016). The Chicago curve (Keifer and Chu1957) is widely applied to design storms in China. A previousinvestigation (Pan et al. 2017) found that it tends to under-estimate the peak flooding volume in the southern urbancatchments of Downtown Panyu, Guangzhou and theImproved Huff curve (Pan et al. 2017) could better representthe temporal distribution of storm rainfalls in Guangzhou.Further investigation is needed into how the differencebetween these curves influences the response of the drainagesystem to storm events, and the conclusion can supporta more reasonable design of urban drainage facilities.
The objective of this study is to assess the mitigation effecton urban flooding by a deep tunnel system proposed in the
CONTACT Lin Liu [email protected]; Xianwei Wang [email protected]
URBAN WATER JOURNALhttps://doi.org/10.1080/1573062X.2019.1669186
© 2019 Informa UK Limited, trading as Taylor & Francis Group

DongHao Creek catchment, Guangzhou, China, and to quan-tify the difference of flooding volume simulated by usingdifferent storm hyetographs, the regular Chicago curve andthe Improved Huff curve. The Storm Water ManagementModel (SWMM) (U.S. EPA 2015) without deep tunnels is cali-brated and validated by field observations, and then the deeptunnel system is generalized as a storage unit in the SWMMmodel. The mitigation in urban flooding using deep tunnels iscomputed by comparing the simulated flooding states beforeand after the addition of the deep tunnel system to the model.The Chicago curve and the Improved Huff curve are employedto design storms with different return periods, which are thenentered into the model with deep tunnels to quantify theflooding volume of different storm hyetographs.
2. Materials and methods
A flowchart of this study is shown in Figure 1. The SWMMmodel without deep tunnels is firstly established and thenused to quantify the flood mitigation brought by adding
deep tunnels as well as the impact of storm hyetographs onflood control.
2.1. Study area and the deep tunnel system
The study area, the DongHao Creek catchment, is located inYuexiu District in Guangzhou, China (Figure 2(a)). It occupies anarea of 12.47 km2 and receives a long-term annual precipitation ofabout 1800 mm, most of which occurs between April andSeptember (Yang et al. 2014). Its topography is characterized byhigher altitude in the north and lower in the south. The mainstream in the study area, the DongHao Creek, originates at Lu Lakein the north, flows to the south and ends at its confluencewith thePearl River (Wang et al. 2016). The deep tunnel system in theDongHao Creek catchment consists of a main tunnel (the north–south red line), a branched XinHePu tunnel (the east–west orangeline), and a pump station near the Pearl River (Figure 2(b)). Themain tunnel is 1770 m long, starting at DongFengDong Road andending at the pump station. Along the main tunnel are fourshafts (the purple points) on DongFengDong Road (No. 1),
Drainage network
Urban flooding model
Digital Elevation Model
Land use/Land cover
Chicago curve
Model withoutdeep tunnels
Chicago curve
Model with deep tunnels
Model withdeep tunnels
Improved Huff
Mitigation effect ofdeep tunnels
Influence ofstorm hyetographs
Field observation
Figure 1. Framework of quantifying the mitigation effect of deep tunnels and the influence of storm hyetographs.
)b()a(
Figure 2. Study area: location of the study area in Guangzhou (a); and land use, the deep tunnel system, and the monitoring point P (b). ‘DHC’ in the legend standsfor ‘DongHao Creek’.
2 H. HUANG ET AL.

ZhongShanSan Road (No. 2), YuDaiHao (No. 3) and YanJiang Road(No. 4) to receive stormwater conveyed by the connected shallowdrainage network. The 1400 m-long branched interception pipewill serve the XinHePu catchment and transfer storm water to theshaft at YanJiang Road (No. 4). When the deep tunnel system iscompleted, it will provide a maximum storage capacity of63,000 m3 (Wang et al. 2016). Moreover, the pump station isplanned to be equipped with a group of pumps, providinga maximum drainage capacity of 48 m3/s.
2.2. Urban flood modelling, calibration and validation
2.2.1. Urban flood modellingSWMM is a widely applied model to urban flooding simulations,and was employed here to represent the DongHao Creek catch-ment and the planned deep tunnel system. Subcatchments,junctions, and pipes were first set manually according to thespatial layout of the drainage network, local topography andland use, and the deep tunnel system was represented usinga storage unit in the model. The parameters of the junctions,pipes, and subcatchments were then computed and linked tocorresponding objects in the model. Some of these parameterssuch as area, slope, and impervious percentage can be deter-mined by field data, whereas the other parameters depend onmodel calibration. The value ranges of the parameters to becalibrated were set according to the SWMM manual.
2.2.2. Model calibration and validationTo calibrate and validate the flooding model, the response ofthe current drainage system to storm events was recorded.Water depth in drainage pipes was collected at the monitoringpoint P (the outlet of an upstream community) during twostorm events (Table 1). Furthermore, water depth monitoringwas also conducted at point P on a dry day to measure themagnitude of dry-weather flow in the combined sewer system.
Model calibration consists of two parts: dry-weather flow andstorm flow. The parameters of dry-weather flow were adjustedby water depth in dry weather measured on 2 June 2016 at pointP. The parameters of storm flowwere determined by using waterdepth data from a storm event on 15 May 2016 in combinationwith dry-weather flow at point P. Finally, themodel was validatedat point P using a storm event on 1 September 2016.
In the calibration and validation, three indices – the Nash–Sutcliffe efficiency (NSE) Equation (1), Peak Error (PE) Equation(2), and Mean Absolute Relative Error (MARE) Equation (3) – wereapplied to evaluate the performance of the urban floodingmodel:
NSE ¼ 1�Pn
i¼1ðSi � OiÞ2
Pn
i¼1ðOi � OÞ2
(1)
PE ¼ Smax � Omax (2)
MARE ¼ 1n
Xn
i¼1
Si � Oi
Oi
����
���� (3)
where Si are the simulated water depths, Oi are the observedwater depths, O is the mean of the observed water depths, and nis the number of observations. Smax and Omax are the maximumwater depths in the simulation and observation, respectively.
Generally, threshold values of NSE to indicate a model ofsufficient quality have been suggested between 0.5 and 0.65(Moriasi et al. 2007; Ritter and Muñoz-Carpena 2013). In con-sideration of possible limitations of NSE such as influence ofoutliers or large values, PE and MARE were introduced to makea more robust evaluation on the model performance. In viewof the complexity of the process of surface runoff and urbanflooding, 10 cm and 20% were set as the maximum thresholdvalues of PE and MARE, respectively.
2.3. Design storm
Storm events that cause hazards in Guangzhou can be dividedinto two types (Pan et al. 2017). The first is long-lasting heavyrainfall, such as typhoon-induced rainfall. For instance, thewater level in the Pearl River was very high during typhoonHato (No. 201713), and many streets nearby were inundatedas a result. The second type of hazardous storm events inGuangzhou, which is short in duration but high in intensity,occurs more frequently than the first type, and is therefore thetarget of this study. Specifically, short-duration storm events(shorter than 3 hours) are the main cause of urban flooding inGuangzhou, and two durations, 1 and 3 h, are selected foranalysis. Four return periods, 0.5-, 1-, 5-, and 10-year, are usedfor the analysis. Because the shallow drainage network incentral Guangzhou was designed to deal with storm eventswith return periods of 0.5 year – 1 year, and is expected tomanage storm events with return periods of 5 years – 10 yearscoupled with the planned deep tunnel system.
To model the rainfall process, an intensity equation is firstused to calculate total rainfall depth given its duration andreturn period, and a storm hyetograph is then employed todistribute total rainfall depth over the duration. The intensityequation for Guangzhou (GBWA 2011) is
I ¼ at þ bð Þn ; a ¼ 167A1 1þ C � logPð Þ (4)
where I is the mean rainfall intensity (L/s/ha.), A1 is the rainfalldepth (mm) with a 1-year return period, C is the parameter ofrainfall depth variations, P is a return period (year), t is therainfall duration (minute) and b and n are constants. Thevalues of C, b and n are 0.438, 11.259, and 0.750, respectively,which were derived based on historical rainfall data from 1990to 2010 (GBWA 2011) and are adopted by the Department ofWater Authority in the Guangzhou metropolitan area. Forexample, the mean rainfall intensity for a storm event with1-h duration and 1-year return period in Guangzhou is 151.319L/s/ha., and thus the total rainfall depth is 54.5 mm.
Two storm hyetographs, the Chicago curve and the ImprovedHuff curve (Pan et al. 2017), were selected for analysis.
Table 1. Storm events used for model calibration and validation.
DatePrecipitation
(mm)Duration(min)
Meanintensity(mm/h)
Maximumintensity(mm/h)
Drydays(d)
15 May 2016 17.6 115 9.2 57.6 51 September 2016 17.1 50 20.5 86.4 5
URBAN WATER JOURNAL 3

2.3.1. Chicago curveThe Chicago curve was derived by using the intensity–dura-tion–frequency relationship, and is widely applied to designstorms in China. The general equations of the rising and fallinglimbs are:
qðtbÞ ¼a½ð1�nÞtb
1�r þ b�½ tb1�r�
1þn
qðtaÞ ¼a½ð1�nÞta
r þ b�½tar þ b�1þn
(5)
where q(tb) and q(ta) are the time series of rainfall intensity inthe rising and falling limbs, respectively; tb and ta are the timesbefore and after the peak rainfall intensity, respectively; r is theratio of the duration of the rising limb to the total rainfallduration, and was set to 0.33 in Guangzhou.
2.3.2. Improved Huff curveThe Improved Huff method (Pan et al. 2017) separatesa rainfall into two limbs, a rising and a falling one, and thedistribution of rainfall intensity is expressed by:
qðtbÞ ¼ 0:017þ 0:040=tb
qðtaÞ ¼ 0:007þ 0:406ta � 0:927t2a þ 0:785t3a(6)
where q(tb) and q(ta) are the time series of rainfall intensity inthe rising and falling limbs, respectively; tb and ta representthe normalized time prior to and after the peak rainfall inten-sity, respectively; the ratio of the duration of the rising limb tothe total rainfall duration was also set to 0.33.
2.4. Urban flooding mitigation obtained by using deeptunnels
The parameters of the validated model were applied to theentire urban flooding model of the study area. Two models,one without the deep tunnel system and the other equippedwith it, were run to quantify the role of the deep tunnelsystem in reducing the flooding risk. All storms were designedby the Chicago curve, which is recommended by the latestcode (CMA 2014).
Two global indicators, total flooding volume and thenumber of flooding points, were employed to measure themitigation effect. Storm runoff in the conduits overflowsfrom the junctions to the ground when the conduits getsurcharged. All overflowed storm water in the study areaover the entire duration was added together to computethe total flooding volume. The change in the total floodingvolume under the storm of a specific return period, whichwas resulted by introducing the deep tunnels, can reflectthe effectiveness of the deep tunnels on reducing the risk ofsurface flooding under that storm. The number of floodingpoints describes the amount of regions affected by flooding.In addition to the global indices, the spatial distributions ofthe flooding points under storms of different return periodswere also mapped to display regions that were vulnerableto flooding.
2.5. Impact of storm hyetograph on flood control
For each combination of storm duration and return period, thetotal precipitation was calculated based on the intensity equa-tion, and then was distributed over the entire duration byusing the Chicago curve and the Improved Huff curve sepa-rately, leading to two rainfall processes. The two storm pro-cesses were entered into the model containing the deeptunnel system to obtain two indices: total flooding volumeand the number of flooding points. The influence of the stormhyetograph on flood control was then estimated based onchanges in the two indices.
3. Results
3.1. Urban flooding model
The urban flooding model without the deep tunnel system con-sists of 453 subcatchments, 1,814 pipes and 1,748 junctions.
The dry-weather flow depth was recorded at point P from 7am to 11 am, and from 7 pm to 9 pm on 2 June 2016, and theresults of calibration are shown in Figure 3. The model was thencalibrated at point P by a storm event on 15 May 2016, andvalidated by another on 1 September 2016. The performance ofthe model is shown in Figure 4 and the optimized parametersare listed in Table 2. Simulated depths show a smoother changethan observed depths not only in the calibration process, butalso in the validation process. However, the difference betweenthe simulated and observed depths for the validation process islarger than that in the calibration process. The most probablereason for this larger difference is the difference in rainfallcharacteristics between the two storm events. They have almostthe same total rainfall depth, but mean rainfall intensity of thestorm event on 1 September 2016 is two times larger than thatof the storm event on 15 May 2016. The calibration yields a bestfit solution for the event on 15 May 2016, but may producesome deviations for the validation process due to the complex-ity and nonlinearity of the process of surface runoff and flood-ing formation. In terms of the NSE, its values (0.38 for thecalibration and 0.48 for the validation) were slightly below 0.5,showing relatively poor performances. But in light of the PE and
0.0
0.1
0.2
0.3
0.4
0.5
7:00 8:00 9:00 10:00 11:00 19:00 20:00 21:00
)m(
htpeD
Time
Observed depth
Simulated depth
NSE = 0.86
PE = -1cm
MARE = 5.7%
Figure 3. Calibration of dry-weather flow at the monitoring point on2 June 2016. NSE, PE and MARE denote the Nash–Sutcliffe efficiency, PeakError and Mean Absolute Relative Error, respectively.
4 H. HUANG ET AL.

MARE, the PE values (−7.3 cm for the calibration and 4.5 cm forthe validation) and the MARE values (8.1% for the calibrationand 16.5% for the validation) were smaller than 10 cm and 20%,respectively, indicating good performances. As a result, theperformance of the urban flooding model was acceptable.
3.2. Designed storms
The total rainfall depths for each group of storm duration andreturn period are shown in Table 3, and the according processesare given in Figure 5. To compare the processes obtained by theChicago curve and the Improved Huff curve, the percentage ofrainfall depth in each decile duration was calculated as the totalrainfall depth divided by rainfall depth in this duration (Figure 6).
It is clear that the percentage of rainfall depth in the risinglimb of the Improved Huff curve (39.5% for 1-h duration and46.7% for 3-h duration) is higher than that of the Chicago curve(30.7% for 1-h duration and 34.9% for 3-h duration). Furthermore,the percentage of rainfall depth in the first half of each durationfor the Improved Huff curve (76.7% for 1-h duration and 79.6%for 3 h) is also higher than that of the Chicago curve (64.9% for
1-h duration and 69.8% for 3-h duration). In addition to theoverall trend, there is an exception in the storm events of3-h duration whereby the peak value of the Chicago curve islarger than that of the Improved Huff curve.
Thus, there are more rainfalls in the rising limb of stormsdesigned by the Improved Huff curve than that made by theChicago curve. This pattern also applies to the rainfall depth inthe first half of storm duration.
3.3. Urban flooding mitigation obtained by using deeptunnels
3.3.1. Total mitigation effectThe simulated mitigation effects of deep tunnels on urbanflooding in different storm scenarios are listed in Tables 4 and 5.
With the addition of the deep tunnel system to the model, thetotal flooding volume is reduced significantly by a minimum of19% and a maximum of 42% under design storms of 10- and0.5-year return periods, although the reduction in the number offlooding points in all simulations is slight. This suggests thatbuilding deep tunnels does not change the location of floodingbut alleviates the pressure at the flooding points to a certaindegree. Moreover, compared with the mitigation induced for1-h storms, performancewas slightly better for 3-h storms becausethe intensity of the latter was less than that of the former.
Even though the deep tunnel system was introduced, thereare still flooding points in the simulation of the storm event of0.5-year return period, which suggests that making better use ofthe deep tunnel system relies on improving the shallow drainagenetwork. Moreover, a systematic plan is required for the improve-ment of the shallowdrainage network. Local improvement of thedrainage network can result in more efficient conveyance ofstorm runoff in that area, and thus, impose more pressure to itsdownstream area. As a result, new bottle necks are probably toemerge in the downstream area. Only when the drainage capa-cities in the upstream areas and the downstream areas arecompatible, can the storm runoff be transferred efficiently tothe deep tunnel system through the shallow drainage network.
3.3.2. Spatial distribution of mitigation effectTo understand the mitigation effect of deep tunnels at differentplaces, the spatial distribution of the flooding points and the
0
20
40
60
80
100
1200
0.2
0.4
0.6
0.8
1
17:25 17:55 18:25 18:55 19:25
Rai
nfal
l int
ensi
ty (m
m/h
)
htpeD
(m)
Time
Rainfall intensity
Observed depth
Simulated depth
NSE = 0.48, PE = 4.5cm, MARE = 16.5%
0
20
40
60
80
100
1200
0.2
0.4
0.6
0.8
1
17:40 18:10 18:40 19:10 19:40
Rai
nfal
l int
ensi
ty (m
m/h
)
htpeD
(m)
Time
Rainfall intensity
Observed depth
Simulated depth
NSE = 0.38, PE = -7.3cm, MARE = 8.1%
(a) (b)
Figure 4. Performances in the model calibration by a storm event on 15 May 2016 (a) and the validation by a storm event on 1 September 2016 (b). NSE, PE andMARE denote the Nash–Sutcliffe efficiency, Peak Error and Mean Absolute Relative Error, respectively.
Table 2. Optimized parameters of the urban flooding model.
ParameterOptimizedvalue
Manning’s n of conduits 0.01Manning’s n on impervious surface 0.024Manning’s n on pervious surface 0.2Depression storage on impervious surface 1.9 mmDepression storage on pervious surface 3.8 mmPercentage of impervious surface with no depressionstorage
17.7%
Maximum infiltration rate 124.3 mm/hMinimum infiltration rate 8.13 mm/hDecay constant 3.5 h−1
Table 3. Total rainfall depth for different groups of storm duration and returnperiod according to the intensity Equation (4) issued by the Guangzhou Bureauof water authority in 2011.
1-hour 3-hour
0.5-year 45.3 mm 57.6 mm1-year 54.5 mm 72.2 mm5-year 75.5 mm 108.3 mm10-year 85.0 mm 126.0 mm
URBAN WATER JOURNAL 5

according mitigation effects were mapped. The results derivedfrom simulations driven by the 1-h storms are shown in Figure 7.
The larger the return period, the greater the number offlooding points. There are a minimum of 19 flooding points
and a maximum of 38 flooding points in simulations of stormevents with 0.5- and 10-year return periods, respectively.A sudden increase in the number of flooding points occurswhen the return period changes from 1 year to 5 years. The
(a) (b)
0
1
2
3
4
5
6
0 10 20 30 40 50 60
)m
m(htpedllafnia
R
Duration (min)0.5 year-Chicago 1 year-Chicago 5 years-Chicago 10 years-Chicago
0.5 year-Huff 1 year-Huff 5 years-Huff 10 years-Huff
0
1
2
3
4
5
6
0 30 60 90 120 150 180
)m
m(htpedllafnia
R
Duration (min)0.5 year-Chicago 1 year-Chicago 5 years-Chicago 10 years-Chicago
0.5 year-Huff 1 year-Huff 5 years-Huff 10 years-Huff
Figure 5. Designed rainfall processes for 1-h duration (a) and 3-h duration (b). In each subgraph, there are 8 rainfall processes generated by four return periods (0.5-,1-, 5-, and 10-year) and two designing approaches (the Chicago curve and the Improved Huff curve). The ratio of the duration of the rising limb to the total rainfallduration is 0.33. ‘Huff’ in the legend means the Improved Huff curve.
0
10
20
30
40
1 2 3 4 5 6 7 8 9 10
)%(egatnecreP
Decile of the duration
1h-Chicago
1h-Improved Huff
0
10
20
30
40
1 2 3 4 5 6 7 8 9 10
)%(egatnecreP
Decile of the duration
3h-Chicago
3h-Improved Huff
(b)(a)
Figure 6. Temporal distribution of rainfall depth in each decile for 1 h (a) and 3 h (b) durations. The percentage in one decile is computed as the total rainfall depthdivided by the sum of rainfall depth in the decile.
Table 4. The results of simulated flooding and mitigation effect in 1-h storms scenarios. The change is ‘With deep tunnels’ minus ‘No deep tunnels,’ meaning that thechange occurred after the introduction of deep tunnels into the model. TFV and NFP denote total flooding volume and the number of flooding points, respectively.
0.5-year 1-year 5-year 10-year
TFV (m3) NFP TFV (m3) NFP TFV (m3) NFP TFV (m3) NFP
No deep tunnels 82,323 19 130,234 21 243,708 37 340,723 38With deep tunnels 50,177 18 90,353 21 185,812 34 276,353 38Change −32,146 −1 −39,881 0 −57,896 −3 −64,370 0Change percentage −39% / −31% / −24% / −19% /
Table 5. Results of simulated flooding and mitigation effect in 3-h storms scenarios. The change is ‘With deep tunnels’ minus ‘No deep tunnels,’ meaning that thechange occurred after the introduction of deep tunnels to the model. TFV and NFP denote total flooding volume and the number of flooding points, respectively.
0.5-year 1-year 5-year 10-year
TFV (m3) NFP TFV (m3) NFP TFV (m3) NFP TFV (m3) NFP
No deep tunnels 59,603 17 109,689 18 285,325 34 394,035 38With deep tunnels 34,475 15 70,806 19 210,608 33 310,058 36Change −25,128 −2 −38,883 1 −74,717 −1 −83,977 −2Change percentage −42% / −35% / −26% / −21% /
6 H. HUANG ET AL.

points that are flooded in the less intensive storm event are allflooded in the more intensive storm event as well.
In terms of percentage of flooding volume reduction ata given point, the mitigation effects are classified into threetypes: significant improvement (decline by more than 5%;green in the figure), no change (change by no more than5%; blue in the figure), and significant deterioration (increaseby more than 5%; red in the figure).
There is an obvious pattern whereby most points at whichflooding is mitigated are located in the west and the immediatenorth of the main tunnel, and most points at which flooding isnot significantly improved are in the east. It should also be notedthat flooding at two points in the southeast deteriorates insimulations of storm events with 5- and 10-year return periods.A likely reason for this phenomenon is that higher water levels inthe downstream pipes following the connection to the XinHePutunnel are unfavourable for upstream drainage.
In sum, simulated flooding points in the DongHao Creekcatchment show a stable spatial distribution in different
scenarios, and most mitigated points are in the west of thestudy area.
3.4. Impact of storm hyetograph on flood control
A comparison of the simulated results obtained by theImproved Huff curve and the Chicago curve is shown inTables 6 and 7. Tables 6 and 7 list the performance of themodel for the 1- and 3-h storm events, respectively.
For 1-h storm events, the total flooding volume in simula-tions using the Chicago curve is less than that using theImproved Huff curve, and the percentage of underestimationranges from 17% to 28%. The underestimating trend is alsoapplicable to the number of flooding points.
However, the results of the 3-h storms simulations are verydifferent from those of the 1-h storms simulations. Overall,there also appear to be a trend of underestimation, whereasthe percentage of underestimation (from 4% to 11%) is smallerthan that in the 1-h storms simulations (from 17% to 28%). In
Figure 7. Spatial distribution of simulated flooding points under storms of 1-h duration and 0.5-, 1-, 5-, and 10-year return periods. All points on the map are floodedin the scenario with 10-year return period. The mitigation effect of the deep tunnel system is represented by colors: green (significant improvement), blue (nochange), and red (significant deterioration).
URBAN WATER JOURNAL 7
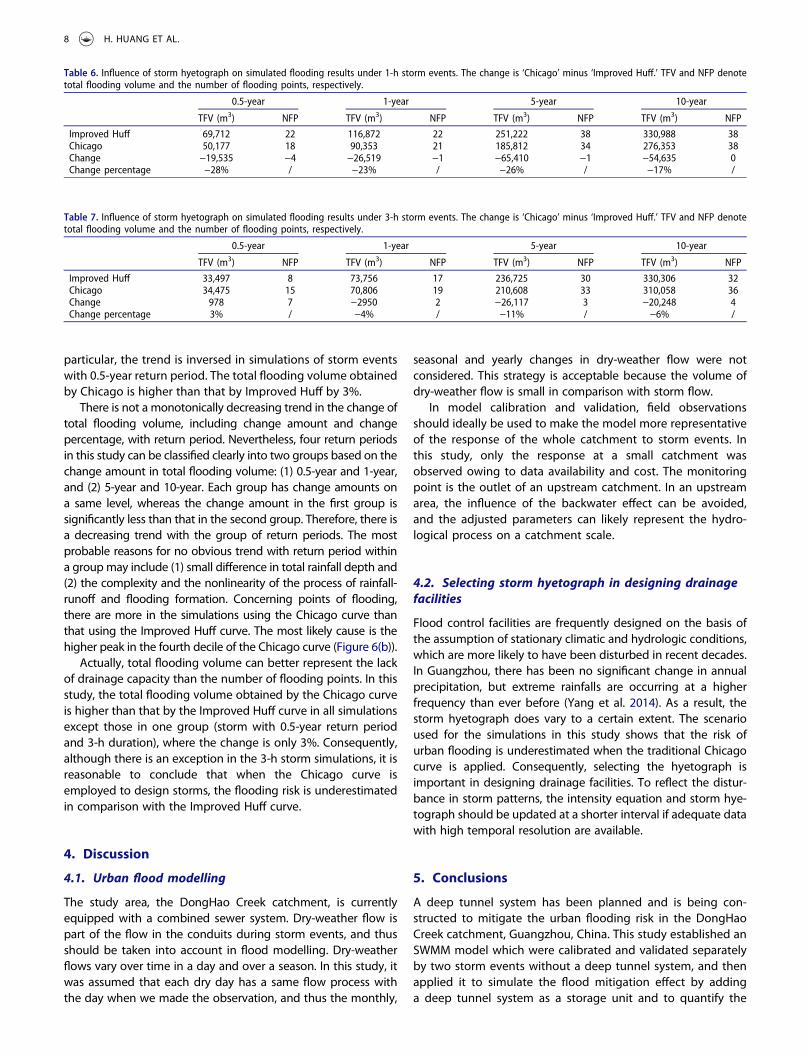
particular, the trend is inversed in simulations of storm eventswith 0.5-year return period. The total flooding volume obtainedby Chicago is higher than that by Improved Huff by 3%.
There is not a monotonically decreasing trend in the change oftotal flooding volume, including change amount and changepercentage, with return period. Nevertheless, four return periodsin this study can be classified clearly into two groups based on thechange amount in total flooding volume: (1) 0.5-year and 1-year,and (2) 5-year and 10-year. Each group has change amounts ona same level, whereas the change amount in the first group issignificantly less than that in the second group. Therefore, there isa decreasing trend with the group of return periods. The mostprobable reasons for no obvious trend with return period withina groupmay include (1) small difference in total rainfall depth and(2) the complexity and the nonlinearity of the process of rainfall-runoff and flooding formation. Concerning points of flooding,there are more in the simulations using the Chicago curve thanthat using the Improved Huff curve. The most likely cause is thehigher peak in the fourth decile of the Chicago curve (Figure 6(b)).
Actually, total flooding volume can better represent the lackof drainage capacity than the number of flooding points. In thisstudy, the total flooding volume obtained by the Chicago curveis higher than that by the Improved Huff curve in all simulationsexcept those in one group (storm with 0.5-year return periodand 3-h duration), where the change is only 3%. Consequently,although there is an exception in the 3-h storm simulations, it isreasonable to conclude that when the Chicago curve isemployed to design storms, the flooding risk is underestimatedin comparison with the Improved Huff curve.
4. Discussion
4.1. Urban flood modelling
The study area, the DongHao Creek catchment, is currentlyequipped with a combined sewer system. Dry-weather flow ispart of the flow in the conduits during storm events, and thusshould be taken into account in flood modelling. Dry-weatherflows vary over time in a day and over a season. In this study, itwas assumed that each dry day has a same flow process withthe day when we made the observation, and thus the monthly,
seasonal and yearly changes in dry-weather flow were notconsidered. This strategy is acceptable because the volume ofdry-weather flow is small in comparison with storm flow.
In model calibration and validation, field observationsshould ideally be used to make the model more representativeof the response of the whole catchment to storm events. Inthis study, only the response at a small catchment wasobserved owing to data availability and cost. The monitoringpoint is the outlet of an upstream catchment. In an upstreamarea, the influence of the backwater effect can be avoided,and the adjusted parameters can likely represent the hydro-logical process on a catchment scale.
4.2. Selecting storm hyetograph in designing drainagefacilities
Flood control facilities are frequently designed on the basis ofthe assumption of stationary climatic and hydrologic conditions,which are more likely to have been disturbed in recent decades.In Guangzhou, there has been no significant change in annualprecipitation, but extreme rainfalls are occurring at a higherfrequency than ever before (Yang et al. 2014). As a result, thestorm hyetograph does vary to a certain extent. The scenarioused for the simulations in this study shows that the risk ofurban flooding is underestimated when the traditional Chicagocurve is applied. Consequently, selecting the hyetograph isimportant in designing drainage facilities. To reflect the distur-bance in storm patterns, the intensity equation and storm hye-tograph should be updated at a shorter interval if adequate datawith high temporal resolution are available.
5. Conclusions
A deep tunnel system has been planned and is being con-structed to mitigate the urban flooding risk in the DongHaoCreek catchment, Guangzhou, China. This study established anSWMM model which were calibrated and validated separatelyby two storm events without a deep tunnel system, and thenapplied it to simulate the flood mitigation effect by addinga deep tunnel system as a storage unit and to quantify the
Table 6. Influence of storm hyetograph on simulated flooding results under 1-h storm events. The change is ‘Chicago’ minus ‘Improved Huff.’ TFV and NFP denotetotal flooding volume and the number of flooding points, respectively.
0.5-year 1-year 5-year 10-year
TFV (m3) NFP TFV (m3) NFP TFV (m3) NFP TFV (m3) NFP
Improved Huff 69,712 22 116,872 22 251,222 38 330,988 38Chicago 50,177 18 90,353 21 185,812 34 276,353 38Change −19,535 −4 −26,519 −1 −65,410 −1 −54,635 0Change percentage −28% / −23% / −26% / −17% /
Table 7. Influence of storm hyetograph on simulated flooding results under 3-h storm events. The change is ‘Chicago’ minus ‘Improved Huff.’ TFV and NFP denotetotal flooding volume and the number of flooding points, respectively.
0.5-year 1-year 5-year 10-year
TFV (m3) NFP TFV (m3) NFP TFV (m3) NFP TFV (m3) NFP
Improved Huff 33,497 8 73,756 17 236,725 30 330,306 32Chicago 34,475 15 70,806 19 210,608 33 310,058 36Change 978 7 −2950 2 −26,117 3 −20,248 4Change percentage 3% / −4% / −11% / −6% /
8 H. HUANG ET AL.

flooding volume difference by using different storm hyeto-graphs under four return periods, 0.5-, 1-, 5- and 10-year.
Simulation results show that the flooding volume is signifi-cantly reduced by a minimum of 19% and a maximum of 42%under design storms of 10- and 0.5-year return periods,respectively, when the deep tunnel system is constructed.There is a distinct spatial pattern for the mitigation effect.The best mitigation is in the west and the immediate northof the main tunnel, whereas the east of the creek does notshow significant mitigation. Moreover, the simulated totalflooding volume by the Chicago curve is smaller than thatby the Improved Huff curve to design storms. In other words,the actual flooding risk is likely underestimated when theChicago curve is employed to represent the storm hyetograph.
In the context of the severe urban flooding situation, thereare growing demands for drainage facilities that can providemassive storage capacities, such as deep tunnels, for excessstorm runoff caused by climate change and rapid urbaniza-tion. Further investigations are needed to assess the design ofcost-effective and adaptable drainage facilities, and the impactof changes in storm characteristics and underlying surface.
Disclosure statement
No potential conflict of interest was reported by the authors.
Funding
This study was jointly supported by the National Key Research andDevelopment Program of China (#2018YFB0505500, #2018YFB0505502),the National Natural Science Foundation of China (#41301419,#41871085), the China Scholarship Council (#201806385016), and theScience and Technology Program of Guangzhou (# 201707010098).
ORCID
Lin Liu http://orcid.org/0000-0002-7202-3418
References
Alves, A., B. Gersonius, A. Sanchez, Z. Vojinovic, and Z. Kapelan. 2018.“Multi-criteria Approach for Selection of Green and Grey Infrastructureto Reduce Flood Risk and Increase CO-benefits.” Water ResourcesManagement 32 (7): 2505–2522. doi:10.1007/s11269-018-1943-3.
Bambridge, C. J., L. S. Hoor, J. D. Hutton, and W. D. Rogstad. 2005. “TheStormwater Management and Road Tunnel (SMART), Kuala Lumpur,Malaysia – A Unique Use of Tunnel Space for Both Traffic and FloodWater.” 17th Rapid Excavation and Tunneling Conference, Seattle, WA.
Cherqui, F. A., A. B. Belmeziti, D. C. Granger, A. C. Sourdril, and P. A. B. LeGauffre. 2015. “Assessing Urban Potential Flooding Risk and IdentifyingEffective Risk-reduction Measures.” The Science of the Total Environment514: 418–425. doi:10.1016/j.scitotenv.2015.02.027.
CMA (China Meteorological Administration). 2014. Technical Guidelines forEstablishment of Intensity-Duration-Frequency Curve and DesignRainstorm Profile. Beijing, China: China Meteorological Press. Availableonline: http://www.cma.gov.cn/en2014/news/Features/201504/P020150420660788373564.pdf.
Ewea, H. A., A. M. M. Elfeki, J. A. Bahrawi, and N. S. Al-Amri. 2016.“Sensitivity Analysis of Runoff Hydrographs Due to Temporal RainfallPatterns in Makkah Al-Mukkramah Region, Saudi Arabia.” ArabianJournal of Geosciences 9 (5). doi:10.1007/s12517-016-2443-5.
Fore, A. 2013. “From Rooftop Gardens to Deep Tunnels: Chicago Tackles ItsStormwater Problems.” Planning 79 (1): 50–53.
GBWA (Guangzhou Bureau of Water Authority). 2011. The RainstormFormula and Calculation Chart in Guangzhou Downtown. Guangzhou,China: Guangzhou Bureau of Water Authority. Available online: http://www.cma.gov.cn/2011xwzx/2011xxdqxywtx/2011xzhgcxt/201110/t20111029_141510.html
Gong, Y., X. Liang, X. Li, J. Li, X. Fang, and R. Song. 2016. “Influence ofRainfall Characteristics on Total Suspended Solids in Urban Runoff:A Case Study in Beijing, China.” Water 8 (7): 278. doi:10.3390/w8070278.
Guan, M., N. Sillanpää, and H. Koivusalo. 2016. “Storm Runoff Response toRainfall Pattern, Magnitude and Urbanization in a Developing UrbanCatchment.” Hydrological Processes 30 (4): 543–557. doi:10.1002/hyp.10624.
Huang, H., X. Chen, Z. Zhu, Y. Xie, L. Liu, X. Wang, X. Wang, and K. Liu.2018. “The Changing Pattern of Urban Flooding in Guangzhou, China.”The Science of the Total Environment 622–623: 394–401. doi:10.1016/j.scitotenv.2017.11.358.
Isidoro, J. M. G. P., J. L. M. P. de Lima, and J. Leandro. 2012. “Influence ofWind-driven Rain on the Rainfall-runoff Process for Urban Areas: ScaleModel of High-rise Buildings.” Urban Water Journal 9 (3): 199–210.doi:10.1080/1573062X.2012.654801.
Kang, N., S. Kim, Y. Kim, H. Noh, S. J. Hong, and H. S. Kim. 2016. “UrbanDrainage System Improvement for Climate Change Adaptation.” Water8 (7). doi:10.3390/w8070268.
Keifer, C. J., and H. H. Chu. 1957. “Synthetic Storm Pattern for DrainageDesign.” Journal of the Hydraulics Division 83 (4): 1–25.
Liu, L., and M. B. Jensen. 2017. “Climate Resilience Strategies of Beijing andCopenhagen and Their Links to Sustainability.” Water Policy 19 (6):997–1013. doi:10.2166/wp.2017.165.
Morgan, J. 2012. “Challenges of Indianapolis Deep Tunnel System.” 2012North American Tunneling Conference, NAT 2012, Indianapolis, IN. doi:10.1094/PDIS-11-11-0999-PDN.
Moriasi, D. N., J. G. Arnold, M. W. Van Liew, R. L. Bingner, R. D. Harmel, andT. L. Veith. 2007. “Model Evaluation Guidelines for SystematicQuantification of Accuracy in Watershed Simulations.” Transactions ofthe ASABE 50 (3): 885–900. doi:10.13031/2013.23153.
O Donnell, E. C., J. E. Lamond, and C. R. Thorne. 2017. “Recognising Barriers toImplementation of Blue-Green Infrastructure: A Newcastle Case Study.”Urban Water Journal 14 (9): 964–971. doi:10.1080/1573062X.2017.1279190.
Owusu, P. A., S. N. Odai, F. O. Annor, and K. A. Adjei. 2013. “ReservoirStorage for Managing Floods in Urban Areas: A Case Study of DzorwuluBasin in Accra.” Hydrological Processes 27 (11): 1615–1625. doi:10.1002/hyp.9286.
Pan, C., X. Wang, L. Liu, H. Huang, and D. Wang. 2017. “Improvement tothe Huff Curve for Design Storms and Urban Flooding Simulations inGuangzhou, China.” Water 9 (6): 411. doi:10.3390/w9060411.
Price, J. C., L. Wright, C. Fant, and K. M. Strzepek. 2016. “CalibratedMethodology for Assessing Climate Change Adaptation Costs forUrban Drainage Systems.” Urban Water Journal 13 (4): 331–344.doi:10.1080/1573062X.2014.991740.
Ritter, A., and R. Muñoz-Carpena. 2013. “Performance Evaluation ofHydrological Models: Statistical Significance for Reducing Subjectivityin Goodness-of-fit Assessments.” Journal of Hydrology 480 (1): 33–45.doi:10.1016/j.jhydrol.2012.12.004.
Rosbjerg, D. 2017. “Optimal Adaptation to Extreme Rainfalls in Current andFuture Climate.” Water Resources Research 53 (1): 535–543. doi:10.1002/2016WR019718.
Scalise, C., and K. Fitzpatrick. 2012. “Chicago Deep Tunnel Design andConstruction.” Structures Congress 2012, Chicago, IL. doi: 10.1094/PDIS-11-11-0999-PDN.
Ten Veldhuis, M. C., Z. Zhou, L. Yang, S. Liu, and J. Smith. 2018. “The Roleof Storm Scale, Position and Movement in Controlling Urban FloodResponse.” Hydrology and Earth System Sciences 22 (1): 417–436.doi:10.5194/hess-22-417-2018.
(U.S. EPA United States Environment Protection Agency). 2015. StormWater Management Model User’s Manual Version 5.1. Cincinnati, OH.
Wang, G., W. Li, Y. Chen, J. Zhou, Y. Chen, and Y. Li. 2016. “PreliminaryStudy on Deep Tunnel Drainage Engineering at Donghao Creek inGuangzhou.” China Water & Wastewater 32 (22): 7–13.
URBAN WATER JOURNAL 9

Wu, H., G. Huang, Q. Meng, M. Zhang, and L. Li. 2016. “Deep Tunnel forRegulating Combined Sewer Overflow Pollution and Flood Disaster:A Case Study in Guangzhou City, China.” Water 8 (8): 329. doi:10.3390/w8080329.
Yang, L., J. Scheffran, H. Qin, and Q. You. 2014. “Climate-related FloodRisks and Urban Responses in the Pearl River Delta, China.”Regional Environmental Change 15 (2): 379–391. doi:10.1007/s10113-014-0651-7.
Young, J. 2010. “Kowloon’s Fight against Flooding.” Tunnels and TunnellingInternational (April): 29–32.
Zheng, Z., J. Gao, Z. Ma, Z. Wang, X. Yang, X. Luo, T. Jacquet, and G. Fu. 2016.“Urban Flooding in China: Main Causes and Policy Recommendations.”Hydrological Processes 30 (7): 1149–1152. doi:10.1002/hyp.10717.
Zhu, Z., and X. Chen. 2017. “Evaluating the Effects of Low ImpactDevelopment Practices on Urban Flooding under Different RainfallIntensities.” Water 9 (7): 548. doi:10.3390/w9070548.
10 H. HUANG ET AL.