Embed Size (px)
Citation preview

Brookhaven Science AssociatesU.S. Department of Energy
Assessing Local Deposition of Mercury Associated with
Coal-Fired Power Plants
T. Sullivan1, B. Bowerman1, J. Adams1, F. Lipfert2,
1 Brookhaven National Laboratory2 Independent Consultant
Presented at theDOE/NETL Mercury Control Technology R&D Program Review
Pittsburgh, PA July, 15, 2004

Brookhaven Science AssociatesU.S. Department of Energy
BackgroundBackgroundMercury regulation is on its way.EPA has suggested a Cap-and-Trade ProgramImpacts of local deposition are perceived to be an issue of concern for Cap-and-Trade• Secretary McGinty (PA – DEP) “Unlike most pollutants,
mercury is highly toxic and does not disperse easily, creating “hot spots” of contamination.” July 04
• Secretary Cipriano (IL – EPA) “Specifically, we are concerned that local "hot spots" of elevated mercury may result or worsen, especially if the required reduction levels are not sufficiently strict.” Feb 04

Brookhaven Science AssociatesU.S. Department of Energy
BackgroundBackground
Modeling studies suggest some increased local deposition, however, few measurement studies.Local deposition of reactive gaseous mercury and any particulate mercury is expected during precipitation events. Elemental mercury enters the global cycle.Data are needed to asses local impacts.

Brookhaven Science AssociatesU.S. Department of Energy
ApproachApproach
Select a coal-fired power plant for analysis.Perform deposition modeling based on plant specific parameters and meteorological conditions.Design soil and vegetation sampling program to look for excess deposition within 10 Km of the plant and determine the validity of modeling.Examine data for correlation with model predictions and look for hot spots.

Brookhaven Science AssociatesU.S. Department of Energy
Coal-Fired Power PlantCoal-Fired Power PlantA large sized power plant in the Midwest was
selected for study.
Annual emissions of Hg 340 kg/yr
Fraction of Hg(+2) = 0.18 (61kg/yr of Hg(+2))
Large stack height (200 m), lower deposition locally.
Brookhaven Science AssociatesU.S. Department of Energy
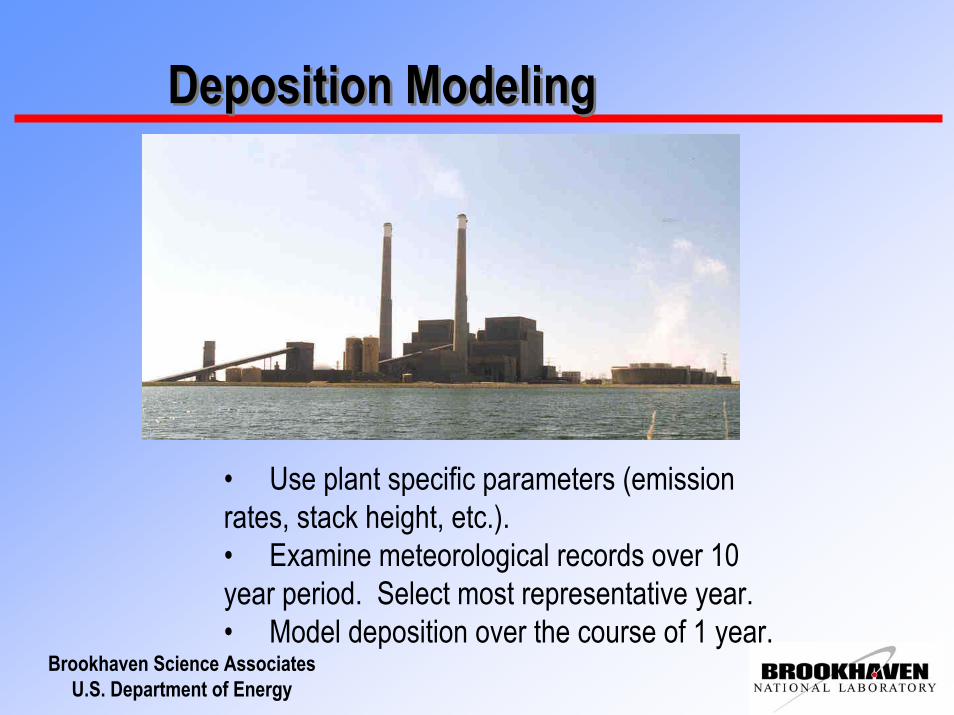
Deposition ModelingDeposition Modeling
• Use plant specific parameters (emission rates, stack height, etc.).• Examine meteorological records over 10 year period. Select most representative year.• Model deposition over the course of 1 year.

Brookhaven Science AssociatesU.S. Department of Energy
Wind and Rain RoseWind and Rain RoseRain RoseWind Rose

Brookhaven Science AssociatesU.S. Department of Energy
Deposition Modeling ResultsDeposition Modeling Results
Power PlantN
Deposition unitug/m2/yr
Background wetdeposition of 5 – 10 ug/m2/yr

Brookhaven Science AssociatesU.S. Department of Energy
Final Sampling GridFinal Sampling Grid
8 km

Brookhaven Science AssociatesU.S. Department of Energy
SamplingSamplingCover an area of 64 km2 primarily south west of plantAt each of the 51 grid locations collect:• 3 soil samples from top 5 cm (3 meter spacing)• 1 deep soil sample from 5 – 10 cm• 1 vegetation sample

Brookhaven Science AssociatesU.S. Department of Energy
AnalysisAnalysisAll samples shipped back to BNLSamples analyzed on Direct Mercury Analyzer (DMA-80). (Moisture determined separately.)Each sample measured 3 times to verify homogeneity.Blank analysis every 10th sampleNIST Standard every 10th
sample

Brookhaven Science AssociatesU.S. Department of Energy
ResultsResults51 Sample Sites Average 28.7 ng/g• Median 27.4 ng/g• Standard Deviation – 7
ng/g• Maximum – 55 ng/g• Minimum – 11.6 ng/g
Probability of being less than soil Hg level
00.10.20.30.40.50.60.70.80.9
1
0 10 20 30 40 50 60Soil Hg (ng/g)
Pro
babi
lity

Brookhaven Science AssociatesU.S. Department of Energy
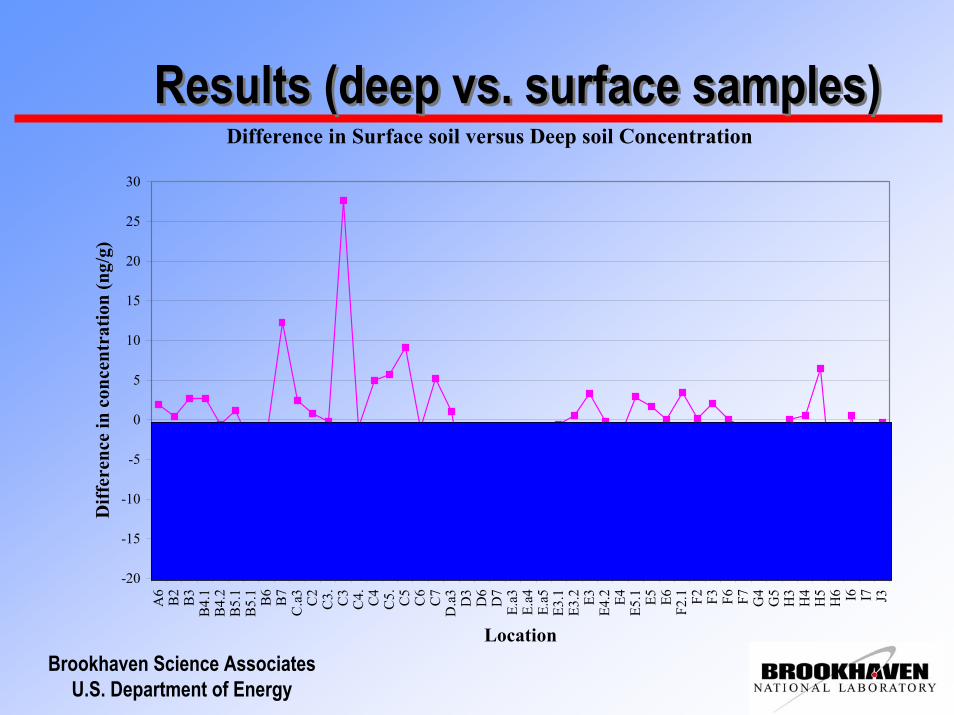
Soil ResultsSoil ResultsEffects of deposition are subtle and there is variability in the spatial distribution of Hg in soils.
Statistically significant agreement between model and data not found.
No clear definition of background.

Brookhaven Science AssociatesU.S. Department of Energy
Results (deep vs. surface samples)Results (deep vs. surface samples)
0
10
20
30
40
50
60
70
80
0 10 20 30 40 50Locxation (1=A6, 48=J3)
Mer
cury
(ng/
g)
DeepSamplesSurface
Brookhaven Science AssociatesU.S. Department of Energy
Results (deep vs. surface samples)Results (deep vs. surface samples)Difference in Surface soil versus Deep soil Concentration
-20
-15
-10
-5
0
5
10
15
20
25
30A
6B
2B
3B
4.1
B4.
2B
5.1
B5.
1B
6B
7C
.a3
C2
C3. C3
C4. C4
C5. C5
C6
C7
D.a
3D
3D
6D
7E.
a3E.
a4E.
a5E3
.1E3
.2 E3E4
.2 E4E5
.1 E5 E6F2
.1 F2 F3 F6 F7 G4
G5
H3
H4
H5
H6 I6 I7 J3
Location
Diff
eren
ce in
con
cent
ratio
n (n
g/g)

Brookhaven Science AssociatesU.S. Department of Energy
Vegetation ResultsVegetation ResultsEffects of deposition are similar and there is much larger variability than in the soil samples.
Same general pattern asSoil samples.
-8000 -6000 -4000 -2000 0 2000 4000 6000-6000
-4000
-2000
0
2000
10.70 to 22.90 22.90 to 31.50 31.50 to 84.40 84.40 to 691.10
Vegetation mercury levels (ng/g) versus predicted deposition

Brookhaven Science AssociatesU.S. Department of Energy
Comparison of deposition modeling and data on mass depositionComparison of deposition modeling and data on mass deposition
Three estimates obtained:• Mass deposited = Excess in surface soils versus
deep soils (0.7 ng/g)• Mass deposited = Surface soil average minus
average of the lowest 1/3 of the samples (8.4 ng/g). Lowest 1/3 taken as pre-operational background.
• ISCT model annual deposition prediction multiplied by plant life.

Brookhaven Science AssociatesU.S. Department of Energy
Estimates of Mass DepositedEstimates of Mass Deposited
0.70.129400Deposition Modeling (23 years)
Lowest 1/3 as background (upper bound)
Deep vs. Surface Soils
Case
30000
2700
Total Mass Required over plant life time of 23 years (g)
0.4
0.04
Percentage of total Hg emission
2.1
0. 2
Percentage of reactive Hg emissions

Brookhaven Science AssociatesU.S. Department of Energy
ConclusionsConclusions
At the power plant under study a small fraction (< 0.5%) of mercury appears to be deposited within 5 miles of the plant. No evidence for ‘hot spots’ in soil.General agreement between estimates of total mass deposited between data and model.Agreement between data and model in terms of spatial pattern is not statistically significant.Next step: Repeat at another plant