Embed Size (px)
Citation preview
ASSESSING THE EFFECT OF IN-FIELD RAINWATER HARVESTING ON SOIL
PHYSICO-CHEMICAL PROPERTIES AND CROP YIELD IN COMPARISON
WITH THE TRADITIONAL FARMERS’ PRACTICE
By
Mduduzi Khuzwayo
209503395
Submitted in fulfilment of the academic requirement for the degree of Master of Science
in Soil Science
School of Agricultural, Earth and Environmental Science
University of KwaZulu-Natal
Pietermaritzburg
September 2017
i
ABSTRACT
Most communal farmers in South Africa rely on rain-fed agriculture. However, the country is
experiencing rainfall variability as well as low soil fertility. These are major limiting factors to
food production especially since South Africa is dominated by a semi-arid climate. It is for this
reason that rural communities must optimally utilise their limited water reserves. Rainwater
harvesting (RWH) technologies are amongst possible alternatives to maximise agricultural
crop production. The aim of this study was to assess the effect of in-field rainwater harvesting
on selected soil physico-chemical properties and maize crop yield in comparison with the
traditional farmer practice. The study was conducted in homestead gardens in Kwa-Zulu Natal
(KZN) province, under Msinga local municipality and in Eastern Cape Province (EC), under
Tsolo local municipality. The study was set up at five homestead gardens namely Madosini,
Beya, Mjali, Quvile and Sokhombe in the Eastern Cape and three field trials in Kwa-Zulu Natal
(Mntungane, Xoshimpi and Mxheleni). It was designed as randomised complete block design,
that compared in-field rainwater harvesting (contour ridges) with the traditional farmer practice
(control) over two seasons (2013/14 and 2014/2015). Data was collected for soil chemical and
physical properties as well as for crop grain and dry matter yields. Soil samples were collected
at 0 - 10, 10 - 20 and 20 - 30 cm depths for analysis of soil pH, exchangeable bases,
micronutrients and aggregate stability, and for analysis of bulk density at 0 -10 cm. These
samples were collected at planting (2013) and at harvesting (2015). Gravimetric soil moisture
content was periodically monitored at different stages of maize growth (planting, vegetative
growth, tasselling and harvesting) in 2015. Biomass and grain yield were determined at harvest.
Results showed that rainwater harvesting improved soil moisture content, aggregate stability,
grain and dry matter yields. No clear trend was observed on the effect of rainwater harvesting
on exchangeable bases, soil pH and micronutrients across all study sites in Kwa-Zulu Natal
and Eastern Cape. It was therefore recommended that rainwater harvesting be used by resource
constrained rural farmers who are experiencing unfavorable precipitations to improve crop
yields and soil productivity.

ii
DECLARATION – plagiarism
I, Mduduzi Khuzwayo declare that:
1. The research reported in this dissertation, except where otherwise indicated is my
original work.
2. This dissertation has not been submitted for examination for any degree at any
other university.
3. This dissertation does not contain other person’s data, pictures, graphs or other
information, unless specifically acknowledged as being sourced from the other
person.
4. This dissertation does not contain other persons writing, unless specifically
acknowledged as being sourced from those researchers. Where other written sources
have been quoted, then:
a. Their words have been re-written but the general information attributed to
them has been referenced.
b. Where their exact words have been used, then their writing has been placed
in italics and inside quotation marks, and referenced.
5. This dissertation does not contain text, graphics or tables copied and pasted from
the internet, unless specifically acknowledged, with the source being detailed in the
dissertation and in the reference section.
Signed:…………………………............. Date:………………………………….
Mduduzi Khuzwayo (Candidate)
I as the candidate’s supervisor have/have not approved this dissertation for submission
Signed:………………………………….. Date:…………………………………..
Dr. Rebecca Zengeni (Supervisor)
Signed………………………………... Date:…………………………………………
Mr Jon McCosh (co-supervisor)
iii
ACKNOWLEGMENTS
I thank the holy place uMuzi waseKuPhakameni that God created for us. I further thank God
for His mercy and grace throughout the time of this study, especially sound health, protection,
provisions and preservation. I travelled a lot on the road for data collection and conference
presentations. I thank Him for journey mercies, divine provision and protection all through the
study. I also appreciate members of Mayandiswe for their encouragement and emotional
support. A special thanks to Mrs Mwelase (Mkhokheli MaChithwayo), Bawelile Purity Langa
and Carol Mpisi. Your contributions towards my success was noted and appreciated.
I also appreciate my mother (Zikhokhile Ntuli) and siblings (Lindokuhle Emmanual
Khuzwayo, Njabulo Lucky Khuzwayo and Snenhlahla Khuzwayo) whom God had used to be
a source of provision, encouragement and emotional support. My son Avela Siyamini Asibonge
Khuzwayo that God blessed me with during the course of this study. I do celebrate all my
friends. Appreciate their concerns, care, kindness and emotional support (Lindokuhle Phakathi,
Richard Mhlongo, Njabulo Makhoba, Mthokozisi Gcabashe, Mthokozisi Zuma, Mlungisi
Gwala, Njabulo Mbedu, Ndumiso Ncobela, Siyabonga Dlamini and Lihle Gumbi). In patience
and your constructive sources of ideas and resources, my humble supervisors Dr. Rebecca
Zengeni (University of KwaZulu-Natal) and Jon McCosh (Institute of Natural Resources), I
say thank you. Your academic guidance, assistance and commitment throughout the study
cannot be quantified.
I am extending my gratitude to staff (Ms Tezi Nala, Joe Buthelezi and Rajiv Singh) and
colleagues (Nondumiso Sosibo, Nsikelelo Dlamini, Bonginkosi Vilakazi, Lindumusa Myeni
and Bangani Dube) of the department of Soil Science; for their contribution, and assistance in
one way or the other (laboratory work and consultations). My appreciation also goes to the
Water Research Commission who admitted me into the project research titled “Up-scaling of
rainwater harvesting and conservation on communal crop and rangeland through integrated
crop and livestock production for increased water use productivity” under Water Research
Commission Project Number K5/2177/4/. In respect to this, some of the information in the
project are also contained in some specific deliverable reports submitted to Water research
Commission between 2015 and 2016 through the Institute of Natural Resources (INR) in
KwaZulu-Natal. I also acknowledged their financial support for this project. My sincere thanks
also goes to Jon McCosh and Brigid Letty (Institute of Natural Resources) whom counted me
worthy and incorporated into Water Research Commission project. This project provided the
funding required for the fieldwork research projects. Thank you for your assistance in logistics

iv
and planning during my data collection, Msinga farmers (Mtungane Zulu, Xoshimpi Zulu and
Mxheleni women’s group) and Eastern Cape farmers (mam’Quvile, mam’Mjali, Sokhombela,
Beya and mum’Madosini). Thank you for time and effort in ensuring that this project become
successful. I also appreciate all project team members under the leadership of Mr Jon McCosh
(Brigid Lety., Gasa Nokulunga., Lynton Dedekind., Michael Malinga., Mawethu Tshabu.,
Zanele Shezi and Zinhle Ntombela), contributors (R. Zengeni, P Muchaonyerwa, J.J Botha and
J.J Anderson). I cannot end this page without saying a word of appreciation to the Agricultural
Research Council for funding the presentation of part of this work in the Combined Congress
Conference held in Bela Bela in January 2017 and in the African Combined Congress held in
Ratanga Junction in Cape Town in January 2018.

v
TABLE OF CONTENTS
ABSTRACT ................................................................................................................................ i
DECLARATION – plagiarism .................................................................................................. ii
TABLE OF CONTENTS ........................................................................................................... v
LIST OF FIGURES .................................................................................................................. ix
LIST OF TABLES ..................................................................................................................... x
1 CHAPTER ONE: GENERAL INTRODUCTION ............................................................ 1
2 CHAPTER TWO: LITERATURE REVIEW .................................................................... 4
2.1 Introduction ................................................................................................................. 4
2.2 History and origin of rainwater harvesting ................................................................. 5
2.3 Overview of different rainwater harvesting techniques .............................................. 6
2.3.1 Micro-catchment rainwater harvesting ..................................................................... 7
2.3.2 Macro-catchment rainwater harvesting................................................................... 14
2.4 Guidelines for selecting site for rainwater harvesting techniques............................. 18
2.5 Challenges and opportunities for rainwater harvesting in South Africa. .................. 20
2.6 Effect of rainwater harvesting on selected soil physical properties. ......................... 21
2.7 Soil chemical properties and fertility as influenced by rainwater harvesting ........... 22
2.8 Crop yields as affected by rainwater harvesting ....................................................... 23
2.9 Level of adoption of rainwater harvesting in South Africa ....................................... 24
3 CHAPTER THREE: MATERIALS AND METHODS .................................................. 25
3.1 Introduction ............................................................................................................... 25
vi
3.2 Site Description ......................................................................................................... 25
3.2.1 Msinga research area in KwaZulu-Natal Province ................................................. 25
3.2.2 Tsolo research area in Eastern Cape Province ........................................................ 27
3.3 Experimental Design ...................................................................................................... 28
3.3.1 Development of Contours on research sites............................................................ 29
3.3 Crop Planting............................................................................................................. 29
3.4 Field data collection and laboratory analysis ............................................................ 30
3.4.1 Soil sampling and preparation for initial and final site characterisation ........... 30
3.4.2 Soil moisture determination at different stages of maize growth ...................... 30
3.5 Soil laboratory analyses ............................................................................................ 31
3.5.1 Particle size distribution ..................................................................................... 31
3.5.2 Aggregate stability ............................................................................................. 32
3.5.3 Bulk Density ...................................................................................................... 32
3.5.4 Soil pH, micronutrients and exchangeable bases ............................................... 33
3.5.5 Gravimetric soil moisture determination ........................................................... 33
3.6 Plant yield .................................................................................................................. 34
3.7 Statistical Analysis .................................................................................................... 34
4 CHAPTER FOUR: RESULTS ........................................................................................ 35
4.1 Introduction ............................................................................................................... 35
4.2 Site descriptions ........................................................................................................ 35
4.2.1 KZN site descriptions ........................................................................................ 35

vii
4.2.2 Eastern Cape site descriptions ........................................................................... 36
4.3 Comparison of soil physical properties before planting (2013) and at harvest (2015)
at the research sites .............................................................................................................. 37
4.3.1 Physical soil properties at KZN sites ................................................................. 37
4.3.2 Physical properties at Eastern Cape sites ........................................................... 41
4.4 Comparison of soil chemical properties before planting (2013) and at harvest (2015)
at the research sites. ............................................................................................................. 44
4.4.1 Chemical properties at KZN sites ...................................................................... 44
4.4.2 Chemical properties at EC sites ......................................................................... 49
4.5 Seasonal variations of gravimetric soil moisture at different contour positions and
stages of maize growth for KZN and EC research sites in the 2014/15 season. .................. 55
4.5.1 KZN soil moisture.............................................................................................. 55
4.5.2 Eastern Cape soil moisture................................................................................. 55
4.6 Grain and dry matter yields at EC in 2015 ................................................................ 57
5 CHAPTER FIVE: GENERAL DISCUSSION, CONCLUSION &
RECOMMENDATIONS ......................................................................................................... 58
5.1 Introduction ............................................................................................................... 58
5.2 Discussion ................................................................................................................. 58
5.3 Implications, recommendation and conclusions for further studies .......................... 62
6 References ........................................................................................................................ 64
7 List of Appendices ........................................................................................................... 75
7.1 Appendix A. An analysis of variance of aggregate stability for KZN ...................... 75
7.2 Appendix B. Analysis of variance of bulk density for KZN ..................................... 75

viii
7.3 Appendix C. Analysis of variance of aggregate stability for Eastern Cape sites ...... 76
7.4 Appendix D. Analysis of variance of bulk density for Eastern Cape ....................... 76
7.5 Appendix E. Analysis of variance of pH (Water) for KZN ...................................... 77
7.6 Appendix F. Analysis of variance of micronutrients for KZN ................................. 78
7.7 Appendix G. Analysis of variance of exchangeable bases for KZN ......................... 81
7.8 Appendix H. Analysis of variance of pH (water) for Eastern Cape .......................... 83
7.9 Appendix I. Analysis of variance of micro nutrients for Eastern Cape .................... 84
7.10 Appendix J. Analysis of variance of exchangeable bases for Eastern Cape ......... 87
7.11 Appendix K. Analysis of variance of gravimetric moisture content for KZN ...... 90
7.12 Appendix L. Analysis of variance of gravimetric moisture for Eastern Cape ...... 90
7.13 Appendix M. Analysis of variance of grain yield for Eastern Cape...................... 91
7.14 Appendix N. A general analysis of variance of dry matter yield for Eastern Cape
92
7.15 Appendix O. Annual mean rainfall for KwaZulu-Natal (2013-2016) ................... 92
7.16 Appendix P. Annual mean rainfall for Eastern Cape sites .................................... 93
ix
LIST OF FIGURES
Figure 2.1: Different rainwater harvesting techniques (Oweis and Hachum, 2006) ................ 6
Figure 2.2: Rooftop (a) and courtyard (b) rainwater harvesting (Kahinda et al., 2008) ............ 8
Figure 2.3: Runoff or vegetation filter strips (Barling and Moore, 1994) ............................... 11
Figure 2.4: Contour ridges (a) and contour bunds (b) (Lema and Majule, 2009). ................... 12
Figure 2.5: Contour bench terraces (Zingg and Hauser, 1959) ................................................ 13
Figure 2.6: Zai pits rainwater harvesting technique (Kahinda et al., 2007) ............................. 14
Figure 2.7: Hill sheet flow rainwater harvesting (Kahindra et al, 2007). ................................ 15
Figure 2.8: Ephemeral stream diversions with distribution canals (Li et al., 2008a) .............. 17
Figure 2.9: Flow chart for the selection of rainwater harvesting technique (Hatibu et al., 2006).
.................................................................................................................................................. 19
Figure 3.1: Map showing location of study sites in KZN and Eastern Cape provinces. ......... 27
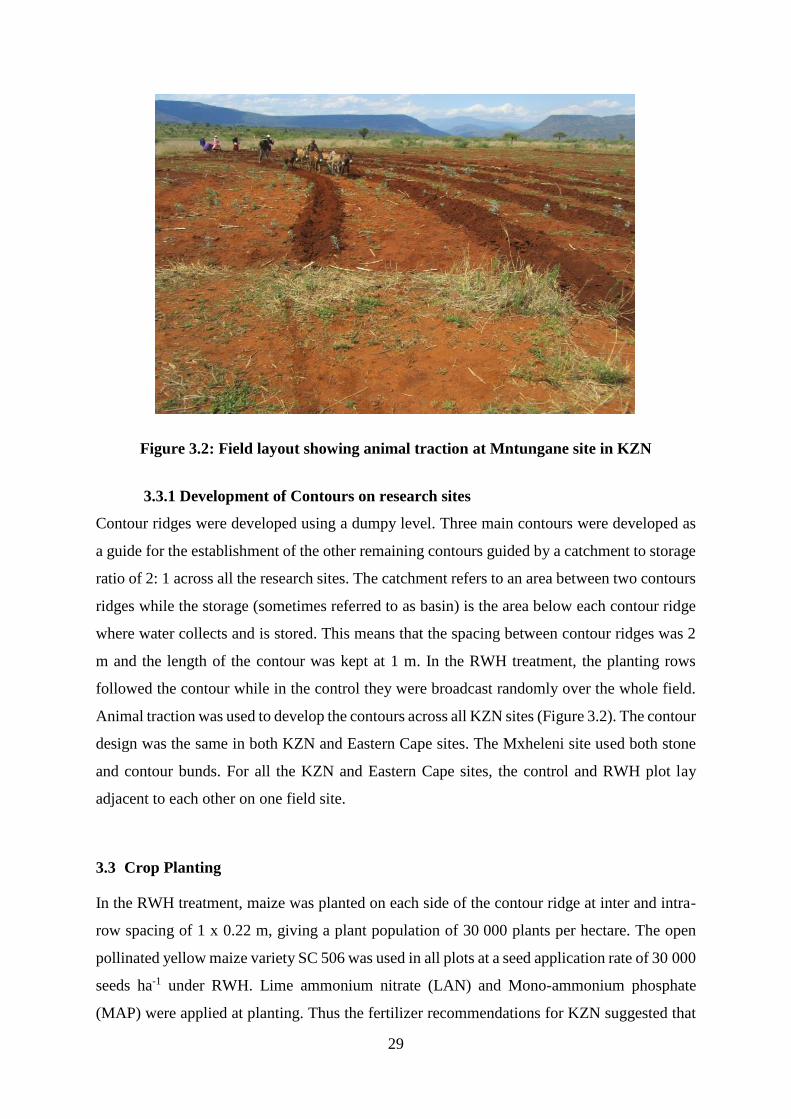
Figure 3.2: Field layout showing animal traction at Mntungane site in KZN ......................... 29
Figure 3.3: Sampling for gravimetric soil moisture at different contour positions ................. 31
Figure 4.1: Variation of soil moisture content for KZN sites. ................................................. 55
Figure 4.2: Variation of soil moisture content for Eastern Cape sites. .................................... 56
Figure 4.3: Grain and dry matter yield at different Eastern Cape sites in 2015 ...................... 57

x
LIST OF TABLES
Table 2.1: Guidelines for the application of some micro water harvesting techniques ............. 9
Table 4.1: Dominant soil forms and their characteristics for KZN sites ................................. 36
Table 4.2: Dominant soil forms and their characteristics for Eastern Cape sites .................... 37
Table 4.3: Aggregate stability before planting (2013) and at harvest (2015) for KZN sites ... 39
Table 4.4: Bulk density before planting (2013) and at harvest (2015) for KZN sites. ............ 40
Table 4.5: Aggregate stability before planting (2013) and at harvest (2015) for Eastern Cape
sites .......................................................................................................................................... 42
Table 4.6: Bulk density before planting (2013) and at harvest (2015) for Eastern Cape ........ 43
Table 4.7: Soil pH before planting (2013) and at harvest (2015) for KZN sites ..................... 44
Table 4.8: Micronutrients before planting (2013) and at harvest (2015) for KZN sites .......... 46
Table 4.9: Exchangeable bases before planting (2013) and at harvest (2015) for KZN sites . 48
Table 4.10: Soil pH before planting (2013) and at harvest (2015) for EC sites ...................... 50
Table 4.11: Micronutrients before planting (2013) and at harvest (2015) for EC sites ........... 52
Table 4.12: Exchangeable bases before planting (2013) and at harvest (2015) for EC ........... 54
1
1 CHAPTER ONE: GENERAL INTRODUCTION
Poverty is a challenge for South Africa’s population. About half the population is classified as
living in poverty while 25 % are extremely poor (Botha et al., 2003). This situation is even
worse in rural areas. To address food insecurity, the agricultural sector plays a vital role in
providing food and income for the majority of the population (Lema and Majule, 2009).
Agriculture is therefore considered as a good tool for reducing poverty and to create jobs in
rural areas (Botha et al., 2003). As a result, it is key to economic development as well as food
security of the country (Majule, 2008). However, agricultural production is facing serious
challenges of climate unreliability and variability (Lema and Majule, 2009). Climate variability
and change is recognised through changes in rainfall patterns, amounts and intensities.
Deficiencies in precipitation result in reductions in crop yields, and this is particularly true in
regions where annual rainfall ranges from 300 to 500 mm (Mertz et al., 2009). This is usually
the case for most rainfall regions within South Africa. Furthermore, South Africa is classified
as a semi–arid and water-scarce country (Schulze and Maharaj, 1997). It is amongst other
countries in sub-Saharan Africa that experiences limited precipitation over an extended period
of time (Thomas et al., 2007). South Africa receives mean annual rainfall of less than 500 mm
which is well below the global annual mean (Kahinda and Taigbenu, 2011). The rainfall also
experiences an erratic distribution. In addition to this, less than 15 % of land in South Africa is
arable. Thus, both low average rainfall and limited arable land make it difficult to successfully
and efficiently use natural resources for food and fibre production (Botha et al., 2003).
Smallholder agriculture has experienced land degradation in many parts of Africa including
South Africa. This is due to several factors including poor management coupled with over-
utilisation of natural resources such as vegetation and soil (Hensley et al., 2000). Overgrazing
on rangelands has resulted in loss of many grass species which impact on soil surface cover.
This results in poor infiltration, increased runoff as well as severe soil erosion. Crop and
livestock production in the communal farming regions of South Africa is mostly rain-fed, since
most farming communities do not possess the necessary irrigation facilities to supplement
rainfall. The reduction in water use efficiency is another additional challenge that South
African communal farmlands are facing (Howell, 2001). This is due to several factors such as
unproductive losses because of surface runoff and excessive soil evaporation due to bare soil
surfaces. These losses lead to reduction in agricultural food production.
2
Farming communities in South Africa have reported declining crop yields over the years (Deng
et al., 2006). There have also been reports of livestock mortality in Eastern Cape and in Kwa-
Zulu Natal provinces. These mortalities as well as declining crop yields are a result of limited
water availability under dry-land farming (Shackleton et al., 2001). It is therefore observed that
communities are vulnerable to the challenges of both low and erratic rainfall. It is reported that
the declining of rainfall occurrence is expected to be worse with time (Smithers and Schulze,
2003). To address the problem of limited water availability, different technologies have been
introduced in dry land agriculture in order to improve the quality and quantity of yields (Deng
et al., 2006a). These include advances in plant breeding, fertilizers and irrigation systems
(Mupangwa et al., 2006a). However, Wang et al. (2009) suggested that despite all these
technological innovations, climate variability remains a critical limiting factor in dry-land
agricultural production. The main reason for this is that the majority of the communal farmers
of South Africa are resource poor and cannot afford to implement the expensive technological
advancements. Rainfall variability and a low rainfall supply reduce the quality and availability
of water for crop growth and soil productivity (Wang et al., 2009). This in-turn reduces the
productivity of agricultural ecosystems. Different rainwater harvesting techniques (RWH) such
as in-field, ex-field and on farm rainwater harvesting that aim to supplement the limited rainfall
events have been introduced in communal farming regions of South Africa (Hensley et al.,
2000). Al-Shamiri and Ziadat (2012), defined RWH as the “concentration, collection, storage
and use of rainwater runoff for both domestic and agricultural purposes”. The different RWH
techniques adopted so far include both in situ and ex situ RWH technology. A detailed
description of the different techniques is given in chapter two.
Rainwater harvesting and conservation (RWH&C) techniques have not only been
demonstrated to increase agricultural crop production but also to be environmentally
sustainable (Botha et al., 2007). RWH improves soil water content and its availability for plant
uptake (Li et al., 2000a). This improves the uptake of nutrients by plants as water serves as a
transport medium for soil nutrients (Mbilinyi et al., 2005b). The aim of this research was to
assess the impact of the contour ridge RWH technique on crop yields and soil productivity in
comparison with the traditional farmers’ practise. The traditional farmer practise in this study
is referred to any practise that the farmer is employing on his or her field. The objectives of
this study were as follows:
1. To determine the effect of RWH on soil physico-chemical properties in comparison
with the traditional farmers’ practice.

3
2. To determine soil moisture content at different positions of the contour in comparison
with the control.
3. To assess crop yields under RWH in comparison with the traditional farmers’ practice.
4
2 CHAPTER TWO: LITERATURE REVIEW
2.1 Introduction
Aridity and climatic uncertainty are the leading challenges to agricultural productivity in arid
and semi-arid regions (Ammar et al., 2016). Farmers in these regions are heavily reliant on
rain-fed agriculture as the dominant farming system. Variable rainfall, which is poorly
distributed and is below average, is a challenge to farmers operating in these regions. South
Africa is a water stressed country characterised by low, erratic and poorly distributed rainfall
with high evaporation rates, and excessive runoff which result in soil losses (Kahinda et al.,
2010). It receives an average annual rainfall of 500 mm. Regions that are considered to receive
good rainfall in South Africa are few, and these are mostly along the south-eastern coastline
(Baiyegunhi, 2015). The greater part of the interior and western part of the country is
characterised as being arid or semi-arid. About 65 percent of South Africa receives an annual
rainfall which is below 500 mm per annum (Thomas et al., 2011). This is regarded as the
minimum for dry land agriculture. Furthermore, about 21.5% of South African regions receive
less than 200 mm of annual rainfall (Affairs and Forestry, 1994). This confirms that South
Africa is indeed experiencing water shortages due to low rainfall events.
Climate variability in South Africa has impacted significantly on both the availability and
requirements for water (Botha et al., 2007). South Africa is currently experiencing rainfall
shifts by way of a decrease in early summer rainfall i.e. from October to December and an
increase in late summer rainfall (January to March) (Tadross et al., 2005). The majority of the
South African population lives in rural areas that are mostly arid or semi-arid and marginal for
crop production, except for a small portion that is under irrigation (Baiyegunhi, 2015). Hall
(2007) stated that the practice of backyard gardens in rural communities adds up to 200 000 ha
of land which doubles the area that requires irrigation. This area is huge enough for the
production of food adequate for household food security. However, the major constraint is
inadequate and fluctuating water availability, which affects agricultural productivity and
profitability. This causes communal farmers to remain at subsistence level and in continuous
poverty (Baiyegunhi, 2015). The collection and storage of water for later use has long been
practiced in sub-Saharan Africa using indigenous knowledge systems. This practice is termed
rainwater harvesting.
5
2.2 History and origin of rainwater harvesting
Domestic rainwater harvesting (RWH) was basically used on farms, schools and hospitals
before improved water supply technologies became available (Suleman et al., 1995). This type
of rainwater harvesting was mainly used for drinking as well as domestic use, but not really for
agricultural purposes. The origin of rainwater harvesting is not easily traceable due to
numerous related techniques that were independently developed in different regions of the
world (Kahinda et al., 2007). In southern Jordan and southern Mesopotamia, RWH structures
were believed to have been constructed over 9000 years ago and as early as 4500 BC
respectively (Oweis and Hachum, 2006). In Ganzu province of China, rainwater wells as well
as jars only existed 2000 years ago (GNADLINGER, 2000). About 100 years BC, rainwater
harvesting was already a common technique in the Mediterranean and Middle East countries
such as Egypt, Palestine, Iran, Iraq as well as in Greece (Smet and Moriarty, 2001). The main
motive for rainwater harvesting was mostly for the collection of drinking water.
Other drivers for the origin of agricultural related RWH include population expansion, rural to
urban migration and rainfall variability (Bennie and Hensley, 2001). This has been the case for
South Africa. As the population begins to increase, the competition for natural resources such
as water also increases. This results in a desperate need for the implementation of alternative
technologies that will enhance an improved water supply for human consumption (Abu-
Awwad and Shatanawi, 1997). Population expansion also led to a greater demand on
agriculture in order to ensure food security. Rural to urban migration also contributed to
population expansion as many people migrated from the rural to the urban areas thus causing
an increased demand for water resources in the urban areas (Gao et al., 2014). Rainfall
variability is also another factor that contributed to the origin of rainwater harvesting
technologies. Rainfall variability is associated with the following major challenges (Gao et al,
2014):
(a) The poor spatial distribution and seasonality of rainfall that results in total crop
failure.
(b) Relatively low stream flows in rivers.
(c) Permanent crop failure in dry-land agriculture.
(d) Drought and extreme soil loss
(e) Reduction of soil fertility

6
South African government institutions such as the department of agriculture or department of
education have responded to a limited rainfall supply by donating water tanks to people for
improved water storage (Dilley, 2000). However, there is a need for up scaling and out-scaling
of rainwater harvesting techniques. It is not only the soil surface that can be used, but different
structures can be used to successfully store water. These include the storage of rainwater from
rooftops or courtyards. This form of storing rainwater is common in rural households, and is
used for domestic purposes, gardening as well as small-scale agricultural productive activities
(Baiyegunhi, 2015). The following section discusses different rainwater harvesting
technologies that are available and currently used in different parts of Africa.
2.3 Overview of different rainwater harvesting techniques
Rainwater harvesting can be classified into two categories namely micro and macro catchment
depending on the catchment area (Kahinda et al., 2008). In micro-catchment rainwater
harvesting, runoff is collected from a small catchment area where sheet flow prevails over a
short distance (Deng et al., 2006b). Macro-catchment rainwater harvesting on the other hand
is characterized by runoff water collected from large natural catchments such as hills or
mountains. Figure 2.1 illustrates the distinction between micro- and macro-catchment
rainwater harvesting techniques.
Figure 2.1: Different rainwater harvesting techniques (Oweis and Hachum, 2006)
Water Harvesting Methods
Macro catchment
Off wadi system
water spreadin
g
Large bunds
Hafair, tanks and
Liman
Cistems
Hillside conduits
Wadi-bed system
Small farms
reservours
Wadi bed
cultivation
Jessour
Micro catchment
Roof top systems On farm systems
contour bench
terraces
Inter row
systems
Small runoff basins
(Negarim)
Semi-circular/ trapezoi
d
MeskatsRunoff strips
Small pits
Contour Ridges
7
The following section will discuss some of the techniques illustrated in Figure 2.1 in detail.
However, not all the techniques displayed in the Figure will be discussed, only those that are
common and have been adopted in South Africa are discussed.
As shown in Figure 2.1, micro catchment rainwater harvesting can further be divided into on-
farm and rooftop system. Techniques of rainwater harvesting possible under on-farm are
contour ridges, small pits, runoff strips as well as meskat. Under rooftop micro catchment
rainwater harvesting, systems like semi-circular/ trapezoidal, small runoff basin, inter row as
well as contour bench terraces are considered. Macro catchment and floodwater methods can
also be subdivided into wadi-bed systems as well as off-wadi systems. Under wadi-bed,
systems like small farm reservoirs, wadi-bed cultivation and jessour can be applied. Techniques
like water-spreading, large bunds, hafair, tanks and liman, cisterns as well as hillside conduits
can be considered under off-wadi system.
2.3.1 Micro-catchment rainwater harvesting
Micro-catchment rainwater harvesting systems include contour ridges, runoff strips and many
others shown in Figure 2.1. These are characterised by having smaller runoff generating areas
(Gao et al., 2014). The advantage of this system is its cost efficiency, as it is cheap and easy to
implement. In the micro-catchment techniques, the cropped area is usually adjacent to a
catchment area, which is located above the cropped area and is clear of vegetation in order to
increase the runoff. This results in excess water being available for crop uptake, thereby
reducing water stress during extremely dry conditions (Li and Gong, 2002). The micro-
catchment system is ideal for crop production under arid and semi- arid regions for subsistence
and large-scale farming. Micro-catchment rainwater harvesting is further subdivided into two
categories, namely rooftop and courtyard system, and the on-farm system. Rooftop and
courtyard rainwater harvesting is referred to as domestic rainwater harvesting (Kahinda et al.,
2008). Here, water is collected from roofs of buildings then stored in tanks, jars and/or in
underground systems as illustrated in Figure 2.2. These systems are generally used in cities,
villages and on farmhouses for small-scale utilization in gardens or for household consumption.
On-farm is different from courtyard rainwater harvesting in that in on-farm, runoff is collected
in a catchment then used for agricultural purposes.
8
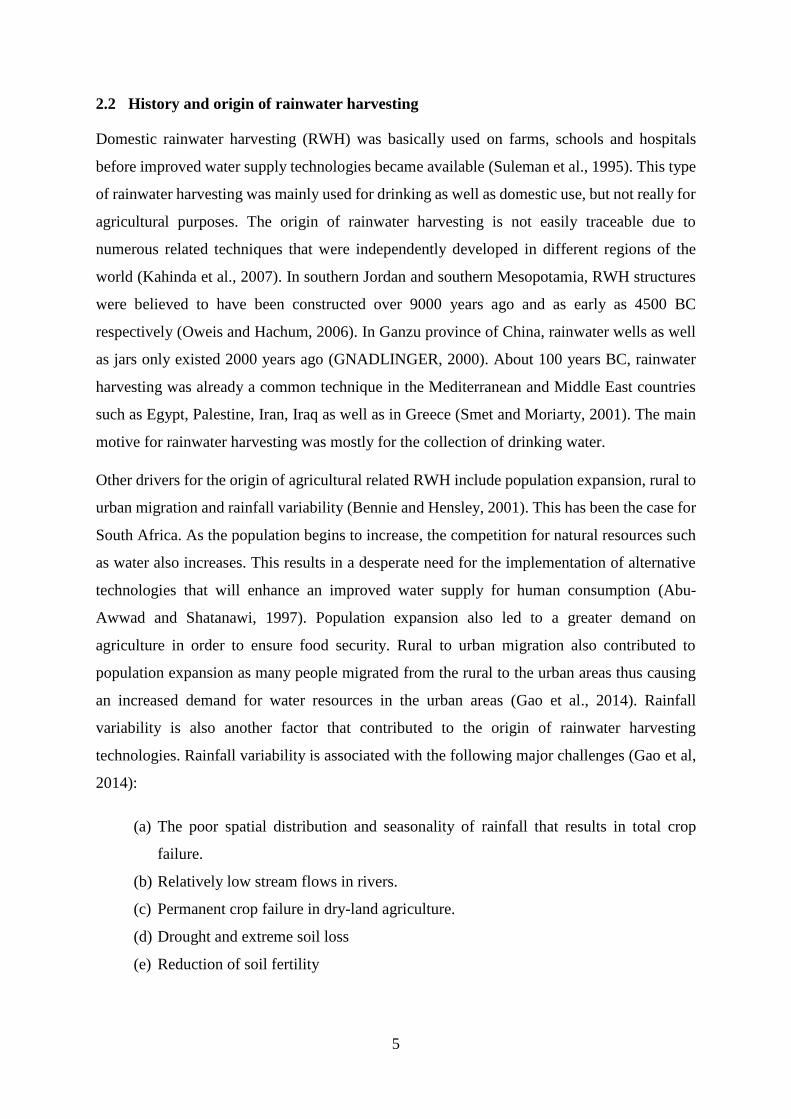
Figure 2.2: Rooftop (a) and courtyard (b) rainwater harvesting (Kahinda et al., 2008)
Table 2.1 gives the guidelines for application of micro-catchment rainwater harvesting.
Contour ridges can be used when planting trees, vegetables as well as field crops. However,
the soil depth should be above 500 mm while soil texture can be variable. This technique
performs best at a slope between 4 and 12 % (Joseph, 2007). Different techniques with their
associated crop type as well as suitable soil properties are outlined in Table 2.1.
b a

9
Table 2.1: Guidelines for the application of some micro water harvesting techniques
Technique Crop type Soil Properties
Depth (mm) Texture (%) Slope (%)
Contour ridge Trees,
vegetables and
veld
>1000 or Variable 4-12
500-1000+
Tied ridging Various Crops 500-1000+ Variable 1-50
Contour
ridging with
bunds
Various Crops 500-1000+ Variable 1-50
Shallow
trenching
Various Crops 500-1000+ Variable <4
Deep trenching Trees, various
crops and
vegetables
>1000 or Variable <4
500-1000+
Basin tillage Various crops
and trees
500-1000+ Variable 4-12
Pot-holing Veld, Trees and
various crops
>1000 Variable 4-12
500-1000+
Runoff strip Various crops 500-1000 Variable 2-4
In-field Rain
Water
Harvesting
Various crops >700 20-60 % clay 1-7
Source: (Joseph, 2007)
10
On-farm rainwater harvesting can be further divided into runoff strips, bunds, contour ridges,
terraces, planting pits and basins among others.
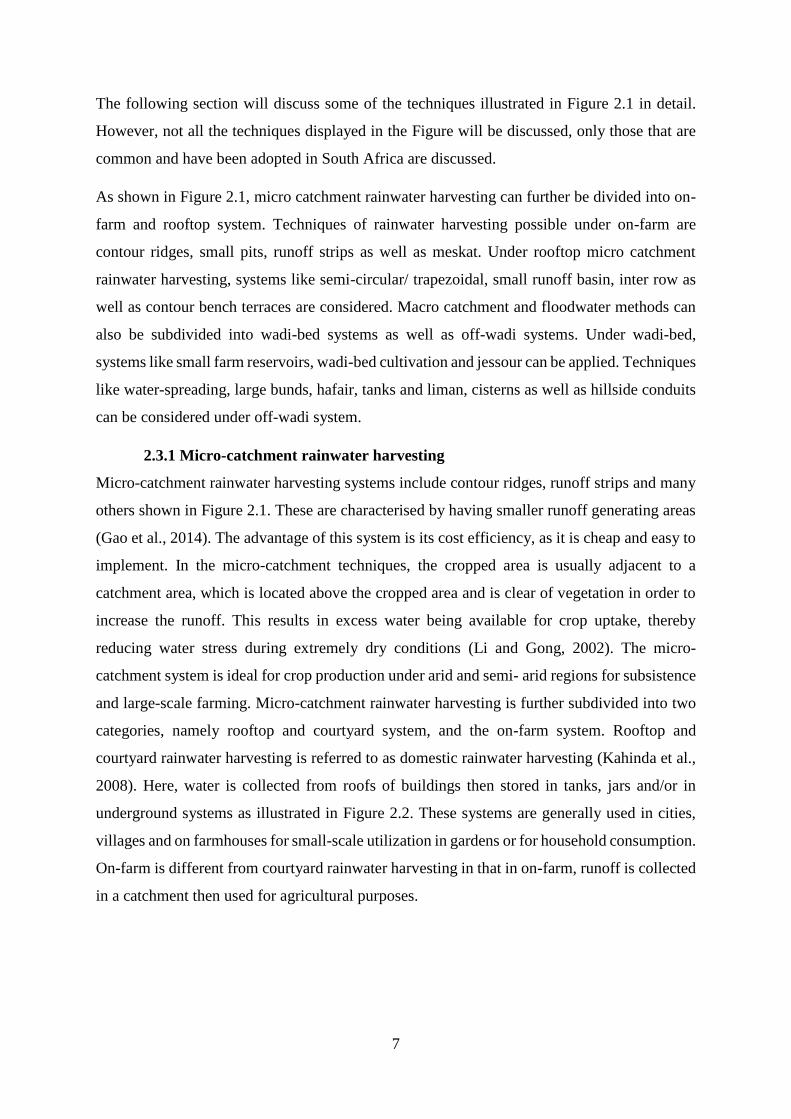
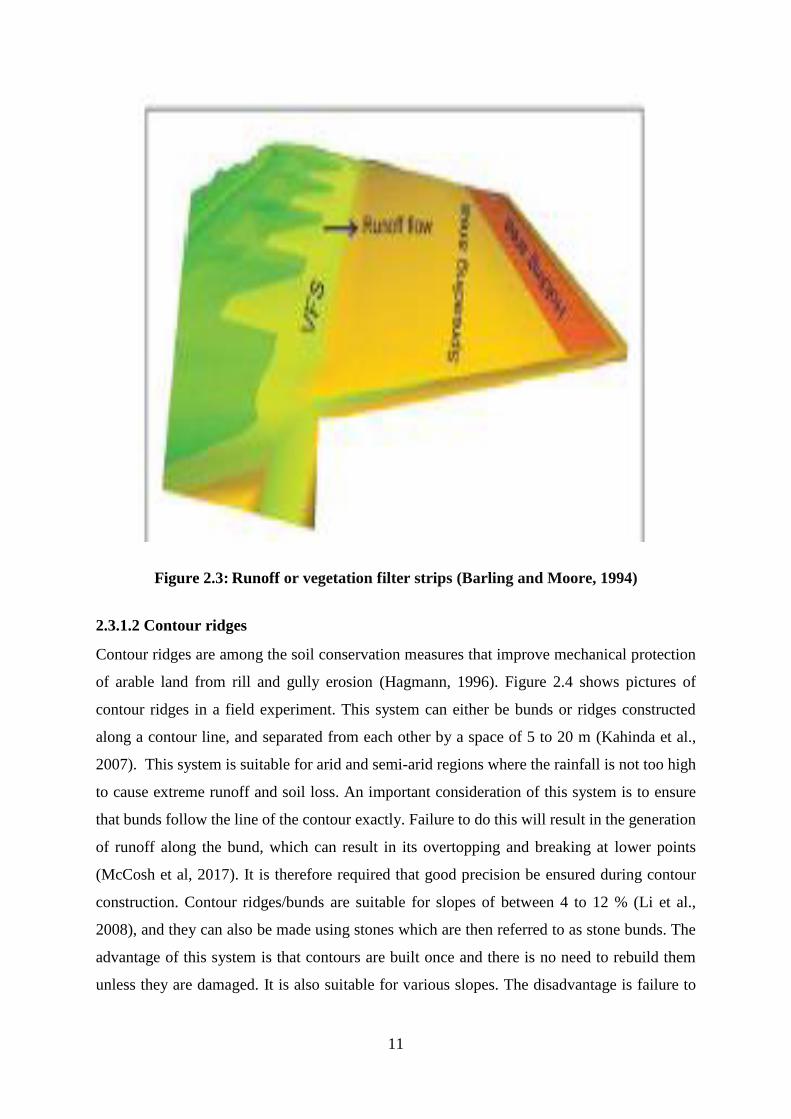
2.3.1.1 Runoff strips
Runoff strips which are sometimes referred to as vegetative filter strips (VFS) are either plants
that are collectively planted downslope of the crop land or animal production facilities
(Kahinda and Taigbenu, 2011). Their significance includes localised erosion protection and to
filter nutrient sediments, organics, pathogens and pesticides from agricultural runoff before
they reach receiving waters. Figure 2.3 shows how the runoff strips are used in the field. Ridges
are constructed along the contours where strips are used to support crops in the drier regions.
The upstream strip is used as the catchment area while the downstream is used to support crops
(Kahinda and Taigbenu, 2011). The advantages of this system is that the surface is permanently
covered with vegetation. This will increase the organic carbon content of the soil and reduce
soil loss through erosion and surface evaporation. In areas where activities associated with
livestock are high, the major pollutants in these areas includes nitrogen, phosphorus and
sediments (Kahinda et al., 2007). This system is effective at removing these pollutants in
surface runoff. This is achieved through changes in flow hydraulics that enhance the runoff and
pollutants to infiltrate into the soil profile. It further enhances the deposition of total suspended
solids through filtration of suspended sediments by vegetation and adsorption on soil and plant
surfaces. The adsorbed pollutants are then trapped in the soil profile by a combination of
physical, chemical and biological processes. The infiltrability status of the soil plays a
significant role in this system as it decreases surface runoff, thereby reducing pollutant losses
(Kahinda et al., 2010).
11
Figure 2.3: Runoff or vegetation filter strips (Barling and Moore, 1994)
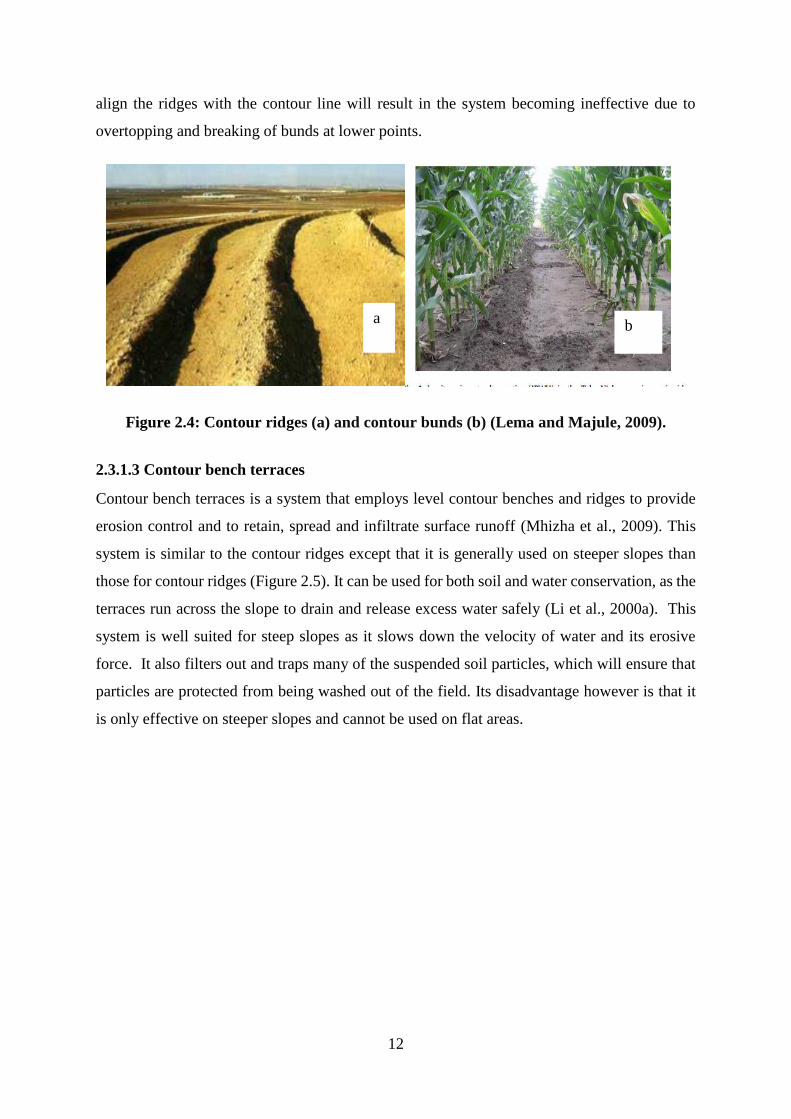
2.3.1.2 Contour ridges
Contour ridges are among the soil conservation measures that improve mechanical protection
of arable land from rill and gully erosion (Hagmann, 1996). Figure 2.4 shows pictures of
contour ridges in a field experiment. This system can either be bunds or ridges constructed
along a contour line, and separated from each other by a space of 5 to 20 m (Kahinda et al.,
2007). This system is suitable for arid and semi-arid regions where the rainfall is not too high
to cause extreme runoff and soil loss. An important consideration of this system is to ensure
that bunds follow the line of the contour exactly. Failure to do this will result in the generation
of runoff along the bund, which can result in its overtopping and breaking at lower points
(McCosh et al, 2017). It is therefore required that good precision be ensured during contour
construction. Contour ridges/bunds are suitable for slopes of between 4 to 12 % (Li et al.,
2008), and they can also be made using stones which are then referred to as stone bunds. The
advantage of this system is that contours are built once and there is no need to rebuild them
unless they are damaged. It is also suitable for various slopes. The disadvantage is failure to
12
align the ridges with the contour line will result in the system becoming ineffective due to
overtopping and breaking of bunds at lower points.
Figure 2.4: Contour ridges (a) and contour bunds (b) (Lema and Majule, 2009).
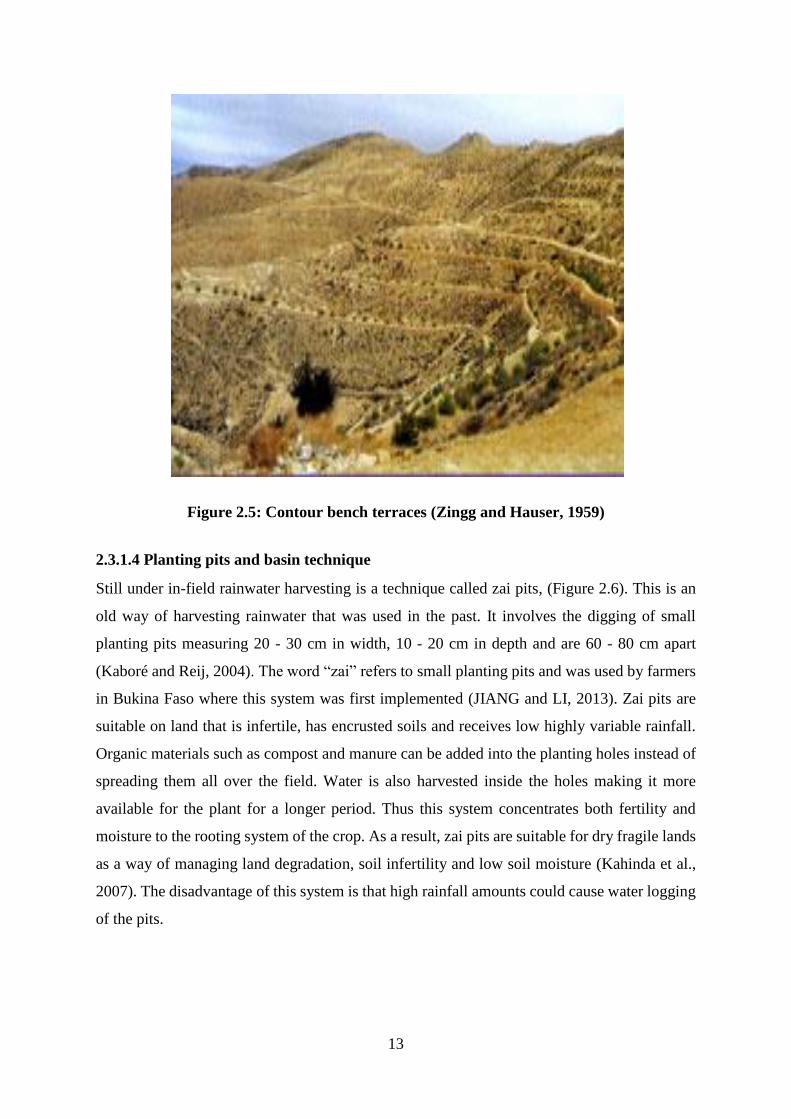
2.3.1.3 Contour bench terraces
Contour bench terraces is a system that employs level contour benches and ridges to provide
erosion control and to retain, spread and infiltrate surface runoff (Mhizha et al., 2009). This
system is similar to the contour ridges except that it is generally used on steeper slopes than
those for contour ridges (Figure 2.5). It can be used for both soil and water conservation, as the
terraces run across the slope to drain and release excess water safely (Li et al., 2000a). This
system is well suited for steep slopes as it slows down the velocity of water and its erosive
force. It also filters out and traps many of the suspended soil particles, which will ensure that
particles are protected from being washed out of the field. Its disadvantage however is that it
is only effective on steeper slopes and cannot be used on flat areas.
b a
13
Figure 2.5: Contour bench terraces (Zingg and Hauser, 1959)
2.3.1.4 Planting pits and basin technique
Still under in-field rainwater harvesting is a technique called zai pits, (Figure 2.6). This is an
old way of harvesting rainwater that was used in the past. It involves the digging of small
planting pits measuring 20 - 30 cm in width, 10 - 20 cm in depth and are 60 - 80 cm apart
(Kaboré and Reij, 2004). The word “zai” refers to small planting pits and was used by farmers
in Bukina Faso where this system was first implemented (JIANG and LI, 2013). Zai pits are
suitable on land that is infertile, has encrusted soils and receives low highly variable rainfall.
Organic materials such as compost and manure can be added into the planting holes instead of
spreading them all over the field. Water is also harvested inside the holes making it more
available for the plant for a longer period. Thus this system concentrates both fertility and
moisture to the rooting system of the crop. As a result, zai pits are suitable for dry fragile lands
as a way of managing land degradation, soil infertility and low soil moisture (Kahinda et al.,
2007). The disadvantage of this system is that high rainfall amounts could cause water logging
of the pits.

14
Figure 2.6: Zai pits rainwater harvesting technique (Kahinda et al., 2007)
2.3.2 Macro-catchment rainwater harvesting
Macro-catchment or external catchment rainwater harvesting is a system that involves the
collection of runoff water from large areas that are at a notable distance from where it is being
used (Mupangwa et al., 2006b). This system involves the harvesting of water from catchments
of areas ranging from 0.1 to thousands of hectares. These catchment areas can either be located
near the cropped area or further distances away (JIANG and LI, 2013). Harvested rain water is
usually used on cropped areas that are either terraced or on flat lands (Ren et al., 2008).
Structures of diversion and distribution networks are usually used to convey runoff water when
the catchment is large and located at a significant distance from cropped areas. In macro
catchment rainwater harvesting, the runoff volumes and flow rates are higher than those of
micro catchment systems. It is for this reason that macro catchment rainwater harvesting
usually has problems associated with managing potentially demanding peak flows, which may
lead to serious erosion and sediment deposition. Therefore, it is advisable that substantial
channels and runoff control structures must be built. In cases where the macro catchments
rainwater harvesting produces high volumes of runoff that cannot be stored in the soil profile;
the harvested water is stored in dams or water holes. That is why small dams are normally
constructed across rolling topography where creeks can be found.
15
The adoption of macro-catchment rainwater harvesting is frustrated by biophysical constraints
such as the risk associated with the design of the system. This is because it is not easy to time
and estimate the amount of runoff that is likely to be received each year. Sometimes the system
receives high runoff volumes and flow rates, which results in serious soil losses. In that case
substantial channels as well as runoff control structures such as stone bunds should be
considered (Mzirai and Tumbo, 2010). The following section will be illustrating examples of
macro catchment rainwater harvesting.
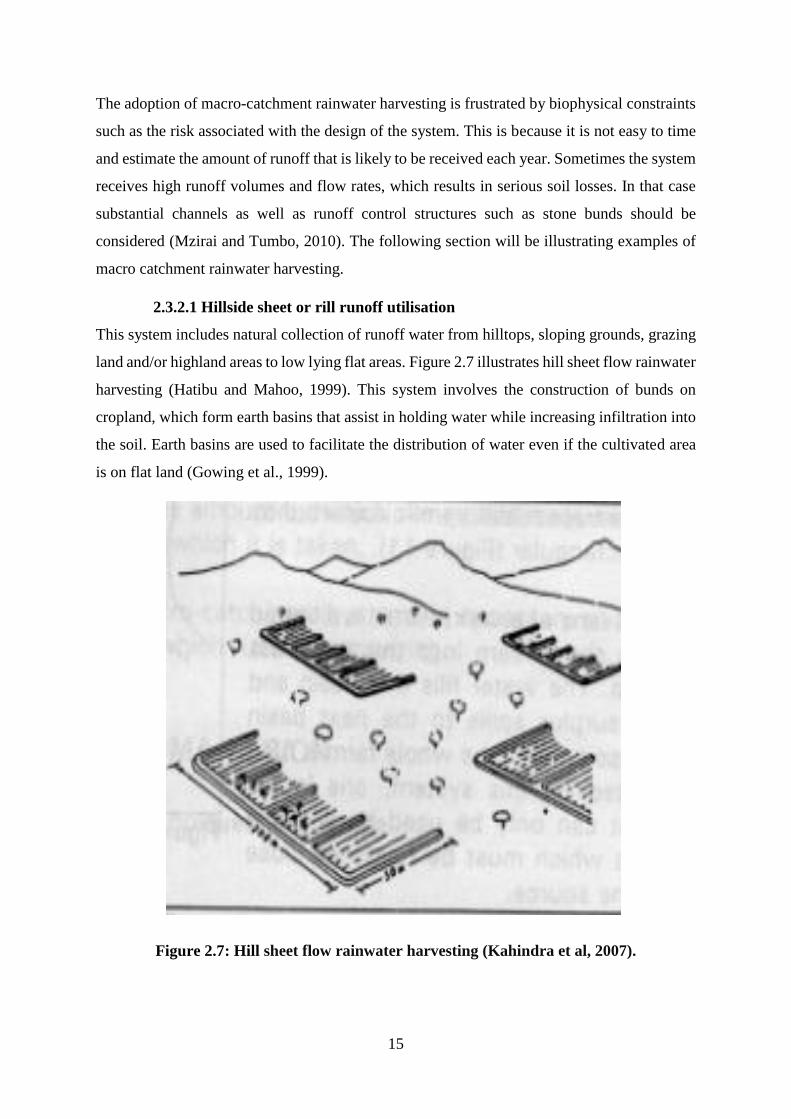
2.3.2.1 Hillside sheet or rill runoff utilisation
This system includes natural collection of runoff water from hilltops, sloping grounds, grazing
land and/or highland areas to low lying flat areas. Figure 2.7 illustrates hill sheet flow rainwater
harvesting (Hatibu and Mahoo, 1999). This system involves the construction of bunds on
cropland, which form earth basins that assist in holding water while increasing infiltration into
the soil. Earth basins are used to facilitate the distribution of water even if the cultivated area
is on flat land (Gowing et al., 1999).
Figure 2.7: Hill sheet flow rainwater harvesting (Kahindra et al, 2007).
16
2.3.2.2 Floodwater harvesting within the stream bed
This system uses barriers such as permeable stone dams to reduce water flow and spread it on
the adjacent plain, thereby enhancing soil infiltration rate. The wetted area is then used for crop
production (Kahindra et al., 2011). Advantages of this system include the improvement of land
management due to silting up of gullies with fertile deposits. It also increases crop production
and erosion control because of harvesting and spreading of floodwater. Groundwater recharge
is also enhanced. This system also reduces runoff velocities as well as the erosive potential of
water. The major disadvantage of this system is the high labour cost during implementation
and requirement for large quantities of stones (Jiang and Li., 2013). It is also suitable for areas
receiving high volumes of rainfall only.
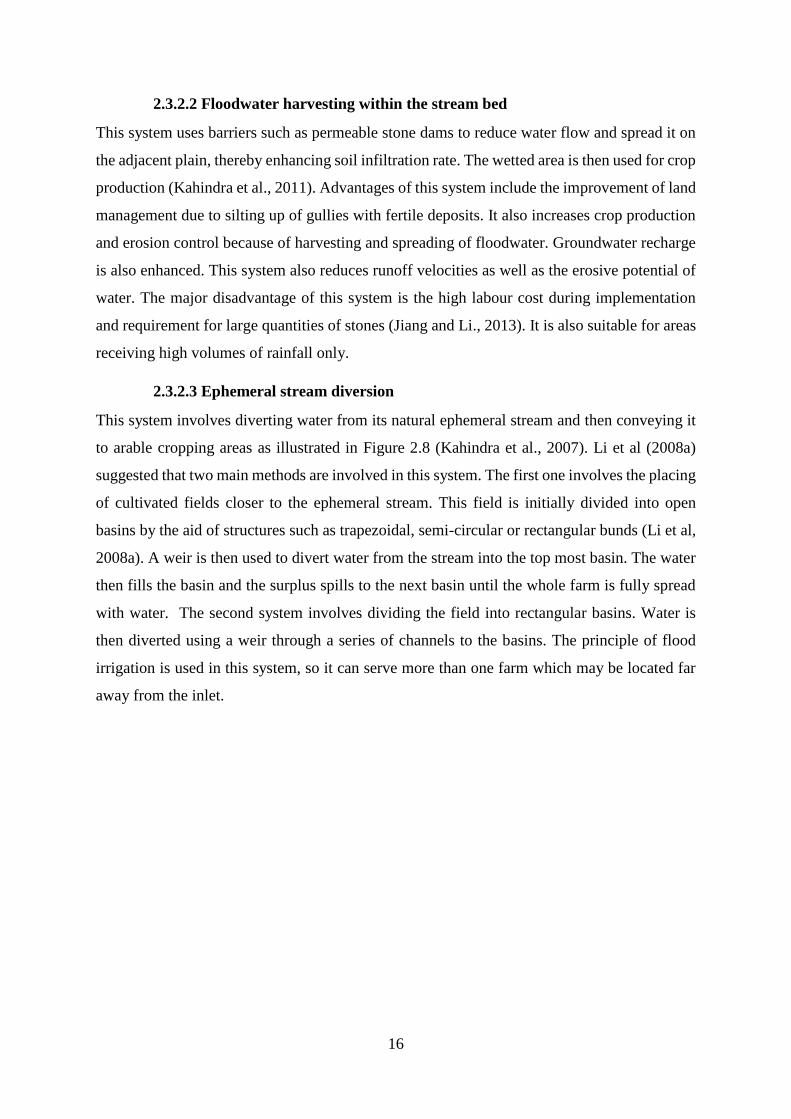
2.3.2.3 Ephemeral stream diversion
This system involves diverting water from its natural ephemeral stream and then conveying it
to arable cropping areas as illustrated in Figure 2.8 (Kahindra et al., 2007). Li et al (2008a)
suggested that two main methods are involved in this system. The first one involves the placing
of cultivated fields closer to the ephemeral stream. This field is initially divided into open
basins by the aid of structures such as trapezoidal, semi-circular or rectangular bunds (Li et al,
2008a). A weir is then used to divert water from the stream into the top most basin. The water
then fills the basin and the surplus spills to the next basin until the whole farm is fully spread
with water. The second system involves dividing the field into rectangular basins. Water is
then diverted using a weir through a series of channels to the basins. The principle of flood
irrigation is used in this system, so it can serve more than one farm which may be located far
away from the inlet.
17
Figure 2.8: Ephemeral stream diversions with distribution canals (Li et al., 2008a)
18
2.4 Guidelines for selecting site for rainwater harvesting techniques
Biophysical factors such as landscape, slope, amount of rainfall and its distribution, slope type
are key factors to consider when choosing a site for rainwater harvesting. Furthermore, social
and cultural aspects of the area of concern should be given due consideration (Kahinda et al.,
2007). These factors will affect the success or failure of the technique implemented. When
these factors are well considered it will then be easy for end users to adopt the technology. A
flow chart was developed which is useful when selecting a site for rainwater harvesting (Hatibu
et al., 2006). Figure 2.9 shows how to qualify the site for rainwater harvesting. This is based
on the slope gradient. Different slope gradients are suitable for different rainwater harvesting
technology. The summary of what the Figure represents is described as follows:
The RWH techniques suitable for a land where crop production is being considered, and for
slopes less than 8 % but where irrigation is not possible include contour, stone and trapezoidal
bunds, as well as contour ridges. This is assuming that all biophysical factors such as soil
texture, depth and rainfall are suitable for the implementation of rainwater harvesting. Under
the same conditions but considering tree or forestation development, all micro catchment
rainwater harvesting techniques can be considered. In the case of rangelands or fodder
production under the same biophysical conditions as outlined before, contour bunds and semi-
circular trees can be implemented using large scale mechanisation or hand dug on small scale
respectively. On the other hand, when the slope is greater than 8 % and when considering crop
production, water spreading bunds and permeable rock dams can be implemented.
Indigenous knowledge for selecting suitability of site for rainwater harvesting suggests that the
site should have medium to low slope i.e. slopes less than 8 percent (Mbilinyi et al., 2005a).
The reason for this is that soils in this type of slope are often deep enough for the
implementation of rainwater harvest and hence less susceptible to erosion. However, there are
technologies that can be implemented on steeper slopes. Figure 2.9 shows that spreading bunds
and permeable rock dams can be considered in areas of steeper slopes. The problem with
steeper slopes is that they are associated with high labour intensity, which is costly to
subsistence farmers. For rainwater harvesting to be a success, the site must have access to
runoff which is a function of its location along a toposequence (Mbilinyi et al., 2005a). This
means farmers located downslope stand a good chance to successfully implement rainwater
harvesting. In terms of soil properties, soils with high water holding capacity are well suitable
for the implementation of rainwater harvesting so as to minimise erosion. Thus, loamy soil

19
textures are the best for rainwater harvesting because of their high water holding capacity
which allow better water seepage and percolation. Areas dominated by sandy textures are not
suitable for implementation of rainwater harvesting (Mbilinyi et al., 2005a). This is because
sandy soils cannot store water for long periods, as they have low infiltration rates and can easily
be washed away when runoff is high. This will defeat the purpose of rainwater harvesting.
Figure 2.9: Flow chart for the selection of rainwater harvesting technique (Hatibu et al.,
2006).
Semi-arid/ Arid areas
Slope < 5 %
Irrigation viable
Irrigation not viable
SuiTable soils
WH possible
runoff farming (water source-overland flow
rangeland fodder
large scale
mechanised
contour bunds
small scale hand
dig
semi circular
trees
Trees
large scale
mechanised
contour bunds
small scale hand
dig
micro catchment
s
Crop production
none available
Contour stone bunds
no stones available
Trapezoidla bunds or
contour ridges
flood water farming (water source-channel
flow)
Crop production
Diversion system
Water spreading
bunds
within bed
spreading system
Permeable rock dams
Problem soils
WH not recommended
Slope > 5 %
Problem soils
WH not recommend
ed
20
2.5 Challenges and opportunities for rainwater harvesting in South Africa.
South Africa has not yet successfully adopted rainwater harvesting techniques due to the often-
prohibitive costs needed to construct RWH storage structures. Rural farmers also do not have
the skills required for successful implementation of these technologies. Jiang et al. (2013)
suggested that the main challenge to the adoption of rainwater harvesting is the ability to select
suitable land that will allow for its implementation. Apart from this, there is also not enough
literature on rainwater harvesting that relates its functioning and purpose for agricultural and
domestic uses (Ren et al., 2008). Resource constrained farmers cannot afford to pay skilled
personnel that will ensure correct implementation of the techniques. Rainwater harvesting also
requires high labour input to implement initially and for its maintenance thereafter. Another
limitation includes the unavailability of required machinery. Kahindra et al. (2008) stated that
socio-economic studies of micro-basin tillage in Free State showed that it was hands on, and
demanding high labour input. Since the rural communities do not have the means to pay for
external labour, they then fail to implement and sustain rainwater-harvesting techniques.
The other challenge concerning implementation of rainwater harvesting in many countries
including South Africa is that it is not included in water policies. Water management is usually
based on renewable water, which is surface and groundwater with little consideration for
rainwater (Kahindra et al., 2007). This will result in low quantities of water reaching people
and ecosystems downstream, which will cause conflicts. The one last challenge for sustainable
implementation of rainwater harvesting is the need for institutional support (Xiaolong et al.,
2008). Kahindra et al. (2008) alluded to the fact that policy should consider establishing a body
that co-ordinates rainwater harvesting. This body will focus on making the technology expand
in terms of establishment and also guide how it can be practiced. It can be concluded that there
is huge requirement for the government and non-governmental organisations to fund rainwater
harvesting research and implementation (Kahindra et al., 2008).
21
2.6 Effect of rainwater harvesting on selected soil physical properties.
Soil physical properties are important parameters in crop production as they determine the
amount of water that will be available for plant uptake (Horneck et al., 2011). These include
bulk density, aggregate stability, porosity and hydraulic conductivity among others (Brady and
Weil, 2000). Factors such as the addition of organic matter, changing the land use from
conventional to minimum or zero tillage directly affects soil physical properties (Horneck et
al., 2011). Al-Seekh and Mohammad (2009) studied the effect of stone terraces and contour
ridges on soil moisture. They found that soil moisture content was about 45 percent higher in
both rainwater harvesting techniques compared with the control. The reason for this was a
reduced surface runoff which led to increased infiltration and soil moisture stored in the profile
under stone terraces and contour ridges (Al-Seekh and Mohammad, 2009). The increase in soil
moisture due to rainwater harvesting was also observed in the study where contour bunds were
used as the rainwater harvesting technique in arid areas of Central Australia (Dunkerley, 2002).
Botha et al. (2007) conducted another study that supports these findings where soil moisture
was improved because of introducing rainwater harvesting, when mulching technology was
used to harvest rainwater. They associated the increase in soil moisture content to the fact that
mulch cover reduces surface water loss through evaporation during low rainfall events and
therefore the water is stored in the soil profile for the used by the plants.
Shreshtha et al. (2007) in their study found that stone terraces and contour bunds decreased soil
bulk density and increased aggregate stability since they were also coupled with mulching. The
increase in aggregate stability where mulch was added to the soil was associated with the
mulching effect, i.e., mulching improves the soil’s resistance to external disruptive forces
further enhancing the stability of soil aggregates (Mulumba and Lal, 2008). This will equally
decrease the bulk density of the soil. In another study where contour ridges were used as
rainwater harvesting, it was found that aggregate stability also increased where contour ridges
were used compared to the control (Shrestha et al., 2007). Furthermore, Hummad et al. (2004)
conducted a study where stonewalled terracing technique was assessed to see its effect on soil-
water conservation and wheat production. They found that aggregate stability as a measure of
water stable aggregate (WSA) was 2-2.5 times higher in the stone-walled terracing plot
compared with non-stonewalled terracing plot. The improved aggregate stability was
considered as an important factor in controlling surface runoff and soil erosion.
22
2.7 Soil chemical properties and fertility as influenced by rainwater harvesting
Chemical as well as fertility status of the soil is affected by many factors including soil water
(Bulluck et al., 2002). This further affects crop performance. Singh et al (2012) evaluated the
effect of rainwater harvesting (i.e. contour and box trenches) combined with afforestation on
soil properties, tree growth and restoration of degraded hills. They did their initial
measurements on soil pH, electric conductivity, organic carbon, ammonium and nitrate-N,
extractable phosphorus, soil water dynamics and texture in 2005 then final measurements in
2010. They found an increase in soil pH, organic carbon, electric conductivity, ammonium
nitrogen (NH4+), nitrate (NO3-N) and extractable phosphate (PO4-P) down the slope of their
study sites (Singh et al., 2012). This was not attributed to the rainwater harvesting but rather to
mass movement of material from the upper to lower slope. This resulted in the accumulation
of salts and nutrients transported along with water from upper to lower slope positions (Singh
et al., 2012). Yong et al (2006) also observed similar trends of nutrient accumulation from
upper slope to lower slope. The greatest increase in SOC was observed in the 10-20 % slope,
and this was associated with the effect of rainwater harvesting, as it enabled soil water retention
and nutrient mobilization that enhanced vegetation cover as well as turnover of roots and litter
(Singh et al., 2012). Another study done in semi-arid China where mulch coupled with no till
practice was used as a form of rainwater harvesting suggested an increase in soil organic carbon
by 2.7 % compared with the conventional tillage practice where maize crop was planted (Liu
et al., 2009). Al-Seekh and Mohammad (2009) also obtained a 5 % increase in soil organic
carbon in their study where they studied the effect of harvesting rainwater on runoff, sediments
and soil properties. These two studies indicate that the rainwater harvesting technique improves
soil organic carbon.
Based on this literature, it can therefore be concluded that the benefits of rainwater harvesting
include crop yield increases, improved soil fertility especially when it is mixed with soil
conversation techniques such as mulching, minimum and zero tillage, (Blevin et al, 1983).
However, another short-term study to assess the impact of stone bench terraces on soil
properties and crop response in the Peruvian Andes suggested no effect of this technique on
soil fertility (Posthumus and Stroosnijder, 2010). The results from this study showed no
significant differences in soil chemical nutrients between rainwater harvesting and control
plots. They indicated that a change in soil chemical properties could not be expected since the
study was run over short period, i.e. over a period of two growing seasons.

23
2.8 Crop yields as affected by rainwater harvesting
There are studies that have proven that rainwater harvesting improves crop yields and thus
promotes food security to rural farmers. A study by Botha et al (2003) in Taba Nchu area in
Free State province of South Africa is one example where in-field rainwater harvesting
significantly improved maize and sunflower production in homestead gardens. Their
treatments included organic mulch in basins and bare surfaces in runoff area (ObBr), organic
mulch in basin and organic mulch on runoff area (ObOr), organic mulch in basin and stone
mulch on runoff area (ObSr) and stone mulch in basin and stone mulch in runoff area (SbSr).
The rainwater-harvesting treatments above were compared with conventional tillage (CON)
practice. They measured seed and biomass yield and the results obtained from their study
indicated that ObSr, treatment was 15 % higher than the CON treatment for maize seed yield
while ObOr was 5 % higher than the CON for maize biomass yield. The seed yields obtained
for sunflower followed the order ObSr > ObOr > ObBr > SbSr > CON. However, no significant
difference was observed between treatments for biomass yield for both maize and sunflower
crops in their study. An improvement in seed yields under RWH treatments compared to the
CON plot was an evidence that rainwater harvesting has the potential to improve crop yields
and thus food security. In another study in India, ridge-furrow tillage was tested against
conventional tillage in a sub humid area that is prone to drought during the production of sweet
sorghum (Wang et al., 2009). They found that ridge furrow over-performed the control plot by
15 percent for both grain and biomass yields.
Another study conducted in the Mediterranean where stone-walled terraces were compared
with a non-stonewalled terrace control for wheat production, showed that rainwater harvesting
was 43 % higher than the control plot for both grain yield and dry matter yields (Hammad et
al., 2004). Similar results where plastic mulch treated with several treatments that aimed at
reducing surface evaporation were used during the sorghum production, found improvement
in sorghum biomass yield when compared to the control (Wang et al., 2009). Based on these
findings, it can be concluded that rainwater harvesting technologies can be considered as an
alternative for farmers operating under dry land agriculture in arid and semi-arid regions to
improve their crop production and household food security (Li et al., 2000b). In another study
done by Posthumus and Stroosnijder (2010), where the short-term impact of bench terraces as
rainwater harvesting technique on soil properties and maize yields was studied. They found
24
that though there was no evidence that soil fertility was improved as a result of this technique,
water productivity was improved, which resulted in average grain yield being higher where
bench terraces was employed compared with the control plot. This study was conducted for
only two growing seasons.
2.9 Level of adoption of rainwater harvesting in South Africa
Rainwater harvesting is mostly adopted in areas of high population such as in China where cost
of developing surface or groundwater reserves are restricting. It has been hugely adopted in
arid and semi-arid regions. However, its adoption is very low in South Africa due to the high
cost and skill requirement for this technology. The only rainwater harvesting technique that is
common in South Africa is the trapping of rainwater using the rooftop system for domestic use.
South African departments such as human settlement have adopted this method by providing
households with tanks for rainwater harvesting purposes across all of its nine provinces. About
1 % of South Africa’s rural inhabitants are currently using domestic rainwater harvesting as
their main water source (Kahindra et al., 2007). The department of agriculture and rural
development has also adopted the rooftop and courtyard rainwater harvesting methods in
supporting small-scale farmers in rural areas that are facing drought. While the department of
education has implemented this technique by providing schools with rainwater harvesting tanks
in an effort to curb rainfall variability and water shortage experienced throughout the country.
In-field rainwater harvesting techniques such as contour ridges are mostly implemented at
household level in the backyard while the ex-field rainwater harvesting such as contour
terracing, percolating tanks etc. is not very common. Eastern Cape is one province that has
considered use of contour ridges in their homestead gardens. In Kwa-Zulu Natal, most rural
farmers use contour bunds to harvest rainwater in their gardens especially when planting sweet
potatoes (Baiyegunhi., 2015). This is due to the high water consumption required by sweet
potatoes. Kahindra et al. (2007) stated that the Agricultural Research Council of South Africa
initiated a programme of in-field rainwater harvesting in Taba Nchu area for over a decade.
The technique has not extended beyond small plots around homestead garden due to the high
costs required to scale it out. It can be concluded that the adoption of rainwater harvesting is
still uncommon in South Africa, despite its positive impacts on agriculture and homestead food
security.

25
3 CHAPTER THREE: MATERIALS AND METHODS
3.1 Introduction
This chapter outlines the methods and materials used for the study and will provide detailed
descriptions of the sites used, experimental layout and design, as well as the soil and plant
variables measured. The study was conducted in homestead gardens of Kwa-Zulu Natal (KZN)
province under Msinga local municipality and in Eastern Cape Province (EC) under Tsolo local
municipality. The KZN sites lie from latitude 28.5608° S to 29.0549°S and from longitude
30.4358°E to 30.6085°E. While Eastern Cape sites lie between latitude 31.3194°S to 31.0638°S
and longitude 28.7548°E to 28.3345°E. The study was set up as five on-farm field trials namely
Madosini, Beya, Mjali, Quvile and Sokhombe in Tsolo, and three field trials in Msinga
(Mntungane, Xoshimpi and Mxheleni). Initially, five homestead gardens were selected in both
provinces to participate in this project. However, two homesteads in KZN withdrew and were
eliminated due to farmers’ inability to cope with research expectations.
3.2 Site Description
3.2.1 Msinga research area in KwaZulu-Natal Province
Msinga is one of the four local municipalities constituting Umzinyathi district (Figure 3.1). The
agricultural production potential in uMsinga is largely affected by poor soil fertility and
unfavourable climate (Baiyegunhi, 2015). The mean annual precipitation for uMsinga ranges
from 300 to 500 mm while the mean annual minimum and maximum temperatures are 11.7oC
and 26.7oC respectively. There is rampant land degradation due to soil erosion caused by
overgrazing (Camp, 1997). The limited rainfall also causes soil to be dry and become
susceptible to de-flocculation due to animal hooves. This results in high soil losses through
wind or water erosion.
These conditions often fail to support rain-fed agriculture, resulting in persistent crop failures
and subsequent food shortages since the area is semi-arid. The altitude ranges from 641 to 800
m above sea level. While the slope ranges from 5- 15 %. However, the dominant terrain unit is
valley with a slope of less than 5 percent (Camp, 1999). There are also several hills and
mountains dominated by bushveld and mixed thornveld (Camp, 1997). These are characterised
by acacia species such as Acacia karoo, Acacia nilotica, Acacia tortilis as well as other species
like Brocia albitrunca, Schotia brachypetala. The bio-resource unit (BRU) for Msinga trial
sites are Sb2 and Tb6. This coding is based on the rainfall, altitude as well as the vegetation
26
type of that area. Thus, in Sb2, S represents rainfall of between 601-650 mm, b is an altitude
of 641 to 800 mm and the number 2 represents dry coast forest, thorn and palm veld vegetation
type. The T in Tb6 represents rainfall of 300 to 500 mm, b is altitude of 451 to 900 m while
number 6 shows that this is the sixth occurrence of the TB code (Camp, 1999).
Igneous rocks such as dolerite and granite characterize the geology of the area. The dominant
parent material within the study area is dolerite and shales (Hardy and Camp, 1999). These
give rise to soil forms such as shortlands and glenrosa (Soil Classification working group,
1991). The soils are dark brown (7.5 YR 4/4) in appearance at the surface and yellowish red (5
YR 4/6) at depth. They are shallow, duplex with moderate to poor drainage that presents
erosion hazard if not managed properly (Camp, 1997). Three experimental sites were selected
namely Xoshimpi, Mtungani and Mxheleni which all fall under Msinga municipality of
Umzinyathi district. Xoshimpi and Mntungane are both located in the same village and
Mxheleni site is about 5 km north-west of Xoshimpi and Mntungane sites. Figure 3.1 below
represents the location of study sites in KZN.

27
3.2.2 Tsolo research area in Eastern Cape Province
In the Eastern Cape, the study was conducted in Tsolo local municipality. The study location
is presented in Figure 3.1 below. This area is located between Qumbu and uMtata towns
(Hammond-Tooke, 1968). The five homestead gardens selected were Madosin, Beya, Mjali,
Quvile and Sokhombela. Tsolo has annual precipitation ranging from 600 to 700 mm and mean
annual temperature of 16oC (Hammond‐Tooke, 1968). The natural vegetation is tall grassveld
and trees such as Acacia tortilis, Brocia albitrunca and Schotia brachypetala (Hammond‐
Tooke, 1968), with soils being generally deep and well drain Shortlands. The dominant parent
material is dolerite (Group, 1991).
Figure 3.1: Map showing location of study sites in KZN and Eastern Cape provinces.

28
3.3 Experimental Design
The study was designed as randomised complete block design, that compared two treatments
i.e. rainwater harvesting (RWH, using contour bunds) with the traditional farmer practice
(control) over two seasons (2013/14 and 2014/2015) in the two study areas (KZN and EC).
Three contour bunds in the RWH were randomly selected for sampling during the study period
and were considered as replicates of each other for statistical analysis. In the control treatment
which was adjacent to the RWH treatment, three 5 x 5 metres were selected for soil sampling
and crop harvesting. These plots in the control treatment were considered as replicates of each
other. A detailed treatment factors are discussed in the subsequent sections.
The plot size for all study sites in KZN was maintained at 0.4 ha. A rainwater harvesting
(RWH) treatment plot comprising of contour bunds and ridges was set up at each site and this
was compared with an adjacent control plot. The control treatment was where the farmers were
allowed to practice their own preferable method of farming which in this study all farmers
preferred broadcasting of seeds in the control plot both in KZN and in EC. Contour ridges were
used as the RWH technique at Xoshimpi and Mntungane sites, while stone bunds were used at
Mxheleni. A detailed explanation of how contours were developed is outlined in section 3.3.1
below. Figure 3.2 shows the field layout at Mntungane site where contour ridges were
developed. There were five selected homestead gardens in Eastern Cape where research was
done namely Quvile (0.30 ha), Sokhombela (0.31 ha), Mjali (0.30 ha), Beya (0.32 ha) and
Madosini (0.30 ha).
29
Figure 3.2: Field layout showing animal traction at Mntungane site in KZN
3.3.1 Development of Contours on research sites
Contour ridges were developed using a dumpy level. Three main contours were developed as
a guide for the establishment of the other remaining contours guided by a catchment to storage
ratio of 2: 1 across all the research sites. The catchment refers to an area between two contours
ridges while the storage (sometimes referred to as basin) is the area below each contour ridge
where water collects and is stored. This means that the spacing between contour ridges was 2
m and the length of the contour was kept at 1 m. In the RWH treatment, the planting rows
followed the contour while in the control they were broadcast randomly over the whole field.
Animal traction was used to develop the contours across all KZN sites (Figure 3.2). The contour
design was the same in both KZN and Eastern Cape sites. The Mxheleni site used both stone
and contour bunds. For all the KZN and Eastern Cape sites, the control and RWH plot lay
adjacent to each other on one field site.
3.3 Crop Planting
In the RWH treatment, maize was planted on each side of the contour ridge at inter and intra-
row spacing of 1 x 0.22 m, giving a plant population of 30 000 plants per hectare. The open
pollinated yellow maize variety SC 506 was used in all plots at a seed application rate of 30 000
seeds ha-1 under RWH. Lime ammonium nitrate (LAN) and Mono-ammonium phosphate
(MAP) were applied at planting. Thus the fertilizer recommendations for KZN suggested that

30
LAN should be applied at 140 kg.ha-1 across all sites. However, MAP was applied at a rate of
60, 50 and 45 kg.ha-1 at Xoshimpi, Mntungane and Mxheleni sites respectively in KZN. The
Eastern Cape sites on the other hand had a uniform application for both LAN and MAP of 140
kg.ha-1 and 20 kg.ha-1 respectively. Farmers were requested to assist with weeding without the
use of any herbicides during the course of the study.
3.4 Field data collection and laboratory analysis
3.4.1 Soil sampling and preparation for initial and final site characterisation
Soil samples were taken prior to planting to characterize soil chemical and physical properties
of the study sites in 2013. They were collected from three selected contour bunds in the RWH
treatments and in three 5 x 5 meter plots in the control treatment. Samples were taken at 0 - 10,
10 - 20 and 20 - 30 cm depths using a bucket auger. Collected samples were transported to the
milling room in well-labelled plastic bags where they were air-dried and ground with pestle
and mortar to pass through a 2 mm sieve for the analyses of pH, electric conductivity,
exchangeable bases, micronutrients and particle size distribution. Aggregate stability and bulk
density samples were collected separately. Aggregate stability samples were taken as clods
using the spade to avoid shearing effect of a soil auger; while bulk density samples were taken
using stainless steel core cylinders. Bulk density samples were taken at 0-10 cm depth only
while aggregate stability samples were collected at 0-10, 10-20 and 20-30 cm depth intervals.
Particle size was only analysed during initial site characterisation to determine the soil texture.
Another set of samples were collected at harvest in 2015 for a second analysis of chemical and
physical properties. This was done in order to see if there were any changes in soil physico-
chemical properties from those measured during initial site characterisation in 2013. There was
periodic monitoring of gravimetric soil moisture content at different stages of maize growth
throughout the course of the 2014/15 growing season as outlined in section 3.4.2 below.
3.4.2 Soil moisture determination at different stages of maize growth
Soil moisture content was periodically monitored at different stages of maize growth (i.e.
planting, establishment, vegetative growth, tasselling and harvest) to determine if rainwater
harvesting was effective at improving soil moisture; at sampling depths of 0-10, 10-20, 20-30,
30-60 cm or until the limiting horizon was encountered. KZN sites had shallow soils so they
were sampled up to 60 cm depth, while Eastern Cape sites had deeper soil and were sampled
up to 120 cm depth. In the RWH plots, samples were also collected from different contour
positions, which were runoff collecting area, below and above ridge as illustrated in Figure 3.3.
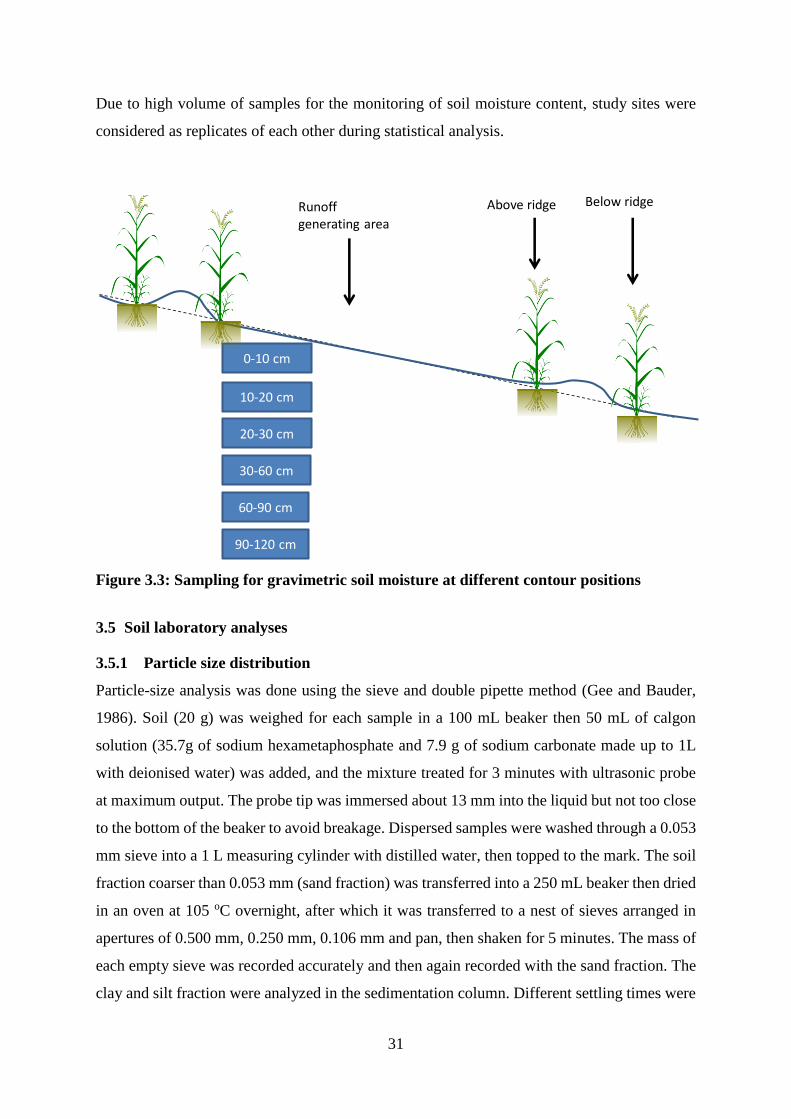
31
Due to high volume of samples for the monitoring of soil moisture content, study sites were
considered as replicates of each other during statistical analysis.
Figure 3.3: Sampling for gravimetric soil moisture at different contour positions
3.5 Soil laboratory analyses
3.5.1 Particle size distribution
Particle-size analysis was done using the sieve and double pipette method (Gee and Bauder,
1986). Soil (20 g) was weighed for each sample in a 100 mL beaker then 50 mL of calgon
solution (35.7g of sodium hexametaphosphate and 7.9 g of sodium carbonate made up to 1L
with deionised water) was added, and the mixture treated for 3 minutes with ultrasonic probe
at maximum output. The probe tip was immersed about 13 mm into the liquid but not too close
to the bottom of the beaker to avoid breakage. Dispersed samples were washed through a 0.053
mm sieve into a 1 L measuring cylinder with distilled water, then topped to the mark. The soil
fraction coarser than 0.053 mm (sand fraction) was transferred into a 250 mL beaker then dried
in an oven at 105 oC overnight, after which it was transferred to a nest of sieves arranged in
apertures of 0.500 mm, 0.250 mm, 0.106 mm and pan, then shaken for 5 minutes. The mass of
each empty sieve was recorded accurately and then again recorded with the sand fraction. The
clay and silt fraction were analyzed in the sedimentation column. Different settling times were
Runoff generating area
Above ridge Below ridge
0-10 cm
10-20 cm
20-30 cm
30-60 cm
60-90 cm
90-120 cm
32
used guided by the temperature of sedimentation. After the appropriate settling time, fine silt
was sampled at 100 mm and clay was sampled at 75 mm below the surface. After plunging the
sedimentation column, 20 ml of the soil suspension was pipetted using a double pipette into a
pre-weighed 50 mL beaker and placed in an oven at 105 oC overnight. The following day,
beakers were removed from the oven, allowed to cool in a desiccator and re-weighed.
Proportions of sand, silt and clay were calculated and expressed as percentages of the total then
used to determine soil textural class using the textural triangle.
3.5.2 Aggregate stability
The Emerson’s stability test was used for analyzing aggregate stability through mean weight
diameter. Clods were sampled using a spade at 0-10, 10-20 and 20-30 cm depth only. The clods
were then air dried at atmospheric temperature. Clods (3 to 5 mm in size) were oven-dried at
40 oC for 24 hours, in order to prevent contrasts in humidity and to make the sample conditions
uniform (Bissonnais, 1996). These were then weighed, with initial weight in the range of 5-10
g. Deionized water (50 ml) was poured into a 100 ml beaker and the aggregates were placed
inside. Slaking was observed visually for 10 minutes and then excess water from the beaker
was removed using a pipette. Aggregates were then transferred into a 50 µm sieve which was
immersed in ethanol. Soil fraction greater than 50 µm was passed through a set of 6 sieves with
apertures of 2000, 1000, 500, 200, 50 µm and pan. The weight of the fraction smaller than 50
µm was inferred by difference with initial weight (Amezketa, 1999). Mean weight diameter
(MWD) was then calculated in mm units (Haynes and Francis, 1993). Calculation of MWD
was based on a formula derived from Henin et al., (1958) and improved by Haynes (1993).
MWD = ∑(𝑑 ∗ 𝑤)
d – Mean diameter between size fractions
w – Proportion by weight of size fraction
3.5.3 Bulk Density
Soil sampling for bulk density was only done at 0-10 cm depth and was determined using the
core method as described by Blakes (1965). The soil core was oven dried at 105oC until a
constant weight was reached. The height and diameter of the cores used was measured, and the
mass of the soil core after oven drying was recorded. The volume of the core was given by the
formula V=πr2h where r is the radius and h is the height of the soil core. Bulk density was then
computed as follows:
𝑀𝑠 (𝑘𝑔)
𝑉(𝑐𝑚3)
33
Ms - mass of the soil core after oven drying
V – volume of soil core
3.5.4 Soil pH, micronutrients and exchangeable bases
Soil pH was measured at 1: 5 (soil: solution) ratio and the suspension was stirred for two
minutes and left to stand for an hour before measuring pH using the pH 210 standard pH meter.
Micronutrients (copper, manganese, iron and zinc) were extracted using 1 % EDTA by
weighing 5 grams of soil samples into centrifuge tubes, then adding 50 ml of 1 % EDTA. The
mixture was shaken for an hour before it was filtered through Whatman no. 5 filter paper. The
filtrate was analysed with an inductively coupled plasma optical emission spectrometer i.e.
ICP-OES 720 Varian describe by the non-affiliated soil analysis work committee (Committee,
1990). The basic cations (Ca2+, Mg2+, K+ and Na+) were extracted using ammonium acetate
(NH4OAc). Samples were placed in centrifuge tubes and 50 ml of 1M NH4OAc solution was
added. The mixture was shaken on a reciprocal shaker at 180 oscillations per minute for 30
minutes. The suspension was filtered through Whatman no. 5 filter paper before analysing
using a Varian (AA280FS) atomic absorption spectrophotometer (Thomas, 1982).
3.5.5 Gravimetric soil moisture determination
Soil moisture was determined by weighing about 10g of soil of each sample before and after
oven dried to constant mass at 105o C, then calculated using the formula below:
𝑀𝑎𝑠𝑠 𝑜𝑓 𝑤𝑒𝑡 𝑠𝑜𝑖𝑙(𝑔) − 𝑀𝑎𝑠𝑠 𝑜𝑓 𝑑𝑟𝑦 𝑠𝑜𝑖𝑙(𝑔)
𝑀𝑎𝑠𝑠 𝑜𝑓 𝑑𝑟𝑦 𝑠𝑜𝑖𝑙(𝑔)
34
3.6 Plant yield
Three 5 x 5 m plots were harvested in June, six months after planting. This was done under
both control and RWH treatments. Maize was harvested 1 cm above the ground. Maize cobs
were separated from the stalk. The maize stalk was then oven dried at 60 oC until constant
weight and weighed for dry matter yield. Maize cobs were air dried until constant weight for
the determination of grain yield.
3.7 Statistical Analysis
Measured soil and crop variables were subjected to an analysis of variance (ANOVA) test using
Genstat 17th edition (VSN International, UK). Treatment means were separated using the least
significant difference (LSD) at 5% probability level.
35
4 CHAPTER FOUR: RESULTS
4.1 Introduction
This chapter presents results that were collected during the course of the study. It begins with
site characterization which details soil forms and the initial soil physico-chemical properties of
the study sites. This is followed by results from the physical and chemical analyses of the soils
at the research sites taken during the course of the study to determine whether rainwater
harvesting had an impact on soil properties. The results also include seasonal soil moisture
results taken at different stages of maize growth (before planting, at establishment, vegetative
growth, tasseling and harvesting), as well as at different positions of the contour (runoff
generation area, below and above ridge) in comparison with the control plots. Moisture results
for the KZN sites at harvesting stage could not be obtained due to complete crop failure because
of drought. At the Eastern Cape sites, soil moisture results at tasselling were inconsistent so
they were excluded from the seasonal moisture trends. This resulted in both the KZN and
Eastern Cape sites having gravimetric moisture monitored for only four stages of growth.
Finally, the chapter presents results on maize dry matter and grain yields. Due to the complete
crop failure at the KZN research sites in both seasons, data on crop yields was not determined.
4.2 Site descriptions
4.2.1 KZN site descriptions
The KZN sites had shallow soils with an effective rooting depth of less than 30 cm (Table 4.1).
The dominant soil forms at Mntungane and Xoshimpi sites were Shortlands. The Clovelly soil
form was also found at Xoshimpi though it was not as abundant as Shortlands. Mxheleni was
however dominated by the Swartland soil form. All sites were basically shallow with Xoshimpi
and Mxheleni sites having a total soil depth of 80 cm, while Mntungane had a total depth of 75
cm. All KZN sites had clay loam textures with medium slope classes (5-15%).
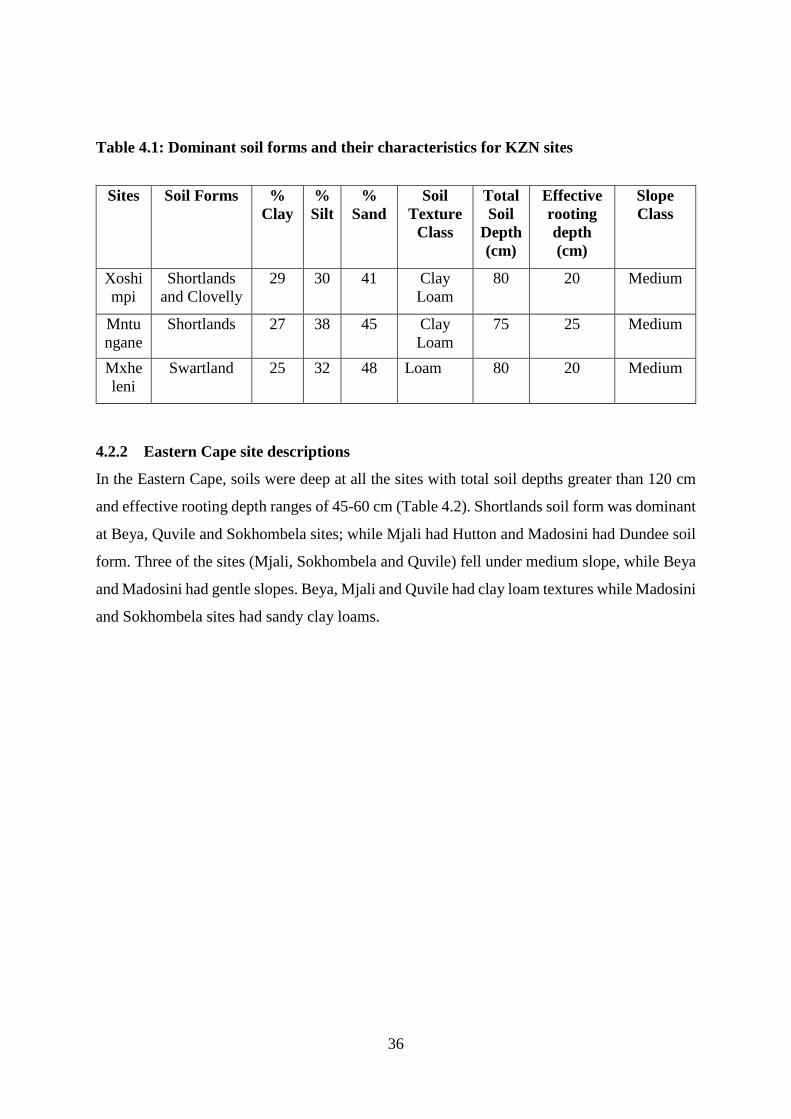
36
Table 4.1: Dominant soil forms and their characteristics for KZN sites
Sites Soil Forms %
Clay
%
Silt
%
Sand
Soil
Texture
Class
Total
Soil
Depth
(cm)
Effective
rooting
depth
(cm)
Slope
Class
Xoshi
mpi
Shortlands
and Clovelly
29 30 41 Clay
Loam
80 20 Medium
Mntu
ngane
Shortlands 27 38 45 Clay
Loam
75 25 Medium
Mxhe
leni
Swartland 25 32 48 Loam 80 20 Medium
4.2.2 Eastern Cape site descriptions
In the Eastern Cape, soils were deep at all the sites with total soil depths greater than 120 cm
and effective rooting depth ranges of 45-60 cm (Table 4.2). Shortlands soil form was dominant
at Beya, Quvile and Sokhombela sites; while Mjali had Hutton and Madosini had Dundee soil
form. Three of the sites (Mjali, Sokhombela and Quvile) fell under medium slope, while Beya
and Madosini had gentle slopes. Beya, Mjali and Quvile had clay loam textures while Madosini
and Sokhombela sites had sandy clay loams.
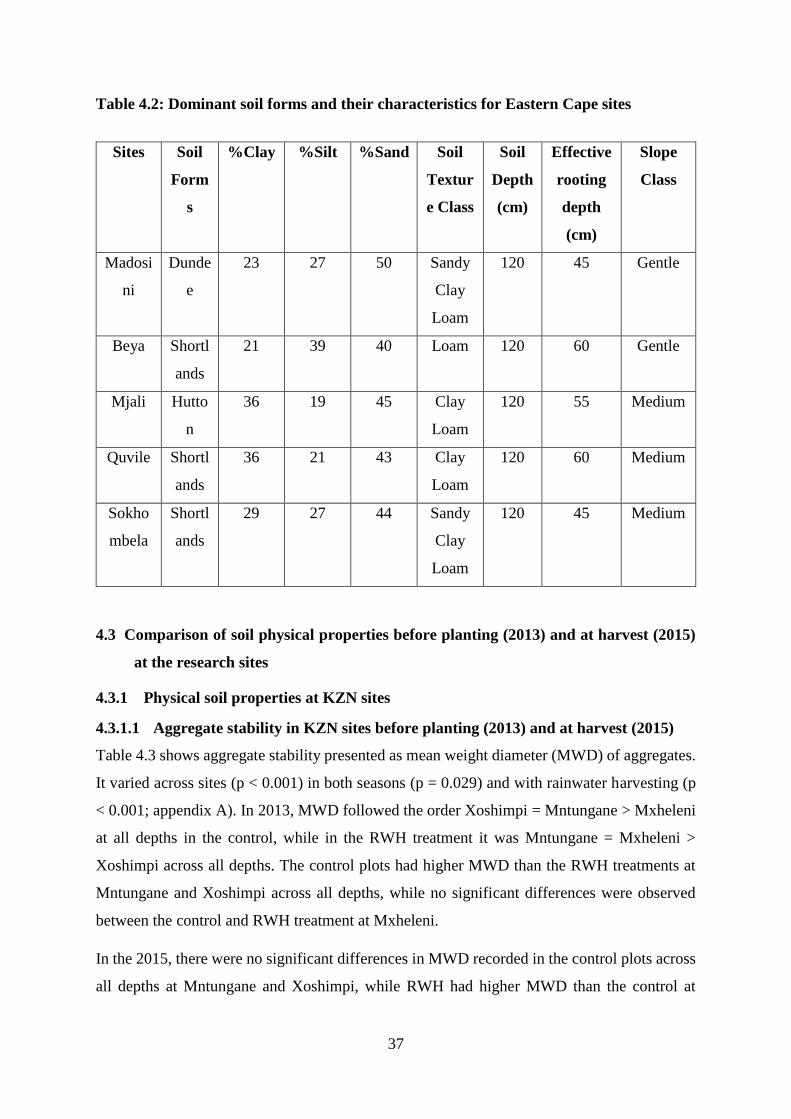
37
Table 4.2: Dominant soil forms and their characteristics for Eastern Cape sites
Sites Soil
Form
s
%Clay %Silt %Sand Soil
Textur
e Class
Soil
Depth
(cm)
Effective
rooting
depth
(cm)
Slope
Class
Madosi
ni
Dunde
e
23 27 50 Sandy
Clay
Loam
120 45 Gentle
Beya Shortl
ands
21 39 40 Loam 120 60 Gentle
Mjali Hutto
n
36 19 45 Clay
Loam
120 55 Medium
Quvile Shortl
ands
36 21 43 Clay
Loam
120 60 Medium
Sokho
mbela
Shortl
ands
29 27 44 Sandy
Clay
Loam
120 45 Medium
4.3 Comparison of soil physical properties before planting (2013) and at harvest (2015)
at the research sites
4.3.1 Physical soil properties at KZN sites
4.3.1.1 Aggregate stability in KZN sites before planting (2013) and at harvest (2015)
Table 4.3 shows aggregate stability presented as mean weight diameter (MWD) of aggregates.
It varied across sites (p < 0.001) in both seasons (p = 0.029) and with rainwater harvesting (p
< 0.001; appendix A). In 2013, MWD followed the order Xoshimpi = Mntungane > Mxheleni
at all depths in the control, while in the RWH treatment it was Mntungane = Mxheleni >
Xoshimpi across all depths. The control plots had higher MWD than the RWH treatments at
Mntungane and Xoshimpi across all depths, while no significant differences were observed
between the control and RWH treatment at Mxheleni.
In the 2015, there were no significant differences in MWD recorded in the control plots across
all depths at Mntungane and Xoshimpi, while RWH had higher MWD than the control at

38
Mxheleni (Table 4.3). The RWH treatment thus followed the order Mxheleni > Mntungane =
Xoshimpi in MWD across all depths. A closer look at the seasonal trends suggest that RWH
improved MWD across all sites (especially at Mxheleni) in 2015 compared to 2013 (p = 0.029).
The control only recorded better MWD in 2015 than 2013 at Mxheleni, while it remained
unchanged at the other two sites.
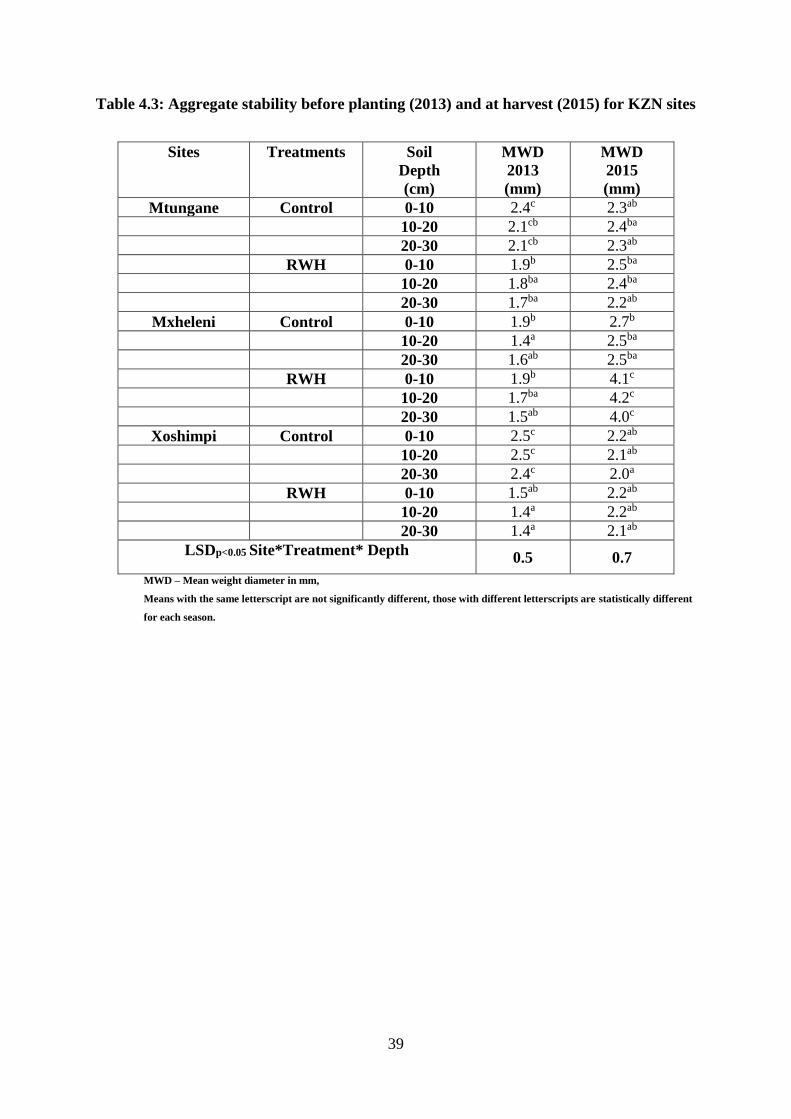
39
Table 4.3: Aggregate stability before planting (2013) and at harvest (2015) for KZN sites
Sites Treatments Soil
Depth
(cm)
MWD
2013
(mm)
MWD
2015
(mm)
Mtungane Control 0-10 2.4c 2.3ab 10-20 2.1cb 2.4ba 20-30 2.1cb 2.3ab
RWH 0-10 1.9b 2.5ba 10-20 1.8ba 2.4ba 20-30 1.7ba 2.2ab
Mxheleni Control 0-10 1.9b 2.7b 10-20 1.4a 2.5ba 20-30 1.6ab 2.5ba
RWH 0-10 1.9b 4.1c 10-20 1.7ba 4.2c 20-30 1.5ab 4.0c
Xoshimpi Control 0-10 2.5c 2.2ab 10-20 2.5c 2.1ab 20-30 2.4c 2.0a
RWH 0-10 1.5ab 2.2ab 10-20 1.4a 2.2ab 20-30 1.4a 2.1ab
LSDp<0.05 Site*Treatment* Depth 0.5 0.7
MWD – Mean weight diameter in mm, Means with the same letterscript are not significantly different, those with different letterscripts are statistically different
for each season.

40
4.3.1.2 Bulk density in KZN sites before planting (2013) and at harvest (2015)
Bulk density values for KZN sites were only taken at 0-10 cm depth (Table 4.4). Mntungane
had the highest bulk density compared to the other two sites in 2013, while Xoshimpi had
highest and Mxheleni lowest density values in 2015 (p = 0.037; Appendix B). There were no
significant differences in bulk density between the RWH treatment and control across most
sites in each season. Seasonal variations showed bulk density to be generally higher in 2015
compared to 2013 (p = 0.003; Appendix B).
Table 4.4: Bulk density before planting (2013) and at harvest (2015) for KZN sites.
Sites Treatments Bulk
Density
2013
(g cm-3)
Bulk
Density
2015
(g cm-3)
Mtungane Control 1,19b 1,38b
RWH 1,18b 1,21ab
Mxheleni Control 0,73a 1,12a
RWH 1,13b 1,04a
Xoshimpi Control 0,99ba 1,62b
RWH 0,74a 1,63b
LSDp<0.05 Site*Treatment 0,32 0,34
Means with the same letterscript are not significantly different, those with different letterscripts are statistically
different for each season.

41
4.3.2 Physical properties at Eastern Cape sites
4.3.2.1 Aggregate stability in EC sites before planting (2013) and at harvest (2015)
Table 4.5 shows the variation of aggregate stability for Eastern Cape sites before planting
(2013) and at harvest (2015). MWD varied across sites (p<0.001; Appendix C) in both seasons
(p<0.001; Appendix C). Quvile and Sokhombela sites had the highest while Beya and Mjali
had moderate and Madosini the lowest MWD in both the control and RWH plots across all
depths and seasons. There were no significant differences in MWD between RWH treatment
and control at Beya, Madosini, Mjali and Sokombela in 2013, while RWH had higher MWD
than the control at Quvile. The RWH treatment recorded higher MWD than the control plots at
all sites in 2015 however (p < 0.01; appendix C). Soil depth did not have a significant effect
on MWD across all treatments. Seasonal observations were that the MWD was higher in 2015
than 2013 in the RWH plots at most sites.

42
Table 4.5: Aggregate stability before planting (2013) and at harvest (2015) for Eastern
Cape sites
Sites Treatments Soil
Depth
(cm)
MWD
2013
(mm)
MWD
2015
(mm)
Beya Control 0-10 2.4c 2.5cb 10-20 2.1bc 2.2bc 20-30 2.1bc 2.1b
RWH 0-10 2.5c 3.7ed 10-20 2.4c 3.6ed 20-30 2.2cb 3.6ed
Madosini Control 0-10 1.9b 1.7a 10-20 1.4a 1.6a 20-30 1.6ab 1.6a
RWH 0-10 1.9b 2.7c 10-20 1.7ba 2.6c 20-30 1.5a 2.5cb
Mjali Control 0-10 2.5c 2.5cb 10-20 2.5c 2.4cb 20-30 2.4c 2.4cb
RWH 0-10 2.5c 3.8e 10-20 2.4c 3.7ed 20-30 2.4c 3.3d
Quvile Control 0-10 3.7d 3.0dc 10-20 3.7d 3.0dc 20-30 3.6d 2.9cd
RWH 0-10 4.4e 4.5f 10-20 4.4e 4.4f 20-30 4.2e 4.4f
Sokhombela Control 0-10 3.5d 3.4de 10-20 3.5d 3.4de 20-30 3.5d 3.4de
RWH 0-10 3.5d 5.3g 10-20 3.4d 5.3g 20-30 3.5d 5.3g
LSDp<0.05 Site*Treatment* Depth 0,49 0,46 Means with the same letterscript are not significantly different, those with different letterscripts are statistically different for each
season.
4.3.2.2 Bulk Density in EC sites before planting (2013) and at harvest (2015)
Bulk density was not affected by the site, water harvesting or depth but only differed across
seasons (p = 0.002; appendix D) in EC (Table 4.6). In 2013 RWH increased bulk density at
Beya, while in 2015 the control had higher density values that RWH at Madosini and
Sokhombela. RWH improved bulk density at Sokhombela, Beya, Mjali and Quvile since they
recorded lower density values in 2015 than 2013, while Madosini, Beya and Sokhombela had
higher density values in 2015 than 2013 in the control.

43
Table 4.6: Bulk density before planting (2013) and at harvest (2015) for Eastern Cape
Sites Treatments Bulk
Density
2013
(g cm-3)
Bulk
Density
2015
(g cm-3)
Madosini Control 1,4ab 1,8c
RWH 1,4ab 1,5b
Beya Control 1,2a 1,4ba
RWH 1,9b 1,4ba
Mjali Control 1,8b 1,5bc
RWH 1,6b 1,5bc
Quvile Control 1,2a 1,3ba
RWH 1,5ba 1,3ab
Sokhombela Control 1,4ba 2,6d
RWH 1,4ba 1,1a
LSDp<0.05 Site*Treatment 0,42 0,32
Means with the same letterscript are not significantly different; those with different letterscripts are statistically

44
4.4 Comparison of soil chemical properties before planting (2013) and at harvest (2015)
at the research sites.
4.4.1 Chemical properties at KZN sites
4.4.1.1 Soil pH
Table 4.7 shows soil pH in water for KZN sites before planting (2013) and at harvest (2015).
Soil pH differed across sites (p = 0.021; Appendix E) in both seasons (p < 0.001; Appendix E).
However, the soil depth and water harvesting did not have a significant effect on pH. In 2013
no significant differences in pH were recorded across sites, depths or RWH treatment. In 2015
however, Xoshimpi site had the lowest pH in the control plots across depths, with the control
having significantly lower pH than the RWH at this site. A comparison of seasons showed pH
to be generally higher in 2015 than 2013 across treatments.
Table 4.7: Soil pH before planting (2013) and at harvest (2015) for KZN sites
Sites Treatments Soil Depth
(cm)
pH (water)
2013
pH (Water)
2015
Xoshimpi Control 0-10 6a 6.8b
10-20 6.3ab 6.1a 20-30 6.4ba 6.2a
RWH 0-10 6.7b 7.7c
10-20 6.4ab 7.3c
20-30 6.4ab 7.2cb
Mntungane Control 0-10 6.3ab 6.9b
10-20 6.5ba 7.8c
20-30 6.2ab 6.5ba
RWH 0-10 7b 7.5c
10-20 6.7b 6.5ba
20-30 7.1b 7.1cb
Mxheleni Control 0-10 6.4ba 7.5c
10-20 6.3ab 7.5c 20-30 6.6ba 6.7b
RWH 0-10 6.7b 7.7c
10-20 6.5ba 7.6c
20-30 6.2ab 6.5ba
LSDp<0.05 Site*Treatment* Depth 0.66 0.5
Means with different letterscript in a column indicate significant differences at p < 0.05.
4.4.1.2 Micronutrients
The concentrations of both Cu and Mn varied significantly across sites (p < 0.001; Appendices
Fi and iii), while water harvesting, growing season and depth had no effect on these nutrients
(Table 4.8). The Mxheleni site recorded the lowest while Mntungane had the highest Cu

45
amounts in both seasons, treatments and across all depths. In the case of Mn, Xoshimpi had the
highest Mn in both seasons and across all treatments. No clear site differences were recorded
for Mn in 2013, while Mntungane had the lowest Mn in 2015 in the control plot.
Fe on the other hand only had a significant seasonal effect shown by a huge increase in Fe in
2015 across all treatments (p<0.001; Appendix Fii). Mxheleni had the lowest Fe amount in the
control in 2013, while no clear trend among sites was observed in 2015 (Table 4.8). Finally,
Zn was not affected by any of the treatment factors (Table 4.8)

46
Table 4.8: Micronutrients before planting (2013) and at harvest (2015) for KZN sites
Sites Treatments Soil
Depth
(cm)
Cu
2013
Cu
2015
Fe
2013
Fe
2015
Mn
2013
Mn
2015
Zn
2013
Zn
2015
mg/kg
Xoshimpi Control 0-10 0.2c 0.19d 6.3b 26.2cb 37.7d 33.2d 0,5a 0.6a 10-20 0.17b 0.22e 6.9b 32.7e 31.1c 37.9d 0,4a 0.6a 20-30 0.2c 0.19d 6.3b 26.9cb 37.6d 33.3d 0,5a 0.5a
RWH 0-10 0.18b 0.22e 5.9b 30.1d 31.1c 38.5d 0,4a 0.7a 10-20 0.2c 0.19d 5.9b 26.6cb 37.6d 32.9d 0,5a 0.6a 20-30 0.17b 0.22e 5.9b 31.5ed 31.7c 37.9d 0,4a 0.7a
Mntungane Control 0-10 0.44e 0.55f 19.2d 29.7c 29.2cb 4.5a 0,4a 1.9a 10-20 0.4d 0.54f 1.2a 36.6f 12.9a 4.8a 0,4a 1.4a 20-30 0.4d 0.55f 3.2ab 27.2c 28.9cb 3.8a 0,4a 1.5a
RWH 0-10 0.4d 0.18cd 1.2a 25.4ab 12.7a 35.3d 0,4a 0.6a 10-20 0.4d 0.17c 3.2ab 20.3a 28.9cb 36.3d 0,4a 0.6a 20-30 0.4d 0.39f 3.3ab 25.1b 12.9a 14.1b 0,4a 9.1b
Mxheleni Control 0-10 0.1a 0.04a 1.5 a 27.5c 27.7bc 23.6c 0,5a 1.2a 10-20 0.1a 0.06b 1.3a 37.6f 25.2b 28.8dc 0,4a 1.7a 20-30 0.04a 0.04a 1.6 a 30.4d 28.0bc 23.5c 0,5a 1.3a
RWH 0-10 0.1a 0.06b 1.2a 32.0ed 25.2b 29.4dc 0,4a 1.7a 10-20 0.04a 0.04a 15.4c 27.6c 27.9bc 23.8c 0,5a 1.2a 20-30 0.1a 0.06b 15.2c 39.2g 12.9a 29.3dc 0,4a 1.7a
LSDp<0.05 Site*Treatment* Depth 0,02 0,02 0,02 0,02 4.3 6.7 0.11 2.46 Means with different letterscript in a column indicate significant differences at p<0.05.
47
4.4.1.3 Exchangeable bases
The concentrations of Ca varied significantly across sites and depths (p < 0.001; Appendix Gi),
while water harvesting had no effect on this nutrient (Table 4.9). In 2013, Ca followed the
following trend in both the control and RWH treatment Mxheleni > Mntungane > Xoshimpi.
Ca amounts also increased in 2013 at 10-20 cm depth at two of the sites in the control (Mxheleni
and Xoshimpi), while it decreased at these same sites and depth in the RWH treatment. In 2015
on the other hand, Ca was highest at Mxheleni in both the control and RWH treatment, while
there was no clear trend with depth. Seasonal variations showed that there were significantly
lower amounts of Ca in the control in 2013 than in 2015 while no clear seasonal Ca differences
were recorded under RWH.
In the case of Mg, Mxheleni had the highest Mg in 2013 in the control, while it also had highest
and Xoshimpi had lowest Mg in 2015 in the RWH treatment (p < 0.001; Appendix Gii). There
was a rise in Mg amount at 10-20 cm depth under the control and a drop at the same depth
under the RWH treatment at Xoshimpi and Mntungane in 2013 (p < 0.001; Appendix Gii). The
opposite was recorded in 2015 where a drop was observed at 10-20 cm under the control and a
rise was recorded at the same depth under RWH treatment for these two sites (Table 4.9). The
2015 season generally recorded higher Mg than 2013 across all sites (p < 0.001; Appendix Gii).
Na however had a significant site (p = 0.032; Appendix Giii) and seasonal effect (p = 0.016),
particularly in 2015 where Mxheleni recorded the highest Na concentration (Table 4.9). The
depth and water harvesting had no significant effect on Na amounts. A closer look at seasonal
effect suggests that Na was higher in 2013 compared with 2015 (Table 4.9).
Finally, K only varied significantly across sites (p = 0.002; appendix Giv) and depth (p = 0.031)
while water harvesting and growing season had no effect on the concentration of this element.
The Xoshimpi site recorded the highest while Mxheleni had the lowest K amounts in both
seasons and across all treatments. While there was no clear trend of K with depth in 2013; in
2015 there was an increase in K at 10-20 cm for Mxheleni and Mntungane in the control. This
same element decreased at 10-20 cm depth at the same sites in the RWH treatment.

48
Table 4.9: Exchangeable bases before planting (2013) and at harvest (2015) for KZN sites
Sites Treatments Soil
Depth
(cm)
Ca
2013
Ca
2015
Mg
2013
Mg
2015
Na
2013
Na
2015
K
2013
K
2015
cmolc/Kg
Xoshimpi Control 0-10 8.0a 15.0b 5.2a 7.5c 4.0ba 0.14ab 1.3c 1.4e
10-20 15.0bc 12.8ba 7.0c 5.2a 2.7a 0.09a 1.4d 1.3d
20-30 8.0a 15.1b 5.3a 7.5c 4.0ba 0.13ab 1.3c 1.4e
RWH 0-10 15.0bc 9.2a 7.1c 5.1a 2.7a 0.09a 1.4d 1.3d
10-20 8.0a 15.1b 5.1a 7.5c 4.1ba 0.10a 1.3c 1.4e
20-30 15.0bc 9.6ab 5.7b 5.1a 2.7a 0.14ab 1.4d 1.3d
Mntungane Control 0-10 12.7b 14.5b 5.0a 7.6c 3.7a 0.12a 1.2b 0.9c
10-20 14.6bc 13.9b 6.9c 6.9b 4.2b 0.14ab 0.6a 1.4e
20-30 12.6b 14.5b 5.1a 7.5c 3.7a 0.10a 1.2b 0.9c
RWH 0-10 14.6bc 13.1ba 6.9c 6.9b 4.0ba 0.10a 0.6a 1.4e
10-20 17.4c 14.7b 5.0a 7.5c 3.7a 0.14ab 1.2b 0.9c
20-30 23.5d 13.6b 6.9c 6.9b 4.0ba 0.11a 0.6a 1.4e
Mxheleni Control 0-10 17.4 c 25.2c 7.2c 7.6c 3.9a 0.38d 0.6a 0.6a
10-20 23.5d 17.3b 7.3c 7.3c 4.0ba 0.24c 0.6a 0.7b
20-30 17.4c 25.2c 7.3c 7.6c 3.9ba 0.11a 0.6a 0.6a
RWH 0-10 23.5d 17.3b 7.2c 7.4c 4.0ba 0.10a 0.6a 0.7b
10-20 17.4c 25.2c 7.2c 7.6c 3.9ba 0.18b 0.6a 0.6a
20-30 23.5d 17.3b 7.3c 7.4c 4.1ba 0.13ab 0.6a 0.7b
LSDp<0.05 Site*Treatment* Depth 3.1 4.4 0.5 0.3 1.5 0.06 0.1 0.06 Means with different letterscript in a column indicate significant differences at p<0.05.

49
4.4.2 Chemical properties at EC sites
4.4.2.1 Soil pH
Table 4.10 shows soil pH in water for Eastern Cape before planting (2013) and at harvest
(2015). Soil pH differed across sites (p < 0.001; appendix H) in both seasons (p = 0.029).
However, the soil depth and water harvesting did not have a significant effect on it. In 2013,
soil pH was highest at Madosini and Mjali sites, but lowest at Quvile across all treatments. In
2015, soil pH was lowest at Mjali in the control while there were no clear differences in the
RWH treatments. There was a general drop in pH as one moved from the 2013 to 2015 season.
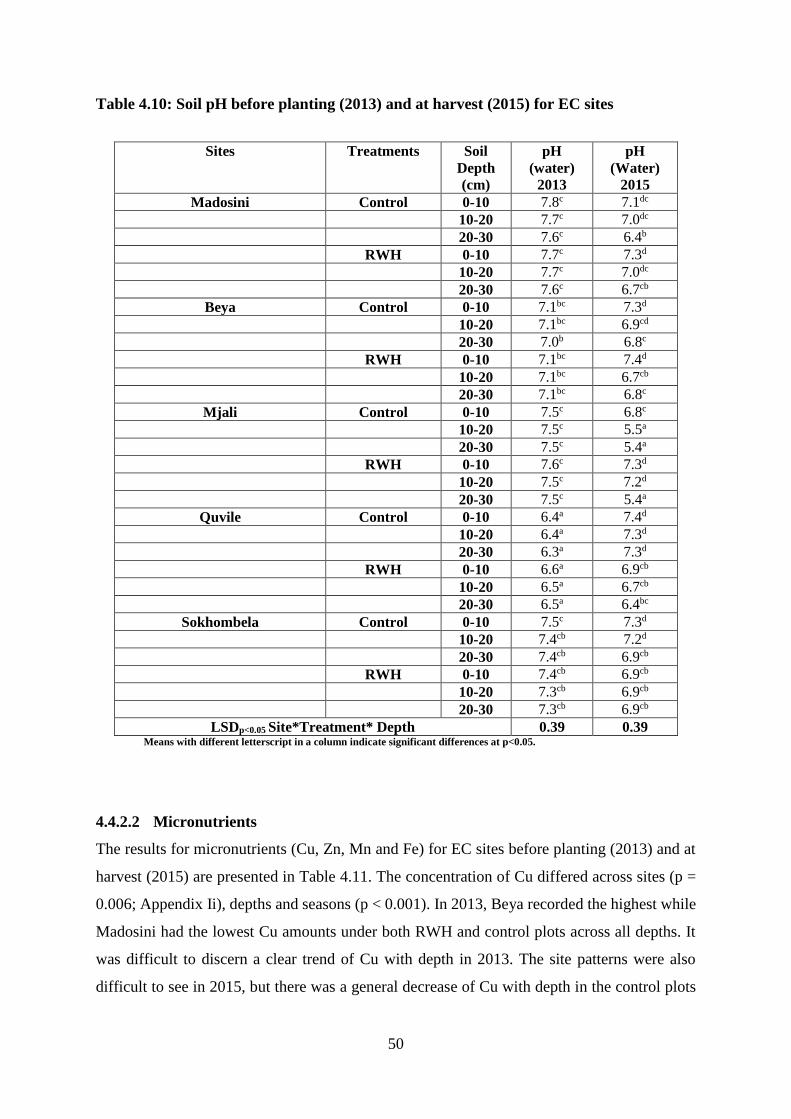
50
Table 4.10: Soil pH before planting (2013) and at harvest (2015) for EC sites
Sites Treatments Soil
Depth
(cm)
pH
(water)
2013
pH
(Water)
2015
Madosini Control 0-10 7.8c 7.1dc 10-20 7.7c 7.0dc 20-30 7.6c 6.4b
RWH 0-10 7.7c 7.3d 10-20 7.7c 7.0dc 20-30 7.6c 6.7cb
Beya Control 0-10 7.1bc 7.3d 10-20 7.1bc 6.9cd 20-30 7.0b 6.8c
RWH 0-10 7.1bc 7.4d 10-20 7.1bc 6.7cb 20-30 7.1bc 6.8c
Mjali Control 0-10 7.5c 6.8c 10-20 7.5c 5.5a 20-30 7.5c 5.4a
RWH 0-10 7.6c 7.3d 10-20 7.5c 7.2d 20-30 7.5c 5.4a
Quvile Control 0-10 6.4a 7.4d 10-20 6.4a 7.3d 20-30 6.3a 7.3d
RWH 0-10 6.6a 6.9cb 10-20 6.5a 6.7cb 20-30 6.5a 6.4bc
Sokhombela Control 0-10 7.5c 7.3d 10-20 7.4cb 7.2d 20-30 7.4cb 6.9cb
RWH 0-10 7.4cb 6.9cb 10-20 7.3cb 6.9cb 20-30 7.3cb 6.9cb
LSDp<0.05 Site*Treatment* Depth 0.39 0.39 Means with different letterscript in a column indicate significant differences at p<0.05.
4.4.2.2 Micronutrients
The results for micronutrients (Cu, Zn, Mn and Fe) for EC sites before planting (2013) and at
harvest (2015) are presented in Table 4.11. The concentration of Cu differed across sites (p =
0.006; Appendix Ii), depths and seasons (p < 0.001). In 2013, Beya recorded the highest while
Madosini had the lowest Cu amounts under both RWH and control plots across all depths. It
was difficult to discern a clear trend of Cu with depth in 2013. The site patterns were also
difficult to see in 2015, but there was a general decrease of Cu with depth in the control plots
51
at Mjali, Madosini and Sokhombela, while it increased with depth in the RWH treatment at
Quvile and Beya. There was a significant increase in soil Cu amount in 2015 compared to 2013.
Zn only showed significant differences across sites (p < 0.001; Appendix Iii), while there were
no significant seasonal, depth and water harvesting effects (Table 4.11). In 2013, the
Sokhombela and Mjali sites recorded higher Zn in the control while no significant differences
were observed across sites in the RWH treatment. There were no clear site differences of Zn in
2015 however.
Mn significantly differed across sites, depths and seasons (p < 0.001; Appendix Iiii), but rain
water harvesting did not have a significant effect on it (Table 4.11). Mjali and Sokhombela
sites had the highest Mn in 2013. It was difficult to see a clear trend of Mn with depth however
in this season. In 2015 Sokhombela and Beya sites also recorded the highest while Madosini
had the lowest Mn amount. There was an increase in Mn at the 10-20 cm depth at Beya (both
treatments) and Mjali (control only) in 2015. Overall, the 2015 season recorded higher amounts
of Mn than 2013 at most of the sites (Table 4.11).
The concentration of Fe in the soil was also significantly affected by site, season (p < 0.001;
appendix Iiv) and depth (p = 0.029). Mjali had the highest while Madosini had the lowest Fe
concentration in 2013 (Table 4.11). There were no significant differences of Fe with depth in
this season however. In 2015, Quvile had the highest and Madosini the lowest Fe in the RWH
treatment; while Beya had the lowest Fe in the control. Most of the sites (serve for Beya in the
control) had more Fe in 2015 than in 2013.
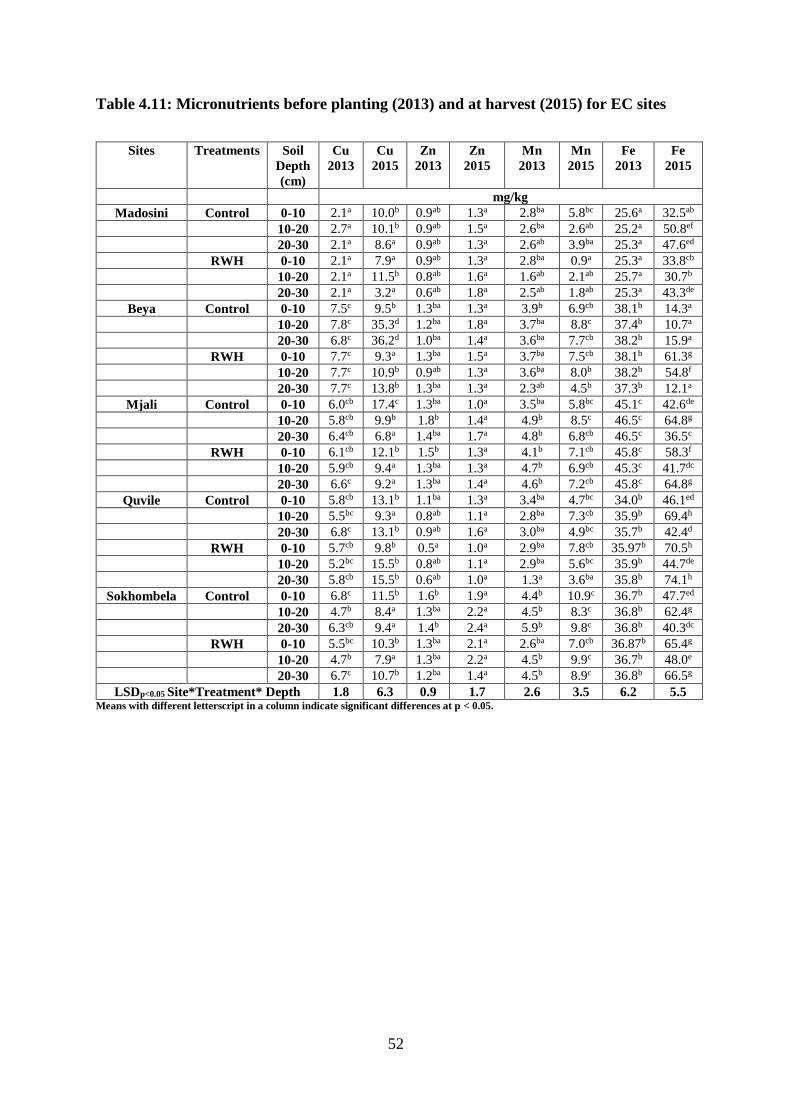
52
Table 4.11: Micronutrients before planting (2013) and at harvest (2015) for EC sites
Sites Treatments Soil
Depth
(cm)
Cu
2013
Cu
2015
Zn
2013
Zn
2015
Mn
2013
Mn
2015
Fe
2013
Fe
2015
mg/kg
Madosini Control 0-10 2.1a 10.0b 0.9ab 1.3a 2.8ba 5.8bc 25.6a 32.5ab 10-20 2.7a 10.1b 0.9ab 1.5a 2.6ba 2.6ab 25.2a 50.8ef 20-30 2.1a 8.6a 0.9ab 1.3a 2.6ab 3.9ba 25.3a 47.6ed
RWH 0-10 2.1a 7.9a 0.9ab 1.3a 2.8ba 0.9a 25.3a 33.8cb 10-20 2.1a 11.5b 0.8ab 1.6a 1.6ab 2.1ab 25.7a 30.7b 20-30 2.1a 3.2a 0.6ab 1.8a 2.5ab 1.8ab 25.3a 43.3de
Beya Control 0-10 7.5c 9.5b 1.3ba 1.3a 3.9b 6.9cb 38.1b 14.3a 10-20 7.8c 35.3d 1.2ba 1.8a 3.7ba 8.8c 37.4b 10.7a 20-30 6.8c 36.2d 1.0ba 1.4a 3.6ba 7.7cb 38.2b 15.9a
RWH 0-10 7.7c 9.3a 1.3ba 1.5a 3.7ba 7.5cb 38.1b 61.3g 10-20 7.7c 10.9b 0.9ab 1.3a 3.6ba 8.0b 38.2b 54.8f 20-30 7.7c 13.8b 1.3ba 1.3a 2.3ab 4.5b 37.3b 12.1a
Mjali Control 0-10 6.0cb 17.4c 1.3ba 1.0a 3.5ba 5.8bc 45.1c 42.6de 10-20 5.8cb 9.9b 1.8b 1.4a 4.9b 8.5c 46.5c 64.8g 20-30 6.4cb 6.8a 1.4ba 1.7a 4.8b 6.8cb 46.5c 36.5c
RWH 0-10 6.1cb 12.1b 1.5b 1.3a 4.1b 7.1cb 45.8c 58.3f 10-20 5.9cb 9.4a 1.3ba 1.3a 4.7b 6.9cb 45.3c 41.7dc 20-30 6.6c 9.2a 1.3ba 1.4a 4.6b 7.2cb 45.8c 64.8g
Quvile Control 0-10 5.8cb 13.1b 1.1ba 1.3a 3.4ba 4.7bc 34.0b 46.1ed 10-20 5.5bc 9.3a 0.8ab 1.1a 2.8ba 7.3cb 35.9b 69.4h 20-30 6.8c 13.1b 0.9ab 1.6a 3.0ba 4.9bc 35.7b 42.4d
RWH 0-10 5.7cb 9.8b 0.5a 1.0a 2.9ba 7.8cb 35.97b 70.5h 10-20 5.2bc 15.5b 0.8ab 1.1a 2.9ba 5.6bc 35.9b 44.7de 20-30 5.8cb 15.5b 0.6ab 1.0a 1.3a 3.6ba 35.8b 74.1h
Sokhombela Control 0-10 6.8c 11.5b 1.6b 1.9a 4.4b 10.9c 36.7b 47.7ed 10-20 4.7b 8.4a 1.3ba 2.2a 4.5b 8.3c 36.8b 62.4g 20-30 6.3cb 9.4a 1.4b 2.4a 5.9b 9.8c 36.8b 40.3dc
RWH 0-10 5.5bc 10.3b 1.3ba 2.1a 2.6ba 7.0cb 36.87b 65.4g 10-20 4.7b 7.9a 1.3ba 2.2a 4.5b 9.9c 36.7b 48.0e 20-30 6.7c 10.7b 1.2ba 1.4a 4.5b 8.9c 36.8b 66.5g
LSDp<0.05 Site*Treatment* Depth 1.8 6.3 0.9 1.7 2.6 3.5 6.2 5.5 Means with different letterscript in a column indicate significant differences at p < 0.05.

53
4.4.2.3 Exchangeable bases
The results for exchangeable Ca, Mg, Na and K are presented in Table 4.12. The concentrations
of Mg and Na show no significant differences across sites, treatments, depths and seasons. Ca
differed across sites and depths (p < 0.001; appendix Jii), while it showed no significant
seasonal and water harvesting effects (Table 4.12). In 2013, Beya recorded the highest, while
Sokhombela followed by Mjali had the lowest Ca amounts under both RWH and control plots
across all depths (Table 4.12). There was not much difference of Ca amounts observed with
depth in 2013 across sites. The site and depth patterns were highly variable in 2015.
K on the other hand varied significantly across sites (p = 0.004; appendix Jiv) and with water
harvesting treatments (p = 0.018), while season and depth had no effect on the amount of this
element. In 2013, Quvile site had the highest while Beya and Mjali had the lowest K values in
all treatments. In 2015, no clear site differences in K were observed in the control, while
Madosini had the lowest and Beya the highest amount of K in RWH treatment. No clear depth
effect was observed in both seasons.
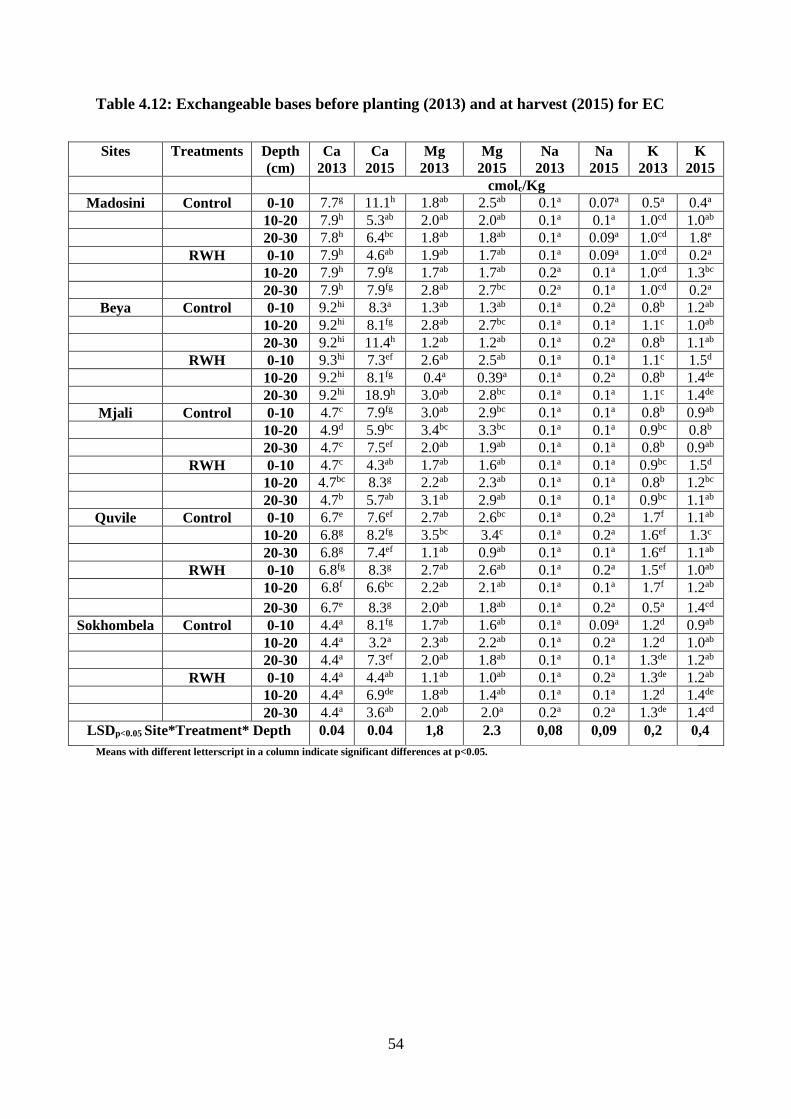
54
Table 4.12: Exchangeable bases before planting (2013) and at harvest (2015) for EC
Sites Treatments Depth
(cm)
Ca
2013
Ca
2015
Mg
2013
Mg
2015
Na
2013
Na
2015
K
2013
K
2015 cmolc/Kg
Madosini Control 0-10 7.7g 11.1h 1.8ab 2.5ab 0.1a 0.07a 0.5a 0.4a 10-20 7.9h 5.3ab 2.0ab 2.0ab 0.1a 0.1a 1.0cd 1.0ab 20-30 7.8h 6.4bc 1.8ab 1.8ab 0.1a 0.09a 1.0cd 1.8e
RWH 0-10 7.9h 4.6ab 1.9ab 1.7ab 0.1a 0.09a 1.0cd 0.2a 10-20 7.9h 7.9fg 1.7ab 1.7ab 0.2a 0.1a 1.0cd 1.3bc 20-30 7.9h 7.9fg 2.8ab 2.7bc 0.2a 0.1a 1.0cd 0.2a
Beya Control 0-10 9.2hi 8.3a 1.3ab 1.3ab 0.1a 0.2a 0.8b 1.2ab 10-20 9.2hi 8.1fg 2.8ab 2.7bc 0.1a 0.1a 1.1c 1.0ab 20-30 9.2hi 11.4h 1.2ab 1.2ab 0.1a 0.2a 0.8b 1.1ab
RWH 0-10 9.3hi 7.3ef 2.6ab 2.5ab 0.1a 0.1a 1.1c 1.5d 10-20 9.2hi 8.1fg 0.4a 0.39a 0.1a 0.2a 0.8b 1.4de 20-30 9.2hi 18.9h 3.0ab 2.8bc 0.1a 0.1a 1.1c 1.4de
Mjali Control 0-10 4.7c 7.9fg 3.0ab 2.9bc 0.1a 0.1a 0.8b 0.9ab 10-20 4.9d 5.9bc 3.4bc 3.3bc 0.1a 0.1a 0.9bc 0.8b 20-30 4.7c 7.5ef 2.0ab 1.9ab 0.1a 0.1a 0.8b 0.9ab
RWH 0-10 4.7c 4.3ab 1.7ab 1.6ab 0.1a 0.1a 0.9bc 1.5d 10-20 4.7bc 8.3g 2.2ab 2.3ab 0.1a 0.1a 0.8b 1.2bc 20-30 4.7b 5.7ab 3.1ab 2.9ab 0.1a 0.1a 0.9bc 1.1ab
Quvile Control 0-10 6.7e 7.6ef 2.7ab 2.6bc 0.1a 0.2a 1.7f 1.1ab 10-20 6.8g 8.2fg 3.5bc 3.4c 0.1a 0.2a 1.6ef 1.3c 20-30 6.8g 7.4ef 1.1ab 0.9ab 0.1a 0.1a 1.6ef 1.1ab
RWH 0-10 6.8fg 8.3g 2.7ab 2.6ab 0.1a 0.2a 1.5ef 1.0ab 10-20 6.8f 6.6bc 2.2ab 2.1ab 0.1a 0.1a 1.7f 1.2ab
20-30 6.7e 8.3g 2.0ab 1.8ab 0.1a 0.2a 0.5a 1.4cd
Sokhombela Control 0-10 4.4a 8.1fg 1.7ab 1.6ab 0.1a 0.09a 1.2d 0.9ab 10-20 4.4a 3.2a 2.3ab 2.2ab 0.1a 0.2a 1.2d 1.0ab 20-30 4.4a 7.3ef 2.0ab 1.8ab 0.1a 0.1a 1.3de 1.2ab
RWH 0-10 4.4a 4.4ab 1.1ab 1.0ab 0.1a 0.2a 1.3de 1.2ab 10-20 4.4a 6.9de 1.8ab 1.4ab 0.1a 0.1a 1.2d 1.4de 20-30 4.4a 3.6ab 2.0ab 2.0a 0.2a 0.2a 1.3de 1.4cd
LSDp<0.05 Site*Treatment* Depth 0.04 0.04 1,8 2.3 0,08 0,09 0,2 0,4
Means with different letterscript in a column indicate significant differences at p<0.05.
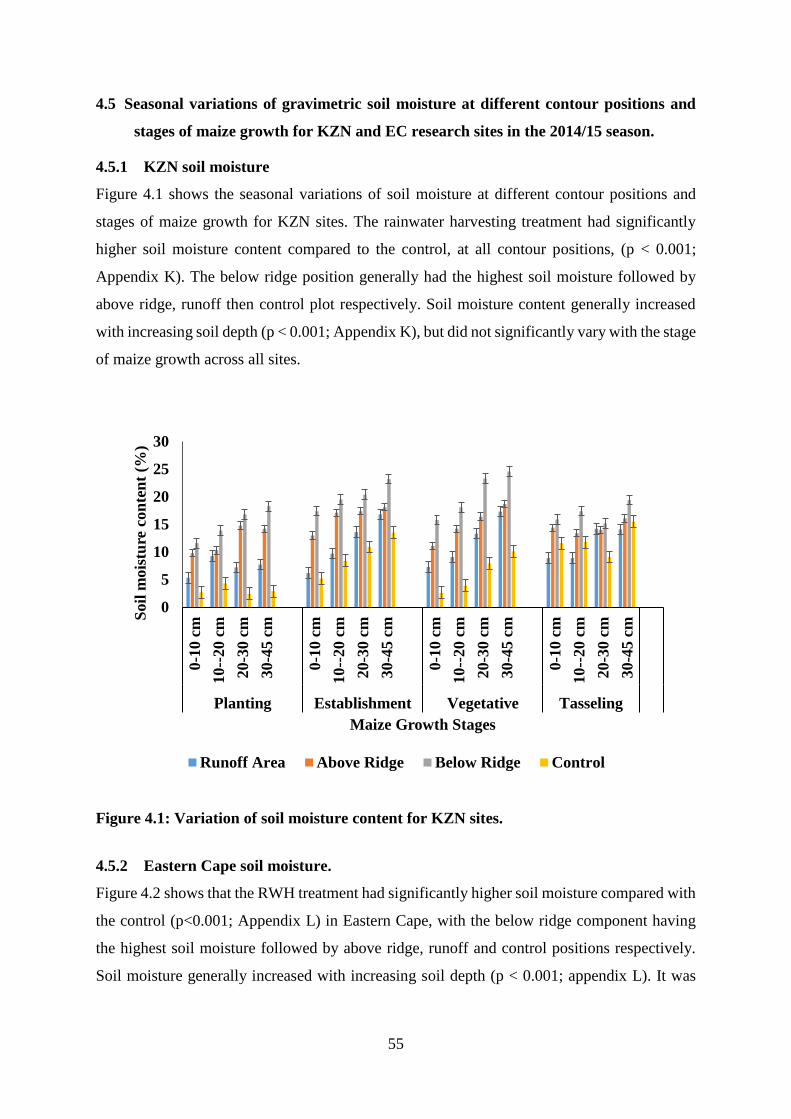
55
4.5 Seasonal variations of gravimetric soil moisture at different contour positions and
stages of maize growth for KZN and EC research sites in the 2014/15 season.
4.5.1 KZN soil moisture
Figure 4.1 shows the seasonal variations of soil moisture at different contour positions and
stages of maize growth for KZN sites. The rainwater harvesting treatment had significantly
higher soil moisture content compared to the control, at all contour positions, (p < 0.001;
Appendix K). The below ridge position generally had the highest soil moisture followed by
above ridge, runoff then control plot respectively. Soil moisture content generally increased
with increasing soil depth (p < 0.001; Appendix K), but did not significantly vary with the stage
of maize growth across all sites.
Figure 4.1: Variation of soil moisture content for KZN sites.
4.5.2 Eastern Cape soil moisture.
Figure 4.2 shows that the RWH treatment had significantly higher soil moisture compared with
the control (p<0.001; Appendix L) in Eastern Cape, with the below ridge component having
the highest soil moisture followed by above ridge, runoff and control positions respectively.
Soil moisture generally increased with increasing soil depth (p < 0.001; appendix L). It was
0
5
10
15
20
25
30
0-1
0 c
m
10--
20 c
m
20-3
0 c
m
30-4
5 c
m
0-1
0 c
m
10--
20 c
m
20-3
0 c
m
30-4
5 c
m
0-1
0 c
m
10--
20 c
m
20-3
0 c
m
30-4
5 c
m
0-1
0 c
m
10--
20 c
m
20-3
0 c
m
30-4
5 c
m
Planting Establishment Vegetative Tasseling
Soil
mois
ture
con
ten
t (%
)
Maize Growth Stages
Runoff Area Above Ridge Below Ridge Control
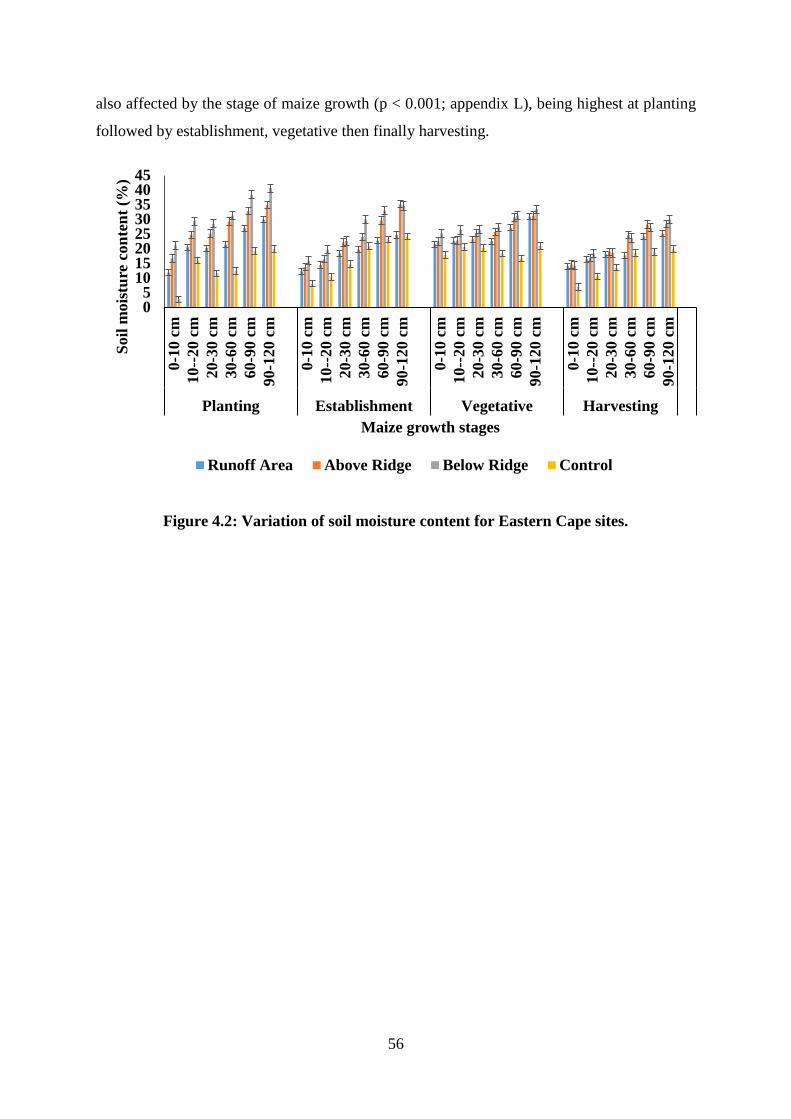
56
also affected by the stage of maize growth (p < 0.001; appendix L), being highest at planting
followed by establishment, vegetative then finally harvesting.
Figure 4.2: Variation of soil moisture content for Eastern Cape sites.
05
1015202530354045
0-1
0 c
m
10--
20 c
m
20-3
0 c
m
30-6
0 c
m
60-9
0 c
m
90-1
20 c
m
0-1
0 c
m
10--
20 c
m
20-3
0 c
m
30-6
0 c
m
60-9
0 c
m
90-1
20 c
m
0-1
0 c
m
10--
20 c
m
20
-30
cm
30-6
0 c
m
60-9
0 c
m
90-1
20 c
m
0-1
0 c
m
10--
20 c
m
20-3
0 c
m
30-6
0 c
m
60-9
0 c
m
90
-12
0 c
m
Planting Establishment Vegetative Harvesting
Soil
mois
ture
con
ten
t (%
)
Maize growth stages
Runoff Area Above Ridge Below Ridge Control
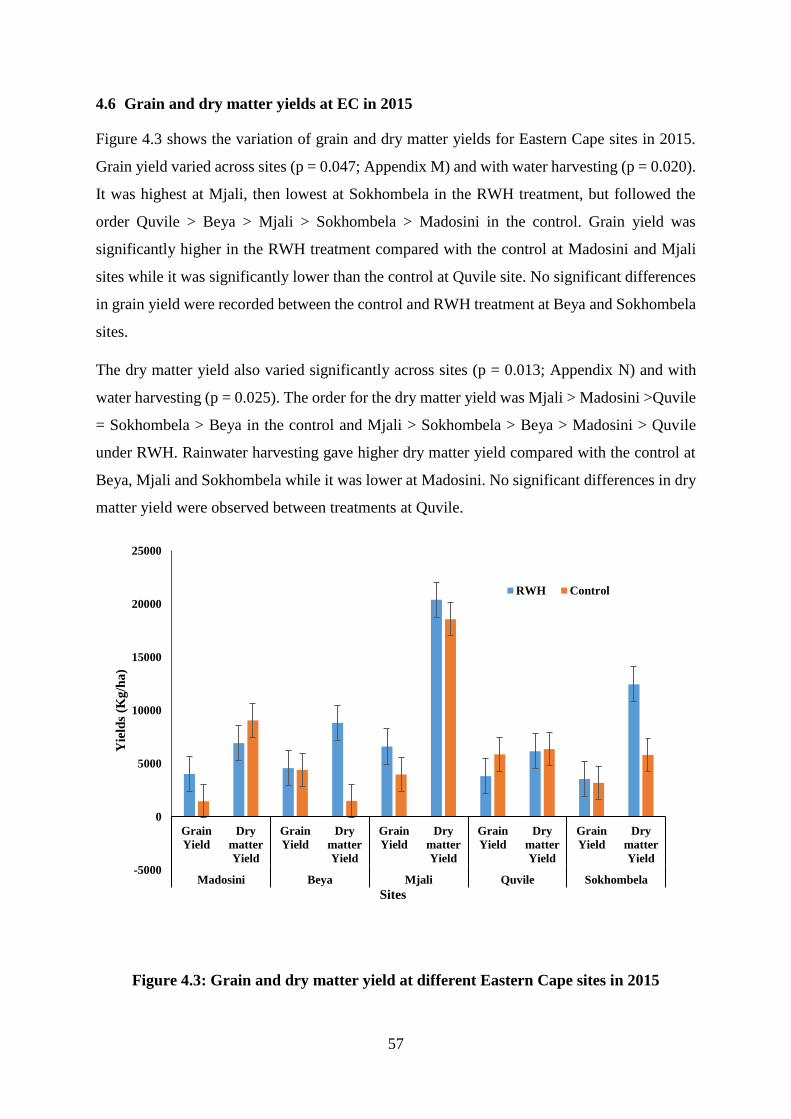
57
4.6 Grain and dry matter yields at EC in 2015
Figure 4.3 shows the variation of grain and dry matter yields for Eastern Cape sites in 2015.
Grain yield varied across sites (p = 0.047; Appendix M) and with water harvesting (p = 0.020).
It was highest at Mjali, then lowest at Sokhombela in the RWH treatment, but followed the
order Quvile > Beya > Mjali > Sokhombela > Madosini in the control. Grain yield was
significantly higher in the RWH treatment compared with the control at Madosini and Mjali
sites while it was significantly lower than the control at Quvile site. No significant differences
in grain yield were recorded between the control and RWH treatment at Beya and Sokhombela
sites.
The dry matter yield also varied significantly across sites (p = 0.013; Appendix N) and with
water harvesting (p = 0.025). The order for the dry matter yield was Mjali > Madosini >Quvile
= Sokhombela > Beya in the control and Mjali > Sokhombela > Beya > Madosini > Quvile
under RWH. Rainwater harvesting gave higher dry matter yield compared with the control at
Beya, Mjali and Sokhombela while it was lower at Madosini. No significant differences in dry
matter yield were observed between treatments at Quvile.
Figure 4.3: Grain and dry matter yield at different Eastern Cape sites in 2015
-5000
0
5000
10000
15000
20000
25000
Grain
Yield
Dry
matter
Yield
Grain
Yield
Dry
matter
Yield
Grain
Yield
Dry
matter
Yield
Grain
Yield
Dry
matter
Yield
Grain
Yield
Dry
matter
Yield
Madosini Beya Mjali Quvile Sokhombela
Yie
lds
(Kg
/ha
)
Sites
RWH Control
58
5 CHAPTER FIVE: GENERAL DISCUSSION, CONCLUSION &
RECOMMENDATIONS
5.1 Introduction
The aim of this chapter is to discuss the main findings from the study as outlined by the initial
objectives of this study. It will further highlight the conclusions drawn and recommendations
made from this research.
5.2 Discussion
Findings from this study suggests that rainwater harvesting improved soil aggregate stability
at Mxheleni site only in Kwa-Zulu Natal; while it was improved across all the study sites in
Eastern Cape. This was informed by higher MWD in the RWH treatment compared with the
traditional farming practice in 2015 than the 2013 season at these sites. However, in KZN there
were no significant differences in bulk density between the RWH treatment and control plots
across most sites in each season. On the other hand, seasonal variations showed bulk density
to be generally higher in 2015 compared to 2013. Improved bulk density through rainwater
harvesting was observed at Sokhombela, Beya, Mjali and Quvile in EC, since they recorded
lower density values in 2015 than 2013. In a similar study done by Li et al (2000), they found
that rainwater harvesting improved both bulk density and aggregate stability, as was the case
in EC. This was further supported by Xiaolong et al (2008) in their study on the effect of
rainwater harvesting on spring corn production. Improved aggregate stability with
simultaneous decrease in bulk density is desirable since it promotes the infiltration rate of soil
and protect it from erosion (Barthes and Roose, 2002). It is however; not very clear why sites
in KZN that had seemingly good aggregate stability had undesirably high density values. It is
possible that the bulk density samples from KZN were taken in areas where the soil was
compacted due to the action of animal hooves and tractor wheels which were used during the
construction of contours. Kuht et al (2012) suggested that the use of heavy agricultural
machinery could lead to soil compaction, which if not managed could possible lead to serious
soil degradation. Shah et al (2017), further alluded that both the use of heavy agricultural
machinery and hoofing by animals could lead to soil compaction. According to Bissonnais
(1996), poor soil aggregation coupled with higher bulk density could promote aggregate
breakdown as well as the detachment of soil fragments by rain in areas under semi-arid regions.
59
This will destroy soil structure which negatively impacts soil water retention, as poor soil
structure promotes the reduction of soil pores that are active in the retention of gases and
moisture within the soil continuum (Kasangaki et al, 2003).
Soil pH was not affected by rainwater harvesting across all sites in KZN and Eastern Cape.
This was informed by RWH plots having similar pH results with the traditional farmer practice.
However, seasonal variations showed increasing pH at KZN while it decreased in Eastern Cape
as one moved from 2013 to 2015. Generally, an increase in soil moisture could results in a
decrease in soil pH (Adejumobi et al, 2014). This, especially could hold true for Eastern Cape
sites as higher annual rainfall was recorded in 2015 compared with those obtained in 2013
(Appendix P). Therefore, the differences in the amount of recorded annual rainfall could cause
the pH to drop because of possible high amount of soil moisture which could results in a drop
in soil pH as one move from 2013 to 2015 (Wang and Jong, 1998). In KZN sites, an opposite
trend was observed with regards to rainfall. Higher amounts of rainfall were received in 2013
compared with those obtained in 2015 (Appendix O). As a result, soil pH values were recorded
lower in 2013 than those recorded in 2015 for all KZN sites. This is again could be associated
with Adejumobi et al (2014) observations mentioned in the preceding section. Helyar and
Porter (1989) described the mechanism that results in dropping soil pH because of an increase
in soil moisture. In their description, they stated that as soil water increases, it results in possible
leaching of basic elements such as calcium, magnesium and potassium. These basic elements
are then replaced by acidic elements such as hydrogen, aluminium and manganese (Bolan et
al, 2003). This mechanism was supported in this study by a drop in soil pH when research sites
received higher rainfall and an increase in soil pH when study sites received lower rainfall.
This study showed no effect of rainwater harvesting on soil micronutrients in both KZN and
Eastern Cape sites. Seasonal effects were significant for Fe as it increased in 2015 in both areas.
Iron was also found to be higher at Mntungane and Xoshimpi sites in KZN. This could be
associated with the soil form found at these sites which is Shortlands that is dominated by the
haematite mineral with high Fe content (Inman-Bamber et al, 1993). When this soil form
receives adequate moisture, Fe is easily released as an abundant element (Meyer et al, 1983).
The same reason may apply to the EC sites as they were dominated by Hutton soil form and
Shortlands also associated with high Fe mineralogy. Furthermore, in the Eastern Cape, Cu and
Mn also increased in 2015, while Zn decreased in 2015 at KZN. The mobility of Cu and Mn is
favoured at soil pH less than 5 (Mdlambuzi, 2014). However, the mobility of these elements
could not be associated with pH in this study. This is because even though there was a slightly
60
drop in soil pH in 2015 in the EC sites, the drop was still not less than 5 where the mobility of
these elements is promoted. However, Weil et al (2016) stated that the availability of these
elements in soils i.e. Cu and Mn could also be favoured under the conditions of increasing soil
moisture content. The increase in soil moisture content under the RWH treatment due to high
rainfall received in 2015 compared with that received in 2013 for EC sites (Appendix P) under
the RWH treatment could therefore be associated with an increase in the concentration of these
elements in these sites.
Rainwater harvesting did not have a significant effect on basic cations serve for Mg and K that
had variable trends among treatments in KZN and EC respectively. There was a rise in Mg
levels while Na amounts dropped in 2015 at KZN. According to Shaw and Thorbum (1985),
when soil moisture content increases either through irrigation or heavy precipitation, it
promotes the mobility of micro nutrients that form complexes with basic cations and results in
the leaching of these basic cations making them less available in the soil. This was supported
by Xu et al (2010) who explained that if more moisture is received by the soil through irrigation
or rainfall, it can result in a drop in the soil pH towards acidic. This observation was clearly
supported by findings in the Eastern Cape sites in 2015 and in KZN sites in 2013 where higher
rainfall was received and yet some basic elements were less available in the soil. According to
the soil forms that were obtained across all study sites, the dominant soil form was well drained
Shortlands and Hutton. These soils are usually developed from dolerite which is an igneous
rock. According to Mayland and Wilkinson (1989), soils that are formed from igneous rocks
contain substantial amounts of ferromagnesian mineral, which means that they contain vast
amounts of iron and magnesium. It is that reason that high amounts of Mg and Fe under RWH
treatment were obtained in this study.
In the Eastern Cape where the control exhibited lower concentration of K compared with RWH,
was contrary to most of water conservation studies as lower concentrations of this element
could only be expected under RWH since it promotes the leaching of basic elements. Therefore,
we could rather expect RWH plot to have lower concentration of these element since this
technique aimed at increasing soil moisture and therefore promotes the acidic conditions that
will promote the mobility of micronutrients that will form complexes with basic elements
making them less available in the RWH. However, Nelson (1968) stated that the lower soil
temperature could affect the availability of K in the soil. The low quantities of K obtained under
the RWH compared with those under the control could only be associated with the soil
temperature. The soil samples in 2015 were collected at harvest in July where soil exhibited
61
low temperature, which resulted in RWH treatment exhibiting lower concentrations of K than
the control as the RWH treatment had lower soil temperature compared with the control.
Higher soil moisture was found on all the different positions of the contour compared with
control plot. This implies that RWH effectively conserved soil moisture (Botha et al., 2007).
Improved soil moisture results in good crop yields as it enhances the easy flow of essential
plant nutrients, making them readily available for plant uptake (Tardieu et al., 1991). The
highest soil moisture was obtained below the ridge of the contour across all sites in Kwa-Zulu
Natal and Eastern Cape. This suggests that rainwater collects from the runoff area and is
deposited below the ridge of the contour. Higher accumulation of rainwater below the ridge
could promote plant growth. As a result, it is recommended that plants be grown along the
contours so that they enjoy the benefits of higher moisture content in this region. The growing
of plants along the contour was also recommended by Botha (2006). Higher soil moisture was
obtained during the vegetation and establishment stages of maize growth in KZN and at
planting in the Eastern Cape. This could be due to the fact that rainfall amounts were highest
at planting in EC compared to other stages of maize growth.
Results from this study show that the contour ridge rainwater harvesting technique is suitable
for arid and semi-arid regions through its effect of improving soil moisture reserves. It might
not be suitable in humid regions for the same reasons, as the higher moisture reserves under
contours would induce heavy leaching of basic cations resulting in decreases in soil pH towards
acidic levels (Helyar and Porter, 1989). This acidity will consequently favour the sorption and
precipitation of elements such as P and exchangeable bases while micronutrients Fe, Mn etc.
become more available at low pH (McBride, 1994). However, this could not be possible in dry
areas such as those from arid and semi-arid regions. Furthermore, higher soil moisture found
at deeper soil depths across all study sites implies that water percolates down the soil profile
and accumulates in the lower depths (Iqbal et al., 2005).
Higher grain yields at Madosini and Mjali and dry matter yield at Beya, Mjali and Sokhombela
under RWH than the control plot suggests that RWH through contour farming can be adopted
to improve maize crop production in low yielding rain-fed areas. Many studies have shown
that RWH technology is designed specifically for subsistence farmers who are located in
marginal semi-arid ecotopes with high risk of drought, coupled with duplex soils and high
runoff losses (Hensley et al., 2011). Farmers like those that were part of this study can be able
to attain better crop yields through contour farming than what they obtain using their
62
conventional farming practices. Mzezewa et al (2011) at the university of Venda research farm
conducted another study where the grain yield of sunflower was compared between the in-field
rainwater harvesting (IRWH) and other tillage systems. Results from this study indicated that
grain yield was 56 % higher in IRWH than under other tillage systems. Botha et al (2003) and
Botha et al (2012) obtained similar results where grain yields of sunflower and maize crops
were improved because of RWH. Oweis and Hachum (2006), also measured the maize dry
matter yield under water harvesting and supplemental irrigation for improved water
productivity of dryland farming system. They found that where water harvesting structures i.e.
contour ridges and bunds were constructed there was higher dry matter yield compared to
where no water harvesting structures were constructed. Based on these findings from the
literature, it can be concluded that rainwater harvesting could improve both grain and dry
matter yield.
5.3 Implications, recommendation and conclusions for further studies
Climate variability poses a great threat to agricultural food production in rural areas of arid and
semi-arid regions. Technologies that will assist the less privilege farmers in these regions are
demanding attention to researchers. Studies have shown that rainwater harvesting can address
the issue of rainfall variability in these regions by conserving limited water resource for crop
production. It is therefore recommended that farmers especially those that are resource poor in
these regions are supported by all means, especially with financial investments and required
skills for the successful implementation of RWH in order to improve crop production under
unfavourable climatic conditions. It has been proven in several studies that rainwater harvesting
can improve the livelihood and food security of those communities that have adopted it (Botha
et al, 2003).
It is therefore recommended, based on the findings from this study that farmers should improve
their traditional way of farming by incorporating rainwater harvesting in crop production. This
is because rainwater harvesting does not only conserve water but also conserves the fragile soil
resource while maintaining higher crop yields. However, this will require capital investment to
cover the labour requirements needed to implement and maintain contours. This is especially
true for rural communities since most of the farmers there are elderly people who will not be
able to supply the labour required for successful implementation and maintenance of rainwater
harvesting. Apart from the unfavourable socio-economic status of farmers who participate in
rural farming, contour farming also requires skilled personnel that can ensure accurate
63
installation of the contours, otherwise they will end up causing accelerated soil losses through
erosion if not installed properly. It is therefore equally significant that government departments
such as agriculture and rural development should come on board to support the implementation
of rainwater harvesting technology since it has potential to promote crop production under a
variable climate.
Conclusions drawn from our study is that that RWH through use of contours, improved soil
aggregate stability, soil moisture content as well as grain and dry matter yields compared to the
traditional farmer practice. However, the trends for the effect of RWH on other soil parameters
such as bulk density, micronutrients and exchangeable bases were inconsistent and highly
variable to draw meaningful conclusions. Better soil fertility trends might have been observed
if the experiment had been allowed to run over a longer period of time. The recommendation
is therefore to advise farmers to adopt contour farming, since it has the ability to conserve soil
moisture, improved aggregate stability and consequently enhance crop yields. The higher plant
biomass produced under rainwater harvesting can also be incorporated into the soil after crop
harvest to enhance residual soil fertility for the next crop, as well as improve soil carbon
reserved. The biomass produced could also be given as fodder to animals especially during
drought years when pastures are unproductive.
Farmers could also become more food secure as a result of better grain yield gains under
rainwater harvesting. Future research must aim at studying the performance of contour ridges
under more seasons, and possibly with a combination of other conservation techniques such as
crop rotation, residue mulch or the use of cover crops etc. to gain a more holistic insight as to
the benefits of different rainwater harvesting techniques, under rural dry-land farming
conditions.
64
6 References
ABU-AWWAD, A. M. AND SHATANAWI, M. R. 1997. Water harvesting and infiltration in
arid areas affected by surface crust: examples from Jordan. Journal of Arid
Environments, 37, 443-452.
ADEJUMOBI, M.A., OJEDIRAN, J.O. AND OLABIYI, O.O., 2014. Effects of irrigation
practices on some soil chemical properties on OMI irrigation scheme.
International Journal Engineering Research and Applications, 4(10 Part 2), 29-35.
AFFAIRS, S. A. D. O. W. AND FORESTRY 1994. Water Supply and Sanitation Policy: White
Paper: Water, an Indivisible National Asset, Department of Water Affairs and
Forestry.
AL-SEEKH, S. H. AND MOHAMMAD, A. G. 2009. The effect of water harvesting techniques
on runoff, sedimentation, and soil properties. Environmental management, 44, 37-45.
AL-SHAMIRI, A. AND ZIADAT, F. M. 2012. Soil-landscape modeling and land suitability
evaluation: the case of rainwater harvesting in a dry rangeland environment.
International Journal of Applied Earth Observation and Geoinformation, 18, 157-164.
AMEZKETA, E. 1999. Soil aggregate stability: a review. Journal of sustainable agriculture,
14, 83-151.
AMEZKETA, E. 1999. Soil aggregate stability: a review. Journal of sustainable agriculture,
14, 83-151.
AMMAR, A., RIKSEN, M., OUESSAR, M. AND RITSEMA, C. 2016. Identification of
suitable sites for rainwater harvesting structures in arid and semi-arid regions: A
review. International Soil and Water Conservation Research, 4, 108-120.
BAIYEGUNHI, L. J. S. 2015. Determinants of rainwater harvesting technology (RWHT)
adoption for home gardening in Msinga, KwaZulu-Natal, South Africa. Water SA, 41,
33-40.
BARLING, R. D. AND MOORE, I. D. 1994. Role of buffer strips in management of waterway
pollution: a review. Environmental management, 18, 543-558.

65
BARTHES, B. AND ROOSE, E., 2002. Aggregate stability as an indicator of soil
susceptibility to runoff and erosion; validation at several levels. Catena, 47(2), 133-
149.
BENNIE, A.T.P. AND HENSLEY, M., 2001. Maximizing precipitation utilization in dryland
agriculture in South Africa—a review. Journal of Hydrology, 241(1), 124-139.
BISSONNAIS, Y. L. 1996. Aggregate stability and assessment of soil crustability and
erodibility: I. Theory and methodology. European Journal of soil science, 47, 425-
437.
BLAKE, G. 1965. Bulk density. Methods of soil analysis. Part 1. Physical and mineralogical
properties, including statistics of measurement and sampling, p. 374-390.
BLEVINS, R., THOMAS, G., SMITH, M., FRYE, W. AND CORNELIUS, P. 1983. Changes
in soil properties after 10 years continuous non-tilled and conventionally tilled corn.
Soil and tillage research, Environmental management, 3, 135-146.
BOLAN, N.S., ADRIANO, D.C. AND CURTIN, D., 2003. Soil acidification and liming
interactions with nutrient and heavy metal transformation and bioavailability.
Advances in Agronomy, 78, 215-272.
BORIN, M., VIANELLO, M., MORARI, F. AND ZANIN, G., 2005. Effectiveness of buffer
strips in removing pollutants in runoff from a cultivated field in North-East
Italy. Agriculture, ecosystems & environment, 105(1), 101-114.
BOTHA, J. J. 2006. Evaluation of maize and sunflower production in a semi-arid area using
in-field rainwater harvesting.
BOTHA, J., ANDERSON, J., GROENEWALD, D., MDIBE, N., BAIPHETHI, M.,
NHLABATSI, N. AND ZERE, T. 2007. On-farm application of in-field rainwater
harvesting techniques on small plots in the central region of South Africa. The Water
Research Commission Report, South Africa.
BOTHA, J., VAN RENSBURG, L., ANDERSON, J., HENSLEY, M., MACHELI, M., VAN
STADEN, P., KUNDHLANDE, G., GROENEWALD, D. AND BAIPHETHI, M.
2003. Water conservation techniques on small plots in semi-arid areas to enhance
rainfall use efficiency, food security, and sustainable crop production. Water Research
Commission Report, 1176, 03.
66
BOTHA, J.J., 2006. Evaluation of maize and sunflower production in a semi-arid area using
in-field rainwater harvesting (Doctoral dissertation, University of the Free State).
BOTHA, J.J., VAN RENSBURG, L.D., ANDERSON, J.J., VAN STADEN, P.P. AND
HENSLEY, M., 2012. Improving maize production of in‐field rainwater harvesting
technique at glen in South Africa by the addition of mulching practices. Irrigation and
Drainage, 61(S2), 50-58.
BRADY, N. C. AND WEIL, R. R. 2000. Elements of the nature and properties of soils, Prentice
Hall Upper Saddle River, NJ, USA.
BULLUCK, L., BROSIUS, M., EVANYLO, G. AND RISTAINO, J. 2002. Organic and
synthetic fertility amendments influence soil microbial, physical and chemical
properties on organic and conventional farms. Applied Soil Ecology, 19, 147-160.
CAMP, K. G. T. 1997. The bioresource groups of KwaZulu-Natal, KwaZulu-Natal
Department of Agriculture, Cedara, Pietermaritzburg.
CAMP, K. G. T. 1999. A bioresource classification for KwaZulu-Natal, South Africa.
CARTER, M. 1990. Relative measures of soil bulk density to characterize compaction in
tillage studies on fine sandy loams. Canadian Journal of Soil Science, 70, 425-433.
COMMITTEE, N.-A. S. A. W. 1990. Handbook of standard soil testing methods for advisory
purposes. Soil Science Society of South Africa, Pretoria, p.160.
DENG, X.-P., SHAN, L., ZHANG, H. AND TURNER, N. C. 2006. Improving agricultural
water use efficiency in arid and semiarid areas of China. Agricultural Water
Management, 80, 23-40.
DILLEY, M., 2000. Reducing vulnerability to climate variability in Southern Africa: the
growing role of climate information. In Societal Adaptation to Climate Variability and
Change (p. 63-73). Springer Netherlands.
DUNKERLEY, D. 2002. Infiltration rates and soil moisture in a groved mulga community near
Alice Springs, arid central Australia: evidence for complex internal rainwater
redistribution in a runoff–runon landscape. Journal of Arid Environments, 51, 199-219.
DRECHSEL, P., GRAEFE, S., SONOU, M. AND COFIE, O.O., 2006. Informal irrigation in
urban West Africa: An overview (Vol. 102). IWMI.
67
GAO, Y., XIE, Y., JIANG, H., WU, B. AND NIU, J. 2014. Soil water status and root
distribution across the rooting zone in maize with plastic film mulching. Field Crops
Research, 156, 40-47.
GEE, G. W. AND BAUDER, J. W. 1986. Particle-size analysis. Methods of soil analysis: Part
1—Physical and mineralogical methods, 383-411.
GNADLINGER, J. 2000. Rainwater Harvesting in rural areas. IRPPA, Juazeiro, BA.
GOWING, J.W., MAHOO, H.F., MZIRAI, O.B. AND HATIBU, N., 1999. Review of
rainwater harvesting techniques and evidence for their use in semi-arid Tanzania.
Tanzania Journal of Agricultural Sciences, 2, 21-29.
HAGMANN, J. 1996. Contour Ridges: Cure for, or Cause of, Rill Erosion? Land degradation
& development, 7, 145-160.
HALL, R., 2007. Transforming rural South Africa? Taking stock of land reform. The
land question in South Africa, 87-106.
HAMMAD, A. A., HAUGEN, L. E. AND BØRRESEN, T. 2004. Effects of stonewalled
terracing techniques on soil-water conservation and wheat production under
Mediterranean conditions. Environmental Management, 34, 701-710.
HAMMOND‐TOOKE, W. 1968. Descent group scatter in a Mpondomise ward. African
Studies, 27, 83-94.
HARDY, M. AND CAMP, K. 1999. Bioresource Groups 11, 12 and 15: Moist Transitional
Tall Grassveld, Moist Tall Grassveld and Moist Lowland Tall Grassveld. Veld in
KwaZulu-Natal. KwaZulu-Natal Department of Agriculture, Cedara, p. 88-91.
HATIBU, N. AND MAHOO, H., 1999. Rainwater harvesting technologies for agricultural
production: A case for Dodoma, Tanzania. Conservation tillage with animal traction,
p.161.
HATIBU, N., MUTABAZI, K., SENKONDO, E. AND MSANGI, A. 2006. Economics of
rainwater harvesting for crop enterprises in semi-arid areas of East Africa.
Agricultural Water Management, 80, 74-86.

68
HAVLIN, J., KISSEL, D., MADDUX, L., CLAASSEN, M. AND LONG, J. 1990. Crop
rotation and tillage effects on soil organic carbon and nitrogen. Soil Science Society
of America Journal, 54, 448-452.
HAYNES, R. AND FRANCIS, G. 1993. Changes in microbial biomass C, soil carbohydrate
composition and aggregate stability induced by growth of selected crop and forage
species under field conditions. European Journal of Soil Science, 44, 665-675.
HELYAR, K.R. AND PORTER, W.M., 1989. Soil acidification, its measurement and the
processes involved. Soil acidity and plant growth, 17, 61-101.
HENSLEY, M., BOTHA, J.J., ANDERSON, J.J., VAN STADEN, P.P. AND DU TOIT, A.,
2000. Optimizing rainfall use efficiency for developing farmers with limited access to
irrigation water. Water Research Commission, South Africa, Report, 34, 701-710.
HENSLEY, M., BENNIE, A.T.P., VAN RENSBURG, L.D. AND BOTHA, J.J., 2011.
Review of'plant available water'aspects of water use efficiency under irrigated and
dryland conditions. Water SA, 37(5), 771-779.
HORN, R., TAUBNER, H., WUTTKE, M. AND BAUMGARTL, T. 1994. Soil physical
properties related to soil structure. Soil and Tillage Research, 30, 187-216.
HORNECK, D. A., SULLIVAN, D. M., OWEN, J. S. AND HART, J. M. 2011. Soil test
interpretation guide. [Corvallis, Or.]: Oregon State University, Extension Service.
HOWELL, T. A. 2001. Enhancing water use efficiency in irrigated agriculture. Agronomy
journal, 93, 281-289.
INMAN-BAMBER, N.G., CULVERWELL, T.L. AND MCGLINCHEY, M.G., 1993.
Predicting yield responses to irrigation of sugarcane from a growth model and field
records. In Proceedings of the South African Sugar Technologists’ Association
Vol. 67, 66-72.
IQBAL, J., THOMASSON, J. A., JENKINS, J. N., OWENS, P. R. AND WHISLER, F. D.
2005. Spatial variability analysis of soil physical properties of alluvial soils. Soil
Science Society of America Journal, 69, 1338-1350.
JIANG, Z.Y. AND LI, X.Y. 2013. Water and energy conservation of rainwater harvesting
system in the Loess Plateau of China. Journal of Integrative Agriculture, 12, 1389-
1395.
69
JONES, H. E. AND ETHERINGTON, J. 1970. Comparative studies of plant growth and
distribution in relation to waterlogging: I. The survival of Erica cinerea L. and E.
tetralix L. and its apparent relationship to iron and manganese uptake in
waterlogged soil. The Journal of Ecology, 487-496.
JOSEPH, L. F. 2007. Maize response to in-field rainwater harvesting on the Fort Hare
oakleaf ecotype. African Journal of Environmental Science and Technology, 3,
206-218.
KABORÉ, D. AND REIJ, C. 2004. The emergence and spreading of an improved traditional
soil and water conservation practice in Burkina Faso, Intl Food Policy Res Inst.
KAHINDA, J. M. AND TAIGBENU, A. 2011. Rainwater harvesting in South Africa:
Challenges and opportunities. Physics and Chemistry of the Earth, Parts A/B/C, 36,
968-976.
KAHINDA, J. M., LILLIE, E., TAIGBENU, A., TAUTE, M. AND BOROTO, R. 2008.
Developing suitability maps for rainwater harvesting in South Africa. Physics and
Chemistry of the Earth, Parts A/B/C, 33, 788-799.
KAHINDA, J. M., TAIGBENU, A. AND BOROTO, R. 2010. Domestic rainwater harvesting
as an adaptation measure to climate change in South Africa. Physics and Chemistry of
the Earth, Parts A/B/C, 35, 742-751.
KAHINDA, J.-M. M., TAIGBENU, A. E. AND BOROTO, J. R. 2007. Domestic rainwater
harvesting to improve water supply in rural South Africa. Physics and Chemistry of
the Earth, Parts A/B/C, 32, 1050-1057.
KASANGAKI, G.J., MEDERO, G.M. AND OOI, J.Y., 2013. Factors influencing water
retention characteristics of granular materials. Multiphysical Testing of Soils and
Shales, p.111-116.
KUHT, J., REINTAM, E., EDESI, L. AND NUGIS, E., 2012. Influence of subsoil
compaction on soil physical properties and on growing conditions of barley.
Agronomy Research, 10(1-2), 329-334.
LAL, R. 2006. Enhancing crop yields in the developing countries through restoration of the
soil organic carbon pool in agricultural lands. Land Degradation & Development, 17,
197-209.
70
LEMA, M. AND MAJULE, A. E. 2009. Impacts of climate change, variability and adaptation
strategies on agriculture in semi-arid areas of Tanzania: The case of Manyoni District
in Singida Region, Tanzania. African Journal of Environmental Science and
Technology, 3, 206-218.
LI, F., COOK, S., GEBALLE, G. T. AND BURCH JR, W. R. 2000. Rainwater harvesting
agriculture: an integrated system for water management on rainfed land in China's*
semiarid areas. AMBIO: A Journal of the Human Environment, 29, 477-483.
LI, X.Y., GONG, J.D. AND WEI, X.-H. 2000b. In-situ rainwater harvesting and gravel mulch
combination for corn production in the dry semi-arid region of China. Journal of Arid
Environments, 46, 371-382.
LI, X.Y. AND GONG, J.D. 2002. Compacted microcatchments with local earth materials for
rainwater harvesting in the semiarid region of China. Journal of Hydrology, 257, 134-
144.
LI, X.Y., ZHAO, W.W., SONG, Y.-X., WANG, W. AND ZHANG, X.-Y. 2008. Rainfall
harvesting on slopes using contour furrows with plastic-covered transverse ridges for
growing Caragana korshinskii in the semiarid region of China. Agricultural Water
Management, 95, 539-544.
LIU, C., JIN, S., ZHOU, L., JIA, Y., LI, F., XIONG, Y. AND LI, X. 2009. Effects of plastic
film mulch and tillage on maize productivity and soil parameters. European Journal of
Agronomy, 31, 241-249.
LUCAS, R.E. AND D DAVIS, J., 1961. Relationships between pH values of organic soils and
availabilities of 12 plant nutrients. Soil Science, 92(3), 177-182.
MAJULE, A. 2008. Climate change and variability: Impacts on agriculture and water
resource and implications for livelihoods in selected basins. InWEnt-Internationale
Weiterbildung und Entwicklung gGmbH. 87, 36-54.
MAYLAND, H.F. AND WILKINSON, S.R., 1989. Soil factors affecting magnesium
availability in plant-animal systems: A review. Journal of Animal Science, 67(12),
3437-3444.
MBILINYI, B. P., TUMBO, S. D., MAHOO, H. F., SENKONDO, E. M. AND HATIBU, N.
2005. Indigenous knowledge as decision support tool in rainwater harvesting. Physics
and Chemistry of the Earth, Parts A/B/C, 30, 792-798.
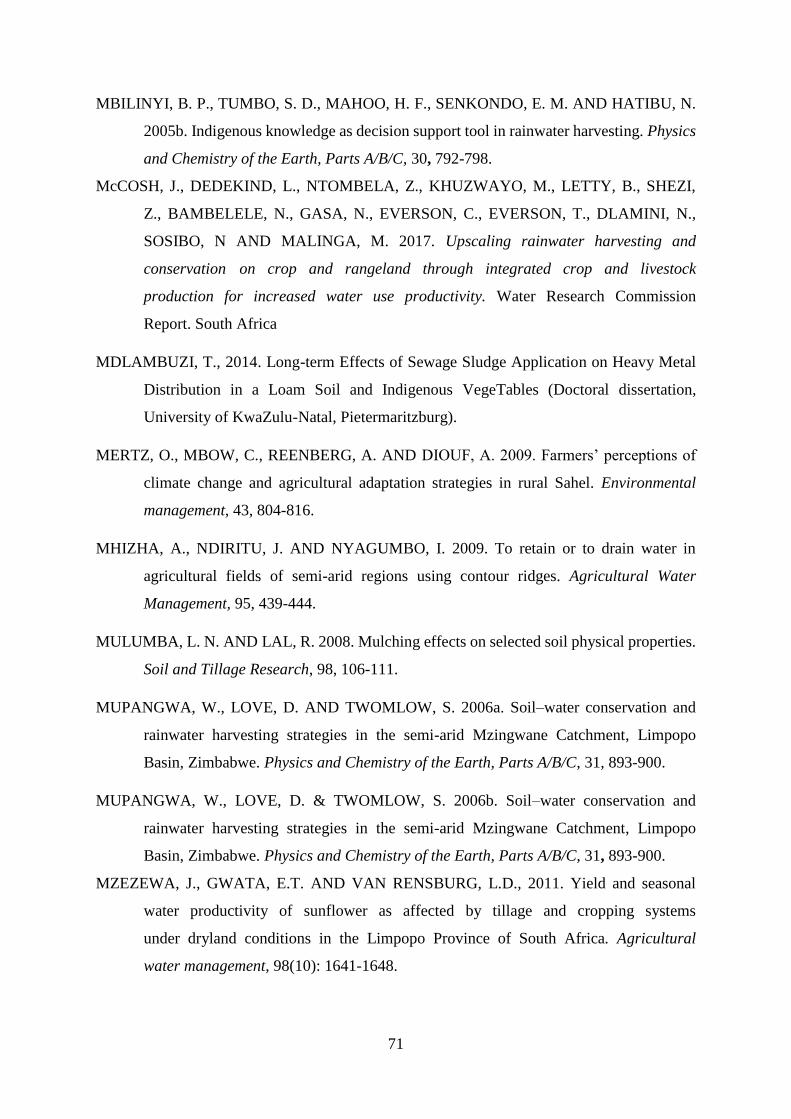
71
MBILINYI, B. P., TUMBO, S. D., MAHOO, H. F., SENKONDO, E. M. AND HATIBU, N.
2005b. Indigenous knowledge as decision support tool in rainwater harvesting. Physics
and Chemistry of the Earth, Parts A/B/C, 30, 792-798.
McCOSH, J., DEDEKIND, L., NTOMBELA, Z., KHUZWAYO, M., LETTY, B., SHEZI,
Z., BAMBELELE, N., GASA, N., EVERSON, C., EVERSON, T., DLAMINI, N.,
SOSIBO, N AND MALINGA, M. 2017. Upscaling rainwater harvesting and
conservation on crop and rangeland through integrated crop and livestock
production for increased water use productivity. Water Research Commission
Report. South Africa
MDLAMBUZI, T., 2014. Long-term Effects of Sewage Sludge Application on Heavy Metal
Distribution in a Loam Soil and Indigenous VegeTables (Doctoral dissertation,
University of KwaZulu-Natal, Pietermaritzburg).
MERTZ, O., MBOW, C., REENBERG, A. AND DIOUF, A. 2009. Farmers’ perceptions of
climate change and agricultural adaptation strategies in rural Sahel. Environmental
management, 43, 804-816.
MHIZHA, A., NDIRITU, J. AND NYAGUMBO, I. 2009. To retain or to drain water in
agricultural fields of semi-arid regions using contour ridges. Agricultural Water
Management, 95, 439-444.
MULUMBA, L. N. AND LAL, R. 2008. Mulching effects on selected soil physical properties.
Soil and Tillage Research, 98, 106-111.
MUPANGWA, W., LOVE, D. AND TWOMLOW, S. 2006a. Soil–water conservation and
rainwater harvesting strategies in the semi-arid Mzingwane Catchment, Limpopo
Basin, Zimbabwe. Physics and Chemistry of the Earth, Parts A/B/C, 31, 893-900.
MUPANGWA, W., LOVE, D. & TWOMLOW, S. 2006b. Soil–water conservation and
rainwater harvesting strategies in the semi-arid Mzingwane Catchment, Limpopo
Basin, Zimbabwe. Physics and Chemistry of the Earth, Parts A/B/C, 31, 893-900.
MZEZEWA, J., GWATA, E.T. AND VAN RENSBURG, L.D., 2011. Yield and seasonal
water productivity of sunflower as affected by tillage and cropping systems
under dryland conditions in the Limpopo Province of South Africa. Agricultural
water management, 98(10): 1641-1648.
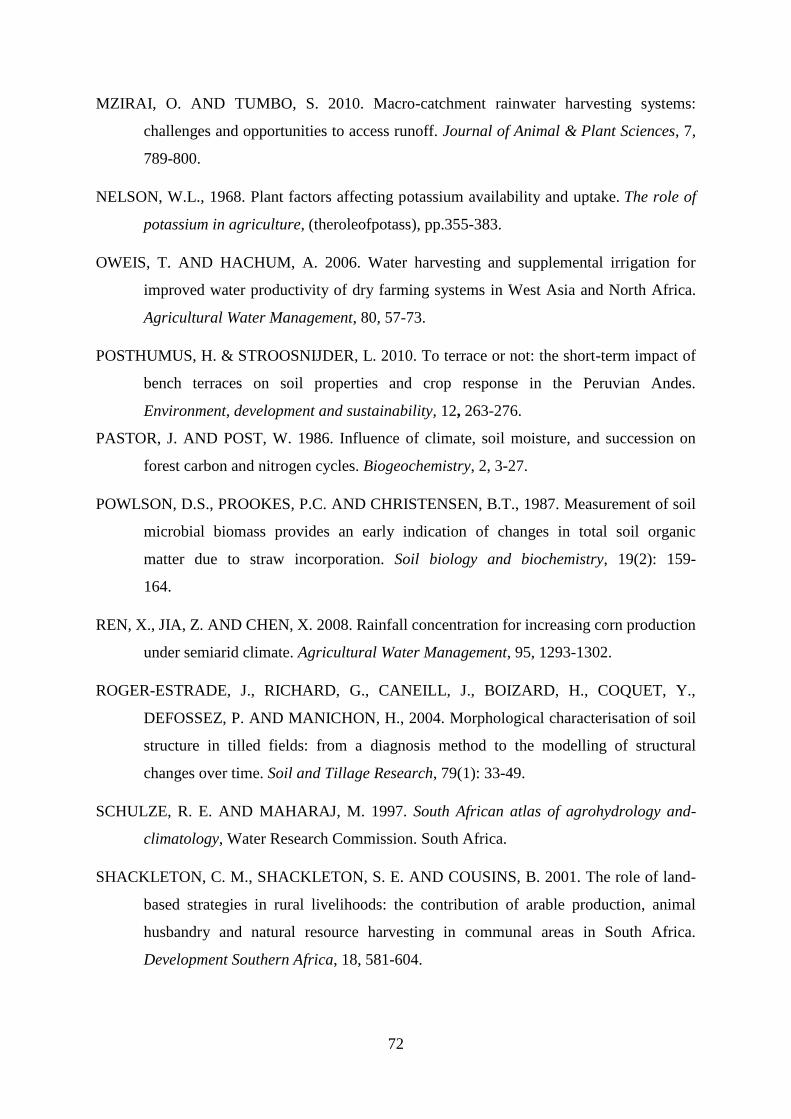
72
MZIRAI, O. AND TUMBO, S. 2010. Macro-catchment rainwater harvesting systems:
challenges and opportunities to access runoff. Journal of Animal & Plant Sciences, 7,
789-800.
NELSON, W.L., 1968. Plant factors affecting potassium availability and uptake. The role of
potassium in agriculture, (theroleofpotass), pp.355-383.
OWEIS, T. AND HACHUM, A. 2006. Water harvesting and supplemental irrigation for
improved water productivity of dry farming systems in West Asia and North Africa.
Agricultural Water Management, 80, 57-73.
POSTHUMUS, H. & STROOSNIJDER, L. 2010. To terrace or not: the short-term impact of
bench terraces on soil properties and crop response in the Peruvian Andes.
Environment, development and sustainability, 12, 263-276.
PASTOR, J. AND POST, W. 1986. Influence of climate, soil moisture, and succession on
forest carbon and nitrogen cycles. Biogeochemistry, 2, 3-27.
POWLSON, D.S., PROOKES, P.C. AND CHRISTENSEN, B.T., 1987. Measurement of soil
microbial biomass provides an early indication of changes in total soil organic
matter due to straw incorporation. Soil biology and biochemistry, 19(2): 159-
164.
REN, X., JIA, Z. AND CHEN, X. 2008. Rainfall concentration for increasing corn production
under semiarid climate. Agricultural Water Management, 95, 1293-1302.
ROGER-ESTRADE, J., RICHARD, G., CANEILL, J., BOIZARD, H., COQUET, Y.,
DEFOSSEZ, P. AND MANICHON, H., 2004. Morphological characterisation of soil
structure in tilled fields: from a diagnosis method to the modelling of structural
changes over time. Soil and Tillage Research, 79(1): 33-49.
SCHULZE, R. E. AND MAHARAJ, M. 1997. South African atlas of agrohydrology and-
climatology, Water Research Commission. South Africa.
SHACKLETON, C. M., SHACKLETON, S. E. AND COUSINS, B. 2001. The role of land-
based strategies in rural livelihoods: the contribution of arable production, animal
husbandry and natural resource harvesting in communal areas in South Africa.
Development Southern Africa, 18, 581-604.

73
SHAH, A.N., TANVEER, M., SHAHZAD, B., YANG, G., FAHAD, S., ALI, S., BUKHARI,
M.A., TUNG, S.A., HAFEEZ, A. AND SOULIYANONH, B., 2017. Soil
compaction effects on soil health and crop productivity: an overview.
Environmental Science and Pollution Research, 16, 1-12.
SHAW, R.J. AND THORBURN, P.J., 1985. Prediction of leaching fraction from soil
properties, irrigation water and rainfall. Irrigation Science, 6(2): 73-83.
SHRESTHA, B., SINGH, B., SITAULA, B., LAL, R. AND BAJRACHARYA, R. 2007. Soil
aggregate-and particle-associated organic carbon under different land uses in Nepal.
Soil Science Society of America Journal, 71, 1194-1203.
SINGH, G., KHAN, A., KUMAR, A., BALA, N. AND TOMAR, U. 2012. Effects of rainwater
harvesting and afforestation on soil properties and growth of Emblica officinalis while
restoring degraded hills in western India. African Journal of Environmental Science
and Technology, 6, 300-311.
SMET, J. AND MORIARTY, P. 2001. Rooftop rainwater harvesting. African Journal of
Environmental Science and Technology, 8, 20-31.
SMITHERS, J. C. AND SCHULZE, R. 2003. Design rainfall and flood estimation in South
Africa, Water Research Commission, Pretoria.
SOIL CLASSIFICATION WORKING GROUP AND MACVICAR, C.N., 1991. Soil
classification: a taxonomic system for South Africa. Department of Agricultural
Development. Pretoria.
SULEMAN, S., WOOD, M. K., SHAH, B. H. AND MURRAY, L. 1995. Development of a
rainwater harvesting system for increasing soil moisture in arid rangelands of
Pakistan. Journal of Arid Environments, 31, 471-481.
TADROSS, M., JACK, C. & HEWITSON, B. 2005. On RCM‐based projections of change
in southern African summer climate. Geophysical Research Letters, 32.
TARDIEU, F., KATERJI, N., BETHENOD, O., ZHANG, J. AND DAVIES, W. 1991. Maize
stomatal conductance in the field: its relationship with soil and plant water potentials,
mechanical constraints and ABA concentration in the xylem sap. Plant, Cell &
Environment, 14, 121-126.

74
THOMAS, D. S., TWYMAN, C., OSBAHR, H. & HEWITSON, B. 2007. Adaptation to
climate change and variability: farmer responses to intra-seasonal precipitation trends
in South Africa. Climatic change, 83, 301-322.
THOMAS, D. S., TWYMAN, C., OSBAHR, H. AND HEWITSON, B. 2011. Adaptation to
climate change and variability: Farmer responses to intra-seasonal precipitation trends
in South Africa. African Climate and Climate Change. Springer.
THOMAS, G. W. 1982. Exchangeable cations. Methods of soil analysis. Part 2. Chemical
and microbiological properties, p.159-165.
VAN BREEMEN, N., BURROUGH, P., VELTHORST, E. V., VAN DOBBEN, H., DE
WIT, T., RIDDER, T. D. AND REIJNDERS, H. 1982. Soil acidification from
atmospheric ammonium sulphate in forest canopy through fall. Nature, 299, 548-
550.
WANG, X. AND GONG, Z., 1998. Assessment and analysis of soil quality changes after
eleven years of reclamation in subtropical China. Geoderma, 81(3), 339-355.
WANG, Y., XIE, Z., MALHI, S. S., VERA, C. L., ZHANG, Y. AND WANG, J. 2009. Effects
of rainfall harvesting and mulching technologies on water use efficiency and crop
yield in the semi-arid Loess Plateau, China. Agricultural Water Management, 96, 374-
382.
XIAOLONG, R., ZHIKUAN, J., XIAOLI, C., QINGFANG, H. AND RONG, L. 2008. Effects
of a rainwater-harvesting furrow/ridge system on spring corn productivity under
simulated rainfalls. Acta Ecologica Sinica, 28, 1006-1015.
XIAOLONG, R., ZHIKUAN, J., XIAOLI, C., QINGFANG, H. AND RONG, L., 2008.
Effects of a rainwater- harvesting furrow/ridge system on spring corn
productivity under simulated rainfalls. Acta Ecologica Sinica, 28(3), 1006- 1015.
XU, J., WU, L., CHANG, A.C. AND ZHANG, Y., 2010. Impact of long-term reclaimed
wastewater irrigation on agricultural soils: a preliminary assessment. Journal of
Hazardous Materials, 183(1), 780-786.
ZINGG, A. AND HAUSER, V. 1959. Terrace benching to save potential runoff for semiarid
land. Agronomy Journal, 51, 289-292.
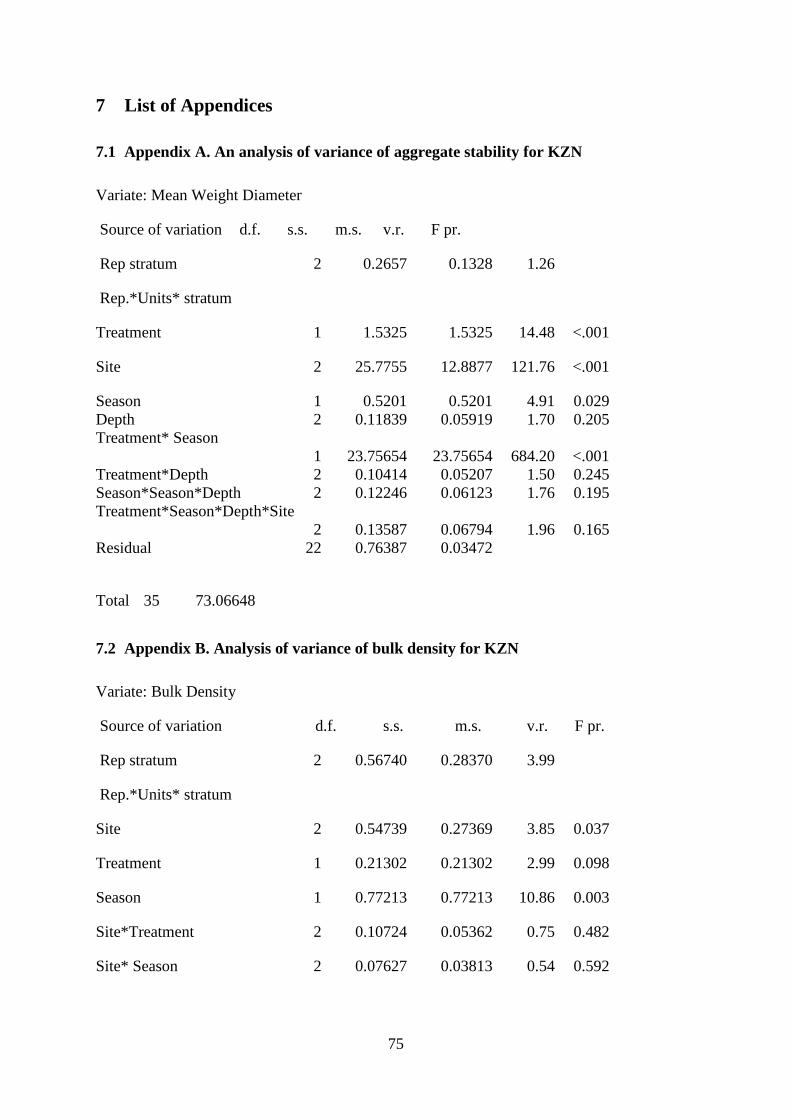
75
7 List of Appendices
7.1 Appendix A. An analysis of variance of aggregate stability for KZN
Variate: Mean Weight Diameter
Source of variation d.f. s.s. m.s. v.r. F pr.
Rep stratum 2 0.2657 0.1328 1.26
Rep.*Units* stratum
Treatment 1 1.5325 1.5325 14.48 <.001
Site 2 25.7755 12.8877 121.76 <.001
Season 1 0.5201 0.5201 4.91 0.029
Depth 2 0.11839 0.05919 1.70 0.205
Treatment* Season
1 23.75654 23.75654 684.20 <.001
Treatment*Depth 2 0.10414 0.05207 1.50 0.245
Season*Season*Depth 2 0.12246 0.06123 1.76 0.195
Treatment*Season*Depth*Site
2 0.13587 0.06794 1.96 0.165
Residual 22 0.76387 0.03472
Total 35 73.06648
7.2 Appendix B. Analysis of variance of bulk density for KZN
Variate: Bulk Density
Source of variation d.f. s.s. m.s. v.r. F pr.
Rep stratum 2 0.56740 0.28370 3.99
Rep.*Units* stratum
Site 2 0.54739 0.27369 3.85 0.037
Treatment 1 0.21302 0.21302 2.99 0.098
Season 1 0.77213 0.77213 10.86 0.003
Site*Treatment 2 0.10724 0.05362 0.75 0.482
Site* Season 2 0.07627 0.03813 0.54 0.592
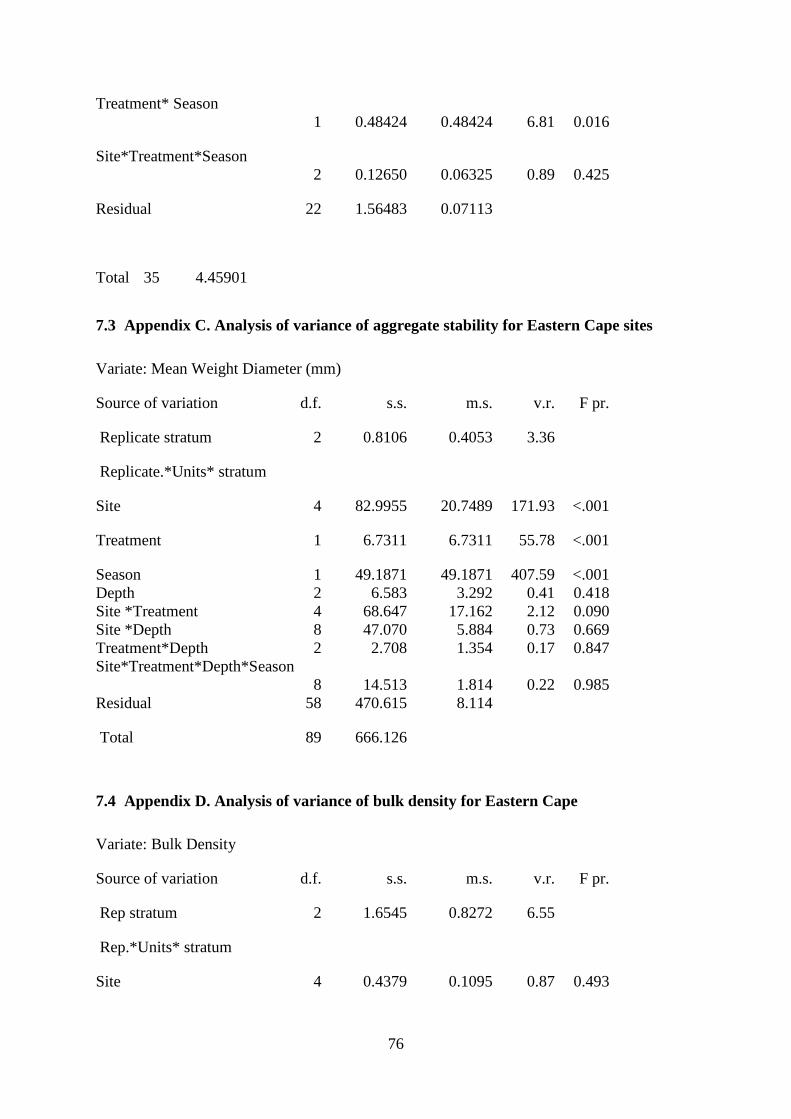
76
Treatment* Season
1 0.48424 0.48424 6.81 0.016
Site*Treatment*Season
2 0.12650 0.06325 0.89 0.425
Residual 22 1.56483 0.07113
Total 35 4.45901
7.3 Appendix C. Analysis of variance of aggregate stability for Eastern Cape sites
Variate: Mean Weight Diameter (mm)
Source of variation d.f. s.s. m.s. v.r. F pr.
Replicate stratum 2 0.8106 0.4053 3.36
Replicate.*Units* stratum
Site 4 82.9955 20.7489 171.93 <.001
Treatment 1 6.7311 6.7311 55.78 <.001
Season 1 49.1871 49.1871 407.59 <.001
Depth 2 6.583 3.292 0.41 0.418
Site *Treatment 4 68.647 17.162 2.12 0.090
Site *Depth 8 47.070 5.884 0.73 0.669
Treatment*Depth 2 2.708 1.354 0.17 0.847
Site*Treatment*Depth*Season
8 14.513 1.814 0.22 0.985
Residual 58 470.615 8.114
Total 89 666.126
7.4 Appendix D. Analysis of variance of bulk density for Eastern Cape
Variate: Bulk Density
Source of variation d.f. s.s. m.s. v.r. F pr.
Rep stratum 2 1.6545 0.8272 6.55
Rep.*Units* stratum
Site 4 0.4379 0.1095 0.87 0.493
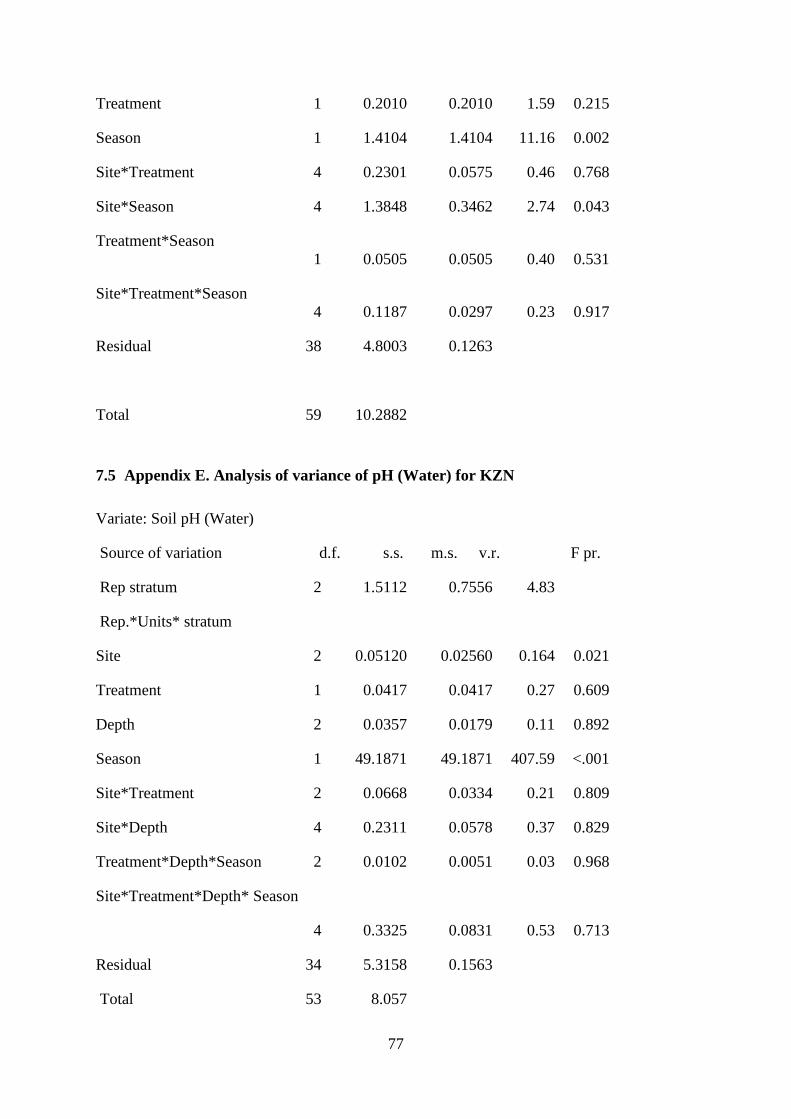
77
Treatment 1 0.2010 0.2010 1.59 0.215
Season 1 1.4104 1.4104 11.16 0.002
Site*Treatment 4 0.2301 0.0575 0.46 0.768
Site*Season 4 1.3848 0.3462 2.74 0.043
Treatment*Season
1 0.0505 0.0505 0.40 0.531
Site*Treatment*Season
4 0.1187 0.0297 0.23 0.917
Residual 38 4.8003 0.1263
Total 59 10.2882
7.5 Appendix E. Analysis of variance of pH (Water) for KZN
Variate: Soil pH (Water)
Source of variation d.f. s.s. m.s. v.r. F pr.
Rep stratum 2 1.5112 0.7556 4.83
Rep.*Units* stratum
Site 2 0.05120 0.02560 0.164 0.021
Treatment 1 0.0417 0.0417 0.27 0.609
Depth 2 0.0357 0.0179 0.11 0.892
Season 1 49.1871 49.1871 407.59 <.001
Site*Treatment 2 0.0668 0.0334 0.21 0.809
Site*Depth 4 0.2311 0.0578 0.37 0.829
Treatment*Depth*Season 2 0.0102 0.0051 0.03 0.968
Site*Treatment*Depth* Season
4 0.3325 0.0831 0.53 0.713
Residual 34 5.3158 0.1563
Total 53 8.057

78
7.6 Appendix F. Analysis of variance of micronutrients for KZN
(i) Variate: Cu
Source of variation d.f. s.s. m.s. v.r. F pr.
Rep stratum 2 319.04 159.52 5.06
Rep.*Units* stratum
Site 2 9559.76 4779.88 151.54 <.001
Treatment 1 12.92 12.92 0.41 0.524
Season 1 0.02 0.02 0.00 0.980
Depth 2 75.14 37.57 1.19 0.310
Site*Treatment 2 39.41 19.70 0.62 0.538
Site*Season 2 22.80 11.40 0.36 0.698
Treatment*Growing season
1 9.58 9.58 0.30 0.583
Site*Depth 4 80.99 20.25 0.64 0.634
Treatment*Depth 2 23.92 11.96 0.38 0.686
Season*Depth 2 5.29 2.64 0.08 0.920
Site*Treatment*Season
2 44.12 22.06 0.70 0.500
Site*Treatment*Depth 4 34.69 8.67 0.27 0.893
Site*Season*Depth
4 22.62 5.65 0.18 0.948
Treatment*Season*Depth
2 20.32 10.16 0.32 0.726
Site*Treatment*Season*Depth
4 19.54 4.89 0.15 0.960
Residual 70 2207.90 31.54
Total 107 12498.06
(ii) Variate: Fe
Source of variation d.f. s.s. m.s. v.r. F pr.
Rep stratum 2 158.99 79.49 3.18
Rep.*Units* stratum
Site 2 151.95 75.98 3.04 0.054
Treatment 1 62.53 62.53 2.50 0.118
Season 1 15253.45 15253.45 610.54 <.001
Depth 2 42.22 21.11 0.84 0.434
Site*Treatment 2 145.32 72.66 2.91 0.061
Site*Season 2 92.73 46.37 1.86 0.164
Treatment*Season
1 389.20 389.20 15.58 <.001

79
Site*Depth 4 25.36 6.34 0.25 0.906
Treatment*Depth 2 3.68 1.84 0.07 0.929
Growing season*Depth 2 8.31 4.16 0.17 0.847
Site*Treatment*Season
2 30.77 15.38 0.62 0.543
Site*Treatment*Depth 4 41.41 10.35 0.41 0.798
Site*Season*Depth
4 21.34 5.33 0.21 0.930
Treatment*Growing season*Depth
2 3.21 1.61 0.06 0.938
Site*Treatment*season*Depth
4 10.62 2.66 0.11 0.980
Residual 70 1748.86 24.98
Total 107 18189.95
(iii) Variate: Mn
Source of variation d.f. s.s. m.s. v.r. F pr.
Rep stratum 2 577.61 288.80 6.14
Rep.*Units* stratum
Site 2 4820.96 2410.48 51.26 <.001
Treatment 1 97.34 97.34 2.07 0.155
Season 1 35.54 35.54 0.76 0.388
Depth 2 10.25 5.13 0.11 0.897
Site*Treatment 2 300.32 150.16 3.19 0.047
Site*Season 2 153.42 76.71 1.63 0.203
Treatment*Season
1 1132.12 1132.12 24.08 <.001
Site*Depth 4 69.14 17.28 0.37 0.831
Treatment*Depth 2 32.71 16.35 0.35 0.707
Season*Depth 2 194.30 97.15 2.07 0.134
Site*Treatment*Season
2 146.77 73.39 1.56 0.217
Site*Treatment*Depth 4 136.80 34.20 0.73 0.576
Site*Season*Depth
4 107.43 26.86 0.57 0.684
Treatment*Season*Depth
2 61.41 30.71 0.65 0.524
Site*Treatment*Season*Depth
4 36.52 9.13 0.19 0.941
Residual 70 3291.65 47.02
Total 107 11204.28
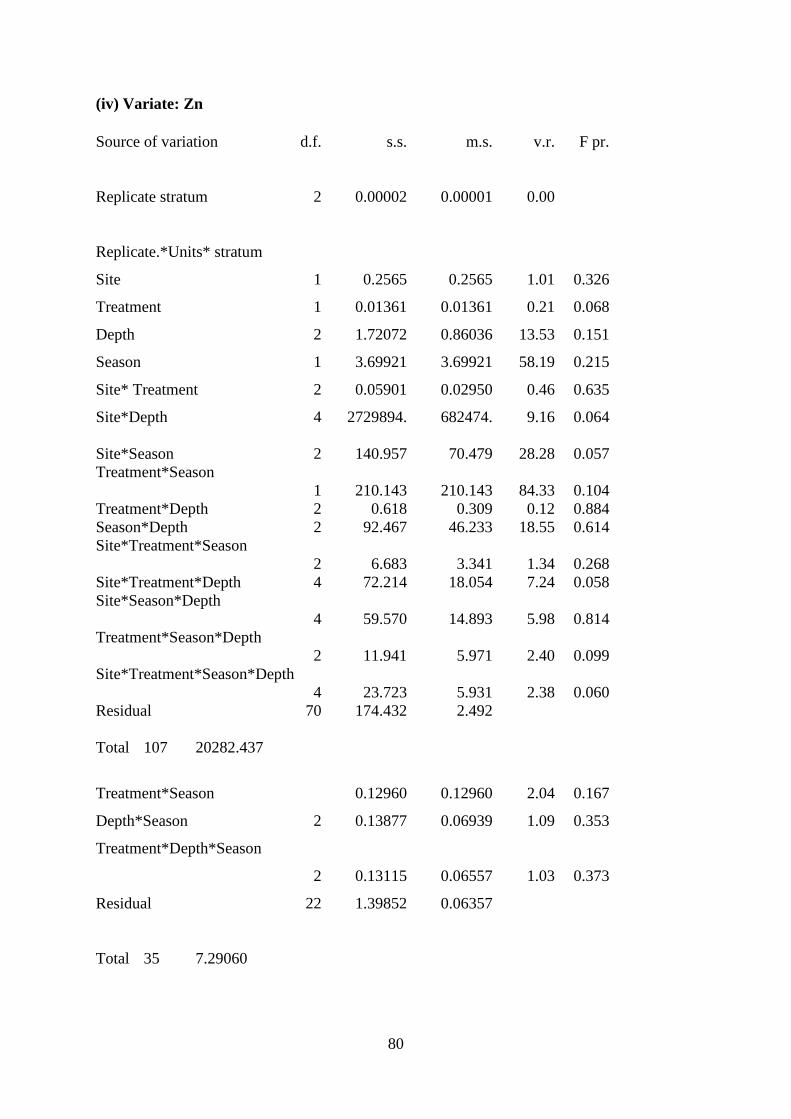
80
(iv) Variate: Zn
Source of variation d.f. s.s. m.s. v.r. F pr.
Replicate stratum 2 0.00002 0.00001 0.00
Replicate.*Units* stratum
Site 1 0.2565 0.2565 1.01 0.326
Treatment 1 0.01361 0.01361 0.21 0.068
Depth 2 1.72072 0.86036 13.53 0.151
Season 1 3.69921 3.69921 58.19 0.215
Site* Treatment 2 0.05901 0.02950 0.46 0.635
Site*Depth 4 2729894. 682474. 9.16 0.064
Site*Season 2 140.957 70.479 28.28 0.057
Treatment*Season
1 210.143 210.143 84.33 0.104
Treatment*Depth 2 0.618 0.309 0.12 0.884
Season*Depth 2 92.467 46.233 18.55 0.614
Site*Treatment*Season
2 6.683 3.341 1.34 0.268
Site*Treatment*Depth 4 72.214 18.054 7.24 0.058
Site*Season*Depth
4 59.570 14.893 5.98 0.814
Treatment*Season*Depth
2 11.941 5.971 2.40 0.099
Site*Treatment*Season*Depth
4 23.723 5.931 2.38 0.060
Residual 70 174.432 2.492
Total 107 20282.437
Treatment*Season 0.12960 0.12960 2.04 0.167
Depth*Season 2 0.13877 0.06939 1.09 0.353
Treatment*Depth*Season
2 0.13115 0.06557 1.03 0.373
Residual 22 1.39852 0.06357
Total 35 7.29060

81
7.7 Appendix G. Analysis of variance of exchangeable bases for KZN
(i) Variate: Ca
Source of variation d.f. s.s. m.s. v.r. F pr.
Rep stratum 2 102398. 51199. 0.69
Rep.*Units* stratum
Site 2 61692236. 30846118. 413.93 <.001
Treatment 1 81697. 81697. 1.10 0.299
Season 1 769559. 769559. 10.33 0.002
Depth 2 3301442. 1650721. 22.15 <.001
Site*Treatment 2 784342. 392171. 5.26 0.007
Site*Season 2 144367. 72184. 0.97 0.385
Treatment*Season
1 24661819. 24661819. 330.94 <.001
Site*Depth 4 2729894. 682474. 9.16 <.001
Treatment*Depth 2 158631. 79315. 1.06 0.350
Growing season*Depth 2 292563. 146282. 1.96 0.148
Site*Treatment*Season
2 6000784. 3000392. 40.26 <.001
Site*Treatment*Depth 4 956182. 239045. 3.21 0.018
Site*Season*Depth
4 782443. 195611. 2.62 0.042
Treatment*Season*Depth
2 1827107. 913553. 12.26 <.001
Site*Treatment*Season*Depth
4 3309118. 827279. 11.10 <.001
Residual 70 5216390. 74520.
Total 107 112810972.
(ii) Variate: Mg
Source of variation d.f. s.s. m.s. v.r. F pr.
Rep stratum 2 5016.3 2508.2 2.60
Rep.*Units* stratum
Site 2 415825.3 207912.7 215.32 <.001
Treatment 1 135.0 135.0 0.14 0.710
Season 1 157250.5 157250.5 162.86 <.001
Depth 2 119262.5 59631.2 61.76 <.001
Site*Treatment 2 88453.0 44226.5 45.80 <.001

82
Site*Season 2 84502.9 42251.4 43.76 <.001
Treatment*Season
1 479433.5 479433.5 496.52 <.001
Site*Depth 4 13665.0 3416.2 3.54 0.011
Treatment*Depth 2 1451.0 725.5 0.75 0.475
Season*Depth 2 1452.2 726.1 0.75 0.475
Site*Treatment*Season
2 223663.3 111831.7 115.82 <.001
Site*Treatment*Depth 4 1412.5 353.1 0.37 0.832
Site*Season*Depth
4 4594.3 1148.6 1.19 0.323
Treatment*Season*Depth
2 13046.4 6523.2 6.76 0.002
Site*Treatment*Season*Depth
4 7066.2 1766.5 1.83 0.133
Residual 70 67590.7 965.6
Total 107 1683820.
(iii) Variate: Na
Source of variation d.f. s.s. m.s. v.r. F pr.
Rep stratum 2 691.8 345.9 2.46
Rep.*Units* stratum
Site 2 868.6 434.3 3.08 0.032
Treatment 1 112.7 112.7 0.80 0.374
Season 1 264.0 264.0 1.87 0.016
Depth 2 89.6 44.8 0.32 0.729
Site*Treatment 2 15.2 7.6 0.05 0.947
Site*Season 2 191.4 95.7 0.68 0.510
Treatment*Season
1 486.1 486.1 3.45 0.067
Site*Depth 4 538.3 134.6 0.96 0.437
Treatment*Depth 2 0.7 0.4 0.00 0.997
Season*Depth 2 26.8 13.4 0.10 0.909
Site*Treatment*Season 2 4632.0 2316.0 16.45 0.581
Site*Treatment*Depth 4 11.6 2.9 0.02 0.999
Site*Season*Depth
4 8.0 2.0 0.01 1.000
Treatment*Season*Depth
2 338.3 169.2 1.20 0.307
Site*Treatment*Season*Depth
4 635.1 158.8 1.13 0.351
Residual 70 9857.6 140.8
Total 107 18767.8

83
(iv) Variate: K
Source of variation d.f. s.s. m.s. v.r. F pr.
Replicate stratum 2 441018. 220509. 6.08
Replicate.*Units* stratum
Site 4 639724. 159931. 4.41 0.002
Treatment 1 739956. 739956. 20.41 0.541
Season 1 212. 212. 0.01 0.939
Depth 2 5357978. 2678989. 73.89 0.031
Site*Treatment 4 661988. 165497. 4.56 0.002
Site*Season
4 4868. 1217. 0.03 0.998
Treatment*Season 1 6151. 6151. 0.17 0.681
Site*Depth 8 460717. 57590. 1.59 0.135
Treatment*Depth 2 181804. 90902. 2.51 0.086
Growing Season*Depth 2 1324. 662. 0.02 0.982
Site*Treatment*Season 4 6076. 1519. 0.04 0.997
Site*Treatment*Depth 8 622810. 77851. 2.15 0.037
Site*Growing Season*Depth 8 7315. 914. 0.03 1.000
Treatment*Season*Depth2 2782. 1391. 0.04 0.962
Site*Treatment*Season*Depth
8 5989. 749. 0.02 1.000
Residual 118 4278004. 36254.
Total 179 13418715.
7.8 Appendix H. Analysis of variance of pH (water) for Eastern Cape
Variate: pH Water
Source of variation d.f. s.s. m.s. v.r. F pr.
Replicate stratum 2 0.15176 0.07588 1.31
Replicate. *Units* stratum
Site 4 33.13045 8.28261 142.64 <.001
Treatment 1 0.12027 0.12027 2.07 0.155
Depth 2 0.03211 0.01605 0.28 0.759
Season 1 0.5201 0.5201 4.91 0.029

84
Site *Treatment 4 0.53350 0.13338 2.30 0.070
Site *Depth 8 0.10222 0.01278 0.22 0.986
Treatment*Depth 2 0.03140 0.01570 0.27 0.764
Site *Treatment*Depth
8 0.17402 0.02175 0.37 0.930
Residual 58 3.36777 0.05807
Total 89 37.64349
7.9 Appendix I. Analysis of variance of micro nutrients for Eastern Cape
(i) Variate: Cu
Source of variation d.f. s.s. m.s. v.r. F pr.
Replicate stratum 2 159.37 79.69 0.98
Replicate.*Units* stratum
Site 4 1223.64 305.91 3.77 0.006
Treatment 1 12.51 12.51 0.15 0.695
Depth 2 2535.62 1267.81 15.64 <.001
Season 1 2017.50 2017.50 24.89 <.001
Site * Treatment 4 23.29 5.82 0.07 0.990
Site * Depth 8 1001.35 125.17 1.54 0.149
Treatment * Depth 2 35.95 17.98 0.22 0.801
Site *Season
4 324.32 81.08 1.00 0.410
Treatment * Season
1 13.39 13.39 0.17 0.685
Depth *Season 2 897.47 448.73 5.54 0.005
Site * Treatment *Depth
8 117.11 14.64 0.18 0.993
Site * Treatment * Season
4 21.41 5.35 0.07 0.992
Site * Depth*Season
8 862.24 107.78 1.33 0.235
Treatment * Depth *Season
2 29.81 14.90 0.18 0.832
Site * Treatment*Depth*Season
8 150.29 18.79 0.23 0.984
Residual 118 9564.54 81.06
Total 179 18989.82

85
(ii) Variate: Fe
Source of variation d.f. s.s. m.s. v.r. F pr.
Replicate stratum 2 0.8108 0.4054 3.49
Replicate.*Units* stratum
Site 4 9.7896 2.4474 21.05 <.001
Treatment 1 0.0140 0.0140 0.12 0.729
Depth 8 0.4980 0.0622 0.54 0.828
Season 1 0.0005 0.0005 0.00 0.946
Site*Treatment 4 1.9840 0.4960 4.27 0.003
Site*Depth 8 1.1501 0.1438 1.24 0.284
Treatment*Depth 2 0.0634 0.0317 0.27 0.762
Site* Season 1 0.0005 0.0005 0.00 0.946
Depth* Season 2 0.0648 0.0324 0.28 0.757
Site*Treatment*Depth 8 2.4921 0.3115 2.68 0.010
Site*Treatment* Season 4 0.2801 0.0700 0.60 0.662
Site*Depth* Season 8 0.8366 0.1046 0.90 0.520
Treatment*Depth* Season2 0.1565 0.0783 0.67 0.512
Residual 118 13.7214 0.1163
Total 179 53.9792
(iii) Variate: Mn
Source of variation d.f. s.s. m.s. v.r. F pr.
Replicate stratum 2 14.979 7.490 2.59
Replicate.*Units* stratum
Site 4 357.559 89.390 30.86 <.001
Treatment 1 8.266 8.266 2.85 0.094
Depth 2 189.897 94.949 32.78 <.001
Growing Season 1 367.985 367.985 127.05 <.001
Site *Treatment 4 28.784 7.196 2.48 0.047
Site *Depth 8 70.838 8.855 3.06 0.004
Treatment *Depth 2 20.826 10.413 3.60 0.031
Site * Season
4 92.772 23.193 8.01 <.001
Treatment * Season
1 0.292 0.292 0.10 0.751
Depth * Season 2 17.680 8.840 3.05 0.051
Site *Treatment *Depth
8 33.414 4.177 1.44 0.186
Site *Treatment * Season
4 25.969 6.492 2.24 0.069
Site *Depth * Season
8 42.097 5.262 1.82 0.080
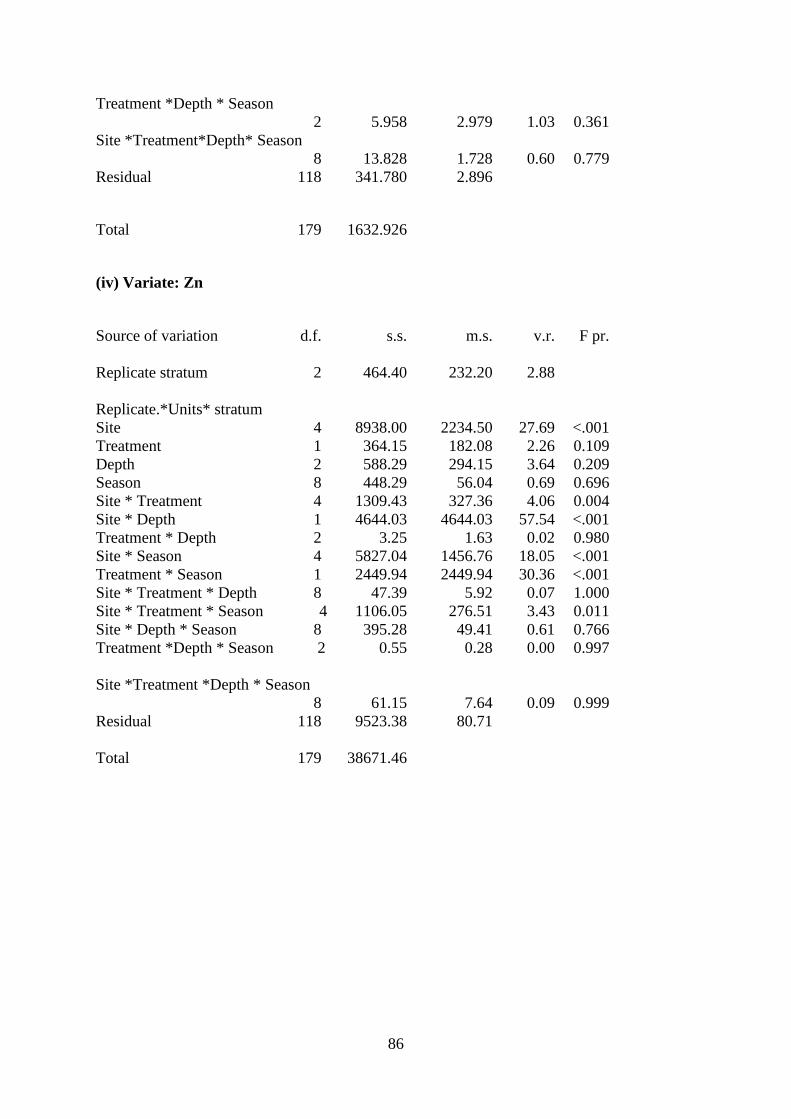
86
Treatment *Depth * Season
2 5.958 2.979 1.03 0.361
Site *Treatment*Depth* Season
8 13.828 1.728 0.60 0.779
Residual 118 341.780 2.896
Total 179 1632.926
(iv) Variate: Zn
Source of variation d.f. s.s. m.s. v.r. F pr.
Replicate stratum 2 464.40 232.20 2.88
Replicate.*Units* stratum
Site 4 8938.00 2234.50 27.69 <.001
Treatment 1 364.15 182.08 2.26 0.109
Depth 2 588.29 294.15 3.64 0.209
Season 8 448.29 56.04 0.69 0.696
Site * Treatment 4 1309.43 327.36 4.06 0.004
Site * Depth 1 4644.03 4644.03 57.54 <.001
Treatment * Depth 2 3.25 1.63 0.02 0.980
Site * Season 4 5827.04 1456.76 18.05 <.001
Treatment * Season 1 2449.94 2449.94 30.36 <.001
Site * Treatment * Depth 8 47.39 5.92 0.07 1.000
Site * Treatment * Season 4 1106.05 276.51 3.43 0.011
Site * Depth * Season 8 395.28 49.41 0.61 0.766
Treatment *Depth * Season 2 0.55 0.28 0.00 0.997
Site *Treatment *Depth * Season
8 61.15 7.64 0.09 0.999
Residual 118 9523.38 80.71
Total 179 38671.46
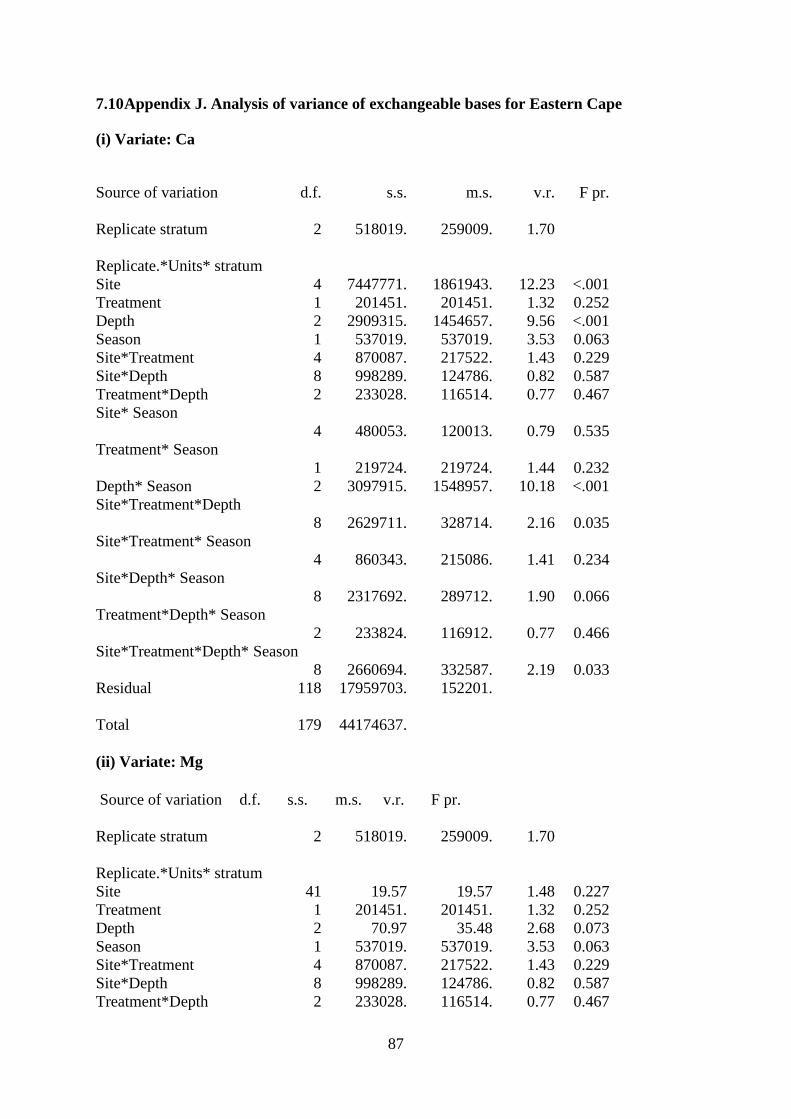
87
7.10 Appendix J. Analysis of variance of exchangeable bases for Eastern Cape
(i) Variate: Ca
Source of variation d.f. s.s. m.s. v.r. F pr.
Replicate stratum 2 518019. 259009. 1.70
Replicate.*Units* stratum
Site 4 7447771. 1861943. 12.23 <.001
Treatment 1 201451. 201451. 1.32 0.252
Depth 2 2909315. 1454657. 9.56 <.001
Season 1 537019. 537019. 3.53 0.063
Site*Treatment 4 870087. 217522. 1.43 0.229
Site*Depth 8 998289. 124786. 0.82 0.587
Treatment*Depth 2 233028. 116514. 0.77 0.467
Site* Season
4 480053. 120013. 0.79 0.535
Treatment* Season
1 219724. 219724. 1.44 0.232
Depth* Season 2 3097915. 1548957. 10.18 <.001
Site*Treatment*Depth
8 2629711. 328714. 2.16 0.035
Site*Treatment* Season
4 860343. 215086. 1.41 0.234
Site*Depth* Season
8 2317692. 289712. 1.90 0.066
Treatment*Depth* Season
2 233824. 116912. 0.77 0.466
Site*Treatment*Depth* Season
8 2660694. 332587. 2.19 0.033
Residual 118 17959703. 152201.
Total 179 44174637.
(ii) Variate: Mg
Source of variation d.f. s.s. m.s. v.r. F pr.
Replicate stratum 2 518019. 259009. 1.70
Replicate.*Units* stratum
Site 41 19.57 19.57 1.48 0.227
Treatment 1 201451. 201451. 1.32 0.252
Depth 2 70.97 35.48 2.68 0.073
Season 1 537019. 537019. 3.53 0.063
Site*Treatment 4 870087. 217522. 1.43 0.229
Site*Depth 8 998289. 124786. 0.82 0.587
Treatment*Depth 2 233028. 116514. 0.77 0.467
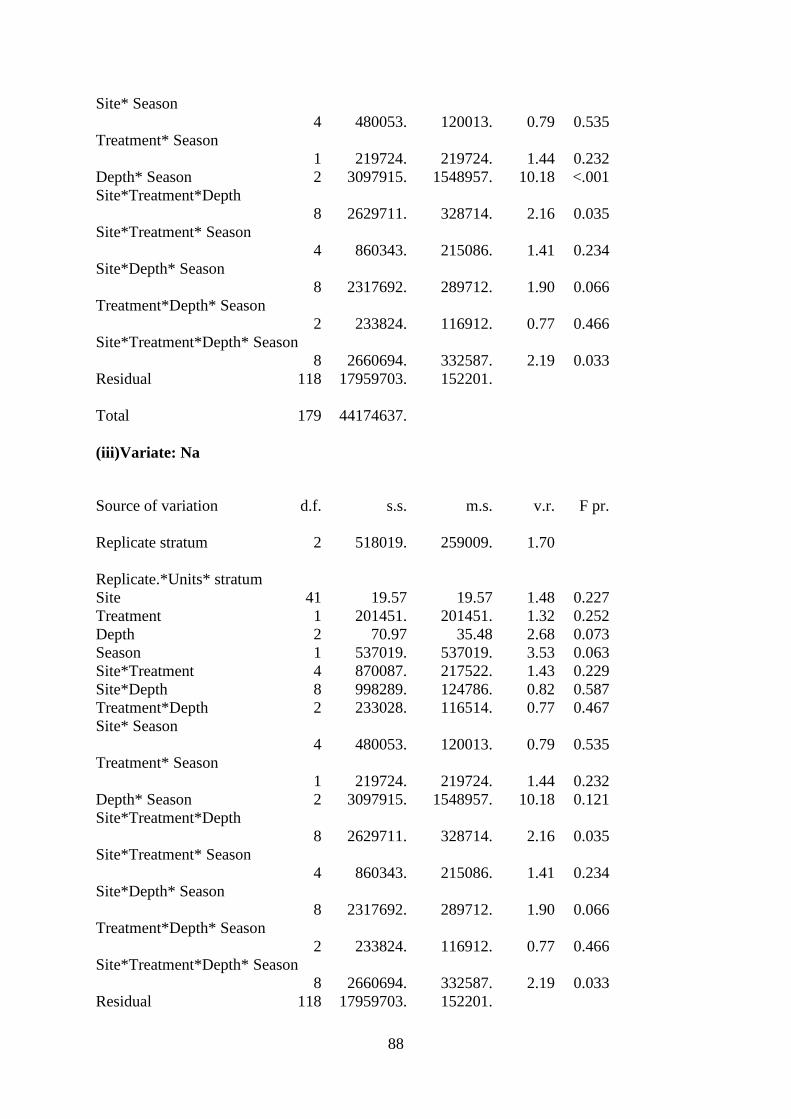
88
Site* Season
4 480053. 120013. 0.79 0.535
Treatment* Season
1 219724. 219724. 1.44 0.232
Depth* Season 2 3097915. 1548957. 10.18 <.001
Site*Treatment*Depth
8 2629711. 328714. 2.16 0.035
Site*Treatment* Season
4 860343. 215086. 1.41 0.234
Site*Depth* Season
8 2317692. 289712. 1.90 0.066
Treatment*Depth* Season
2 233824. 116912. 0.77 0.466
Site*Treatment*Depth* Season
8 2660694. 332587. 2.19 0.033
Residual 118 17959703. 152201.
Total 179 44174637.
(iii)Variate: Na
Source of variation d.f. s.s. m.s. v.r. F pr.
Replicate stratum 2 518019. 259009. 1.70
Replicate.*Units* stratum
Site 41 19.57 19.57 1.48 0.227
Treatment 1 201451. 201451. 1.32 0.252
Depth 2 70.97 35.48 2.68 0.073
Season 1 537019. 537019. 3.53 0.063
Site*Treatment 4 870087. 217522. 1.43 0.229
Site*Depth 8 998289. 124786. 0.82 0.587
Treatment*Depth 2 233028. 116514. 0.77 0.467
Site* Season
4 480053. 120013. 0.79 0.535
Treatment* Season
1 219724. 219724. 1.44 0.232
Depth* Season 2 3097915. 1548957. 10.18 0.121
Site*Treatment*Depth
8 2629711. 328714. 2.16 0.035
Site*Treatment* Season
4 860343. 215086. 1.41 0.234
Site*Depth* Season
8 2317692. 289712. 1.90 0.066
Treatment*Depth* Season
2 233824. 116912. 0.77 0.466
Site*Treatment*Depth* Season
8 2660694. 332587. 2.19 0.033
Residual 118 17959703. 152201.
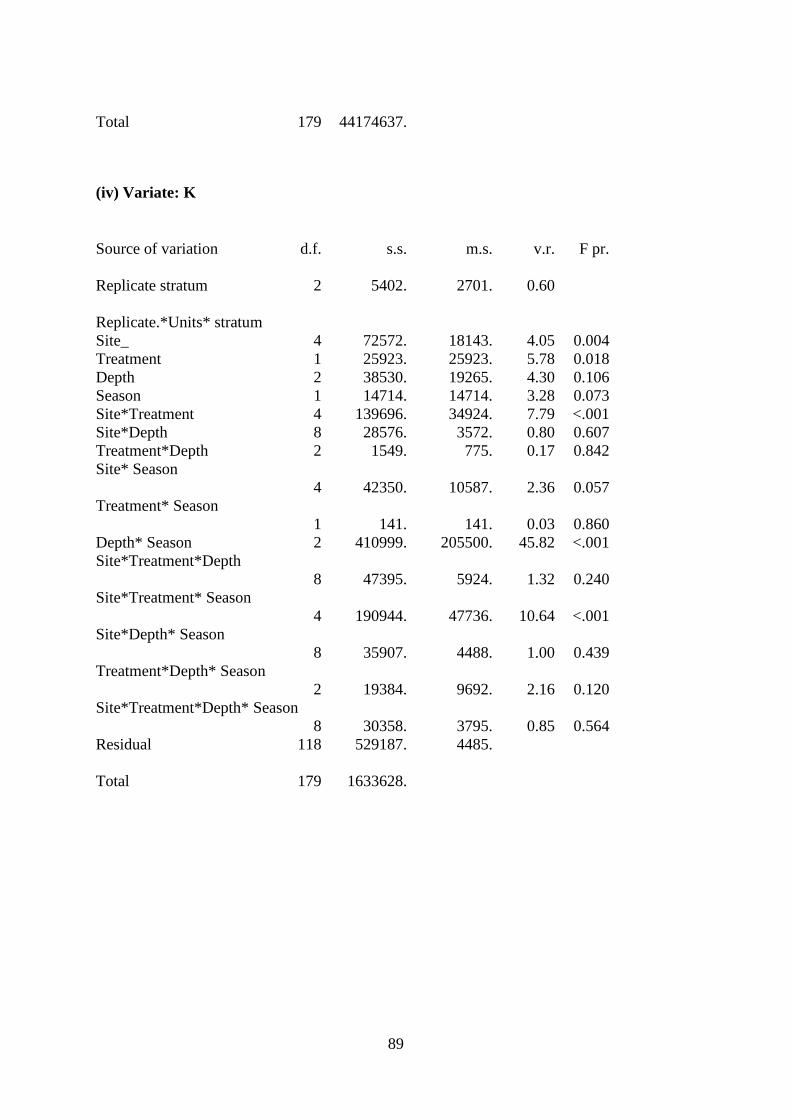
89
Total 179 44174637.
(iv) Variate: K
Source of variation d.f. s.s. m.s. v.r. F pr.
Replicate stratum 2 5402. 2701. 0.60
Replicate.*Units* stratum
Site_ 4 72572. 18143. 4.05 0.004
Treatment 1 25923. 25923. 5.78 0.018
Depth 2 38530. 19265. 4.30 0.106
Season 1 14714. 14714. 3.28 0.073
Site*Treatment 4 139696. 34924. 7.79 <.001
Site*Depth 8 28576. 3572. 0.80 0.607
Treatment*Depth 2 1549. 775. 0.17 0.842
Site* Season
4 42350. 10587. 2.36 0.057
Treatment* Season
1 141. 141. 0.03 0.860
Depth* Season 2 410999. 205500. 45.82 <.001
Site*Treatment*Depth
8 47395. 5924. 1.32 0.240
Site*Treatment* Season
4 190944. 47736. 10.64 <.001
Site*Depth* Season
8 35907. 4488. 1.00 0.439
Treatment*Depth* Season
2 19384. 9692. 2.16 0.120
Site*Treatment*Depth* Season
8 30358. 3795. 0.85 0.564
Residual 118 529187. 4485.
Total 179 1633628.
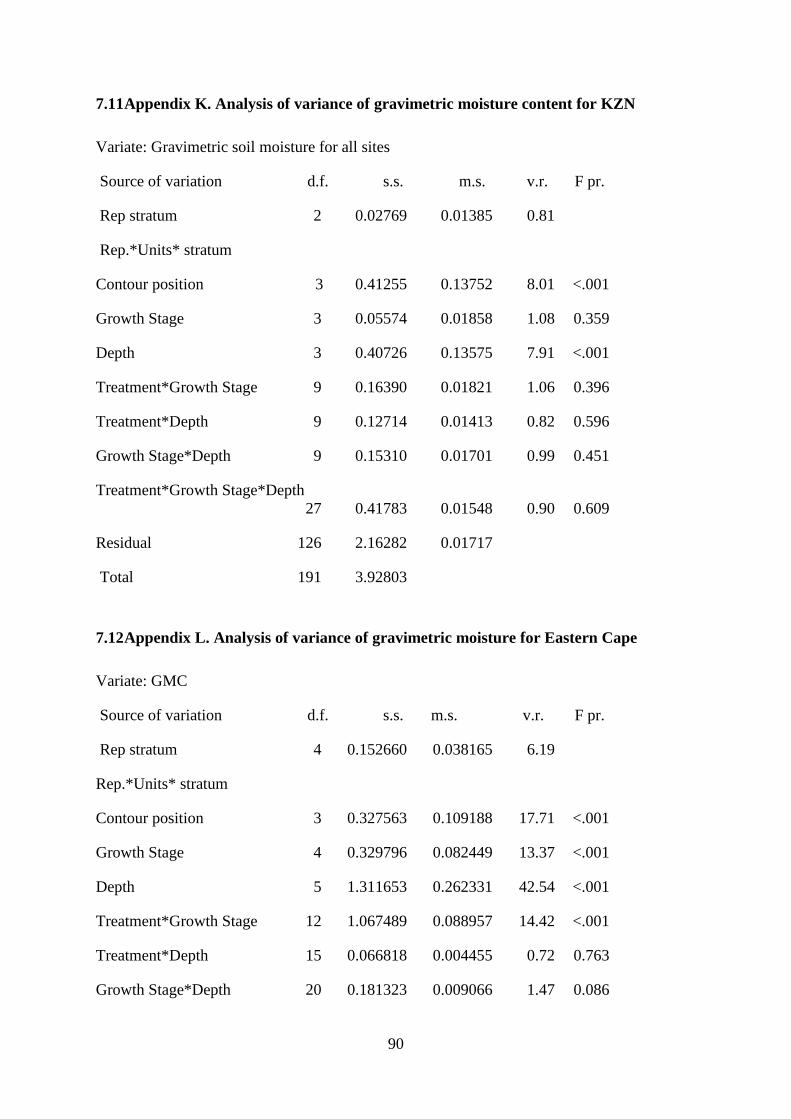
90
7.11 Appendix K. Analysis of variance of gravimetric moisture content for KZN
Variate: Gravimetric soil moisture for all sites
Source of variation d.f. s.s. m.s. v.r. F pr.
Rep stratum 2 0.02769 0.01385 0.81
Rep.*Units* stratum
Contour position 3 0.41255 0.13752 8.01 <.001
Growth Stage 3 0.05574 0.01858 1.08 0.359
Depth 3 0.40726 0.13575 7.91 <.001
Treatment*Growth Stage 9 0.16390 0.01821 1.06 0.396
Treatment*Depth 9 0.12714 0.01413 0.82 0.596
Growth Stage*Depth 9 0.15310 0.01701 0.99 0.451
Treatment*Growth Stage*Depth
27 0.41783 0.01548 0.90 0.609
Residual 126 2.16282 0.01717
Total 191 3.92803
7.12 Appendix L. Analysis of variance of gravimetric moisture for Eastern Cape
Variate: GMC
Source of variation d.f. s.s. m.s. v.r. F pr.
Rep stratum 4 0.152660 0.038165 6.19
Rep.*Units* stratum
Contour position 3 0.327563 0.109188 17.71 <.001
Growth Stage 4 0.329796 0.082449 13.37 <.001
Depth 5 1.311653 0.262331 42.54 <.001
Treatment*Growth Stage 12 1.067489 0.088957 14.42 <.001
Treatment*Depth 15 0.066818 0.004455 0.72 0.763
Growth Stage*Depth 20 0.181323 0.009066 1.47 0.086
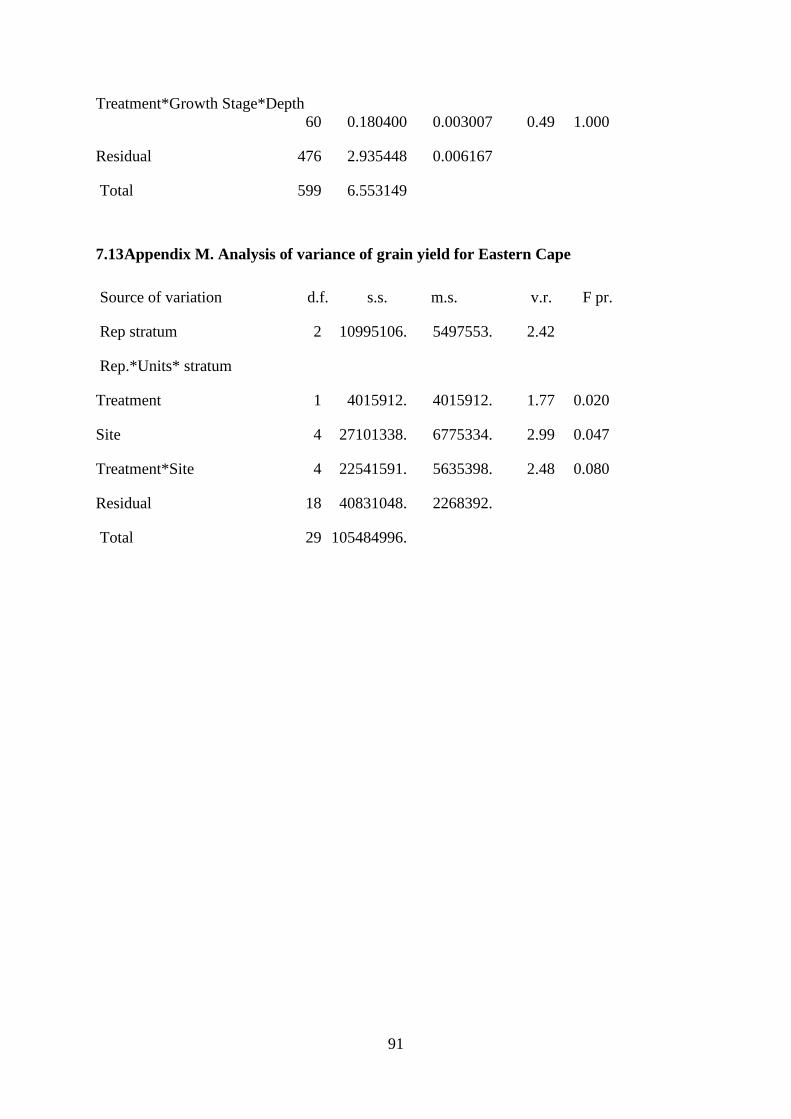
91
Treatment*Growth Stage*Depth
60 0.180400 0.003007 0.49 1.000
Residual 476 2.935448 0.006167
Total 599 6.553149
7.13 Appendix M. Analysis of variance of grain yield for Eastern Cape
Source of variation d.f. s.s. m.s. v.r. F pr.
Rep stratum 2 10995106. 5497553. 2.42
Rep.*Units* stratum
Treatment 1 4015912. 4015912. 1.77 0.020
Site 4 27101338. 6775334. 2.99 0.047
Treatment*Site 4 22541591. 5635398. 2.48 0.080
Residual 18 40831048. 2268392.
Total 29 105484996.
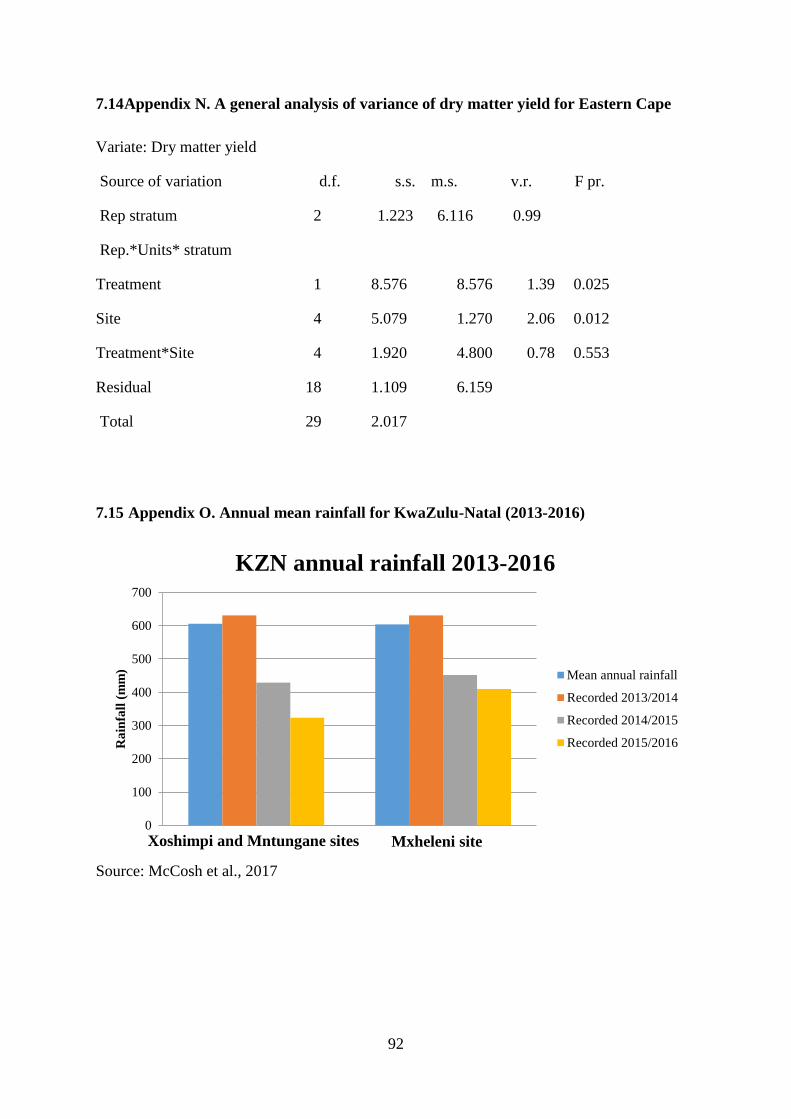
92
7.14 Appendix N. A general analysis of variance of dry matter yield for Eastern Cape
Variate: Dry matter yield
Source of variation d.f. s.s. m.s. v.r. F pr.
Rep stratum 2 1.223 6.116 0.99
Rep.*Units* stratum
Treatment 1 8.576 8.576 1.39 0.025
Site 4 5.079 1.270 2.06 0.012
Treatment*Site 4 1.920 4.800 0.78 0.553
Residual 18 1.109 6.159
Total 29 2.017
7.15 Appendix O. Annual mean rainfall for KwaZulu-Natal (2013-2016)
Source: McCosh et al., 2017
0
100
200
300
400
500
600
700
Ra
infa
ll (
mm
)
KZN annual rainfall 2013-2016
Mean annual rainfall
Recorded 2013/2014
Recorded 2014/2015
Recorded 2015/2016
Xoshimpi and Mntungane sites Mxheleni site
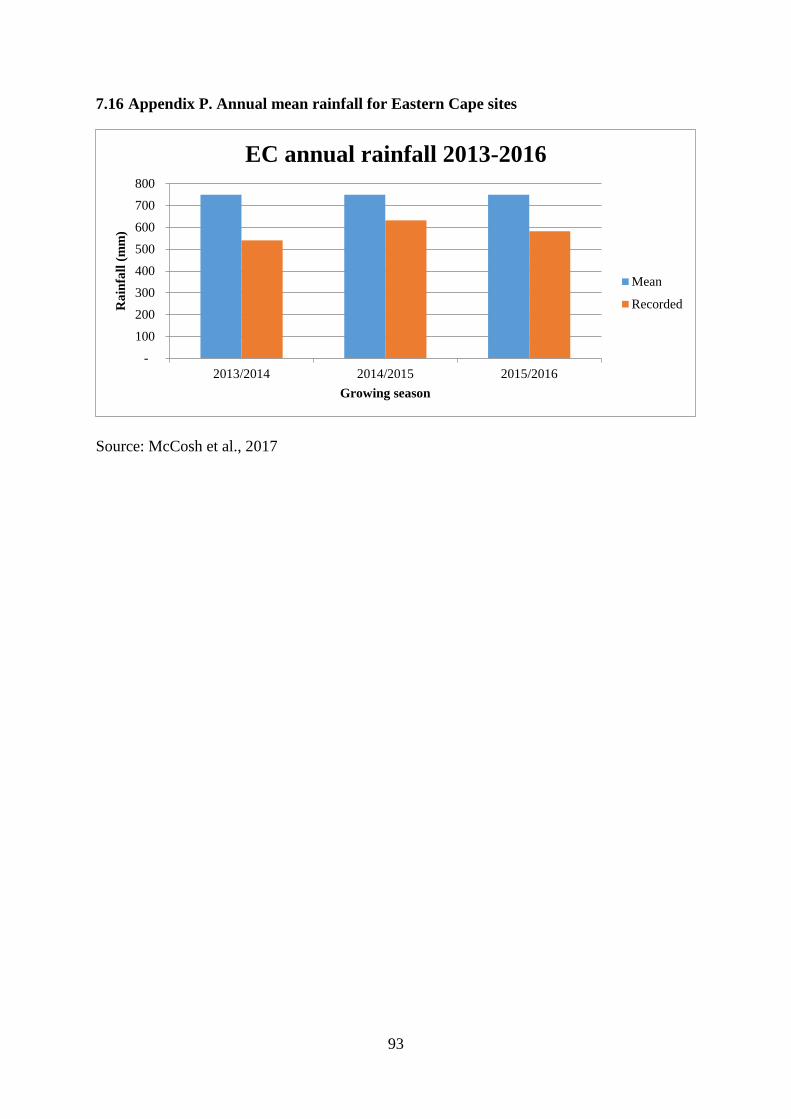
93
7.16 Appendix P. Annual mean rainfall for Eastern Cape sites
Source: McCosh et al., 2017
-
100
200
300
400
500
600
700
800
2013/2014 2014/2015 2015/2016
Ra
infa
ll (
mm
)
Growing season
EC annual rainfall 2013-2016
Mean
Recorded