Embed Size (px)
Citation preview

Assessing the Economic Impacts of Weather and Value of Weather ForecastsJeffrey K. Lazo
Societal Impacts ProgramNational Center for Atmospheric ResearchBoulder, CO. USA 80307

Some Things to Mention
• Meteorologist relevant economics
• A note of thanks … Caio, Barb, Manifred, others• Talk on Monday focuses on the Weather
Information Value Chain and includes some different examples of economics than this talk does
• A note on color blindness … apologies
• User-relevant verification

Meteorologist relevant economics
Please raise you hand if you work for a private sector company that makes it’s money by selling products and services (i.e., you do not work for the government, a university or research institute, or non-profit organization).
Please raise you hand if you work for a public enterprise that gets it’s funding mainly from the government or other public source (i.e., you do work for the government, a university or research institute, or non-profit organization).

Meteorologist relevant economics
Scenario … The Minister of Finance of the Country of Hypothetica is deciding how to allocate the 2018 Budget across all agencies …
By some weird accident of history there are two agencies in Hypothetica providing technically identical hydro-met information …
The Minister of Finance has indicated this will stop and he will only fund one agency heretofore, forthwith, and from now on and on …
He calls the Directors in to make their case!

Meteorologist relevant economics
The Director of Popular National Hydrological and Meteorological Services of Hypothetica makes his case (we will call him Director A)
“Our new models have 3 KM grid resolution with 17 vertical layers at 15 second time steps. We have new D-band radar, verify at 23.5% at the 500mb level, and have a lead time for barometric pressure of 13.2 minutes … We are the best!”

Meteorologist relevant economics
The Director of Peoples National Hydrological and Meteorological Services of Hypothetica makes his case (we will call him Director B)
“Using our new models led to warnings that saved 152 lives during last month’s floods. Forecasts save the airline industry $20 million a month on fuel costs and helped reduce drought impacts in Southern Hypothetica preventing 1,251 farmers from loosing their crops and livestock … We are the best!”

Meteorologist relevant economics
Who makes the better argument as far the Minister of Finance is concerned? Did I mention he has a bachelor’s degree in the Fine Arts?Did I mention your job depends this?
A. Director A (500 MB skill score)
B. Director B (152 lives saved)

• Why should weather people care about economics?• Cost-Loss Modeling • What is economics? What is “value” (in economics)?• Relationship of economics to verification and the
Weather Information Value Chain• Examples of economics and weather• Some final thoughts …
Objectives

Why Economics and Weather?US National Weather Service • Mission: Provide weather, water, and climate data, forecasts and warnings for
the protection of life and property and enhancement of the national economy• Goals that focus on critical weather-dependent issues:
• Improve sector-relevant information in support of economic productivity;(http://www.nws.noaa.gov/com/weatherreadynation/files/strategic_plan.pdf)
World Meteorological Organization• The vision of WMO is to provide world leadership in expertise and international
cooperation in weather, climate, hydrology and water resources and related environmental issues and thereby contribute to the safety and well-being of people throughout the world and to the economic benefit of all nations
(http://www.wmo.int/pages/about/mission_en.html)
Lesotho Meteorological Services• Mission Statement: To improve the livelihood of Basotho through effective
application of the science of Meteorology and harmonization of their socio-economic activities with weather and climate
(http://www.lesmet.org.ls/about-us.htm)
Do weather agencies “verify”
their mission?

Model used extensively in the meteorology literature to explain the value of a forecastIn the simplest version - decision framework where there are:
• Two possible weather outcomes• Adverse weather - with probability p• No adverse weather - with probability (1-p)• P – initially based on climatology, persistence, or …
• Two available decision actions• Protect at cost = C• Do not protect at cost = 0
• If adverse weather and not protected there is a loss = L
Cost-Loss Model

• Decision is to protect or not protect based on maximizing the expected value (or minimizing the expected cost) of the decision
• If Protect the “expected value” is simply the cost = C• If Do Not Protect the “expected value” is the probability of
a loss times the loss = p*L + (1-p)*0 = p*L• “expected value” over a large number of realizations – ex
ante decision (not necessarily repeated decision)
Cost-Loss ModelWeather Outcomes
Adverse Wx No Adverse Wx
Action
Protect C C
Do Not Protect L 0

• Decision Context: Maximize Expected Value• Decision Context: Minimize Expected Loss• Chose Action = min(C, p*L)• Protect if C < p*L
rearranging C/L < p
Cost-Loss ModelWeather Outcomes
Adverse Wx No Adverse Wx
Action
Protect C C
Do Not Protect L 0

• Decision context: whether to de-ice airplanes at the airport in the event of freezing weather (T<32F)
• It costs $10,000 per plane to de-ice and 100 planes a day –
C = $10,000 x 100 = $1,000,000• If you don’t de-ice and (T>32F) then no freezing – no cost and no loss• If you don’t de-ice and (T<32F) then freezing – 1 out every 100 planes crashes
(one a day) – 200 people on board - $6M/person VSL – Loss = $1.2 B• Climatology: (T<32F) on 36.5 days/yr … p = 36.5/365 = 0.10• Decision Rule: Protect if C < p*L or if C/L < p• Protect if $1 M < 0.10 * $1.2 B … Protect if $1 M < $120 M• or if $1M/$1.2 B < 0.10 … Protect if 0.0008333 < 0.10• Total Cost of Decision = 365 days * $1M/day = $365 M/yr
Example
Weather Outcomes
T<32F T>32F
Action
De-Ice
Don’t De-Ice
$1 M $1 M$0$1.2 B

• Decision Rule: Protect if Forecast(T<32) – so protect 36.5 days a year • Perfect Forecast (T>32F) – no de-icing – no cost and no loss• Perfect Forecast: (T<32) on 36.5 days/yr• Total Cost of Decision = 36.5 days * $1M/day = $36.5 M/yr
Annual Cost (Climatology) $365.0 M/yr
Annual Cost (Perfect Forecast) $ 36.5 M/yr
Value of Perfect Forecast $ 328.5 M/yr
Example – Perfect Forecast
Weather Outcomes
T<32F T>32F
Action
De-Ice
Don’t De-Ice
$1 M NA
$0NA

• Value of forecast• Improvement over “counterfactual”
• Climatology• Persistence• Existing forecast system
• Add information on forecast probabilities on the weather outcomes
Cost-Loss ModelWeather Outcomes
Adverse Wx No Adverse Wx
Action
Protect C C
Do Not Protect L 0

• Extensions• Risk aversion• Probabilistic information• Various distributions of forecast information• Various measures of forecast quality• Repeated decision making – dynamic• Many extensions …
Cost-Loss ModelWeather Outcomes
Adverse Wx No Adverse Wx
Action
Protect C C
Do Not Protect L 0

• Cost-Loss Model• Related more to decision analysis than “economics”
• Limitations of the Cost-Loss Model• Realism of decision context?• Decisions are not categorical• Forecasts are not categorical• What are the costs? Where does that info come from?• What are the losses? Where does that info come from?• Lazo WCAS editorial
Cost-Loss ModelWeather Outcomes
Adverse Wx No Adverse Wx
Action
Protect C C
Do Not Protect L 0

Verification Analysis of Cost-Loss Model References
• Murphy, A.H., 1969. On Expected -Utility Measures in Cost-Loss Ratio Decision Situations. Applied Meteorology. 8:989-991– 9 references – 0 economics
• Murphy, A.H.,. 1976. Decision-Making Models in the Cost-Loss Ratio Situation and Measures of the Value of Probability Forecasts. Monthly Weather Review. 104:1058-1065.– 20 references – 2 economics
• Murphy, Katz, Winkler, and Hsu. 1985. Repetitive Decision Making and the Value of Forecasts in the Cost‐Loss Ratio Situation: A Dynamic Model. Monthly Weather Review. 113(5):801-813.– 20 references – 0 economics
• Richardson, D. S., 1999. Applications of cost-loss models, Seventh Workshop on Meteorological Operational Systems, ECMWF. Shinfield Park, Reading, 1999 pp.209-213– 5 references – 0 economics
• Lee, K-K., and J-W. Lee. 2007. The economic value of weather forecasts for decision-making problems in the profit/loss situation. Meteorol. Appl. 14: 455–463 (2007). (www.interscience.wiley.com) DOI: 10.1002/met.44– 21 references – 0 economics
• Verkade, J. S. and M. G. F. Werner. 2011. Estimating the benefits of single value and probability forecasting for flood warning. Hydrol. Earth Syst. Sci., 15, 3751–3765.– 36 references – 2 economics– Econ references are from econometric journal on a type of regression analysis – not
really on economics
References Economics21 09 020 220 05 036 2
111 4

Relationship of economics to verification
• User relevant verification– Who are the users– What is relevant to them– How do we measure that– How do we use user-relevant verification to improve forecasting?

Relationship of economics to verification
• Impact based warning– Forecast - severe weather and 10
people will die in the storm tomorrow.
– Impacts Forecast A – 10 die– Impacts Forecast B – 0 die– Which forecast “verifies”?– Which is the better forecast?

Good forecast or bad forecast?
F O
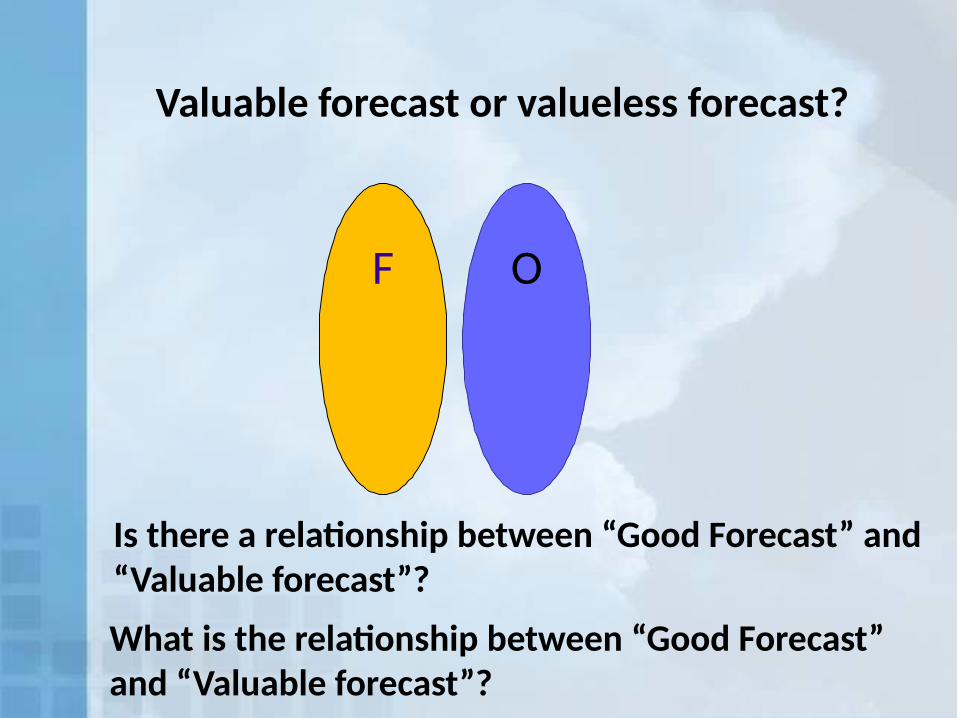
Valuable forecast or valueless forecast?
F O
Is there a relationship between “Good Forecast” and “Valuable forecast”?
What is the relationship between “Good Forecast” and “Valuable forecast”?

Valuable forecast or valueless forecast?
F OIf I’m a water manager for this watershed, it’s a
valueless forecast…
If I’m a water manager for this
watershed, it may be an expensive forecast…

Valuable forecast or valueless forecast?
If I’m an aviation traffic strategic planner…It might be a valuable forecast
OA B
OFFlight Route

Valuable forecast or valueless forecast?
O
A B
OF

Barb Brown Corollary
• Brown Corollary 1: If it is worth forecasting it is worth verifying
• Corollary 1b: If it is worth verifying … what is it worth?

• What is the weather information value chain? – Conceptual model of the value creation process– Emphasize this is not linear in the real world!– End-to-end-to-end
• This doesn’t show feedbacks, loops, discontinuities …
Weather Information Value Chain

Economics is … … a science
– theory based– diverse methodologies– focus on empirical analysis
… a social science– a study of human behavior– a theory of value– focus on understanding choices between options
What is economics?

Economic welfare is measured by individual utilityThe “consumer problem:”
What does economic value mean?
• U is the utility function• P is the vector of prices• X is a vector of goods and services• Y is income
By a substituting the utility maximizing demands for into U (the “direct” utility function) we can derive the “indirect” utility function:
Maximum utility attainable at given prices, , and income,
max subject to U X P X Y
,U V P Y

What does economic value mean?
Indirect utility function has arguments in prices , , and income, Can add “W” as weather – taken as an exogenous “given” argument in V
Maximum utility attainable at given prices, , income, . Given initial , , and achieve: Suppose now weather changes from to What is the change in well-being?• Measured by the change in income needed to leave the individual at
the same level of utility prior to the change in weather• Willingness-to-Pay (WTP)
WTP is the maximum amount of income individual is willing to give up (can be negative) to get a good (or to avoid a bad).
,U V P Y
, |U V P Y W
0 0 0 0, |U V P Y W
0 0 0 0 0 0 1, | , |U V P Y W V WTP Y WP

What does economic value mean?
Suppose now weather forecast quality is at initial level:
• “Better” information factors into ability to make better informed decisions
• Decision theory or more specific models can develop the “how” better information improves decisions to generate value.
Decision making under uncertainty: Value of Information (VOI)
Weather forecast quality changes from to
Weather doesn’t change just because forecast quality does ()
What is the change in well-being?• Measured by the change in income needed to leave the individual at
the same level of utility prior to the change in weather• Willingness-to-Pay (WTP) for improved weather forecast accuracy:
0 0 0 0 0, | ,U V P Y W I
0 0 101 , | ,U V P Y W I
0 0 0 0 0 0 0 0 1, | , , | ,U V P Y W I V P Y WTP IW

1. What is the economic impact of weather?
2. What is the value to the general public of current weather forecasts?
3. What is the value of improving the accuracy of hurricane forecasts?
4. What is the benefit of investment in research to improve forecasts?
What sorts of economic questions can be asked (and hopefully answered) about
weather and weather forecasts?

Dutton (BAMS 2002)
“. . . the third column lists the contribution to the GDP of industries with a (subjectively determined) weather sensitivity on operations, demand, or price.”
1. ECONOMIC IMPACT OF WEATHER

What is Weather Sensitivity?P$
Q
S(K0, L0, E0;W0)
D(W0)
P*
Q*
D(W1)
S(K0, L0, E0; W1)
Q1
P1
Change in GSPGSP

Economic Modeling
transcendental logarithmic (translog) functional form
GSP – Gross State ProductX – economic & weather inputs (K, L,
E, Temp, Precip) (indexed with k)i – statet – year– state specific fixed effectsδ – “technological change”
GSP: value added, is equal to its gross output
(sales or receipts and other operating income, commodity taxes, and
inventory change) minus its intermediate inputs (consumption of goods and services purchased
from other U.S. industries or imported)
112
1 1 1
ln ln ln lnN N N
it i k kit k kit lit itk k l
GSPδ t β X X X

Economic Modeling
Output elasticity of a productive input or weather variable k
Percent change in output due to percent change in input accounting for all main and cross effects (productive input or weather variable k )
Calculated variance of estimated output elasticities to calculate t-stats
A statistically significant estimate will suggest that an input does have an effect on output …
1
lnln
ln
Nit
k kl litlkit
GSPX
X

DataEconomic Data - state x year x sector
Gross State Product (dependent variable)Production Inputs– Capital (K) - dollars– Labor (L) - hours– Energy (E) – BTUs
Weather Data - state x year
Temperature Variability– CDD : Cooling Degree Days: (T - 65) on a given day– HDD : Heating Degree Days: (65 - T) on a given day
Precipitation– P_Tot: Precipitation Total (per square mile)– P_Std: Precipitation Standard Deviation
i = state 48j = sector 11t = year 1977-2000 = 24 years48 x 11 x 24 = 12,672 “observations”

Super SectorsSector 2000 GDP Billions (2000$)
Agriculture 98
Communications 458
Construction 436
Finance-Insurance-Real Estate (FIRE) 1,931
Manufacturing 1,426
Mining 121
Retail Trade 662
Services 2,399
Transportation 302
Utilities 189
Wholesale Trade 592
Total Private Sector 8,614
Government 1,135
Total GDP 9,749

Econometric Methods
• Heteroskedasticity – non-constant error term
• Serial correlation – panel data
• Fixed Effects – state level variation not accounted for in our explanatory variables (Hausman test)
FGLS – Feasible Generalized Least Squares – mixed mode (fixed effects and autoregressive (AR1)) corrected for heteroskedasticity
112
1 1 1
ln ln ln lnN N N
it i k kit k kit lit itk k l
GSPδ t β X X X

“Economic Input” Elasticities(blue box indicates significant at 10%)
Communications
1.12 0.31 -0.14
Construction 0.48 1.14 0.12
FIRE 0.98 0.39 -0.20
Manufacturing
0.48 0.62 0.09
Mining 1.20 0.60 0.10
Retail Trade 0.91 0.54 -0.04
Services 0.94 0.64 -0.07
Transportation
0.94 0.33 0.07
Utilities 1.11 -0.31 -0.03
Wholesale Trade
0.50 0.78 -0.02
Sector Capital Labor Energy
Agriculture 1.10 0.44 -0.01
lnln
GSPX

“Weather Input” Elasticities
(blue box indicates significant at 10%) Sector HDD CDD Total
PrecipPrecip
Variance
Agriculture 0.00 -0.19 0.28 -0.12
Communications
0.13 0.06 0.06 0.17
Construction -0.01 0.06 -0.01 0.26
FIRE 0.15 0.06 0.54 -0.08
Manufacturing
0.18 0.02 0.49 -0.22
Mining 0.25 0.04 -3.52 1.10
Retail Trade 0.04 0.03 -0.13 0.13
Services 0.04 0.00 0.33 -0.05
Transportation
-0.03 0.01 -0.15 0.15
Utilities 0.00 0.08 -0.59 -0.28
Wholesale 0.10 0.02 -0.19 0.02
lnln
GSPX

Weather Sensitivity AnalysisGoal: evaluate how GSP varies as a result of variation in weather
11 Sector Models: Q = f (K, L, E; W; Year, State)
• average K, L, E over 1996-2000• set ‘Year’ to 2000• run historical weather data 1931-2000 through each sector
model for each state• fitted GSP values by sector by state by year
– 11 sectors– 48 states– 70 “years” of state-sector GSP fitted to year 2000 “economic structure”
112
1 1 1
ln ln ln lnN N N
it i k kit k kit lit itk k l
GSPδ t β X X X

Aggregated by State(Billions $2000)
State Mean Max Min Range % Rang
e
Rank
New York 633.3 679.6 594.0 85.6 13.5% 1
Alabama 92.0 93.9 81.7 12.2 13.3% 2
California 1019.4
1080.5
968.6 111.9 11.0% 3
Wyoming 13.7 14.3 12.8 1.4 10.5% 4
Ohio 312.0 330.6 298.4 32.2 10.3% 5...
......
......
......
Delaware 30.2 30.6 29.6 1.0 3.3% 44
Maine 27.0 27.4 26.5 0.9 3.3% 45
Montana 17.2 17.4 16.9 0.6 3.3% 46
Louisiana 109.5 111.2 107.6 3.6 3.3% 47
Tennessee 141.1 142.8 139.3 3.5 2.5% 48


Aggregated by Sector (Billions $2000)
Wholesale trade 601.5 607.8 594.5 13.3 2.20%
Retail trade 761.5 771.2 753.9 17.3 2.27%
FIRE1,639
.31,713.
11,580.
6 132.5 8.08%
Communications 237.3 243.4 232.3 11.1 4.68%
Utilities 212.9 220.8 206.0 14.9 6.98%
Transportation 276.1 280.7 271.0 9.8 3.53%
Manufacturing
1,524.8
1,583.2
1,458.2 125.1 8.20%
Construction 374.5 384.0 366.4 17.7 4.71%
Mining 102.0 108.9 94.2 14.7 14.38%
Services1,834
.91,865.
41,804.
9 60.5 3.30%
Sector Mean Max Min Range %Range
Agriculture 127.6 134.4 119.0 15.4 12.09%
Total National
7,692.4
7,813.4
7,554.6 258.7 3.36%

Aggregate National Sensitivity
• Annual variability 3.36% variability (±1.7%) in annual US GDP– ~$485B variability (±$243B) of 2008 GDP ($14.44 T)– ~$532B variability (±$243B) of 2012 GDP ($15.85 T)
• Coefficient of variation (the standard deviation divided by the mean) is .0071 (7/10 of 1%)
• For 2008 US GDP– 68% of time less than ±$103B– 95% of time less than ±$205B– 0.2% of time more than ±$307B
• Every 500 years more than ±1.9% of GDP

2. VALUE OF CURRENT FORECASTS
Objective– What is the economic value of current weather forecasts?– Back-of-the-envelope” estimate
Method– Nationwide survey >1,500 respondents to assess
• where, when, and how often they obtain weather forecasts• how they perceive forecasts• how they use forecasts• the value they place on current forecast information.
– Implemented online with restricted access to only invited participants
– Simplified valuation approachLazo, J.K., R.E. Morss, and J.L. Demuth. 2009. “300 Billion Served: Sources, Perceptions, Uses, and Values of Weather Forecasts.” Bulletin of the American Meteorological Society. 90(6):785-798

The National Weather Service (NWS) is the primary source of weather forecasts, watches, and warnings for the United States. In addition to normal weather forecasts of precipitation, temperature, cloudiness, and winds, the NWS also provides:
• Severe weather (such as thunderstorms and tornadoes) forecasts, watches, and warnings• Hurricane forecasts, watches, and warnings• Fire weather forecasts, watches, and warnings• Forecasts used for aviation and marine commerce
All this information is also provided to media (including television, radio, and newspapers) and private weather services (such as The Weather Channel). How important to you is the information provided by the NWS that is listed above?
All of the activities of the National Weather Service (NWS) are paid for through taxes as a part of the federal government. This money pays for all of the observation equipment (such as satellites and radar), data analysis, and products of the NWS (including all the forecasts, watches, and warnings).
Suppose you were told that every year about $2 of your household's taxes goes toward paying for all of the weather forecasting and information services provided by the NWS. Do you feel that the services you receive from the activities of the NWS are worth more than, exactly, or less than $2 a year to your household?
a) Worth more than $2 a year to my householdb) Worth exactly $2 a year to my household c) Worth less than $2 a year to my household
Not at all important
A little important
Somewhat important
Very important
Extremely important
Randomly used different $$$/yr with different respondents

2. VALUE OF CURRENT FORECASTS
Lazo, J.K., R.E. Morss, and J.L. Demuth. 2009. “300 Billion Served: Sources, Perceptions, Uses, and Values of Weather Forecasts.” Bulletin of the American Meteorological Society. 90(6):785-798

2. VALUE OF CURRENT FORECASTS
Results– value of current wx information ~$286 / household / year– ~114,384,000 households in US (2006)– $31.5 billion total per year value to U.S. households
– compares to U.S. public and private sector meteorology costs of $5.1 billion/ yr
– benefit-cost ratio of 6.2 to 1.0
– Note: “back-of-the-envelope” approach used suggests need for better methods to derive current value estimates
Lazo, J.K., R.E. Morss, and J.L. Demuth. 2009. “300 Billion Served: Sources, Perceptions, Uses, and Values of Weather Forecasts.” Bulletin of the American Meteorological Society. 90(6):785-798

3. VALUE OF IMPROVED FORECASTS• Objective
– evaluate households’ values for improved hurricane forecasts and warnings
– Hurricane Forecast Improvement Project (HFIP)
• Methods– non-market valuation – conjoint analysis – survey development
• expert input• focus groups• cognitive interviews• pre-tests• small sample pre-test (80 subjects) - Miami, FL.• full implementation
– Online implementation –1,218 responses– Gulf and Atlantic coast hurricane vulnerable areas up to N. Carolina
Lazo, J.K. and D.M. Waldman. 2011. “Valuing Improved Hurricane Forecasts.” Economics Letters. 111(1): 43-46.Lazo, J.K., D.M. Waldman, B.H. Morrow, and J.A. Thacher. 2010. “Assessment of Household Evacuation Decision Making and
the Benefits of Improved Hurricane Forecasting.” Weather and Forecasting. 25(1):207-219

3. VALUE OF IMPROVED FORECASTS


• utility is linear combination of choice attributes and a random error
• Uij = utility of alternative i in choice set j• vector β are marginal utilities
– For the cost attribute, ß measures the marginal utility of money and is expected to be negative because increased cost implies decreased utility (or disutility).
• X = – accuracy of time of landfall– accuracy of projected location of landfall– accuracy of maximum wind speed– accuracy of wind speed change– accuracy of storm surge depth– provision of separate storm surge– extended forecast information– annual household cost
• = random disturbance
3. Random Utility Model (RUM)
, , ; 1, ..., 8ij ij ijU x i A B j

3. VALUE OF IMPROVED FORECASTS
Random Utility Model (RUM)• assumed independent, identically distributed,
mean zero normal random variables, uncorrelated with xij, with constant unknown variance σ
• Under these assumptions, the probability of choosing program 1, for example, is:
• univariate standard normal cumulative distribution function
• Probit model for dichotomous choice
, , ; 1, ..., 8ij ij ijU x i A B j
1 1 2 1 2 / 2ij ijij ij ijP P U U x x

3. VALUE OF IMPROVED FORECASTSOption to remain at status quo level:
• Φ2 is the standard bivariate normal cumulative distribution function.
• Normalization is required and an additional parameter is identified – normalize σε
is the correlation between and
3 0
3 02 0
3 0
,
/ 2 , / ;
ij ij ij
ij ij ij
ij ij ij ij
ij ij ij
ij ij ij ij
k k k
ij ij ij ij
k k k
k k k
P U U U U
x x x x

3. VALUE OF IMPROVED FORECASTS
Lazo, J.K. and D.M. Waldman. 2011. “Valuing Improved Hurricane Forecasts.” Economics Letters. 111(1): 43-46.Lazo, J.K., D.M. Waldman, B.H. Morrow, and J.A. Thacher. 2010. “Assessment of Household Evacuation Decision Making and the Benefits of Improved
Hurricane Forecasting.” Weather and Forecasting. 25(1):207-219
Conditional Probit (AB and SQ choices)
N= 1201 (out of 1218) respondents who answered all 8 choice questions. 9605 responses (out of 8*1201 = 9608) responses (3 refusals of St. Quo question)
Beta t-stat WTP Unit Range WTP Max
Improvement
Landfall Time -0.052 -9.41 $1.27 hours 2 - 5 $3.81
Landfall Location -0.009 -13.92 $0.21 miles 25 - 50 $5.26
Wind Speed -0.005 -2.51 $0.11 mph 7-15 $0.90
Change in Wind Speed 0.007 13.70 $0.16 % 20 - 60 $6.49
Surge Depth -0.007 -1.30 $0.17 feet 2 - 5 $0.50
Surge Information 0.035 1.83 $0.85 yes/no 0 - 1 $0.85
Extended Forecast 0.035 3.68 $0.86 days 5 - 7 $1.72
Cost -0.041 -48.39 $19.52

3. VALUE OF IMPROVED FORECASTS
• Results– significant marginal values for improved accuracy of landfall,
timing, specificity, extended forecast, etc.– total WTP for this average overall superior forecast (from
baseline to maximum levels on all attributes) is $19.52 per household per year
– 9,857,371 households … $192,421,599 total annual benefit?

4. VALUE OF RESEARCH TO IMPROVE FORECASTS
• Objective– perform benefit-cost analysis for a new supercomputer for research to
improve weather forecasting
• Methods– several economic methods applicable to benefit-cost analysis
(1) benefits transfer(2) survey-based nonmarket valuation(3) discounting(4) value of statistical life(5) expert elicitation(6) influence diagramming, and(7) sensitivity analysis
Lazo, J.K., J. S. Rice, M. L. Hagenstad. 2010. “Benefits of Investing in Weather Forecasting Research: An Application to Supercomputing.” Yuejiang Academic Journal. 2(1):18-39.

4. VALUE OF RESEARCH TO IMPROVE FORECASTS

4. VALUE OF RESEARCH TO IMPROVE FORECASTS
• Results– benefits to households, agriculture, aviation evaluated– average total benefits from these three sectors were estimated at $116
million in present value (2002 US dollars)– Net Present Value (present value of benefits minus costs)
• 3% real rate of discount = $104.60 million (2003 US dollars)• 5% real rate of discount = $ 53.17 million (2003 US dollars)
– internal rate of return = 21.82%
• Policy Analysis / Decision Making– meet OMB regulatory requirements for a benefit-cost analysis study of a
significant investment in research infrastructure
Lazo, J.K., J. S. Rice, M. L. Hagenstad. 2010. “Benefits of Investing in Weather Forecasting Research: An Application to Supercomputing.” Yuejiang Academic Journal. 2(1):18-39.

Some Other Things to Mention …• Ethical Issues
– Efficiency versus Equity
• World Bank / USAID / WMO Book on Socio-Economic Benefit Analysis– https://drive.google.com/file/d/0BwdvoC
9AeWjUX2dJblR6WlMybU0/view
• Social Sciences– Anthropology– Sociology– Communication– History– Law– Geography– Linguistics– Political Science– Psychology

Economics and Weather … • Why talk about economics of weather enterprise?
• What to value? (i.e., objective of an economic study)– Economic impact of weather– Value of current forecasts– Value of improved forecasts – Value of research to improve forecasts– Value of …
• How to value? (i.e., methods)– Primary studies versus using existing data / research– Market valuation or non-market valuation– Survey research, econometric models, expert elicitation, …
• What level of detail / sophistication? (i.e., resources)– $25k benefit-cost assessment to $1M benefit analysis
• What is information from the study going to be used for?– will the study provide the right information for decision making?

THANKS FOR LISTENING!
QUESTIONS?
Jeff [email protected]
www.sip.ucar.edu
References (available on http://www.sip.ucar.edu/publications.php)• Lazo, J.K. and D.M. Waldman. 2011. “Valuing Improved Hurricane Forecasts.” Economics Letters. 111(1): 43-46.• Lazo, J.K., D.M. Waldman, B.H. Morrow, and J.A. Thacher. 2010. “Assessment of Household Evacuation Decision Making and the Benefits of Improved Hurricane
Forecasting.” Weather and Forecasting. 25(1):207-219.• Lazo, J.K., J. S. Rice, M. L. Hagenstad. 2010. “Benefits of Investing in Weather Forecasting Research: An Application to Supercomputing.” Yuejiang Academic Journal.
2(1):18-39.• Lazo, J.K., M. Lawson, P.H. Larsen, and D.M. Waldman. June 2011 “United States Economic Sensitivity to Weather Variability.” Bulletin of the American Meteorological
Society. 92: 709-720.• Lazo, J.K., R.E. Morss, and J.L. Demuth. 2009. “300 Billion Served: Sources, Perceptions, Uses, and Values of Weather Forecasts.” Bulletin of the American
Meteorological Society. 90(6):785-798.