Embed Size (px)
Citation preview
e at SciVerse ScienceDirect
Journal of Equine Veterinary Science 34 (2014) 275–280
Contents lists availabl
Journal of Equine Veterinary Science
journal homepage: www.j -evs.com
Original Research
Assessing the Association Between Hoof Thermography and HoofDoppler Ultrasonography for the Diagnosis of Lameness in Horses
Teresa L. Douthit PhD a,*, Jennifer M. Bormann PhD, PAS a, Nora M. Bello PhD, VMDb
aDepartment of Animal Sciences and Industry, Kansas State University, Manhattan, KansasbDepartment of Statistics, Kansas State University, Manhattan, Kansas
a r t i c l e i n f o
Article history:Received 26 February 2013Received in revised form 3 June 2013Accepted 17 June 2013Available online 30 July 2013
Keywords:Doppler ultrasonographyHorseLamenessThermography
* Corresponding author at: Teresa L. Douthit,Animal Sciences and Industry, Kansas State UniverManhattan, KS 66506.
E-mail address: [email protected] (T.L. Douthit).
0737-0806/$ – see front matter � 2014 Elsevier Inchttp://dx.doi.org/10.1016/j.jevs.2013.06.005
a b s t r a c t
The objectives of this study were to assess the correlation between hoof surface temper-ature and ultrasonographic measurements of digital blood vessels in horses and to eval-uate the measurements’ potential as predictors for clinical lameness. Twelve 3-year-oldAmerican Quarter Horses, 6 geldings and 6 mares, with average initial body weight of459 � 31 kg were used. On days 0, 30, 60, and 90 of the study, horses were weighed andsubjected to clinical lameness examinations. Doppler ultrasonography was used tomeasure diameter of the medial palmar artery in the distal left forelimb and velocity ofblood flow through that artery, starting at 60 minutes after morning feeding and repeatedat 30-minute intervals. Temperature measurements on the hoof were collected at15-minute intervals beginning 75 minutes after feeding, using a digital thermographiccamera. A series of bivariate linear mixed models were fitted to estimate the correlationbetween Doppler and temperature measurements. The within-horse and between-horsecorrelations between hoof surface temperature and velocity of blood flow in the distallimb through the medial palmar artery was estimated at 0.40 (P > .50) and 0.99 (P < .001),respectively. These results indicate that at the horse level, the correlation between hooftemperature and velocity of blood flow in the distal limb was very high but that thewithin-horse correlation was not significantly different from 0. Velocity of blood flow at60 minutes after feeding improved model fit to the lameness data, so it was included asa model predictor for lameness.
� 2014 Elsevier Inc. All rights reserved.
1. Introduction [3,4], removes wastes, and is essential in the thermoregu-
Lameness can be devastating to the utility of the horse,as the equine often is expected to perform athletically formany years. In fact, lameness has been cited not only as themost common cause of lost performance [1] but also themost frequently reported health problem in horses [2].Recent studies have enhanced our understanding of thepathophysiology of lameness. In particular, altered digitalcirculation has been proposed to play a role, becausecirculating blood carries nutrients to the digital tissues
PhD, Department ofsity, 129 Weber Hall,
. All rights reserved.
lation of the hoof [4]. In addition, the rigid nature of thehoof wall makes the equine foot particularly susceptible tochanges in pressure, with little room for expansion toaccommodate the edema that characterizes any inflam-matory process [4]. Both navicular syndrome and laminitis,common forms of equine lameness, have been associatedwith altered circulation in the equine hoof [3-8].
Doppler ultrasonography and thermographic imagingare noninvasive methods of assessing blood flow to varioustissues within the body. Moving structures, such as eryth-rocytes in circulating blood, show differential patterns ofsound wave reflectance based on their speed of travel;these patterns can be detected through Doppler ultraso-nography [9]. Doppler ultrasonography has been used toevaluate blood flow throughout the equine limb [10,11] and

T.L. Douthit et al. / Journal of Equine Veterinary Science 34 (2014) 275–280276
the equine hoof specifically [12]. Studies have shown thatdespite considerable variability in measurements, the useof Doppler ultrasonography in the equine limb is suffi-ciently repeatable and sensitive to detect changes in bloodflow [13,14]. In fact, Doppler ultrasonography is able todetect differences as small as 0.005 and 0.01 ml/min indigital arterial and venous flow, respectively [13], makingthe technique sufficiently sensitive to detect differentphysiological stages [15].
Thermographic imaging is commonly used to measuresurface temperature, which in turn may be considered anindicator of blood flow to an area. As local circulatory flowin the equine limb increases so does the emission ofinfrared energy [16]. This technique has been shown toyield repeatable measurements [17], although ambienttemperature differences may affect measurements ob-tained [18]. Thermography has been used to detect a varietyof inflammatory conditions [19] and early signs of osteo-arthritis [20] in the horse. The use of thermographyrequires little operator training and does not require closeproximity to a blood vessel, making it more practical thanDoppler ultrasonography to assess blood flow in areas suchas the hoof. Despite the fact that thermographic imaging isrelatively simple and straightforward to administer, it is notused widely in clinical settings [21].
The objectives of this study were to assess the correla-tion between hoof surface temperature and ultrasono-graphic measurements of digital blood vessels in horses,and to evaluate the measurements’ potential as predictorsfor clinical lameness.
2. Materials and Methods
All procedures were approved by the InstitutionalAnimal Care and Use Committee at Kansas State University.This study was conducted concurrently and with the sameset of horses assigned to another experiment designed toevaluate the effects of endophyte-infected fescueconsumption on digital circulation in the horse [11]. Briefly,12 3-year-old American Quarter Horses, 6 geldings and 6mares, with mean initial body weight of 459 � 31 kg wereblocked by weight, gender, and hyperkalemic periodicparalysis status (homozygous normal or heterozygous) andassigned to dietary treatment groups as described ina study by Douthit et al. [11]. The effect of dietary treatmenton digital circulationwas reported in Douthit et al. [11]. Thepresent study addresses the relationships between themeasurements of digital circulation to each other, as well astheir relationship to lameness, independent of treatment,which were not addressed in the previous publication [11].
Horses were housed in 45-m � 20-m drylot pens andreceived routine vaccinations, deworming, and hoof care.The study was conducted from June through October 2007.Horses were weighed and subjected to clinical lamenessexaminations by a board-certified equine veterinarian ondays �1 and 0, 30 and 31, 60 and 61, and 90 and 91 of thestudy. One veterinarian conducted all examinations ondays �1 to 31, with another veterinarian conducting allremaining examinations. On each of these days, lamenesswas assessed by the veterinarian after observing horsestrotting in a straight line and trotting in a circle on a longe
line on a concrete surface and their sensitivity to hooftesters. Initially horses were scored according to the AAEPlameness scale, and then any horse receiving a gradegreater than 0 (those showing any sign of lameness) werescored 1, and sound horses were scored 0. Concurrent withthe clinical examinations, surface temperatures of eachhorse’s front hooves were recorded throughout the dayusing a digital thermographic camera (ThermaCAMP45HSV; Flir Systems, Inc., Pleasant Hill, MO). Thetemperature of each front hoof was measured by a trainedgraduate student, and readings were averaged betweenhooves for each horse at each time point within the day.Temperature measurements were collected at approxi-mately 1 cm below the coronary band at 15-minute inter-vals beginning 75 minutes after feeding. Dopplerultrasonography (Megas ES FD570A; Biosound Esaote, Inc.,Indianapolis, IN) was used to measure diameter of themedial palmar artery in the distal left forelimb and velocityof blood flow through that artery. Each series of measure-ments took place on two consecutive days, with six horsesevaluated each day. Approximately 12 hours prior tomeasurement, horses were placed in climate-controlledstalls. Sampling with Doppler ultrasonography began 60minutes after morning feeding and was repeated at 30-minute intervals by the same veterinarian that conductedthe lameness examinations. Velocity was recorded on allcollection dates, but diameter was not collected on day 0.Volume of blood flow was calculated by multiplyingvelocity by diameter. Further details about management ofthe horses and measurement of responses can be found inDouthit et al. [11].
2.1. Statistical Analysis
For the purpose of exploring the association betweensurface temperature and ultrasonographic measurementsof the hoof, a series of three bivariate linear mixed modelswere fitted to hoof temperature and velocity of blood flow,hoof temperature, and diameter of medial palmar artery,and hoof temperature and volume of blood flow. For each ofthe responses of interest, namely velocity, diameter,volume, and temperature, the arithmetic mean of allmeasurements made on a horse on a given day wascalculated, resulting in a single data point for each responsevariable per horse and day. The statistical model includedfixed effects of treatment, day, and their two-way interac-tion, as well as a random effect of horse nested withintreatment to account for repeated measures over multipledays for each horse. All variance components were estimateusing residual maximum likelihood. Statistical modelswere fitted using the MIXED procedure of SAS software(version 9.2; SAS Institute, Cary, NC). The residual (i.e.,within-horse) and random (i.e., between-horse) variance-covariance matrices were specified as unstructured toallow for separate estimation of variance and covarianceparameters at both levels. These variance-covariance esti-mates were used to estimate within-horse and between-horse correlation coefficients between hoof temperatureand velocity of blood flow, hoof temperature and diameterof medial palmar artery, and hoof temperature and volumeof blood flow. These correlation coefficients were then

T.L. Douthit et al. / Journal of Equine Veterinary Science 34 (2014) 275–280 277
tested against a null value 0 using a t-test, as described ina study by Kutner et al. [22]. Because diameter and volumewere not measured on day 0, there were only threerepeated measures for these variables; therefore, correla-tions between hoof temperature and diameter of medialpalmar artery and between hoof temperature and volumeof blood flow could not be estimated.
The associations between occurrence of lameness (yes/no) and velocity, diameter, volume, and temperaturemeasurements of the hoof were also examined. A gener-alized linear mixed model was used to describe the asso-ciation between lameness and the predictors of interest;the model was determined by step-wise forward selectionusing maximum-likelihood–based Bayesian informationcriterion (BIC) as an indicator of model fit. The base modelincluded day, treatment, and sex as fixed effects and therandom effect of horse nested within treatment and sex.Candidate explanatory variables evaluated for modelinclusion were velocity, diameter, and volume measured attime points 60, 90, 120, 150, and 180 minutes, andtemperature was measured at time points 75, 90, 105, 120,135, 150, and 165 minutes after feeding. For this analysis,temperature, velocity, diameter, and volume were notaveraged within horse and day. Model fitting was con-ducted using the GLIMMIX procedure of SAS software(version 9.2; SAS Institute, Cary, NC), with P value of .05 asthe significance level. No horses showed lameness on day0; therefore, only observations from days 30, 60, and 90were used in this analysis to prevent quasi-completeseparation of data points.
3. Results
3.1. Relationship Between Doppler Ultrasonography andTemperature Measurements
Scatterplots of observed values for hoof surfacetemperature and velocity of blood flow are presented inFigures 1 and 2, respectively, for each horse and are colorcoded for days 0, 30, 60, and 90. The estimatedwithin-horse
Fig. 1. Scatterplot of observed hoof temperature (�F) on days �1 and 0, 30 and 31, 6means (-) for each horse.
(i.e., residual level) correlation between hoof surfacetemperature and velocity of blood flow in the distal limbthrough themedial palmar artery was 0.40 (P> .50); that is,for a given horse and within a given day, measurements ofhoof temperature and velocity of blood flow in the distallimb were only moderately correlated. The within-horserelationship between hoof surface temperature andvelocity of blood flow is depicted in Figure 3 by means ofa scatterplot of their respective residuals.
The estimated between-horse (i.e., random level)correlation was 0.99 (P < .001); that is, after estimatinga relative horse-specific response over the course of thestudy (much as is donewith best linear unbiased predictionin linear mixed models), the estimated horse-level corre-lation for hoof surface temperature and velocity of bloodflow in the distal limb was of considerable magnitude.Figure 4 illustrates this relationship using a scatterplot ofthe estimated horse-specific differential effects on hooftemperature over estimated horse-specific differentialeffects on blood flow velocity.
In the remaining two bivariate linear mixed modelsfitted to hoof surface temperature and each of diameter andvolume, per hoof blood vessel ultrasonographic measure-ments, between-horse variance components estimationconverged to 0; therefore, it was not possible to computethe between-horse correlation between variables.
3.2. Relationship of Hoof Temperature and DopplerUltrasound Measurements With Lameness
When BIC-based forward model selection was used toassess explanatory variables associated with lameness,none of the variables was significantly (P < .05) associatedwith lameness. Velocity of blood flow at 60 minutes afterfeeding was identified as the best fitting predictor oflameness (decreased the BIC by more than 2) afteraccounting for other variables in the model, namely day,treatment, and sex. In addition, hoof temperature at 75, 90,105,120,135, and 150minutes after feeding or average hooftemperature seemed to have comparable model fit to the
0 and 61, and 90 and 91 for 12 horses. Shown are daily observations ( ) and

Fig. 2. Scatterplot of observed velocity of blood flow (m/s) as measured by Doppler ultrasonography through the medial palmar artery on days �1 and 0, 30 and31, 60 and 61, and 90 and 91 for 12 horses. Shown are daily observations ( ) and means (-) for each horse.
T.L. Douthit et al. / Journal of Equine Veterinary Science 34 (2014) 275–280278
data relative to velocity at 60 minutes, meaning theydecreased the BIC by approximately the same amount andhad similar P values. However, after one of these explana-tory variables was added, none of the others added to thepredictive ability of the model. Other studies have reportedsuccess in diagnosing lameness in horses with the aid ofthermography [25,26]. In our case, even though modelselection indicated that several explanatory variables (aslisted above) contributed to explaining lameness, theirP values ranged from .13 to .18. The estimated 95% confi-dence intervals for the odds ratios for velocity, volume,diameter, or temperature when incorporated into the base
Fig. 3. Scatterplot of within-horse residuals (color coded within horse) velocity ofDoppler ultrasonography and hoof surface temperature (�C; x-axis). The estimated
model included the null value 0 in all cases and had P values>.13, indicating that none of the variables was significantlyassociated with the odds of lameness.
4. Discussion
The moderate correlation detected between surfacetemperature of the hoof and velocity of blood flow concurswith the conclusion drawn by other authors that Dopplerand thermographic readings show a poor degree of corre-lation [23,24]. Such moderate correlation might be attrib-utable to measurement noise associated with the
blood flow through the medial palmar artery (m/s; y-axis) as measured bywithin-horse correlation was 0.40 (P < .02).
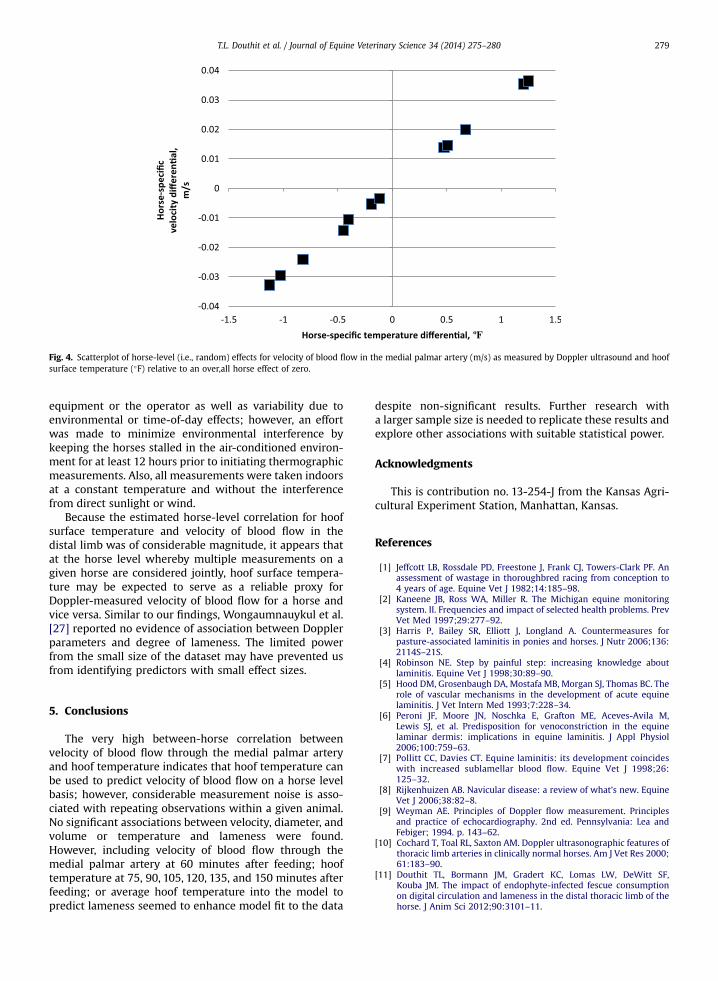
Fig. 4. Scatterplot of horse-level (i.e., random) effects for velocity of blood flow in the medial palmar artery (m/s) as measured by Doppler ultrasound and hoofsurface temperature (�F) relative to an over,all horse effect of zero.
T.L. Douthit et al. / Journal of Equine Veterinary Science 34 (2014) 275–280 279
equipment or the operator as well as variability due toenvironmental or time-of-day effects; however, an effortwas made to minimize environmental interference bykeeping the horses stalled in the air-conditioned environ-ment for at least 12 hours prior to initiating thermographicmeasurements. Also, all measurements were taken indoorsat a constant temperature and without the interferencefrom direct sunlight or wind.
Because the estimated horse-level correlation for hoofsurface temperature and velocity of blood flow in thedistal limb was of considerable magnitude, it appears thatat the horse level whereby multiple measurements on agiven horse are considered jointly, hoof surface tempera-ture may be expected to serve as a reliable proxy forDoppler-measured velocity of blood flow for a horse andvice versa. Similar to our findings, Wongaumnauykul et al.[27] reported no evidence of association between Dopplerparameters and degree of lameness. The limited powerfrom the small size of the dataset may have prevented usfrom identifying predictors with small effect sizes.
5. Conclusions
The very high between-horse correlation betweenvelocity of blood flow through the medial palmar arteryand hoof temperature indicates that hoof temperature canbe used to predict velocity of blood flow on a horse levelbasis; however, considerable measurement noise is asso-ciated with repeating observations within a given animal.No significant associations between velocity, diameter, andvolume or temperature and lameness were found.However, including velocity of blood flow through themedial palmar artery at 60 minutes after feeding; hooftemperature at 75, 90, 105, 120, 135, and 150 minutes afterfeeding; or average hoof temperature into the model topredict lameness seemed to enhance model fit to the data
despite non-significant results. Further research witha larger sample size is needed to replicate these results andexplore other associations with suitable statistical power.
Acknowledgments
This is contribution no. 13-254-J from the Kansas Agri-cultural Experiment Station, Manhattan, Kansas.
References
[1] Jeffcott LB, Rossdale PD, Freestone J, Frank CJ, Towers-Clark PF. Anassessment of wastage in thoroughbred racing from conception to4 years of age. Equine Vet J 1982;14:185–98.
[2] Kaneene JB, Ross WA, Miller R. The Michigan equine monitoringsystem. II. Frequencies and impact of selected health problems. PrevVet Med 1997;29:277–92.
[3] Harris P, Bailey SR, Elliott J, Longland A. Countermeasures forpasture-associated laminitis in ponies and horses. J Nutr 2006;136:2114S–21S.
[4] Robinson NE. Step by painful step: increasing knowledge aboutlaminitis. Equine Vet J 1998;30:89–90.
[5] Hood DM, Grosenbaugh DA, Mostafa MB, Morgan SJ, Thomas BC. Therole of vascular mechanisms in the development of acute equinelaminitis. J Vet Intern Med 1993;7:228–34.
[6] Peroni JF, Moore JN, Noschka E, Grafton ME, Aceves-Avila M,Lewis SJ, et al. Predisposition for venoconstriction in the equinelaminar dermis: implications in equine laminitis. J Appl Physiol2006;100:759–63.
[7] Pollitt CC, Davies CT. Equine laminitis: its development coincideswith increased sublamellar blood flow. Equine Vet J 1998;26:125–32.
[8] Rijkenhuizen AB. Navicular disease: a review of what’s new. EquineVet J 2006;38:82–8.
[9] Weyman AE. Principles of Doppler flow measurement. Principlesand practice of echocardiography. 2nd ed. Pennsylvania: Lea andFebiger; 1994. p. 143–62.
[10] Cochard T, Toal RL, Saxton AM. Doppler ultrasonographic features ofthoracic limb arteries in clinically normal horses. Am J Vet Res 2000;61:183–90.
[11] Douthit TL, Bormann JM, Gradert KC, Lomas LW, DeWitt SF,Kouba JM. The impact of endophyte-infected fescue consumptionon digital circulation and lameness in the distal thoracic limb of thehorse. J Anim Sci 2012;90:3101–11.

T.L. Douthit et al. / Journal of Equine Veterinary Science 34 (2014) 275–280280
[12] Hoffmann KL, Wood AKW, McCarthy PH, Griffiths KA, Evans DL,Gill RW. Sonographic observations of the peripheral vasculature ofthe equine thoracic limb. Anat Histol Embryol 1999;28:281–9.
[13] Menzies-Gow NJ, Marr CM. Repeatability of Doppler ultrasono-graphic measurement of equine digital blood flow. Vet RadiolUltrasound 2007;48:281–5.
[14] Raisis AL, Young LE, Meire HB, Taylor PM, Walsh K, Lekeux P.Variability of Doppler ultrasound measurements of hindlimb bloodflow in conscious horses. Equine Vet J 2000;32:125–32.
[15] Menzies-Gow NJ, Sepulveda MF, Bailey SR, Cunningham FM, Elliott J.Roles of thromboxane a(2) and 5-hydroxytryptamine in endotoxin-induced digital vasoconstriction in horses. Am J Vet Res 2008;69:199–207.
[16] Stromberg B, Norberg I. Infra-red emission and 133Xe-disappearancerate studies in the horse. Equine Vet J 1971;1:1–7.
[17] Palmer SE. Use of the portable infrared thermometer as a means ofmeasuring limb surface-temperature in the horse. Am J Vet Res1981;42:105–8.
[18] Mogg KC, Pollitt CC. Hoof and distal limb surface-temperature in thenormal pony under constant and changing ambient-temperatures.Equine Vet J 1992;24:134–9.
[19] Purohit RC, Mccoy MD. Thermography in the diagnosis of inflam-matory processes in the horse. Am J Vet Res 1980;41:1167–74.
[20] Vaden MF, Purohit RC, Mccoy MD, Vaughan JT. Thermography�atechnique for sub-clinical diagnosis of osteo-arthritis. Am J Vet Res1980;41:1175–9.
[21] Rantanen NW. Equine imaging modalities: an algorithm approach.American Association of Equine Practitioners Proceedings 2010;56:290–6.
[22] Kutner MH, Nachtsheim CJ, Neter J, Li W. Applied linear statisticalmodels. 5th ed. London: McGraw-Hill Irwin; 2004. p. 84.
[23] Seifalian AM, Stansby G, Jackson A, Howell K, Hamilton G.Comparison of laser Doppler perfusion imaging, laser Dopplerflowmetry, and thermographic imaging for assessment of bloodflow in human skin. Eur J Vasc Surg 1994;8:65–9.
[24] Wienzek H, Freise H, Giesler I, Van Aken HK, Sielenkaemper AW.Altered blood flow in terminal vessels after local applicationof ropivacaine and prilocaine. Reg Anesth Pain Med 2007;32:233–9.
[25] Eddy A, Hoogmoed V, Synder R. The role of thermography in themanagement of equine lameness. Vet J 2001;162:172–81.
[26] Turner TA. Diagnostic thermography. Vet Clin North Am EquinePract 2001;17:95–113.
[27] Wongaumnuaykul S, Siedler C, Schobesberger H, Stanek C. Dopplersonographic evaluation of the digital blood flow in horses withlaminitis or septic pododermatitis. Vet Radiol Ultrasound 2006;47:199–205.