Embed Size (px)
Citation preview

Assessing Seismic Hazard and Risk Globally for an Earthquake Resilient
World
Vitor Silva, Marco Pagani, John Schneider, Paul Henshaw
Global Earthquake Model Foundation

Abstract
The constant growth of world population has led to growth in conurbations prone to disasters associated with natural
hazards and - as a consequence - to an increase in the overall level of societal risk. Amongst natural catastrophes,
earthquakes represent about one fifth of the economic losses, and are responsible for an average of 20 thousand
fatalities per year. This increasing pressure requires the development and implementation of risk reduction measures,
ideally supported by reliable and technically sound risk information, such as maps, with expected hazard intensities,
annualised average losses, or losses for a particular return period (or probability of exceedance). Some of the challenges
to the generation of this information are due to the lack of open models, datasets and tools, as well as insufficient local
capacity to create or use such resources. The recognition of this shortage of models and need to improve institutional
capacity to assess the impact of earthquakes propelled the Global Earthquake Model (GEM) and its partners to develop
an open seismic hazard and risk model with global coverage. In this contribution we describe the hazard, exposure and
vulnerability components of this model, and the open-source tools that have been created to allow experts to reproduce
the hazard and risk results, or tailor parts of the model to specific needs. We also provide a discussion regarding how
the results from the global earthquake model may be used to identify global risk trends, and support the monitoring of
the Sendai Framework for Disaster Risk Reduction.

The need for for a global earthquake risk model
In 10 years world population will exceed 8 billion, and by the year of 2055 we will be more than 10 billion. This
growth in population has resulted in an increase in losses due to natural hazards from 14 billion USD annually to more
than 140 billion USD between 1985 and 2014. Earthquakes constitute on average 20% of the annual losses, but in some
years this proportion has been as high as 60% (e.g. 2010, 2011). This peril has been responsible for an average death toll
of over 20 thousand people per year in the last several decades and economic losses that can reach a great fraction of a
country’s welfare. In Central America and the Caribbean, the earthquakes of Guatemala (1976), Nicaragua (1972), El
Salvador (1986) and Haiti (2010) caused economic losses of approximately 98%, 82%, 40% and 120% of the nominal
gross domestic product (GDP) of each country, respectively (Daniell et al., 2010). This impact hinders sustainable
development, creation of jobs and availability of funds for poverty reduction initiatives (UNISDR, 2015). In addition to
these direct consequences in the vicinity of the seismic event, business disruption of large companies can induce a
negative impact at a global scale. After the Great East Japan earthquake in 2011, the electronics industry suffered
systematic delays in the supply of numerous components produced by some of the affected factories, which led to a
worldwide rise of prices due to stock shortage. The trend in the losses (ground-up and insured) in the last 4 decades is
illustrated in Figure 1. In one quarter of the recorded years the ground-up losses exceeded 20 billion USD, and in the last
15 years the annual losses were always above 5 billion USD.

Figure 1 – Overall and insured losses between 1980 and 2013 (from MunichRe, 2018).
Altering the trend in disaster losses is only possible through the development and implementation of efficient
risk reduction measures. In the last 20 years, about 12 billion EUR have been financed by large institutions (e.g.
European Union, World Bank) and national governments (e.g. Japan, Australia, United States) for the implementation
of risk reduction measures in regions frequently struck by natural hazards (Kellett and Caravani, 2013). Understanding
the magnitude of human and economic losses from damaging events is fundamental in order to inform decision makers
and disaster risk managers in the development of such measures. For example, in 2009 the Italian Government invested
almost 1 billion EUR in a seismic prevention programme at the national scale. In order to distribute the funds across the
different regions, a seismic risk assessment study was conducted and the funds were distributed proportionally (Dolce,
2012). Similarly, in 2002 a catastrophe insurance pool for residential buildings was created in Turkey to transfer the risk
from the public sector to the international reinsurance market (Bommer et al. 2002). The establishment of this financial
mechanism required an earthquake model to estimate the expected economic losses from each province. More
recently, Mora et al. (2015) demonstrated how a probabilistic loss model was used to prioritize which schools should be
the target of a retrofitting intervention in Colombia.

At the global scale, one of the most relevant efforts to understand earthquake hazard was the Global Seismic
Hazard Assessment Program (GSHAP – Giardini et al, 1999), which combined several national and regional models to
produce the first global hazard map of peak ground acceleration for a return period of 475 years on rock. This map has
been one of the main references to illustrate the threat posed by earthquakes globally. More recently, the United
Nations International Strategy for Disaster Risk Reduction (UNISDR) supported the development of the Global
Assessment Report (GAR, 2015) one of the most notable efforts at the global scale to provide uniform average annual
losses for earthquakes. The exposure model developed for the GAR was derived based on a top-down approach, where
national/regional population, socio-economic data and building-type information were used as proxies to estimate the
spatial distribution of building counts (DeBono and Chatenoux 2015). For the hazard component, a fully probabilistic
model was developed using the NEIC-USGS earthquake catalogue and hundreds of seismic sources distributed across
six tectonic regions (Ordaz et al., 2013). This effort employed for the first time a uniform approach for seismic hazard
assessment at the global scale, resulting in sets of conventional hazard curves and earthquake scenarios. These
scenarios were used to estimate annualized average losses and aggregated losses for specific return periods.
Earthquake loss models are comprised of three main components: an exposure model defining the spatial
distribution, replacement cost and vulnerability class of the building stock, a suite of vulnerability/fragility functions to
estimate the likelihood of damage/loss conditioned on a set of ground shaking intensity measure levels, and a
probabilistic seismic hazard analysis (PSHA) model describing the probabilities of exceeding various ground shaking
levels in the region. These components can be introduced in an analysis software to estimate seismic hazard and risk
results. The Global Earthquake Model (GEM) has supported the development of an open-source software for such
analyses, the OpenQuake-engine (Pagani et al. 2014, Silva et al. 2014). This software is capable of producing a number
of relevant hazard and risk results, such as seismic hazard curves and maps, uniform hazard spectra, annualized average
losses, probable maximum losses (for a set of return periods), aggregated loss exceedance curves, event loss tables and
risk maps. This broad set of risk metrics can support decision-makers in the identification of regions that are prone to
higher and more frequent earthquake-induced hazards and losses, to distinguish construction types that have high
vulnerability, and to devise strategies for effective risk mitigation. Despite the evident importance of such results,
earthquake loss models are usually only available for developed nations, and not always accessible to all stakeholders.
Moreover, even when some datasets and models do exist for a particular region, the required capacity to use and
customize these models might not exist, which once again impedes the use of reliable earthquake risk information in
decision-making.
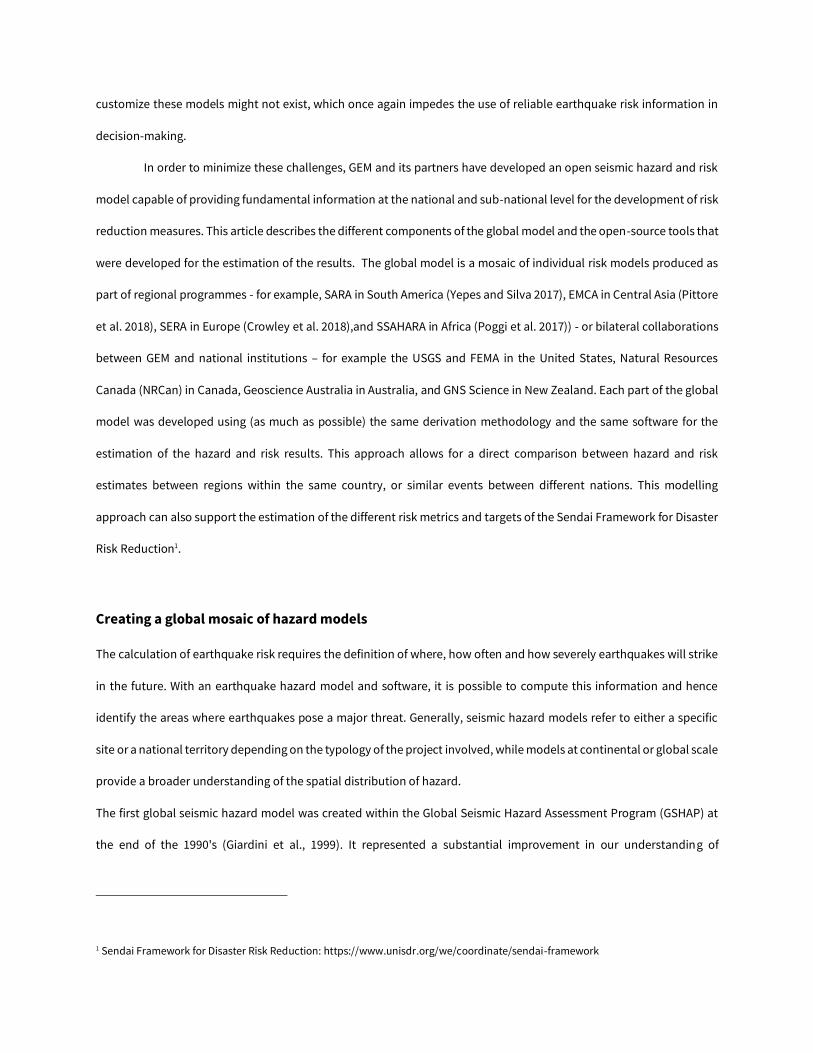
In order to minimize these challenges, GEM and its partners have developed an open seismic hazard and risk
model capable of providing fundamental information at the national and sub-national level for the development of risk
reduction measures. This article describes the different components of the global model and the open-source tools that
were developed for the estimation of the results. The global model is a mosaic of individual risk models produced as
part of regional programmes - for example, SARA in South America (Yepes and Silva 2017), EMCA in Central Asia (Pittore
et al. 2018), SERA in Europe (Crowley et al. 2018),and SSAHARA in Africa (Poggi et al. 2017)) - or bilateral collaborations
between GEM and national institutions – for example the USGS and FEMA in the United States, Natural Resources
Canada (NRCan) in Canada, Geoscience Australia in Australia, and GNS Science in New Zealand. Each part of the global
model was developed using (as much as possible) the same derivation methodology and the same software for the
estimation of the hazard and risk results. This approach allows for a direct comparison between hazard and risk
estimates between regions within the same country, or similar events between different nations. This modelling
approach can also support the estimation of the different risk metrics and targets of the Sendai Framework for Disaster
Risk Reduction1.
Creating a global mosaic of hazard models
The calculation of earthquake risk requires the definition of where, how often and how severely earthquakes will strike
in the future. With an earthquake hazard model and software, it is possible to compute this information and hence
identify the areas where earthquakes pose a major threat. Generally, seismic hazard models refer to either a specific
site or a national territory depending on the typology of the project involved, while models at continental or global scale
provide a broader understanding of the spatial distribution of hazard.
The first global seismic hazard model was created within the Global Seismic Hazard Assessment Program (GSHAP) at
the end of the 1990's (Giardini et al., 1999). It represented a substantial improvement in our understanding of
1 Sendai Framework for Disaster Risk Reduction: https://www.unisdr.org/we/coordinate/sendai-framework

earthquake hazard globally and offered to many countries essential information for the design of buildings and land-
use planning. GSHAP was a collective effort that involved more than a hundred scientists from dozens of countries
globally and encouraged sharing of information, scientific debate and international collaboration. Because of the
nature of the GSHAP project, the resulting gobal hazard model was formed by assembling various newly created
continental and subcontinental models.
Almost twenty years later, GEM in collaboration with hundreds of scientists from more than 50 nations has
released a completely new compilation, called the GEM earthquake hazard mosaic of earthquake hazard models
created either at national or regional (i.e. continental) scale2. This collection of models is homogeneous in the sense
that the format adopted for the description of each model conforms with the one used to describe an input earthquake
hazard model for the OpenQuake-engine. However, the models in the mosaic have different origins and were developed
using diverse methodologies depending on the organisations and the experts involved. Overall, the mosaic contains
regional models for Europe, Middle East, Central Asia, Continental Southeast Asia, Africa, South America, Mexico,
Central America and the Caribbean, Northern Asia and Pacific Islands. In the majority of cases, local scientists either led
the development of the model or collaborated with GEM scientists in its preparation. At a higher resolution, a second
set of models is composed of seismic hazard models developed at a national level by agencies charged with assessing
earthquake hazard for their countries. This set, for example, comprises models for the Arabian Peninsula, Canada,
Indonesia, Philippines, Australia, New Zealand, India, Japan and the United States. While the vast majority of models
were developed either collaboratively within a GEM project or through an official development process at national level,
models for a few remaining areas were developed separately by the GEM Secretariat (e.g., Russia, North Africa).
There are some notable differences between the hazard models created in the GSHAP project and the ones
included in the GEM earthquake hazard mosaic. Overall, recent models are more complicated because they describe
explicitly epistemic uncertainties in the seismic source and ground motion characterisation. Another major step forward
has been in the improved characterization of earthquake faults and the ability to associate the locations of potential
future earthquakes to active fault sources. Thus, in contrast to GSHAP, the potential occurrence of the largest
2 Nature article: https://www.nature.com/articles/d41586-018-07705-2

earthquakes are now associated with specific fault sources, resulting generally in more refined and accurate estimates
of the most significant earthquake hazards (and associated risks).
Figure 2 shows a hazard map depicting the spatial distribution of the values of peak ground acceleration (PGA)
with a 10% probability of exceedance in 50 years. The zones showing the highest values of hazard are along the major
plate boundaries, particularly on the coasts of the Pacific Ocean and within the Alpine-Himalayan deformation belt. It
is worth noting that a substantial majority of the models included in the mosaic were developed using the OpenQuake-
engine. The development of the OpenQuake-engine performed in parallel with the construction of the GEM earthquake
hazard mosaic therefore benefited from the feedback of experts across the world and supported the widespread and
parallel preparation of modern hazard models. The hazard maps were calculated following the classical probabilistic
seismic hazard assessment methodologies (Cornell 1968, McGuire 2004), and the OpenQuake-engine is publicly
available (including the source-code) at Github3.
3 OpenQuake GitHub repository: https://github.com/gem/oq-engine/#openquake-engine

16
Figure 2 – GEM Global seismic hazard map in terms of the peak ground acceleration (PGA) with 10% probability of exceedance in 50 years.

Building a global exposure model
The assessment of earthquake impact requires the availability of a reliable and up-to-date exposure model.
This component of the risk assessment describes the location of the assets, replacement costs, number of occupants
(at different times of the day) and the vulnerability class of each asset. The development of a global exposure model is
arguably one of the most difficult steps in the development of the global risk model due to the lack of data. Even when
some information is available, the fact that the built environment has changed rapidly in some parts of the world (e.g.
South-east Asia, Central America) makes the existing data obsolete. It is also potentially one of the most subjective
components of risk analyses due to the need to complement the limited existing data with judgement from local
experts.
The global risk modelling effort covers three types of building occupancies: residential, commercial and
industrial. The derivation method for residential buildings differs considerably for most of the countries in comparison
with the procedure required for the commercial and industrial building stock, as discussed further in the following
sections.
Modelling the residential building stock
The development of the global residential exposure model relied predominantly on data from the national housing
census of each country. These surveys are usually performed every 10 years at the smallest administrative level, or
according to a regional division defined specifically for the purposes of the housing census (e.g. Mexico, United States,
Canada). The quality of the data collected by each country, unfortunately, varies considerably. In the best-case scenario,
the survey data comprises information concerning the number of buildings, type of structures (e.g. isolated houses,
apartment buildings), main material of construction, material of the roofs, material of the floors, number of stories, year
of construction and even the state of conservation of the building (e.g. Portugal, Costa Rica). For many nations (e.g.
Algeria, Iraq, Zambia, Mali), the survey data is quite limited and only provides information on the type of dwelling and
the main material of the walls (e.g. wood, brick, concrete). In these cases, it is necessary to develop a mapping scheme,
which establishes a relation between the variables used by the national housing census, and the most likely
vulnerability classes. The definition of these mapping schemes is performed using peer-reviewed literature, World
Housing Encyclopedia (WHE) reports, and the judgment of local experts, collected using remote expert surveys or locally

organized workshops. For some countries the mapping schemes had to be derived differently for different areas within
a given region (urban versus rural areas), and in some cases a specific mapping scheme was also developed for a large
city (e.g. Addis Ababa in Ethiopia, Panama City in Panama, Santo Domingo in Dominican Republic) or different levels of
urbanization (e.g. India, Mexico). Alternative approaches were also followed in countries (e.g. Central Asia) where the
housing census is either insufficient or simply not available. In these cases rapid screening activities were performed in
selected locations and integrated by ancillary information derived from satellite imagery and from volunteered
geoinformation (e.g. Pittore and Wieland 2012, Wieland et al. 2015).
It is also worth noting that for a few countries it was not necessary to develop an exposure model based on the
housing census information, due to the availability of datasets with a higher reliability that have been used in natural
hazards risk analyses for many years. This applies to the United States (Jaiswal et al. 2015, FEMA P-366 2017), Canada,
(covered by different versions of the HAZUS software - FEMA 2001), Australia (covered by the NEXIS dataset / Nadimpalli
et al. 2007) and New Zealand. On the other end of the spectrum, there are also countries that simply have no housing
information available (e.g. Democratic Republic of Congo, South Sudan), or have been heavily affected by natural
hazards (e.g. hurricanes, earthquakes) after the completion of the national housing census (e.g. Haiti, Nepal). In these
cases, an alternative approach had to be adopted that leveraged population datasets, satellite imagery and
OpenStreetMap data.
The combination of different sources of exposure information will inevitably lead to a global exposure dataset
that is not uniform in resolution, quality and vintage. Nonetheless, to the maximum extent possible, the same
methodology and taxonomy (see Silva et al. 2017) was used in the generation of the exposure model of each country.
An example of such an outcome is presented in Figure 3 for twelve countries located in the Middle East.

Figure 3. Distribution of the number of residential buildings at the smallest available administrative subdivision
for twelve countries in the Middle East.
3.2 Industrial and commercial building stock
Exposure information regarding non-residential buildings is rarely compiled systematically at a regional or
national scale, as previously presented for the residential counterpart. In the vast majority of cases, one has to rely on
secondary sources of data such as economic census surveys which provide data regarding the number of employees
and various other economic indicators that are related to commercial and industrial structures. The exceptions are once
again the United States and Canada, where the HAZUS dataset does in fact cover detailed estimates of the commercial
and industrial building stock.
The development of the exposure models for non-residential occupancy types relied on three main sources of
datasets: 1) demographic data concerning the work-force across the different sectors (primary, secondary, and services)
or types of businesses (e.g. agriculture, mining, manufacturing, retail, car industry, small shops); 2) data concerning the

number of permits, which may also specify the date, type of business, size of the facility and number of workers; and 3)
large scale datasets that identify regions according to occupancy (e.g. Corine for Europe – Sousa et al. 2017). In addition,
web surveys engaging hundreds of experts to collect missing information (e.g. type of construction per sector, average
area per worker) were used. The combination of these datasets allows the estimation of the average built up area or
number of facilities per occupancy (at the smallest available administrative level), which is then distributed across a
number of vulnerability classes. Figure 4 depicts the number of industrial and commercial facilities at the first
administrative level for 7 countries in Central America.
Figure 4. Distribution of the number of industrial facilities at the first administrative level for sevel countries in
Central America.
It is clear that some of the administrative regions cover extensive areas (e.g. Malaysia, Indonesia), within which
the seismic hazard can vary considerably. For this reason, an additional step is followed to spatially re-distribute the
assets within each area, following a smaller evenly spaced grid (30x30 arcsec). In order to assess the grid points where
buildings are expected to exist, a number of auxiliary datasets are considered such as nighttime lights (Elvidge et al.
2012), WorldPop (www.worldpop.org.uk) and the location of residential and tertiary roads from OpenStreetMap

(www.openstreetmap.org). The evenly spaced exposure dataset can be aggregated following different approaches to
illustrate the distribution of the building stock at the national, regional or global scale. The estimated number of
buildings at the global scale is depicted following a hexagonal grid with 0.30x0.34 decimal degrees in Figure 5.
Unsurprisingly, the resulting global exposure database indicates a large concentration of buildings in South-East Asia,
western Latin America, Central and South Europe and eastern Sub-Saharan Africa. Unfortunately, as presented in Figure
1, these regions also have significant seismic hazard.

16
Figure 5. Global distribution of building count following a hexagonal grid with 0.30x0.34 decimal degrees.
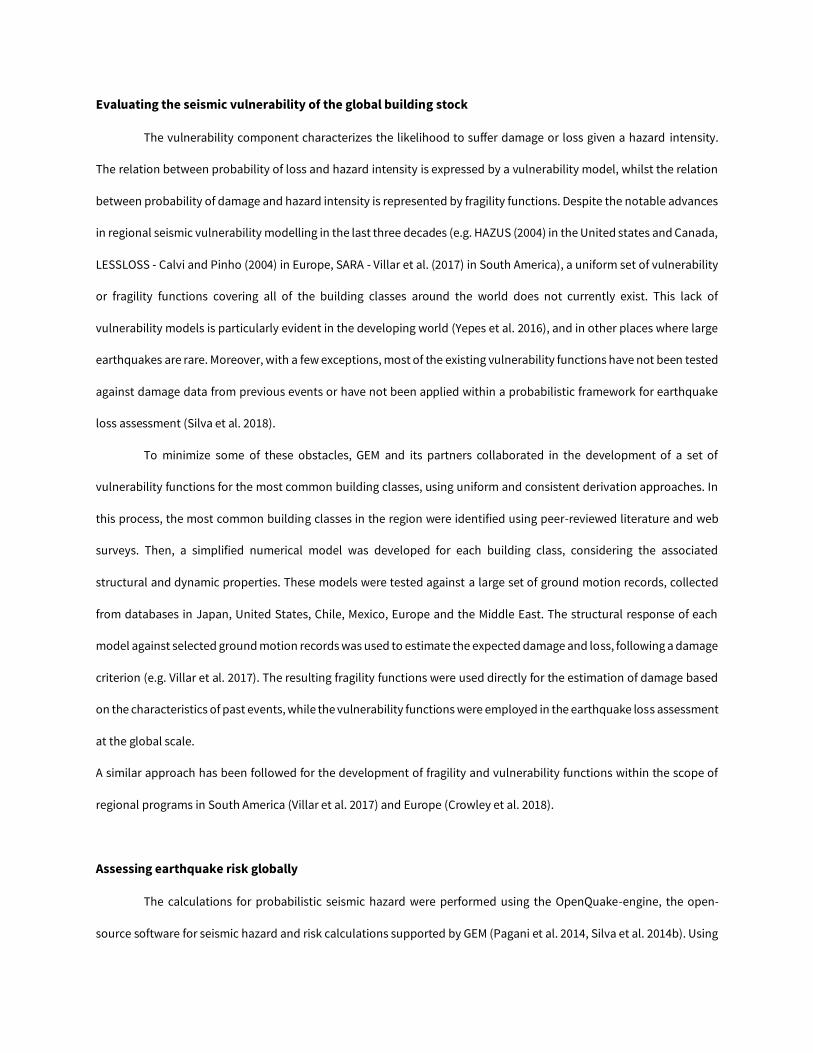
Evaluating the seismic vulnerability of the global building stock
The vulnerability component characterizes the likelihood to suffer damage or loss given a hazard intensity.
The relation between probability of loss and hazard intensity is expressed by a vulnerability model, whilst the relation
between probability of damage and hazard intensity is represented by fragility functions. Despite the notable advances
in regional seismic vulnerability modelling in the last three decades (e.g. HAZUS (2004) in the United states and Canada,
LESSLOSS - Calvi and Pinho (2004) in Europe, SARA - Villar et al. (2017) in South America), a uniform set of vulnerability
or fragility functions covering all of the building classes around the world does not currently exist. This lack of
vulnerability models is particularly evident in the developing world (Yepes et al. 2016), and in other places where large
earthquakes are rare. Moreover, with a few exceptions, most of the existing vulnerability functions have not been tested
against damage data from previous events or have not been applied within a probabilistic framework for earthquake
loss assessment (Silva et al. 2018).
To minimize some of these obstacles, GEM and its partners collaborated in the development of a set of
vulnerability functions for the most common building classes, using uniform and consistent derivation approaches. In
this process, the most common building classes in the region were identified using peer-reviewed literature and web
surveys. Then, a simplified numerical model was developed for each building class, considering the associated
structural and dynamic properties. These models were tested against a large set of ground motion records, collected
from databases in Japan, United States, Chile, Mexico, Europe and the Middle East. The structural response of each
model against selected ground motion records was used to estimate the expected damage and loss, following a damage
criterion (e.g. Villar et al. 2017). The resulting fragility functions were used directly for the estimation of damage based
on the characteristics of past events, while the vulnerability functions were employed in the earthquake loss assessment
at the global scale.
A similar approach has been followed for the development of fragility and vulnerability functions within the scope of
regional programs in South America (Villar et al. 2017) and Europe (Crowley et al. 2018).
Assessing earthquake risk globally
The calculations for probabilistic seismic hazard were performed using the OpenQuake-engine, the open-
source software for seismic hazard and risk calculations supported by GEM (Pagani et al. 2014, Silva et al. 2014b). Using

the seismogenic source model for each region, the OpenQuake-engine can generate several possible realizations of
seismicity conditional on a given interval of time (i.e. stochastic event sets). In this process, several sources of epistemic
uncertainty can be considered using the logic-tree structure (e.g. uncertainty in estimation of maximum magnitude,
seismic zonation boundaries, magnitude-frequency parameters). The number of possible branches can range from a
few dozen (e.g. North and Sub-Saharan Africa – Poggi et al. 2017) to thousands (e.g. India, United States – Fields et al.
2014). Each rupture was used to generate a ground motion field considering the logic tree for ground motion prediction
equations associated with each tectonic environment. Amplification or attenuation effects are accounted for through
the consideration of estimates of shear wave velocity in the top 30 meters of the ground surface (Vs30), which are
available globally through simplified topographic-based empirical models proposed by Wald and Allen (2007).
The ground shaking at the location of each asset is used to calculate the resulting loss ratio using the
associated vulnerability function, considering the uncertainty in the distribution of the loss ratio per intensity measure
level. This loss ratio is multiplied by the estimated replacement cost of the asset to obtain the final economic loss. The
losses per event (across all of the stochastic event sets) can be aggregated to produce an event loss table, indicating the
total loss for each generated event. The average annual loss (AAL) can be obtained by dividing the sum of the annualized
economic losses by the total number of 1-year stochastic event sets. Additional information concerning the procedure
for the calculation of the earthquake losses following the event-based approach can be found in Silva (2017).
The global risk results are presented in Figure 6 following an hexagonal grid with a spatial resolution of
0.30x0.34 decimal degrees (approximately 1000 km2 at the Ecuador). In this map, the average annual losses have been
normalized by the construction cost of each country, in order to avoid an over-representation of the countries with high
construction costs.

16
Figure 6. Global seismic risk in terms of average annual losses normalized by the average construction cost of each country, following a hexagonal grid
with 0.30x0.34 decimal degrees.

17
This first version of the Global Earthquake Model indicates an average annual loss of over 45 billion USD per year,
which is approximately equivalent to the annual gross domestic product of countries such as Slovenia or
Guatemala, and about 4 times higher than the total investment in disaster risk reduction from international
organizations (e.g. Japanese International Cooperation Agency, World Bank, European Union) in the last 20 years.
The top 15 countries in terms of economic losses contribute to 80% of the global average annual loss. The
residential building stock contributes 64% of the total annual loss, while commercial and industrial buildings
represent 22% and 14% of the losses, respectively. Japan, China (including Taiwan), the United States of America,
Turkey and Italy lead the ranking, mostly due to the high economic value of the building stock in those countries,
as presented in Figure 7.
Figure 7. Top 15 countries in terms of average annual economic losses (in billion USD).
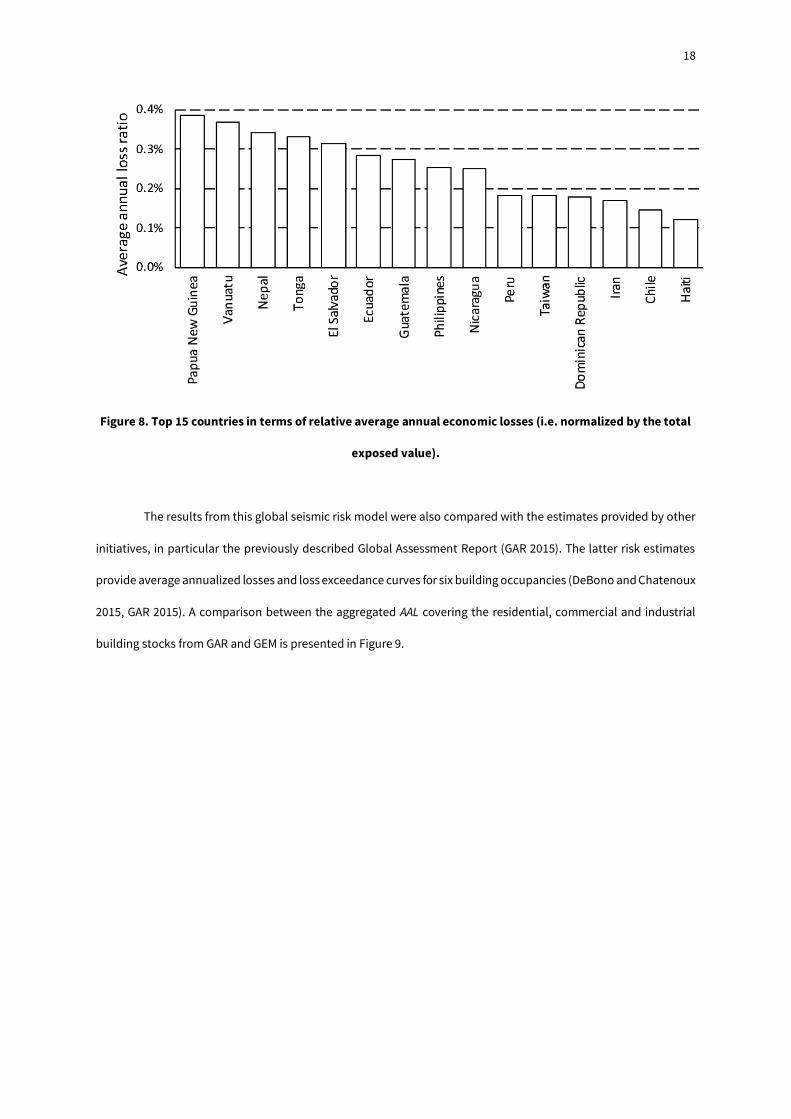
The evaluation of the earthquake risk in terms of absolute economic losses can be misleading, as poor or
lesser populated countries with vulnerable structures have annual losses several orders of magnitude below
nations such as Japan, United States or China. It is thus useful to normalise the average annual losses based on the
total exposed value. This metric is called the average annual loss ratio and, accordingly, the top 15 countries are
depicted in Figure 8. Unsurprisingly, this list is led by countries with a history of large disastrous events (e.g. 2001
M7.7 El Salvador, 2007 M8.0 Peru, 2015 M7.8 Nepal), with poor construction practices, and with high seismic hazard
(see Figure 1).
18
Figure 8. Top 15 countries in terms of relative average annual economic losses (i.e. normalized by the total
exposed value).
The results from this global seismic risk model were also compared with the estimates provided by other
initiatives, in particular the previously described Global Assessment Report (GAR 2015). The latter risk estimates
provide average annualized losses and loss exceedance curves for six building occupancies (DeBono and Chatenoux
2015, GAR 2015). A comparison between the aggregated AAL covering the residential, commercial and industrial
building stocks from GAR and GEM is presented in Figure 9.

19
Figure 9. Comparison between the AAL provided by GAR and GEM.
Although there is an evident agreement in the trend of the risk estimates from both studies, the results
from GEM are on average below the ones presented by GAR by approximately a factor of 2. Globally, GAR indicates
an average annual loss due to ground shaking of about 100B USD, while in this study a value of approximately 45B
USD was obtained. The identification of the causes for these discrepancies is a rather complex process, since as
described in the preceding sections, the methodology to develop the main components (seismic hazard, exposure
and vulnerability) of GAR was considerably different from the methodology adopted by GEM and its partners.
Final remarks
The Global Earthquake Model results from nearly a decade of work by more than 100 collaborators
worldwide and represents a major step forward in earthquake hazard and risk assessment compiled with global
coverage. The Global Earthquake Model is in fact a mosaic of models developed at regional to national scales. Most
of the models were developed using the open source hazard and risk analysis software, OpenQuake; the remainder
were translated into OpenQuake in order to allow researchers from around the world to compare and contrast
0.001
0.1
10
1000
100000
0.001 0.1 10 1000 100000
AA
L fr
om G
AR
(M
USD
)
AAL from this study (M USD)
Japan
Nepal
Eritrea
Trinidad and Tobago
Gibraltar

20
assumptions and methods within a common analysis platform. This collaborative process also results in hazard
and risk models that are more likely to be accepted, trusted and used by risk managers, planners and risk reduction
practitioners.
The Global Earthquake Model will initially be made available under an open license CC BY-NC-SA4 which
lets others modify and build upon the work for non-commercial applications, as long as credit is given and new
creations are licensed under identical terms. The global risk map identifies areas of high seismic risk at present, but
the underlying earthquake risk model has also been designed so that others may update it with new hazard,
vulnerability and exposure information. In so doing, trends in future risk may be identified, and cost-effective
solutions may be developed to mitigate and reduce earthquake risk globally.
The application of uniform datasets, methodologies, and tools for the assessment of the seismic hazard
and risk allows a just and unbiased comparison of the risk between countries, or regions within a particular nation.
For example, depicts the top 15 countries in terms of average annual economic losses. Such comparison is helpful
to understand the relative risk between different countries. Additional results regarding the global seismic hazard
and risk results can be explored at https://www.globalquakemodel.org/gem.
The global earthquake model has been developed for application to a wide range of decision making
applications, including: insurance and risk financing for international companies and reinsurance companies with
globally distributed portolios; international disaster response planning by the UN and INGOs; and risk monitoring
for the Sendai Framework for Disaster Risk Reduction. The regional to national hazard and risk models can form
the bases for many government risk reduction actions, including: improvement or review of seismic building
regulations; post-disaster contingency risk financing such as through catastrophe bonds or insurance pools;
prioritization of exposed populations, buildings and infrastructure, or geographic areas where further work should
be done to mitigate or reduce risk. The Global Earthquake Model provides one of the most complete and
transparent assessment of earthquake risk created to date on a global scale. It is an open and freely available
resource for risk assessment experts, disaster risk management practitioners and the public to use in order to better
understand, commit to and reduce earthquake risk globally. The completion of the Global earthquake model fulfills
a major commitment of the sponsors and partners of the GEM Foundation toward its vision for a world resilient to
4 https://creativecommons.org/licenses/by-sa/4.0/

21
earthquakes. To that end, GEM, as a global community of researchers and risk management practitioners, is
committed to its application, maintenance and continuous improvement.

22
References
Calvi GM, Pinho R (2004). LESSLOSS - a European integrated project on risk mitigation for earthquakes and
landslides. IUSS Press, Pavia.
Crowley H, Rodrigues D, Silva V, Despotaki V, Romao X, Castro M, Akkar S, Hancilar U, Pitilakis K, Pitilakis D, Belvaux
M, Wiemar S, Danciu L, Correia A, Bursi O, Wenzel M (2018). Towards a Uniform Earthquake Risk Model for
Europe. 16th European Conference on Earthquake Engineering. Thessaloniki, Greece.
Cornell, C. A. (1968). Engineering seismic risk analysis. Bulletin of the Seismological Society of America, 58, 1583-
1606.
DeBono A, Chatenoux B (2015). Global Exposure Model for GAR 2015, UNEP/Grid-Geneva; UNISDR: Geneva,
Switzerland.
Elvidge CD, Baugh KE, Anderson SJ, Sutton PC, Ghosh T (2012). The Night Light Development Index (NLDI): A
spatially explicit measure of human development from satellite data. Social Geography, 7(1), pp.23–35.
Federal Emergency Management Agency - FEMA (2001). Hazus99 Estimated Annualized Earthquake Losses for the
United States, Federal Emergency Management Agency Mitigation Directorate, FEMA 366, Washington, D.C.
Federal Emergency Management Agency - FEMA P-366 (2017) Hazus®MH Estimated Annualized Earthquake Losses
for the United States, available at- https://www.fema.gov/media-library-data/1497362829336.../FEMAP-
366_2017.pdf
GAR (2015). UNISDR Global Assessment Report accessed on 18/02/19:
www.preventionweb.net/english/hyogo/gar/2015
Giardini, D, Grunthal, G, Shedlock, KM, Zhang, P (1999). The GSHAP Global Seismic Hazard Map. Ann. Geophys, 42,
https://doi.org/10.4401/ag-3784.
Jaiswal K, Bausch D, Chen R, Bouabid J, Seligson H (2015). Estimating Annualized Earthquake Losses for the
Conterminous United States. Earthquake Spectra: December 2015, Vol. 31, No. S1, pp. S221-S243.
Jaiswal K, Wald D (2010). Development of a semi-empirical loss model within the USGS Prompt Assessment of
Global Earthquakes for Response (PAGER) System. Proceedings of the 9th US and 10th Canadian Conference
on Earthquake Engineering, Toronto, Canada.
Jayaram N, Baker J (2010). Efficient sampling and data reduction techniques for probabilistic seismic lifeline risk
assessment, Earthquake Engineering and Structural Dynamics, 39(10):1109-1131.

23
Kellett J, Caravani A (2013). Financing Disaster Risk Reduction: A 20-year story of international aid, a joint report of
the Global Facility for Disaster Reduction and Recovery (GFDRR) at the World Bank and the Overseas
Development Institute (ODI).
Martins L, Silva V (2018). A Global Database of Vulnerability Models for Seismic Risk Assessment, in Proceeding of
the 16th European Conference on Earthquake Engineering, Thessaloniki, Greece.
McGuire, R. R. (2004). Seismic hazard and risk analysis. Earthquake Engineering Research Institute Publication No.
MNO-10, Second monograph series.
McKenna F, Fenves G, Scott M, Jeremic B (2000). Open System for Earthquake Engineering Simulation (OpenSees).
Berkeley, CA: Pacific Earthquake Engineering Research Center, University of California.
Nadimpalli, K., Edwards, M. and Mullaly, D. 2007. National Exposure Information System (NEXIS) for Australia: Risk
Assessment Opportunities. In: Oxley, L. and Kulasiri, D. (eds.) MODSIM 2007: International Congress on
Modelling and Simulation. Modelling and Simulation Society of Australia and New Zealand.
Pagani M, Hao K, Fujiwara H, Gerstenberger M, Ma K (2016). Appraising the PSHA Earthquake Source Models of
Japan, New Zealand, and Taiwan, Seismological Research Letters, Volume 87, Number 6
Pagani M, Monelli D, Weatherill G, Danciu L, Crowley H, Silva V, Henshaw P, Butler L, Nastasi M, Panzeri, L, Simionato
M, Vigano D (2014). OpenQuake Engine: An open hazard (and risk) software for the Global Earthquake Model,
Seismological Research Letters, 85(3):692-702.
Pittore M, Wieland M (2012). Toward a rapid probabilistic seismic vulnerability assessment using satellite and
ground-based remote sensing, Natural Hazards.
Pittore M, Fleming K, Silva V, Moldobekov B (2018). Seismic Risk in Central Asia, Outcomes of the EMCA project,
Proceeding of the 16th European Conference on Earthquake Engineering, Thessaloniki, Greece.
Poggi V, Durrheim R, Tuluka G, Weatherill G, Gee R, Pagani M, Nyblade A, Delvaux D (2017). Assessing Seismic Hazard
of the East African Rift: a pilot study from GEM and AfricaArray. Bulleting of Earthquake Engineering.
Porter K, Field E, Milner K (2017). Trimming a Hazard Logic Tree with a New Model-Order-Reduction Technique,
Earthquake Spectra, Vol. 33, No. 3, pp. 857-874.
Silva V (2017). Critical Issues on Probabilistic Earthquake Loss Assessment. Journal of Earthquake Engineering,
http://dx.doi.org/10.1080/13632469.2017.1297264
Silva V, Crowley H, Pinho R, Varum H, Sousa R (2014a). Evaluation of analytical methodologies to derive vulnerability
functions”. Earthquake Engineering and Structural Dynamics, 43(2):181-204.

24
Silva V, Crowley H, Pagani M, Monelli D, Pinho R (2014b). Development of the OpenQuake engine, the Global
Earthquake Model’s open-source software for seismic risk assessment. Natural Hazards, 72(3):1409-1427.
Silva V, Yepes-Estrada C, Dabbeek J, Martins L, Tiziana R, Verruci E (2017). GED4ALL - Global Exposure Database for
Multi-Hazard Risk Analysis - Inception Report. GEM Technical Report 2017-01, GEM Foundation, Pavia, Italy.
Sousa L, Silva V, Bazzurro P (2017). Using open-access data in the development of exposure datasets of industrial
buildings for earthquake risk modelling. Earthquake Spectra, 33(1): 63-84.
Villar-Vega M, Silva V, Crowley H, Yepes C, Tarque N, Acevedo A, Hube M, Santa María H, Coronel G (2016).
Development of a Fragility Model for the Residential Building Stock in South America, Earthquake Spectra.
Wieland et al., (2015). A Multiscale Exposure Model for Seismic Risk Assessment in Central Asia, Seismological
Research Letters, 86,(1):210–222.
Yepes C, Silva V, D’Ayala D, Rossetto T, Ioannou I, Meslen A, Crowley H (2016). The Global Earthquake Model Physical
Vulnerability Database. Earthquake Spectra, 32(4):2567-2585.
Yepes C, Silva V (2017). Probabilistic Seismic Risk Assessment of the Residential Building Stock in South America.
Proceedings of 16th World Conference on Earthquake Engineering, Santiago, Chile.