Embed Size (px)
Citation preview

The University of MaineDigitalCommons@UMaine
Electronic Theses and Dissertations Fogler Library
Spring 5-10-2019
Assessing Quantitative Reasoning in a Ninth GradeScience Class Using Interdisciplinary Data StoryAssignmentsBryn W. KeenholdUniversity of Maine, [email protected]
Follow this and additional works at: https://digitalcommons.library.umaine.edu/etd
Part of the Science and Mathematics Education Commons, and the Secondary EducationCommons
This Open-Access Thesis is brought to you for free and open access by DigitalCommons@UMaine. It has been accepted for inclusion in ElectronicTheses and Dissertations by an authorized administrator of DigitalCommons@UMaine. For more information, please [email protected].
Recommended CitationKeenhold, Bryn W., "Assessing Quantitative Reasoning in a Ninth Grade Science Class Using Interdisciplinary Data StoryAssignments" (2019). Electronic Theses and Dissertations. 2963.https://digitalcommons.library.umaine.edu/etd/2963

ASSESSING QUANTITATIVE REASONING IN A NINTH GRADE
SCIENCE CLASS USING INTERDISCIPLINARY
DATA STORY ASSIGNMENTS
By
Bryn W. Keenhold
B.S. St. Lawrence University, 2014
A THESIS
Submitted in Partial Fulfillment of the
Requirements for the Degree of
Master of Science in Teaching
The Graduate School
The University of Maine
May 2019
Advisory Committee:
Franziska Peterson, Assistant Professor of Mathematics, Co-advisor
Molly Schauffler, Assistant Professor of Earth and Climate Sciences, Co-advisor
Asli Sezen-Barrie, Assistant Professor of Curriculum, Assessment and Instruction

ii
Copyright 2019 Bryn W. Keenhold

ASSESSING QUANTITATIVE REASONING IN A NINTH GRADE
SCIENCE CLASS USING INTERDISCIPLINARY
DATA STORY ASSIGNMENTS
By Bryn W. Keenhold
Thesis Advisors: Dr. Franziska Peterson and Dr. Molly Schauffler
An Abstract of the Thesis Presented
in Partial Fulfillment of the Requirements for the Degree of Master of Science in Teaching
May 2019
In a data-driven world, it is necessary that students graduate from high school
quantitatively literate, with the ability to interpret quantities within a context to make
informed decisions for their lives. A critical component of science learning is developing
the ability to make sense of data, critically evaluate it, and effectively communicate
scientific ideas. The purpose of this study is two-fold: 1) to investigate how 9th grade
students in an Earth Science class use quantitative reasoning (QR) skills when
constructing evidence-based scientific explanations during Data Story assignments and 2)
to provide teachers with supports to incorporate Data Stories into their curriculum. A
Data Story is an interdisciplinary, scaffolded written argumentation assignment that
requires students to analyze authentic, real-world scientific data and draw their own
conclusions. In doing so, students integrate several discrete skills to synthesize an
argument that is supported by evidence.
Quantitative and qualitative results were used to investigate affordances and
challenges students face when constructing a Data Story, what QR skills they use in the
process, and what aspects of QR are challenging for them. Two evidence-based learning
progressions provided the foundation for the development of two rubrics to score the

student Data Stories quantitatively. Four student interviews analyzed using Grounded
Theory provided qualitative insight into the role of QR in evidence-based explanations.
Results suggest students enjoyed the Data Story assignments, which exposed
them to a range of graph-types and data literacy skills. However, students seemed to
struggle to develop appropriate evidence to support a claim in the Claim-Evidence-
Reasoning (CER) framework and may need additional supports in this area. Further
analysis with the QR Rubric and student interviews revealed some aspects of QR that
may be hindering science learning and the development of evidence-based reasoning
including: 1) not reasoning about variables in the context of a dataset 2) looking only for
a correlation or difference and 3) not using quantitative language. These are aspects
teachers should consider when implementing Data Story assignments in their own
classrooms as a way to enhance students’ abilities in developing appropriate evidence to
support a claim.

iii
ACKNOWLEDGEMENTS
First, I would like to thank my committee members: Dr. Franziska Peterson, Dr.
Molly Schauffler, and Dr. Asli Sezen-Barrie. Thank you for the thoughtful conversations
and time you have put into this project. Most of all, thank you making this whole
experience fun and rewarding.
I am especially grateful to the 9th grade Earth Science teacher who took time out
of her busy day to coordinate with me, answer questions, and provide me with the data
for this project. This project would not have been possible without her immense
contributions.
Finally, I would like to thank my friends at the RiSE Center and around the
University of Maine, all of who I shared “free time” with in Orono, playing, chatting and
exploring. A special thank you to the ones who saw it all and offered love, support and
lots of hugs, Greg and Nala.

iv
TABLE OF CONTENTS
ACKNOWLEDGEMENTS ............................................................................................... iii LIST OF TABLES .............................................................................................................. ix LIST OF FIGURES ............................................................................................................. x LIST OF ABBREVIATIONS ............................................................................................ xi Chapter 1. INTRODUCTION ....................................................................................................... 1
Importance of Quantitative Reasoning ...................................................................... 1
Importance of Constructing Evidence-based Explanations ....................................... 3
Data Story Assignments as an Effective Learning Strategy ...................................... 4
2. LITERATURE REVIEW ............................................................................................ 8
Instructional Context .................................................................................................. 8
Science Education Reform .............................................................................. 8
Epistemic Practices in the NGSS ................................................................... 10
Roots of Epistemic Practices/Constructivism ....................................... 11 Theory of Learning Progressions .......................................................... 13
Framework for Epistemic Practices .......................................................................... 17 Framework for Constructing Evidence-based Explanations ......................... 17
Student Challenges Associated with CER ............................................. 22
Framework for Quantitative Reasoning ........................................................ 24
Student Challenges Associated with QR ............................................... 29
Goals for this Study .................................................................................................. 30
v
3. METHODS ................................................................................................................ 32
Overview .............................................................................................................. 32 The Data Story Assignment ........................................................................... 33
Data Story 1 ........................................................................................... 36 Data Story 2 ........................................................................................... 37
Data Collection ........................................................................................................ 38
Student Data Stories ...................................................................................... 38
Rubric Development .............................................................................. 39
Development of the CER Rubric for 9th Grade Data Story
Assignments ................................................................................... 40
Development of the QR Rubric for 9th Grade Data Story
Assignments ................................................................................... 42
Scoring Student Data Stories ................................................................. 44
Scoring Example (Jett) .............................................................. 44 CER Rubric Scores for Jett .............................................. 45
QR Rubric Scores for Jett ................................................. 45
Scoring Examples 2 and 3 (Alex and Emma) ............................. 46
CER Rubric Scores (Alex and Emma) ............................. 48
QR Rubric Scores (Alex and Emma) ............................... 48
Interviews ...................................................................................................... 49
Student Interviews ................................................................................. 50
Selection of Student Interviewees ................................................. 51
Teacher Interview .................................................................................. 51

vi
Data Analysis ........................................................................................................... 52
Data Story Rubrics (Quantitative Analysis) .................................................. 52 Interviews (Qualitative Analysis) .................................................................. 53
4. RESULTS .................................................................................................................. 56
Research Question 1: Affordances and Challenges to Constructing Data Stories .............................................................................................................. 56
Student Feelings Towards Data Story Assignments ...................................... 56
Student CER Rubric Performance Results for Data Story 1 and
Data Story 2 ................................................................................................... 58
Results for Claim ........................................................................................... 58
Results for Evidence .............................................................................. 59 Results for Reasoning ............................................................................ 61 Student Performance in Meeting the Expectation for CER .................. 62
Research Question 2: QR Skills Used in Constructing Data Stories ....................... 63 QR Rubric Development ............................................................................... 63 Elements of the QR Rubric ............................................................................ 66
Research Question 3: Affordances and Challenges of Using QR while Constructing Data Stories ........................................................................................ 69
QR Rubric Results ......................................................................................... 69
Results for Variable ............................................................................... 70 Results for Manipulation ....................................................................... 70 Results for Variation ............................................................................. 71 Results for Interpretation ...................................................................... 72 Student Performance in Meeting the Expectation for QR ..................... 72

vii
Interview Results ........................................................................................... 73
How Students Approached a Data Story ............................................... 74
Contextualized Variables First ...................................................... 75 Explored Variables First ................................................................ 76
Mindset About Data and What Makes a Valid Data Story? .................. 77
There Must be a Correlation or Clear Difference .......................... 78
Data Should Fit a Mold Already in Mind ...................................... 80
Use of Quantitative Values and Reasoning ........................................... 87
Summary of Key Results ......................................................................................... 91
Research Question 1 ...................................................................................... 92 Research Question 2 ...................................................................................... 92
Research Question 3 ...................................................................................... 93
5. DISCUSSION AND IMPLICATIONS ..................................................................... 94
Supporting Students in the Classroom ..................................................................... 96 Pedagogical Approaches to Data Story Assignments .................................... 98
Pay Attention to How Students Approach a Data Story ....................... 99 Are Students Approaching Data and Data Stories with an Open-Mind for Unexpected Outcomes? .............................................. 102 Encourage Students to Use Quantitative Language ............................ 104
Limitations and Directions for Future Research .................................................... 107
Conclusion ............................................................................................................. 108
REFERENCES ................................................................................................................ 110 ‘
viii
APPENDICES ................................................................................................................. 117 Appendix A. Progress Map for Counting and Ordering Learning Progression ............................................................................................. 117 Appendix B. Data Story 1 Assignment ................................................................. 118 Appendix C. Data Story 2 Assignment ................................................................. 119 Appendix D. Student Interview Protocol .............................................................. 120 Appendix E. Teacher Interview Protocol .............................................................. 122 Appendix F. Rubric Codebook .............................................................................. 124
BIOGRAPHY OF THE AUTHOR ................................................................................. 126

ix
LIST OF TABLES
Table 2.1. Comparison of Reasoning frameworks ........................................................ 19
Table 2.2. Quantitative Reasoning Learning Progression (Mayes et al., 2014) ............ 26
Table 3.1. Comparison of Data Story 1 and Data Story 2 ............................................. 36
Table 3.2. CER Rubric for 9th Grade Data Story Assignments ..................................... 41
Table 3.3. Quantitative Reasoning Rubric for 9th Grade Data Story Assignments ....... 43
Table 3.4. Rubric scores for Jett (Figure 3.4) ................................................................ 45
Table 3.5. Rubric scores for Figures 3.5 and 3.6: Alex and Emma ............................... 48
Table 3.6. Example of in vivo coding process ............................................................... 55
Table 4.1. Student Claim score examples ...................................................................... 59
Table 4.2. Student CER rubric performance results consolidated into Meets
and Does Not Meet (the expectations) for Data Story 1 (DS1) and Data Story 2 (DS2) ....................................................................................... 62
Table 4.3. Student QR rubric performance results consolidated into Meets
and Does Not Meet (the expectations) for Data Story 1 (DS1) and Data Story 2 (DS2) ....................................................................................... 73
Table 4.4. Interviewed student rubric performance scores for Data Story 1 (DS1)
and Data Story 2 (DS2) ................................................................................ 74 Table F.1. Rubric codebook ......................................................................................... 124

x
LIST OF FIGURES
Figure 2.1. Learning progression for the skill of argumentation (Berland & McNeill, 2010) .......................................................................... 20 Figure 3.1. Visual model of methods .............................................................................. 33
Figure 3.2. Example Tuvalabs.com interface ................................................................. 35
Figure 3.3. Graph Choice Chart (Webber et al., 2014) ................................................... 37
Figure 3.4 Student Data Story example 1 (Jett) ............................................................. 44
Figure 3.5 Student Data Story example 2 (Alex) ........................................................... 46
Figure 3.6 Student Data Story example 3 (Emma) ........................................................ 47
Figure 4.1 Student CER rubric performance results for Data Story 1 (DS1) and Data Story 2 (DS2) ............................................................................... 58
Figure 4.2 Example boxplot of monthly average temperature between
Bangor, ME and Sand Diego, CA ................................................................ 67 Figure 4.3 Student QR rubric performance results for Data Story 1 (DS1)
and Data Story 2 (DS2) ................................................................................ 69 Figure 4.4 Weather balloon graph constructed by Elliot ............................................... 81
Figure 4.5 Weather balloon graph constructed by Kyah ............................................... 82
Figure 4.6 Weather balloon graph constructed by Ann ................................................. 84
Figure 4.7 Weather balloon graph constructed by Jett ................................................... 86
Figure 5.1 Hypothetical graph example ....................................................................... 101
Figure 5.2 Example Data Story graph: Change in sea surface temperatures since 1840 ................................................................................................... 106
Figure 5.3 Summary of QR components necessary to develop a strong
evidence-based explanation ........................................................................ 109 Figure A.1. Sample learning progression: Counting and ordering (Curriculum Corporation, 1997) ...................................................................................... 117

xi
LIST OF ABBREVIATIONS
CER Claim Evidence Reasoning
DS1 Data Story 1
DS2 Data Story 2
QR Quantitative Reasoning

1
CHAPTER 1
INTRODUCTION
In an emerging world where data are increasingly available and relied upon, it is
crucial that students not only understand how data are collected, but how data are being
used and what they can tell us (Wolff & Kortuem, 2015). Students should graduate from
high school with the skills needed to validate others’ claims and develop their own
evidence-based explanations.
However, teachers are facing a lack of research and literature on practical advice
for incorporating and scaffolding this type of thinking into their curricula (Frykholm &
Glasson, 2005). An example for practical advice are Data Story assignments. Data Stories
are a learning strategy developed by the Maine Data Literacy Project, in which students
are asked to interpret a dataset in the context of a question, make a claim, and write a
short discussion of the data. The implementation of these assignments may help to bridge
the gap between mathematics and science, and support students in developing necessary
21st century reasoning skills.
Importance of Quantitative Reasoning
As noted in Steen (2004) “personal success in the new information economy
requires a new set of problem-solving and behavioural skills that emphasize the flexible
application of reasoning abilities” (p. 9). Quantitative Reasoning (QR) skills give citizens
the necessary reasoning and problem-solving abilities to be successful in the 21st century.
QR has many definitions including but not limited to numeracy, number sense, deductive
reasoning, mathematical literacy, quantitative literacy, problem solving, contextualized
2
mathematics, mathematical modeling and quantitative reasoning (Mayes, Peterson, &
Bonilla, 2013).
While there are many definitions quantitative reasoning ultimately, it can be
defined as the application of basic mathematics and statistics to solve problems within a
disciplinary context (Elrod, 2014). Whereas traditional mathematics is typically abstract,
rises above the context and is generally only used in professional settings, QR is a
practical, robust habit of mind, is deeply rooted in the context and is essential for all
graduates’ personal and civic responsibilities (Elrod, 2014). QR skills give citizens the
tools they need to independent, informed choices at home, in the workplace, and on
complicated national and international issues, including but not limited to: health
insurance, governmental policy decisions and debates, sports statistics, investments,
and/or budgets (Madison & Steen, 2003; Steen, 2001, 2004). Having the ability to reason
with numbers and statistics has always been important, but data have not always been as
prevalent and used in argumentation for change as they are now (Orrill, 2003).
While the typical response to the increasing demand for QR skills may be to
increase the rigor of mathematics classes in high school, Steen (2001) argues that even
those who have studied calculus remain ignorant of what to do with data and find
themselves unable to comprehend or articulate their (or other’s) findings. “As it turns out,
it is not calculus but numeracy [quantitative reasoning] that is the key to understanding
our data-drenched society” (Steen, 2001, p. 2). Unfortunately, the skills that lead citizens
to make sound, justifiable decisions do not exist in many curricula in high-schools, rather,
students are left understanding complex mathematics but do not have enough basic
mathematics literacy to make a decent living; students have too much of the wrong kind

3
of mathematics (Carnevale & Desrochers, 2003; Orrill, 2003). As such, the National
Council of Teachers of Mathematics (NCTM) (2000) and the American Association of
Colleges and Universities (2010) have called for a greater presence of QR throughout K-
16 education.
The United States ranked below average in mathematics compared to 65 nations
across the globe in the 2015 OECD Program for International Student Assessment (PISA)
(OECD Mathematics performance (PISA) (indicator), 2015). This assessment compares
15 year-old students from 65 countries in mathematics, science and reading every three
years (OCED, 2015). In the 2015 survey, researchers noted that American students did
poorly on mathematical tasks that required higher cognitive thinking, such as taking real-
world situation, translating them into mathematical terms, and interpreting mathematical
aspects in real-world problems (OCED, 2015). Similarly, Whitacre and Saul (2016)
found that sense-making in reading authentic science-graphs was limited. They
concluded that even though these students had learned how to “do school,” they were
unable to critically engage in real-world science. This demonstrates the need to include
more context-dependent, interdisciplinary and applicable mathematics into curriculum for
a more holistic education. One way to do this is through the manipulation, analysis and
interpretation of authentic science data.
Importance of Constructing Evidence-based Explanations
The ability to construct an explanation is the heart of a science education: “the
goal of science is to construct explanations for the causes of phenomena” (National
Research Council, 2012, p. 52). When students are asked to construct explanations in
school they gain a deeper understanding of scientific concepts, are able to generate their
4
own scientific evidence, have an opportunity to explain natural phenomena, and are
invited to participate in science writing and talk (National Research Council, 2008).
Explaining how evidence supports an argument or claim allows students to change their
thinking about science from memorization into practice, so they can construct and justify
their own science knowledge, as well as change or refine their image of what science is
(Bell & Linn, 2000; Berland & McNeill, 2010). Stated by McNeill & Krajcik (2012)
“creating a scientific explanation requires students to really think and reason about a
phenomenon” (p. 8).
It is essential that students are trained in the skills of criticizing and reasoning
with science ideas, data, and evidence by summarizing their results and creating their
own scientific evidence-supported explanation, rather than simply being taught
memorization of pre-established facts. If students lack critical reasoning skills, they are
forced to accept ideas they think sound the most plausible or come from those who they
believe to be the most reputable (Berland & McNeill, 2010). This is not scientific
literacy.
Developing the ability to create scientific explanations can also help to set
students up to be logically-minded adults. As students develop scientific explanations,
they are given practice in tracing logical connections between ideas and evidence, which
is a necessary twenty-first-century skill (McNeill & Krajcik, 2012; National Research
Council, 2008)
Data Story Assignments as an Effective Learning Strategy
A Data Story assignment is a scaffolded written argumentation assignment
developed by the Maine Data Literacy Project as a way to help students interpret

5
authentic data in terms of real world contexts. The idea of scaffolding data skills and Data
Stories arose out of the 2010-2015 work of the Maine Data Literacy Project, a five-year
project undertaken at the University of Maine Center for Research in STEM Education
and the Schoodic Institute, funded by the USDOE Title II Math-Science Partnership
Grant Program, “Data Literacy” and the Davis Family Foundation. In creating Data
Stories, students begin with a (usually provided) set of data (or a selection of datasets to
choose from). Ultimately, they frame a question that can be asked of the data, decide how
best to graph the data as evidence, then, based on their graph, make a claim in response to
the question, and back the claim up by explaining what aspects of the graph support their
claim.
The Data Story assignment can be adapted to provide more or less scaffolding for
students at different stages of the analysis. For example, in addition to the dataset,
students can be given a specific question from the teacher to investigate. The end goal is
for students to progress to a level of independence where they have the skills to frame a
clear question that is answerable with data, decide which data to graph for evidence, how
best to graph it, what claim or claims can be made according to patterns in the data, and
explain how the evidence they constructed supports (or refutes) the claim.
Key to a Data Story assignment is the assumption that a set of data usually has
more than one, if not many, “stories” that can arise from the data, and that there is often
more than one way to communicate data as evidence. Data Story assignments give
students opportunity (with more or fewer constraints, as needed) to pull together evidence
and construct a succinct argument, or Data Story, that they can own. Students may
communicate their findings through a one-page written report, a presentation with one or

6
two slides, or a poster, or by defending their story in group discussion -- all typical forms
of communication used in the scientific community.
Data Stories encourage students to use real-life and authentic data sets, which
provides context to problems and helps to create relevance for the students, a strategy that
has been widely shown to increase student engagement (Carter, Noble, Russel, &
Swanson, 2011; DeLuca & Lari, 2011; Erwin, 2015; Garfield & Ben-Zvi, 2009; McNeill,
2009; Neumann, Hood, & Neumann, 2013). Many students are not motivated to engage
with the typical school statistical data sets, as they are “artificial” (e.g. hypothetical or
simulated data), and irrelevant (Erwin, 2015; Neumann et al., 2013). By using authentic
data sets, students are able move beyond the idea that they are just doing a practice
activity, and are actually able to accomplish thoughtful, intellectual, statistical work
(Erwin, 2015).
Data Stories introduce academic discourse in a way that allows students to make
connections to their own experiences and their own science, a strategy promoted by
McNeill (2011) and Varelas, Pappas, Kane, & Arsenault (2007). While students create
Data Stories they are required to: ask questions and define problems about their chosen
data set (NGSS Science Practice (NGSS SP) 1), develop a graph that represents their data
(NGSS SP 2), plan an investigation of the data and carry it out (NGSS SP 3), analyze
their graph and interpret the meaning from if (NGSS SP 4), use mathematics and/or
computational thinking to find relationships in their data (NGSS SP 5), construct an
explanation of what they have discovered (NGSS SP 6), and communicate and evaluate
their results (NGSS SP 8) (NGSS Lead States, 2013). Each of these science practices
gives the students the opportunity to construct their own knowledge through exploration
7
and manipulation, which makes Data Stories a great constructivist learning activity that
teachers could implement in their classroom.
Additionally, Data Stories can be used as an interdisciplinary bridge between
mathematics and science. Ivanitskaya, Clark, Montgomery, & Primeau (2002) define
interdisciplinary learning as “the integration of multidisciplinary knowledge across a
central program theme or focus” (p. 95). Interdisciplinary learning encourages students to
develop advanced critical thinking and problem-solving skills that require students to
synthesize information and apply ideas from different situations to solve unfamiliar
problems. Interdisciplinary thinking and problem solving a fundamental part of
addressing some of the most complex problems we are faced with as a society in the 2st
century (Ivanitskaya et al., 2002; National Research Council, 2012). Furthermore,
interdisciplinary learning leads to increased memory, retention and comprehension of
information learned (Ivanitskaya et al., 2002). As Data Stories require students to move
fluently between math, science and English, they are considered to be an interdisciplinary
assignment and are likely effective learning strategies.

8
CHAPTER 2
LITERATURE REVIEW
This chapter reviews the theoretical frameworks that support this study and the
backgrounds from which they are derived. The overarching framework used in this study
is the Next Generation Science Standards (NGSS) and the associated NGSS Science
Practices (NGSS SPs). However, of two of the NGSS SP’s are studied in detail and two
additional frameworks are used to investigate these science practices. Previous studies are
used to highlight where student struggles within these frameworks have already been
identified. This information lays the groundwork to suggest the Data Story assignment as
an effective learning strategy that encompasses many of the science practices in a
constructivist learning environment. The chapter ends by presenting the goals and
research questions for this study.
Instructional Context
Science Education Reform
Traditionally, science education focused on what students need to know in order
to do science. This type of thinking led to teacher-lectures and “cookbook” science
laboratory experiments (Duschl, 2008). The National Research Council (NRC), however,
notes that despite the increasing importance of science, technology, engineering and
mathematics (STEM) disciplines, few U.S. workers have the strong STEM skills needed
to engage with the rapid growth of scientific tools and technologies (National Research
Council, 2012).
The most recent nation-wide science education reform, the Science for All
Americans movement began in the U. S. in 1989 and continues to this day as a part of the
9
national standards movement (Bybee & McInerney, 1995; R. Duschl, 2008). The goal of
this reform was and is “to develop a scientifically literate populace that can participate in
both the economic and democratic agendas of our increasingly global market – focused
science, technology, engineering and mathematics (STEM) societies” (Duschl, 2008, p.
268). Science for All Americans recommends basic learning goals for students that
promote scientific literacy including but not limited to: being aware of some of the ways
in which science, mathematics, and technology depend upon one another, developing a
capacity for scientific ways of thinking, and using scientific knowledge and ways of
thinking for individual and social purposes (Bybee & McInerney, 1995).
To meet the demand of the growing STEM market and to address the Science for
All Americans goals, the NRC developed The Framework for K-12 Science Education:
Practices, Cross-Cutting Concepts and Core Ideas (The Framework) in 2012. During a
time when many states were adopting mathematics and English/language arts common
standards, The Framework aimed to revitalize the creation of science education standards
(National Research Council, 2012). The Framework builds on major ideas and
benchmarks identified in science education by both the American Association for
Advancement of Science (AAAS) and the NRC and attempts to actively engage students
in science and engineering practices over multiple years of school to deepen their
understanding in the core ideas of each field (National Research Council, 2012).
The Next Generation Science Standards (NGSS), completed in 2013, are strictly
grounded in the ideas developed in The Framework (NGSS Lead States, 2013). These
science education standards are the first to recognize that science practices are as
important as science content knowledge, and that science knowledge should not be

10
simply accumulated but actively constructed (NGSS Lead States, 2013; NRC, 2012).
Research on epistemic practices in science education strongly influenced the decision to
include scientific practices into science education standards (Duschl, 2008; Kelly, 2008).
Over the last 60 years, historians, philosophers, psychologists and sociologists
have worked together to closely investigate what scientists do and how they do it, rather
than what scientists need to know in order to do science, as is typical in the traditional
science education. This attempt to establish science as a set of practices, rather than as a
series of memorized facts and procedures, is rooted in epistemic practices (National
Research Council, 2008). Epistemic practices consider the way knowledge is constructed
through practice and action and help to characterize the ways in which students propose,
communicate, justify, assess and legitimize knowledge-claims (Cunningham & Kelly,
2017). Kelly (2008) suggests that engaging in epistemic practices improves student
understanding and helps students to make sense of what they are investigating.
Epistemic Practices in the NGSS
Epistemic practice research is embedded into the science education curriculum
through the NGSS, as eight SPs that are carried throughout students’ K-12 educational
career: Asking questions, developing and using models, planning and carrying out
investigations, analyzing and interpreting data, using mathematics and computational
thinking, constructing explanations, engaging in argument from evidence, and obtaining,
evaluating and communicating information (NGSS Lead States, 2013). The NGSS SPs,
for the first time in science education, are taught in tandem with content knowledge
rather than being treated as individual inquiry investigations (NGSS Lead States, 2013).
The practices developed by The Framework are not created to stand alone, rather, to be

11
fully intertwined into the curriculum and to be sequenced in a way that supports scientific
inquiry (NGSS Lead States, 2013).
Practice is used in place of terms like inquiry and skills to emphasize that the
doing and learning of science cannot be separated, and that understanding science
requires the coordination of the correct skill, the specific practice and the appropriate
content knowledge (Jimenez-Aleixandrew & Crujeiras, 2017; National Research Council,
2008). These practices reinforce that science is not a single set of procedures, give
students the tools they need to help them think like scientists, and encourage students to
practice science in context (NGSS Lead States, 2013; NRC, 2008). This practice-based
approach to science education also encourages students to move beyond memorization
and instead engages students in purposeful knowledge construction work, emphasizing its
constructivism nature (Berland et al., 2016). The underlying theory for these epistemic
practices is rooted in the constructivism learning epistemology.
Roots of Epistemic Practices/Constructivism. Epistemic practices, and
subsequently the NGSS SPs, are based on constructivist epistemology, which assumes
that students are active learners and construct their own knowledge (Schunk, 2012).
Constructivist learning environments engage students to explore content through
manipulation and exploration through tasks such as: observing phenomena, collecting
data, generating and testing hypotheses and working collaboratively with others, all of
which are incorporated into the NGSS SPs (NGSS Lead States, 2013; Schcolnik &
Abarbanel, 2006; Schunk, 2012). This type of instruction is generally used by teachers
for lab experiments, personal science projects and real-life activities where students are
able to incorporate some sort of reflection on their learning.

12
Constructivism is described as an epistemology and not a learning theory
(Schunk, 2012). That is, it is a philosophical explanation about the nature of learning,
rather than a set of scientifically accepted principles that exist and are to be discovered
and tested (Schunk, 2012). Constructivists do not believe that knowledge is imparted
from outside sources, but that it is pieced together within an individual through reflection
and may differ based on their beliefs, experiences and interactions with the environment
(Schcolnik, Kol, & Abarbanel, 2006; Schunk, 2012). While a traditional instructivist
classroom that promotes the transmission of ideas may be able to cover more material
than a constructivist classroom, it is important to recognize that effective learning
encompasses more than just coverage (Schcolnik et al., 2006; von Glasersfeld, 1983).
Rather than covering an extensive list of topics in a curriculum, constructivists believe
that students should study fewer topics in depth, that allow students develop critical
thinking skills and truly build their knowledge (Schcolnik et al., 2006; von Glasersfeld,
1983).
Constructivists also believe that in order for students to truly conceptualize,
process and understand the world that surrounds them and apply their learning to new
situations, students need to be given time to develop these scientific ideas over several
years, rather than across a few weeks or months (National Research Council, 2007;
Schcolnik et al., 2006). Taking Science to School investigated how students of all ages
learn and interact with science and promotes the idea that all students have some prior
knowledge that should be built upon throughout their education to attain more
sophisticated levels of understanding (National Research Council, 2007, 2012). This type
13
of cognitive development is modeled through learning progressions; therefore, epistemic
practices also have roots in, and are closely related to learning progressions.
Theory of Learning Progressions. Learning progressions represent plausible
learning pathways for students, where students move from novice to expert over a series
of years (Duschl, Maeng, & Sezen, 2011). Defined by the NRC in Taking Science to
School (2007):
Learning progressions are descriptions of the successively more sophisticated
ways of thinking about a topic that can follow one another as children learn about
and investigate a topic over a broad span of time (e.g. six to eight years). They are
crucially dependent on instructional practices if they are to occur. (p. 219)
While learning progressions look like a rubric, they are not intended to be so,
rather, they help teachers to better understand how students’ thinking is expected to
develop over several years. Students who are just entering the learning progression are
considered to be novices and fall into the lowest levels of the learning progression. Over
the years these novice students develop more sophisticated ways of thinking and are able
to progress through the learning progression to the expert level.
For example, the Australian Council of Education Research developed a series of
learning progressions for their mathematics education (Curriculum Corporation, 1997;
Heritage, 2008). One example of a basic learning progression is the “Progress Map for
Counting and Ordering” which was designed to better understand how students’ concepts
of numbers change over time.
14
Students enter this learning progression at a level 1 when they are able to 1) use
terms like first, second and third, 2) use numbers to decide which is bigger, smaller or the
same size, 3) skip count by 2s or 3s using a number line or hundred chart 4) make sense
of the size of small collections up to 10 and/or 5) count collections to answer the question
“How many are there?” (Curriculum Corporation, 1997). Students progress through the
levels of the learning progression, moving through aspects of comparisons, estimations,
fractions and place value, until they reach level 5 where the students’ thinking is
developed enough to understand concepts like whole number powers and square roots,
common equivalences, percentages and unitary ratios (see Appendix A for the full
example learning progression) (Curriculum Corporation, 1997).
Learning progressions are organized around the most core ideas/practices that are
central to the discipline and attempt to coordinate sequential teaching across grade levels
(Duschl et al., 2011). They are grounded on the premise that learning should be
coordinated and sequenced along a conceptual trajectory, and that there should be a clear
alignment of curriculum, instruction and assessment between grades (Duschl et al.,
2011). Because they extend over multiple years, learning progressions prompt educators
to reflect and evaluate how their disciplinary content is presented at each grade level in
order to ensure a sequential alignment of content (National Research Council, 2008).
Longer sequences of instruction allow time for students to develop rich, conceptual
knowledge of the subject, which has been shown to have a positive effect in conceptual
change research (Duschl et al., 2011).
Learning progressions consist of upper and lower anchors that have been
empirically validated (Duschl et al., 2011). The lower anchors are typically events that
15
are easily visible to students or are representative of their everyday experiences, which
allow the learning progression to be accessible to all learners (Duschl et al., 2011). In the
concept of numbers learning progression example provided above, notice that students
enter level one when they are able to use terms like first and second, or bigger and
smaller. These are examples of concepts that students are used to hearing in everyday
language; it may not be something that is explicitly taught to them rather, it is language
students may pick up through their experiences.
The defined upper anchors of learning progressions are the learning goal of the
learning progression, which represent accurate understanding and increased sophisticated
practices, that together reach the societal expectations and values (Duschl et al., 2011;
National Research Council, 2007). Using the example provided above, an expert is able
to reason with ratios and percentages, which are necessary skills to be a functioning
member of our society. However, we would never expect a kindergartener to reach this
level, as this is above their developmental capacity.
Intermediate levels exist between the lower and upper anchor which highlight
important precursor learning that allow students to construct a more mature
understanding (National Research Council, 2007). These intermediate levels are
important stepping stones between the upper and lower anchors but are not always as
clearly defined as the beginning and end anchors (Duschl et al., 2011).
Gotwals and Songer (2010) define the intermediate levels of learning progressions
as the messy middle, as students do not always show a consistent pattern of
understanding as they progress along a learning progression (Solem, Huynh, & Boehm,
2013). In one case, Gotwals and Songer (2010) found students gave different responses to

16
tasks designed to evaluate the same content when asked to reason about food chains. For
example, they found that many students confused the meanings of directional arrows in
different food chain scenarios: while students were able to correctly interpret the
directional arrow pointing from mice to snakes as representing the direction of energy
transfer (that the snakes are eating the mice), when presented with the same directional
arrow pointing from algae to small fish, students interpreted the arrow to symbolize the
algae eating the small fish. It is unclear whether these differences are due to the students
not having a full conceptual understanding of the directional arrows, or whether the
challenge came from unfamiliarity with algae as an organism. Regardless of the root
cause, these results indicate that much of the students’ middle knowledge is messy, in
that they are able to correctly interpret representations in some contexts, but not all
(Gotwals & Songer, 2010)
Gotwals and Songer (2010) also describe a form of the messy middle that is based
on students’ challenges when working to combine both context knowledge and skills.
One question in their study asked students “Write a scientific explanation for the
following question: If all the small fish in the pond system died one year from a disease
that killed only small fish, what would happen to large fish in the pond?” All students
demonstrated their competence in the content knowledge by stating that the large fish
would either decrease, die, or starve. However, when asked to apply this knowledge to
create a scientific explanation to explain why this would occur, many students we unable
to appropriately do so. It is clear in this case that students have some of the pieces
(content knowledge) necessary to complete the assignment but fall short in other aspects
(creating a scientific explanation). This illustrates another type of messy middle for

17
teachers to consider where students may be confident in one part of the assignment but
not in another (Gotwals & Songer, 2010).
Solem et al. (2013) describe that throughout the intermediate levels of a learning
progression, it is possible that 1. Students will not interact with all assessments in the
same way and/or 2. May be confident with some but not all of the necessary knowledge
pieces to respond to a particular assessment. Teachers need to be aware that not all
students will move through the learning progression in the same ways, as each student
has had different instructional histories, and personal and/or cultural experiences that will
influence their learning process (National Research Council, 2007).
Though movement through the messy middle is not the same for all students, and
further research is needed to better understand the way students grasp knowledge as they
move through these intermediate levels, it is important to highlight that the teacher plays
a critical role in helping students move from the lower anchor, through the messy middle
and ultimately to the upper anchors of a learning progression (Duschl et al., 2011;
National Research Council, 2007). The teacher is must understand where students are
coming from and where they are going in their development of a concept and are
responsible for helping guide students along the learning progression towards the end
goal.
Frameworks for Epistemic Practices
Framework for Constructing Evidence-based Explanations
McNeill and Krajcik originally became interested in the way students make
meaning of science investigations after observing several middle-school classrooms and
analyzing student writing and talk with teachers (McNeill & Krajcik, 2012). They found

18
a major challenge for students was the ability to make sense of data and to construct
scientific explanations using evidence to justify a claim. Students involved with the
science investigations, were able to make observations and collect data, but when asked
to interpret the data in order to draw conclusions, students struggled to create an
evidence-based explanation (McNeill & Krajcik, 2012).
Because many people, students and teachers alike, have trouble developing and
comprehending written arguments and evidence-based explanations (Reznitskaya et al.,
2001), McNeill et al., (2006) developed a new framework, adapted from Toulmin’s
(1958) model of argumentation, to help teachers explain the crucial parts of constructing
an evidence-based explanation: claim, evidence and reasoning (CER). Defined by
McNeill et al. (2006), a claim is a conclusion or question to a problem, evidence consists
of scientific data that supports the claim, and reasoning includes a justification that links
the evidence to the claim using scientific principles.
The definition and expectations of the reasoning aspect of argumentation has
many definitions depending on the framework that is used (Sampson & Clark, 2008). The
presented study uses the framework developed by McNeill et al. (2006) which, similar to
Zohar & Nemet (2002) and Clark & Sampson (2007), relies on reasoning as a way for
students to incorporate scientific principals into their arguments to back-up their claims.
Thus. the reasoning is the logic for why the evidence supports the claim, and gives
students practice in using real scientific knowledge to support a claim.
It is important to note that in the presented study the classroom teacher does not
use the McNeill et al. (2006) framework and definition for reasoning. Instead, the teacher
expects students to use the reasoning section of the Data Story to tie the evidence back to

19
the claim; to explain why and/or how the evidence supports the claim using examples
from the graph. She believes that while students are building their scientific knowledge,
which is the goal of a Data Story, they need to use the evidence in front of them to reason
about the claim. She feels it is not until students have acquired many building blocks and
have had experience or instruction in certain topics, that they should be required to
include scientific principles into the reasoning portion of CER. This definition is more
consistent with Lawson’s framework, which suggests that students will have a hard time
making hypothetico-predictive arguments, because they do not have the background
knowledge needed to generate this type of argument (Lawson, 2003). Table 2.1
demonstrates the differences between the McNeill et al. (2006) and (Lawson, 2003)
frameworks.
Table 2.1: Comparison of Reasoning frameworks Framework Zohar & Nemet (2002)/McNeill et
al. (2006)/Research Team Lawson (2003)/Ms. Brown
Main component of reasoning
Scientific principles and hypothetico-predictive arguments
Evidence/data from investigation
Justification for the framework
Students need to practice in using scientific knowledge and principals into a claim
Students have not developed the reasoning needed to test and generate hypotheses and should base their arguments on what they observe.
Example response (two different data sets)
There are more tectonic plate interferences in the Southern Hemisphere.
Magnitude and depth are not correlated due to the fact, the trend line is not tight and data does not have a specific pattern
Note: Based on Sampson & Clark (2008).
Using the framework for scientific argumentation created by McNeill et al.
(2006), (Berland & McNeill, 2010) developed a learning progression for the skill of
argumentation grounded in both studies of science practice and research on student
learning (Berland & McNeill, 2010). Berland & McNeill (2010) used empirical results

20
from elementary to high school levels to develop their learning progression for
argumentation. Their final product (Figure 2.1) represents an effective learning pathway
for students in grades 5-12 in argumentation; the upper anchor, identified by the darkest
shading on the far right (Complex), as well as intermediate steps, identified by the
medium shaded color, are based on how scientists use argumentation in the field of
science (Berland & McNeill, 2010).
Figure 2.1: Learning progression for the skill of argumentation (Berland & McNeill, 2010). The darkest cells on the far right represent the upper anchors of the learning progression, and the lighter shaded cells to the left represent the lower anchors of the learning progression. The middle cells represent the intermediate steps.
21
Three dimensions are necessary in this argumentation learning progression: (1)
Instructional context, (2) Argumentative product and (3) Argumentative process (Berland
& McNeill, 2010).
The instructional context dimension focuses on characteristics that support
students’ argumentation ability such as: How students phrase their questions, how
students pick their data and the amount of teacher scaffolding that is provided.
The argumentative product dimension focuses on what the students produce: Do
they defend their claims with evidence? Do they address the question that was posed? Do
they use appropriate evidence and reasoning?
The third dimension of the argumentation learning progression is the
argumentative process. This dimension takes into consideration how students evaluate,
defend and/or revise their work and participate in argumentative discourse with others.
Berland and McNeill (2010) argue that each of these dimensions is achievable by
students of any age (though they only collected empirical evidence from grades 5-12),
and that their learning progression is not age dependent. Rather, they argue the learning
progression is dependent on the way the teacher generates classroom norms around
argumentation (Berland & McNeill, 2010). For example, if a teacher asks students to
engage with evidence frequently and promotes argumentation as a way of learning in the
classroom, a sixth-grader may be able to achieve the upper levels of the learning
progression. On the other hand, if students have never been exposed to the skill of
argumentation and it is not a part of normal classroom discourse, a sophomore in high
school may not have the skills to reach the upper levels of this learning progression.

22
We have chosen to use pieces of this learning progression as part of our
conceptual framework to understand students’ demonstration of CER skills, coupled with
a previously adapted rubric for CER (Martin, 2016) as a way to develop a rubric for
assessing ninth graders’ Data Stories. The creation of this rubric is explained in Chapter
3. We want to better understand how students in this Earth Science class use CER,
because despite the importance of being able to use appropriate evidence to support a
scientific statement, this has proven to be a challenge for students (McNeill & Krajcik,
2007).
Student Challenges Associated with CER. Prior research into the use of CER in
science classrooms suggests that students have the most difficulty using appropriate
evidence to support the claim (McNeill & Krajcik, 2007, 2012; Sampson & Clark, 2008),
incorporating a reasoning portion of their argument (McNeill, 2009; McNeill et al.,
2006), and formulating their argument into words (Berland & McNeill, 2010).
While many students participate in evidence collection in the classroom, when it
comes time to make and support a claim, students tend to fall back on their own opinions
and personal experiences instead of incorporating the data they have just collected
(Hogan & Maglienti, 2001; McNeill & Krajcik, 2012; Sadler, 2004). While it is
important for students to make connections with their own lives as a way to developing
robust and useable scientific knowledge (Bell & Linn, 2000; McNeill & Pimentel, 2010),
students also need to understand that collected data is valuable and can and should be
used as evidence! Reasons for this exclusion of evidence may stem from students not
fully understanding what counts as evidence, or the inability to select the appropriate data
to support their claim (McNeill & Krajcik, 2007; Sadler, 2004). McNeill and Krajcik
23
(2007) found that the use of inappropriate evidence was amplified when students did not
have a strong understanding in the content of the data.
McNeill et al. (2006) also found that students have a hard time incorporating
reasoning into their arguments and, similarly to the challenges identified while
developing evidence, may draw primarily on their past experiences to explain a
phenomenon. Reasoning is arguably one of the most important skills students should
develop throughout a science curriculum because it connects the science content
knowledge to the data and helps students to make science connections outside of the
classroom, therefore increasing their overall scientific literacy skills McNeill and Krajcik,
2012; McNeill et al., 2006). When students choose to draw on past experiences instead of
using scientific principles they have learned in the classroom, they miss this important
meaning-making opportunity. Many studies have shown that scientific reasoning does not
come naturally to students, rather, it is a skill that needs to be taught and used in practice
(Osborne, Erduran, & Simon, 2004).
In addition to the challenges of including appropriate evidence and reasoning into
their argument, students also find it challenging to translate their findings into words
(Berland & McNeill, 2010). When students try to express their claim, evidence and
reasoning through their writing, Berland and McNeill (2010), found that students’ written
argumentative products tend to under represent their abilities of argumentation, perhaps
due to (1) poor writing abilities that do not allow students to communicate argumentative
thoughts or (2) lack of appropriate audience (Berland & McNeill, 2010). Similarly,
Pfannkuch, Regan, Wild, and Horton (2010) found that when students were writing for an
assignment, they did not find it necessary to fully convince the audience (their teacher),
24
of any scientific facts. Many “stories” were not holistic, did not have a beginning, middle
and end, and were weak arguments (Berland & McNeill, 2010; Pfannkuch et al., 2010).
Framework for Quantitative Reasoning
QR has many definitions including: numeracy, number sense, deductive
reasoning, mathematical literacy, quantitative literacy, problem solving, contextualized
mathematics, mathematical modeling and quantitative reasoning (Mayes et al., 2013).
The presented study uses the quantitative reasoning within a context (QRC) definition
offered by Mayes et al. (2013):
Mathematics and statistics applied in real-life, authentic situations that impact an
individual’s life as a constructive, concerned and reflective citizen. QRC
problems are context-dependent, interdisciplinary, open-ended tasks that require
critical thinking and the capacity to communicate a course of action” (p. 6).
This definition targets skills that are needed to create a Data Story, including the ability
to: reason with problems that are context-dependent, use interdisciplinary and open-
ended questions that require critical thinking, and communicate the findings in the
context of the defined problem. This definition allows us to move fluently between
mathematics and science contexts (Mayes et al., 2013)
Mayes et al. (2013) developed a QR learning progression for environmental
science, grades 6-12, as a way to understand how students develop QR skills throughout
their education. Mayes, Forrester, Schuttlefield Christus, Peterson, and Walker (2014)
further developed, revised and validated this original QR learning progression through
25
empirical research and student interviews (Table 2.2). Their learning progression was
designed as a promising model to “advance effective adaptive-instruction teaching
techniques and thereby change the norms of practice in schools” (Mayes et al., 2013, p.
1), as a learning progression is a necessary first step to take before any curriculum
changes to include QR could be made.
26
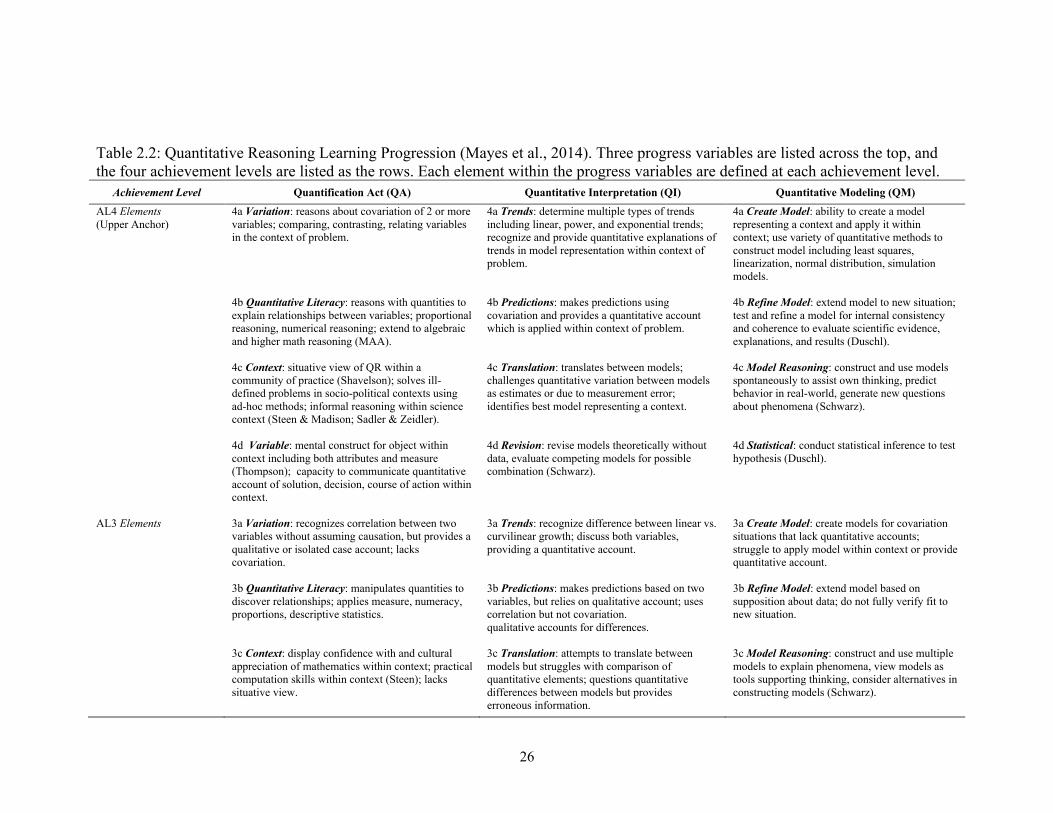
Table 2.2: Quantitative Reasoning Learning Progression (Mayes et al., 2014). Three progress variables are listed across the top, and the four achievement levels are listed as the rows. Each element within the progress variables are defined at each achievement level.
Achievement Level Quantification Act (QA) Quantitative Interpretation (QI) Quantitative Modeling (QM) AL4 Elements (Upper Anchor)
4a Variation: reasons about covariation of 2 or more variables; comparing, contrasting, relating variables in the context of problem.
4a Trends: determine multiple types of trends including linear, power, and exponential trends; recognize and provide quantitative explanations of trends in model representation within context of problem.
4a Create Model: ability to create a model representing a context and apply it within context; use variety of quantitative methods to construct model including least squares, linearization, normal distribution, simulation models.
4b Quantitative Literacy: reasons with quantities to explain relationships between variables; proportional reasoning, numerical reasoning; extend to algebraic and higher math reasoning (MAA).
4b Predictions: makes predictions using covariation and provides a quantitative account which is applied within context of problem.
4b Refine Model: extend model to new situation; test and refine a model for internal consistency and coherence to evaluate scientific evidence, explanations, and results (Duschl).
4c Context: situative view of QR within a community of practice (Shavelson); solves ill-defined problems in socio-political contexts using ad-hoc methods; informal reasoning within science context (Steen & Madison; Sadler & Zeidler).
4c Translation: translates between models; challenges quantitative variation between models as estimates or due to measurement error; identifies best model representing a context.
4c Model Reasoning: construct and use models spontaneously to assist own thinking, predict behavior in real-world, generate new questions about phenomena (Schwarz).
4d Variable: mental construct for object within context including both attributes and measure (Thompson); capacity to communicate quantitative account of solution, decision, course of action within context.
4d Revision: revise models theoretically without data, evaluate competing models for possible combination (Schwarz).
4d Statistical: conduct statistical inference to test hypothesis (Duschl).
AL3 Elements 3a Variation: recognizes correlation between two variables without assuming causation, but provides a qualitative or isolated case account; lacks covariation.
3a Trends: recognize difference between linear vs. curvilinear growth; discuss both variables, providing a quantitative account.
3a Create Model: create models for covariation situations that lack quantitative accounts; struggle to apply model within context or provide quantitative account.
3b Quantitative Literacy: manipulates quantities to discover relationships; applies measure, numeracy, proportions, descriptive statistics.
3b Predictions: makes predictions based on two variables, but relies on qualitative account; uses correlation but not covariation. qualitative accounts for differences.
3b Refine Model: extend model based on supposition about data; do not fully verify fit to new situation.
3c Context: display confidence with and cultural appreciation of mathematics within context; practical computation skills within context (Steen); lacks situative view.
3c Translation: attempts to translate between models but struggles with comparison of quantitative elements; questions quantitative differences between models but provides erroneous information.
3c Model Reasoning: construct and use multiple models to explain phenomena, view models as tools supporting thinking, consider alternatives in constructing models (Schwarz).

27
Table 2.2 Cont. Achievement Level Quantification Act (QA) Quantitative Interpretation (QI) Quantitative Modeling (QM)
3d Variable: object within context is conceptualized so that the object has attributes, but weak measure (Thompson); capacity to communicate qualitative account of solution, decision, course of action within context, but weak quantitative account.
3d Revision: revise model to better fit evidence and improve explanatory power (Schwarz).
3d Statistical: use descriptive statistics for central tendency and variation; make informal comparisons to address hypothesis.
AL2 Elements 2a Variation: sees dependence in relationship between two variables, provides only a qualitative account; lacks correlation, erroneously assumes causation.
2a Trends: identify and explain single case in model; recognize increasing/ decreasing trends but rely on qualitative account or change in only one variable.
2a Create Model: constructs a table or data plot to organize two dimensional data; create visual models to represent single variable data, such as statistical displays (pie charts, histograms).
2b Quantitative Literacy: poor arithmetic ability interferes with manipulation of variables; struggle to compare or operate with variables.
2b Predictions: makes predictions for models based on only one variable, provides only qualitative arguments supporting prediction.
2b Refine Model: extends a given model to account for dynamic change in model parameters; provides only a qualitative account.
2c Context: lack confidence with or cultural appreciation of math within context; practical computation skills are not related to context.
2c Translation: indicate preference for one model over another but do not translate between models; acknowledge quantitative differences in models but do not compare.
2c Model Reasoning: construct and use model to explain phenomena, means of communication rather than support for own thinking (Schwarz).
2d Variable: object within context is identified, but not fully conceptualized with attributes that are measurable; fails to communicate solution, decision, course of action within context; qualitative account without quantitative elements (Thompson).
2d Revision: revise model based on authority rather than evidence, modify to improve clarity not explanatory power (Schwarz).
2d Statistical: calculates descriptive statistics for central tendency and variation but does not use to make informal comparisons to address hypothesis.
AL1 Elements (Lower Anchor)
1a Variation: does not compare variables; works with only one variable when discussing trends.
1a Trends: do not identify trends in models.
1a Create Model: does not view science as model building and refining so does not attempt to construct models.
1b Quantitative Literacy: fails to manipulate and calculate with variables to answer questions of change, discover patterns, and draw conclusions.
1b Predictions: avoids making predictions from models.
1b Refine Model: accepts authority of model, does not see as needing refinement new knowledge (Schwarz).
1c Context: does not relate quantities to context or exhibit computational skills.
1c Translation: fail to acknowledge two models can represent the same context.
1c Model Reasoning: construct and use models that are literal illustrations, model demonstrates for others not tool to generate.
1d Variable: fail to relate model to context by identifying objects no attempt to conceptualize attributes that are measurable; discourse is force-dynamic; avoids quantitative account, provides weak qualitative account.
1d Revision: view models as fixed, test to see if good or bad replicas of phenomena (Schwarz).
1d Statistical: does not use statistics; no calculation of even descriptive statistics.

28
Mayes et al. (2014) describe three key components of QR (progress variables): 1)
Quantification Act (QA), which considers how students may identify variables, observe
variable attributes, and assign measures to the variables they are working with, 2)
Quantitative Interpretation (QI), which examines a students’ ability to perform
computations with variables, compare them, make estimates, and draw conclusions, and
3) Quantitative Modeling (QM), which is similar to quantitative interpretation, but goes
beyond just interpreting models, and into the domain of creating their own (Mayes et al.,
2013; Mayes et al., 2014). Each of these three progress variables is further described by
several elements that are considered to be fundamental to each progress variable (Mayes
et al, 2014 p. 8-10):
1. QA: Variation, quantitative literacy, context, communication
2. QI: Trends, predictions, translation, revision
3. QM: Create Model, refine model, model reasoning, methods, statistical.
For a full description of what students should be able to accomplish in these defined
elements, please reference the learning progression (Table 2.2). Each progress variable
and element within are characterized at four levels, which in this table, are first defined at
the upper anchor where students are expected to be at by the time they graduate from
high school. The learning progression then illustrates two intermediate levels, before
reaching the lower anchor, where the skills students may have when they first enter the
learning progression are described (Mayes et al., 2014). This learning progression
represents the most up-to-date understanding of students’ QR learning trajectory
29
throughout grades 6-12 (Mayes et al., 2014). We have chosen to use this learning
progression for QR as part of our conceptual framework for creating a quantitative
reasoning rubric for assessing students’ Data Stories. The development of our rubric is
described in Chapter 3.
Student Challenges Associated with QR. Quantitative reasoning skills are
crucial in a data-filled world, where citizens are constantly asked to interpret and validate
claims. It is important for teachers to frequently incorporate authentic and scientific data
into their classrooms in order to gain student interest, generate robust claims, and provide
context to the situation. Incorporating these skills into other disciplines will not only
increase students’ QR skills, but provide a good base from which to start creating and
validating their own claims in different disciplines
One of the major challenges in students’ QR skills is the inability to work with
graphs; while many students have the ability to make graphs, interpreting them is a
different story (Konold, Higgins, Russell, & Khalil, 2015; Whitacre & Saul, 2016). This
problem stems from students who focus on individual data points and cannot
conceptualize data as an aggregate to see trends (Konold et al., 2015; Whitacre & Saul,
2016).
Konold et al. (2015) studied the way students talked about data they had collected
individually, and the subsequent graphs that were created. Konold et al. (2015) found that
when students talk about data in a graph, they will refer to it as one of four categories: (1)
Pointer, where students disregard the data and say what they think, but not what is
represented in the display, (2) case value, where students pick one value from the graph,
and use that to represent the whole, (3) classifier, where students will combine similar

30
individual cases, but disregard the data in comparison to the whole, and (4) aggregate,
where students are able to reason with the whole data set, and mention things like the
spread, shape, and distribution of the values (Konold et al., 2015). Similarly, Whitacre
and Saul (2016), studied a group of students who all performed exceptionally in school,
but when asked to interpret a graph they had never seen, most students were unable to
correctly identify the major trends.
Additionally, many teachers believe the topic should be left to the mathematics
teachers, when in reality these skills should be practiced across the curriculum, in many
contexts; “it must be pervasive in all areas of students’ education” (Steen, 2004, p. 17). In
order for students to fully employ QR skills they need to use QR outside of the
mathematics classroom where they will begin to understand that QR and statistics are
effective methods of evaluating data sets from any discipline (Neumann et al., 2013; L.A
Steen, 2004)
Goals for this Study
This study investigates how the use of interdisciplinary Data Story assignments
can be used to promote both mathematics and science learning in a meaningful, student-
driven assignment that encourages the development of 21st century critical thinking skills.
Frameworks from both disciplines (science and mathematics) are used to view the Data
Story assignments to better understand the roles that each of these disciplines have in
Data Story construction. We are most interested in investigating how a students’ QR
skills can either enhance or impede science learning.
The driving research questions for this study are:

31
1. What are the affordances and challenges students face when constructing Data
Stories?
2. What QR skills do students use when constructing evidence-based explanations in
Data Stories?
3. What are the affordances and challenges students face within QR while
constructing Data Stories?

32
CHAPTER 3
METHODS
Overview
To address the research questions, the researchers recruited a high school teacher with
11 years of experience (Ms. Brown) from a rural school in mid-coast Maine who
implemented Data Stories over the course of the school year to improve students’
abilities in developing evidence-based explanations (CER). Over the course of the school
year (9 months) the classroom teacher asked students in two of her Honor’s Global
Science classes to develop two Data Story assignments as a part of their normal
classwork. Student participants in this study were primary Caucasian and ranged in age
from 14-16 years. In accordance with IRB practices, the classroom teacher de-identified
all student work before providing it to the research team and all interviewed participants
were assigned a pseudonym.
Researchers collected de-identified student Data Story assignments, or Data
Stories, during the 2017-2018 academic year from Ms. Brown and developed two rubrics
(described at length in the subsequent paragraphs) to score student work in a way that
standardized student scores so that the work could be easily compared. These two rubrics
allowed the researchers to better understand the relationship between constructing
evidence-based explanations and QR when constructing Data Stories by scoring the same
student work through two different frameworks.
After the second Data Story assignment was scored and analyzed, four students
were selected with the help of the teacher for one half-hour individual interview to gain

33
deeper insight into students’ thinking during the creation of a Data Story. Interviews took
place towards the end of the school year (April 2018).
Finally, the research team interviewed Ms. Brown to better understand the
specific requirements and expectations for each Data Story and to learn about the
scaffolding that had been provided to students leading up to the assignment. This
interview was intended to help provide context for the Data Stories and allowed
researchers to better understand patterns and themes that appeared within them. Figure
3.1 visually describes the methods of this study.
Figure 3.1: Visual model of methods.
The Data Story Assignment
Data Stories were a part of the students’ normal course work throughout the
2017/2018 school year. Before each assignment, Ms. Brown presented examples of Data
Stories at both the Meets and Exceeds levels (from her perspective) and worked with
students to help them develop the skills they would need to ask good questions and
effectively use the CER framework for evidence-based explanations. It is important to

34
remember that Ms. Brown does not use the McNeill et al. (2006) framework, and
therefore has a different definition for reasoning than the research team had.
Students created graphs for their Data Stories using Tuvalabs.com (Tuva) (Tuva
Labs, 2019), a commercial online data visualization platform the classroom teacher
subscribes to. Tuva’s data set library is composed of real-world data sets that are
designed for classroom use and come from open source, public, and government datasets
that span a variety of disciplines. Additionally, Tuva offers a variety of interactive tools
that students can use to visualize, manipulate, analyze and interpret data, which
ultimately facilitates a constructive learning environment. Students can use this platform
to easily manipulate data between graph types, e.g. histograms to box-plots, which helps
to reduce the amount of time spent on graph mechanics and allows students to put more
energy towards analyzing and interpreting their data set in the context of a question or
problem. The flexibility Tuva provides also allows students to make their own decisions
while graphing and analyzing data in order to construct their own “story” about the data.
Figure 3.2 provides an example of what the Tuva interface looks like before students
begin plotting attributes. Note that all the attributes students can choose to graph are on
the left and the graph type options are in the toolbar above the graphing area. Additional
features such as descriptive statistics and adding the line of best fit can be found in the
Stats drop-down menu.

35
Figure 3.2: Example Tuvalabs.com interface.
Ms. Brown gave students time in class to work on their Data Stories and expected
students to use out-of-class time to finish them. Students used class time to ask questions,
gain peer feedback and receive question-coaching from Ms. Brown. Students had
approximately one week to work on their Data Stories before the final due date.
Once complete, students handed in their final Data Stories to Ms. Brown who de-
identified student work, assigned a code to each student and uploaded student work as
.pdf files onto a secure, private Google Drive shared by the research team. Over the
course of the school year, Ms. Brown assigned a total of two Data Stories and provided
them to the research team. Students were assigned the same code for both Data Stories so
individual progress between Data Story 1 and Data Story 2 could be tracked.
Assigning a set of Data Stories over the course of the school year was a part of
Ms. Brown’s strategy in scaffolding CER skills. As such, each of the assignments had
slightly different requirements to fit the curricular goals for the year. To identify patterns
in student work between Data Stories, researchers found it important to understand how
Ms. Brown introduced each assignment to her students and the differences in her
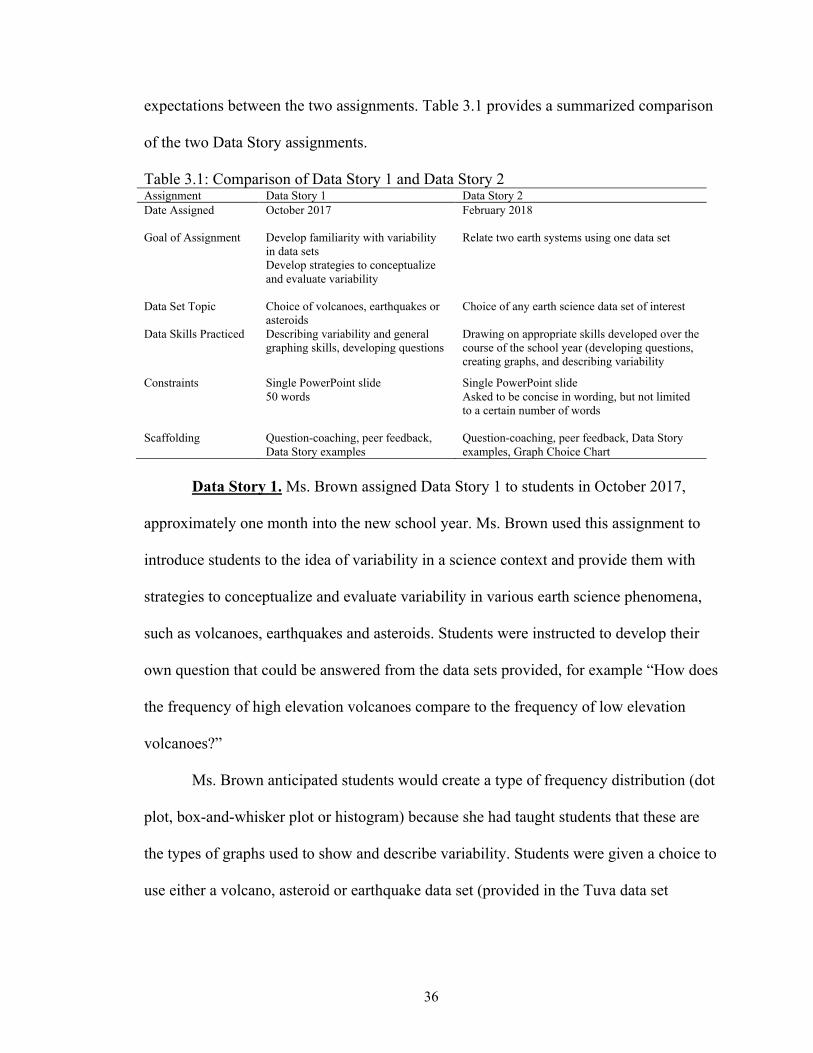
36
expectations between the two assignments. Table 3.1 provides a summarized comparison
of the two Data Story assignments.
Table 3.1: Comparison of Data Story 1 and Data Story 2 Assignment Data Story 1 Data Story 2 Date Assigned October 2017
February 2018
Goal of Assignment Develop familiarity with variability in data sets Develop strategies to conceptualize and evaluate variability
Relate two earth systems using one data set
Data Set Topic Choice of volcanoes, earthquakes or asteroids
Choice of any earth science data set of interest
Data Skills Practiced
Describing variability and general graphing skills, developing questions
Drawing on appropriate skills developed over the course of the school year (developing questions, creating graphs, and describing variability
Constraints Single PowerPoint slide 50 words
Single PowerPoint slide Asked to be concise in wording, but not limited to a certain number of words
Scaffolding Question-coaching, peer feedback, Data Story examples
Question-coaching, peer feedback, Data Story examples, Graph Choice Chart
Data Story 1. Ms. Brown assigned Data Story 1 to students in October 2017,
approximately one month into the new school year. Ms. Brown used this assignment to
introduce students to the idea of variability in a science context and provide them with
strategies to conceptualize and evaluate variability in various earth science phenomena,
such as volcanoes, earthquakes and asteroids. Students were instructed to develop their
own question that could be answered from the data sets provided, for example “How does
the frequency of high elevation volcanoes compare to the frequency of low elevation
volcanoes?”
Ms. Brown anticipated students would create a type of frequency distribution (dot
plot, box-and-whisker plot or histogram) because she had taught students that these are
the types of graphs used to show and describe variability. Students were given a choice to
use either a volcano, asteroid or earthquake data set (provided in the Tuva data set

37
library) to construct their Data Story, though the activity was intended to focus more on
explaining and reasoning about variability rather than on learning new science content.
To emphasize conciseness, Ms. Brown required students to use a single
presentation slide to present their findings including: a question, the graph from Tuva, as
well as their claim, evidence and reasoning. A full copy of the requirements for Data
Story 1 can be found in Appendix B.
Data Story 2. Ms. Brown assigned Data Story 2 in February 2018, approximately
five months into the school year. By this point in the curriculum Ms. Brown had exposed
students to the Graph Choice Chart (Figure 3.3) which is a tool designed to help students
determine the type of graph that will best represent their data (Webber, Nelson,
Weatherbee, Zoellick, & Schauffler, 2014)
Figure 3.3: Graph Choice Chart (Webber et al., 2014).
!

38
Ms. Brown had also given students practice constructing evidence-based
explanations in class and provided opportunities for the students to become familiar with
Tuva and all the data visualization and analysis tools it offers. Therefore, she felt the
students had the skill sets needed to ask a few different types of questions, use any of the
graph types offered by Tuva, and then use their graph as evidence to back up a claim.
Ms. Brown designed Data Story 2 to encourage students to use a data set to find a
relationship between two different Earth systems, e.g. connections between atmosphere
and ocean, geosphere and biosphere, etc. Therefore, this assignment had a stronger
emphasis on Earth science content than Data Story 1, which as noted earlier, focused
more on exploring and explaining variability in a distribution of data. While this Data
Story did not explicitly set a word limit, Ms. Brown emphasized students should be
selective with their words and use precise language. For full assignment details see
Appendix C.
Data Collection
Researchers collected quantitative and qualitative data from September 2017 to
May 2018 in the form of 1) two Data Story assignments from each student, 2) four semi-
structured 30-minute one-on-one student interviews, and 3) one semi-structured 45-
minute teacher interview.
Student Data Stories
Once students handed in their completed Data Stories to Ms. Brown, these files
were de-identified and shared with the research team as .pdf files. 34 students completed
Data Story 1 and 31 matching students completed Data Story 2. The three students who
completed Data Story 1 but not Data Story 2 were removed for the purposes of this study.

39
All Data Story assignments were scored by the author. In attempts to standardize student
scores on Data Stories, the research team developed two rubrics from which all student
Data Stories were scored.
Rubric Development. To standardize the scoring of student assignments, the
research team developed two rubrics based on the frameworks presented in Chapter 2 to
score and analyze student Data Stories. These two rubrics allowed Data Stories to be
viewed through two different lenses to effectively investigate the interconnectedness of
the two subjects inherent in a Data Story: CER and QR. Analyzing these assignments
from both a CER and QR perspective helped to identify both the CER and QR skills used
in developing a Data Story, as well as helped to pin-point what elements students
struggled in while developing their Data Story. The goal of these rubrics was to develop a
tool that would effectively capture a wide range of student scores that could be used by
science teachers to better understand what CER and QR skills their students struggle
with.
Over the course of the project the two rubrics were iteratively revised and edited
by 1) members of the Research in STEM Education (RiSE) Center Research Group at the
University of Maine, Orono, 2) graduate students enrolled in the Master of Science in
Teaching (MST) program at the University of Maine, and 3) the research team of this
study. The RiSE Center Research group is composed of both faculty and graduate
students focusing in STEM Education research at the University of Maine.
While both rubrics underwent similar iterative processes throughout the project,
their initial development stems from different places. Researchers adapted CER rubrics
from other sources to create the QR Rubric for 9th Grade Data Story Assignments.

40
However, because there was no pre-existing rubric for QR in Context, the researchers
developed the QR Rubric for 9th Grade Data Story Assignments from a learning
progression. Development of these two rubrics is further described below.
Development of the CER Rubric for 9th Grade Data Story Assignments. The CER
Rubric developed in this study is adapted from a CER rubric developed by Martin (2016),
which originally used McNeill & Krajcik's (2012) CER rubric as a template. Because the
research questions in this study do not specifically focus on whether students learn
content when they create Data Stories, the research team felt it was appropriate to remove
the Content element described by Martin (2016). Instead the rubric focuses only on the
aspects of the CER framework defined by McNeill and Krajcik (2012): claim, evidence
and reasoning. Rubric language was altered to be more explicit and specifically
applicable to Data Story assignments.
Ultimately, the final CER Rubric for 9th Grade Data Story Assignments includes
three elements: Claim, Evidence and Reasoning at four performance levels: Does Not
Meet Expectations (DMN) (1), Partially Meets Expectations (2), Meets Expectations (3)
and Exceeds Expectations (4) (Table 3.2). The Partially Meets Expectations level
consists of two components because the research team believes students can partially
meet the expectation in different ways. Allowing two components of Partially Meets also
allows the research team to parse out aspects of the messy middle (Gotwals & Songer,
2010), and to better quantify the gradations of student work.

41
Table 3.2: CER Rubric for 9th Grade Data Story Assignments
Element Does Not Meet Expectations (1) Partially Meets Expectations (2) Meets Expectations (3) Exceeds Expectations (4)
Cla
im
Do
stud
ents
mak
e a
scie
ntif
ical
ly
accu
rate
cla
im?
Does not make an explicit claim, or claim does not respond to the question
Claim responds to the question, but is incomplete, or is scientifically inaccurate1
Claim responds to the question and is scientifically accurate1, but does not stand alone; may lack a qualitative or quantitative account
Claim responds to the question, is scientifically accurate1, and stands alone; includes a qualitative or quantitative account
Evi
denc
e D
o st
uden
ts u
se th
e gr
aph
to
supp
ort t
heir
cla
im?
Does not provide evidence, or evidence does not support the claim; use of irrelevant data
2+: At least 1 piece of evidence2 that supports the claim and follows from a properly constructed graph. Uses poor quantitative accounts or avoids them completely 2-: At least 1 piece of evidence2 that supports the claim but follows data from an ill-constructed graph. Uses poor quantitative accounts or avoids them completely
At least 1 piece of evidence2 that supports the claim and follows data from a properly constructed graph, with the inclusion of an appropriate quantitative account
At least 2 pieces of evidence2 that support the claim and follow data from a properly constructed graph, and includes more than one appropriate quantitative account
Rea
soni
ng
Do
stud
ents
con
nect
thei
r cl
aim
and
evi
denc
e to
a
scie
ntif
ic p
rinc
ipal
?
Does not provide reasoning, or reasoning is unrelated to claim, or evidence
2+: Reasoning is related to claim and evidence with an attempt to incorporate scientific principles, but does so inaccurately or incompletely 2- : Reasoning is related to claim and evidence, but is missing scientific principles, or may restate claim or evidence
Reasoning relates the claim and evidence using scientific principles correctly and completely
Reasoning relates the claim and evidence using scientific principles and provides a deeper understanding and/or addresses greater impacts
1Scientifically accurate with respect to the datasets provided on Tuvalabs.com 2Piece of evidence relates to one “topic/theme” used to support claim This rubric is adapted from Martin (2016) and McNeill and Krajcik (2012).
42
Development of the QR Rubric for 9th Grade Data Story Assignments. The QR Rubric for
9th Grade Data Story Assignments is derived from the Mayes et al. (2013) QR learning
progression. While this learning progression is effective for displaying all the expected QR skills
and abilities students should acquire as they move from 6-12th grade, the language is highly
complex and does not offer an effective way to score student Data Stories, nor does it provide a
manageable resource for teachers to use. Additionally, the research team found that not all QR
skills in the learning progression are necessary for the creation of a Data Story. Therefore, the
research team found it necessary to develop a rubric for this learning progression focusing only
on the QR skills used in the creation of a Data Story.
Through collaboration and discussion, the research team removed elements that were not
relevant in scoring the Data Story, incorporated elements that were not focal to the assignment
into other elements and summarized complex language to create a rubric to score students’ Data
Stories. This process is further described in Chapter 4.
The final version of the QR Rubric for 9th Grade Data Story Assignments (Table 3.3)
includes four overarching QR elements: Variable, Manipulation, Variation and Interpretation, at
three performance levels: Does not Meet (1), Partially Meets (2) and Meets expectations (3),
each of which are described in detail in Chapter 4.
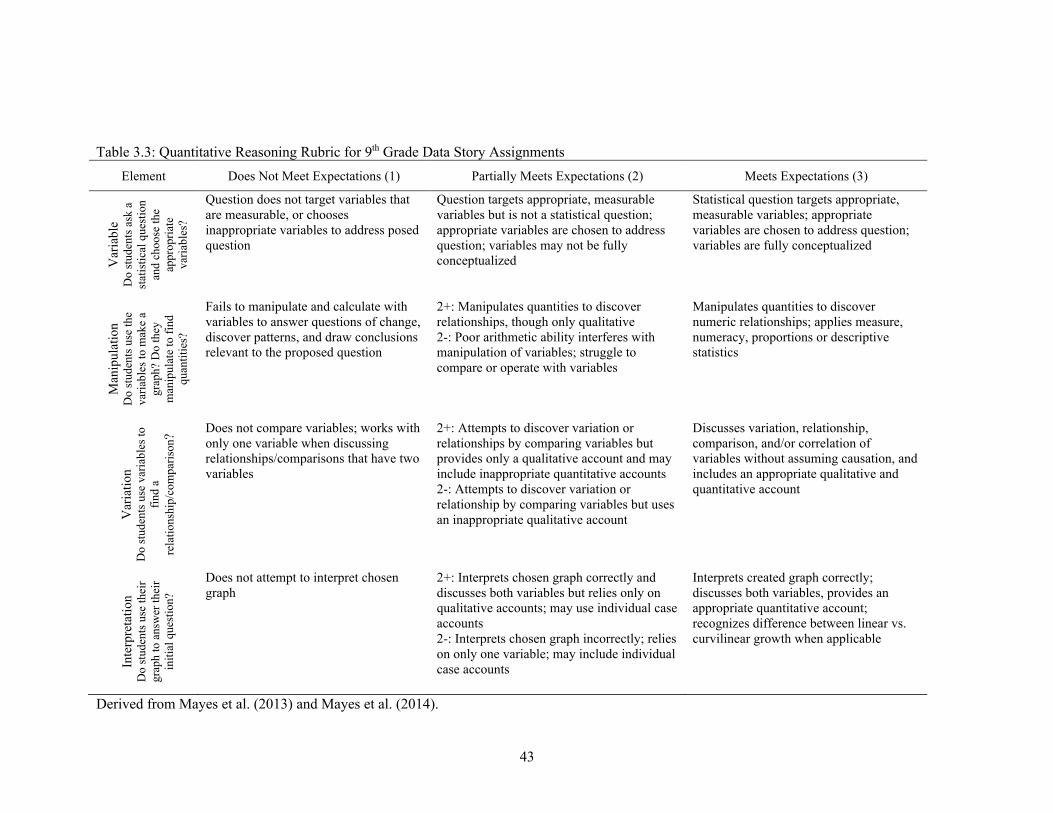
43
Table 3.3: Quantitative Reasoning Rubric for 9th Grade Data Story Assignments
Element Does Not Meet Expectations (1) Partially Meets Expectations (2) Meets Expectations (3)
Vari
ab
le
Do s
tudents
ask
a
stati
stic
al
quest
ion
and c
hoose
the
appro
pri
ate
vari
able
s?
Question does not target variables that
are measurable, or chooses
inappropriate variables to address posed
question
Question targets appropriate, measurable
variables but is not a statistical question;
appropriate variables are chosen to address
question; variables may not be fully
conceptualized
Statistical question targets appropriate,
measurable variables; appropriate
variables are chosen to address question;
variables are fully conceptualized
Man
ipu
lati
on
Do s
tudents
use
the
vari
able
s to
make a
gra
ph? D
o t
hey
manip
ula
te t
o f
ind
quanti
ties?
Fails to manipulate and calculate with
variables to answer questions of change,
discover patterns, and draw conclusions
relevant to the proposed question
2+: Manipulates quantities to discover
relationships, though only qualitative
2-: Poor arithmetic ability interferes with
manipulation of variables; struggle to
compare or operate with variables
Manipulates quantities to discover
numeric relationships; applies measure,
numeracy, proportions or descriptive
statistics
Vari
ati
on
Do s
tudents
use
vari
able
s to
find a
rela
tionsh
ip/c
om
pari
son? Does not compare variables; works with
only one variable when discussing
relationships/comparisons that have two
variables
2+: Attempts to discover variation or
relationships by comparing variables but
provides only a qualitative account and may
include inappropriate quantitative accounts
2-: Attempts to discover variation or
relationship by comparing variables but uses
an inappropriate qualitative account
Discusses variation, relationship,
comparison, and/or correlation of
variables without assuming causation, and
includes an appropriate qualitative and
quantitative account
Inte
rpre
tati
on
Do s
tudents
use
their
gra
ph t
o a
nsw
er
their
init
ial
quest
ion?
Does not attempt to interpret chosen
graph
2+: Interprets chosen graph correctly and
discusses both variables but relies only on
qualitative accounts; may use individual case
accounts
2-: Interprets chosen graph incorrectly; relies
on only one variable; may include individual
case accounts
Interprets created graph correctly;
discusses both variables, provides an
appropriate quantitative account;
recognizes difference between linear vs.
curvilinear growth when applicable
Derived from Mayes et al. (2013) and Mayes et al. (2014).
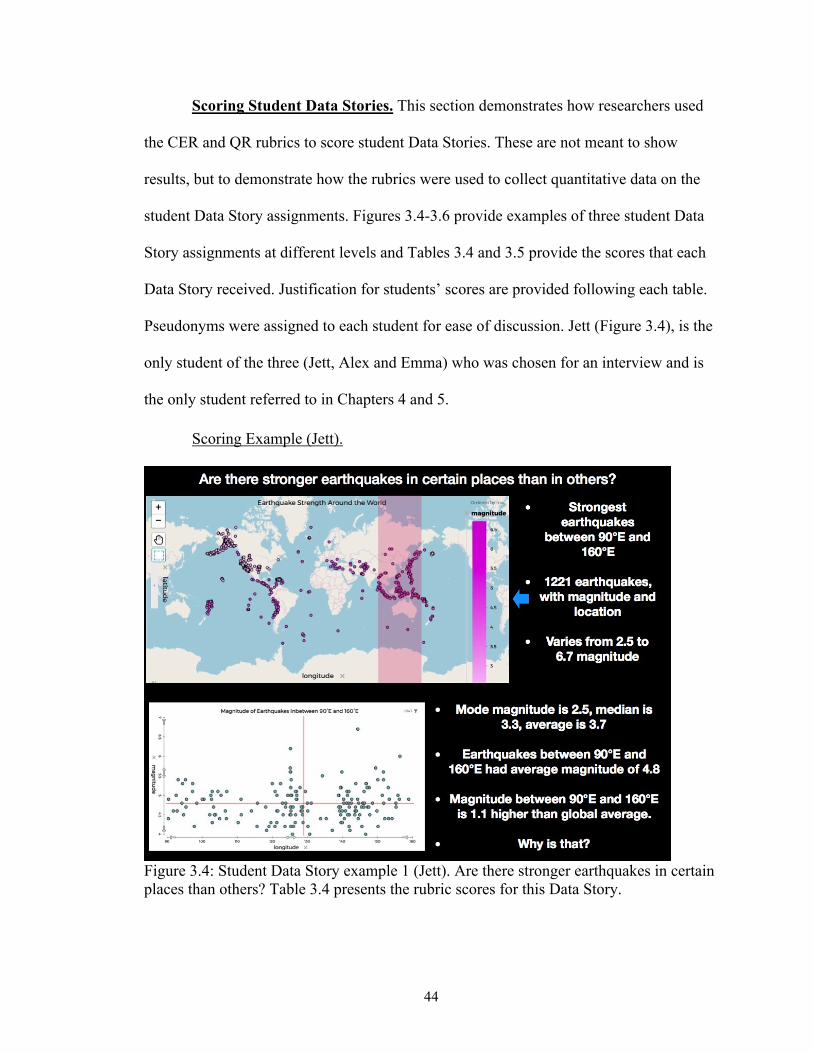
44
Scoring Student Data Stories. This section demonstrates how researchers used
the CER and QR rubrics to score student Data Stories. These are not meant to show
results, but to demonstrate how the rubrics were used to collect quantitative data on the
student Data Story assignments. Figures 3.4-3.6 provide examples of three student Data
Story assignments at different levels and Tables 3.4 and 3.5 provide the scores that each
Data Story received. Justification for students’ scores are provided following each table.
Pseudonyms were assigned to each student for ease of discussion. Jett (Figure 3.4), is the
only student of the three (Jett, Alex and Emma) who was chosen for an interview and is
the only student referred to in Chapters 4 and 5.
Scoring Example (Jett).
Figure 3.4: Student Data Story example 1 (Jett). Are there stronger earthquakes in certain places than others? Table 3.4 presents the rubric scores for this Data Story.

45
Table 3.4: Rubric scores for Jett (Figure 3.4) Rubric CER QR Element Claim Evidence Reasoning Variable Manipulation Variation Interpretation
Score 3 3 1 2 3 3 3
CER Rubric Scores for Jett. Jett’s claim is: “Strongest earthquakes between 90°E and
160°E.” This corresponds to 3 in Claim on the CER rubric because the claim is
scientifically accurate according to this data set, but it does not stand alone (by taking this
claim out of context it would lose its relevance) and does not include a quantitative
account both of which would have moved this student to a 4. While there is a quantitative
account in the final bullet that is relevant to the claim, it is not included in the claim
sentence, and is therefore not a part of this student’s claim.
Jett also receives a 3 in Evidence. He manipulates the data to determine the
average magnitude of earthquakes in the identified region (between 90°E and 160°E) and
compares that to his calculated global average. Together this accounts for 1) an
appropriate quantitative account and 2) a piece of supporting evidence. He also constructs
an appropriate graph. Jett uses one piece of evidence to support the claim in this Data
Story: the magnitude of this region is “1.1 higher than the global average.” Using two,
distinct pieces of evidence would have moved this student up to a score of 4.
Jett scores a 1 in Reasoning on the CER rubric, because there is no reasoning
provided for this explored phenomenon.
QR Rubric Scores for Jett. Jett scores a 2 in Variable. The question the he asks targets
appropriate, measurable variables and the appropriate variables are then used to answer
the question. The reason he does not achieve a 3 in Variable is because the question
asked is not a statistical question. A statistical question is a question that can be answered
using data, where the answer inherently includes some sort of variability; it is not a

46
deterministic answer. Jett asks: “Are there stronger earthquakes in certain places than
others?” which has a deterministic answer; yes or no.
As mentioned in Evidence from the CER Rubric, Jett manipulates quantities to
discover numeric relationships and works with the variables to identify the descriptive
statistics. Therefore, he receives a 3 for Manipulation.
For the element Variation, Jett quantitatively compares the region he selects to the
rest of the world and receives a 3.
Finally, he receives a 3 in Interpretation. Jett discusses both variables (magnitude
and region) and talks about the solution using quantities.
Scoring Examples 2 and 3 (Alex and Emma). The following two examples
(Figures 3.5 and 3.6), provide examples of student work who chose the same data set and
asked the same question, but came to different conclusions.
Figure 3.5: Student Data Story example 2 (Alex). How Does the Magnitude of an Earthquake Correlate to its Depth?
How Does the Magnitude of an Earthquake Correlate to its Depth?
The magnitude of an earthquake does correlate to its depth. The data is mostly normal but it does rise giving the positive correlation, which means that the higher the magnitude, the higher the depth. The data hardly has a mode, and the data is somewhat skewed.

47
Figure 3.6: Student Data Story example 3 (Emma). Is Magnitude and Depth in Earthquakes Correlated?
Alex and Emma both use an earthquake data set for their Data Story and ask,
essentially, if there is a correlation between magnitude and depth. While it may not look
like students are using the same data set, Alex has manipulated the data to not include
any earthquakes with magnitudes under seven and is therefore missing the lower portion
of data that is seen in Emma’s graph who has not eliminated any data. Alex comes to the
conclusion that there is a correlation by stating “the magnitude of an earthquake does
correlate to its depth,” while Emma comes to a different conclusion: “Magnitude and
depth are not correlated due to the fact, the trend line is not tight and data does not have a
specific pattern.” The resulting scores for both the CER and QR rubric are found in Table
3.5 and the justification for the scores are found in the following paragraphs.
ERYN KALOUSTIAN
IS MAGNITUDE AND DEPTH IN EARTHQUAKES CORRELATED?
‣ Claim: Magnitude and depth are not correlated considering the data has no pattern.
‣ Evidence: The data shows a very weak correlation which is not negative nor positive. The data is spread out into three different quadrants versus two. Also, most of the data is bunched together towards the left of the graph causing a weak correlation. Plus, the line of best fit does not touch more than half of the data
‣ Conclusion: In conclusion, magnitude and depth are not correlated due to the fact, the trend line is not tight and data does not have a specific pattern
I CHOSE THIS QUESTION BECAUSE I WAS SO SURE THEY WERE CORRELATED, BUT WHEN THEY WERE NOT I WAS SHOCKED.
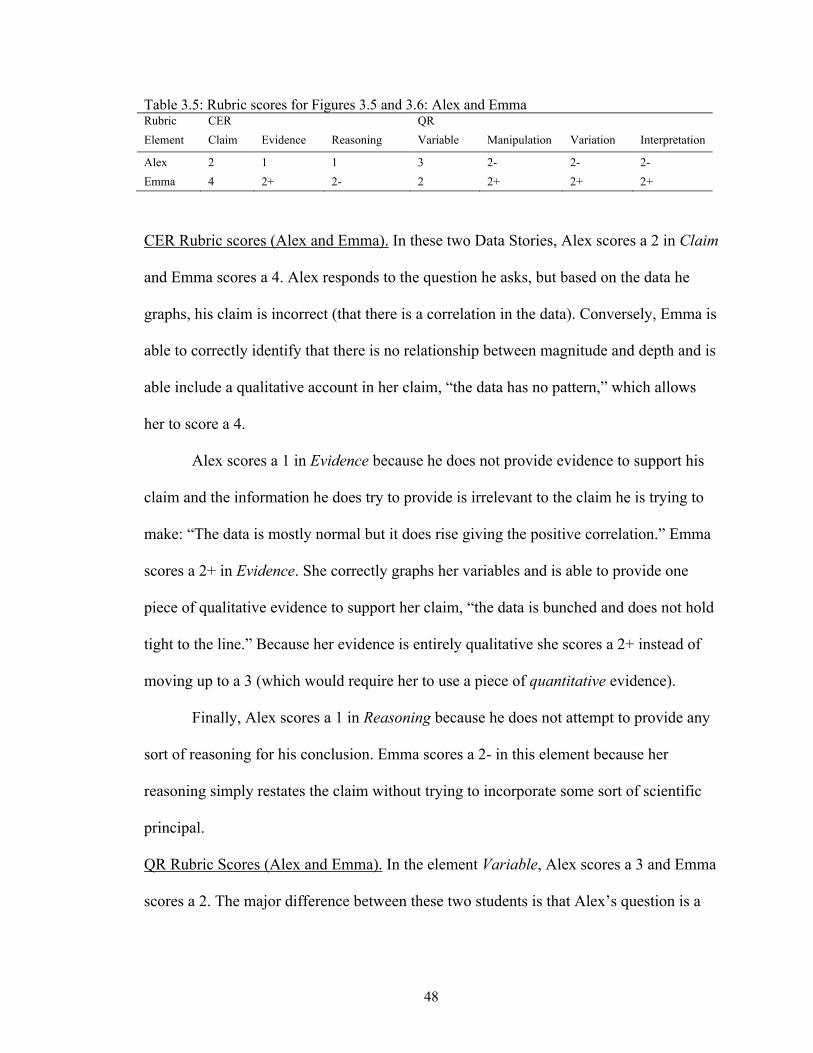
48
Table 3.5: Rubric scores for Figures 3.5 and 3.6: Alex and Emma Rubric CER QR Element Claim Evidence Reasoning Variable Manipulation Variation Interpretation
Alex 2 1 1 3 2- 2- 2- Emma 4 2+ 2- 2 2+ 2+ 2+
CER Rubric scores (Alex and Emma). In these two Data Stories, Alex scores a 2 in Claim
and Emma scores a 4. Alex responds to the question he asks, but based on the data he
graphs, his claim is incorrect (that there is a correlation in the data). Conversely, Emma is
able to correctly identify that there is no relationship between magnitude and depth and is
able include a qualitative account in her claim, “the data has no pattern,” which allows
her to score a 4.
Alex scores a 1 in Evidence because he does not provide evidence to support his
claim and the information he does try to provide is irrelevant to the claim he is trying to
make: “The data is mostly normal but it does rise giving the positive correlation.” Emma
scores a 2+ in Evidence. She correctly graphs her variables and is able to provide one
piece of qualitative evidence to support her claim, “the data is bunched and does not hold
tight to the line.” Because her evidence is entirely qualitative she scores a 2+ instead of
moving up to a 3 (which would require her to use a piece of quantitative evidence).
Finally, Alex scores a 1 in Reasoning because he does not attempt to provide any
sort of reasoning for his conclusion. Emma scores a 2- in this element because her
reasoning simply restates the claim without trying to incorporate some sort of scientific
principal.
QR Rubric Scores (Alex and Emma). In the element Variable, Alex scores a 3 and Emma
scores a 2. The major difference between these two students is that Alex’s question is a
49
statistical question: “How does the magnitude of an earthquake correlate to its depth?”
whereas Emma’s question is not: “Is magnitude and depth in earthquakes correlated?”
Alex scores a 2- in Manipulation because he does try to manipulate the data to
find relationships but in doing so, he discards part of the data (any earthquake below a
magnitude of 7), which interferes with his ability to operate with the variables. Emma
scores a 2+ because she is able to effectively manipulate the variables to discover
patterns, but she does not use any sort of quantitative value which prevents her from
scoring a 3.
In Variation, Alex tries to identify a relationship but does so incorrectly. There is
no relationship in the data he graphed (Figure 3.5). The blue line that is drawn on the
graph actually represents the opposite trend Alex claims. Alex scores a 2- in Variation
because he attempts to find a relationship but does so incorrectly. Emma is able to
correctly identify relationships, but again, does so only qualitatively and is therefore
scored at a 2+.
In Interpretation, Alex scores a 2- and Emma scores a 2+. Alex incorrectly
interprets his graph, but does make an attempt to interpret it, while Emma interprets her
graph correctly, but does not provide any quantitative values in her interpretation.
Interviews
The author conducted four, one-on-one, semi-structured student interviews and
one teacher interview in April 2018 to gain a deeper understanding of students’ thought
processes during Data Story creation and to better understand the expectations for each
assignment. The open-ended nature of the semi-structured interviews allowed participants
to fully engage with the material in their own way with limited influence from the
50
instructor, but also gave the interviewer some control over the direction of the
conversation (Creswell, 2012; Given, 2008). For full student and teacher semi-structured
interview protocols, see Appendices D and E, respectively.
The author audio-recorded interviews on two digital handheld devices in different
places around the room. Researchers initially used Temi, (Temi, 2018) an online audio to
text service, to transcribe all interviews. The author further revised the transcripts
manually for accuracy. Pseudonyms were provided for all interviewed students as well as
the classroom teacher.
Student Interviews. The goal of interviewing students was to 1) gain a deeper
understanding of students’ affordances and challenges in QR while creating a Data Story
and 2) better understand student thought process and experience during Data Story
creation. During these interviews students had to 1) reflect on a Data Story they had
created, 2) provide reasoning for decisions they had made, 3) note improvements that
could be made to their assignments, 4) construct a Data Story for the interviewer and
describe the steps taken throughout the process, and 5) provide feedback to a previously
“student constructed” Data Story the students had never seen. Individual student
interviews took place during their normal class time and were approximately 30 minutes
long.
As part of the interview, students were asked to think out loud as they created a
Data Story with a data set about weather balloons that they had not seen before. The data
set included 284 readings taken every few seconds onboard a weather balloon as it
ascended, carried by the wind through Earth’s atmosphere. Data included time, altitude,
ascent rate, pressure, humidity, external temperature, internal temperature, horizontal

51
speed, heading, latitude, longitude and battery. Students were free to choose any of these
variables to plot on their graphs.
Selection of Student Interviewees. The research team purposefully selected ten
students for one-on-one interviews based on rubric scores. Purposeful selection is a form
of opportunistic sampling which takes place after the research begins in an attempt to
obtain new information to better understand emerging trends and help answer the
research questions (Creswell, 2012; Patton, 1990).
The students selected for interviews represented a mixture of both sections of Ms.
Brown’s Honors Global Science class. They received a range of rubric scores from both
rubrics and demonstrated different pathways within the rubrics, (some progressing, some
remaining consistent and some retrogressing within certain elements of the rubric). The
research team expected these purposefully selected students to provide representative
examples of the range of thought processes during Data Story creation (Creswell, 2012).
Ms. Brown handed all ten students permission forms one week before interviews
were scheduled to obtain consent from parents. Only four students turned in the
permission form before the interview date, limiting the number of student interviews in
this study to four. However, these four students still represent all of the targeted groups
identified above and therefore researchers still felt it was appropriate to use these students
as a representative sample of the two classes (Seidman, 2006).
Teacher Interview. The goal of interviewing the classroom teacher was to gain
an understanding of the background and scaffolding Ms. Brown provided to the students
before assigning the Data Story assignments, as well as the expectations she had for the
students for each assignment. This information helped researchers to identify trends in
52
student work and understand what students were asked and expected to accomplish for
each assignment. The teacher interview took place after school in Ms. Brown’s classroom
and lasted approximately 45 minutes.
Data Analysis
The research team used both quantitative and qualitative methods to analyze all
collected data. The quantitative data used in this study are a result of scoring all student
Data Stories with both rubrics and the qualitative data come from the both the student and
teacher interviews.
Data Story Rubrics (Quantitative Analysis)
Using the two validated rubrics, researchers scored Data Story 1 and Data Story 2
and stored the resulting scores in an Excel spreadsheet. Researchers generated Excel
tables to summarize the number of students who scored at each performance level in the
two rubrics. The researchers further manipulated these tables to display the percent of
total students who scored at each level. While the rubrics levels were helpful to show a
gradation of student performance for each Data Story and to parse out the messy middle
(Gotwals & Songer, 2010), the research team was more interested in the general, overall
challenges for students, and found it hard to identify trends with so many levels.
Therefore, the researchers consolidated the rubric scores into two broader
performance categories for analysis: Meets Expectations and Does not Meet
Expectations. Scores 3 and 4 qualified as meeting the expectation, while scores 2+, 2-, 2
or 1 fell into Does not Meet. Researchers created contingency tables for each element
described in the rubrics and used a McNemar test to determine whether student
53
movement (gains or losses in scores) between Data Story 1 and Data Story 2 were
statistically significant.
Interviews (Qualitative Analysis)
Researchers used Strauss & Corbin's (1998) approach to grounded theory to
analyze student interview data. Grounded theory, first developed by Barney Glaser and
Anselm Strauss in 1967, allows researchers to look past their research as solely a way to
verify facts, but as a way to generate an explanation of them that is completely grounded
in the data (Glaser & Strauss, 1967). Grounded Theory is not used to test a hypothesis
from an existing framework and therefore researchers do not go into the coding process
with pre-determined codes in mind. Rather, they use the empirical data to develop a new
theory as common codes and themes emerge out of the data (Dunne, 2011). Grounded
theorists build theories slowly through constant comparison between incidents in the data,
incidents in the data and emerging categories, and emerging categories with other
emerging categories (Creswell, 2012).
In this study, researchers were interested in investigating the QR affordances and
challenges students face when constructing Data Stories further, and therefore used the
four elements described in the QR Rubric for 9th Grade Data Story Assignments as
guiding pillars during interview analysis. Using Strauss & Corbin’s (1998) outline for
approaching grounded theory, the research team’s first step was to use open-coding, or in
vivo coding on two student interviews to expose important thoughts and ideas in the
words of the participants and to keep the analysis as tightly grounded in the data as
possible (Creswell, 2012; Glaser & Strauss, 1967). An example using the original
transcript and the corresponding in vivo code are provided in Table 3.6.

54
To reduce the error and bias associated with grounded theory in this study, the
author and another member of the research team individually open-coded one student
transcript line-by-line using NVivo 12 Pro software (NVivo, 2018) and compared codes
for intercoder reliability (Hruschka et al., 2004; Kurasaki, 2009; Strauss & Corbin, 1998).
Intercoder reliability is a measure of the amount of agreement between two researchers as
they code interview data and is used to demonstrate that the emerging themes are shared
constructs from the data and not figments of one researcher’s imagination (Kurasaki,
2000).
Researchers reached a reliability of 95% after initial open-coding. Because of the
high level of reliability, researchers collaborated to open code a second student transcript.
Through the second transcript coding researchers continually discussed segments to code,
generated memos together and deliberated over emerging categories.
As the most important in vivo codes began to emerge and common relationships
became apparent, the researchers began to move away from the in vivo codes, and
towards abstract concepts called categories (Strauss & Corbin, 1998). These categories
define a certain phenomenon that the researcher has identified as important in the data,
and help to identify the problems, and concerns that are important to the study (Strauss &
Corbin, 1998). For continued reliability, the research team also brought the raw in vivo
codes to the RiSE Center Research group who read through the codes and offered their
input on emerging categories. Table 3.6 demonstrates how the original transcript was
paired down to an in vivo code which was later condensed with other in vivo codes to
develop emerging categories.
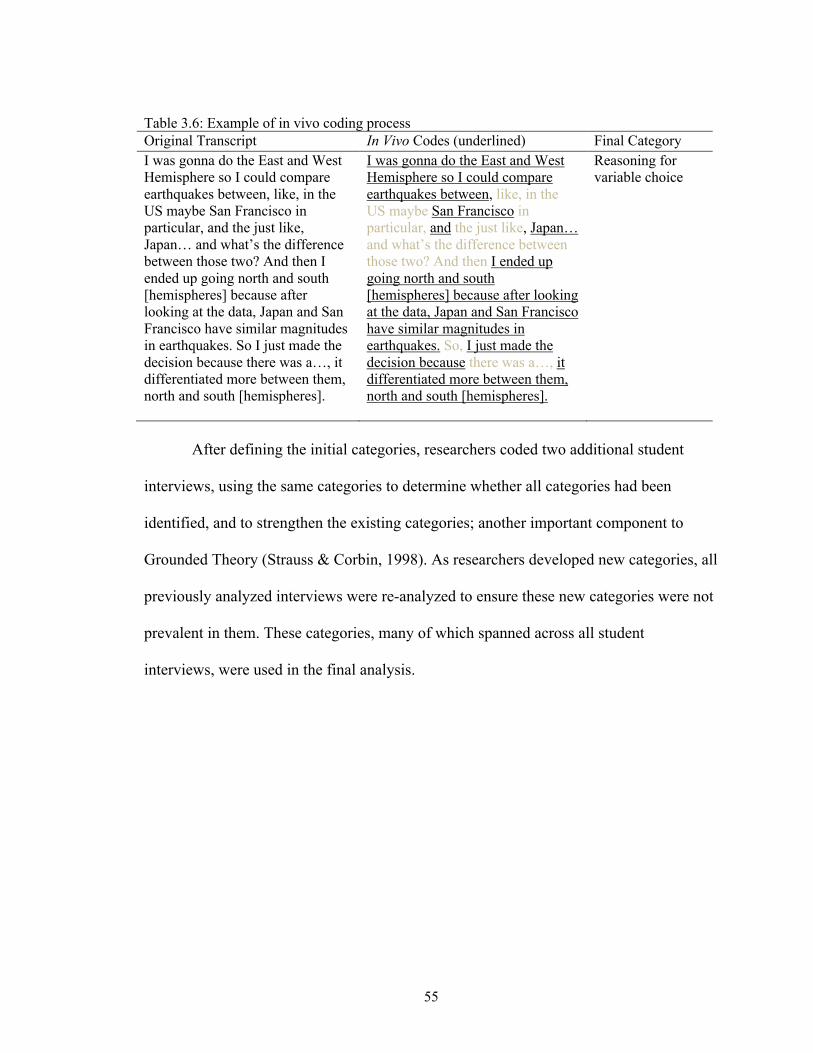
55
Table 3.6: Example of in vivo coding process Original Transcript In Vivo Codes (underlined) Final Category I was gonna do the East and West Hemisphere so I could compare earthquakes between, like, in the US maybe San Francisco in particular, and the just like, Japan… and what’s the difference between those two? And then I ended up going north and south [hemispheres] because after looking at the data, Japan and San Francisco have similar magnitudes in earthquakes. So I just made the decision because there was a…, it differentiated more between them, north and south [hemispheres].
I was gonna do the East and West Hemisphere so I could compare earthquakes between, like, in the US maybe San Francisco in particular, and the just like, Japan… and what’s the difference between those two? And then I ended up going north and south [hemispheres] because after looking at the data, Japan and San Francisco have similar magnitudes in earthquakes. So, I just made the decision because there was a…, it differentiated more between them, north and south [hemispheres].
Reasoning for variable choice
After defining the initial categories, researchers coded two additional student
interviews, using the same categories to determine whether all categories had been
identified, and to strengthen the existing categories; another important component to
Grounded Theory (Strauss & Corbin, 1998). As researchers developed new categories, all
previously analyzed interviews were re-analyzed to ensure these new categories were not
prevalent in them. These categories, many of which spanned across all student
interviews, were used in the final analysis.

56
CHAPTER 4
RESULTS
This chapter contains the quantitative and qualitative results addressing the following
research questions:
1. What are the affordances and challenges students face when constructing Data
Stories?
2. What QR skills do students use when constructing evidence-based explanations in
Data Stories?
3. What are the affordances and challenges students face within QR while
constructing Data Stories?
Research Question 1: Affordances and Challenges to Constructing
Data Stories
The first testable question explores the affordances and challenges 9th grade
students faced while constructing Data Stories. To answer this question researchers used
both student interview data and the CER Rubric for 9th Grade Data Story Assignments
(Table 3.2) to score students’ Data Stories (Data Story 1 and Data Story 2). Student
interviews were used to describe personal student emotional affordances/challenges and
the CER rubric helped to identify affordances and challenges academically during Data
Story creation.
Student Feelings Towards Data Story Assignments
Students generally had positive feelings towards Data Story assignments and felt
the assignment had helped them look at data critically and develop appropriate graphs to
display the data.

57
When asked what students learned from the Data Stories, or what they liked about
the Data Stories, interviewed students responded with things like, “I’d say probably
learned how to look at data critically,” and “I like them because they teach you how to
use evidence, make a claim with it, and just how to work with data.” One student liked
the challenge of Data Story 2, where students were asked to use data to connect two
different earth systems: “I thought it was kinda interesting because I had to think about
how it would affect… how this data would affect other Earth systems.”
Two interviewed students also felt that the Data Stories supported them in
learning how to use different types of graphs to represent data in appropriate ways. One
student stated:
I have made so many graphs that just don't make sense because I've used like bar
graphs, histograms to just display something that could be displayed with a
scatterplot. And so [the Data Stories] really helped when [Ms. Brown] emphasizes
points, like if you make it this way, it's going to be so much clearer you. And it
really is.
Another student echoed this response:
At like the beginning of the year, we just like... like last year we stuck with a
couple of specific graphs but now once we’re in high school and realize that there
might be more graphs, and that they actually have to do with specific things like
time, correlation…

58
Student CER Rubric Performance Results for Data Story 1 and Data Story 2
Researchers scored all student Data Story assignments and converted the number
of students who scored at each level to percentages. Figure 4.1 presents the percentage of
total students who scored at each performance level for each element in Data Story 1 and
Data Story 2. Score differences between Data Story 1 and Data Story 2 are not
statistically significantly different.
Figure 4.1: Student CER rubric performance results for Data Story 1 (DS1) and Data Story 2 (DS2). Represented in percent of total students (n = 31). Note. In Claim, there are only four levels the students can score in (1, 2, 3 or 4), there is not a 2-/2+ distinction. Therefore, in this figure, a 2- should be interpreted as equivalent to a 2 for Claim.
Results for Claim. Overall, students received the highest scores in Claim. For
Data Story 1 the largest percentages of students scored a 3 or 2 (38.7% of total students at
each level) in the element Claim, meaning they created a claim that either responded to
the question and the claim was scientifically accurate (score of 3), or they created a claim
that responded to the question, but the claim was incomplete, or scientifically inaccurate
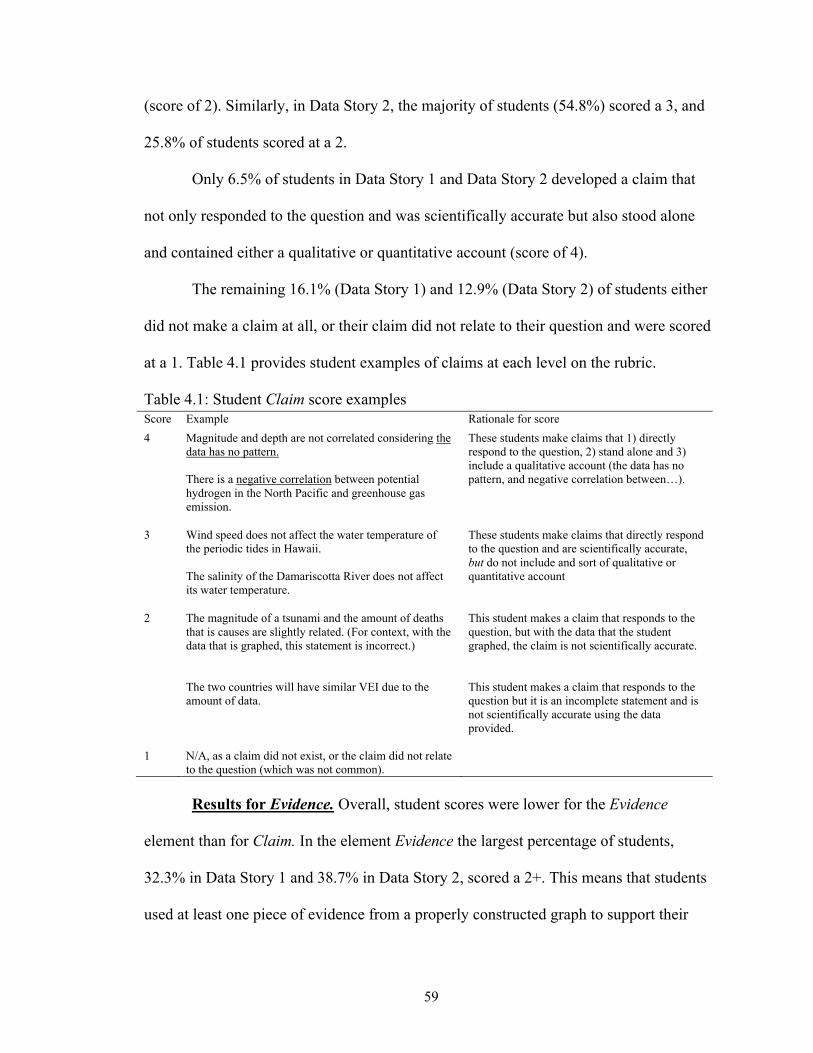
59
(score of 2). Similarly, in Data Story 2, the majority of students (54.8%) scored a 3, and
25.8% of students scored at a 2.
Only 6.5% of students in Data Story 1 and Data Story 2 developed a claim that
not only responded to the question and was scientifically accurate but also stood alone
and contained either a qualitative or quantitative account (score of 4).
The remaining 16.1% (Data Story 1) and 12.9% (Data Story 2) of students either
did not make a claim at all, or their claim did not relate to their question and were scored
at a 1. Table 4.1 provides student examples of claims at each level on the rubric.
Table 4.1: Student Claim score examples
Results for Evidence. Overall, student scores were lower for the Evidence
element than for Claim. In the element Evidence the largest percentage of students,
32.3% in Data Story 1 and 38.7% in Data Story 2, scored a 2+. This means that students
used at least one piece of evidence from a properly constructed graph to support their
Score Example Rationale for score 4 Magnitude and depth are not correlated considering the
data has no pattern.
These students make claims that 1) directly respond to the question, 2) stand alone and 3) include a qualitative account (the data has no pattern, and negative correlation between…). There is a negative correlation between potential
hydrogen in the North Pacific and greenhouse gas emission.
3 Wind speed does not affect the water temperature of the periodic tides in Hawaii.
These students make claims that directly respond to the question and are scientifically accurate, but do not include and sort of qualitative or quantitative account The salinity of the Damariscotta River does not affect
its water temperature.
2 The magnitude of a tsunami and the amount of deaths that is causes are slightly related. (For context, with the data that is graphed, this statement is incorrect.)
This student makes a claim that responds to the question, but with the data that the student graphed, the claim is not scientifically accurate.
The two countries will have similar VEI due to the amount of data.
This student makes a claim that responds to the question but it is an incomplete statement and is not scientifically accurate using the data provided.
1 N/A, as a claim did not exist, or the claim did not relate to the question (which was not common).

60
claim, however, students may have used poor quantitative accounts in their evidence or
avoided them completely.
Examples of poor quantitative accounts include case accounts, or specific areas of
interest on a map, for example, “As shown in the graph, the high of both is 3.” While this
statement does include a quantitative account, “the high of both is 3,” which is the
maximum value of the graph, the account does not provide the reader with much valuable
information about the data set as a whole, and is therefore considered in this study to be
an inappropriate quantitative account. In other 2+ cases, students completely avoid using
quantitative accounts, for example, “These graphs show how the amount of ozone
increases with the temperature to a certain point, but then begins to drop when the
temperature became higher.”
To move from a 2+ to a 3 on the rubric requires the use of a quantitative account.
For example, “The line of best fit has a downward slope, which means the ice out dates
today are on average, about 10 days earlier than they were 165 years ago.” Only 9.7% of
students in Data Story 1 and 16.1% of students in Data Story 2 were able to achieve a 3.
No students scored a 4 on the first Data Story, and only one student did on the
second story. Scoring a 4 requires students to use at least two pieces of quantitative
evidence to support their claim from a properly constructed graph.
58% and 41.9% of students did not score higher than a 2- on Data Story 1 and
Data Story 2, respectfully. This means that the student did not provide any evidence or
only irrelevant evidence (score of 1), or their evidence was based on an ill-constructed
graph (score of 2-).
61
Results for Reasoning. In Reasoning, the majority of students (61.3% and
41.9%) scored a 1 for both Data Stories. This means the students did not provide
reasoning or related reasoning to connect the evidence and claim, as framed in the
McNeill and Krajcik (2012) framework.
Students who attempted to relate the claim and evidence but did not include any
scientific principles as part of their reasoning, or simply restated the claim and evidence
received a score of 2- (25.6% and 22.6%). For example, a student who simply restated
the claim and evidence states in their Reasoning section, “Magnitude and depth are not
correlated due to the fact that, the trend line is not tight and data does not have a specific
pattern.” While this is true, this statement is an example of evidence that supports the
claim, it is not a scientific principle the student explores to explain why magnitude and
depth are not correlated, scientifically.
The remaining 12.9% and 35.5% of students either attempted to connect the claim
and evidence through scientific principles but did so either incorrectly or incompletely
(score 2+), or were able to relate the claim and evidence using scientific principles
correctly and completely (score 3). In a Data Story exploring the trend of the extent of
sea ice over time, a student who scored a 3 in Reasoning wrote, “The atmosphere and
cryosphere are interacting due to global climate change. Atmospheric pollution causes
global climate change which melts the ice in the Cryosphere.” This student brought in an
outside connection (pollution) to describe the trend in the graph.
No students scored 4 in Reasoning for either Data Story, which would have
required students to relate the claim and evidence and address the greater impacts of their
findings.
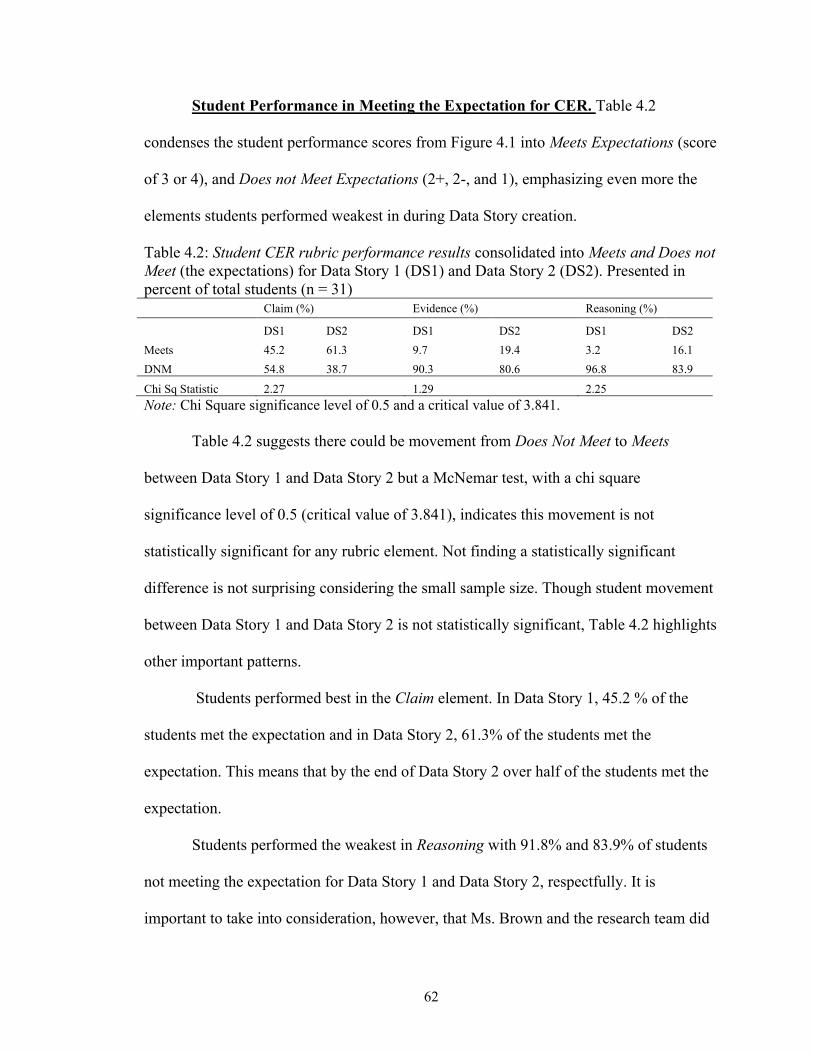
62
Student Performance in Meeting the Expectation for CER. Table 4.2
condenses the student performance scores from Figure 4.1 into Meets Expectations (score
of 3 or 4), and Does not Meet Expectations (2+, 2-, and 1), emphasizing even more the
elements students performed weakest in during Data Story creation.
Table 4.2: Student CER rubric performance results consolidated into Meets and Does not Meet (the expectations) for Data Story 1 (DS1) and Data Story 2 (DS2). Presented in percent of total students (n = 31) Claim (%) Evidence (%) Reasoning (%)
DS1 DS2 DS1 DS2 DS1 DS2 Meets 45.2 61.3 9.7 19.4 3.2 16.1 DNM 54.8 38.7 90.3 80.6 96.8 83.9 Chi Sq Statistic 2.27 1.29 2.25 Note: Chi Square significance level of 0.5 and a critical value of 3.841.
Table 4.2 suggests there could be movement from Does Not Meet to Meets
between Data Story 1 and Data Story 2 but a McNemar test, with a chi square
significance level of 0.5 (critical value of 3.841), indicates this movement is not
statistically significant for any rubric element. Not finding a statistically significant
difference is not surprising considering the small sample size. Though student movement
between Data Story 1 and Data Story 2 is not statistically significant, Table 4.2 highlights
other important patterns.
Students performed best in the Claim element. In Data Story 1, 45.2 % of the
students met the expectation and in Data Story 2, 61.3% of the students met the
expectation. This means that by the end of Data Story 2 over half of the students met the
expectation.
Students performed the weakest in Reasoning with 91.8% and 83.9% of students
not meeting the expectation for Data Story 1 and Data Story 2, respectfully. It is
important to take into consideration, however, that Ms. Brown and the research team did
63
use the same framework for Reasoning (see Chapter 2). Because Ms. Brown did not ask
students to include a scientific principle into the reasoning portion of the Data Story, and
that is what moves students in the CER Rubric for 9th Grade Data Story Assignments
from a DSM to a Meets, we did not expect high scores, or student progression between
Data Stories in this element of the rubric. Therefore, for the purposes of this study, we
will disregard this data.
Finally, students faced substantial challenges in the Evidence element of the CER
Rubric, with 90.3% and 80.6% for Data Story 1 and Data Story 2, respectively. These are
values that raise concerns and that the research team felt necessary to investigate further.
The research team developed the QR Rubric for 9th Grade Data Story Assignments to
take a deeper look into why students score so low in the Evidence element of the CER
Rubric for 9th Grade Data Story Assignments.
Research Question 2: QR Skills Used in Constructing Data Stories
The QR Rubric for 9th Grade Data Story Assignments (Table 3.3) is a result of
investigating research question 2. The goal of developing this rubric was to identify the
QR skills students use when constructing Data Story assignments and to identify which
elements students performed the weakest in hopes of detecting potential underlying
mathematical difficulties that may impede science learning. An effective rubric would
capture a wide range of student scores that could be used to evaluate the progression of
students’ QR skills and be a tool that teachers could bring into their 9th grade classrooms.
QR Rubric Development
Through investigation of all student Data Stories and collaboration with experts in
the field, researchers narrowed down and consolidated the full list of 12 elements

64
described in Quantitative Reasoning Learning Progression (Mayes et al., 2013) to
develop a modified progression/rubric to map the skills students use when constructing
Data Story assignments.
To narrow down the list of elements, researchers used the student Data Story
assignments to identify which of the 12 elements from the QR learning progression were
most necessary in constructing Data Stories. Some were not as prominent or as important
to explicitly state. For example, in the original learning progression Predictions is
separate element, which suggests that students should be able to use the graph they have
created to make some sort of quantitative prediction. For example, a student making a
prediction may state: “in the next five years, I believe that the concentration of CO2 will
rise in the atmosphere by 20ppm.” While this is an important QR skill, it is not something
that is explicitly asked for in Data Story assignments and not something that every
student incorporates. For that reason, the research team decided to merge this element
into the Interpretation element on the QR Rubric for 9th Grade Data Story Assignments.
Students may still use predictions while interpreting their graph, but they are not
penalized if they do not.
Other elements were removed from the original learning progression simply
because they were not relevant to student Data Story assignments. For example, the
element, Refine Model, was excluded from the rubric because a final Data Story
assignment does not require that students refine their model, change parameters, or
extend their model to a new situation, all of which are aspects of the element Refine
Model on the original learning progression. For this reason, Refine Model was removed
for the purposes of the QR Rubric.
65
While there is an upper level in the original learning progression, this level
represents what students should know when they graduate from high school (12th grade).
Students in this study are primarily in 9th grade and the research team did not find any
students who scored above a 3 (Meets Expectations) on the learning progression.
Therefore, the researchers felt it was appropriate to drop the upper anchor of the learning
progression for the purpose of the QR rubric
Through many iterations of the rubric, the research team developed four
summative elements capturing the skills students draw upon when constructing Data
Story assignments to include in the QR Rubric for 9th Grade Data Story Assignments,
they are: Variable, Manipulation, Variation and Interpretation.
To ensure inter-rater reliability of the rubrics an additional member of the
research group and two MST students scored an intentionally selected sample of ten
student Data Stories. To ensure consistency in rubric scoring, terms included in the two
rubrics were defined in a codebook (Appendix F). The author trained all three raters on
how to use the codebook and led them through the coding of three example Data Stories
to increase familiarity with both rubrics. Raters were free to ask any clarifying questions.
The sample of student work chosen for inter-rater reliability represented the full range of
scores from both rubrics and a mix of Data Stories that provided both straightforward and
challenging scoring. Scores were discussed until all four raters reached at least 95%
agreement for both rubrics (McAlister et al., 2017). Researchers worked with the raters to
revise the rubrics until no further clarification was needed.

66
Elements of the QR Rubric
Variable (in the QR rubric) refers to a student’s ability to develop and ask a
statistical and measurable question given a choice of variables; it is how students choose
what variables they are going to work with. Mayes et al. (2013) describe this as a part of
the act of quantification. Quantification is a conceptual process that enables a student to
move conceptually between real objects, graphical representations or numeric
computations of them, and then back to the real-world context seamlessly (Mayes et al.,
2013).
In this rubric, students meet the expectation when they are able to fully
conceptualize variables. This suggests that students understand what the variables mean
in the context of a real-world application and are able to choose variables to work with
that are measurable, appropriate, and can be used to answer a statistical question (a
question where the answer inherently includes some variability). Examples of student
work are in the subsequent paragraphs.
After students are able to quantify variables in context, they need to begin
considering the measurement of these variables, and how they can be manipulated to
discover quantitative relationships. The Manipulation element in the rubric measures
students’ number sense, ability to effectively manipulate with quantities, and ability to
manipulate with variables to develop a graph, in order to develop a quantitative solution.
This includes a student’s ability to reason with numbers, use arithmetic processes
(addition, subtraction, multiplication and division), use descriptive statistics and
generally, use numbers to talk about relationships (Mayes et al., 2014, 2013; Steen,
2001).

67
The Variation element assesses whether students are able to describe and discover
relationships between the two quantified variables (Mayes et al., 2013). Mayes et al.
(2013) describe that in this element, students should be able to identify trends to interpret
change, explain covariation between two variables and determine both the direction and
strength of the relationship. However, in Data Stories, it is not required that students
choose two numerical variables that correlate to investigate. For example, a student may
choose to compare summer temperatures between two different cities, thus comparing a
numeric variable (temperature) with a categorial variable (two different cities). One
appropriate way a student may display this data is through a boxplot (Figure 4.2).
Figure 4.2: Example boxplot of monthly average temperature between Bangor, ME and San Diego, CA
While there is no correlation between the two variables because of how these
variables have been graphed, there are still quantitative relationships and comparisons
students could identify and in this Data Story. For example, a student may say that
Bangor, ME has a larger variability in temperatures than San Diego, CA because the

68
interquartile range (IQR) of the two is different. While Bangor’s IQR is 37.25°F, the IQR
of San Diego’s temperature is only 8.65°F.
As demonstrated with this example, not all Data Stories will have a correlation.
Because of the research team felt it was necessary to modify the Variation element
defined by Mayes et al. (2013) to include all correlations, relationships and comparisons.
Interpretation is the final element considered in the QR rubric. This element
measures a students’ ability to bring all the pieces of their Data Story together to interpret
their evidence correctly and put the problem back into context. To meet the standard in
Interpretation students must be able to correctly use the model they have created to
explain evidence that supports their claim, while continuing to consider the context of the
problem. This element is a combination of several elements from the original learning
progression within the Quantitative Interpretation and Quantitative Modeling progress
variables because it requires students to interpret a model that they have created. The
hypothetical example in Figure 4.2 demonstrates a student who is able to create a graph
that effectively displays the data (quantitative modeling) and then correctly interprets the
graph while discussing the IQR (quantitative interpretation).
The QR Rubric for 9th Grade Data Story Assignments was able to successfully
describe the major elements necessary for creating Data Stories and capture a range of
student scores (Figure 4.3), verifying its effectiveness as a rubric. Thus, this rubric is an
effective tool for scoring 9th grade student Data Story assignments.

69
Research Question 3: Affordances and Challenges of Using QR while
Constructing Data Stories
The third testable question investigates students’ affordances and challenges of
QR during Data Story construction. Results are based on a combination of sample student
Data Stories, their respective QR scores, and student interviews.
QR Rubric Results
Researchers used the QR Rubric to score all Data Stories to identify which QR
elements students performed the weakest in during Data Story construction (Figure 4.3).
The values in Figure 4.3 represent the total percentage of students at each level for each
element (Data Story 1 and Data Story 2). Student performance scores between Data
Story 1 and Data Story 2 are not statistically significantly different.
Figure 4.3: Student QR rubric performance results for both Data Story 1 (DS1) and Data Story 2 (DS2). Represented in percent of total students (n = 31) Note that for Variable there is not a 2+ level, students may only score a 1, 2, or 3. Therefore, in this figure, a 2- represents a 2 in Variable.

70
Results for Variable. In the element Variable, the majority of students (67.7% in
Data Story 1 and 61.3% in Data Story 2) scored a 2. This means students formulated
questions that targeted appropriate variables, however the questions were not statistical
questions, and oftentimes the variables were not fully conceptualized. For example,
students who scored a 2 in Variable asked questions like: “Do asteroids have a larger
diameter in Canada, Russia, Australia, or the USA?,” “Is volcano elevation increasing
over time?,” or “Do lower elevation volcanos erupt more often?” While these are
questions that can be answered with data, they are not questions whose answer inherently
includes variability, rather, these questions are answered with a definitive answer.
Students who scored a 3 in Variable (12.9%/35.5%) formulated a statistical
question, chose appropriate variables to graph, and seemed to have a full conceptual
understanding of the variables. Example student questions at a 3 include: “How does the
VEI of a volcano compare to the number of days it lasts?,” “How does the elevation of
volcanos in the Philippines compare to the elevation of volcanos in Indonesia?,” and
“What effect does herbicide usage have on honeybee populations?”
The remaining students (19.4%/3.2%) either did not ask a question targeting
measurable variables or were unable to choose appropriate variables to address the posed
question and scored a 1.
Results for Manipulation. In the Manipulation element, the majority of students
in both Data Story assignments scored a 2+ (41.9%/38.7%), which suggests students
manipulated variables to discover relationships but only did so in a qualitative way. Many
students made appropriate graphs to discover relationships, but only used qualitative

71
phrases to talk about them, for example, “the two charts show a fairly steep and
consistent slope upwards”, or “there is a clear downward trend.”
Students who were able to manipulate quantities and to discover and reason about
relationships, measure, proportions or descriptive statistics earned a 3 (12.9% in Data
Story 1 and 19.4% in Data Story 2).
The remaining 45.2% of students in Data Story 1 and 40% of students in Data
Story 2 scored a 2- or 1. These students tried to manipulate with values but were unable
to do so due to poor arithmetic skills (2-), or did not attempt to manipulate the variables
in any way to make them more meaningful to the audience (1).
Results for Variation. The Variation element scores students on their ability to
discuss the relationship or comparison between the two variables. Most students (45.2%
and 58.1%) scored a 2+, meaning they discussed the relationship, but did not include any
sort of quantitative statements in their discussion. For example, “The average sea levels
are rising at a slow and steady rate. I know this because the least squares line is at a small
slant upward meaning it is rising slowly as time progresses,” or “There is very little
correlation between the air temperature and water temperature at two meters. The line of
best fit is almost flat, meaning that there is not a lot of correlation between the two
variables.”
On the other hand, 12.9%/6.5% of the students did include some sort of
quantitative account into their discussion about the relationship of the two variables, for
example, “If this claim is true, there would be a decrease of 0.00000232 ppm in the North
Pacific’s average amount of pH for every ppm of GHG released into the atmosphere.”
72
9.7% of students in Data Story 1 and 25.8% of students scored a 2-, which means
they attempted to discuss the variation, but did so inappropriately. The remaining
32.3%/9.7% of students scored a 1 meaning they either did not attempt to discuss the
variation between variables or chose to only discuss one variable when working with two.
Results for Interpretation. In the Interpretation element of the rubric, students
scored the best, again, at the 2+ level (45.2% in Data Story 1 and 61.3% in Data Story 2),
meaning they were able to pull all their information to interpret their graph correctly and
discuss both variables, but only used qualitative accounts in the discussion. Students at
this level may have also included individual case accounts in their interpretation when
attempting to discuss the data as an aggregate.
Students who went an extra step and were not only able to interpret their graph
correctly and include a discussion of both variables, but include an appropriate
quantitative account scored at a level 3 (3.2% in Data Story 1 and 3.2% in Data Story 2).
Students who attempted to, but incorrectly interpreted their graphs scored a 2-
(38.7%/32.3%), and students who did not attempt to interpret their graph at all scored a 1
(9.7%/3.2%).
Student Performance in Meeting the Expectation for QR. To get a better sense
of student movement towards meeting the expectation, scores were further consolidated
into Meets Expectations (score of 3) and Does not Meet Expectations (DNM) (Score or 1,
2- or 2+) (Table 4.3).

73
Table 4.3: Student QR rubric performance results consolidated into Meets and Does not Meet (the expectations) for Data Story 1 (DS1) and Data Story 2 (DS2). Presented in percent of total students (n = 31). Variable Manipulation Variation Interpretation
DS 1 DS 2 DS 1 DS 2 DS 1 DS 2 DS 1 DS 2 Meets 12.9 35.5 12.9 19.4 12.9 6.5 6.5 3.2 DNM 87.1 64.5 87.1 80.6 87.1 93.5 93.5 96.8 Chi Sq Statistic 3.27 0.5 0.67 0.33 Note: Chi Square significance level of 0.5 and a critical value of 3.841.
A McNemar test, with a chi square significance level of 0.5 (critical value 3.841),
suggests that student movement between Data Story 1 and Data Story 2 is not statistically
significant for any element identified in the QR Rubric. Calculated chi square statistics
are: 3.27, 0.5, 0.67, and 0.33 for Variable, Manipulation, Variation, and Interpretation,
respectfully.
While movement between the two Data Stories is not statistically significant, less
than 50% of students achieved the expectation in any of the elements for either Data
Story. By the end of the year (Data Story 2), 64.5%, 80.6%, 93.5% and 96.8% of students
still did not meet the expectation in Variable, Manipulation, Variation and Interpretation,
respectfully. To gain insight why students struggled to meet expectations in all elements
of the QR rubric, researchers felt it was necessary to conduct student interviews for an in-
depth perspective.
Interview Results
Through many NVivo coding cycles the research team identified recurring aspects
within the four QR elements identified in the QR Rubric for 9th Grade Data Story
Assignments. These major aspects include: 1) how students initially approach Data
Stories, 2) what data students believe constitutes a Data Story, and 3) how students talk

74
about data. Each of these themes are explained in further detail with student examples in
the subsequent paragraphs.
Students interviewed will be referenced frequently throughout this section. Table
4.4 presents each interviewed students’ performance scores in both rubrics for Data Story
1 and Data Story 2. While these scores are not necessarily tied to the work students
describe in their interviews, the table provides an overall idea of the level of student
performance throughout the school year. In order of increasing total points for both Data
Stories: Ann = 25, Elliot = 27, Kyah = 32 and Jett = 36. Therefore, Kyah and Jett
represent the higher rubric score and Elliot and Ann represent the lower rubric scores.
Table 4.4: Interviewed student rubric performance scores for Data Story 1 (DS1) and Data Story 2 (DS2).
How Students Approached a Data Story. When students had a firm grasp on
the context of the problem and were able to situate the variables within that context, they
were better able to conceptualize the problem as a whole to develop a meaningful,
context-driven question. Conversely, students who struggled to contextualize variables
seemed to disassociate the variables they were talking about from the problem and take a
trial-and-error approach to developing their question.
Each interviewee was given a data set collected by a weather balloon that they
had not seen before and was asked to think out loud as they developed a Data Story. The
four interviewees approached creating a Data Story in one of two ways. Two of them, Jett
and Kyah, began by taking the time to contextualize the variables, ask appropriate
Claim DS 1 DS2
Evidence DS 1 DS2
Reasoning DS 1 DS2
Variable DS 1 DS2
Manipulation DS 1 DS2
Variation DS 1 DS2
Interpretation DS 1 DS2
Jett 3 3 3 4 1 1 2 3 3 3 3 2+ 3 2+ Kyah 3 3 3 2+ 2+ 2+ 2 2 3 2+ 2+ 2+ 2+ 2+
Elliot 2 3 2- 2- 2- 2- 2 2 1 1 2- 2- 2- 2-
Ann 2 3 1 1 1 1 2 3 1 2+ 2- 2+ 2- 2+

75
questions and develop a question based on their understanding of the data set. The other
two students, Elliot and Ann, explored the variables in a trial-and-error way, by placing
variables in the graphing area until they found something interesting to graph.
The following quotes begin just after the interviewee was given the data set and
progress until they develop the question for their Data Story.
Contextualized Variables First. Jett and Kyah both took the time to search through
the variables and attempted to understand their context. With that information, these two
students were able to develop a context-relevant question to answer. The students
considered the types of data the weather balloon collected and tried to determine what
questions would be appropriate to ask with the collected data. Kyah did not fully
understand the background context of the variables at first and asked questions to gather
the information she needed before moving forward. These two students did not begin
plotting variables until after they have determined their question.
Jett: So right now, I’m just going to look through all these things, just see what
they are. If I were looking at what data these things gathered, I’d probably look at,
look at one of these four…
Interviewer: Which four are those?
Jett: Pressure, humidity, external temperature and internal temperature because
they’re more about the air than they are about the balloon. If I were to try to
gather data or something, I probably wouldn’t talk about how fast things were
going, I’d probably talk about, say, pressure…So wait, okay. So, one thing that I
could see is altitude. How does altitude compare to pressure?

76
Kyah: I’m scrolling through all the attributes to see what I can compare. So, are
you allowed to tell me more about the data set?
Interviewer: Yes.
Kyah: It is… It’s looking at the temperatures over what?
Interviewer: (Explains what the weather balloon does and how it collects data).
Kyah: Was it just over the ocean?
Interviewer: I think the data set says they released it over Indiana and I don’t
think it got to the ocean.
Kyah: So is there any way we can do, like if when it was over a specific city, if
it’s a different temperature, if it was over a city or like a rural… Okay. How
would I do that?
Explored Variables First. In contrast to Jett and Kyah, Elliot and Ann plotted
variables shortly after being given the data set. Elliot took a few seconds to consider his
variable choices but chose one of the first ones he saw, and Ann began plotting data
immediately without taking the time to look through or contextualize her variables. These
students used a trial-and-error approach to discover a question, rather than develop a
question through the contextualization of variables.
Elliot: So just looking for something that might be… there could be a correlation,
obviously, aside from the obvious altitude-time, altitude-battery. So… let’s try
altitude… on the y-axis and then horizontal speed on the x-axis.
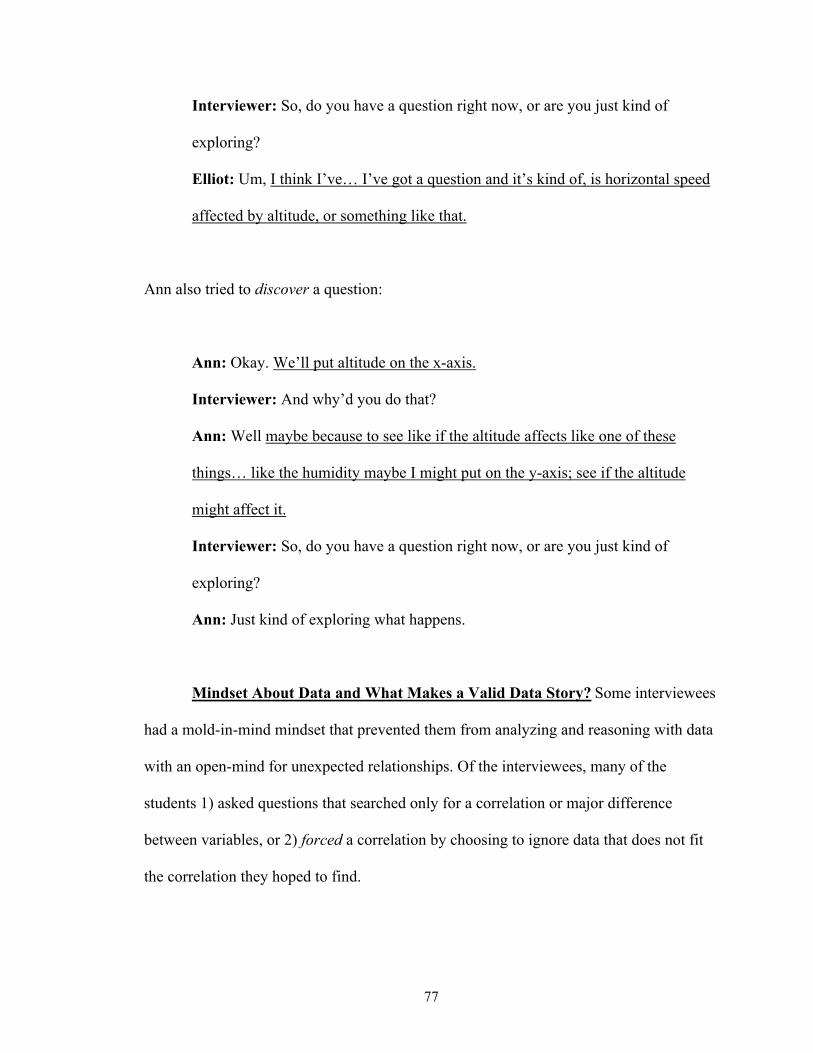
77
Interviewer: So, do you have a question right now, or are you just kind of
exploring?
Elliot: Um, I think I’ve… I’ve got a question and it’s kind of, is horizontal speed
affected by altitude, or something like that.
Ann also tried to discover a question:
Ann: Okay. We’ll put altitude on the x-axis.
Interviewer: And why’d you do that?
Ann: Well maybe because to see like if the altitude affects like one of these
things… like the humidity maybe I might put on the y-axis; see if the altitude
might affect it.
Interviewer: So, do you have a question right now, or are you just kind of
exploring?
Ann: Just kind of exploring what happens.
Mindset About Data and What Makes a Valid Data Story? Some interviewees
had a mold-in-mind mindset that prevented them from analyzing and reasoning with data
with an open-mind for unexpected relationships. Of the interviewees, many of the
students 1) asked questions that searched only for a correlation or major difference
between variables, or 2) forced a correlation by choosing to ignore data that does not fit
the correlation they hoped to find.

78
There Must be a Correlation or Clear Difference. While creating Data Stories Jett,
Kyah and Elliot felt they either need to find two variables that correlated to one another
(when they were working with numerical data) or, felt they needed to discover some sort
of major difference between two or more groups (when they were working with
categorical data).
While Jett and Kyah developed their question, they thought ahead to the final
“story” their Data Story would tell. If they did not believe there would be a correlation
between two variables, or that there would be similarities between groups, they chose not
to ask that question all together. Similarly, while Elliot discovered his question rather
than developed it, he felt that he did not have a good question until there was some sort of
correlation. To these students, there is no relationship, or, there is no difference between
the two groups seem to be inappropriate conclusions for a Data Story.
The following excerpts are examples of when students were looking for some sort
of obvious relationship or difference during their Data Story creation. Note that Ann’s
interview is not included because she did not take the first step of conceptualizing her
variables and is therefore unable to anticipate any sort of conclusion.
Jett: When I like, put two points together and then there’s a really strong
correlation between the two, that would be when I have that a-ha moment and it’s
like, okay, I have a data story.
Interviewer: So, it’s when you see that relationship…
Jett: Yeah, when I see a relationship like this [strong data correlation between two
variables on computer screen].
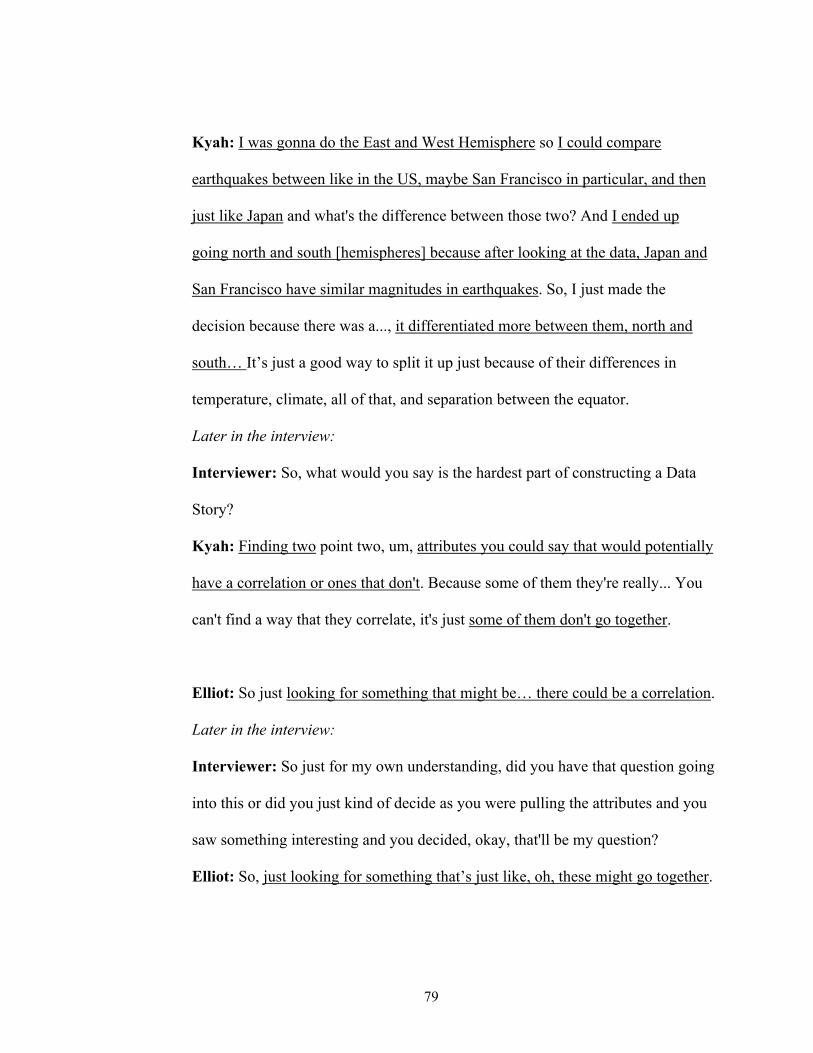
79
Kyah: I was gonna do the East and West Hemisphere so I could compare
earthquakes between like in the US, maybe San Francisco in particular, and then
just like Japan and what's the difference between those two? And I ended up
going north and south [hemispheres] because after looking at the data, Japan and
San Francisco have similar magnitudes in earthquakes. So, I just made the
decision because there was a..., it differentiated more between them, north and
south… It’s just a good way to split it up just because of their differences in
temperature, climate, all of that, and separation between the equator.
Later in the interview:
Interviewer: So, what would you say is the hardest part of constructing a Data
Story?
Kyah: Finding two point two, um, attributes you could say that would potentially
have a correlation or ones that don't. Because some of them they're really... You
can't find a way that they correlate, it's just some of them don't go together.
Elliot: So just looking for something that might be… there could be a correlation.
Later in the interview:
Interviewer: So just for my own understanding, did you have that question going
into this or did you just kind of decide as you were pulling the attributes and you
saw something interesting and you decided, okay, that'll be my question?
Elliot: So, just looking for something that’s just like, oh, these might go together.

80
It is clear through these three excepts that students were looking for some sort of
correlation or difference for their Data Story. Students did not think they had found a
Data Story until there was some correlation/difference and may have even changed their
initial question in order to come to a “better” conclusion and tell a “better” story.
Data Should Fit a Mold Already in Mind. When these students asked questions
that only looked for correlations or differences it set some of them up to have a mold-in-
mind mindset, meaning they were looking for something in particular from their data, and
not going into their data analysis with an open-mind to find unexpected relationships.
This mold-in-mind mindset caused Elliot to rush to an overarching claim and Ann
to ignore large portions of the data, both without considering the data as a whole. This
caused the two students to miss the major ideas that should have been drawn from the
data. Conversely, Kyah and Jett were able to keep an open mind for unexpected
relationships during their data analysis and were able to discover important scientific
concepts and come to more thoughtful conclusions. Students examples exemplify this
below.
In the following excerpt, Elliot is referring to graph he created during his
interview (Figure 4.4), below.
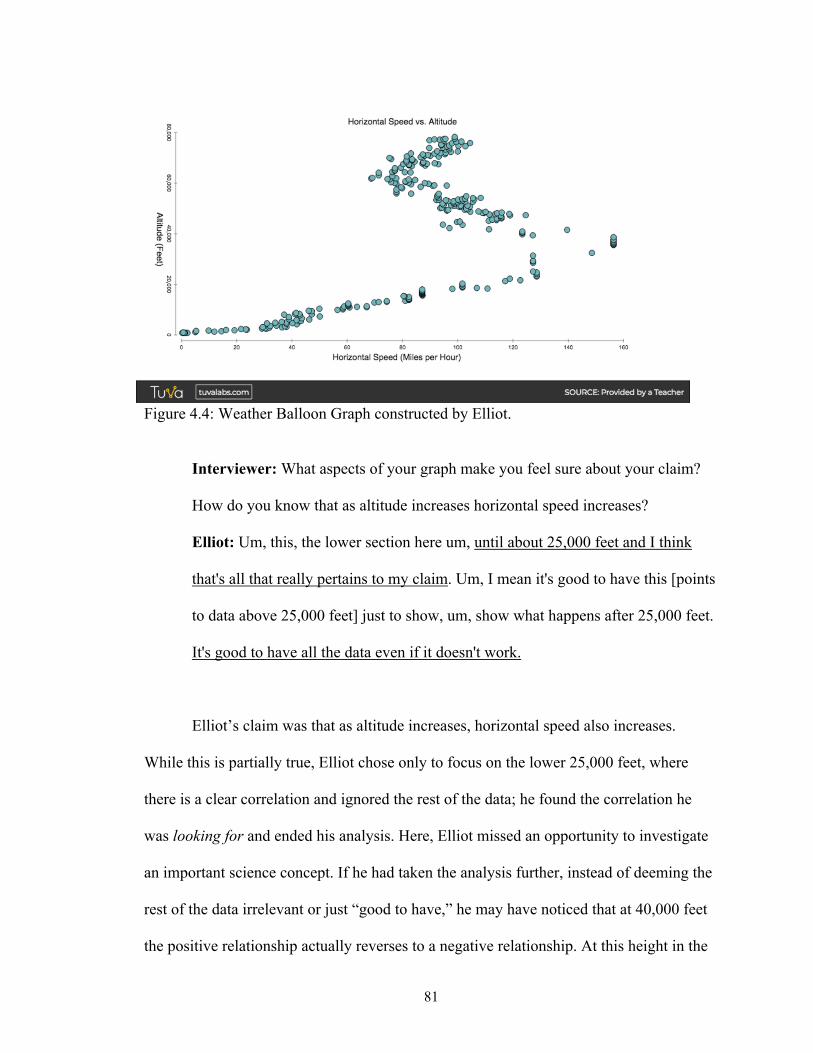
81
Figure 4.4: Weather Balloon Graph constructed by Elliot.
Interviewer: What aspects of your graph make you feel sure about your claim?
How do you know that as altitude increases horizontal speed increases?
Elliot: Um, this, the lower section here um, until about 25,000 feet and I think
that's all that really pertains to my claim. Um, I mean it's good to have this [points
to data above 25,000 feet] just to show, um, show what happens after 25,000 feet.
It's good to have all the data even if it doesn't work.
Elliot’s claim was that as altitude increases, horizontal speed also increases.
While this is partially true, Elliot chose only to focus on the lower 25,000 feet, where
there is a clear correlation and ignored the rest of the data; he found the correlation he
was looking for and ended his analysis. Here, Elliot missed an opportunity to investigate
an important science concept. If he had taken the analysis further, instead of deeming the
rest of the data irrelevant or just “good to have,” he may have noticed that at 40,000 feet
the positive relationship actually reverses to a negative relationship. At this height in the
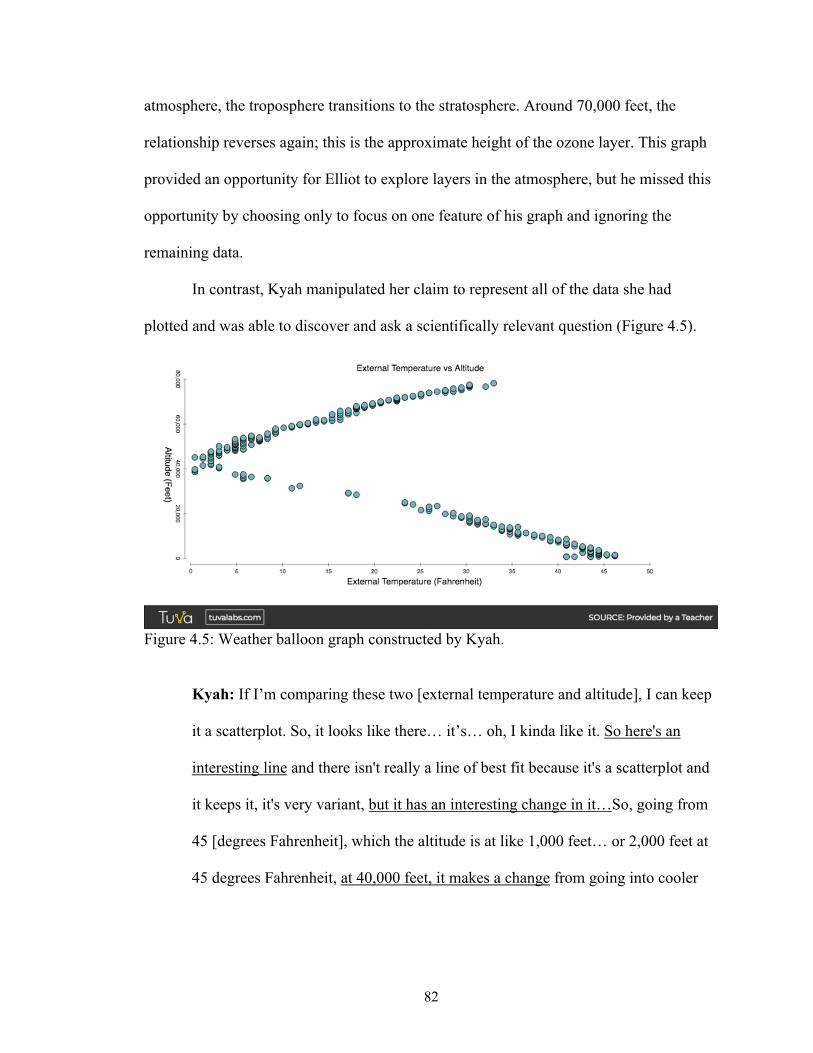
82
atmosphere, the troposphere transitions to the stratosphere. Around 70,000 feet, the
relationship reverses again; this is the approximate height of the ozone layer. This graph
provided an opportunity for Elliot to explore layers in the atmosphere, but he missed this
opportunity by choosing only to focus on one feature of his graph and ignoring the
remaining data.
In contrast, Kyah manipulated her claim to represent all of the data she had
plotted and was able to discover and ask a scientifically relevant question (Figure 4.5).
Figure 4.5: Weather balloon graph constructed by Kyah.
Kyah: If I’m comparing these two [external temperature and altitude], I can keep
it a scatterplot. So, it looks like there… it’s… oh, I kinda like it. So here's an
interesting line and there isn't really a line of best fit because it's a scatterplot and
it keeps it, it's very variant, but it has an interesting change in it…So, going from
45 [degrees Fahrenheit], which the altitude is at like 1,000 feet… or 2,000 feet at
45 degrees Fahrenheit, at 40,000 feet, it makes a change from going into cooler
83
temperatures to going in… it starts to progress as the temperature, as the altitude
increases the temperature, rises.
Kyah did not ignore any parts of the data as she developed her claim. She
correctly identify that at approximately 40,000 feet the external temperature changes
from cooling with height to warming with height. While she did not necessarily
understand why this was the case, she asked questions, suggesting she was thinking about
this point and saw it as an important aspect of her graph:
Kyah: I wonder why there is a change in the graph, like is there something with
the standard… is there… why does it deviate from the norm at that 40,000 feet?
Kyah: Why… in why at 40,000 feet does the progression of the line change from
positive to negative?
Remember from Elliot’s example that 40,000 feet is approximately the height
where the troposphere transitions into the stratosphere. Kyah’s graph, therefore, modeled
how temperature changes with height in different layers of the atmosphere. Rather than
missing this scientific concept, Kyah was well on the way to discovering it for herself
through data manipulation and interpretation.
Ann also used the mold-in-mind mindset during her Data Story creation to state
that there was a correlation between her two plotted variables. She used ranges as a way
to ignore the extra data that did not fit into the mold. The following excerpt comes from

84
Ann’s interview. The graph she created from the weather balloon data is found below
(Figure 4.6).
Figure 4.6. Weather balloon graph constructed by Ann.
Ann: So, I guess as it [altitude] increases, the humidity does also increase. So,
there’s like that relationship.
Interviewer: So, what does your graph tell us about humidity and altitude?
Ann: Well, it shows us that once the weather balloon increases in altitude and
gets to about 60,000 feet, the humidity increases. Like there's this big jump from
negative 20 to 10 in the humidity range once it increases the humidity also
increases.
Ann’s claim was that there is a positive relationship between the altitude of the
weather balloon and the relative humidity. She made this claim by looking at the range of
humidity levels and seeing a cluster of higher humidity at higher altitudes. She did not
consider the data as a whole, rather, she used the range in data from -20% to 10%, and
85
ignored the middle section of the data, thus missing a significant aspect of what this data
actually represents.
With the data presented from this data set, the researchers do not see a
relationship between the altitude and relative humidity levels. It may be of interest to
explore why humidity levels cluster around -20% and/or 10%, why they seem to change
after 50,000 feet, or why relative humidity levels do not exceed -20% until approximately
50,000 feet. However, the overall trend of data in this graph does not suggest a notable
relationship between these two variables. Therefore, by ignoring the center portions of
the data, Ann is developing an inaccurate science understanding that as altitude increases,
humidity levels increase as well.
It is also of interest to note that because relative humidity is presented in terms of
the percent how much water vapor there is in the air relative to the amount that would be
needed to saturate it at that temperature, it is not possible to have a negative relative
humidity. This is something, that with a better understanding of humidity and/or
conceptualization of the variables, the student may have been able to identify. Because
the data for this particular data set was not collected by the research team, we do not
know why these values are present.
The variables that Jett chose to graph created a nearly perfect exponential
function. He graphed altitude vs pressure which modeled the exponential decay of
atmospheric pressure with increasing altitude (Figure 4.7). He included all data in his
discussion because it created such a clear relationship. Not only does Jett use all data in
his discussion, he suggests that he could use this model to make predictions.
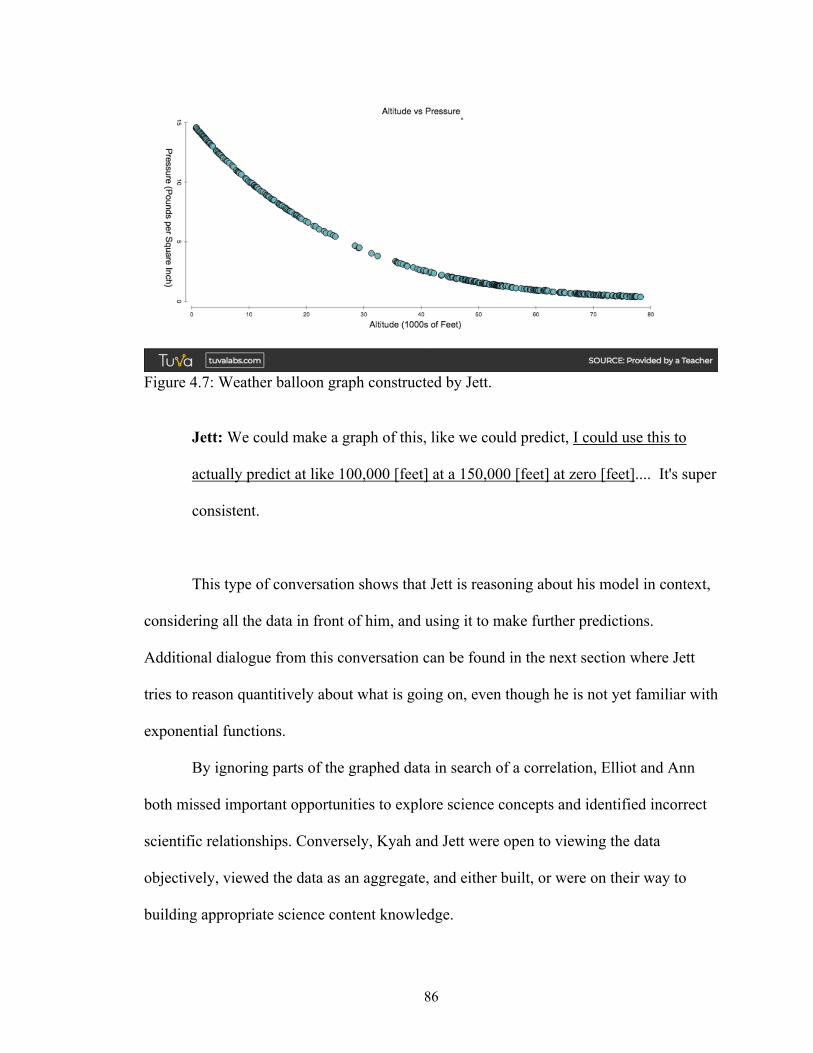
86
Figure 4.7: Weather balloon graph constructed by Jett.
Jett: We could make a graph of this, like we could predict, I could use this to
actually predict at like 100,000 [feet] at a 150,000 [feet] at zero [feet].... It's super
consistent.
This type of conversation shows that Jett is reasoning about his model in context,
considering all the data in front of him, and using it to make further predictions.
Additional dialogue from this conversation can be found in the next section where Jett
tries to reason quantitively about what is going on, even though he is not yet familiar with
exponential functions.
By ignoring parts of the graphed data in search of a correlation, Elliot and Ann
both missed important opportunities to explore science concepts and identified incorrect
scientific relationships. Conversely, Kyah and Jett were open to viewing the data
objectively, viewed the data as an aggregate, and either built, or were on their way to
building appropriate science content knowledge.
87
Use of Quantitative Values and Reasoning. All four interviewees talked about their
graphs qualitatively rather than quantitatively. The interviewees described their graphs,
but the language they used was mostly qualitative and was often confusing and/or vague.
What follows are individual student excerpts from different points throughout the student
interviews, where students were asked to describe a graph they created.
• Jett: This one’s mostly flat. There’s, there is, it does go up a little bit here as well.
• Jett: It does show that there is a correlation between pressure and altitude, which
is that there’s a negative correlation, because altitude goes up pressure goes down,
that’s what this line shows.
• Kyah: Looking at the dot and box plot, I could infer that they were higher
magnitudes because you can see that the box is slimmer, is that there’s like more
of a mode in the data from that southern hemisphere and it varied more in the
northern hemisphere also, and it was low magnitude.
• Kyah: It keeps, it’s very variant but it has an interesting change in it because
starting at the external temperature of about 45, it progresses as the temperature
goes down, um, the altitude is increasing.
• Elliot: The temperature and salinity is different, is fairly different, for all different
sites.
• Elliot: The horizontal speed, or altitude, starts very low and then goes very high,
which makes sense because the balloon is going up.
• Elliot: It tells us that horizontal speed is affected by altitude until about 25,000
feet, and then it’s kind of less.
88
• Ann: You can tell that once the altitude increases, the humidity really does go up
to like… when it’s higher in the sky, the humidity does increase.
• Ann: I feel like there is a relationship between them because the time, like as they
like, as the time goes on, they do increa…, like, ascent rate does increase a little.
But you can see that there’s like these data points and then there’s just this gap.
As demonstrated in the above excerpts, all four students tended to avoid using
quantities in their descriptions and chose to use qualitative words such as: goes down,
increasing, fairly different and high/low.
When these students did choose to incorporate quantitative values into their graph
discussion (or were prompted to) the values were not necessarily used to quantitatively
reason about their graph, but simply as a way to point attention to a specific place in their
graph (points of interest or case accounts), or show changes from the beginning of the
graph to the end (ranges). Points of interest do not represent the data as an aggregate, but
stand out because of their uniqueness, for example, maximum or minimum values,
outliers, and any other point that is distinct. Ranges show the beginning and endpoints of
a data set, but do not necessarily represent the trend of data between the two points. To
get an idea of whether students would be able to include numbers in their analysis and
reason with them, the interviewer asked students how they could include numbers in their
claims.
Interviewer: If you had to talk about your claim using some sort of numbers,
what kind of numbers would you use?
89
Kyah: I would certainly use the data at the bottom of the graph here and then
make the change in time going from whatever, five minutes, and then use a really
big change in time, like go to 80 minutes and you can clearly tell that there is no
change in these things [ascent rate].
Interviewer: Could you use numbers at all to talk about your claim?
Ann: Well, you could give examples of like, the altitude at like 60,000 and the
relative humidity to that, and at like 10 to give like a range of what’s happening in
the graph.
This specific question was not asked to Elliot, though he did provide other examples
throughout the interview that suggest he is using quantitative values to point to certain
areas of the graph, rather than to further generalize or reason with them.
Elliot: My claim would be like horizontal speed increases until about 25,000 feet
where it becomes less consistent because we've got all these cases in here and
although they’re, although they're consistent, they are kind of all over the place,
anywhere from 80 to 120 miles per hour.
Jett was the only student who had the ability to reason about his models quantitatively.
Note in the first excerpt, Jett is describing Figure 4.4, which is a curved line (exponential
function), which does not seem to be something he is familiar talking about.

90
Interviewer: Could you use numbers to talk about your claim at all?
Jett: Um [long pause]. I can use numbers saying like from, from this point at
about 1,000 to about 80,000… or maybe bit by bit just to show that it's gradually
flat flattening out. But um, I can say like when the altitude goes up by... from
1,000 to 11,000, just saying like that, it's 10,000 feet. Right there, right about
there. So, I could... actually it'd probably be closer to... probably closer to that. I
could say when the pressure went down by... let's see 9.7 and 14 so it went down
by about five, five pounds per square inch and then the next 10,000 it went down
by three [pounds per square inch]. Next 10,000 went down by two, yeah two
[pounds per square inch]. So, I could use numbers to say like it's flattening out
gradually.
Jett tried to analyze this graph quantitatively by recognizing that the rate of
altitude to pressure is not linear and doing his best to explain this using quantitative
values. Jett also demonstrated his ability to reason quantitatively when he described and
reflected on his Data Story 1 assignment, where he compared the intensity of earthquakes
between 90°E and 160°E (a region where he identified higher intensity earthquakes) to
the rest of the world (Figure 3.4).
Interviewer: Is there anything else you would like to tell me about this Data
Story [1]?
Jett: I also use, I also use some use most frequent in medians in this as well, kind
of just to show a few things. Like the average right here [between 90°E and
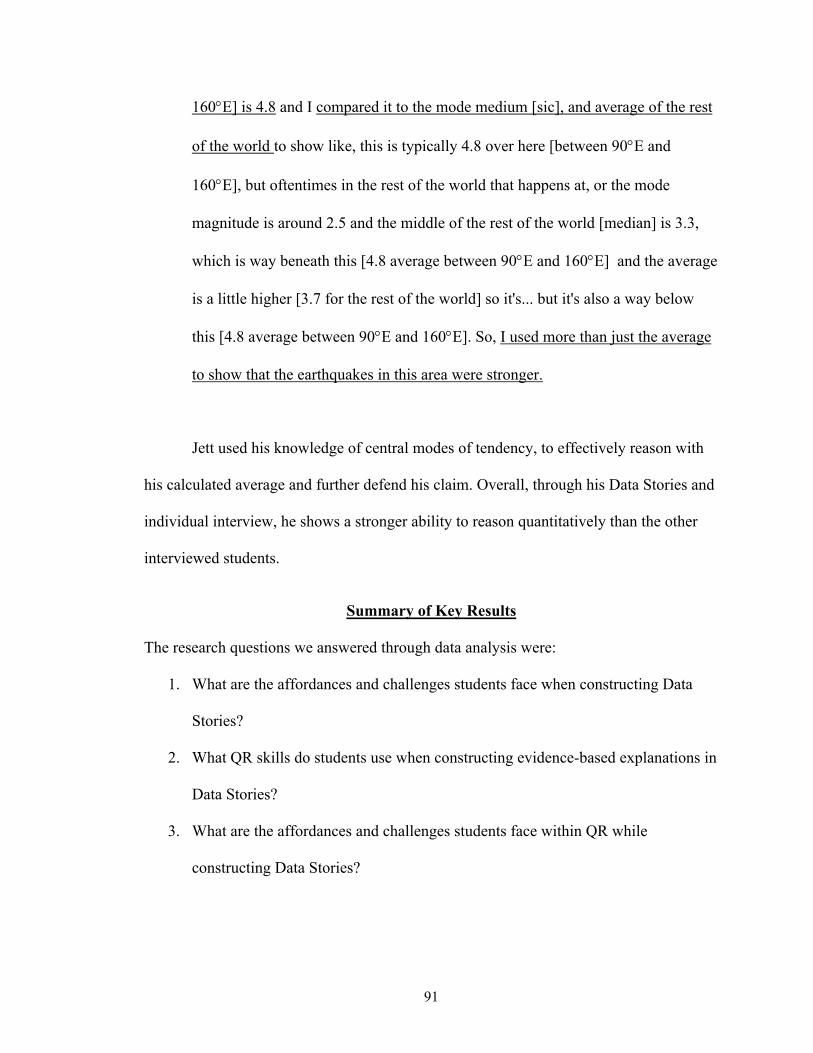
91
160°E] is 4.8 and I compared it to the mode medium [sic], and average of the rest
of the world to show like, this is typically 4.8 over here [between 90°E and
160°E], but oftentimes in the rest of the world that happens at, or the mode
magnitude is around 2.5 and the middle of the rest of the world [median] is 3.3,
which is way beneath this [4.8 average between 90°E and 160°E] and the average
is a little higher [3.7 for the rest of the world] so it's... but it's also a way below
this [4.8 average between 90°E and 160°E]. So, I used more than just the average
to show that the earthquakes in this area were stronger.
Jett used his knowledge of central modes of tendency, to effectively reason with
his calculated average and further defend his claim. Overall, through his Data Stories and
individual interview, he shows a stronger ability to reason quantitatively than the other
interviewed students.
Summary of Key Results
The research questions we answered through data analysis were:
1. What are the affordances and challenges students face when constructing Data
Stories?
2. What QR skills do students use when constructing evidence-based explanations in
Data Stories?
3. What are the affordances and challenges students face within QR while
constructing Data Stories?

92
Research Question 1
In general, students had positive feelings towards the Data Story assignments, and
left the students feeling more confident in their graphing abilities.
Student scores on the CER rubric were weakest for Evidence, with only 20% of
students achieving Meets after Data Story 2 and the strongest in Claim, with
approximately 61% achieving a Meets after Data Story 2. The Reasoning element was
excluded from analysis due to differing frameworks for reasoning between Ms. Brown
and the research team. Student struggles in Evidence were further explored in research
question 2.
Research Question 2
The research team identified four QR elements based on the QR LP (Mayes et al.,
2013) that are crucial in Data Story creation: Variable, Manipulation, Variation and
Interpretation. Variable refers to a students’ ability to ask a statistical question and
choose appropriate variables to answer the question. Manipulation addresses how a
student manipulates the variables they choose through graphing and arithmetic
calculations to discover relationships. Variation scores students on how their ability to
talk quantitively about the relationship between the two chosen variables, and
Interpretation refers to students’ ability to pull everything together by interpreting the
graph correctly and discussing the relationship between variables in the context of the
problem. Researchers used these elements to develop the QR Rubric for 9th Grade Data
Story Assignments which was used to score all student Data Stories.
93
Research Question 3
Students demonstrated weakness in all four elements of the QR rubric with just
35.5%, 19.4%, 6.5% and 3.2% of students meeting the expectation after Data Story 2 in
Variable, Manipulation, Variation and Interpretation, respectfully. Researchers
conducted student interviews to investigate why students scored so low on the QR
Rubric.
Skills students must be able to draw upon to create appropriate evidence for their
Data stories include: 1) contextualizing variables, 2) analyzing data objectively without
using a mold-in-mind mindset, and 3) using appropriate quantitative values (not simply
case accounts) and reasoning quantitively with them to further support a claim.
The implications and discussion of these results are discussed in Chapter 5.
94
CHAPTER 5
DISCUSSION AND IMPLICATIONS
In today’s technology-driven world, citizens are constantly faced with abundant data and
generalized claims they must be able to interpret and validate (Madison & Steen, 2003;
Orrill, 2003; Steen, 2004). Students need to graduate from high school with the skills that
support them in problem-solving, reasoning with data and constructing their own
explanations from evidence (McNeill & Krajick, 2007; Steen, 2004). Science and
mathematics teachers are faced with the challenge of developing meaningful assignments
that can aid students in developing these skills (Frykholm & Glasson, 2005; Steen, 1987).
Data Stories provide teachers with an interdisciplinary learning strategy that
encourages students to practice QR skills and engage with science material where
students are invited to construct their own knowledge of scientific phenomena through
exploration of data sets. They involve many tasks that help students to develop important
skills to become data-literate citizens. Furthermore, Data Stories provide opportunities for
students to think deeply about phenomena and to approach issues through different
perspectives, two important pedagogical practices (Ivanitskaya et al., 2002; National
Research Council, 2014). Data Stories encourage students to involve themselves in deep
thinking and approach issues through different perspectives (Ivanitskaya et al., 2002;
National Research Council, 2012). Because Data Stories use real-world data, students are
given the opportunity to link their learning to real situations, which in turn may provide
relevance to the assignment. The value of using real-world data for learning is widely
demonstrated in the literature (Carter et al., 2011; DeLuca & Lari, 2011; Erwin, 2015;
Garfield & Ben-Zvi, 2009; Neumann et al., 2013; Pfannkuch et al., 2010).

95
The flexibility of Data Stories allows teachers to use them for a variety of
purposes and investigations while allowing for the appropriate amount of scaffolding to
suit the students’ needs. For example, a teacher may provide scaffolding for individual
skills like question development or graph choice when Data Stories are first introduced.
However, as the students begin to master the individual skills, the teacher can remove
some of the scaffolding and expect that students should be able to combine the individual
skills into one coherent Data Story.
When creating a Data Story, students need to ask questions, graph variables using
different graph types, and interpret patterns in data. Because there are so many parts of a
Data Story, students may need scaffolding in individual skills before they can be
successful at combining the skills into one data story. However, because there are so
many pieces, they can be difficult to implement successfully. If a student attempts to
construct a Data Story before he or she has developed component skills, the “synthesis”
value of the assignment can be lost. One of the goals for this investigation was to better
understand where students struggle during Data Story construction in order to provide
teachers with suggestions to better incorporate Data Stories in their own classroom.
The results from this research indicate that students struggle to develop
appropriate evidence to support a claim during Data Story creation, which we argue, is
likely in part tied to QR skills that have not been fully developed. In this chapter, we
discuss the implications of these results for science learning and how to support teachers
in bringing QR into science classrooms to further student learning in both science and
QR. We also acknowledge some of the limitations of this study and suggest directions for
future research.

96
Supporting Students in the Classroom
The CER Rubric results revealed that students performed the best overall in Claim
and the weakest overall in Evidence. One of the reasons students scored so high in Claim
may be because Ms. Brown supported her students through “question-coaching”, where
she assisted students in developing a solid question that would set them up to develop an
appropriate, well-stated claim. Ms. Brown noted during her interview that students really
seemed to struggle with coming up with a good question and so she provided extra
support in this area.
Interviewer: So in any of [the Data Stories]… did you direct [the students] in any
way? Like, this is the question that you have to answer, or these are the data sets
you have to use… or did you kind of let them...?
Ms. Brown: I would give them coaching on their question… Like what, does this
question work? What kind of question is this? Are you um, you know, what kind
of graph would you make, what if you ask the question this way? So, a lot of
them, it really is the question part [that is difficult]. They get hung up on it…
Once kids get the question, its usually so much easier after that, once they have a
clearer question.
While Ms. Brown mentions that her students had the most difficulty coming up
with a question, it seems likely that the scaffolding and supports she provided in the form
of question-coaching helped the students to overcome these challenges and guided them
in a way that allowed them to be more successful in meeting the expectation for Claim.

97
Question-coaching sets students up with the right mindset to develop a question
appropriate for the data set under investigation and that can be directly answered with a
claim. Therefore, question-coaching is an appropriate scaffolding tool that teachers
should consider incorporating into their classrooms to enhance question and subsequently
claim development.
The low Evidence scores suggest that students struggled the most while using
evidence to support their claims. Previous research has identified similar results; for
example, McNeill and Krajcik (2007) found that middle school students have a hard time
determining what counts as evidence and tend to draw on inappropriate evidence that is
irrelevant to the claim. Additionally, Hogan and Maglienti (2001) and Tytler (2001)
demonstrated that those without ample of scientific knowledge and practice tend to base
their conclusions personal views rather than on collected evidence. McNeill & Krajcik
(2007) and Sadler (2004) argue that students must be given ample opportunity to practice
justifying claims and using evidence with direct instruction to increase their awareness of
what counts as evidence in a well-reasoned conclusion.
Because students have a hard time using evidence to support a claim, it was
important to better understand what skills students are drawing upon while they develop
their evidence. It seems reasonable that with similarly-structured supports to those
provided for Claim (question-coaching), students would be able to reach the expectation
in Evidence.
QR skills give students the ability to conceptualize, manipulate, reason with and
interpret both quantitative and qualitative evidence in graphs, and aid the student in
moving seamlessly between their model and the real-world (Mayes et al., 2013;
98
Thompson, 2011). It is likely that many students in this study scored lower than the
expectation in Evidence because they have drawn on QR skills that are not fully
developed. Therefore, it is reasonable to suggest that in order to support students
developing evidence for a CER framework, there should be a focus on bringing QR skills
into the science classroom.
Very possibly, it might not be clear to science teachers how to effectively
incorporate QR in their classroom, as it may not be explicitly mentioned in the
curriculum they teach. Additionally, science teachers are not necessarily acquainted with
the age-appropriate QR skills students should be familiar with, as it is likely not an aspect
of their discipline. Thus, the QR Rubric for 9th Grade Data Story Assignments was
developed as a tool for science teachers to better understand the appropriate QR skills
they need to expect from their students. Teachers should use the rubric to identify which
QR skills should be scaffolded and integrated into their classrooms.
Data Story assignments should not be left to just science teachers; this type of
assignment would be just as effective in a mathematics classroom (Neumann et al., 2013;
Steen, 2004). Additionally, mathematics teachers may have more pedagogical content
knowledge for effectively teaching QR skills to students. Data Story assignments could
be implemented across disciplines to support students in understanding the value of QR
and statistics in evaluating data sets from any discipline (Neumann et al., 2013; Steen,
2004).
Pedagogical Approaches to Data Story Assignments
Results imply that students struggle with contextualizing variables, approaching
Data Stories with an open-mind and using quantitative values in their evidence. Without a

99
developed understanding of the these QR aspects, students will have a difficult time
constructing evidence-based explanations. The subsequent paragraphs describe
considerations that teachers should keep in mind while implementing Data Stories in their
classroom to increase student performance in QR and, consequently, constructing
evidence-based explanations.
Pay Attention to How Students Approach a Data Story. Results suggest that
students have a hard time reasoning (qualitatively or qualitatively) with variables when
they are not able to fully contextualize the variables they are working with.
Contextualizing variables is described as thinking about what variables mean in the
context of a data set including, deciding which variables would be reasonable to work
with to ask appropriate questions and understanding what the variables represent in the
context of the data set.
This finding is consistent with previous research investigating how students work
with variables to develop evidence-based explanations (Mayes et al., 2013; McNeill &
Krajcik, 2007; Thompson, 2011). McNeill and Krajcik (2007) found that the use of
inappropriate evidence was amplified when students did not have a strong understanding
in the content of the data, and Thompson (2011) stresses that students must have some
level of quantification in order to manipulate, compare, and relate variables and to move
between real-life context, mental and computational models. Quantification helps
students to make sense of the observations they notice during analysis, which leads to a
well-developed explanation (Thompson, 2011). Moore, Carlson, & Oehrtman (2009) and
Thompson (2011) both found that when students are able to create correct mental images
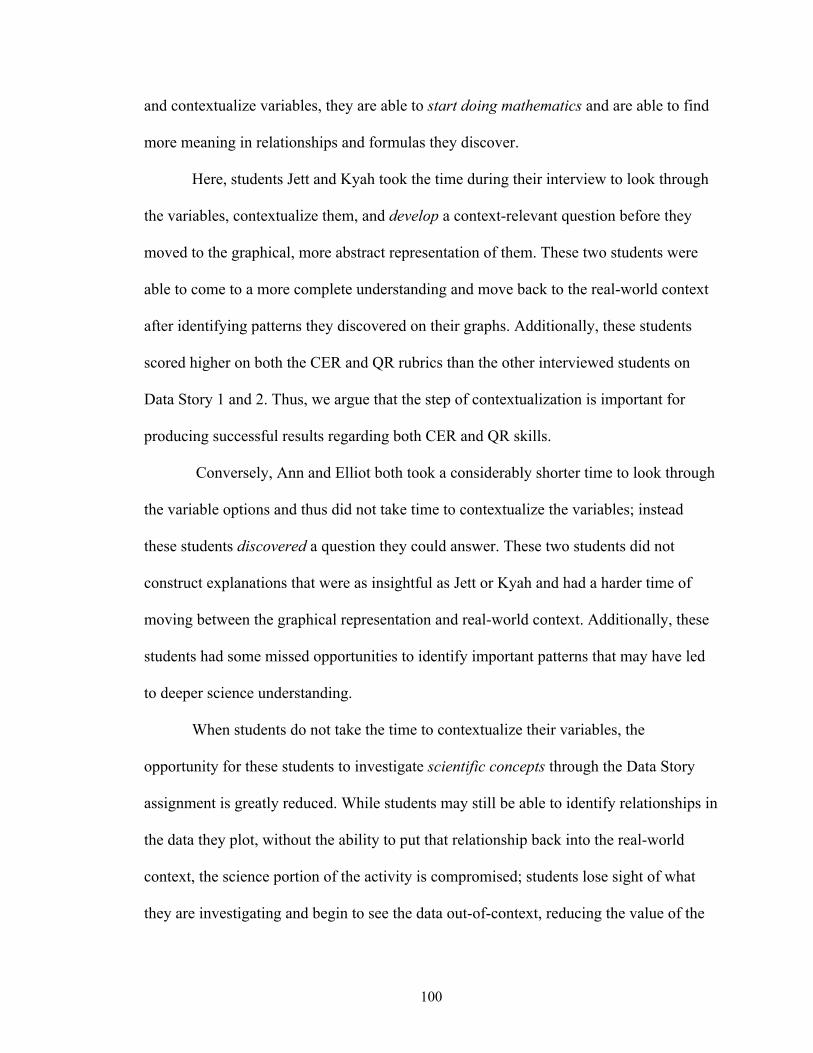
100
and contextualize variables, they are able to start doing mathematics and are able to find
more meaning in relationships and formulas they discover.
Here, students Jett and Kyah took the time during their interview to look through
the variables, contextualize them, and develop a context-relevant question before they
moved to the graphical, more abstract representation of them. These two students were
able to come to a more complete understanding and move back to the real-world context
after identifying patterns they discovered on their graphs. Additionally, these students
scored higher on both the CER and QR rubrics than the other interviewed students on
Data Story 1 and 2. Thus, we argue that the step of contextualization is important for
producing successful results regarding both CER and QR skills.
Conversely, Ann and Elliot both took a considerably shorter time to look through
the variable options and thus did not take time to contextualize the variables; instead
these students discovered a question they could answer. These two students did not
construct explanations that were as insightful as Jett or Kyah and had a harder time of
moving between the graphical representation and real-world context. Additionally, these
students had some missed opportunities to identify important patterns that may have led
to deeper science understanding.
When students do not take the time to contextualize their variables, the
opportunity for these students to investigate scientific concepts through the Data Story
assignment is greatly reduced. While students may still be able to identify relationships in
the data they plot, without the ability to put that relationship back into the real-world
context, the science portion of the activity is compromised; students lose sight of what
they are investigating and begin to see the data out-of-context, reducing the value of the
101
assignment. Students need to be able to move fluently from the models they construct to
real-world context in order to build gain new science understandings, which is not
possible without full contextualization of the variables they are working with.
In practice, teachers need to stress the importance of contextualizing variables to
students before the students begin asking questions of the data or starting any data
analysis. An example of a quick assignment that may benefit students is The Hypothetical
Graph (Figure 5.1).
Figure 5.1: Hypothetical graph example. Soil temperature under different garden coverings.
In this brief assignment, students should make a quick sketch of the what they
believe their graph will look like with their chosen variables. This gives the students a
chance to think about which variables they will use, which axis those variables will go on
and what type of graph they think will best represent the data. Students should be able to

102
put into their own words the relationships they are going to investigate and what both the
question they are asking and the conclusion mean in the context of the problem. It is
important that students consider and visualize what they are actually graphing in context
before moving to a graphical representation and turning the data into a two-dimensional,
abstract model.
Coming to a preconceived conclusion prior to analyzing data demonstrates some
measure of ability to contextualize the variables, but it is important for students to view
their preconception more as a prediction that may or may not be supported by the data
when analyzed.
Are Students Approaching Data and Data Stories with an Open Mind for
Unexpected Outcomes? While it is important that students are able to develop a
question and predict outcomes before plotting data, students must also go into data
analysis with an open-mind for unexpected relationships.
Few published studies have investigated how students develop questions after
they have contextualized their variables, however, the results from this study indicate that
students believe that the next step is to find a correlation (when working with two
numerical variables), or a major difference (when working with one categorical and one
numerical variable). All of the student interviewees believed that if they did not find a
correlation or difference in their data, there was not a valid story to tell. It is likely that
this perception is common among 9th grade students because it was seen at all student
performance levels and observed in many of the collected Data Stories.
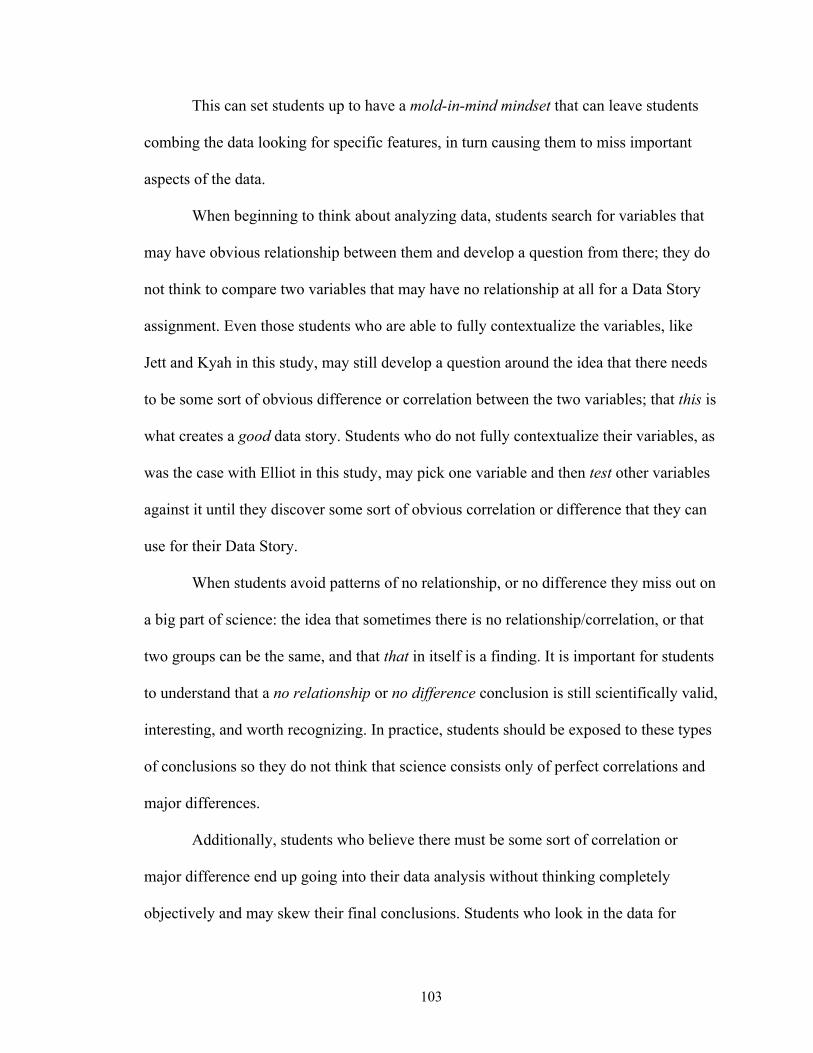
103
This can set students up to have a mold-in-mind mindset that can leave students
combing the data looking for specific features, in turn causing them to miss important
aspects of the data.
When beginning to think about analyzing data, students search for variables that
may have obvious relationship between them and develop a question from there; they do
not think to compare two variables that may have no relationship at all for a Data Story
assignment. Even those students who are able to fully contextualize the variables, like
Jett and Kyah in this study, may still develop a question around the idea that there needs
to be some sort of obvious difference or correlation between the two variables; that this is
what creates a good data story. Students who do not fully contextualize their variables, as
was the case with Elliot in this study, may pick one variable and then test other variables
against it until they discover some sort of obvious correlation or difference that they can
use for their Data Story.
When students avoid patterns of no relationship, or no difference they miss out on
a big part of science: the idea that sometimes there is no relationship/correlation, or that
two groups can be the same, and that that in itself is a finding. It is important for students
to understand that a no relationship or no difference conclusion is still scientifically valid,
interesting, and worth recognizing. In practice, students should be exposed to these types
of conclusions so they do not think that science consists only of perfect correlations and
major differences.
Additionally, students who believe there must be some sort of correlation or
major difference end up going into their data analysis without thinking completely
objectively and may skew their final conclusions. Students who look in the data for

104
something specific may end their analysis when they “find it” and miss out on other
important aspects in the data, as was the case for Elliot in this study. Students may also
ignore aspects of the data that may tell a different story through ranges or case accounts
in order to fit the mold they expect and need to find, as Ann did in her analysis of relative
humidity and elevation. These results echo findings from Sandoval and Millwood (2010)
who found that students often fail to see patterns in their observations and ignore data
when it does not match previously held ideas.
Teachers must be ready to work with students to explain the importance with
going into data analysis with a hypothesis while remaining open-minded through analysis
even when unexpected findings are identified. By doing this, teachers set their students
up to both contextualize variables and approach data analysis without searching for
specific trends that could lead to students’ missing important concepts or ignoring data
through ranges.
Encourage Students to Use Quantitative Language. Ability to reason
qualitatively about a data set is an important first step in identifying patterns in a data set,
but students should be aware that quantitative descriptors provide more compelling
evidence that can describe the data set more thoroughly (Mayes et al., 2013). The QR
learning progression suggests that students around the 9th grade level should be able to
move beyond qualitative skills and into the quantitative section (Mayes et al., 2013).
However, our results indicate that 9th grade students are challenged to incorporate
quantitative accounts into their evidence and tend to rely more on qualitative accounts.
When students use (or are prompted to use) quantitative accounts, they tend to use
case accounts, or points of interest to talk about their model rather than use a summative

105
quantitative account that could be used to describe the data set as a whole. The ability to
distill all data into a single value, has been identified in the research to be a challenge to
students (Konold et al., 2015).
Reasoning quantitatively encourages students to think beyond their own data set
and generalize their model to scientific phenomenon. However, when students use case
accounts as evidence for a claim, they are simply pointing out some data points that seem
to be more important in the data set; the analysis becomes more about the specifics of the
data set and graph rather than a generalization that could be further explored in a science
context.
Specific points or case accounts are not always relevant for students when they
move from their model to the real-world context, and therefore, students may not see the
need to incorporate quantitative values into their analysis. For example, in a question
asking how sea surface temperatures (SST) have increased in the last 175 years, it is
likely that a 9th grade student would state that SST have been rising over the last 175
years but would not include any sort of appropriate quantitative account (Figure 5.2). A
student who uses case accounts may choose to point out a specific point, for example, the
lowest SST was 25.38 °C in 1913, but may also see this piece of information as irrelevant
in supporting the claim and avoid using it completely.
106
Figure 5.2: Example Data Story graph: Change in sea surface temperatures since 1840.
By improving students’ abilities in reasoning with quantitative values beyond case
accounts and towards the data as an aggregate, students may begin to see the power and
importance of using quantitative values to support a claim. In the example provided, a
student who is able to view the data as an aggregate may be able to describe,
quantitatively, that SST are have been rising at a rate of approximately 0.0042 °C per
year, and thus be able to use their model to make a prediction for the real-world context.
Teachers should encourage their students to use quantitative language in their
graph descriptions as it can usually be more descriptive of the data set. One strategy for
exposing students to the value of quantitative language could be through a partner
graphing activity. One partner could be given a graph and asked to describe it to their
partner, who has to draw their interpretation of the description. It will become clear to
students very quickly that “goes down a little,” or “goes up until a certain point and then
goes back down” are not effective ways to describe data, as they have different meanings
to each individual. A discussion about the use of productive quantitative descriptors
could stem from this activity.

107
Limitations and Directions for Future Research
Inferring wider truths from a small population is always a challenge. The small
sample size here of 62 sample student Data Stories from 31 students, and only four
interviews can only offer preliminary insights into understanding how students use QR in
their science classes during Data Story construction. Other aspects of QR may be equally
important to the ones we have identified as dominant affordances and challenges for this
group of students. Future research projects could further this investigation to reach a
larger population of students and to validate the results identified in this study.
While much was learned from the thirty-minute semi-structured interviews, there
were some missed opportunities when it came to gathering a deeper understanding of
student understanding of QR. For example, when the interviewer asked an interviewee
how they could use numbers to support the claim, the student replied “You could give
examples of the altitude at like 60,000 [feet] and the relative humidity to that at like 10
[thousand feet] to give a range of what is happening in the graph.” The interviewer did
not ask any follow-up questions after this statement, but follow-up questions may have
provided more insight into why students believe that case accounts are useful in
supporting claims. Furthermore, the interview time was short, and students had not met
the interviewer prior to the interview, so it is possible that the interviewees did not feel
comfortable enough to share their honest opinions and thoughts during their interview.
Other areas of future research may investigate the best strategies to implement
some of the suggestions for teachers provided in the discussion. Examples of concrete,
quantitatively verified strategies of implementing these QR skills into the classroom
would provide science teachers with even more resources to effectively incorporate Data

108
Stories into their classrooms. Additionally, future researchers could investigate why
students avoid using quantitative evidence to support their claim; is it because students
don’t have the math skills and number sense, because they don’t translate between math
and science effectively, or is there another reason?
Conclusion
The goal of this study was to identity affordances and challenges students face
when constructing Data Stories to better support teachers in using these assignments in
their own curriculum.
Because of the flexible nature of a Data Story, teachers in all disciplines (not just
science) should use Data Story assignments in their curriculum to encourage students’
skill development in constructing evidence-based explanations, that are necessary to
navigate today’s data-driven world.
Overall, students had positive feelings towards Data Story assignments, and felt
like Data Stories helped them build the skills needed to critically evaluate data and to
use/interpret different types of graphs. Question-coaching helped students develop
appropriate questions to ask, which in turn helped to set students up for a solid claim for
their Data Story. Students need similar coaching and support for constructing their
evidence-based explanations and therefore, the QR Rubric for 9th Grade Data Story
Assignments was developed to provide support for teachers by highlighting some of the
elements students need to be comfortable with when constructing Data Stories and
evidence-based explanations.
The interview results from this study indicate some additional aspects of QR
teachers may want to stress to support their students including: 1) promoting full

109
contextualization of variables, 2) making sure students are going into data analysis with
an open-mind , and 3) encouraging students to use quantitative values in addition to their
qualitative statements to better support their claim. Figure 5.3 provides a visual summary
of the necessary QR components identified in this study to develop strong evidence for an
evidence-based explanation.
Figure 5.3: Summary of QR components necessary to develop a strong evidence-based explanation.
Future studies could expand on this project to not only validate the results from
this study, but to provide teachers with even more supports for incorporating Data Stories
into the classroom.

110
REFERENCES
American Association of Colleges and Universities (AAC&U). (2010). Valid Assessment of Learning in Undergraduate Education. Retrieved from http://www.aacu.org/value/rubrics/index_p.cfm
Bell, P., & Linn, M. C. (2000). Scientific arguments as learning artifacts: Designing for
learning from the web with KIE. International Journal of Science Education, 22(8), 797–817. https://doi.org/10.1080/095006900412284
Berland, L. K., & McNeill, K. L. (2010). A learning progression for scientific
argumentation: Understanding student work and designing supportive instructional contexts. Science Education, 94(5), 765–793. https://doi.org/10.1002/sce.20402
Berland, L. K., Schwarz, C. V., Krist, C., Kenyon, L., Lo, A. S., & Reiser, B. J. (2016).
Epistemologies in practice: Making scientific practices meaningful for students. Journal of Research in Science Teaching, 53(7), 1082–1112. https://doi.org/10.1002/tea.21257
Bybee, R. W., & McInerney, J. D. (1995). Redesigning the Science Curriculum: A Report
in the Implications of Standards and Benchmarks for Science Education. Colorado Springs, CO: Biological Sciences Curriculum Study.
Carnevale, A. P., & Desrochers, D. M. (2003). The Democratization of Mathematics. In
Lynn Arthur Steen (Ed.), Quantitative Literacy: Why Numeracy Matters for Schools and Colleges (pp. 21–31). Princeton, NJ: The National Council on Education and the Disciplines.
Carter, J., Noble, S., Russel, A., & Swanson, E. (2011). Developing Statistical Literacy
Using Real World Data: Investigating Socioeconomic Secondary Data Resources Used in Research and Teaching. International Journal of Research & Method in Education, 34(3), 223–240. https://doi.org/10.1080/1743727X.2011.609553
Clark, D. B., & Sampson, V. D. (2007). Personally-Seeded Discussions to Scaffold
Online Argumentation. International Journal of Science Education, 29(3), 253–277. https://doi.org/10.1080/09500690600560944
Creswell, J. W. (2012). Educational Research (4th ed.). Boston, MA: Pearson Education,
Inc. Cunningham, C. M., & Kelly, G. Y. J. (2017). Epistemic Practices of Engineering for
Education. Science Education, 101(3), 486–505. https://doi.org/10.1002/sce.21271 Curriculum Corporation. (1997). Mathematics Profile for Australian Schools. In G.
Masters & M. Forster (Eds.), Mathematics Profile for Australian Schools. Victoria, AU: The Australian Council for Educational Research Ltd.

111
DeLuca, V., & Lari, N. (2011). The GRIDC Project: Developing Students’ Thinking Skills in a Data-Rich Environment. Journal of Technology Education, 23(1), 5–18.
Dunne, C. (2011). The place of the literature review in grounded theory research.
International Journal of Social Research Methodology, 14(2), 111–124. https://doi.org/10.1080/13645579.2010.494930
Duschl, R. (2008). Science Education in Three-Part Harmony: Balancing Conceptual,
Epistemic, and Social Learning Goals. Review of Research in Education, 32(1), 268–291. https://doi.org/10.3102/0091732X07309371
Duschl, Richard, Maeng, S., & Sezen, A. (2011). Learning progressions and teaching
sequences: A review and analysis. Studies in Science Education, 47(2), 123–182. https://doi.org/10.1080/03057267.2011.604476
Elrod, S. (2014). Quantitative reasoning: The next “Across the Curriculum” movement.
AAC&U, Summer, 4–8. Erwin, R. W. (2015). Data Literacy : Real-World Learning Through Problem-Solving
With Data Sets. American Secondary Education, 43(2), 18–27. Frykholm, J., & Glasson, G. (2005). Connecting Science and Mathematics Instruction:
Pedagogical Context Knowledge for Teachers. School Science & Mathematics, 105(3), 127–141. https://doi.org/10.1111/j.1949-8594.2005.tb18047.x
Garfield, J., & Ben-Zvi, D. (2009). Helping Students Develop Statistical Reasoning:
Implementing a Statistical Reasoning Learning Environment. Teaching Statistics, 31(3), 72–77. https://doi.org/10.1111/j.1467-9639.2009.00363.x
Given, L. M. (2008). Semi-Structured Interview. In The SAGE Encyclopedia of
Qualitative Research Methods (p. ??). Sage Publications, Inc. Glaser, B. G., & Strauss, A. L. (1967). The Discovery of Grounded Theory: strategies for
qualitative research. Hawthorne, NY: Aldine Publishing Company. Gotwals, A. W., & Songer, N. B. (2010). Reasoning up and down a food chain: Using an
assessment framework to investigate students’ middle knowledge. Science Education, 94(2), 259–281. https://doi.org/10.1002/sce.20368
Heritage, M. (2008). Learning Progressions: Supporting Instruction and Formative
Assessment. Washington, DC. Hogan, K., & Maglienti, M. (2001). Comparing the epistemological underpinnings of
students’ and scientists’ reasoning about conclusions. Journal of Research in Science Teaching, 38(6), 663–687. https://doi.org/10.1002/tea.1025
112
Hruschka, D. J., Schwartz, D., St.John, D. C., Picone-Decaro, E., Jenkins, R. A., & Carey, J. W. (2004). Reliability in Coding Open-Ended Data: Lessons Learned from HIV Behavioral Research. Field Methods, 16(3), 307–331. https://doi.org/10.1177/1525822X04266540
Ivanitskaya, L., Clark, D., Montgomery, G., & Primeau, R. (2002). Interdisciplinary
learning: Process and outcomes. Innovation Higher Education, 27(2), 95–111. Jimenez-Aleixandrew, M. P., & Crujeiras, B. (2017). Epistemic Practices and Scientific
Practices in Science Education. Science Education, 31, 69–80. https://doi.org/10.1007/9789463007498_006
Kelly, G. J. (2008). Inquiry, activity, and epistemic practice. In R. A. Duschl & R. E.
Grandy (Eds.), Teaching Scientific Inquiry: Recommendations for research and implementation (pp. 99–117). AW Rotterdam, The Netherlands: Sense Publishers.
Konold, C., Higgins, T., Russell, S. J., & Khalil, K. (2015). Data seen through different
lenses. Educational Studies in Mathematics, 88(3), 305–325. https://doi.org/10.1007/s10649-013-9529-8
Kurasaki, K. S. (2000). Intercoder Reliability for Validating Conclusions Drawn from
Open-Ended Interview Data. Field Methods, 12(3), 179–194. https://doi.org/https://doi.org/10.1177/1525822X0001200301
Lawson, A. (2003). The nature and development of hypothetico-predictive argumentation
with implications for science teaching. International Journal of Science Education, 25(11), 1387–1408.
Madison, B. L., & Steen, L. A. (2003). Quantitative literacy: Why numeracy matters for
schools and colleges. Princeton, NJ: National Council on Education and the Disciplines.
Martin, R. (2016). Discussion in Middle and High School Earth Science Classrooms and
Its Impact on Students’ Abilities to Construct Evidence-Based Arguments in Their Written Work. Retrieved from http://digitalcommons.library.umaine.edu/etd/2487/
Mayes, R. L., Forrester, J., Schuttlefield Christus, J., Peterson, F., & Walker, R. (2014).
Quantitative Reasoning Learning Progression: The Matrix. Numeracy, 7(2), Article 5. https://doi.org/10.5038/1936-4660.7.2.5
Mayes, R. L., Peterson, F., & Bonilla, R. (2013). Quantitative Reasoning Learning
Progressions for Environmental Science: Developing a Framework. Numeracy, 6(1), Article 4. https://doi.org/10.5038/1936-4660.6.1.4

113
McAlister, A., Lee, D., Ehlert KM, Kajfez, R., Faber, C., & Kennedy MS. (2017). Qualitative coding: An approach to assess inter-rater reliability. ASEE Annual Conference & Exposition 2017.
McNeill, K. L. (2009). Teachers’ use of curriculum to support students in writing
scientific arguments to explain phenomena. Science Education, 93(2), 233–268. https://doi.org/10.1002/sce.20294
McNeill, K. L. (2011). Elementary students’ views of explanation, argumentation, and
evidence, and their abilities to construct arguments over the school year. Journal of Research in Science Teaching, 48(7), 793–823. https://doi.org/10.1002/tea.20430
McNeill, K. L., & Krajcik, J. (2007). Middle School Students’ use of appropriate and
inappropriate evidence in writing scientific explanations. In M. C. Lovett & P. Shah (Eds.), Thinking with Data (pp. 233–265). New York: Taylor & Francis.
McNeill, K. L., & Krajcik, J. J. (2012). Supporting Grade 5-8 Students in Constructing
Explanations in Science: The claim, evidence, and reasoning framework for talk and writing. Boston, MA: Pearson Education, Inc.
McNeill, K. L., Lizotte, D. J., Krajcik, J., Marx, R. W., Mcneill, K. L., Lizotte, D. J., …
Marx, R. W. (2006). Supporting Students ’ Construction of Scientific Explanations by Fading Scaffolds in Instructional Materials Supporting Students ’ Construction of Scientific Explanations by Fading Scaffolds in Instructional Materials. Journal of the Learning Sciences, 15(December), 153–191. https://doi.org/10.1207/s15327809jls1502
McNeill, K. L., & Pimentel, D. S. (2010). Scientific discourse in three urban classrooms:
The role of the teacher in engaging high school students in argumentation. Science Education, 94(2), 203–229. https://doi.org/10.1002/sce.20364
Moore, K. C., Carlson, M. P., & Oehrtman, M. (2009). The role of quantitative reasoning
in solving applied precalculus problems. Proceedings of the 2009 Conference on Research in Undergraduate Mathematics Education, (June), 1–26.
National Council of Teachers of Mathematics (NCTM). (2000). Principles and standards
for school mathematics. Reston, VA. National Research Council. (2007). Taking Science to School: Learning and Teaching
Svience in Grades K-8. Washington, DC: The National Academies Press. National Research Council. (2008). Ready, Set, SCIENCE!: Putting Research to Work in
K-8 Science Classrooms. Washington, DC: The National Academies Press.

114
National Research Council. (2012). A Framework for K-12 Science Education: Practices, Corsscutting Concepts, and Core Ideas. Washington, DC: The National Academies Press. https://doi.org/doi.org/10.17226/13165
Neumann, D. L., Hood, M., & Neumann, M. M. (2013). Using real-life data when
teaching statistics: Student perceptions of this strategy in an introductory statistics course. Statistics Education Research Journal, 12(2), 59–70.
NGSS Lead States. (2013). Next Generation Science Standards: For States, By States.
Retrieved from https://www.nextgenscience.org/overview-dci NVivo Qualitative Data Analysis Software. (2018). QSR International Pty Ltd. Orrill, R. (2003). Foreword. In Lynn Arthur Steen (Ed.), Quantitative Literacy: Why
Numeracy Matters for Schools and Colleges (pp. vii–viii). Princeton, NJ: The National Council on Education and the Disciplines. https://doi.org/10.1007/b97511
Osborne, J., Erduran, S., & Simon, S. (2004). Enhancing the quality of argumentation in
school science. Journal of Research in Science Teaching, 41(10), 994–1020. https://doi.org/10.1002/tea.20035
Pfannkuch, M., Regan, M., Wild, C., & Horton, N. (2010). Telling data stories: Essential
dialogues for comparative reasoning. Journal of Statistics Education, 18(1), 1–38. https://doi.org/10.1080/00107530.1992.10746755
Reznitskaya, A., Anderson, R. C., McNurlen, B., Nguyen-Jahiel, K., Archodidou, A., &
Kim, S. (2001). Influences of Oral Discussion on Writeen Argument. Discourse Processes, 32(2–3), 155–175. https://doi.org/10.1080/0163853X.2001.9651596
Sadler, T. D. (2004). Informal reasoning regarding socioscientific issues: A critical
review of research. Journal of Research in Science Teaching, 41(5), 513–536. https://doi.org/10.1002/tea.20009
Sampson, V., & Clark, D. B. (2008). Assessment of the Ways Students Generate
Arguments in Science Education: Current Perspectives and Recommendations for Future Directions. Science Education, 92(3), 447–472. https://doi.org/10.1002/sce.20276
Sandoval, W. A., & Millwood, K. A. (2010). The Quality of Students ’ Use of Evidence
in Written Scientific Explanations. Cognition and Instruction, 1(23), 23–55. https://doi.org/10.1207/s1532690xci2301
Schcolnik, M., & Abarbanel, J. (2006). Constructivism in Theory and Practice: English
Teaching Forum, 4, 12–20.
115
Schcolnik, M., Kol, S., & Abarbanel, J. (2006). Constructivism in Theory and in Practice. English Teaching Forum, 44(4), 12–20.
Schunk, D. H. (2012). Learning Theories, an Educational Perspective (6th ed.). Boston,
MA: Pearson Education, Inc. Seidman, I. (2006). Interviewing as Qualitative Research (3rd ed.). New York, NY:
Teachers College Press. Solem, M., Huynh, N. T., & Boehm, R. (2013). Learning Progressions for Maps ,
Geospatial Technology , and Spatial Thinking : A Research Handbook, (April). Steen, L. (2001). The Case for Quantitative Literacy. (L. Steen, Ed.), Mathematics and
Democracy: The case for quantitative literacy. Princeton, NJ: National Council on Education and the Disciplines.
Steen, L.A. (2004). Achieving quantitative literacy: An urgent challenge for higher
education. Washington, DC: Mathematical Association of America. Steen, Lynn Arthur. (1987). Mathematics Education: A Predictor of Scientific
Competitiveness. Science, 237(4812), 251–302. Strauss, A., & Corbin, J. (1998). Basics of Qualitative Research: Techniques and
Procedures for Developing Grounded Theory. Thousand Oaks, CA: Sage Publications, Inc.
Temi. (2018). Retrieved from http://www.temi.com Thompson, P. W. (2011). Quantitative Reasoning and Mathematical Modeling (This
citation needs to be fixed). In New Perspectives and Directions for Collaborative Research in Mathematics Education (pp. 33–56).
Tuva Labs. (2019). Retrieved from http://tuvalabs.com Tytler, R. (2001). Dimensions of evidence , the public understanding of science and
science education. International Journal of Science Education, 23(8), 815–832. https://doi.org/10.1080/09500690010016058
Varelas, M., Pappas, C. C., Kane, J. M., & Arsenault, A. (2007). Urban Primary-Grade
Children think and Talk Science: Curricular and Instructional Practices That Nurture Participation and Argumentation. Science Education, 92, 65–95. https://doi.org/10.1002/sce
von Glasersfeld, E. (1983). Learning as Constructive Activity. 5th Annual Meeting of the
North American Group of Psychology in Mathematics Education, 1, 41–101. https://doi.org/10.1186/1471-2148-10-101
116
Webber, H., Nelson, S., Weatherbee, R., Zoellick, B., & Schauffler, M. (2014). The graph choice chart: a tool to help students turn data into evidence. The Science Teacher, November, 37+. Retrieved from http://link.galegroup.com/apps/doc/A495841945/AONE?u=maine_orono&sid=AONE&xid=c9713a64.
Whitacre, M. P., & Saul, E. W. (2016). High School Girls’ Interpretations of Science
Graphs: Exploring Complex Visual and Natural Language Hybrid Text. International Journal of Science and Mathematics Education, 14(8), 1387–1406. https://doi.org/10.1007/s10763-015-9677-7
Wolff, A., & Kortuem, G. (2015). Visualising energy : teaching data literacy in schools.
In Sencity 2. Osaka. Zohar, A., & Nemet, F. (2002). Fostering Students’ Knowledge and Argumentation Skills
Through Dilemmas in Human Genetics. Journal of Research in Science Teaching, 39(1), 35–62. https://doi.org/10.1002/tea.10008

117
APPENDIX A: PROGRESS MAP FOR COUNTING AND ORDERING
LEARNING PROGRESSION
Figure A.1: Sample learning progression: Counting and ordering (Curriculum Corporation, 1997).

118
APPENDIX B: DATA STORY 1 ASSIGNMENT
Writing a Data Story A data story tells a story with data. Writing a data story is a way of communicating data and results in an interesting and meaningful way. Many of the elements in a data story would be similar to those in a formal lab report but you have more flexibility to in order to make your story compelling. You will create a data story using either earthquake, volcano or asteroid impact data. It is important to understand that you do not have to use all the data in a data set but you would choose the data to use that is relevant to your question. To begin: 1. Design a question that could be answered from one of the data sets provided. Ex. Do
higher elevation volcanoes erupt more frequently? 2. Determine the data needed to answer your question and create a frequency
plot. This may require editing data in TUVA. (use the edit pencil) 3. Make a claim based on your graph that answers your question 4. Visually or verbally describe the evidence from the graph that supports your claim. Be
thorough and accurate. 5. Visually or verbally give your reasoning - think about how reasoning was developed in
the talk circle. 5. Use the template below to create your data story. This must be ready to present in
class. 6. You will present your data story in class to your peers. You will have 2 minutes to
share your data story, so be sure to be prepared. Data Story Template 1. Keynote Slide Use a SINGLE presentation slide that includes the following:
a. Your question (Be specific) b. Photo of your graph from TUVA (Be sure to have all criteria for graph type and
mechanics in rubric) c. Your scientific explanation. (Reference graph scoring rubric and be sure to
have ALL the criteria) d. Minimize the number of words (50 word is is plenty so be concise!?)
2. Presentation to peers Can use a single notecard You have 2 minutes to present (Be prepared)
a. State your question (reference keynote slide) b. Explain what made this question interesting to you. c. Explain the data you used. d. Show your graph and make your claim e. Explain what the data says by describing your graph (reference the keynote
slide and see rubric) f. Defend your claim with reasoning (reference the keynote slide and see rubric)
Your Grade This is assignment is applying ideas & skills we have explored so far this quarter. It is a 50 point assessment Keynote Slide = 40 points (see checklist for scoring) Presentation = 10 points (if not ready to present you will lose 5 points)

119
APPENDIX C: DATA STORY 2 ASSIGNMENT
Earth Systems Data Story
Look through the TUVA datasets and find one that is of interest. There are LOTS of datasets so don't just select the first one. Make sure the dataset has variables (attributes) that will allow you to ask a question that explores a relationship between at least two Earth subsystems.
Data Story elements
1. Establish your question - (use graph choice chart to help with examples)
Determine the type of graph you want to make. (You can use TUVA or you can use different graphing software. Help is available - ask.
2. Construct graph - be sure to look at graphing rubric to help with criteria for graph type and graph mechanics. You may want to construct more than 1 graph to help answer your question.
3. CER
Claim- consider all the data in your graph. Is there a clear answer to your question? Or is there some pattern or trend that you see that may indicate an answer to your question? Write a statement that provides an answer to your question. Be clear and succinct.
Evidence - describe what the body of data in the graph says. Describe it wholistically and highlight specific details that are relevant to your question and claim. Use descriptive language.
Reasoning - explain why the evidence you described supports your claim.
4. BRIEFLY describe which two earth systems are interacting and how.
5. Be VERY selective with your words. Fewer but more precise language is better than lots of words hoping you have the right ideas conveyed are not as strong.
6. Make your data story visually appealing.
7. Fit data story on 1 page or 1 slide. Posted Mon Nov 27, 2017 at 8:46 am
Criteria Grading Scale
Criteria Grading Scale Question 10
Clear, concise and compelling
8.8 Solid and can be answered with the eivdence
6.5 Elements are almost there but the wording makes it hard to answer.
5 Missing

120
APPENDIX D: STUDENT INTERVIEW PROTOCOL
Student Assent Script Hi, my name is Bryn Keenhold, and I’m from the University of Maine. I am here today because I am doing a project to learn about how students use data in science class to communicate ideas. I would like to ask you a few questions about data stories. I will be recording our conversation. It shouldn’t take more than 30 minutes. If you agree, you can still stop at any time by just telling me you want to stop. No one will be upset if you don’t want to do this, or if you want to stop after you have started. If I ask you a question and you don’t want to answer it, that’s okay, too. Your responses won’t have any effect on your grades in school, and there are no “right” or “wrong” answers to my questions. I am just interested in how you think about data stories. If I seem to be repeating myself, or things you are saying, it is just to make sure that I can remember what we were talking about when I listen to our interview later. Your answers will be private, will not be shared with your teachers, and will only be used for my project. Your parents have said it is okay for you to be in the project if you want to. Would you like to participate in my project? (10 minutes) Question #1: Opening Question/Ice breaker/ “grand tour” 1. What classes are you taking now? What other activities are you doing? 2. If you had to rank your classes, what would be your top three? 3. As I said, I would like to talk to you about your data stories today. I brought the 2 DS
assignments you handed in to your teacher for a grade. • Which data story do you like the best (out of DS 1 and DS2) Why? • Let’s talk about this one more—Pick just this one to talk about… • Can you explain how you chose your question? • How did you pick the data set to use? • Can you explain how you chose which type of graph to create? • Can you explain (why you chose to put this on the y, you used these variables,
you used these words… ) 4. Now that some time has passed since you handed this data story in, are there any changes that you would make to improve it? -(Y) Describe what changes you would make, or anything you would add? -(N) What do you see as one or two strengths of your DS? 5. Is there anything that you could do to make your argument more convincing?
(10-15 minutes) Question #2:
Okay, I am interested in how you create a data story. Let’s take the next 10 minutes and see how far we get. If you don’t finish, that is okay. I have chosen this data set for you to use. Could you walk me through how you would create a short data story using this data? It will be helpful to me if you talk out loud the things you are doing, or what you are thinking about.

121
*Let students take the lead here- additional questions I may ask • What’s your question? • How do you know which of these attributes you are going to use/where to put
them? • How did you decide to make this type of graph? • What relationships do you see in the data? • Why did you choose to use a best-fit line? What does that tell us? • What does your graph say about your question (the atmosphere) (How would
you answer initial question?) • How did you come to that conclusion?
(If they are having trouble- let’s back up: What’s your question. Which variables should be picked)
Additional prompts:
• “So why did you just ‘select this’ ‘pull this to the y-axis’ ‘change your question’…
• Can you be more specific… • Can you elaborate on that… • (Could you use numbers to talk about that?)
After they have finished:
• How certain do you feel about your claim? - What makes you feel sure? - What aspects make you feel unsure? - Do you feel like there is anything you could add
• How could you use numbers to talk about your claim • What was the most challenging part of creating this data story?
(time permitting) Question #3: Show student data story *Here’s a data story that a student created a whole back. I’ll give you a minute to look at Ii and then walk you through.
• How convincing is this DS to you? • What would you do to make it a stronger argument?
o Can you elaborate on why you would…___ (last 5 minutes) Question 4: *We’re just about out of time, but I would like to wrap up with asking you if:
• Is there anything you would have liked me to ask you about your data stories? Or something you would like to share about them?
• How have you liked the DS assignments this year? What do you think you have learned from them?
• If you were to recall one thing that Mrs. Murphy taught you about analyzing data, what would it be.
• Any Ah-ha moments when working with data during the school year? Oh THAT’S what she means?

122
APPENDIX E: TEACHER INTERVIEW PROTOCOL
The purpose of this interview is to better understand the context that they students and the background the students have going into these data stories. I also want to document the logistics of each assignment; and hear some of the strategies you have used to introduce these topics to the students. Generally: I want to know what the students are given- so if I see patterns, I can better understand why. Repeat for DS #1 and DS #2
1) What was your reason for including data stories into your curriculum (Overarching goals for students/Unit and lesson plans/Student objectives)
a. What were you hoping students would get out of DS #1 b. What were you hoping students would get out of DS #2
Okay- To focus on DS#1:
2) What was the assignment that you gave to students? a. How did you present the assignment to the students in class? b. How did you “level the playing field” for all students? (Differentiate
instruction) c. Were students asked to work individually or in groups for this
assignment? d. Where were students expected to work on their data story assignments? e. How long did students have to work on this assignment? (In class? At
home?) f. What are some of the major science topics you would expect students to
have an understanding of before DS #1?(What material had you covered?) g. What did you think their favorite topics would be?
REPEAT FOR DS #2
3) What kind of examples (DS) did you use in class before the assignment? (Before DS 2)
a. Did you model how to create a DS? 4) How did you originally introduce Tuva into the classroom? 5) To what extent have students practiced using Tuva during class time? 6) How did you expect students to choose a graph for DS #1? DS #2?
Graph Choice Chart-Lesson on different types of graphs? 7) To what extent did you explain the “information” section of the data sets to the
students? a. Did you ask students to use the information section?
Once they had completed their initial DS…
8) Did you ask students to hand in drafts? a. Did all students take advantage of handing in a draft? b. What types of general feedback did you give between drafts?
i. In class/written c. What kind of support did struggling students receive?

123
9) After DS 1 was completed- what kind of feedback did you give students- how did that inform your instruction?
a. Did you change anything before handing out DS 2 assignment- emphasize any specific topic.
b. DATA STORY 2? 10) What surprised you the most about student data stories?
Overarching 1) When students use the CER framework, what are you expecting from the
reasoning section? 2) (Any specific ways that you) introduced the reasoning section to your students? 3) What type of math skills do you expect students to use in your classroom? 4) How do you encourage students to incorporate math and QR in your classroom? 5) How have you described correlation to students in your class? 6) How many quantities from the graphs do you expect students to include in their
data stories?
1) Have you noticed improvement/change in comfort level with student data stories between DS1/DS2
a. In other parts of the classroom? 2) How do you find students engage with data stories? Like them? Push them?
Allow them to explore? Encourage curiosity? a. Specifically these examples. How do you see students like this vs this
engaging with data stories? 3) Where do you see students having the most difficulty with their data stories? 4) What are your plans for continuing to build data analysis/data literacy between
now and the end of the year?

124
APPENDIX F: RUBRIC CODEBOOK Table F.1: Rubric codebook Statistical question A question that can be answered using data, that will
inherently include variability and does not have a deterministic answer. Example: “How many hours of TV do 15 year-olds typically watch on Tuesdays” (statistical question) vs “How many hours of TV did you watch on Tuesday” (non-statistical). Yes/no or “one number” answer questions are not considered statistical questions for this study.
Qualitative account Uses only descriptive phrases, no numerical values when describing data and/or the graph created. E.g. “increases, goes down, clumped around one area.”
Appropriate quantitative account Uses numerical values when describing data and/or the graph created. Example: “Each year the surface water increases by approximately 1°F.” Appropriate is used to distinguish between values that are beneficial in supporting the claim, and values that are added in a way that does not support the claim or represent the data as an aggregate. Many of the inappropriate quantitative accounts are also case accounts. Quantitative accounts are also deemed inappropriate if the value is incorrect for the graph.
Case accounts Points out specific values or cases on the graph that do not help show the data as an aggregate. E.g. the start value and end value, or the max and min data points.
Variation Finding relationship/comparison between two variables.
Variable A measurable attribute of the data.
Scientifically accurate Given the datasets from Tuvalabs.com, does the student make a claim that is consistent with scientific principles? Note that students are not penalized if they use the data from Tuvalabs.com correctly but came to an incorrect claim due to an incomplete dataset (as this is a Tuvalabs.com data problem).
Scientific principles
A statement based on repeated experimental observation that explains natural phenomena.
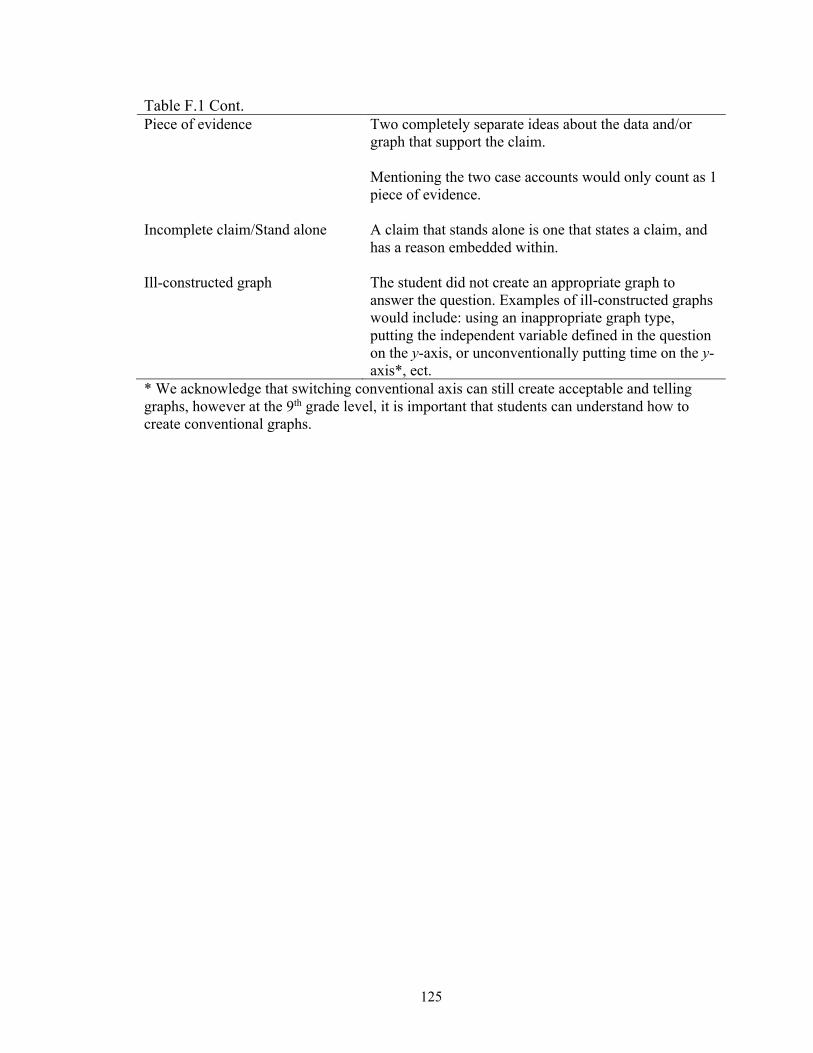
125
Table F.1 Cont. Piece of evidence Two completely separate ideas about the data and/or
graph that support the claim. Mentioning the two case accounts would only count as 1 piece of evidence.
Incomplete claim/Stand alone A claim that stands alone is one that states a claim, and has a reason embedded within.
Ill-constructed graph The student did not create an appropriate graph to answer the question. Examples of ill-constructed graphs would include: using an inappropriate graph type, putting the independent variable defined in the question on the y-axis, or unconventionally putting time on the y-axis*, ect.
* We acknowledge that switching conventional axis can still create acceptable and telling graphs, however at the 9th grade level, it is important that students can understand how to create conventional graphs.

126
BIOGRAPHY OF THE AUTHOR
Bryn Keenhold grew up in Braintree, VT and graduated from Randolph Union
High School in 2010. She earned her bachelor’s degree from St. Lawrence University in
Geology where she studied the movements of the Laurentide Ice Sheet north of the
Adirondacks. Before returning to school for her Masters, she worked as an Interpretive
Ranger for the National Park Service and spent time teaching outdoor education.
She moved to Maine and entered the Master of Science in Teaching program at
The University of Maine in the fall of 2017. After receiving her degree, Bryn will
continue to spread her love of the earth as an Earth Science teacher at Essex High School
in Vermont. Bryn is a candidate for the Master of Science in Teaching degree from the
University of Maine in May 2019.