Embed Size (px)
Citation preview
Report No: AUS0001368
.
Sri Lanka
PER for Nutrition in Sri Lanka
Assessing Public Financing for Nutrition
in Sri Lanka (2014–2018)
.
February 2020
HNP
.
Document of the World Bank
Pub
lic D
iscl
osur
e A
utho
rized
Pub
lic D
iscl
osur
e A
utho
rized
Pub
lic D
iscl
osur
e A
utho
rized
Pub
lic D
iscl
osur
e A
utho
rized
Assessing Public Financing for Nutrition
in Sri Lanka (2014–2018)
February 2020
ASSESSING PUBLIC FINANCING FOR NUTRITION IN SRI LANKA
© 2020 The World Bank
1818 H Street NW, Washington DC 20433
Telephone: 202-473-1000; Internet: www.worldbank.org
Some rights reserved
This work is a product of the staff of The World Bank. The findings, interpretations, and conclusions expressed in this work do not
necessarily reflect the views of the Executive Directors of The World Bank or the governments they represent. The World Bank
does not guarantee the accuracy of the data included in this work. The boundaries, colors, denominations, and other information
shown on any map in this work do not imply any judgment on the part of The World Bank concerning the legal status of any
territory or the endorsement or acceptance of such boundaries.
Rights and Permissions
The material in this work is subject to copyright. Because The World Bank encourages dissemination of its knowledge, this work
may be reproduced, in whole or in part, for noncommercial purposes as long as full attribution to this work is given.
Attribution—please cite the work as follows: World Bank. 2020. Assessing Public Financing for Nutrition in Sri Lanka (2014–
2018). World Bank.
All queries on rights and licenses, including subsidiary rights, should be addressed to World Bank Publications, The World Bank
Group, 1818 H Street NW, Washington, DC 20433, USA; fax: 202-522-2625; e-mail: [email protected].
ASSESSING PUBLIC FINANCING FOR NUTRITION IN SRI LANKA
CONTENTS
Acknowledgments............................................................................................................................ i
Abbreviations and acronyms........................................................................................................... ii
Executive summary ......................................................................................................................... v
1. Introduction ................................................................................................................................. 1
1.1 Rationale, purpose, and structure of the report ..................................................................... 1
2. Context of Sri Lanka ................................................................................................................... 3
2.1 Country profile ...................................................................................................................... 3
2.2 Health, health system, nutrition, and financing ..................................................................... 4
3. Policies and interventions to address the problem of malnutrition in Sri Lanka ...................... 11
3.1 Evidence-based nutrition interventions ............................................................................... 11
3.2 Nutrition-specific interventions .......................................................................................... 12
3.3 Nutrition-sensitive interventions ......................................................................................... 16
3.4 Nutrition-related policies in Sri Lanka ................................................................................ 17
3.5 Nutrition-specific interventions in Sri Lanka ...................................................................... 19
3.6 Nutrition-sensitive interventions in Sri Lanka .................................................................... 24
4. Methods for the assessment ...................................................................................................... 28
4.1 Step 1: Identification ........................................................................................................... 28
4.2 Step 2: Categorization ......................................................................................................... 30
4.3 Step 3: Data collection and assignment of expenditure ...................................................... 32
5. Results and findings .................................................................................................................. 35
5.1 Public expenditure for nutrition interventions in Sri Lanka ................................................ 35
5.2 Public expenditure for nutrition-specific interventions ....................................................... 38
5.3 Public expenditure for nutrition-sensitive interventions ..................................................... 44
5.4 Provincial distribution of public expenditure for nutrition ................................................. 51
6. Summary and the way forward ................................................................................................. 55
6.1 Key findings and limitations ............................................................................................... 55
6.2 Key messages ...................................................................................................................... 56
ASSESSING PUBLIC FINANCING FOR NUTRITION IN SRI LANKA
6.3 Challenges faced in tracking financial information ............................................................ 57
Annex 1: Key interventions for malnutrition throughout the life cycle ........................................ 60
Annex 2: Global evidence base for nutrition interventions .......................................................... 62
Annex 3: Program level Expenditure for Nutrition Interventions, 2018 ...................................... 79
References ..................................................................................................................................... 83
TABLES
Table 1: Ministries having significant responsibilities and programs related to nutrition ........... 29 Table 2: Nutrition interventions and lead ministries ..................................................................... 31 Table 3: Assumptions used for provincial allocation ................................................................... 33
Table 4: Public expenditure for nutrition interventions as a percentage of TPE .......................... 35 Table 5: Cost for scaling up nutrition-specific interventions per year globally ........................... 63
Table 6: WHO recommended nutrition interventions in ANC ..................................................... 68
FIGURES
Figure 1: Provinces in Sri Lanka .................................................................................................... 3 Figure 2: Public health expenditure ................................................................................................ 5
Figure 3: Trends in nutritional status of children under five in Sri Lanka ..................................... 6
Figure 4: Fraction of DALYs attributable to key risk factors for under-five children, 2017 ......... 7
Figure 5: Prevalence of under-five stunting by wealth quintile, 2016 ............................................ 7 Figure 6: Geographic distribution of under-five stunting and wasting, 2016 ................................. 8
Figure 7: Fraction of DALYs attributable to key risk factors for all ages, 2017 .......................... 10 Figure 8: Lancet framework for actions to achieve optimum fetal and child nutrition and
development .................................................................................................................................. 12
Figure 9: Improving nutrition around the life course .................................................................... 13 Figure 10: Mainstreaming maternal nutrition intervention across life cycle and delivery platforms
....................................................................................................................................................... 21 Figure 11: Coverage of maternal nutrition intervention package through ANC Platforms .......... 23 Figure 12: UNICEF conceptual framework of the determinants of child undernutrition............. 30 Figure 13: Nutrition expenditure as a percentage of TPE (unweighted) ...................................... 35
Figure 14: Public expenditure on nutrition 2014–2018 ................................................................ 36 Figure 15: Per capita public expenditure on nutrition 2014–2018 ............................................... 36 Figure 16: Public expenditure on nutrition-specific interventions ............................................... 39
Figure 17: Per capita public expenditure for key nutrition-specific interventions ....................... 39 Figure 18: Public expenditure on nutrition-specific interventions in the health sector ................ 40 Figure 19: Per-pregnant woman public expenditure for MCH medicine/supplements and Thriposha
program ......................................................................................................................................... 40 Figure 20: FHB supplements by MCH program........................................................................... 41 Figure 21: Public expenditure on school and preschool nutritional programs ............................. 43
ASSESSING PUBLIC FINANCING FOR NUTRITION IN SRI LANKA
Figure 22: Per child public expenditure for school and preschool nutritional program, 2018 ..... 43 Figure 23: Coverage of schools under school meal program ....................................................... 44 Figure 24: Allocation versus expenditure on school nutritional program .................................... 44 Figure 25: Public expenditure on nutrition-sensitive interventions .............................................. 45
Figure 26: Per capita public expenditure on nutrition-sensitive interventions ............................. 45 Figure 27: Public expenditure on cash assistance programs ......................................................... 46 Figure 28: Food allowance for pregnant mothers (allocation versus expenditure) ...................... 46 Figure 29: Public expenditure on agriculture sector nutrition-sensitive interventions ................. 47 Figure 30: Public expenditure on fisheries sector nutrition-sensitive interventions ..................... 48
Figure 31: Public expenditure on livestock sector nutrition-sensitive interventions .................... 49 Figure 32: Public expenditure on WASH interventions ............................................................... 50
Figure 33: TPE on nutrition by province, 2014–2018 .................................................................. 52 Figure 34: Per capita public expenditure for the DNAP program, 2018 ...................................... 53 Figure 35: Percentage of preschool meal beneficiaries ................................................................ 53 Figure 36: Percentage of beneficiaries: Pregnant Mother's Food Allowance versus Samurdhi
program ......................................................................................................................................... 54 Figure 37: Conceptual framework ................................................................................................ 62
Figure 38: MAM versus SAM ...................................................................................................... 66 Figure 39: Supporting families for nurturing care and home visiting resource package .............. 76
BOXES
Box 1: Key features of nutrition-sensitive interventions .............................................................. 16
Box 2: Contribution of DPs .......................................................................................................... 37 Box 3: School nutrition programs ................................................................................................. 42
Box 4: Welfare improving measures implemented in 2015 ......................................................... 47 Box 5: Allocation of funds to the provinces ................................................................................. 52 Box 6: WHO guiding principles for child feeding........................................................................ 64
Box 7: Pathways by which agriculture can affect nutrition outcomes .......................................... 70 Box 8: Three milestones to be achieved for a successful biofortification program ...................... 71
Box 9: Pathways by which social protection can affect nutrition outcomes ................................ 74

ASSESSING PUBLIC FINANCING FOR NUTRITION IN SRI LANKA
i
ACKNOWLEDGMENTS
This report was prepared by a joint team of the World Bank and the United Nations Children’s
Fund (UNICEF) consisting of Hideki Higashi, Senior Economist and Task Team Leader (World
Bank); Priyanka Jayawardena, Consultant (World Bank); Louise Moreira Daniels, Chief of Social
Policy (UNICEF); Suganya Yogeswaran, Research Assistant (World Bank); Upula Vishwamithra
Amarasinghe, Research Assistant (World Bank); Safina Abdulloeva, CSD Program Manager
(UNICEF); and Deepika Eranjanie Attygalle, Senior Health Specialist (World Bank) with
technical support from Renuka Jayatissa (Medical Research Institute), Yi-Kyoung Lee, Senior
Health Specialist (World Bank), and Ajay Tandon, Lead Economist (World Bank).
The report was reviewed by Malarmathy Gangatharan, Additional Director General (Department
of National Planning); Chandrika Senanayake, Director (Department of National Planning); Gaya
Adikari, Assistant Secretary to the President (Presidential Secretariat); Hiranya S. Jayawickrama,
Consultant Community Physician (Family Health Bureau, Ministry of Health, Nutrition, and
Indigenous Medicine); Anoma C. M. Basnayake, Consultant Community Physician (Nutrition
Division, Ministry of Health, Nutrition, and Indigenous Medicine); Nayana Senaratne, Director
(Children’s Secretariat, Ministry of Women and Child Affairs); Ilija Talev, Policy Specialist
(UNICEF); Sheila Murthy, Social Protection Consultant (UNICEF); Atif Khurshid, Policy
Specialist (UNICEF); Harriet Torlesse, Regional Advisor Nutrition (UNICEF); and Deepika
Nayar Chaudhery, Senior Health, Nutrition and Population Specialist (World Bank). We would
like to express our appreciation for their valuable advice during the preparation of this report.
We wish to acknowledge the cooperation and support of the Government of Sri Lanka (GOSL),
especially the Nutrition Technical Working Group chaired by the Department of National Planning
with members from the Presidential Secretariat; Ministry of Health, Nutrition, and Indigenous
Medicine; Ministry of Women and Child Affairs; Ministry of Education; Ministry of Agriculture,
Rural Economic Affairs, Irrigation, and Fisheries and Aquatic Resources Development; Ministry
of City Planning, Water Supply, and Higher Education; Ministry of Primary Industries and Social
Empowerment; Ministry of Hill Country New Villages, Infrastructure, and Community
Development; Ministry of Internal and Home Affairs and Provincial Councils and Local
Government; Provincial Councils; Ministry of Finance; and Finance Commission, for their ideas
and suggestions and for providing the information and data used in the preparation of this report.
We would also like to thank the Development Partner Secretariat and Development Partners for
contributing critical information and data.
This material has been funded thanks to the contributions of UK Aid from the UK government and
the European Commission (EC) through the South Asia Food and Nutrition Security Initiative
(SAFANSI), which is administered by the World Bank. The views expressed are entirely those of
the authors and do not necessarily reflect the EC or UK government’s official policies or the
policies of the World Bank or UNICEF.
ASSESSING PUBLIC FINANCING FOR NUTRITION IN SRI LANKA
ii
ABBREVIATIONS AND ACRONYMS
ACCEND Assisting Communities in Creating Environmental and Nutritional
Development
ADB Asian Development Bank
ANC Antenatal Care
BMI Body Mass Index
CCT Conditional Cash Transfer
CFC Ceylon Fisheries Corporation
CKDu Chronic Kidney Diseases of Unknown Etiology
CRC Convention on the Rights of the Child
DALY Disability-adjusted Life Year
DAPH Department of Animal Production and Health
DFAR Department of Fisheries & Aquatic Resources
DHS Demographic and Health Survey
DNCWS Department of National Community Water Supply
DNAP District Nutrition Action Plan
DP Development Partner
EU European Union
EU-SEM European Union Support to Socio Economic Measures
EU-SDDP European Union Support to District Development
FAO Food and Agriculture Organization
FC Finance Commission
FHB Family Health Bureau
FIRST Food and Nutrition Security Impact, Resilience, Sustainability, and
Transformation
FPNP Food Production National Program
FSDD Fisheries Social Development Division
GDP Gross Domestic Product
GNI Gross National Income
GOSL Government of Sri Lanka
GPOBA Global Partnership on Output-based Aid project
HCI Human Capital Index
HPB Health Promotion Bureau
HR Human Resource
IDA Iron Deficiency Anemia
IEC Information, Education, and Communication

ASSESSING PUBLIC FINANCING FOR NUTRITION IN SRI LANKA
iii
IMR Infant Mortality Rate
INMAS Improving Nutrition through Modernizing Agriculture
INPARD Integrating Nutrition Promotion and Rural Development
ISSA International Step by Step Association
IYCF Infant and Young Child Feeding
LB Live Births
LBW Low Birth Weight
LMIC Low- and Middle-Income Country
MAD Minimal Acceptable Diet
MAM Moderate Acute Malnutrition
MCH Maternal and Child Health
MCPWS Ministry of City Planning, Water Supply, and Higher Education
MDD Minimally Diverse Diet
MFARD Ministry of Fisheries and Aquatic Resources Development
MHC Ministry of Hill Country New Villages, Infrastructure, and Community
Development
MLRD Ministry of Livestock and Rural Community Development
MMN Multiple Micronutrient
MNPEA Ministry of National Policies and Economic Affairs
MoA Ministry of Agriculture
MoE Ministry of Education
MoF Ministry of Finance
MoH Ministry of Health, Nutrition, and Indigenous Medicine
MOH Medical Officer of Health
MRI Medical Research Institute
MSAPN Multi-sector Action Plan for Nutrition
MPISE Ministry of Primary Industry and Social Empowerment
MWCA Ministry of Women and Child Affairs
NAQDA National Aquaculture Development Authority
NCD Noncommunicable Disease
ND Nutrition Division
NMR Neonatal Mortality Rate
NNP National Nutritional Policy
NPD Department of National Planning
NWSDB National Water Supply and Drainage Board
OOP Out-of-Pocket
ORS Oral Rehydration Solution
ASSESSING PUBLIC FINANCING FOR NUTRITION IN SRI LANKA
iv
PHE Public Health Expenditure
PHM Public Health Midwife
PNC Postnatal Care
RMNCAYH Reproductive, Maternal, Newborn, Child Adolescent, and Youth Health
RO Reverse Osmosis
RUTF Ready-to-Use Therapeutic Food
SAFANSI South Asia Food and Nutrition Security Initiative
SAM Severe Acute Malnutrition
SDG Sustainable Development Goal
SHN School Health and Nutrition
SUN Scaling Up Nutrition
TPE Total Public Expenditure
UN United Nations
UNICEF United Nations Children’s Fund
WASH Water, Sanitation, and Hygiene
WASSIP Water Supply and Sanitation Improvement Project
WAZ Weight-for-Age Z Score
WFP World Food Programme
WHO World Health Organization
ASSESSING PUBLIC FINANCING FOR NUTRITION IN SRI LANKA
v
EXECUTIVE SUMMARY
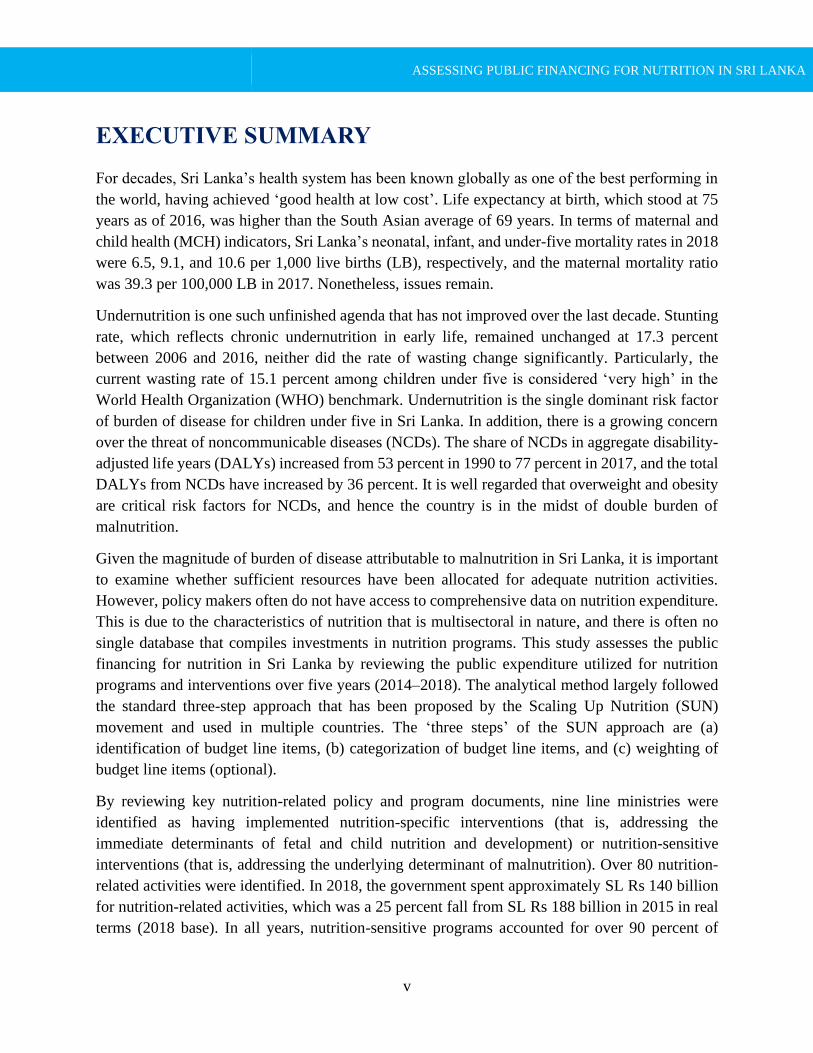
For decades, Sri Lanka’s health system has been known globally as one of the best performing in
the world, having achieved ‘good health at low cost’. Life expectancy at birth, which stood at 75
years as of 2016, was higher than the South Asian average of 69 years. In terms of maternal and
child health (MCH) indicators, Sri Lanka’s neonatal, infant, and under-five mortality rates in 2018
were 6.5, 9.1, and 10.6 per 1,000 live births (LB), respectively, and the maternal mortality ratio
was 39.3 per 100,000 LB in 2017. Nonetheless, issues remain.
Undernutrition is one such unfinished agenda that has not improved over the last decade. Stunting
rate, which reflects chronic undernutrition in early life, remained unchanged at 17.3 percent
between 2006 and 2016, neither did the rate of wasting change significantly. Particularly, the
current wasting rate of 15.1 percent among children under five is considered ‘very high’ in the
World Health Organization (WHO) benchmark. Undernutrition is the single dominant risk factor
of burden of disease for children under five in Sri Lanka. In addition, there is a growing concern
over the threat of noncommunicable diseases (NCDs). The share of NCDs in aggregate disability-
adjusted life years (DALYs) increased from 53 percent in 1990 to 77 percent in 2017, and the total
DALYs from NCDs have increased by 36 percent. It is well regarded that overweight and obesity
are critical risk factors for NCDs, and hence the country is in the midst of double burden of
malnutrition.
Given the magnitude of burden of disease attributable to malnutrition in Sri Lanka, it is important
to examine whether sufficient resources have been allocated for adequate nutrition activities.
However, policy makers often do not have access to comprehensive data on nutrition expenditure.
This is due to the characteristics of nutrition that is multisectoral in nature, and there is often no
single database that compiles investments in nutrition programs. This study assesses the public
financing for nutrition in Sri Lanka by reviewing the public expenditure utilized for nutrition
programs and interventions over five years (2014–2018). The analytical method largely followed
the standard three-step approach that has been proposed by the Scaling Up Nutrition (SUN)
movement and used in multiple countries. The ‘three steps’ of the SUN approach are (a)
identification of budget line items, (b) categorization of budget line items, and (c) weighting of
budget line items (optional).
By reviewing key nutrition-related policy and program documents, nine line ministries were
identified as having implemented nutrition-specific interventions (that is, addressing the
immediate determinants of fetal and child nutrition and development) or nutrition-sensitive
interventions (that is, addressing the underlying determinant of malnutrition). Over 80 nutrition-
related activities were identified. In 2018, the government spent approximately SL Rs 140 billion
for nutrition-related activities, which was a 25 percent fall from SL Rs 188 billion in 2015 in real
terms (2018 base). In all years, nutrition-sensitive programs accounted for over 90 percent of
ASSESSING PUBLIC FINANCING FOR NUTRITION IN SRI LANKA
vi
nutrition expenditure, a clear dominance over nutrition-specific programs. Per capita nutrition
expenditure in 2018 was SL Rs 6,441 (approximately US$39.6). The nutrition expenditure as share
of gross domestic product (GDP) was 1.0 percent, which is equivalent to the level of Bhutan (1.0
percent). The share of nutrition in the total public expenditure (TPE) was 5.2 percent in 2018. This
was higher than Bhutan (3 percent), yet substantially lower than other countries such as Nepal (23
percent) or Bangladesh (9 percent). Given the small share of nutrition-specific programs, they
accounted for only 0.5 percent of TPE. Overall, the nutrition share of TPE has been gradually
declining from the 2015 level (6.9 percent), indicating that nutrition has been given less attention
in recent years. The largest nutrition-specific interventions were school meals and the Thriposha
program that collectively accounted for over 80 percent of nutrition-specific expenditure. Among
the nutrition-sensitive programs, the Samurdhi program; agriculture (particularly fertilizer
subsidy); and water, sanitation, and hygiene (WASH) programs were the largest and accounted for
over 90 percent of nutrition-sensitive expenditure.
It was noted that a significant share of resources has been used by a small number of programs that
may or may not be the most effective interventions in reducing malnutrition. A rigorous
prioritization exercise would be warranted by investigating the effectiveness, cost-effectiveness,
and good practices of nutrition interventions, both nutrition-specific and nutrition-sensitive
programs. Targeted programs are more cost-effective than blanket coverage provided that the
targets are well selected. Weighted resource allocation has already been practiced by the
government, though on a limited scale. There is a potential to gain some fiscal space by changing
the supplementary feeding program, for pregnant and lactating women (Thriposha), to target at-
risk pregnant women rather than all women. In this regard, the government has reviewed the design
of supplementary feeding program for pregnant and lactating women, with possible change in
targeting strategy from blanket to targeted provision in future.
The evidence of nutrition-specific interventions is generally more robust and they address the
immediate determinants of malnutrition. More investment in nutrition-specific programs would be
warranted given their current lower share compared to nutrition-sensitive programs. Nonetheless,
the effects could be undermined if the underlying causes are not properly addressed. The difficulty
in mobilizing resources for nutrition-sensitive programs rests with the fact that decisions are also
guided by other agendas of the sectors. It is therefore important to mainstream nutrition in all
sectors to have more voice in decision making.
ASSESSING PUBLIC FINANCING FOR NUTRITION IN SRI LANKA
1
1. INTRODUCTION
1.1 Rationale, purpose, and structure of the report
Nutrition is a critical element that determines a country’s stock of human capital. Early childhood
undernutrition is associated with poor psychological functioning in late adolescence (Walker et al.
2007). In particular, undernutrition before the age of two predicts poorer cognitive and educational
outcomes in later childhood and adolescence, which has significant educational and economic
consequences at the individual, household, and community levels (WHO 2014a). Economists
estimate that undernutrition can reduce a country’s gross domestic product (GDP) by 7 percent
and thus is an enormous drain on economic productivity and growth (Galasso and Wagstaff 2018).
Conversely, overweight and obesity pose yet another challenge for human capital development
due to the elevated risks of noncommunicable diseases (NCDs) in productive ages. Inadequate diet
and high body mass index (BMI) have been key risk factors for the disease burden in high-income
countries and are now rapidly growing in middle-income countries.1
Given the critical role nutrition plays for a country’s human capital development, it is important
to examine whether sufficient resources are allocated for adequate nutrition activities. However,
policy makers often do not have access to comprehensive data on nutrition investments. This is
chiefly due to the characteristics of nutrition that is multisectoral in nature, and there is often no
single database that compiles expenditure on nutrition programs. Assessing the size of nutrition
investments therefore requires careful investigation, identification of relevant line items, analysis,
and some assumptions. Given the complexity involved, the Scaling Up Nutrition (SUN) movement
has developed a standard approach to capture expenditure of nutrition programs from multiple
sectors. The approach has enabled countries to investigate public financing for nutrition, albeit
with various applications depending on each context.
This study aims to assess the public financing for nutrition in Sri Lanka. The primary purpose is
to understand the size and share of public investments in nutrition relative to the overall level of
public expenditure in the country. Second, it discusses whether the nutrition interventions in which
the government budget is spent are in line with the global evidence base and priorities set out in
national policies. It also provides some recommendations on how such assessments could be
improved from challenges and difficulties faced in undertaking this exercise.
This report begins with background and contextual information of nutrition in Sri Lanka (Chapter
2). It then provides an overview of globally practiced nutrition interventions and policies and
programs that have been implemented in the country (Chapter 3). Chapter 4 describes the approach
1 IHME (Institute for Health Metrics and Evaluation). 2018. GBD Compare. https://vizhub.healthdata.org/gbd-compare/.
ASSESSING PUBLIC FINANCING FOR NUTRITION IN SRI LANKA
2
used for the analysis followed by results and findings in Chapter 5. The report concludes with brief
discussions on key findings, challenges, and recommendations in Chapter 6.
ASSESSING PUBLIC FINANCING FOR NUTRITION IN SRI LANKA
3
2. CONTEXT OF SRI LANKA
2.1 Country profile
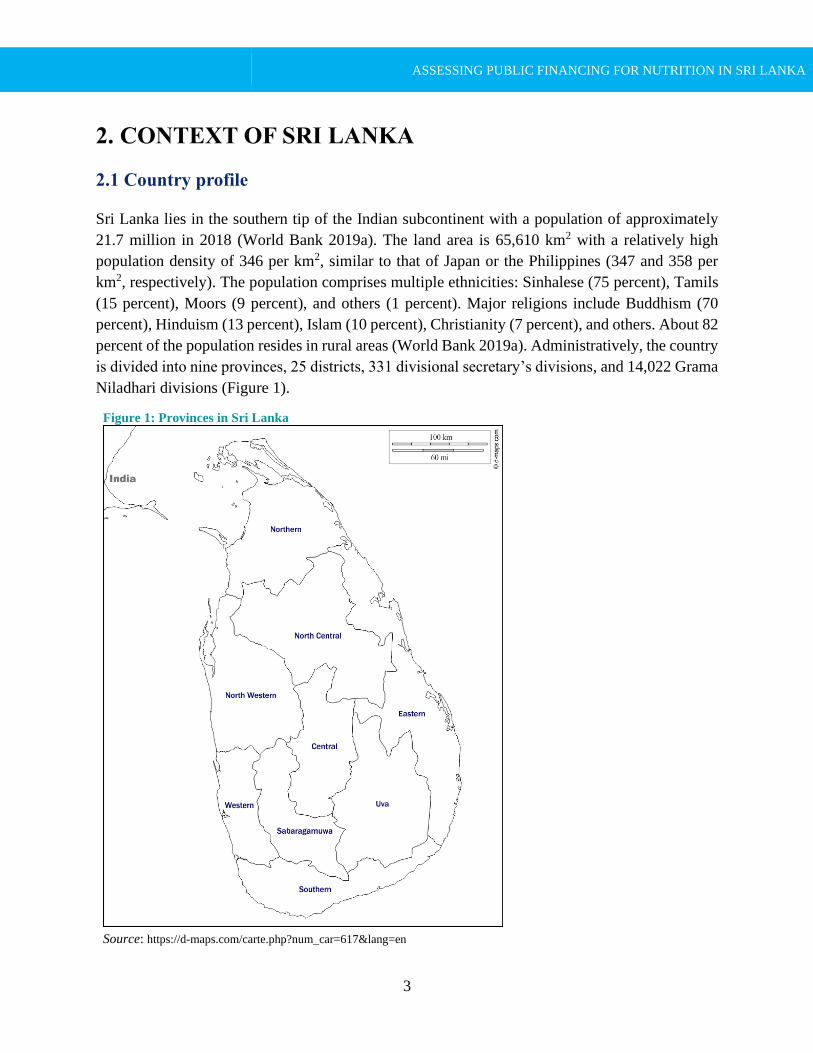
Sri Lanka lies in the southern tip of the Indian subcontinent with a population of approximately
21.7 million in 2018 (World Bank 2019a). The land area is 65,610 km2 with a relatively high
population density of 346 per km2, similar to that of Japan or the Philippines (347 and 358 per
km2, respectively). The population comprises multiple ethnicities: Sinhalese (75 percent), Tamils
(15 percent), Moors (9 percent), and others (1 percent). Major religions include Buddhism (70
percent), Hinduism (13 percent), Islam (10 percent), Christianity (7 percent), and others. About 82
percent of the population resides in rural areas (World Bank 2019a). Administratively, the country
is divided into nine provinces, 25 districts, 331 divisional secretary’s divisions, and 14,022 Grama
Niladhari divisions (Figure 1).
Figure 1: Provinces in Sri Lanka
Source: https://d-maps.com/carte.php?num_car=617&lang=en

ASSESSING PUBLIC FINANCING FOR NUTRITION IN SRI LANKA
4
After the end of the war in 2009, economic growth picked up momentum, attaining what
economists term as a ‘peace dividend’. The annual GDP per capita growth rate averaged
approximately 6 percent between 2008 and 2012 with a peak of 9 percent in 2012 (World Bank
2019a). Alongside the economic growth, poverty has declined significantly over the last decade.
The national poverty headcount ratio decreased from 15 percent of the population in 2006 to 4
percent in 2016; 24 percent to 10 percent at I$ 3.2 per day level, and 4 percent to 1 percent at I$
1.9 per day level during the same period (World Bank 2019a). The gross national income (GNI)
per capita was US$4,060 in 2018, which was similar to the size of the economy of Indonesia
(US$3,840) or Jordan (US$4,210) (World Bank 2019a). The country has transitioned from a
lower-middle-income country to an upper-middle-income country in July 2019 according to the
World Bank classification. The dominant sector of the economy is the service sector that
accommodates 46 percent of employment with a GDP share of 57 percent in 2018 (World Bank
2019a). The share of agriculture has continued to decline over decades and now accounts for only
8 percent of GDP albeit with a share of 26 percent of employment.
2.2 Health, health system, nutrition, and financing
Public health services in Sri Lanka are provided free of charge to the population at all levels with
island-wide coverage. The country has achieved relatively strong health indicators at low health
system costs. Life expectancy at birth, which stood at 77 years in 2017, was higher than the South
Asian average of 69 years (World Bank 2019a). In terms of maternal and child health (MCH)
indicators, Sri Lanka’s neonatal, infant, and under-five mortality rates in 2018 were 6.5, 9.1, and
10.6 per 1,000 live births (LB), respectively, and the maternal mortality ratio was 39.3 per 100,000
LB in 2017.2 Public health care services are provided through a network of 1,118 government
institutions operating at three levels. The primary level includes the primary medical care units
and divisional hospitals; the secondary level includes the district general hospitals and base
hospitals; and the tertiary level includes the National Hospital, teaching hospitals, and provincial
general hospitals. Specialized care is provided by secondary and tertiary-level institutions. Despite
the distinct levels of health institutions, the Sri Lankan health care system allows patients to bypass
the primary-level institutions and obtain services directly from secondary and tertiary levels, which
might increase the cost of health care provision since costs in secondary and tertiary institutions
are usually higher, and this can potentially decrease the budget available for primary
care/preventive health. The private sector is large in the country, particularly in providing
outpatient care, outpatient drugs, and lab examination. Medical officers who practice in public
facilities often provide private practice after hours. Even patients in the lowest wealth quintile seek
private outpatient care due to inconvenient opening hours of public sector (close at 4 p.m.), less
waiting time, and better personalized services.
2 FHB. 2019. “Statistics.” https://fhb.health.gov.lk/index.php/en/statistics.
ASSESSING PUBLIC FINANCING FOR NUTRITION IN SRI LANKA
5
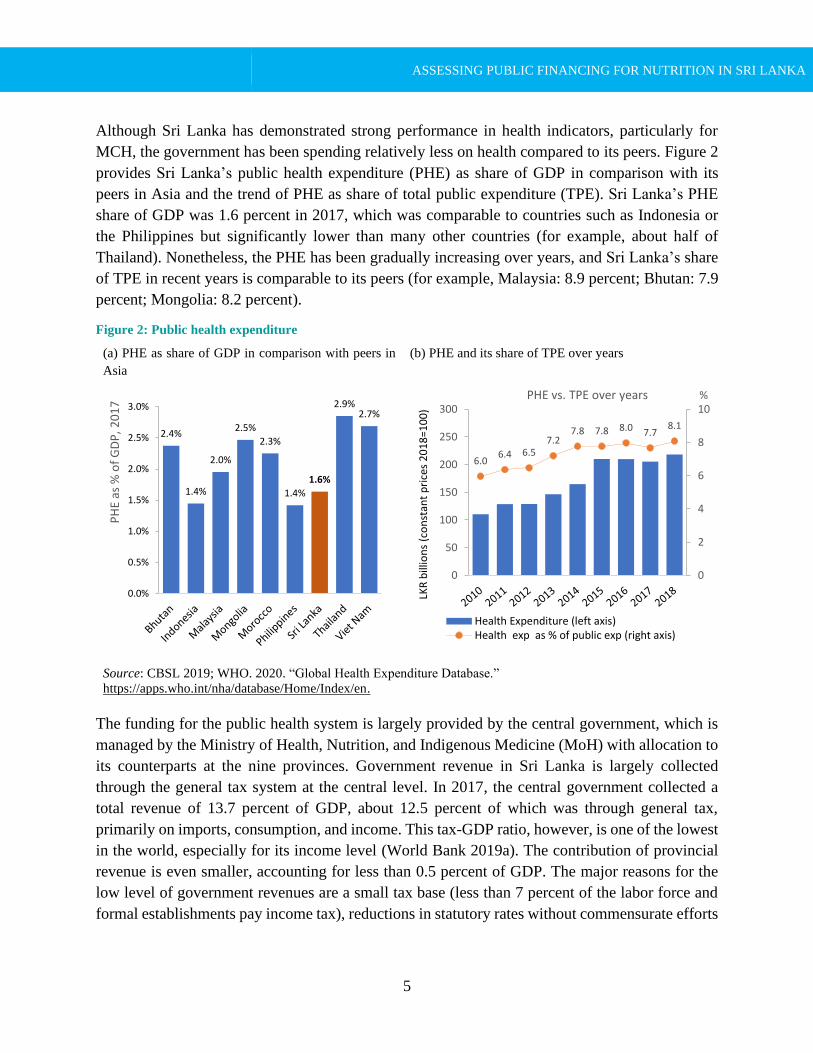
Although Sri Lanka has demonstrated strong performance in health indicators, particularly for
MCH, the government has been spending relatively less on health compared to its peers. Figure 2
provides Sri Lanka’s public health expenditure (PHE) as share of GDP in comparison with its
peers in Asia and the trend of PHE as share of total public expenditure (TPE). Sri Lanka’s PHE
share of GDP was 1.6 percent in 2017, which was comparable to countries such as Indonesia or
the Philippines but significantly lower than many other countries (for example, about half of
Thailand). Nonetheless, the PHE has been gradually increasing over years, and Sri Lanka’s share
of TPE in recent years is comparable to its peers (for example, Malaysia: 8.9 percent; Bhutan: 7.9
percent; Mongolia: 8.2 percent).
Figure 2: Public health expenditure
(a) PHE as share of GDP in comparison with peers in
Asia
(b) PHE and its share of TPE over years
Source: CBSL 2019; WHO. 2020. “Global Health Expenditure Database.”
https://apps.who.int/nha/database/Home/Index/en.
The funding for the public health system is largely provided by the central government, which is
managed by the Ministry of Health, Nutrition, and Indigenous Medicine (MoH) with allocation to
its counterparts at the nine provinces. Government revenue in Sri Lanka is largely collected
through the general tax system at the central level. In 2017, the central government collected a
total revenue of 13.7 percent of GDP, about 12.5 percent of which was through general tax,
primarily on imports, consumption, and income. This tax-GDP ratio, however, is one of the lowest
in the world, especially for its income level (World Bank 2019a). The contribution of provincial
revenue is even smaller, accounting for less than 0.5 percent of GDP. The major reasons for the
low level of government revenues are a small tax base (less than 7 percent of the labor force and
formal establishments pay income tax), reductions in statutory rates without commensurate efforts
2.4%
1.4%
2.0%
2.5%
2.3%
1.4%
1.6%
2.9%2.7%
0.0%
0.5%
1.0%
1.5%
2.0%
2.5%
3.0%
PH
E as
% o
f G
DP
, 20
17
6.06.4 6.5
7.27.8 7.8 8.0 7.7
8.1
0
2
4
6
8
10
0
50
100
150
200
250
300%
LKR
bill
ion
s (c
on
stan
t p
rice
s 2
01
8=1
00
)
PHE vs. TPE over years
Health Expenditure (left axis)Health exp as % of public exp (right axis)
ASSESSING PUBLIC FINANCING FOR NUTRITION IN SRI LANKA
6
to expand the tax base, inefficiencies in administration, and numerous exemptions (World Bank
2017a). The low revenue base limits the more adequate investment in all sectors including health.
Despite the provision of free public health care, public spending on health constitutes less than
half of the country’s total health expenditure. In 2016, out-of-pocket (OOP) health payments
constituted 50 percent of total health expenditure (WHO 2018), which is, for example,
substantially higher than the corresponding figure for Thailand (12 percent). Nonetheless, the total
health spending is still substantially lower (3.9 percent of GDP in 2016) than its comparator
countries.
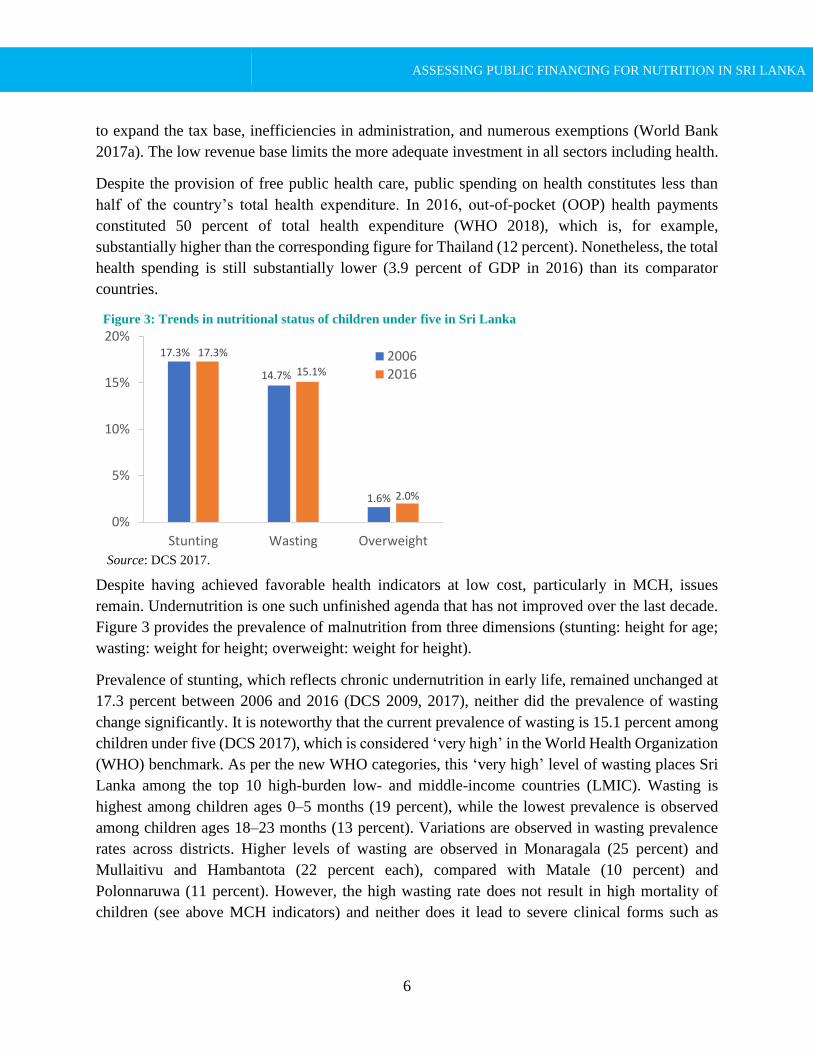
Figure 3: Trends in nutritional status of children under five in Sri Lanka
Source: DCS 2017.
Despite having achieved favorable health indicators at low cost, particularly in MCH, issues
remain. Undernutrition is one such unfinished agenda that has not improved over the last decade.
Figure 3 provides the prevalence of malnutrition from three dimensions (stunting: height for age;
wasting: weight for height; overweight: weight for height).
Prevalence of stunting, which reflects chronic undernutrition in early life, remained unchanged at
17.3 percent between 2006 and 2016 (DCS 2009, 2017), neither did the prevalence of wasting
change significantly. It is noteworthy that the current prevalence of wasting is 15.1 percent among
children under five (DCS 2017), which is considered ‘very high’ in the World Health Organization
(WHO) benchmark. As per the new WHO categories, this ‘very high’ level of wasting places Sri
Lanka among the top 10 high-burden low- and middle-income countries (LMIC). Wasting is
highest among children ages 0–5 months (19 percent), while the lowest prevalence is observed
among children ages 18–23 months (13 percent). Variations are observed in wasting prevalence
rates across districts. Higher levels of wasting are observed in Monaragala (25 percent) and
Mullaitivu and Hambantota (22 percent each), compared with Matale (10 percent) and
Polonnaruwa (11 percent). However, the high wasting rate does not result in high mortality of
children (see above MCH indicators) and neither does it lead to severe clinical forms such as
17.3%
14.7%
1.6%
17.3%
15.1%
2.0%
0%
5%
10%
15%
20%
Stunting Wasting Overweight
20062016
ASSESSING PUBLIC FINANCING FOR NUTRITION IN SRI LANKA
7
Marasmus or Kwashiorkor. Overweight, on the other hand, is an emerging issue that is anticipated
to increase in coming years in Sri Lanka, although the prevalence is not high among children yet.
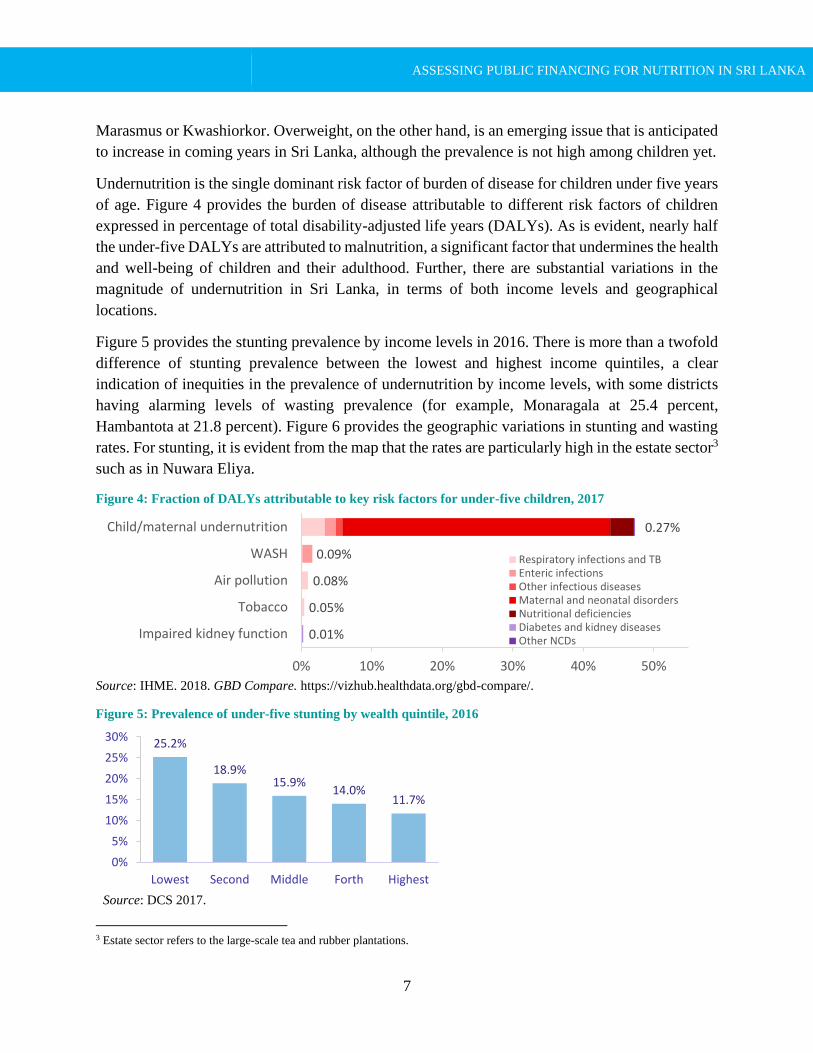
Undernutrition is the single dominant risk factor of burden of disease for children under five years
of age. Figure 4 provides the burden of disease attributable to different risk factors of children
expressed in percentage of total disability-adjusted life years (DALYs). As is evident, nearly half
the under-five DALYs are attributed to malnutrition, a significant factor that undermines the health
and well-being of children and their adulthood. Further, there are substantial variations in the
magnitude of undernutrition in Sri Lanka, in terms of both income levels and geographical
locations.
Figure 5 provides the stunting prevalence by income levels in 2016. There is more than a twofold
difference of stunting prevalence between the lowest and highest income quintiles, a clear
indication of inequities in the prevalence of undernutrition by income levels, with some districts
having alarming levels of wasting prevalence (for example, Monaragala at 25.4 percent,
Hambantota at 21.8 percent). Figure 6 provides the geographic variations in stunting and wasting
rates. For stunting, it is evident from the map that the rates are particularly high in the estate sector3
such as in Nuwara Eliya.
Figure 4: Fraction of DALYs attributable to key risk factors for under-five children, 2017
Source: IHME. 2018. GBD Compare. https://vizhub.healthdata.org/gbd-compare/.
Figure 5: Prevalence of under-five stunting by wealth quintile, 2016
Source: DCS 2017.
3 Estate sector refers to the large-scale tea and rubber plantations.
0.01%
0.05%
0.08%
0.09%
0.27%
0% 10% 20% 30% 40% 50%
Impaired kidney function
Tobacco
Air pollution
WASH
Child/maternal undernutrition
Respiratory infections and TBEnteric infectionsOther infectious diseasesMaternal and neonatal disordersNutritional deficienciesDiabetes and kidney diseasesOther NCDs
25.2%
18.9%15.9%
14.0%11.7%
0%
5%
10%
15%
20%
25%
30%
Lowest Second Middle Forth Highest

ASSESSING PUBLIC FINANCING FOR NUTRITION IN SRI LANKA
8
Figure 6: Geographic distribution of under-five stunting and wasting, 2016
Source: DCS 2017.

ASSESSING PUBLIC FINANCING FOR NUTRITION IN SRI LANKA
9
It is well recognized that exclusive breastfeeding reduces the neonatal mortality rates (NMRs) and
infant mortality rates (IMRs). The infant and neonatal mortality rates have shown remarkable
reductions during the last decade in Sri Lanka. IMR has reduced from 14.4 per 1,000 LB in 2000
to 10.9 per 1,000 LB in 2007 and to 8 per 1,000 LB in 2014. NMR has reduced from 10.1 per
1,000 LB in 2000 to 8.1 per 1,000 LB in 2007 and to 5.6 per 1,000 LB in 2014 (Registrar General).
Early initiation of breastfeeding is reportedly culturally accepted and benefits 90.3 percent of
infants in Sri Lanka. The proportion of infants in Sri Lanka ages less than six months who are
exclusively breastfed is also the highest in the South Asia region (82 percent).
Conversely, two out of five (38 percent) of children ages 6–23 months do not receive a minimal
acceptable diet (MAD) in terms of food diversity and meal frequency (DCS 2017). Dietary
diversity is a larger problem than meal frequency. One out of four children ages 6–23 months do
not consume a minimally diverse diet (MDD), and dietary diversity is particularly low among the
youngest infants, especially those living in the estate sector and rural area (MDD is 52 percent
among 6–8-month-old infants). It is of concern that these statistics may mask elements of poor
feeding practices that are not picked up by these indicators (for example, insufficient quantities of
diverse foods), given the critical level of wasting and persistent stunting. A multisectoral nutrition
assessment in the estate sector suggested being a child of a working mother lowers dietary diversity
and MAD (World Bank 2017b). This may partly explain the high malnutrition rate in the estate
sector where a high proportion of mothers works (47.5 percent) compared to the national average
of 36 percent, which further reduces for mothers with young children by 7.4 percentage point
(World Bank 2017c). A subsequent study has shown that better nutrition could be achieved even
in the estate sector by adopting positive behaviors such as adequate infant and young child feeding
(exclusive breast feeding for six months, healthy complementary feeding practices, and adequate
introduction of animal proteins), information and health service seeking behaviors, regular health
service utilization, and father’s involvement in feeding and child care (World Bank 2018).
In addition to the unfinished agenda of undernutrition, there is a growing concern over the threat
of NCDs. Sri Lanka is in the midst of an epidemiological transition with a rapidly aging population
and changing disease pattern toward high burden of NCDs. The share of NCDs in aggregate
DALYs has risen from 53 percent in 1990 to 77 percent in 2017, and the total DALYs from NCDs
have increased by 36 percent.4 A number of NCDs are known to be associated with lifestyles and
behaviors such as smoking, alcohol consumption, and unhealthy diet. Figure 7 provides the
fractions of risk factors associated with unhealthy diet. More than a quarter of disease burden of
all ages can be attributed to nutrition-related risk factors such as dietary risks (13.5 percent), high
BMI (7.7 percent), malnutrition (4.2 percent), and so on. Overweight is becoming a major threat
to the health of population, especially for adults. About 45 percent of ever-married women in Sri
Lanka are overweight or obese (BMI ≥ 25 kg/m2), according to the latest Demographic and Health
4 IHME. 2018. GBD Compare. https://vizhub.healthdata.org/gbd-compare/.
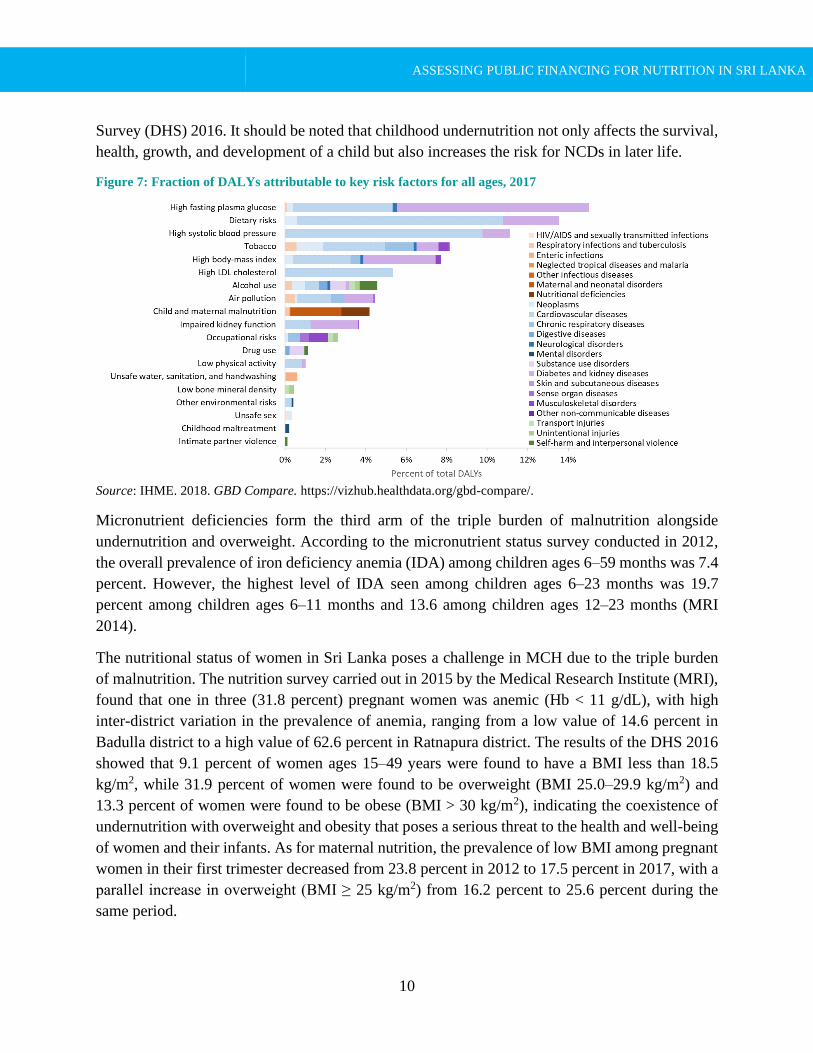
ASSESSING PUBLIC FINANCING FOR NUTRITION IN SRI LANKA
10
Survey (DHS) 2016. It should be noted that childhood undernutrition not only affects the survival,
health, growth, and development of a child but also increases the risk for NCDs in later life.
Figure 7: Fraction of DALYs attributable to key risk factors for all ages, 2017
Source: IHME. 2018. GBD Compare. https://vizhub.healthdata.org/gbd-compare/.
Micronutrient deficiencies form the third arm of the triple burden of malnutrition alongside
undernutrition and overweight. According to the micronutrient status survey conducted in 2012,
the overall prevalence of iron deficiency anemia (IDA) among children ages 6–59 months was 7.4
percent. However, the highest level of IDA seen among children ages 6–23 months was 19.7
percent among children ages 6–11 months and 13.6 among children ages 12–23 months (MRI
2014).
The nutritional status of women in Sri Lanka poses a challenge in MCH due to the triple burden
of malnutrition. The nutrition survey carried out in 2015 by the Medical Research Institute (MRI),
found that one in three (31.8 percent) pregnant women was anemic (Hb < 11 g/dL), with high
inter-district variation in the prevalence of anemia, ranging from a low value of 14.6 percent in
Badulla district to a high value of 62.6 percent in Ratnapura district. The results of the DHS 2016
showed that 9.1 percent of women ages 15–49 years were found to have a BMI less than 18.5
kg/m2, while 31.9 percent of women were found to be overweight (BMI 25.0–29.9 kg/m2) and
13.3 percent of women were found to be obese (BMI > 30 kg/m2), indicating the coexistence of
undernutrition with overweight and obesity that poses a serious threat to the health and well-being
of women and their infants. As for maternal nutrition, the prevalence of low BMI among pregnant
women in their first trimester decreased from 23.8 percent in 2012 to 17.5 percent in 2017, with a
parallel increase in overweight (BMI ≥ 25 kg/m2) from 16.2 percent to 25.6 percent during the
same period.
ASSESSING PUBLIC FINANCING FOR NUTRITION IN SRI LANKA
11
3. POLICIES AND INTERVENTIONS TO ADDRESS THE
PROBLEM OF MALNUTRITION IN SRI LANKA
3.1 Evidence-based nutrition interventions
South Asia bears the greatest share of all undernutrition and is home to almost 40 percent of all
stunted children (59 million) and over half of all wasted children (26 million) in the world
(UNICEF, WHO, and World Bank 2019). Malnutrition is often misunderstood by policy makers,
and the public at large, in many ways: the image that most have of malnutrition is a picture of a
dangerously thin child who is not receiving sufficient food. While that represents one type of
malnutrition, this narrow understanding hinders comprehension of the broader problem, which is
not only about lack of food but poor dietary practices in terms of both lack of nutritious food and
excess consumption of unhealthy food. It also fails to account for the many different but
interrelated factors that contribute to nutritional status, such as water and sanitation facilities,
health status and health care services, care and feeding practices including personal hygiene, and
so on.
Due to these varied and compounding determinants of malnutrition, the global scientific
community concedes that maternal and child malnutrition is a complex public health issue that
cannot be solved with simple one-dimensional solution by any sector alone. Various researchers,
practitioners, and politicians have recognized that joint work across different sectors, systems, and
disciplines under a shared framework is crucial to address this complex issue. The complexity of
nutrition has been widely acknowledged by many specialists from academic and nonacademic
disciplines who work together aiming to foster innovative solutions. Numerous scientific
evidences show that malnutrition during the critical thousand days between conception and a
child’s second birthday can cause irreversible consequences to the brain and child’s physical,
cognitive, social, and emotional development.
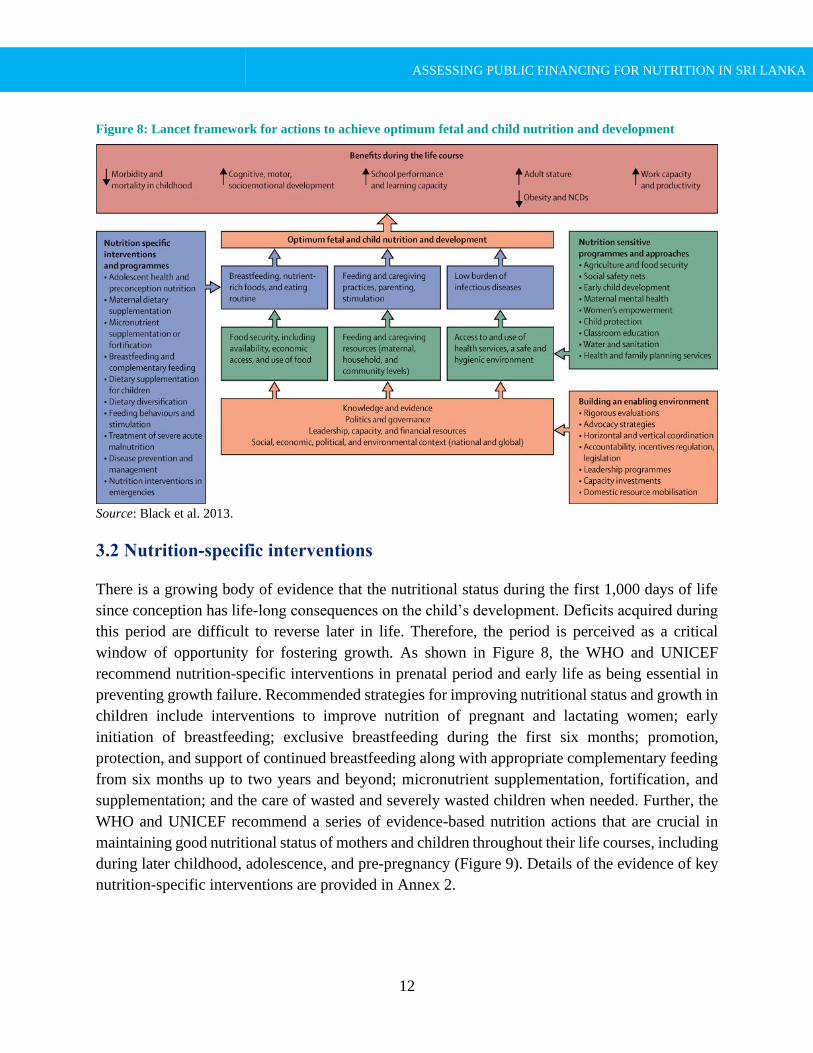
Building on the nutritional framework of the United Nations Children’s Fund (UNICEF), the 2013
Lancet series identified 10 high-impact nutrition-specific interventions and different nutrition-
sensitive interventions to improve maternal and child nutrition as provided in Figure 8. Nutrition-
specific interventions are “interventions or programs that address the immediate determinants of
fetal and child nutrition and development—adequate food and nutrient intake, feeding, caregiving
and parenting practices, and low burden of infectious diseases” (Ruel, Alderman, and Maternal
and Child Nutrition Study Group 2013). Nutrition-sensitive interventions are “interventions or
program that address the underlying determinants of fetal and child nutrition and development—
food security; adequate caregiving resources at the maternal, household and community levels;
and access to health services and a safe and hygienic environment—and incorporate specific
nutrition goals and actions” (Ruel, Alderman, and Maternal and Child Nutrition Study Group
2013).
ASSESSING PUBLIC FINANCING FOR NUTRITION IN SRI LANKA
12
Figure 8: Lancet framework for actions to achieve optimum fetal and child nutrition and development
Source: Black et al. 2013.
3.2 Nutrition-specific interventions
There is a growing body of evidence that the nutritional status during the first 1,000 days of life
since conception has life-long consequences on the child’s development. Deficits acquired during
this period are difficult to reverse later in life. Therefore, the period is perceived as a critical
window of opportunity for fostering growth. As shown in Figure 8, the WHO and UNICEF
recommend nutrition-specific interventions in prenatal period and early life as being essential in
preventing growth failure. Recommended strategies for improving nutritional status and growth in
children include interventions to improve nutrition of pregnant and lactating women; early
initiation of breastfeeding; exclusive breastfeeding during the first six months; promotion,
protection, and support of continued breastfeeding along with appropriate complementary feeding
from six months up to two years and beyond; micronutrient supplementation, fortification, and
supplementation; and the care of wasted and severely wasted children when needed. Further, the
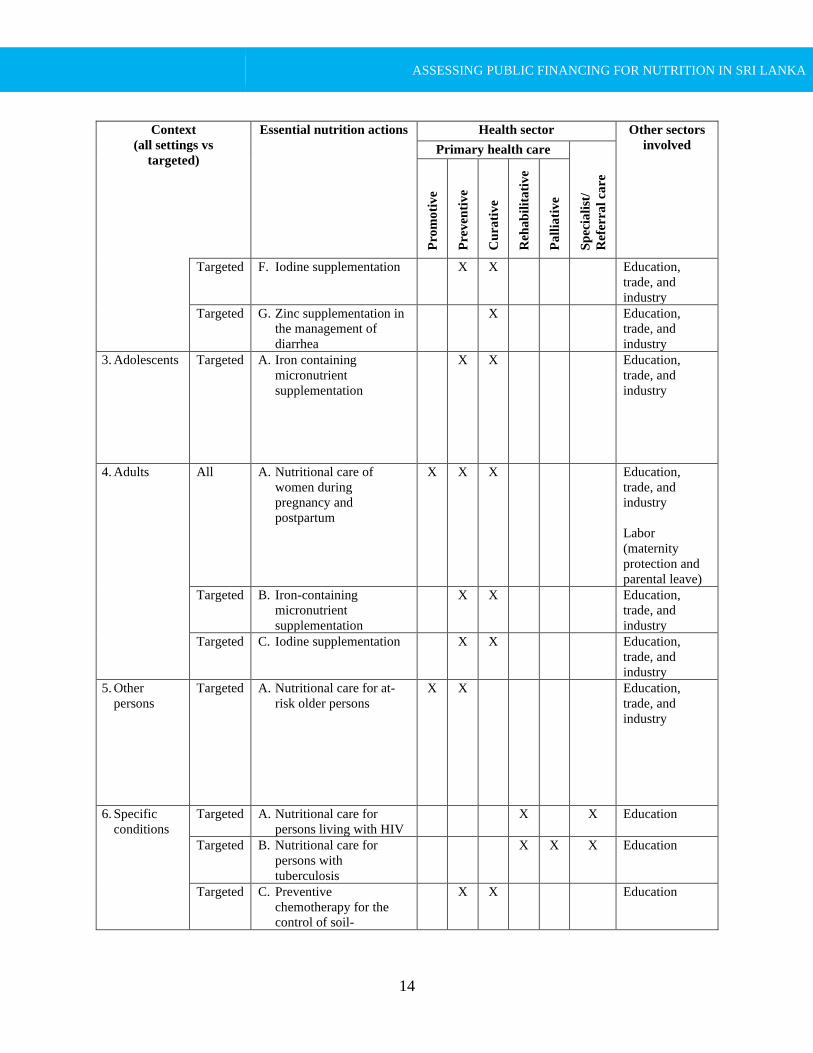
WHO and UNICEF recommend a series of evidence-based nutrition actions that are crucial in
maintaining good nutritional status of mothers and children throughout their life courses, including
during later childhood, adolescence, and pre-pregnancy (Figure 9). Details of the evidence of key
nutrition-specific interventions are provided in Annex 2.

ASSESSING PUBLIC FINANCING FOR NUTRITION IN SRI LANKA
13
Figure 9: Improving nutrition around the life course
Context
(all settings vs
targeted)
Essential nutrition actions Health sector Other sectors
involved Primary health care
Sp
ecia
list
/
Ref
err
al
ca
re
Pro
mo
tiv
e
Pre
ven
tiv
e
Cu
rati
ve
Reh
ab
ilit
ati
ve
Pa
llia
tiv
e
(a) Multisectoral interventions for healthier populations
All A. Healthy diet X X X X X Agriculture,
education,
trade, and
industry
All B. Fortifications of
condiments and staple
foods with vitamins and
minerals
X X X X X Education,
trade, and
industry
(b) Nutrition through the life course
1. Infants All
A. Optimal timing of
umbilical cord clamping
X
All B. Protecting, promoting,
and supporting
breastfeeding
X X Labor
(maternity
protection),
water,
sanitation, and
hygiene
(WASH)
Targeted C. Care of low-birth-weight
and very-low-birth-
weight infants
X
Targeted D. Assessment and
management of wasting
X X X X
Targeted E. Vitamin A
supplementation for
infants under 6 months
of age
X X
2. Children All A. Appropriate
complementary feeding
X X Education,
trade, and
industry
All B. Growth monitoring and
assessment
X X Education
Targeted C. Assessment and
management of wasting
X X X X Education,
trade, and
industry
Targeted D. Iron containing
micronutrient
supplementation
X X Education,
trade, and
industry
Targeted E. Vitamin A
supplementation
X X Education,
trade, and
industry
ASSESSING PUBLIC FINANCING FOR NUTRITION IN SRI LANKA
14
Context
(all settings vs
targeted)
Essential nutrition actions Health sector Other sectors
involved Primary health care
Sp
ecia
list
/
Ref
err
al
ca
re
Pro
mo
tiv
e
Pre
ven
tiv
e
Cu
rati
ve
Reh
ab
ilit
ati
ve
Pa
llia
tiv
e
Targeted F. Iodine supplementation X X Education,
trade, and
industry
Targeted G. Zinc supplementation in
the management of
diarrhea
X Education,
trade, and
industry
3. Adolescents Targeted A. Iron containing
micronutrient
supplementation
X X Education,
trade, and
industry
4. Adults All A. Nutritional care of
women during
pregnancy and
postpartum
X X X Education,
trade, and
industry
Labor
(maternity
protection and
parental leave)
Targeted B. Iron-containing
micronutrient
supplementation
X X Education,
trade, and
industry
Targeted C. Iodine supplementation X X Education,
trade, and
industry
5. Other
persons
Targeted A. Nutritional care for at-
risk older persons
X X Education,
trade, and
industry
6. Specific
conditions
Targeted A. Nutritional care for
persons living with HIV
X X Education
Targeted B. Nutritional care for
persons with
tuberculosis
X X X Education
Targeted C. Preventive
chemotherapy for the
control of soil-
X X Education

ASSESSING PUBLIC FINANCING FOR NUTRITION IN SRI LANKA
15
Context
(all settings vs
targeted)
Essential nutrition actions Health sector Other sectors
involved Primary health care
Sp
ecia
list
/
Ref
err
al
ca
re
Pro
mo
tiv
e
Pre
ven
tiv
e
Cu
rati
ve
Reh
ab
ilit
ati
ve
Pa
llia
tiv
e
transmitted helminth
infection (deworming)
Targeted D. Nutritional care for
persons with Ebola
Virus disease
X X X X Education
Targeted E. Nutritional care for
persons with viral
hemorrhagic disease
(including Ebola,
Marburg Lassa and
Crimean Congo
hemorrhagic fever)
X X X Education
Targeted F. Nutritional care for
infants in the context for
ZIKA virus transmission
X X X Education
Targeted G. Feeding of infants of
mothers who are carriers
of chronic hepatitis B
X X X Education
Targeted H. Feeding of infants in
settings with an ongoing
pandemic of influenza A
(H1N1) virus
transmission
X Education
Targeted I. Vitamin A
supplementation for
infants and children with
measles
X Education
(c) Nutrition in emergencies
All A. Infant and young child
feeding (IYCF) in
emergencies
X X All sectors
All B. Preventing and
controlling micronutrient
deficiencies in
emergencies
X X X All sectors
Source: WHO 2019.
Note: The interventions presented in the section are not exhaustive and other nutrition actions
through the life course can be adapted, as needed, to emergency settings.
ASSESSING PUBLIC FINANCING FOR NUTRITION IN SRI LANKA
16
3.3 Nutrition-sensitive interventions
Malnutrition is a multidimensional issue that goes beyond diet and disease and is a manifestation
of socioeconomic, biological, and behavioral issues. No single intervention implemented in
isolation will therefore be sufficient in reducing the burden of malnutrition. While nutrition-
specific interventions are needed, evidence suggests that they are not sufficient on their own for
rapidly reducing rates of undernutrition (Bhutta et al. 2008; Ruel, Alderman, and Maternal and
Child Nutrition Study Group 2013), and recent nutrition success stories typically point to nutrition-
sensitive sectors as being the main drivers of nutritional change (Headey and Hoddinott 2015),
pointing to the criticality of such interventions.
Nutrition-sensitive interventions or programs address underlying determinants of fetal and child
nutrition—income and food security; adequate caregiving resources/practices at the maternal,
household, and community levels; access to health services; and a safe and hygienic environment
(Alderman 2015). They are thus drawn from complementary sectors, such as agriculture, health,
social protection, early child development, education, and water and sanitation. By enhancing the
household and community environments in which children develop and grow, nutrition-sensitive
interventions are crucial to achieving accelerated results at scale, enhancing the effectiveness and
coverage of nutrition-specific interventions.
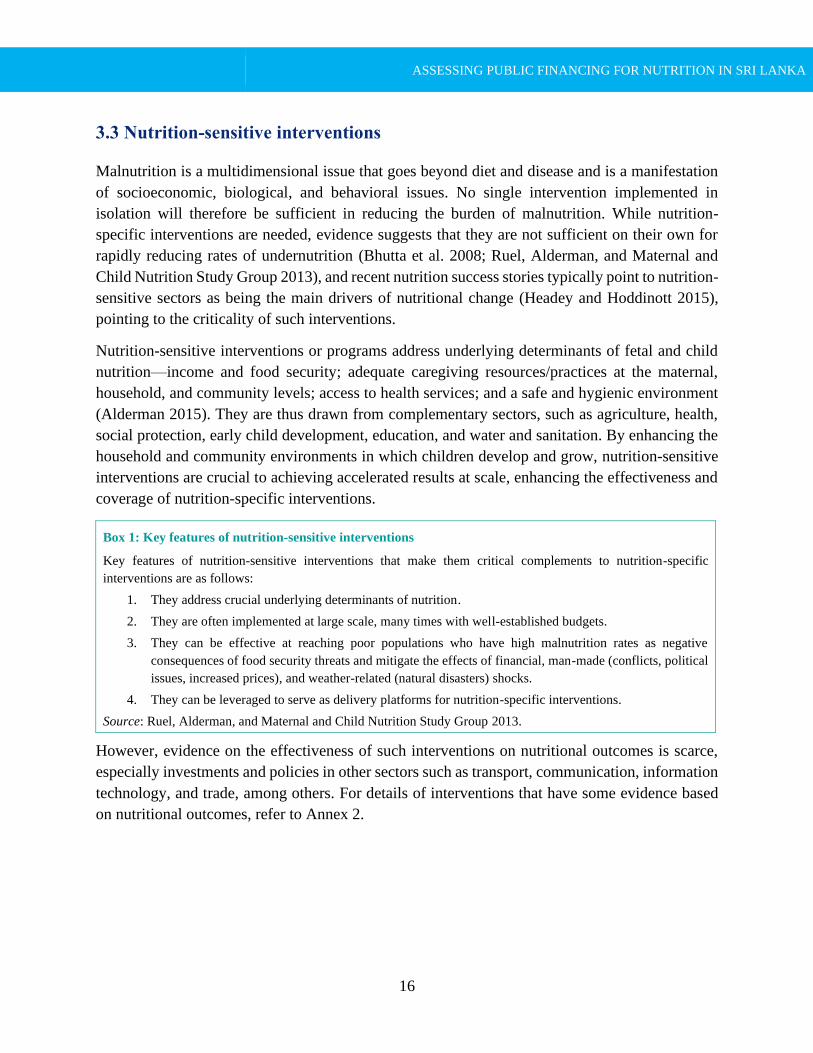
Box 1: Key features of nutrition-sensitive interventions
Key features of nutrition-sensitive interventions that make them critical complements to nutrition-specific
interventions are as follows:
1. They address crucial underlying determinants of nutrition.
2. They are often implemented at large scale, many times with well-established budgets.
3. They can be effective at reaching poor populations who have high malnutrition rates as negative
consequences of food security threats and mitigate the effects of financial, man-made (conflicts, political
issues, increased prices), and weather-related (natural disasters) shocks.
4. They can be leveraged to serve as delivery platforms for nutrition-specific interventions.
Source: Ruel, Alderman, and Maternal and Child Nutrition Study Group 2013.
However, evidence on the effectiveness of such interventions on nutritional outcomes is scarce,
especially investments and policies in other sectors such as transport, communication, information
technology, and trade, among others. For details of interventions that have some evidence based
on nutritional outcomes, refer to Annex 2.
ASSESSING PUBLIC FINANCING FOR NUTRITION IN SRI LANKA
17
3.4 Nutrition-related policies in Sri Lanka
3.4.1 National Nutrition Policy
Despite the efforts of the Government of Sri Lanka (GOSL) and other agencies to eliminate
malnutrition, optimum results cannot be achieved unless all interventions are implemented based
on a well-designed framework in a coordinated manner. Therefore, a solid nutrition policy is a
prerequisite that has to be developed based on the situation on the ground and responsibilities of
all relevant agencies. The first nutrition policy in Sri Lanka was developed in 1986 followed by
several revisions, but its value has diminished over years for several reasons: limited inter-sectoral
coordination, changes in government priorities, and the policies not having been updated along the
rapid socioeconomic and demographic changes.
Given the situation, the Ministry of Healthcare and Nutrition (current MoH) developed the
National Nutrition Policy (NNP) in 2010 (MoH 2010). Based on this document, a strategic plan
and action plans have subsequently been developed. The NNP was designed to be implemented
by the strategies and action plans while incorporating existing relevant policies. The NNP was
prepared assuming a strong inter-sectoral collaboration as the platform to improve nutritional
status of the population and hence include a wide range of sectors such as planning, health,
agriculture, fisheries, livestock, education, social services, and poverty alleviation, among others.
The NNP has six key objectives:
(a) To ensure optimal nutrition throughout the life cycle
(b) To enhance capacity to deliver effective and appropriate interventions
(c) To ensure effective management of adequate nutrition to vulnerable populations
(d) To ensure food and nutrition security for all citizens
(e) To strengthen research, monitoring, and evaluation
Accordingly, the NNP has focused its attention on optimum nutrition throughout the life cycle by
reducing the intergenerational transmission of malnutrition. The NNP has recognized the
importance of targeting nutritional interventions to underserved areas, the plantation community,
urban poor, and conflict-affected areas. Further, it has identified the necessity to promote
behavioral change among the people, enabling them to make appropriate food choices and care
practices. The NNP, which is in the process of revision for 2020–2030, reflects the malnutrition in
all stages of life, including presently neglected nutrition among elders. It is expected to place
greater emphasis on multisectoral coordination and partnership while increasing the coverage of
nutrition-specific interventions at the primary health care level.
ASSESSING PUBLIC FINANCING FOR NUTRITION IN SRI LANKA
18
3.4.2 Multi-sector Action Plan for Nutrition
In Sri Lanka, successive governments have taken several measures to enhance the nutrition
situation through a multisectoral approach. The first Multi-sector Action Plan for Nutrition
(MSAPN) 2013–2016 set the platform through multisector partnerships within the government,
cutting across sectors, for targeted action on the nutrition agenda to reduce malnutrition in the
country (GOSL 2013). The MSAPN was built upon existing interventions and operationalizes the
framework laid out in the NNP by enhancing the synergies between institutions—ministries,
provincial offices, and divisional secretariats together with development partners (DPs) toward a
common nutrition goal. This effort is aligned with the global SUN movement that strongly
advocates the adoption of a multisectoral approach. Building on the lessons learned from the
implementation of the first MSAPN 2013–2016, the second MSAPN 2018–2025 (in draft) further
aims to improve the multisectoral collaboration and coordination (GOSL 2019). Especially, the
MSAPN 2018–2025 aims to increase the momentum toward improving the nutritional status of
the population in line with the Sustainable Development Goals (SDGs) related to nutrition.
3.4.3 Maternal and Child Health Policy
In line with the WHO recommended actions, the Reproductive, Maternal, Newborn, Child,
Adolescent, and Youth Health (RMNCAYH) program is a collection of evidence-based
interventions implemented by the MoH to improve maternal and child health and nutrition. This
RMNCAYH program provides the most wide-spread community-based health care services
implemented through 354 Medical Officer of Health (MOH) areas. The Family Health Bureau
(FHB) is the central-level institution in the MoH that is responsible for planning, implementing,
monitoring, and evaluating the RMNCAYH program.
The RMNCAYH program encompasses interventions for preconception care; care during
pregnancy and lactation; services for children under five years, school children, and adolescents;
and women’s health. This broad package includes nutrition assessment (during antenatal care
[ANC] visits, child’s growth monitoring), provision of micronutrient supplements (iron, folic acid,
calcium, and vitamin C) during pregnancy and first six months of lactation, provision of
supplementary food Thriposha (throughout pregnancy, six months of lactation, and
undernourished children under five years of age), vitamin A supplementation, and deworming
treatment (children ages 18 months and above up to grade 10 at school with higher intensity in the
estate sector), and zinc supplementation for children with diarrhea. To combat anemia among
infants and young children, the multiple micronutrient (MMN) supplementation program has been
implemented island wide from 2017, based on a national compliance study conducted by the MRI
and UNICEF.
The target population of the RMNCAYH program, or ‘Eligible Family’, is defined as a family
with either a married (or living together) female ages between 15 and 49 years or having a child
ASSESSING PUBLIC FINANCING FOR NUTRITION IN SRI LANKA
19
under five years of age. Further, a family with a pregnant woman (irrespective of marital status
and age) and previously married women (widowed, divorced, separated) are also considered
Eligible Family. The Eligible Families are identified by public health midwives (PHMs) in
communities and are registered in the Eligible Family registers. Further, according to the
RMNCAYH eligibility criteria, it is estimated that 18.5 percent of the population is covered under
this program.
Many services of the integrated package are offered through MCH clinics from the time expectant
mothers are registered to the monitoring of the child up to five years of age. Nutrition education is
presently implemented mainly at MCH clinics and field weighing posts by the PHMs and during
their home visits. The health and nutrition education cover breastfeeding, complementary feeding,
and health promotion among children under five years of age and nutrition of other target groups
including pregnant women and school children. Further, special nutrition clinics have been
established in the field to implement targeted interventions to malnourished mothers and children.
District-level trainers were also trained on the new WHO growth standards and growth monitoring
and promotion and IYCF counseling.
3.5 Nutrition-specific interventions in Sri Lanka
3.5.1 Infant and young child feeding and care in the first two years of life
Breastfeeding promotion (including support for early initiation and exclusive breastfeeding) is
advocated following the 10 steps of the Baby Friendly Hospital Initiative. Capacity building on
breastfeeding for the health staff in maternal and child care was introduced in 1995 using the 40-
hour Breastfeeding Counselling Course. Exclusive breastfeeding rates have since improved, with
exclusive breastfeeding rate going up from 19 percent in 1993, 52 percent in 2000, and 76 percent
in 2006 to 82 percent in 2016 (DHS).
However, the DHS 2016 data revealed that while 93.4 percent of infants ages 0–1 months were
exclusively breastfed, only 87.2 percent of infants ages 2–3 months and 63.8 percent of infants
ages 4–5 months exclusively breastfed. The average duration of exclusive breastfeeding was 4.4
months. It is also interesting to note that within the 4–5 months age group, 7.7 percent of children
were given other milk and 12.5 percent of children were given plain water. This may indicate that
some mothers face difficulties and challenges in exclusively breastfeeding their infants for six
months.
Complementary feeding refers to the timely introduction of safe and nutrient-rich foods, in
addition to breastmilk, that are typically provided during 6–23 months of age. Age-appropriate
complementary foods, which is adequate in terms of frequency, density, and diversity for children
in the first two years of life, are promoted through the primary health care system and community
health workers. Complementary feeding practices are context specific and influenced by cultural,
ASSESSING PUBLIC FINANCING FOR NUTRITION IN SRI LANKA
20
geographic, social, economic, gender, and other family and community factors. A more in-depth
analysis of the practices and their driving factors is required.
3.5.2 Micronutrient supplementation programs for young children
The following micronutrient supplementation interventions are being implemented island wide:
Vitamin A high-dose supplementation
Vitamin A is an essential micronutrient that helps in maintaining healthy vision, growth, and
development of a child. The program has been designed for infants and children ages 6–59 months,
who are given a vitamin A mega dose every six months. Currently, the coverage of vitamin A
supplementation is 86.1 percent at 18 months and 92.9 percent at 3 years.5
MMN supplementation
Iron is an important micronutrient for a child’s brain development and for transportation of oxygen
to the body tissues. Globally, IDA is a major public health concern. In Sri Lanka, MMN is given
to children at the age of 6, 12, and 18 months on a daily basis for two consecutive months as a
means to prevent anemia.
Zinc supplementation
It is given for managing diarrhea along with oral rehydration solution (ORS) among children under
five years of age. According to the current MoH protocols, all children with diarrhea are given
zinc tablets for 10–14 days from the onset of diarrhea.
3.5.3 Treatment and management of infants and young children with severe or moderate
acute malnutrition (SAM/MAM)
Under the national growth monitoring program, all children under five years are periodically
measured at child welfare clinics, field weighing posts, and well-baby clinics in curative
establishments. According to MoH recommendations, the weight-for-age of children under two is
assessed monthly and thereafter once every three months up to the age of five years if the child is
growing normally. However, if a child is having any nutritional problems, irrespective of age,
monthly weighing is recommended. The length-for-age is measured at birth, 4, 9, and 18 months,
and for children with nutritional problems it is measured every two months up to two years of age.
The height-for-age is assessed every six months from two years of age up to five years, and for
children with nutritional problems, it is measured every three months from two to five years.
5 FHB. 2019. “Statistics.” https://fhb.health.gov.lk/index.php/en/statistics.

ASSESSING PUBLIC FINANCING FOR NUTRITION IN SRI LANKA
21
Children whose weight for age lies below -2SD receive locally produced fortified food
supplement, Thriposha, at the primary health care level. Although there are potential benefits of
Thriposha, it has not led to positive changes in the prevalence of acute malnutrition. This was
affirmed by a World Food Programme (WFP) technical mission in 2016 and 2017, which cited
several reasons for this, including sharing of the product at the household level, indicating a need
for effective and targeted social and behavior change communication, plus issues with supply
management.
The children with SAM receive BP 100, ready-to-use therapeutic food (RUTF) only after
confirmation of the diagnosis by a pediatrician at the district hospital level or above. At present,
the coverage of services is suboptimal as inpatient and outpatient care and treatment services are
currently available only at the district hospital level and above. Outpatient care for severe wasting
without medical complications has not been decentralized to the divisional hospitals in line with
other primary health care interventions that are provided at the lower levels of the district health
system.
However, service coverage is still limited because of low demand of services from the population,
lack of active case identification, and poor geographical access to services in some provinces.
Lastly, there are no data available on the performance of existing services to treat SAM/MAM (for
example, coverage and treatment outcomes), making it difficult to assess whether children are
being reached and successfully treated.
3.5.4 Women’s nutrition
In Sri Lanka, the interventions around women’s nutrition target the pre-pregnancy, pregnancy, and
postpartum periods as shown in Figure 10.
Figure 10: Mainstreaming maternal nutrition intervention across life cycle and delivery platforms
Source: FHB 2018.
ASSESSING PUBLIC FINANCING FOR NUTRITION IN SRI LANKA
22
Preconception nutrition
As part of a preventative approach, newly married couples are invited to a pre-pregnancy care
program when they first register their marriage. Preconception care is defined as a set of
interventions that aim to identify and modify biomedical, behavioral, and social risks to couples
before conception occurs, including education on achieving a healthy weight through diet and
exercise before becoming pregnant. Coverage for the initiative is currently at 50 percent across the
country, but it is being scaled up and there are plans to extend the program to include inter-
pregnancy counseling.
Nutritional care during pregnancy
The nutritional status of women at the time of conception and during pregnancy plays a vital role
in determining the health of the mother and for ensuring healthy fetal growth and development.
The maternal nutrition program is mainly run by the MoH, Sri Lanka, through ANC and postnatal
care (PNC) platforms. The coverage reached through these platforms are presented in Figure 11.
In addition, there is a cash allowance program for pregnant and lactating women run through a
social protection program by the Ministry of Women and Child Affairs (MWCA).
The maternal care package includes
1. Anthropometric assessment at the first visit through measuring height and weight and
calculating BMI, as well as monitoring weight gain during pregnancy;
2. Universal screening of pregnant women for blood sugar levels (part of the maternal care
package since 2014) as hyperglycemia in pregnancy (including both chronic diabetes and
gestational diabetes mellitus) is an emerging issue in Sri Lanka;
3. Screening for anemia, with full blood count and management of identified cases, including
referrals;
4. Micronutrient supplementation (iron, folic acid, calcium, vitamin C) for all pregnant
women and deworming for pregnant women (until 2018) when required (Mebendazole 100
mg twice a day for 3 days); and
5. Dietary supplementation for all pregnant and lactating women along with nutrition
counseling:
• Thriposha supplementation, two packets per month and
• Cash allowance to buy nutritious food—SL Rs 2,000 per month for 10 months.

ASSESSING PUBLIC FINANCING FOR NUTRITION IN SRI LANKA
23
Figure 11: Coverage of maternal nutrition intervention package through ANC Platforms
Source: FHB 2019. https://fhb.health.gov.lk/index.php/en/statistics.
During the postpartum period, micronutrient and food supplementation continues for six months
after delivery, together with appropriate nutrition counseling. Home visits by the public health
staff, postnatal clinics, and family planning clinics are used to deliver nutritional services for
women after delivery and Well Woman Clinics later on.
High coverage of ANC and PNC interventions to all pregnant women, starting in early pregnancy,
reduced the levels of anemia and undernutrition over the last decades. Nearly four in five pregnant
mothers are registered for ANC before 8 weeks of pregnancy and more than 95 percent are
registered before 12 weeks. In 2018, the average number of field clinic visits was 6.5 per pregnant
woman. However, with a shift in the epidemiological situation and increasing levels of maternal
overweight and obesity, the existing food supplementation programs, which target all pregnant
and lactating women, pose a critical question around the efficiency of blanket supplementation.
Currently, Thriposha supplementation and cash allowance program for pregnant and lactating
women (for essential food commodities) account for 60 percent of the budget for nutrition-specific
interventions. According to the National Nutrition and Micronutrient Survey of Pregnant Women
in Sri Lanka (MRI 2013), 91 percent of pregnant mothers had received Thriposha, but only 11
percent of them had consumed it as prescribed. To improve the cost efficiency and cost-
effectiveness of the Thriposha program, there is a need to reconsider the targeting of food
supplementation.
3.5.5 School health program
Health of school children can play a major role in determining the successful development of a
nation. Schools serve as an ideal setting to positively affect children's health because they reach
young people at a critical stage of development. To activate a school to achieve its potential to
improve health, it is essential for the community to understand the importance and feasibility of
improving health through schools. Several school health interventions are implemented in Sri
91.9
95.8
79.8
0 10 20 30 40 50 60 70 80 90 100
Percentage of pregnant women visited at least once at
home by Public Health Midwife (PHM)
Percentage of pregnant mothers attending clinics at
least once during pregnancy
Percentage of pregnant mothers registered before 8
weeks of gestation
Antenatal care
ASSESSING PUBLIC FINANCING FOR NUTRITION IN SRI LANKA
24
Lanka to enhance the health and nutritional status of school children such as school medical
inspection and follow-up, immunization, weekly iron folate supplementation, and so on.
3.5.6 School meal program
In Sri Lanka, there have been three modalities for school meal programs. The first one is the
government cash-based catering modality and the second is the school milk modality. Combined,
these target more than 1.1 million school students island wide and they are fully funded by the
government. The budget allocation for these programs has been steadily increasing each year and
currently stands at approximately US$6 billion per year. The third modality is the in-kind school
meal program, which was implemented by the WFP in the Northern Province until December
2017. However, the availability of unhealthy food in school canteens is a constraint for nutrition
among school children in spite of availability of school canteen guidelines. Proper monitoring of
school canteens with a regulatory mechanism is needed to improve this situation.
3.5.7 Preschool meal program
Following the same concept, Sri Lanka’s preschool meal programs are also considered as nutrition-
specific interventions. At present, there are two preschool meal programs: preschool meal program
administered by the MWCA and ‘Tikiri Shakthi’, a high protein nutrient bar for the plantation
sector children ages 3–5 years, administered by the Ministry of Hill Country New Villages,
Infrastructure, and Community Development (MHC).
3.6 Nutrition-sensitive interventions in Sri Lanka
A multisectoral approach that combines nutrition-specific and nutrition-sensitive interventions is
vital for a holistic and sustainable approach to address malnutrition. Nutrition sensitive-
interventions include actions from a range of sectors such as health, agriculture and food systems,
WASH, education, and social protection.
3.6.1 Agriculture sector food security interventions
Historically, Sri Lanka has been self-sufficient and has been regarded as the ‘Granary in the East’
due to the abundant food the country produced and exported. Sri Lanka has traditionally been an
agriculture/farming-oriented society, although agriculture contributes to only about 8 percent of
the national GDP today (CBSL 2019). Rice is the staple food and rice cultivation/farming is the
most important economic activity for the majority of the population in rural areas. During recent
years, the paddy sector has grown rapidly due to the extended cultivation of land areas and
improved productivity due to the adoption of modern technologies. The modernization of farming,
such as the use of high-yielding seeds, new machineries and equipment, and chemical fertilizers,
has led to the increased production of rice.
ASSESSING PUBLIC FINANCING FOR NUTRITION IN SRI LANKA
25
Food Crop Production and Improvement Program
The main objectives of the Food Crop Production and Improvement Program are to make Sri
Lanka self-sufficient in rice production and enhance production and productivity of vegetables and
fruits through improved agricultural methods; water management system; pest control; and use of
fertilizer, equipment, and technology. Strategies to enhance production of several crops at a mass
scale include the following: (a) adopt novel technologies, (b) mechanize to raise productivity, (c)
expand national productions and decrease import, (d) increase the efficiency of fertilizer by new
technologies, (e) extend cultivation areas, (f) maintain production availability during nonseasonal
period, and (g) increase high-quality seeds and self-generated seed production.
Home Gardening Promotion
The Home Gardening Promotion aims to make Sri Lanka a self-sufficient nation while fulfilling
the family’s food and nutritional requirements. To attract communities to home gardening, the
government has sponsored providing a few fruit plants without any costs to families, introducing
related training programs, and providing home garden development handbooks.
Fertilizer subsidy
One of the largest subsidy programs provided by the GOSL is for fertilizer, which aims to provide
farmers with adequate fertilizer at reduced costs, especially for rice production. Around 1.5 million
farmers benefit from this program. With the current policy the subsidized price of a 50 kg bag of
fertilizer used for cultivating paddy fields has been fixed at SL Rs 500, regardless of the global
market price.
Food Production National Program
The Food Production National Program (FPNP) was introduced in 2015 to develop the Sri Lankan
economy through promoting agriculture and a healthy diet among the population. To achieve the
goal of the program, several ministries including the Ministry of Agriculture (MoA), Ministry of
Rural Economy, Ministry of Fisheries and Aquatic Resources Development (MFARD), and
Ministry of Plantation Industries had been collaborating with several other authorities. There were
multiple objectives: (a) make the country self-sufficient in traditional local foods and thereby save
the sum of food imports; (b) ensure availability of high-quality food items through adopting
environment friendly food production methods while minimizing the use of chemicals fertilizer
and pesticides; (c) ensure food security by proper management of available food stocks; (d)
introduce a crop production program based on agro-ecological zones; (e) increase productivity by
promoting suitable methodologies in food crop production; (f) maintain proper coordination with
all the institutions involved in local food production and joining the program with the normal daily
routine of school community, civil society, and general public; (g) provide high-quality inputs in
food production and create formal procedures for their production; and (h) build a healthy nation.
ASSESSING PUBLIC FINANCING FOR NUTRITION IN SRI LANKA
26
3.6.2 Fisheries sector programs
Fish is the most important source of animal protein consumed in Sri Lanka. Fish provides more
than 60 percent of animal protein requirement of the country and is the cheapest source of protein
(MFARD 2016). Domestic marine and fresh water fish products are critical in improving the food
security of the country. Marine fish production accounts for around 85 percent of the total fish
production in the country and the rest from inland and aquaculture. There are 15 fishery districts
in the country. However, Sri Lanka imports fish and fishery products to cater for the excess
demand. To facilitate effective distribution of fish without decreasing its nutritional value, retail
outlets of the Ceylon Fisheries Corporation (CFC) have been established island wide, and new
outlets are proposed to be established in 20 more cities. The CFC operates as a public-private joint
venture, aiming to provide its services efficiently through digitization of its financial and sales
divisions. Awareness-raising programs for fishers are ongoing to minimize post-harvest losses and
to improve facilities for ice production and cold rooms and supply of clean water for harbors and
anchorages. Canned fish, which enables storing of fish, also contributes immensely to the per
capita fish consumption. The GOSL is now producing canned fish domestically with support from
the private sector.
3.6.3 Livestock sector programs
Livestock sector is also playing a vital role in the local economy to enhance food security. The
Livestock Development Division under the Department of Animal Production and Health (DAPH)
implements various programs and projects with the aim of meeting the increasing demand through
healthy and quality animal products. At present, around 1 million families are engaged in dairy,
goat, poultry, and swine farming, the majority of whom represent the rural sector.
3.6.4 Food security cash assistance programs
In Sri Lanka, the need to protect the most vulnerable population has been well recognized and
successive governments have been supporting the poor through food subsidization and income
supplementation programs. In 1978, the ‘Food Stamp’ scheme was introduced to low-income
groups, a cash subsidy in the form of food stamps to procure a basket of nutritious food
commodities (rice, flour/cereal, sugar, infant milk foods, dried fish, and pulses). In 1989, the food
stamp scheme was replaced by the national poverty alleviation program ‘Janasaviya’. In 1995,
after the change of government, the Janasaviya program was amended as the ‘Samurdhi’ program.
Further, a nutrition food package for pregnant mothers was introduced in 2006 with the aim of
enhancing the nutritional status of pregnant and lactating mothers of low-income families. The
eligible criteria included those registered in an MOH living in a Samurdhi beneficiary family.
Under this program, the beneficiary received a nutrition relief card to obtain a ‘Nutrition Food
Package’ worth of SL Rs 500 for 20 months. In 2015, when the new government took office, the
ASSESSING PUBLIC FINANCING FOR NUTRITION IN SRI LANKA
27
program was expanded to a universal program where all MOH-registered pregnant mothers
became entitled for the food allowance. Benefits were also increased to SL Rs 2,000 per month for
10 months, amounting to a total of SL Rs 20,000 per beneficiary.
3.6.5 Water and sanitation programs
The Ministry of City Planning, Water Supply, and Higher Education (MCPWS) administers access
to safe drinking water and ensures sanitation facilities island wide. The GOSL has taken several
measures to improve the capacity, quality, and distribution of water supply and sanitation facilities.
At present, 90.6 percent of the population has access to safe drinking water and safe piped water
coverage is 50.5 percent (MCPWS 2018). The National Water Supply and Drainage Board
(NWSDB) and the Department of National Community Water Supply (DNCWS) play key roles
in launching projects and programs in the urban and rural areas, respectively.
There are large-scale projects, such as the Water Supply and Sanitation Improvement Project
(WASSIP) 2016–2020 implemented with support from the World Bank in seven districts around
the country and the Asian Development Bank (ADB) Dry Zone Urban Water and Sanitation
Project. Also, there are special programs implemented that aim to prevent chronic kidney diseases
of unknown etiology (CKDu).

ASSESSING PUBLIC FINANCING FOR NUTRITION IN SRI LANKA
28
4. METHODS FOR THE ASSESSMENT
This study largely followed the three-step approach that has been proposed by the SUN movement
and used in multiple countries (Fracassi et al. 2017). The ‘three steps’ of the SUN approach are (a)
identification of budget line items, (b) categorization of budget line items, and (c) weighting of
budget line items (optional) (Fracassi et al. 2017). The following sections provide details of the
approaches that this study has employed.
4.1 Step 1: Identification
4.1.1 Desk review and search to identify nutrition programs and interventions
Following the SUN approach, we first reviewed various government documents to identify
nutrition programs and interventions that have been implemented in recent years. We initiated this
process by searching the reports from the Ministry of Finance (MoF) using key words
recommended by the SUN approach (Fracassi et al. 2017). While this approach yielded some
information, it has soon become apparent that the line items were largely input based and provided
little to no information on program and activity-wise budget allocation and expenditure that was
needed for this exercise. We then shifted the approach to review key nutrition-related documents
including the NNP 2010, MSAPN Vision 2016, MSAPN 2018–2025 (in draft), and National
Strategic Review of Food Security and Nutrition: Towards Zero Hunger (WFP 2017). This strategy
provided the necessary information, and all programs and interventions that were covered in those
documents were extracted and listed, which formed the basis of the exercise.
4.1.2 Consultation with government stakeholders through working group
Although we obtained a reasonable list of nutrition programs and interventions from the desk
review, there was a critical drawback that little to no information on budget or expenditure was
obtained from the available documents at the granularity required for the analysis. This implied
that we needed to obtain the budget allocation and expenditure data from each ministry,
department, and province manually. To obtain support from the government and facilitate this
process, a working group was formed comprising key ministries and government agencies. We
identified the key ministries and relevant departments from the list of programs developed through
desk review that are summarized in Table 1.
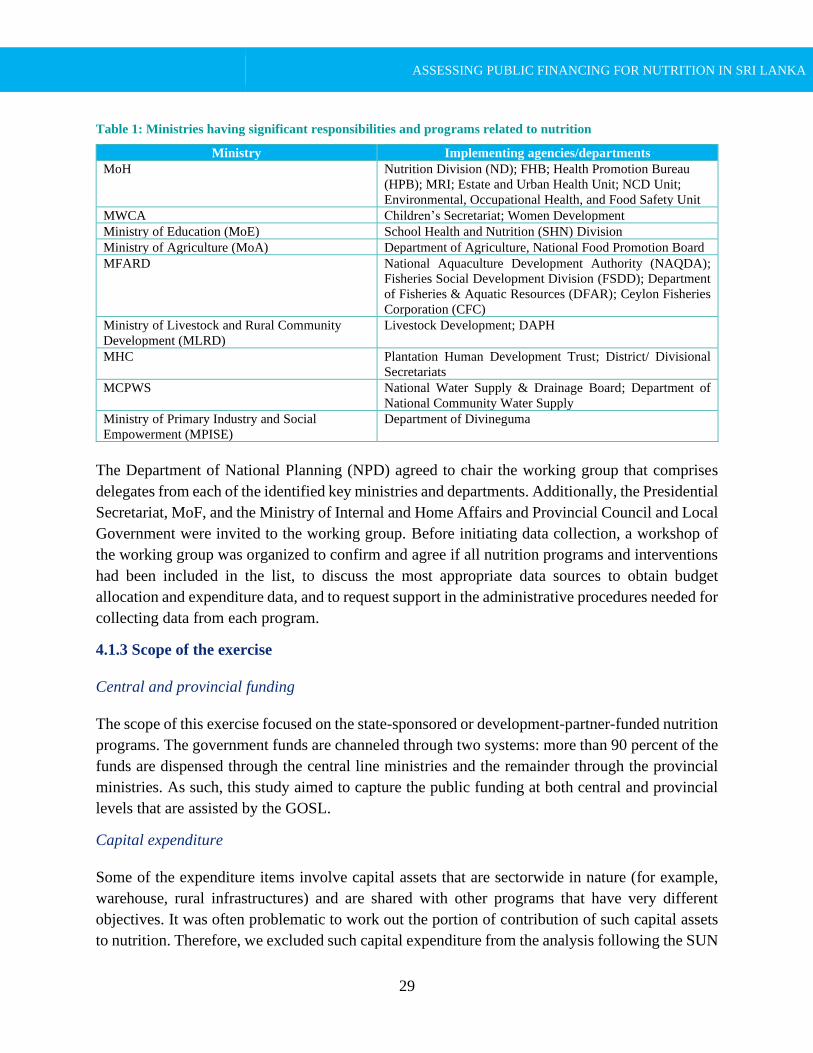
ASSESSING PUBLIC FINANCING FOR NUTRITION IN SRI LANKA
29
Table 1: Ministries having significant responsibilities and programs related to nutrition
Ministry Implementing agencies/departments
MoH Nutrition Division (ND); FHB; Health Promotion Bureau
(HPB); MRI; Estate and Urban Health Unit; NCD Unit;
Environmental, Occupational Health, and Food Safety Unit
MWCA Children’s Secretariat; Women Development
Ministry of Education (MoE) School Health and Nutrition (SHN) Division
Ministry of Agriculture (MoA) Department of Agriculture, National Food Promotion Board
MFARD National Aquaculture Development Authority (NAQDA);
Fisheries Social Development Division (FSDD); Department
of Fisheries & Aquatic Resources (DFAR); Ceylon Fisheries
Corporation (CFC)
Ministry of Livestock and Rural Community
Development (MLRD)
Livestock Development; DAPH
MHC Plantation Human Development Trust; District/ Divisional
Secretariats
MCPWS National Water Supply & Drainage Board; Department of
National Community Water Supply
Ministry of Primary Industry and Social
Empowerment (MPISE)
Department of Divineguma
The Department of National Planning (NPD) agreed to chair the working group that comprises
delegates from each of the identified key ministries and departments. Additionally, the Presidential
Secretariat, MoF, and the Ministry of Internal and Home Affairs and Provincial Council and Local
Government were invited to the working group. Before initiating data collection, a workshop of
the working group was organized to confirm and agree if all nutrition programs and interventions
had been included in the list, to discuss the most appropriate data sources to obtain budget
allocation and expenditure data, and to request support in the administrative procedures needed for
collecting data from each program.
4.1.3 Scope of the exercise
Central and provincial funding
The scope of this exercise focused on the state-sponsored or development-partner-funded nutrition
programs. The government funds are channeled through two systems: more than 90 percent of the
funds are dispensed through the central line ministries and the remainder through the provincial
ministries. As such, this study aimed to capture the public funding at both central and provincial
levels that are assisted by the GOSL.
Capital expenditure
Some of the expenditure items involve capital assets that are sectorwide in nature (for example,
warehouse, rural infrastructures) and are shared with other programs that have very different
objectives. It was often problematic to work out the portion of contribution of such capital assets
to nutrition. Therefore, we excluded such capital expenditure from the analysis following the SUN
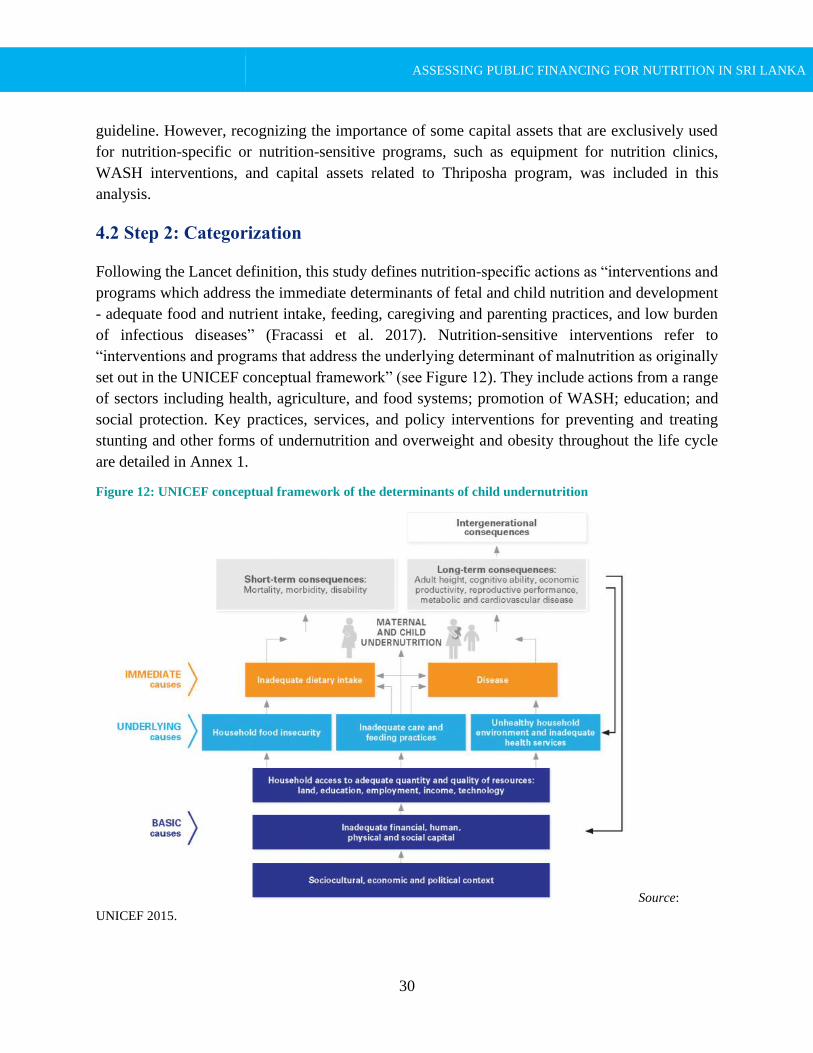
ASSESSING PUBLIC FINANCING FOR NUTRITION IN SRI LANKA
30
guideline. However, recognizing the importance of some capital assets that are exclusively used
for nutrition-specific or nutrition-sensitive programs, such as equipment for nutrition clinics,
WASH interventions, and capital assets related to Thriposha program, was included in this
analysis.
4.2 Step 2: Categorization
Following the Lancet definition, this study defines nutrition-specific actions as “interventions and
programs which address the immediate determinants of fetal and child nutrition and development
- adequate food and nutrient intake, feeding, caregiving and parenting practices, and low burden
of infectious diseases” (Fracassi et al. 2017). Nutrition-sensitive interventions refer to
“interventions and programs that address the underlying determinant of malnutrition as originally
set out in the UNICEF conceptual framework” (see Figure 12). They include actions from a range
of sectors including health, agriculture, and food systems; promotion of WASH; education; and
social protection. Key practices, services, and policy interventions for preventing and treating
stunting and other forms of undernutrition and overweight and obesity throughout the life cycle
are detailed in Annex 1.
Figure 12: UNICEF conceptual framework of the determinants of child undernutrition
Source:
UNICEF 2015.
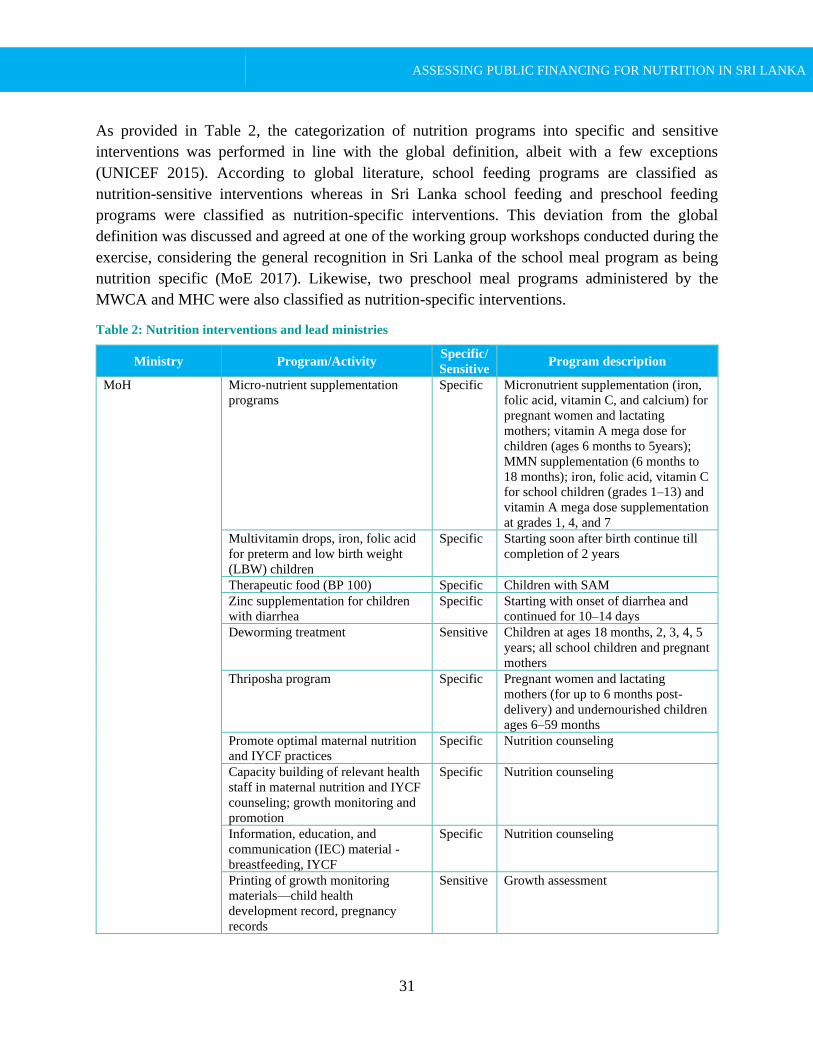
ASSESSING PUBLIC FINANCING FOR NUTRITION IN SRI LANKA
31
As provided in Table 2, the categorization of nutrition programs into specific and sensitive
interventions was performed in line with the global definition, albeit with a few exceptions
(UNICEF 2015). According to global literature, school feeding programs are classified as
nutrition-sensitive interventions whereas in Sri Lanka school feeding and preschool feeding
programs were classified as nutrition-specific interventions. This deviation from the global
definition was discussed and agreed at one of the working group workshops conducted during the
exercise, considering the general recognition in Sri Lanka of the school meal program as being
nutrition specific (MoE 2017). Likewise, two preschool meal programs administered by the
MWCA and MHC were also classified as nutrition-specific interventions.
Table 2: Nutrition interventions and lead ministries
Ministry Program/Activity Specific/
Sensitive Program description
MoH Micro-nutrient supplementation
programs
Specific Micronutrient supplementation (iron,
folic acid, vitamin C, and calcium) for
pregnant women and lactating
mothers; vitamin A mega dose for
children (ages 6 months to 5years);
MMN supplementation (6 months to
18 months); iron, folic acid, vitamin C
for school children (grades 1–13) and
vitamin A mega dose supplementation
at grades 1, 4, and 7
Multivitamin drops, iron, folic acid
for preterm and low birth weight
(LBW) children
Specific Starting soon after birth continue till
completion of 2 years
Therapeutic food (BP 100) Specific Children with SAM
Zinc supplementation for children
with diarrhea
Specific Starting with onset of diarrhea and
continued for 10–14 days
Deworming treatment Sensitive Children at ages 18 months, 2, 3, 4, 5
years; all school children and pregnant
mothers
Thriposha program Specific Pregnant women and lactating
mothers (for up to 6 months post-
delivery) and undernourished children
ages 6–59 months
Promote optimal maternal nutrition
and IYCF practices
Specific Nutrition counseling
Capacity building of relevant health
staff in maternal nutrition and IYCF
counseling; growth monitoring and
promotion
Specific Nutrition counseling
Information, education, and
communication (IEC) material -
breastfeeding, IYCF
Specific Nutrition counseling
Printing of growth monitoring
materials—child health
development record, pregnancy
records
Sensitive Growth assessment
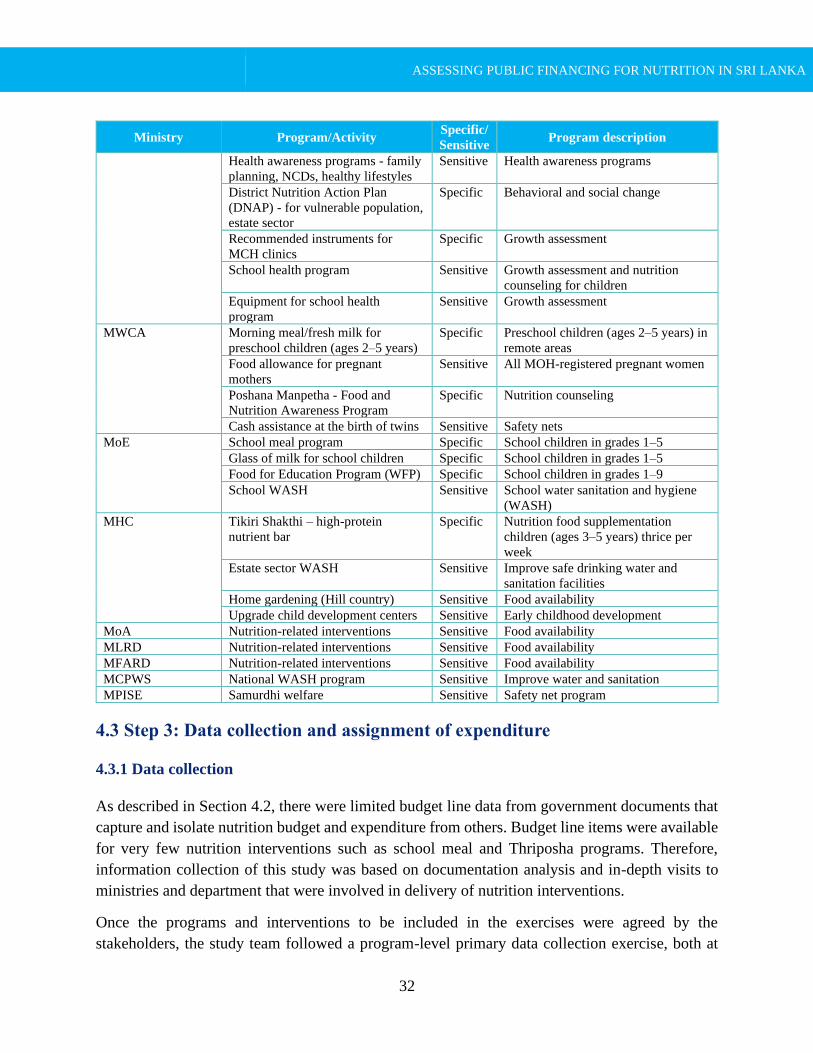
ASSESSING PUBLIC FINANCING FOR NUTRITION IN SRI LANKA
32
Ministry Program/Activity Specific/
Sensitive Program description
Health awareness programs - family
planning, NCDs, healthy lifestyles
Sensitive Health awareness programs
District Nutrition Action Plan
(DNAP) - for vulnerable population,
estate sector
Specific Behavioral and social change
Recommended instruments for
MCH clinics
Specific Growth assessment
School health program Sensitive Growth assessment and nutrition
counseling for children
Equipment for school health
program
Sensitive Growth assessment
MWCA Morning meal/fresh milk for
preschool children (ages 2–5 years)
Specific Preschool children (ages 2–5 years) in
remote areas
Food allowance for pregnant
mothers
Sensitive All MOH-registered pregnant women
Poshana Manpetha - Food and
Nutrition Awareness Program
Specific Nutrition counseling
Cash assistance at the birth of twins Sensitive Safety nets
MoE School meal program Specific School children in grades 1–5
Glass of milk for school children Specific School children in grades 1–5
Food for Education Program (WFP) Specific School children in grades 1–9
School WASH Sensitive School water sanitation and hygiene
(WASH)
MHC Tikiri Shakthi – high-protein
nutrient bar
Specific Nutrition food supplementation
children (ages 3–5 years) thrice per
week
Estate sector WASH Sensitive Improve safe drinking water and
sanitation facilities
Home gardening (Hill country) Sensitive Food availability
Upgrade child development centers Sensitive Early childhood development
MoA Nutrition-related interventions Sensitive Food availability
MLRD Nutrition-related interventions Sensitive Food availability
MFARD Nutrition-related interventions Sensitive Food availability
MCPWS National WASH program Sensitive Improve water and sanitation
MPISE Samurdhi welfare Sensitive Safety net program
4.3 Step 3: Data collection and assignment of expenditure
4.3.1 Data collection
As described in Section 4.2, there were limited budget line data from government documents that
capture and isolate nutrition budget and expenditure from others. Budget line items were available
for very few nutrition interventions such as school meal and Thriposha programs. Therefore,
information collection of this study was based on documentation analysis and in-depth visits to
ministries and department that were involved in delivery of nutrition interventions.
Once the programs and interventions to be included in the exercises were agreed by the
stakeholders, the study team followed a program-level primary data collection exercise, both at
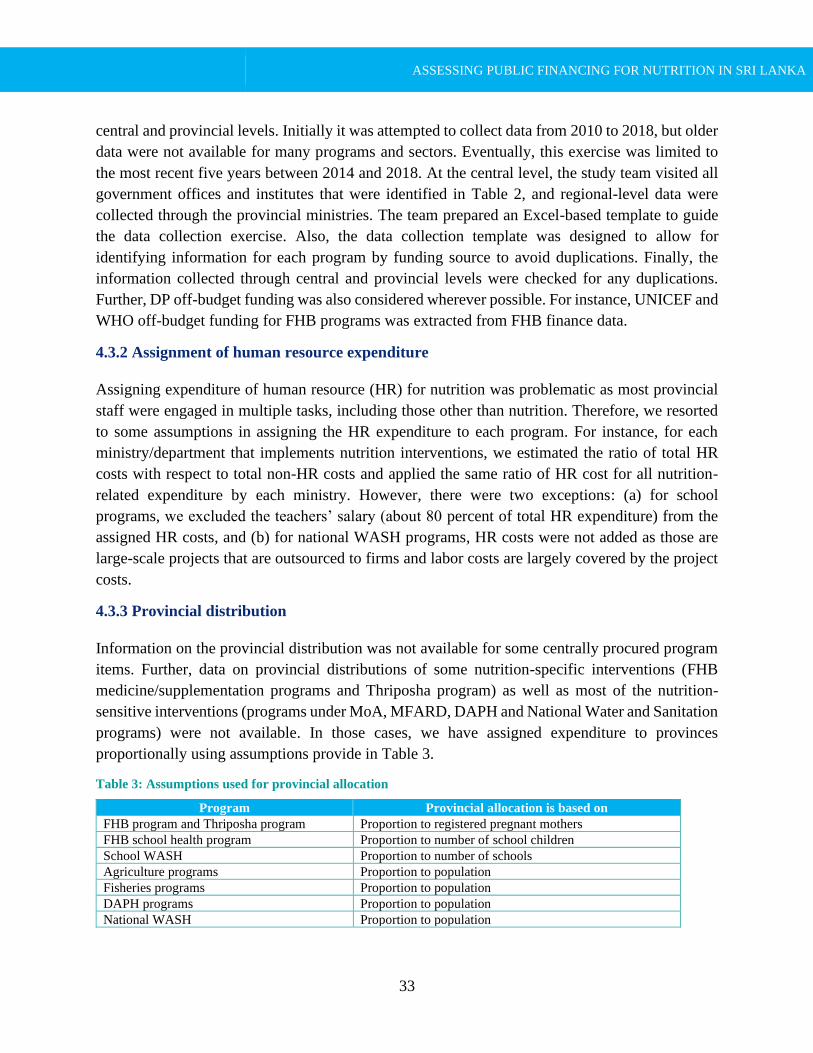
ASSESSING PUBLIC FINANCING FOR NUTRITION IN SRI LANKA
33
central and provincial levels. Initially it was attempted to collect data from 2010 to 2018, but older
data were not available for many programs and sectors. Eventually, this exercise was limited to
the most recent five years between 2014 and 2018. At the central level, the study team visited all
government offices and institutes that were identified in Table 2, and regional-level data were
collected through the provincial ministries. The team prepared an Excel-based template to guide
the data collection exercise. Also, the data collection template was designed to allow for
identifying information for each program by funding source to avoid duplications. Finally, the
information collected through central and provincial levels were checked for any duplications.
Further, DP off-budget funding was also considered wherever possible. For instance, UNICEF and
WHO off-budget funding for FHB programs was extracted from FHB finance data.
4.3.2 Assignment of human resource expenditure
Assigning expenditure of human resource (HR) for nutrition was problematic as most provincial
staff were engaged in multiple tasks, including those other than nutrition. Therefore, we resorted
to some assumptions in assigning the HR expenditure to each program. For instance, for each
ministry/department that implements nutrition interventions, we estimated the ratio of total HR
costs with respect to total non-HR costs and applied the same ratio of HR cost for all nutrition-
related expenditure by each ministry. However, there were two exceptions: (a) for school
programs, we excluded the teachers’ salary (about 80 percent of total HR expenditure) from the
assigned HR costs, and (b) for national WASH programs, HR costs were not added as those are
large-scale projects that are outsourced to firms and labor costs are largely covered by the project
costs.
4.3.3 Provincial distribution
Information on the provincial distribution was not available for some centrally procured program
items. Further, data on provincial distributions of some nutrition-specific interventions (FHB
medicine/supplementation programs and Thriposha program) as well as most of the nutrition-
sensitive interventions (programs under MoA, MFARD, DAPH and National Water and Sanitation
programs) were not available. In those cases, we have assigned expenditure to provinces
proportionally using assumptions provide in Table 3.
Table 3: Assumptions used for provincial allocation
Program Provincial allocation is based on
FHB program and Thriposha program Proportion to registered pregnant mothers
FHB school health program Proportion to number of school children
School WASH Proportion to number of schools
Agriculture programs Proportion to population
Fisheries programs Proportion to population
DAPH programs Proportion to population
National WASH Proportion to population
ASSESSING PUBLIC FINANCING FOR NUTRITION IN SRI LANKA
34
4.3.4 Weighting
We did not attempt to weight the nutrition-sensitive programs. In the SUN guideline, weighting is
suggested as optional. The assignment of weights largely relies on expert opinions or rudimentary
assumptions, which are highly prone to subjectivity. Although we clearly acknowledge the value
of weights for nutrition-sensitive interventions, a robust scientific method is yet to be developed
to derive the weights. For this reason, we did not assign weights for the sensitive interventions.
Therefore, the findings of the investments in nutrition-sensitive interventions must be interpreted
accordingly with cautions.
4.3.5 Inflation adjustment
For this study, we adjusted for inflation by using a GDP deflator. Accordingly, unless otherwise
mentioned hereafter, figures are presented in constant market prices with base year 2018.
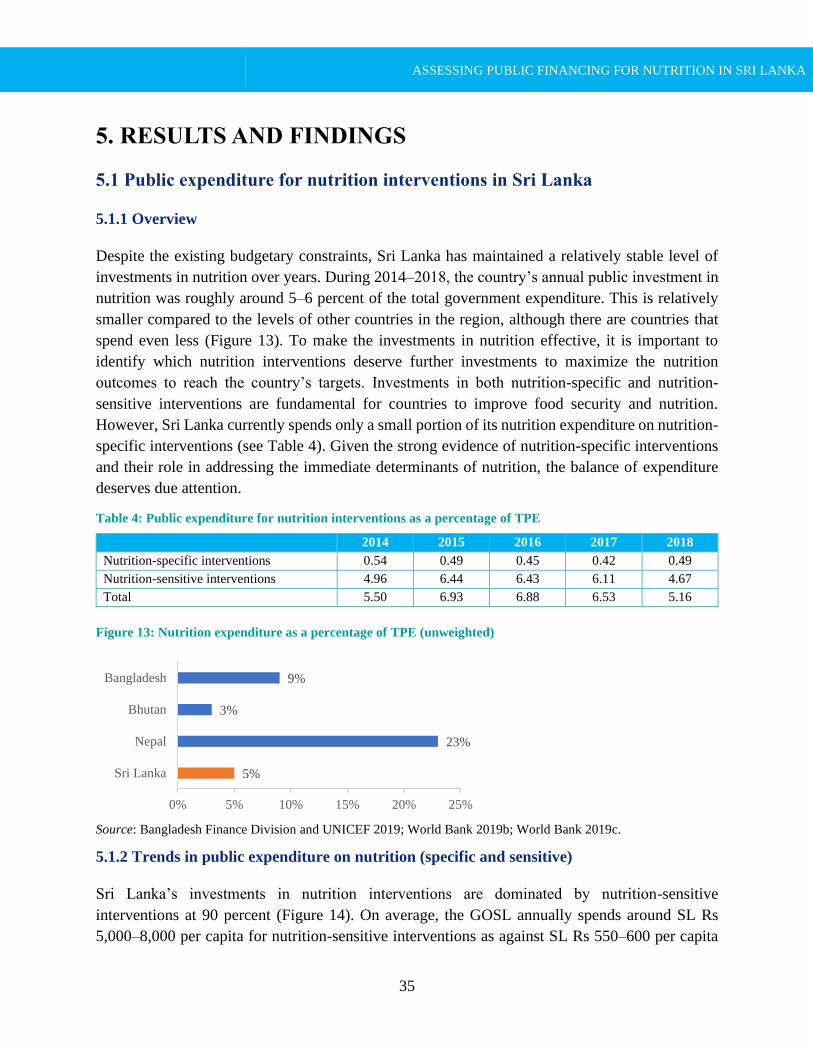
ASSESSING PUBLIC FINANCING FOR NUTRITION IN SRI LANKA
35
5. RESULTS AND FINDINGS
5.1 Public expenditure for nutrition interventions in Sri Lanka
5.1.1 Overview
Despite the existing budgetary constraints, Sri Lanka has maintained a relatively stable level of
investments in nutrition over years. During 2014–2018, the country’s annual public investment in
nutrition was roughly around 5–6 percent of the total government expenditure. This is relatively
smaller compared to the levels of other countries in the region, although there are countries that
spend even less (Figure 13). To make the investments in nutrition effective, it is important to
identify which nutrition interventions deserve further investments to maximize the nutrition
outcomes to reach the country’s targets. Investments in both nutrition-specific and nutrition-
sensitive interventions are fundamental for countries to improve food security and nutrition.
However, Sri Lanka currently spends only a small portion of its nutrition expenditure on nutrition-
specific interventions (see Table 4). Given the strong evidence of nutrition-specific interventions
and their role in addressing the immediate determinants of nutrition, the balance of expenditure
deserves due attention.
Table 4: Public expenditure for nutrition interventions as a percentage of TPE
2014 2015 2016 2017 2018
Nutrition-specific interventions 0.54 0.49 0.45 0.42 0.49
Nutrition-sensitive interventions 4.96 6.44 6.43 6.11 4.67
Total 5.50 6.93 6.88 6.53 5.16
Figure 13: Nutrition expenditure as a percentage of TPE (unweighted)
Source: Bangladesh Finance Division and UNICEF 2019; World Bank 2019b; World Bank 2019c.
5.1.2 Trends in public expenditure on nutrition (specific and sensitive)
Sri Lanka’s investments in nutrition interventions are dominated by nutrition-sensitive
interventions at 90 percent (Figure 14). On average, the GOSL annually spends around SL Rs
5,000–8,000 per capita for nutrition-sensitive interventions as against SL Rs 550–600 per capita
5%
23%
3%
9%
0% 5% 10% 15% 20% 25%
Sri Lanka
Nepal
Bhutan
Bangladesh
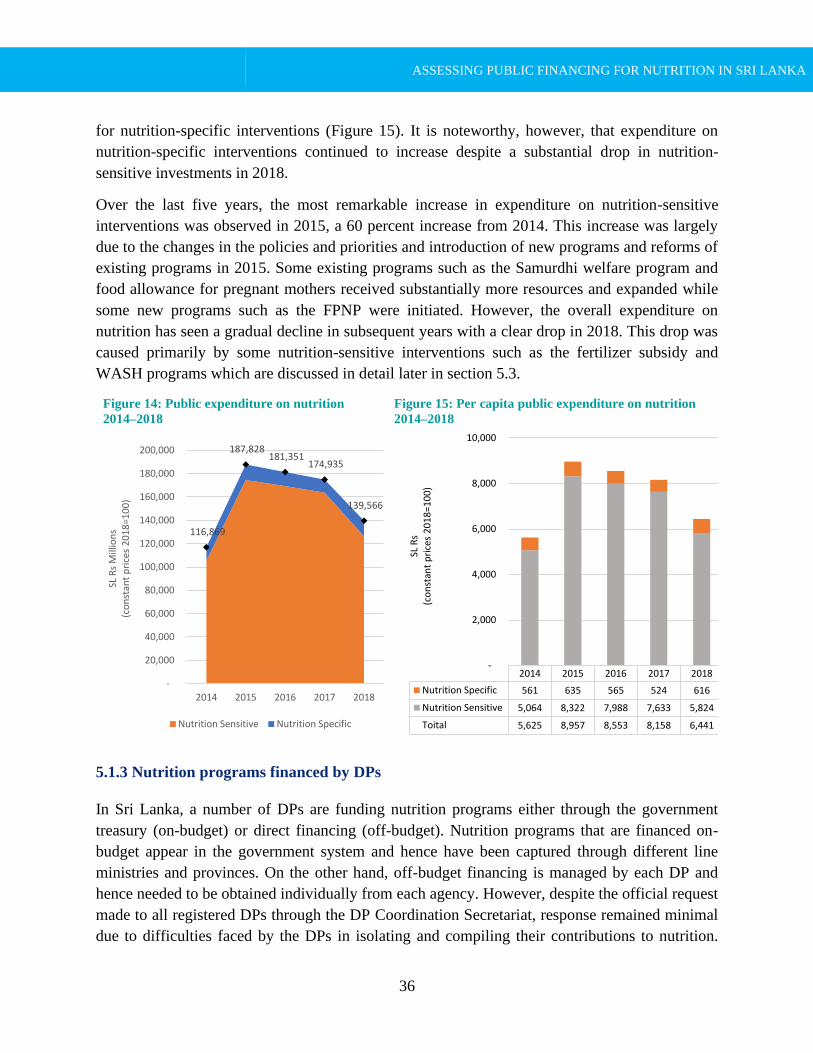
ASSESSING PUBLIC FINANCING FOR NUTRITION IN SRI LANKA
36
for nutrition-specific interventions (Figure 15). It is noteworthy, however, that expenditure on
nutrition-specific interventions continued to increase despite a substantial drop in nutrition-
sensitive investments in 2018.
Over the last five years, the most remarkable increase in expenditure on nutrition-sensitive
interventions was observed in 2015, a 60 percent increase from 2014. This increase was largely
due to the changes in the policies and priorities and introduction of new programs and reforms of
existing programs in 2015. Some existing programs such as the Samurdhi welfare program and
food allowance for pregnant mothers received substantially more resources and expanded while
some new programs such as the FPNP were initiated. However, the overall expenditure on
nutrition has seen a gradual decline in subsequent years with a clear drop in 2018. This drop was
caused primarily by some nutrition-sensitive interventions such as the fertilizer subsidy and
WASH programs which are discussed in detail later in section 5.3.
Figure 14: Public expenditure on nutrition
2014–2018
Figure 15: Per capita public expenditure on nutrition
2014–2018
5.1.3 Nutrition programs financed by DPs
In Sri Lanka, a number of DPs are funding nutrition programs either through the government
treasury (on-budget) or direct financing (off-budget). Nutrition programs that are financed on-
budget appear in the government system and hence have been captured through different line
ministries and provinces. On the other hand, off-budget financing is managed by each DP and
hence needed to be obtained individually from each agency. However, despite the official request
made to all registered DPs through the DP Coordination Secretariat, response remained minimal
due to difficulties faced by the DPs in isolating and compiling their contributions to nutrition.
139,566
174,935 181,351
187,828
116,869
-
20,000
40,000
60,000
80,000
100,000
120,000
140,000
160,000
180,000
200,000
20182017201620152014
SL R
s M
illio
ns
(co
nst
ant
pri
ces
20
18
=10
0)
Nutrition Sensitive Nutrition Specific
20182017201620152014
Nutrition Specific 616524565635561
Nutrition Sensitive 5,8247,6337,9888,3225,064
Toital 6,4418,1588,5538,9575,625
-
2,000
4,000
6,000
8,000
10,000
SL R
s (c
on
stan
t p
rice
s 2
01
8=1
00
)
ASSESSING PUBLIC FINANCING FOR NUTRITION IN SRI LANKA
37
However, we obtained some information from the government offices on off-budget donor-funded
programs that are implemented by the ministry or provinces. We included those programs in the
analysis after confirming that they were identified in Step 1 of the process. Nonetheless, the
contribution of DPs in Sri Lanka is small in general compared to the TPE, and given that on-budget
support is captured on the government side, the incomplete information on off-budget
contributions would not make a major difference at the overall investment level. Box 2 provides a
summary of key contributions from the DPs.6
Box 2: Contribution of DPs
Every year, various nutrition-specific and nutrition-sensitive interventions are funded through different DP
organizations. A summary of their contributions is as follows:
• UNICEF, the WHO, and the WFP are the main DPs aiding financial support to implement nutrition-
specific interventions in Sri Lanka, island wide through the FHB, Nutrition Coordination Division, and
HPB.
• UNICEF contributes to policy development, evidence generation, IYCF promotion, capacity building, and
advocacy programs on maternal and child nutrition, to buy required equipment for the MCH clinics in
certain situations (that is, disaster), and programs such as early childhood development, national nutritional
month, and health and nutrition (by a mix of own fund and grants from other DPs).
• Funds from the WHO are mainly utilized to conduct training and advocacy programs on nutrition,
including promotion of IYCF and breastfeeding practices, as well as for the printing of certain materials
such as preterm growth charts and leaflets only at the inception of a program. In addition, WHO funds are
used for programs under the National Nutrition Surveillance System.
• There are other DPs such as the WFP, Food and Agriculture Organization (FAO), Global Affairs Canada,
and EU-Aid majorly funding to implement different nutrition-sensitive programs in Sri Lanka.
• Improving the nutritional status of pregnant and lactating women and undernourished children is funded
by the WFP and FAO, using SUN through multisectoral approach programs.
• The FAO further funds the Northern, Eastern, and Central Provinces to improve the nutritional status of
vulnerable families in post-war-affected and flood-affected areas.
• The FAO also funds agricultural and agroeconomic development programs, which are implemented
through the MoA and MPISE.
• The Ministry of Fisheries is funded by the FAO for programs such as fish handling, reduction of
postharvest loses in tsunami-affected areas, restoration and improving fish landing sites, construction of
ponds to cultivate fresh water fish, preparation of the inland fisheries sector development program and
implementation strategy, and aquaculture industry improvement.
• EuropeAid supports the estates and surrounding communities to provide equitable WASH for improved
health and nutrition and Assisting Communities in Creating Environmental and Nutritional Development
(ACCEND) in the most vulnerable districts of the Central and Uva Provinces through the Integrated Rural
Development program.
6 The share of foreign financing in public expenditure is generally small in Sri Lanka. In 2016, the TPE was SL Rs 3,106 billion,
of which the share of foreign financing was 7 percent (SL Rs 216 billion). In the health sector, the share of external health
expenditure is even smaller and accounted for just 0.9 percent of PHE in 2016.
ASSESSING PUBLIC FINANCING FOR NUTRITION IN SRI LANKA
38
• Further EU-Aid-funded programs include EU Support to Socio Economic Measures in North and East Sri
Lanka (EU-SEM); EU Support to District Development (EU-SDDP); Food and Nutrition Security Impact,
Resilience, Sustainability, and Transformation (FIRST); and South Asia Food and Nutrition Security
Initiative (SAFANSI), in partnership with the World Bank.
• EU-Aid programs mainly focus on implementing activities such as Building Effective Nutrition
Communication through Partnerships: Addressing Estate Sector Nutrition Issues in Sri Lanka, Integrating
Nutrition Promotion and Rural Development (INPARD), Improving Nutrition through Modernizing
Agriculture (INMAS), and Learning from ‘Champions’: Qualitative study on infant and young child
feeding and caring practices in Sri Lanka’s estate sector.
• Global Affairs Canada funds through Bilateral Aid Disbursements for Nutrition and Related Sectors in Sri
Lanka for programs such as school feeding program in partnership with the WFP, other programs
plantation communities project, International Development Research Centre-Canadian food security,
Volunteer Cooperation Program Uniterra (World University Service of Canada-Centre for International
Studies and Cooperation) (basic nutritional programs), and other agricultural research programs.
5.2 Public expenditure for nutrition-specific interventions
5.2.1 Overview
Nutrition-specific interventions largely fall under the mandate of the MoH. Many of the nutrition-
specific interventions are provided primarily through the existing public health systems, involving
a wide network of health institutions. This broad network has contributed to develop a solid
infrastructure to provide effective health services throughout the country. In addition to the MoH,
the MWCA and MoE are the key ministries that implement nutrition-specific interventions,
particularly targeting the preschool and school children. As discussed earlier in this report,
considering the general recognition of the school meal program as being nutrition specific in Sri
Lanka, school feeding and preschool feeding programs were classified as nutrition-specific
interventions.

ASSESSING PUBLIC FINANCING FOR NUTRITION IN SRI LANKA
39
Figure 16: Public expenditure on nutrition-specific
interventions
Figure 17: Per capita public expenditure for key
nutrition-specific interventions
Key nutrition-specific interventions in Sri Lanka include medicine and supplements provided
through the national MCH program of the FHB,7 Thriposha program, and school meal program.
These three programs account for 96.7 percent of the expenditure on nutrition-specific
interventions (Figure 16). In 2018, 50.5 percent of the total expenditure on nutrition-specific
programs was spent by the school meal program followed by the Thriposha program (31.9
percent), and FHB medicine and supplements in MCH program accounted for only 14.3 percent
of the nutrition-specific investments. Further, in 2018 the GOSL spent around SL Rs 300 per capita
for school meal program, followed by the Thriposha program (SL Rs 200 per capita) and MCH
program (SL Rs 90 per capita) (Figure 17). Also, it is worth noting that the bulk of ‘nutrition-
specific’ expenditure is on school meals for children ages 5–10 years, which is outside the first
1,000-day window when nutrition interventions are most effective. Investments in nutrition-
specific interventions have risen in 2015 driven by the increased expenditure on the Thriposha
program. Public expenditure on nutrition-specific interventions again increased in 2018 driven by
the change in some MCH programs, which is discussed in detail under the FHB programs.
7 The MCH program includes a collection of evidence-based interventions to improve nutrition of reproductive, maternal,
newborn, child adolescent, and youth health.
13,358
11,243 11,988
13,308
11,654
-
2,000
4,000
6,000
8,000
10,000
12,000
14,000
16,000
20182017201620152014
Rs.
Mill
ion
s(c
on
stan
t p
rice
s 2
01
8=1
00
)
Recommended instruments for field MCH clinics
Capacity building of health staff on maternal & child nutrition
Promote optimal maternal nutrition and IYCF practices & IEC material
Nutritonal improvement programmes for vulnerable population
Pre-school meal programmes
School meal programes
Thriposha programme
MCH medicine/supplements
Total-Nutrition Specific Interventions
20182017201620152014
School mealprogrames
311305337335311
Thriposhaprogramme
197154147215169
MCHmedicine/suppleme
nts8849636556
0
200
400
600
SL R
s (c
on
stan
t p
rice
s 2
01
8=1
00
)
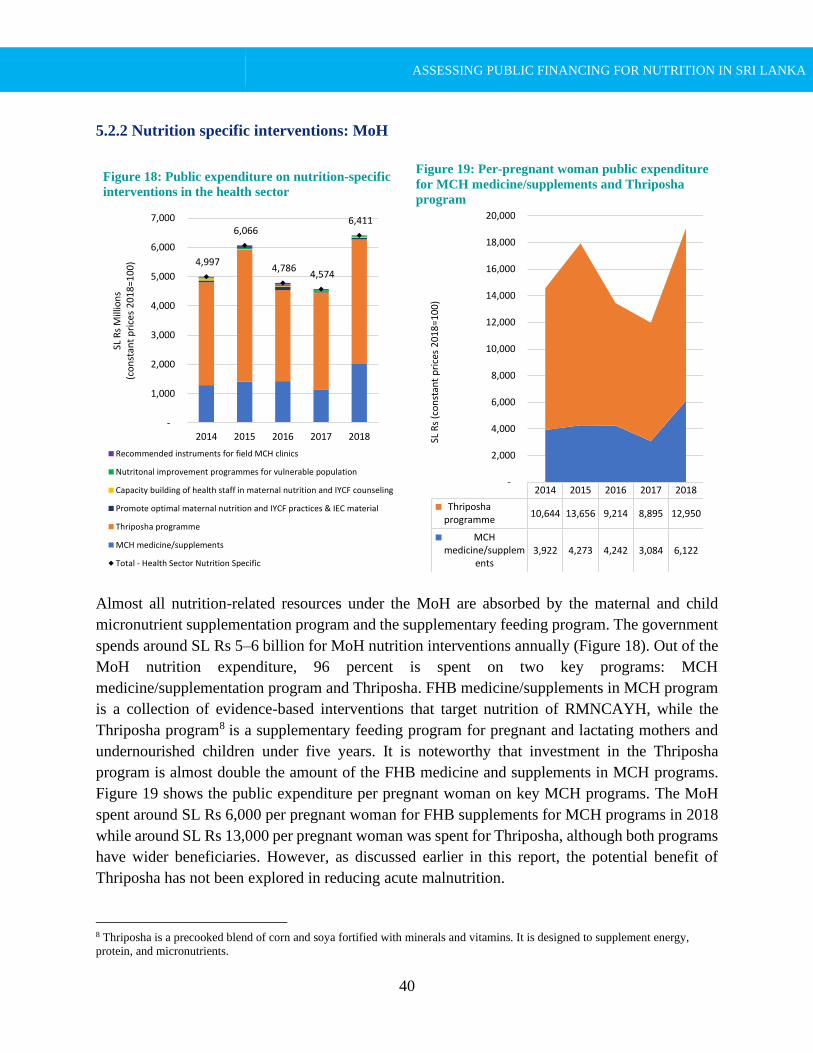
ASSESSING PUBLIC FINANCING FOR NUTRITION IN SRI LANKA
40
5.2.2 Nutrition specific interventions: MoH
Figure 18: Public expenditure on nutrition-specific
interventions in the health sector
Figure 19: Per-pregnant woman public expenditure
for MCH medicine/supplements and Thriposha
program
Almost all nutrition-related resources under the MoH are absorbed by the maternal and child
micronutrient supplementation program and the supplementary feeding program. The government
spends around SL Rs 5–6 billion for MoH nutrition interventions annually (Figure 18). Out of the
MoH nutrition expenditure, 96 percent is spent on two key programs: MCH
medicine/supplementation program and Thriposha. FHB medicine/supplements in MCH program
is a collection of evidence-based interventions that target nutrition of RMNCAYH, while the
Thriposha program8 is a supplementary feeding program for pregnant and lactating mothers and
undernourished children under five years. It is noteworthy that investment in the Thriposha
program is almost double the amount of the FHB medicine and supplements in MCH programs.
Figure 19 shows the public expenditure per pregnant woman on key MCH programs. The MoH
spent around SL Rs 6,000 per pregnant woman for FHB supplements for MCH programs in 2018
while around SL Rs 13,000 per pregnant woman was spent for Thriposha, although both programs
have wider beneficiaries. However, as discussed earlier in this report, the potential benefit of
Thriposha has not been explored in reducing acute malnutrition.
8 Thriposha is a precooked blend of corn and soya fortified with minerals and vitamins. It is designed to supplement energy,
protein, and micronutrients.
6,411
4,574 4,786
6,066
4,997
-
1,000
2,000
3,000
4,000
5,000
6,000
7,000
20182017201620152014
SL R
s M
illio
ns
(co
nst
ant
pri
ces
20
18
=10
0)
Recommended instruments for field MCH clinics
Nutritonal improvement programmes for vulnerable population
Capacity building of health staff in maternal nutrition and IYCF counseling
Promote optimal maternal nutrition and IYCF practices & IEC material
Thriposha programme
MCH medicine/supplements
Total - Health Sector Nutrition Specific
20182017201620152014
Thriposhaprogramme
12,9508,8959,21413,65610,644
MCHmedicine/supplem
ents6,1223,0844,2424,2733,922
-
2,000
4,000
6,000
8,000
10,000
12,000
14,000
16,000
18,000
20,000
SL R
s (c
on
stan
t p
rice
s 2
01
8=1
00
)
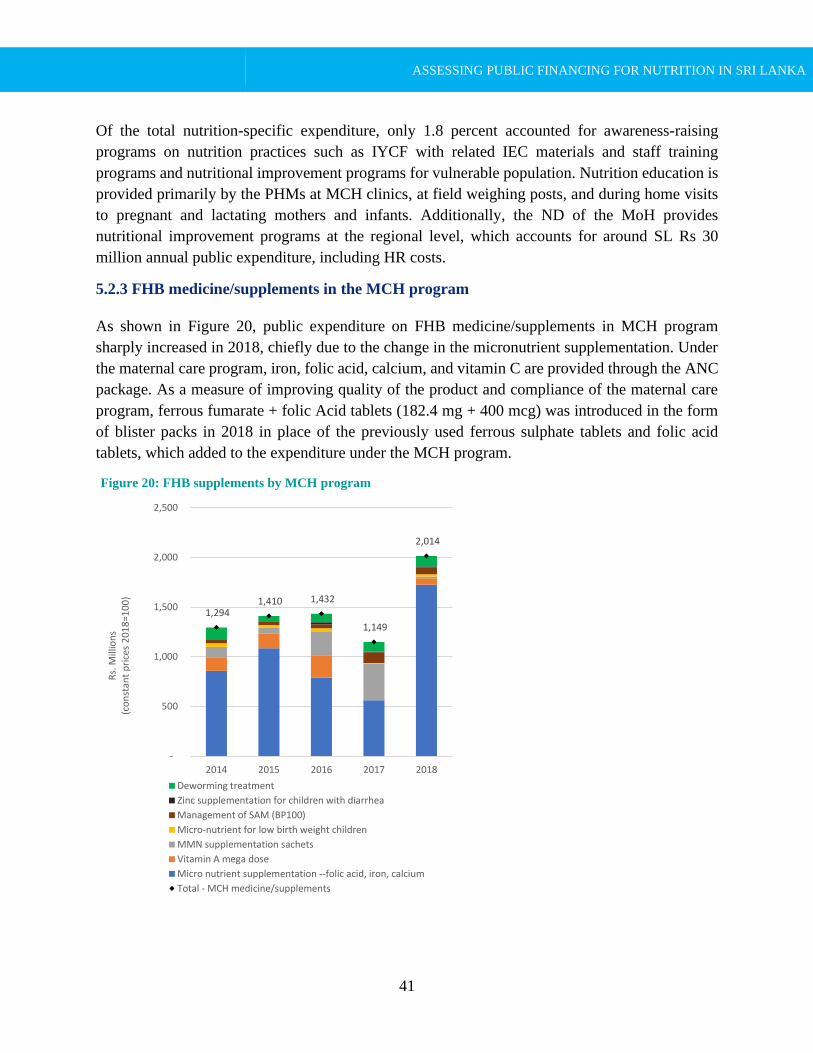
ASSESSING PUBLIC FINANCING FOR NUTRITION IN SRI LANKA
41
Of the total nutrition-specific expenditure, only 1.8 percent accounted for awareness-raising
programs on nutrition practices such as IYCF with related IEC materials and staff training
programs and nutritional improvement programs for vulnerable population. Nutrition education is
provided primarily by the PHMs at MCH clinics, at field weighing posts, and during home visits
to pregnant and lactating mothers and infants. Additionally, the ND of the MoH provides
nutritional improvement programs at the regional level, which accounts for around SL Rs 30
million annual public expenditure, including HR costs.
5.2.3 FHB medicine/supplements in the MCH program
As shown in Figure 20, public expenditure on FHB medicine/supplements in MCH program
sharply increased in 2018, chiefly due to the change in the micronutrient supplementation. Under
the maternal care program, iron, folic acid, calcium, and vitamin C are provided through the ANC
package. As a measure of improving quality of the product and compliance of the maternal care
program, ferrous fumarate + folic Acid tablets (182.4 mg + 400 mcg) was introduced in the form
of blister packs in 2018 in place of the previously used ferrous sulphate tablets and folic acid
tablets, which added to the expenditure under the MCH program.
Figure 20: FHB supplements by MCH program
2,014
1,149
1,432 1,410 1,294
-
500
1,000
1,500
2,000
2,500
20182017201620152014
Rs.
Mill
ion
s(c
on
stan
t p
rice
s 2
01
8=1
00
)
Deworming treatment
Zinc supplementation for children with diarrhea
Management of SAM (BP100)
Micro-nutrient for low birth weight children
MMN supplementation sachets
Vitamin A mega dose
Micro nutrient supplementation --folic acid, iron, calcium
Total - MCH medicine/supplements
ASSESSING PUBLIC FINANCING FOR NUTRITION IN SRI LANKA
42
With the aim of preventing iron deficiency among children ages 6 to 23 months, the MMN
supplementation program was expanded island wide since 2017. MMN supplementation9 for
children was introduced in 2007, with the support of UNICEF, on a pilot basis in four most
nutritionally vulnerable districts. Subsequently the program was expanded and implemented in 13
selected districts. Based on the findings from a national compliance study conducted by the MRI
and UNICEF, the MMN program was expanded to the entire island in 2017. Given the expansion,
expenditure on MMN has increased to around SL Rs 370 million in 2017, which dropped in 2018
due to the balance left from the 2017 procurement.
BP 100, a RUTF, has been used in Sri Lanka for the treatment of SAM, which absorbed SL Rs 70
million in 2018. To ensure the availability of SAM treatment, procurement of BP 100 was
increased during 2016–2018. The annual usage during this period was around 2,700–3,800 cartons,
which was around 2,000 cartoons during 2014–2015.
5.2.4 Public expenditure of school nutritional program
There are three kinds of ‘school nutrition programs’ implemented by the MoE: government school
meal program; ‘Food for Education’ Program jointly implemented by the Ministry of National
Policies and Economic Affairs (MNPEA) and WFP; and the glass of fresh milk/milk packets
program (see Box 3).
Box 3: School nutrition programs
Government school meal program
Schools to conduct the school meal program are selected based upon 3 criteria:
• All the students of schools with total number of students less than 100
• Students from grades 1–5 of selected schools
• Students of the special education unit
SL Rs 28.00 is allocated for one meal for one student a day. The meals should be provided according to the
approved menus. The recommended time to provide meals is 7.30 to 8.30 a.m.
Food for Education Program
The program is jointly implemented by the MNPEA and WFP:
• Implemented in the schools of the Northern Province
• Students of grades 1–9 from selected schools
The MNPEA provides rice, oil, dhal, and canned fish for this program through district secretariat and additional
fund to purchase greenery. This greenery fund is provided based on the daily attendance of students on meal serving
days. The per student allocation for a meal range from SL Rs 3.50 to SL Rs 7.00 based on the number of the
students in the school.
9 MMN powder sachets (containing 15 vitamins and minerals, including iron, zinc, and vitamin A).

ASSESSING PUBLIC FINANCING FOR NUTRITION IN SRI LANKA
43
Glass of fresh milk/milk packets program
This program is funded by the government:
• Students from grades 1–5 of selected schools are included in this project.
• A 150 ml milk packet is provided to a student 5 days in a week.
The government school meal program dominates among the school and preschool meal programs.
The GOSL annually spends around SL Rs 5–6 billion for the government school meal program
(Figure 21).
This program has been implemented in almost 80 percent of all government schools with 1 million
beneficiaries among grade 1–5 school children. Conversely, the glass of fresh milk/milk packets
program is implemented in only around 10 percent of schools, which are not covered under the
school meal program. The GOSL spent around SL Rs 6,000 per child for the school meal program
in 2018 while around SL Rs 3,500 per child was spent on the preschool meal program (Figure 22).
Figure 21: Public expenditure on school and
preschool nutritional programs
Figure 22: Per child public expenditure for school
and preschool nutritional program, 2018
It is also noteworthy that the government school meal program places higher priority on
marginalized regions. For instance, more than 85 percent of schools have the meal program in
North Central and Uva Provinces, while only 60 percent of schools in the Western Province are
covered by the program (see Figure 23). As the WFP-funded ‘Food for Education’ Program that
was implemented in the Northern Province closed in 2017, the government school meal program
was expanded to the Northern Province. With this expansion, public expenditure for the school
7,050 6,764
7,285 7,292 6,779
-
1,000
2,000
3,000
4,000
5,000
6,000
7,000
8,000
20182017201620152014
Rs.
Mil
lion
s
(con
stan
t p
rice
s 2
01
8=
10
0)
Tikiri Shakthi - nutritional bar
Morning meal/fresh milk for preschool children (2-5 years)
Food for education -WFP programme
Glass of milk for school children
School meal programme
School - pre-school nutritional programmes
5,901
4,165
3,627
1,080
- 2,000 4,000 6,000
School meal programme
Glass of milk for school
children
Morning meal/fresh milk for
preschool children (2-5
years)
Tikiri Shakthi - nutritional
bar
SL Rs
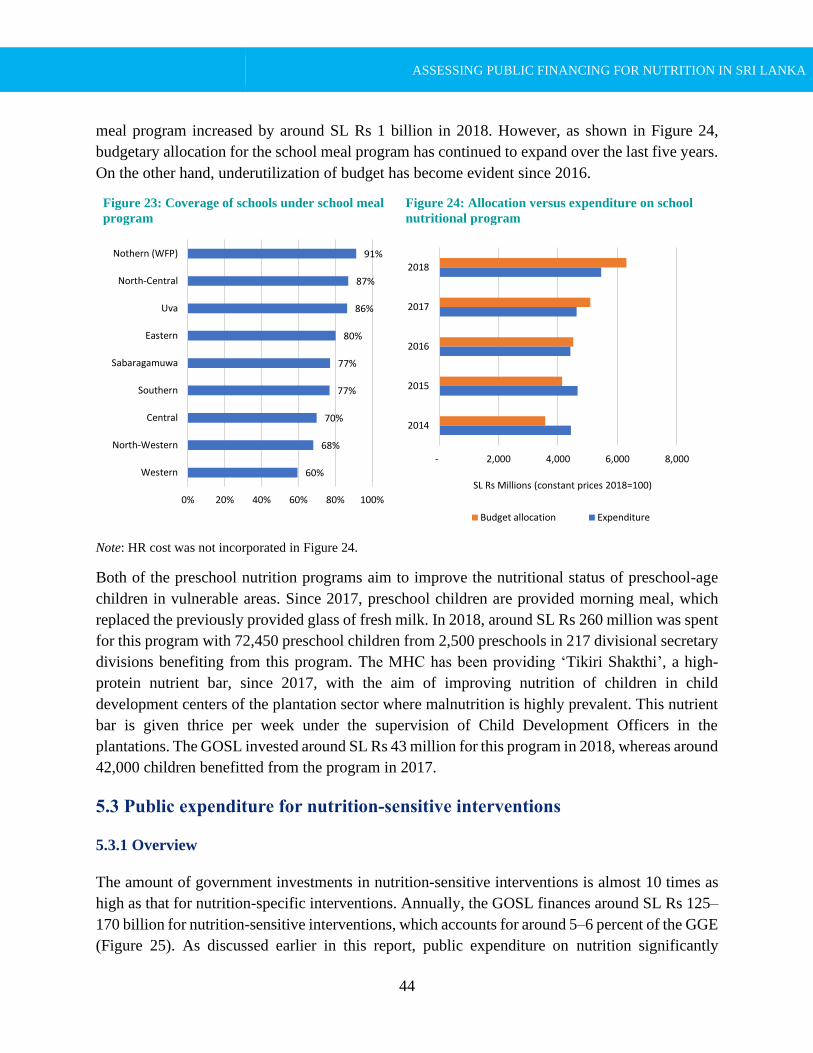
ASSESSING PUBLIC FINANCING FOR NUTRITION IN SRI LANKA
44
meal program increased by around SL Rs 1 billion in 2018. However, as shown in Figure 24,
budgetary allocation for the school meal program has continued to expand over the last five years.
On the other hand, underutilization of budget has become evident since 2016.
Figure 23: Coverage of schools under school meal
program
Figure 24: Allocation versus expenditure on school
nutritional program
Note: HR cost was not incorporated in Figure 24.
Both of the preschool nutrition programs aim to improve the nutritional status of preschool-age
children in vulnerable areas. Since 2017, preschool children are provided morning meal, which
replaced the previously provided glass of fresh milk. In 2018, around SL Rs 260 million was spent
for this program with 72,450 preschool children from 2,500 preschools in 217 divisional secretary
divisions benefiting from this program. The MHC has been providing ‘Tikiri Shakthi’, a high-
protein nutrient bar, since 2017, with the aim of improving nutrition of children in child
development centers of the plantation sector where malnutrition is highly prevalent. This nutrient
bar is given thrice per week under the supervision of Child Development Officers in the
plantations. The GOSL invested around SL Rs 43 million for this program in 2018, whereas around
42,000 children benefitted from the program in 2017.
5.3 Public expenditure for nutrition-sensitive interventions
5.3.1 Overview
The amount of government investments in nutrition-sensitive interventions is almost 10 times as
high as that for nutrition-specific interventions. Annually, the GOSL finances around SL Rs 125–
170 billion for nutrition-sensitive interventions, which accounts for around 5–6 percent of the GGE
(Figure 25). As discussed earlier in this report, public expenditure on nutrition significantly
60%
68%
70%
77%
77%
80%
86%
87%
91%
0% 20% 40% 60% 80% 100%
Western
North-Western
Central
Southern
Sabaragamuwa
Eastern
Uva
North-Central
Nothern (WFP)
- 2,000 4,000 6,000 8,000
2018
2017
2016
2015
2014
SL Rs Millions (constant prices 2018=100)
Budget allocation Expenditure
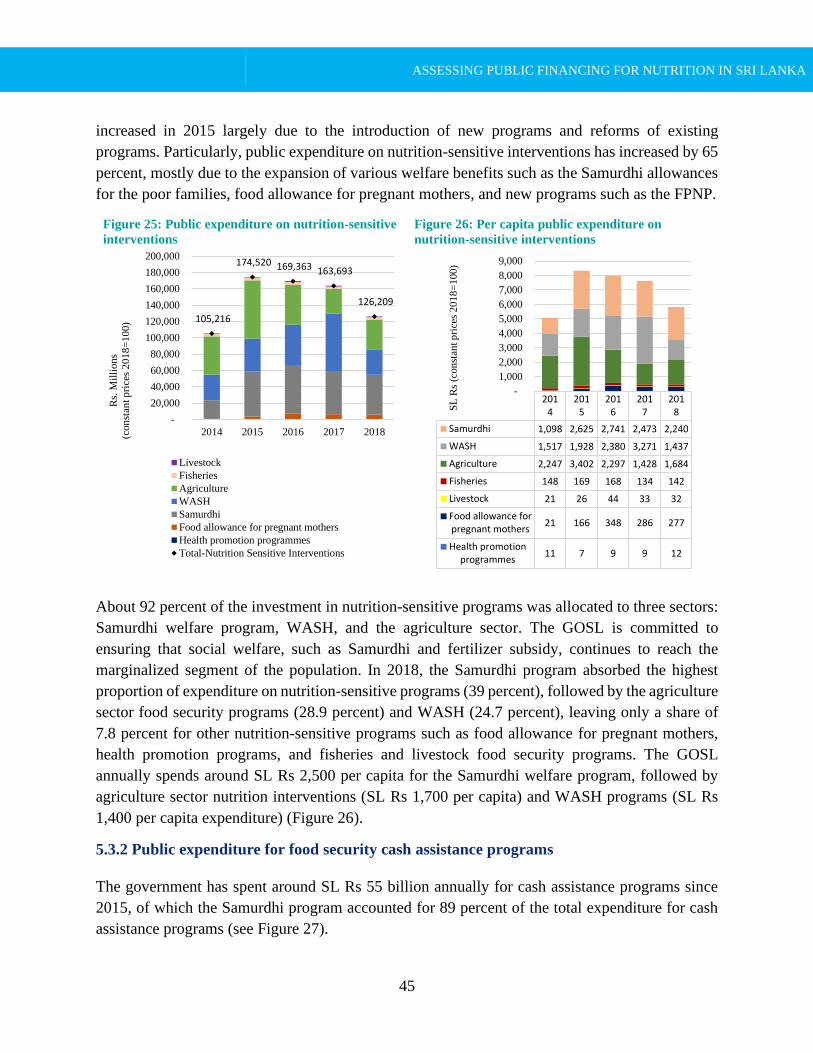
ASSESSING PUBLIC FINANCING FOR NUTRITION IN SRI LANKA
45
increased in 2015 largely due to the introduction of new programs and reforms of existing
programs. Particularly, public expenditure on nutrition-sensitive interventions has increased by 65
percent, mostly due to the expansion of various welfare benefits such as the Samurdhi allowances
for the poor families, food allowance for pregnant mothers, and new programs such as the FPNP.
Figure 25: Public expenditure on nutrition-sensitive
interventions
Figure 26: Per capita public expenditure on
nutrition-sensitive interventions
About 92 percent of the investment in nutrition-sensitive programs was allocated to three sectors:
Samurdhi welfare program, WASH, and the agriculture sector. The GOSL is committed to
ensuring that social welfare, such as Samurdhi and fertilizer subsidy, continues to reach the
marginalized segment of the population. In 2018, the Samurdhi program absorbed the highest
proportion of expenditure on nutrition-sensitive programs (39 percent), followed by the agriculture
sector food security programs (28.9 percent) and WASH (24.7 percent), leaving only a share of
7.8 percent for other nutrition-sensitive programs such as food allowance for pregnant mothers,
health promotion programs, and fisheries and livestock food security programs. The GOSL
annually spends around SL Rs 2,500 per capita for the Samurdhi welfare program, followed by
agriculture sector nutrition interventions (SL Rs 1,700 per capita) and WASH programs (SL Rs
1,400 per capita expenditure) (Figure 26).
5.3.2 Public expenditure for food security cash assistance programs
The government has spent around SL Rs 55 billion annually for cash assistance programs since
2015, of which the Samurdhi program accounted for 89 percent of the total expenditure for cash
assistance programs (see Figure 27).
126,209
163,693 169,363 174,520
105,216
-
20,000
40,000
60,000
80,000
100,000
120,000
140,000
160,000
180,000
200,000
20182017201620152014
Rs.
Mil
lion
s
(con
stan
t p
rice
s 2
01
8=
10
0)
Livestock
Fisheries
Agriculture
WASH
Samurdhi
Food allowance for pregnant mothers
Health promotion programmes
Total-Nutrition Sensitive Interventions
2018
2017
2016
2015
2014
Samurdhi 2,2402,4732,7412,6251,098
WASH 1,4373,2712,3801,9281,517
Agriculture 1,6841,4282,2973,4022,247
Fisheries 142134168169148
Livestock 3233442621
Food allowance forpregnant mothers
27728634816621
Health promotionprogrammes
1299711
-
1,000
2,000
3,000
4,000
5,000
6,000
7,000
8,000
9,000
SL
Rs
(con
stan
t p
rice
s 2
01
8=
100)
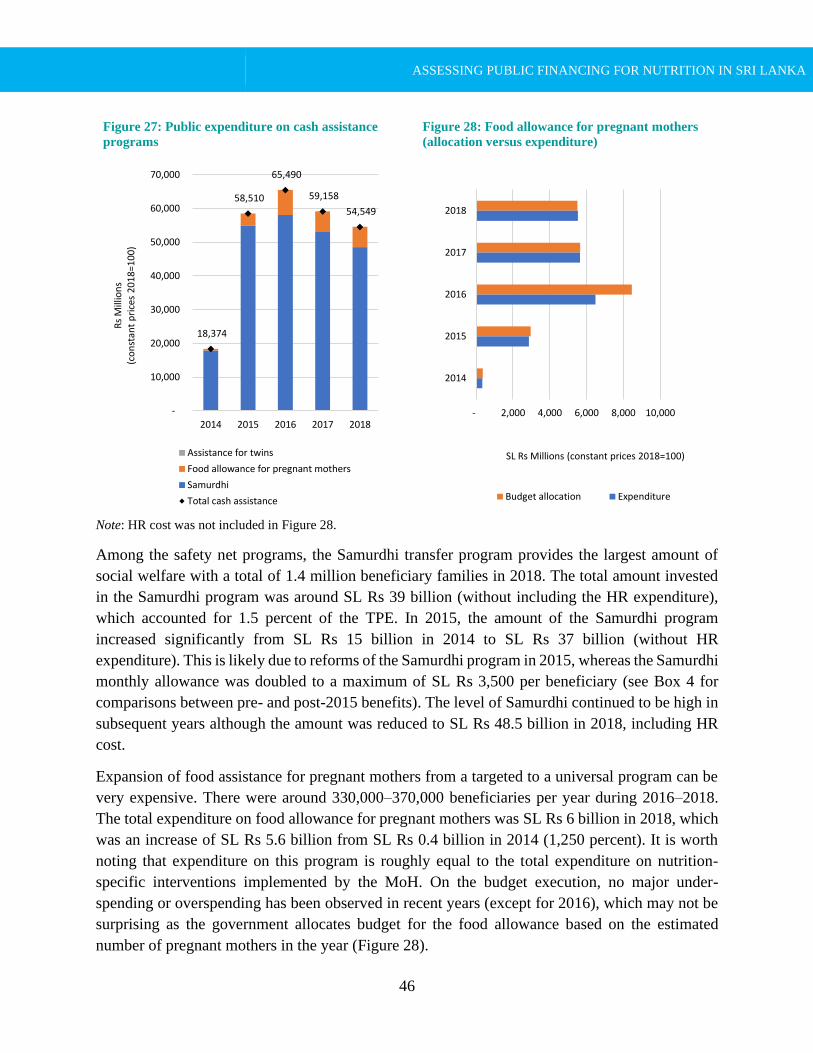
ASSESSING PUBLIC FINANCING FOR NUTRITION IN SRI LANKA
46
Note: HR cost was not included in Figure 28.
Among the safety net programs, the Samurdhi transfer program provides the largest amount of
social welfare with a total of 1.4 million beneficiary families in 2018. The total amount invested
in the Samurdhi program was around SL Rs 39 billion (without including the HR expenditure),
which accounted for 1.5 percent of the TPE. In 2015, the amount of the Samurdhi program
increased significantly from SL Rs 15 billion in 2014 to SL Rs 37 billion (without HR
expenditure). This is likely due to reforms of the Samurdhi program in 2015, whereas the Samurdhi
monthly allowance was doubled to a maximum of SL Rs 3,500 per beneficiary (see Box 4 for
comparisons between pre- and post-2015 benefits). The level of Samurdhi continued to be high in
subsequent years although the amount was reduced to SL Rs 48.5 billion in 2018, including HR
cost.
Expansion of food assistance for pregnant mothers from a targeted to a universal program can be
very expensive. There were around 330,000–370,000 beneficiaries per year during 2016–2018.
The total expenditure on food allowance for pregnant mothers was SL Rs 6 billion in 2018, which
was an increase of SL Rs 5.6 billion from SL Rs 0.4 billion in 2014 (1,250 percent). It is worth
noting that expenditure on this program is roughly equal to the total expenditure on nutrition-
specific interventions implemented by the MoH. On the budget execution, no major under-
spending or overspending has been observed in recent years (except for 2016), which may not be
surprising as the government allocates budget for the food allowance based on the estimated
number of pregnant mothers in the year (Figure 28).
Figure 27: Public expenditure on cash assistance
programs
Figure 28: Food allowance for pregnant mothers
(allocation versus expenditure)
54,549
59,158
65,490
58,510
18,374
-
10,000
20,000
30,000
40,000
50,000
60,000
70,000
20182017201620152014
Rs
Mill
ion
s(c
on
stan
t p
rice
s 2
01
8=1
00
)
Assistance for twins
Food allowance for pregnant mothers
Samurdhi
Total cash assistance
- 2,000 4,000 6,000 8,000 10,000
2018
2017
2016
2015
2014
SL Rs Millions (constant prices 2018=100)
Budget allocation Expenditure

ASSESSING PUBLIC FINANCING FOR NUTRITION IN SRI LANKA
47
Box 4: Welfare improving measures implemented in 2015
Samurdhi monthly allowance, per beneficiary (SL Rs)
Beneficiary categories 2012–2014 2015
Less than 3 members 750 1,500
3 members 1,200 2,500
4 or more members 1,500 3,500
Empowered families 210 420
Pregnant mother’s food assistance program
2009–2014 2015
Food allowance SL Rs 500 for 20 months SL Rs 2,000 for 10 months
Target group Pregnant mothers who are living in Samurdhi
beneficiary family registered at the MOH
All pregnant mothers who are
registered at the MOH
5.3.3 Public expenditure for nutrition-sensitive interventions in the agriculture sector
Fertilizer subsidy dominates the expenditure on nutrition—in the agriculture sector, accounting for
89 percent of the sector’s expenditure on nutrition (Figure 29). The GOSL spent SL Rs 32.3 billion
on fertilizer subsidy in 2018 to enhance paddy production. Other long-standing nutrition-sensitive
interventions in the agriculture sector, such as minor irrigation programs, accounted for an
expenditure of approximately SL Rs 2.5 billion in 2018, while the food crop production and
improvement program accounted for around SL Rs 200 million.
Figure 29: Public expenditure on agriculture sector nutrition-sensitive interventions
36,485 30,615
48,703
71,335
46,693
-
20,000
40,000
60,000
80,000
20182017201620152014
Rs.
Mill
ion
s(c
on
stan
t p
rice
s 2
01
8=1
00
)
Agriculture other
Construction of Training centres, helabojun centres etc
Food Crop Production and Improvement Programme
Food Production National Programme (FPNP)
Minor Irrigation Programme & Renovation of small tanks
Fertilizer Subsidy Programme
Agriculture Total
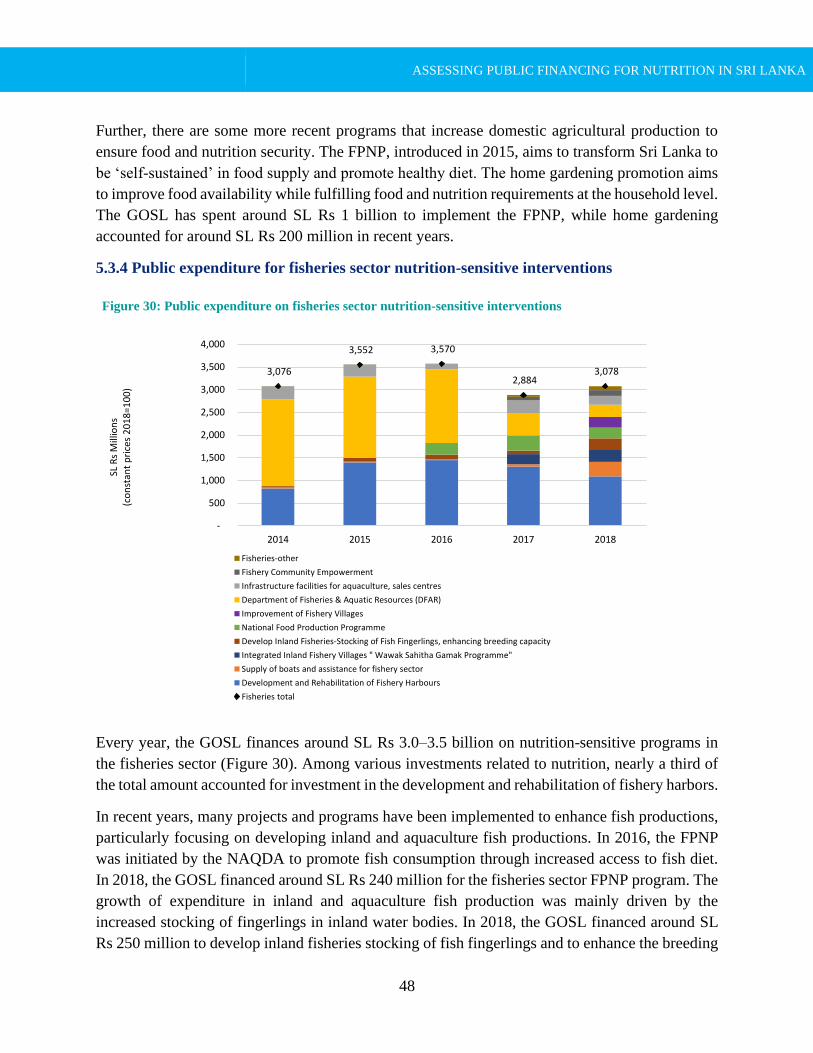
ASSESSING PUBLIC FINANCING FOR NUTRITION IN SRI LANKA
48
Further, there are some more recent programs that increase domestic agricultural production to
ensure food and nutrition security. The FPNP, introduced in 2015, aims to transform Sri Lanka to
be ‘self-sustained’ in food supply and promote healthy diet. The home gardening promotion aims
to improve food availability while fulfilling food and nutrition requirements at the household level.
The GOSL has spent around SL Rs 1 billion to implement the FPNP, while home gardening
accounted for around SL Rs 200 million in recent years.
5.3.4 Public expenditure for fisheries sector nutrition-sensitive interventions
Every year, the GOSL finances around SL Rs 3.0–3.5 billion on nutrition-sensitive programs in
the fisheries sector (Figure 30). Among various investments related to nutrition, nearly a third of
the total amount accounted for investment in the development and rehabilitation of fishery harbors.
In recent years, many projects and programs have been implemented to enhance fish productions,
particularly focusing on developing inland and aquaculture fish productions. In 2016, the FPNP
was initiated by the NAQDA to promote fish consumption through increased access to fish diet.
In 2018, the GOSL financed around SL Rs 240 million for the fisheries sector FPNP program. The
growth of expenditure in inland and aquaculture fish production was mainly driven by the
increased stocking of fingerlings in inland water bodies. In 2018, the GOSL financed around SL
Rs 250 million to develop inland fisheries stocking of fish fingerlings and to enhance the breeding
Figure 30: Public expenditure on fisheries sector nutrition-sensitive interventions
3,078 2,884
3,570 3,552
3,076
-
500
1,000
1,500
2,000
2,500
3,000
3,500
4,000
20182017201620152014
SL R
s M
illio
ns
(co
nst
ant
pri
ces
20
18
=10
0)
Fisheries-other
Fishery Community Empowerment
Infrastructure facilities for aquaculture, sales centres
Department of Fisheries & Aquatic Resources (DFAR)
Improvement of Fishery Villages
National Food Production Programme
Develop Inland Fisheries-Stocking of Fish Fingerlings, enhancing breeding capacity
Integrated Inland Fishery Villages " Wawak Sahitha Gamak Programme"
Supply of boats and assistance for fishery sector
Development and Rehabilitation of Fishery Harbours
Fisheries total
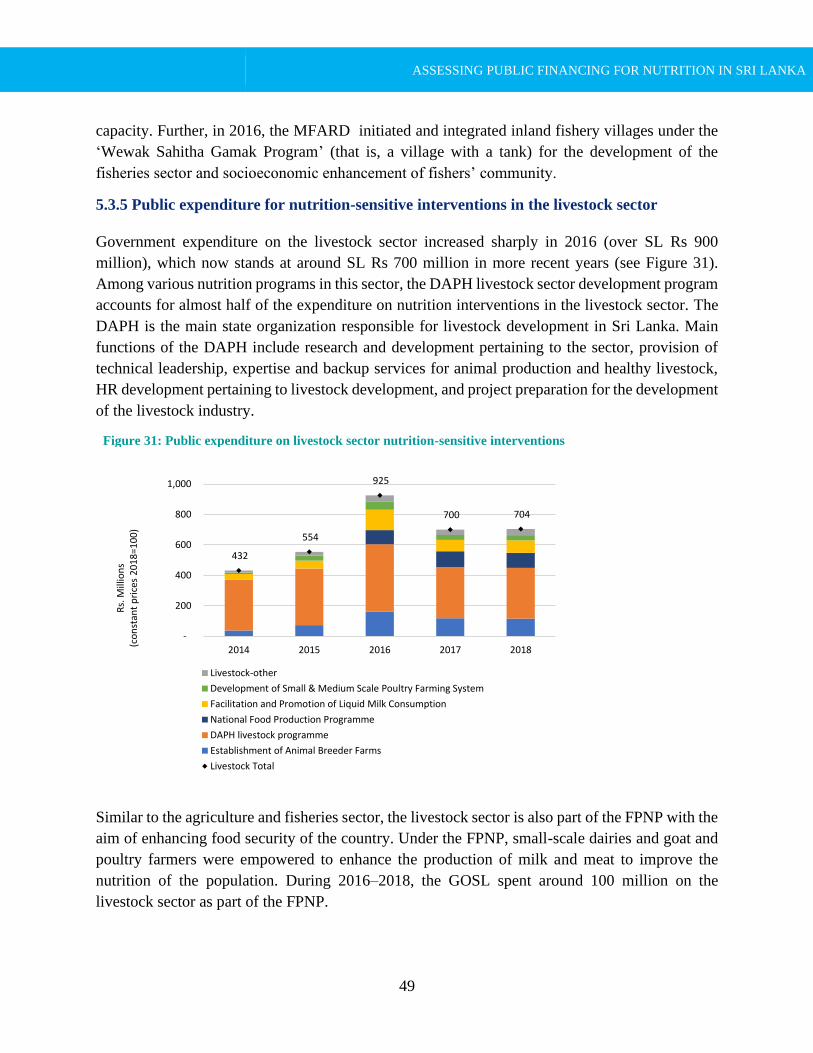
ASSESSING PUBLIC FINANCING FOR NUTRITION IN SRI LANKA
49
capacity. Further, in 2016, the MFARD initiated and integrated inland fishery villages under the
‘Wewak Sahitha Gamak Program’ (that is, a village with a tank) for the development of the
fisheries sector and socioeconomic enhancement of fishers’ community.
5.3.5 Public expenditure for nutrition-sensitive interventions in the livestock sector
Government expenditure on the livestock sector increased sharply in 2016 (over SL Rs 900
million), which now stands at around SL Rs 700 million in more recent years (see Figure 31).
Among various nutrition programs in this sector, the DAPH livestock sector development program
accounts for almost half of the expenditure on nutrition interventions in the livestock sector. The
DAPH is the main state organization responsible for livestock development in Sri Lanka. Main
functions of the DAPH include research and development pertaining to the sector, provision of
technical leadership, expertise and backup services for animal production and healthy livestock,
HR development pertaining to livestock development, and project preparation for the development
of the livestock industry.
Figure 31: Public expenditure on livestock sector nutrition-sensitive interventions
Similar to the agriculture and fisheries sector, the livestock sector is also part of the FPNP with the
aim of enhancing food security of the country. Under the FPNP, small-scale dairies and goat and
poultry farmers were empowered to enhance the production of milk and meat to improve the
nutrition of the population. During 2016–2018, the GOSL spent around 100 million on the
livestock sector as part of the FPNP.
704 700
925
554
432
-
200
400
600
800
1,000
20182017201620152014
Rs.
Mill
ion
s(c
on
stan
t p
rice
s 2
01
8=1
00
)
Livestock-other
Development of Small & Medium Scale Poultry Farming System
Facilitation and Promotion of Liquid Milk Consumption
National Food Production Programme
DAPH livestock programme
Establishment of Animal Breeder Farms
Livestock Total

ASSESSING PUBLIC FINANCING FOR NUTRITION IN SRI LANKA
50
More resources have been spent on the facilitation and promotion of the liquid milk consumption
program, especially targeting the school children. Several other programs have been in place to
enhance the milk production including improvement of hygiene conditions for milk produce in
dairy farms, development of small-scale dairy farms, and provision of cows to female-headed
households. The government has also enhanced financing to support establish breeder farms.
Breeder farms were established island wide at the provincial level with the aim of minimizing the
shortage of dairy cows. Further, several programs are under way to enhance the poultry industry
including distributing chicks, establishing mini feed mills, and enhancing household backyard
poultry programs.
5.3.6 Public expenditure for water and sanitation programs
Figure 32: Public expenditure on WASH interventions
The government has financed around SL Rs 30–50 billion for WASH programs annually (Figure
32). During 2015–2018, about 18 large-scale water supply and sewerage projects were completed
and seven new water supply projects and one sanitation project initiated. In 2017, investment in
WASH programs was around SL Rs 68 billion, whereas 11 new water projects were initiated and
six large-scale water supply projects completed. Further, in 2017 the government invested around
43 billion for large-scale water supply and sewerage projects with GOSL investments as well as
30,704
68,618
48,002
40,265
31,337
-
10,000
20,000
30,000
40,000
50,000
60,000
70,000
20182017201620152014
Rs.
Mil
lion
s
(con
stan
t p
rice
s 2
01
8=
10
0)
Water-other
UNICEF drought mitigation and emergency activities
China Sri Lanka research grant project
Improvement of community water supply schemes
Emerging small townships water supply schemes
Increasing household access to sewerage services (GPOBA -WB)
Improvement of rural water supply & sanitation
Provision of safe drinking water in the areas affected by the CKD
Dry zone urban water & sanitationproject (ADB)
Water supply & sanitation improvement project (WASSIP-WB)
GOSL allocation for for large scale WS & sewerage projects
Local bank loan for large scale WS & sewerage projects
Foreign bank loan for large scale WS & sewerage projects
Large scale water & waste water projects (Disbursement of ongoing projects)
WASH total
ASSESSING PUBLIC FINANCING FOR NUTRITION IN SRI LANKA
51
foreign and local bank loans. Further, it is noteworthy that the GOSL has spent around 23 billion
annually for the loan disbursement of ongoing projects.
Some of the key recent WASH programs include the WASSIP with support from the World Bank
(4.8 billion in 2018, 426,000 beneficiaries in seven districts); the Dry Zone Urban Water and
Sanitation Project with support from the ADB (to improve the urban water and sanitation services
in the towns of North and North-Western regions); and the Global Partnership on Output-based
Aid (GPOBA) Project supported by the World Bank (to expand residential sewerage connections
in the greater Colombo area and to improve sanitation facilities). Some special programs have been
in place with the aim of preventing CKDu, such as providing safe drinking water to highly CKDu-
prevalent districts, new water connections and pipe line extensions, and installation of reverse
osmosis (RO) plants in villages and schools. Further, the China-Sri Lanka Research Grant is
operated for development of technologies for rainwater harvesting testing of quality of water and
to identify factors causing CKDu.
5.4 Provincial distribution of public expenditure for nutrition
5.4.1 Trends in public expenditure on nutrition by province
The provincial expenditure on nutrition includes both centrally procured items that were
distributed to and utilized in provinces and actual expenditure in the provinces. The Western
Province spent the largest amount of nutrition resources among the nine provinces, which is not
surprising given that the province hosts the largest population (Figure 33). On the contrary, the
Western Province spent the least in terms of per capita expenditure on nutrition. It is noteworthy
that the Northern and Eastern Provinces, both recovering from the aftermath of decades of civil
war, marked the highest per capita expenditure on nutrition. This could be partially explained by
the government’s public policy that seeks to promote balanced regional growth by investing more
funds in the provinces that need more resources.
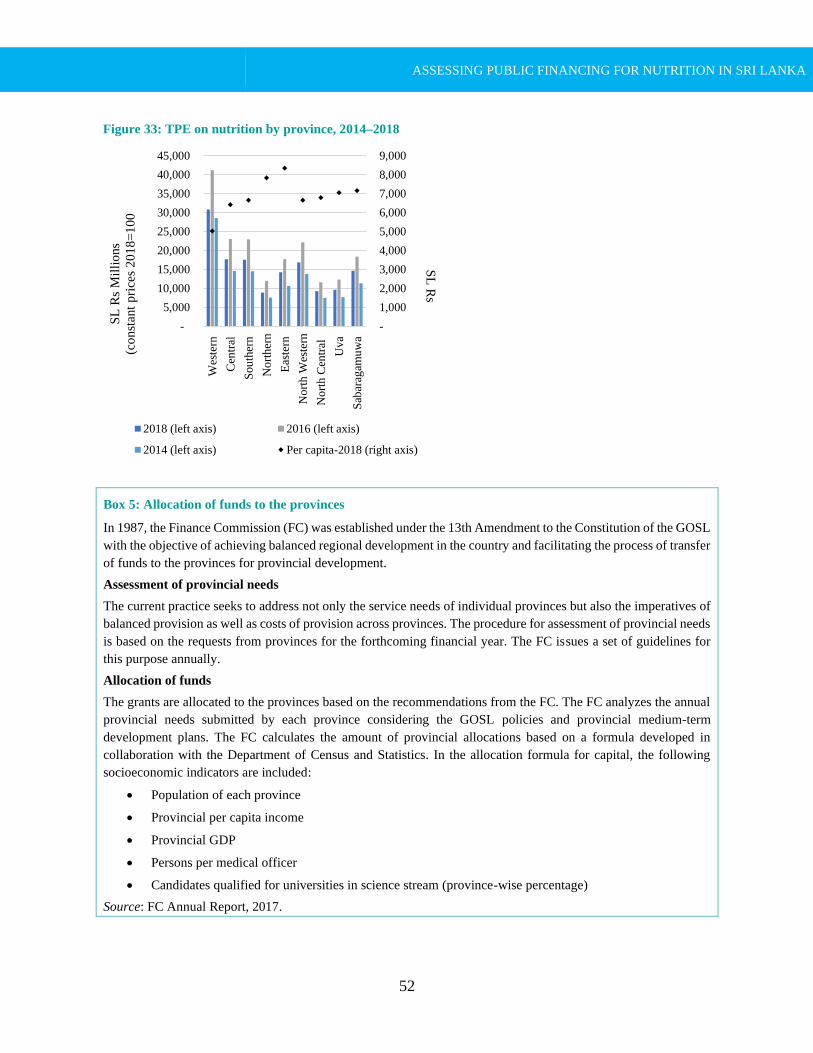
ASSESSING PUBLIC FINANCING FOR NUTRITION IN SRI LANKA
52
Figure 33: TPE on nutrition by province, 2014–2018
Box 5: Allocation of funds to the provinces
In 1987, the Finance Commission (FC) was established under the 13th Amendment to the Constitution of the GOSL
with the objective of achieving balanced regional development in the country and facilitating the process of transfer
of funds to the provinces for provincial development.
Assessment of provincial needs
The current practice seeks to address not only the service needs of individual provinces but also the imperatives of
balanced provision as well as costs of provision across provinces. The procedure for assessment of provincial needs
is based on the requests from provinces for the forthcoming financial year. The FC issues a set of guidelines for
this purpose annually.
Allocation of funds
The grants are allocated to the provinces based on the recommendations from the FC. The FC analyzes the annual
provincial needs submitted by each province considering the GOSL policies and provincial medium-term
development plans. The FC calculates the amount of provincial allocations based on a formula developed in
collaboration with the Department of Census and Statistics. In the allocation formula for capital, the following
socioeconomic indicators are included:
• Population of each province
• Provincial per capita income
• Provincial GDP
• Persons per medical officer
• Candidates qualified for universities in science stream (province-wise percentage)
Source: FC Annual Report, 2017.
-
1,000
2,000
3,000
4,000
5,000
6,000
7,000
8,000
9,000
-
5,000
10,000
15,000
20,000
25,000
30,000
35,000
40,000
45,000
Wes
tern
Cen
tral
Sou
ther
n
No
rth
ern
Eas
tern
No
rth
Wes
tern
No
rth
Cen
tral
Uv
a
Sab
arag
amu
wa
SL
Rs
SL
Rs
Mil
lio
ns
(co
nst
ant
pri
ces
20
18
=1
00
2018 (left axis) 2016 (left axis)
2014 (left axis) Per capita-2018 (right axis)
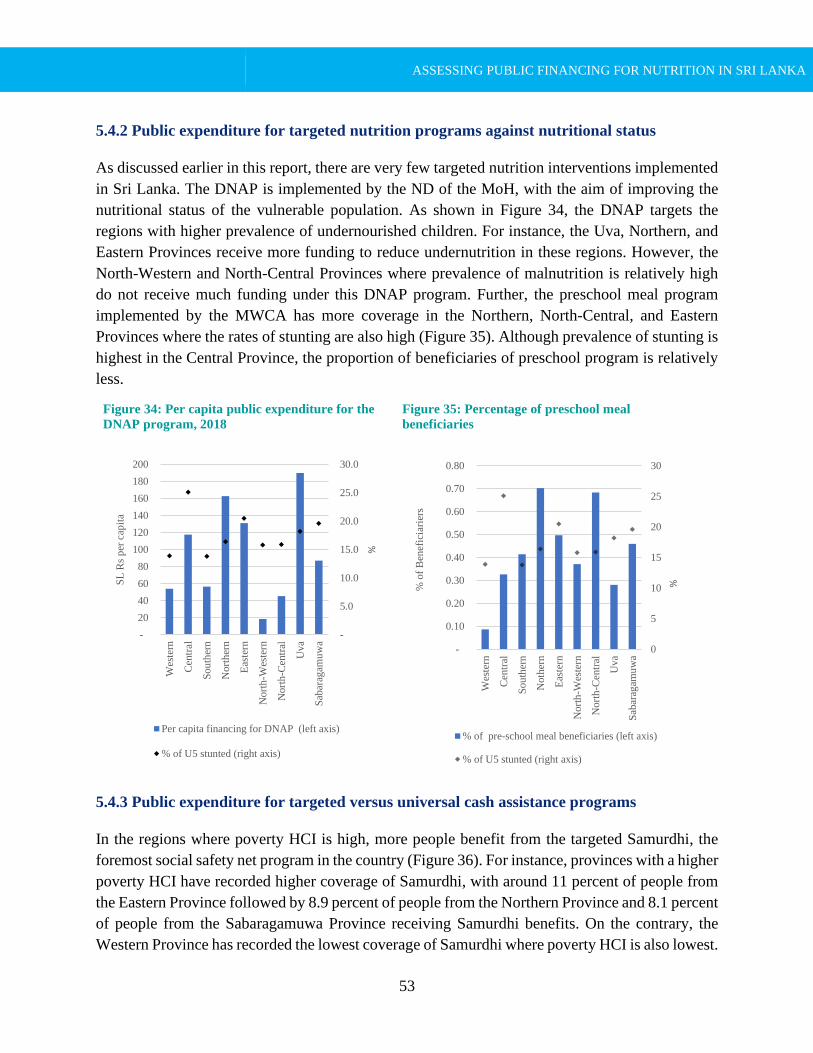
ASSESSING PUBLIC FINANCING FOR NUTRITION IN SRI LANKA
53
5.4.2 Public expenditure for targeted nutrition programs against nutritional status
As discussed earlier in this report, there are very few targeted nutrition interventions implemented
in Sri Lanka. The DNAP is implemented by the ND of the MoH, with the aim of improving the
nutritional status of the vulnerable population. As shown in Figure 34, the DNAP targets the
regions with higher prevalence of undernourished children. For instance, the Uva, Northern, and
Eastern Provinces receive more funding to reduce undernutrition in these regions. However, the
North-Western and North-Central Provinces where prevalence of malnutrition is relatively high
do not receive much funding under this DNAP program. Further, the preschool meal program
implemented by the MWCA has more coverage in the Northern, North-Central, and Eastern
Provinces where the rates of stunting are also high (Figure 35). Although prevalence of stunting is
highest in the Central Province, the proportion of beneficiaries of preschool program is relatively
less.
Figure 34: Per capita public expenditure for the
DNAP program, 2018
Figure 35: Percentage of preschool meal
beneficiaries
5.4.3 Public expenditure for targeted versus universal cash assistance programs
In the regions where poverty HCI is high, more people benefit from the targeted Samurdhi, the
foremost social safety net program in the country (Figure 36). For instance, provinces with a higher
poverty HCI have recorded higher coverage of Samurdhi, with around 11 percent of people from
the Eastern Province followed by 8.9 percent of people from the Northern Province and 8.1 percent
of people from the Sabaragamuwa Province receiving Samurdhi benefits. On the contrary, the
Western Province has recorded the lowest coverage of Samurdhi where poverty HCI is also lowest.
-
5.0
10.0
15.0
20.0
25.0
30.0
-
20
40
60
80
100
120
140
160
180
200
Wes
tern
Cen
tral
Sou
ther
n
Nort
her
n
Eas
tern
Nort
h-W
este
rn
Nort
h-C
entr
al
Uva
Sab
arag
amu
wa
%
SL
Rs
per
cap
ita
Per capita financing for DNAP (left axis)
% of U5 stunted (right axis)
0
5
10
15
20
25
30
-
0.10
0.20
0.30
0.40
0.50
0.60
0.70
0.80
Wes
tern
Cen
tral
Sou
ther
n
Noth
ern
Eas
tern
Nort
h-W
este
rn
Nort
h-C
entr
al
Uva
Sab
arag
amu
wa
%% o
f B
enef
icia
rier
s
% of pre-school meal beneficiaries (left axis)
% of U5 stunted (right axis)
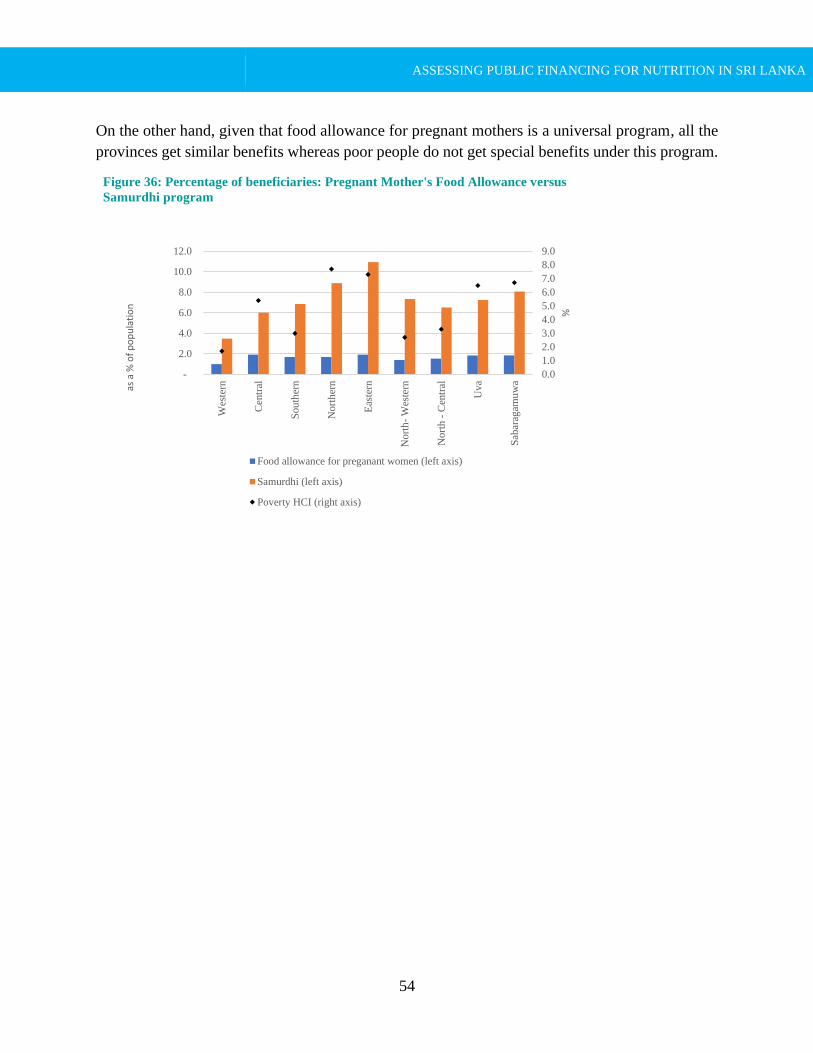
ASSESSING PUBLIC FINANCING FOR NUTRITION IN SRI LANKA
54
On the other hand, given that food allowance for pregnant mothers is a universal program, all the
provinces get similar benefits whereas poor people do not get special benefits under this program.
Figure 36: Percentage of beneficiaries: Pregnant Mother's Food Allowance versus
Samurdhi program
0.0
1.0
2.0
3.0
4.0
5.0
6.0
7.0
8.0
9.0
-
2.0
4.0
6.0
8.0
10.0
12.0
Wes
tern
Cen
tral
Sou
ther
n
Nort
her
n
Eas
tern
Nort
h-
Wes
tern
Nort
h -
Cen
tral
Uva
Sab
arag
amu
wa
%
as a
% o
f p
op
ula
tio
n
Food allowance for preganant women (left axis)
Samurdhi (left axis)
Poverty HCI (right axis)
ASSESSING PUBLIC FINANCING FOR NUTRITION IN SRI LANKA
55
6. SUMMARY AND THE WAY FORWARD
6.1 Key findings and limitations
The GOSL has invested modestly on nutrition programs and interventions
Relative to other countries in the region, Sri Lanka has been spending a modest amount of
government resources on nutrition. A 5 percent share of TPE on nutrition is higher than some
countries such as Bhutan (3 percent, unweighted) but lower compared to countries such as Nepal
and Bangladesh (respectively 23 percent and 9 percent, unweighted). Given the small TPE as a
share of GDP (that is, less than 20 percent), the total investments in nutrition in Sri Lanka may be
remarkably less compared to its peers. The overall expenditure on nutrition has sharply increased
in 2015 due to the initiation of new programs (for example, FPNP) and scale-up of existing
programs (for example, Samurdhi), which was followed by a gradual decline in subsequent years
with a clear drop in 2018. The drop in nutrition expenditure was primarily driven by closure of
some nutrition-sensitive programs (for example, water programs). 2018 has seen a sharp increase
in expenditure on nutrition-specific programs, particularly due to island-wide scale-up of
micronutrient supplementation (that is, folic acid, iron, calcium).
The relatively small share of nutrition-specific programs indicates the potential for further scaling
up effective interventions
Sri Lanka’s investments in nutrition are dominated by nutrition-sensitive interventions; only 10
percent of the total nutrition investments (or only 0.5 percent of TPE) are spent on nutrition-
specific programs. Given that investments in nutrition-sensitive programs were not weighted, the
current expenditure level of 5.2 percent of TPE on nutrition should be interpreted with caution. On
the other hand, the relatively imbalanced composition of the current nutrition expenditure suggests
a significant potential for further improvements of nutritional status.
Blanket provision of some nutrition programs appears costly and may not be efficient
For instance, the expansion of targeted food assistance for pregnant mothers to a universal program
in 2015 added an extra SL Rs 5.6 billion, an increase by 1,250 percent. The amount of expenditure
on this program is now almost equal to the total expenditure on nutrition-specific programs under
the MoH, which encompass all maternal and child nutrition interventions. This should be targeted
in the poor areas.
Less than 2 percent of nutrition-specific investments is spent on targeted nutrition awareness-
raising programs
Effective communication on maternal nutrition and IYCF and healthy diet is a critical element of
a nutrition program. However, only 2 percent of the total nutrition-specific investment has been

ASSESSING PUBLIC FINANCING FOR NUTRITION IN SRI LANKA
56
used for educational and promotive behavior change communication. This may be partly due to
the nature of intervention where a large portion of resources comprise health personnel (for
example, public health midwife). The assumption employed in allocating HR expenditure (that is,
proportional allocation based on the amount of all other expenditures of a program) may have
resulted in a smaller allocation of staff costs.
6.2 Key messages
From the previous section, it is evident that resources used for nutrition programs have not been
distributed in a most efficient way, suggesting potential room for efficiency gains by optimizing
resource allocation. Given this situation, the following provides some key messages that can be
derived from this exercise.
The current nutrition programs need to be reviewed, in terms of both design and beneficiaries
The analysis shows that Sri Lanka has been providing a reasonably comprehensive set of programs
for nutrition. However, a significant share of resources has been used by a small number of
programs that may or may not be the most effective interventions in reducing malnutrition. A
rigorous prioritization exercise would be warranted by investigating the effectiveness, cost-
effectiveness, and good practices of nutrition interventions. In relation to this, careful
considerations need to be taken in determining the beneficiaries (that is, targeted versus blanket).
The current allocation of resources for nutrition-specific interventions deserves revisiting
The evidence of nutrition-specific interventions is generally more robust and they address the
immediate determinants of malnutrition. While nutrition-sensitive programs have critical roles in
addressing the underlying determinants of nutrition, the decision on investments may well be
driven by other agendas. Conversely, investments in nutrition-specific programs can be directly
guided by the nutrition agenda and hence would be more responsive to the real needs. Coverage
of nutrition-specific programs is generally high (for example, 91 percent vitamin A
supplementation at 3 years, ANC coverage over 90 percent). However, some programs have lesser
coverage or coverage itself is not well understood. For instance, the current nutrition information
system lacks data on SAM/MAM service coverage, management, and treatment outcomes. To
address the information gaps, the minimum indicators on acute malnutrition need to be integrated
into the appropriate database system. Given the high prevalence of wasting, services addressing
prevention of SAM/MAM at the community level need to be scaled up.
Mainstreaming nutrition in other sectors
Despite the importance of nutrition-specific programs, the effects of those programs could be
undermined if the underlying causes are not properly addressed. The difficulty in mobilizing
resources for nutrition-sensitive programs rests with the fact that decisions are also guided by other
ASSESSING PUBLIC FINANCING FOR NUTRITION IN SRI LANKA
57
agendas of the sectors. It is therefore important to mainstream nutrition in other sectors to have
more voice in decision making. In strengthening the multisectoral engagement and coordination
in nutrition, the MSAPN was developed in line with the NNP alongside other policies related to
nutrition that need to be aligned with each other. In reviewing different policies and strategies, the
need to tightening links between different strategies was noted. The multisectoral platform for
scaling up nutrition should be aligned to support the concept that ‘nutrition is in every sector and
every sector is in nutrition’ (SUN) and underline the extent of political commitment. In this regard,
the NNP that is being revised is expected to place more emphasis on multisectoral coordination
and partnerships, and all relevant health and non-health policies are expected to be coherent with
NNP.
Targeting of programs
Generally, targeted programs are more cost-effective than blanket coverage as long as the targets
are well selected. The selection of targets requires a prioritization exercise as described earlier,
which, however, needs to accommodate considerations on negative side effects such as inequity.
Nevertheless, weighted resource allocation has already been practiced by the government, though
on a limited scale. There is a potential to gain some fiscal space by changing the supplementary
feeding program, for pregnant and lactating women (Thriposha), to target at-risk pregnant women
rather than all women. Recently, the MoH reviewed the design of this supplementary feeding
program for pregnant and lactating women, which resulted in a change in targeting strategy from
blanket to targeted provision. However, the policy dialogue needs to be continued to finalize and
approve the modifications (and plan for areas where freed resources should be invested).
Health promotion
Albeit with limitations in estimating the expenditure discussed earlier, nutrition awareness-raising
programs and educational and promotive activities may deserve more allocation, especially for
those that are related to the first 1,000-day window, such as IYCF. Given the weak evidence of the
traditional IEC approach in changing behaviors, social and behavior change communication could
be scaled up along with interventions to provide a supportive environment and promote positive
behaviors to enable the beneficiaries to adapt and maintain desirable behaviors.
6.3 Challenges faced in tracking financial information
In conducting the exercise, the team faced a number of difficulties in collecting, consolidating, and
analyzing the data. This was somewhat anticipated given the multisectoral nature of nutrition, and
it would be useful for planning if this exercise could be conducted routinely in more systematic
modalities. The following provides some of the key challenges that are worth noting and some
recommendations for potential improvement.
ASSESSING PUBLIC FINANCING FOR NUTRITION IN SRI LANKA
58
6.3.1 Key challenges
Multisectoral nature of nutrition was the biggest challenge for the exercise
The major challenge was to collect information from all relevant sectors and consolidating on a
single platform. This exercise was initiated with a workshop with representations from provinces
and multiple line ministries. Following on the instructions given at the workshop, each institution
was requested to extract and provide financial data for both nutrition-specific and nutrition-
sensitive programs. Most of the institutions provided the preliminary data sets, which were then
followed up by meetings with relevant officials for clarification. However, in some cases,
miscommunications complicated the data collection process, particularly in the non-health sectors.
This was partly due to lack of consensus as to what constitutes a nutrition-specific or nutrition-
sensitive program. Communicating a clear definition for all sectors was problematic.
Very limited data were available under budget line items for nutrition
The budget document of the MoF was the starting point in identifying relevant data and other
sources for this exercise. Sri Lanka uses an input-based budget line and it was not immediately
feasible to isolate nutrition programs from those records, except for a few programs such as the
school meal and Thriposha programs. Therefore, data collection had to be conducted manually
with a combination of desk review and visits to each government institution. There was no
consolidated database, and paper-based recording was still widely practiced, especially for older
data. It was difficult to find comprehensive data sets over 10 years. Most of the institutions had
started using computer-based databases or spreadsheets recently, but older data sets were kept on
paper.
Data gaps and inconsistent budget formats and record keeping
In some cases, centrally procured items distributed to the regional level did not keep records on
how those items were allocated to each province. Therefore, the amount of provincial allocation
had to resort to assumptions. Some sectors, such as livestock and hill country, were affected by
frequent organizational restructuring of ministries, both at the provincial and central levels. For
those sectors, time series data were not available in a single ministry or department and had to be
collected and consolidated from several departments/ministries to complete the data set. Further,
unclear definitions and scope of programs made it difficult to identify what items were included
in an expenditure item and what not, which was even more complicated with the different budget
formats used by different provinces that made aggregation and comparison problematic. A similar
issue was experienced in collecting off-budget information from DPs. Only a few organizations
provided the expenditure data with varying formats. While the contributions of DPs in Sri Lanka
are small, and on-budget data and some off-budget information were captured from the
ASSESSING PUBLIC FINANCING FOR NUTRITION IN SRI LANKA
59
government side, the results are potentially slightly underestimated although the difference should
be negligible.
6.3.2 Recommendations
Standard coding and tagging
Budget and expenditure of programs and funding sources can be reasonably traced if institutions
at all levels (central, provincial, and below) use a standard coding system with program names. A
budget tagging mechanism, whereby the line items are tagged for nutrition, would further improve
resource tracking as has been practiced in Indonesia. This will also prevent potential double
counting when reporting to the central level.
Database for analysis
Most of the current databases are not designed to generate instant reports and graphics. The
monitoring and evaluation functions of the institutions could significantly improve if databases are
upgraded to allow for more flexibility in performing analysis. Using common formats for data
entry and following standardized good practices in data collection would ensure consistency and
enable comparisons. Merging of data can be performed without difficulties and will reduce the
risk of data misinterpretation and duplication and missing data. When processing expenditure data
and generating summaries, it is recommended to keep a detailed and secure version for later
analysis. It may be stored in an open file format that would not require any paid software to use
and process data.

ASSESSING PUBLIC FINANCING FOR NUTRITION IN SRI LANKA
60
ANNEX 1: KEY INTERVENTIONS FOR MALNUTRITION THROUGHOUT THE
LIFE CYCLE
Source: UNICEF 2015.
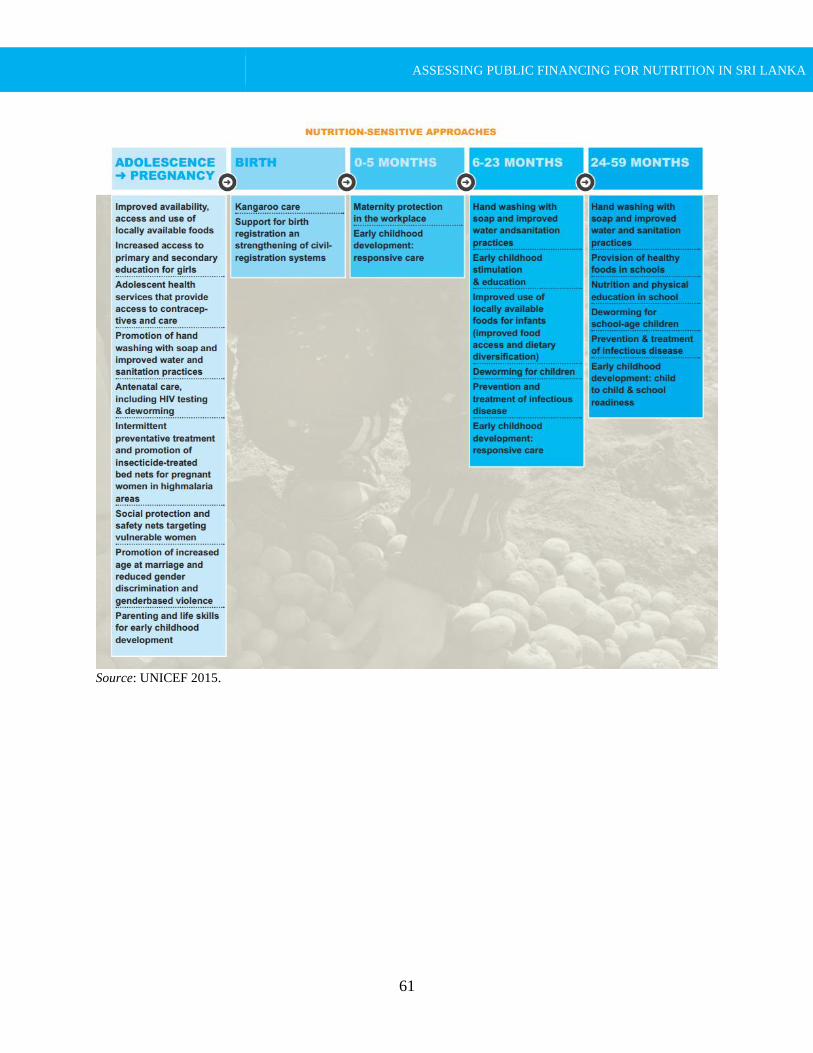
ASSESSING PUBLIC FINANCING FOR NUTRITION IN SRI LANKA
61
Source: UNICEF 2015.
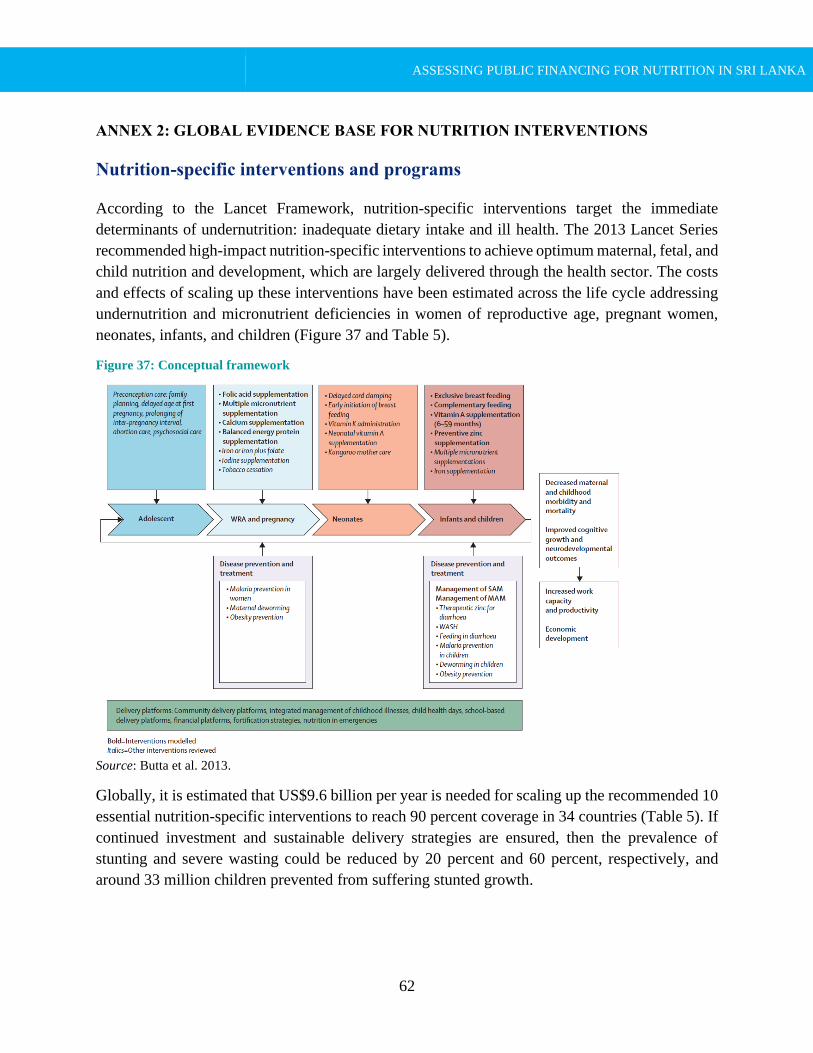
ASSESSING PUBLIC FINANCING FOR NUTRITION IN SRI LANKA
62
ANNEX 2: GLOBAL EVIDENCE BASE FOR NUTRITION INTERVENTIONS
Nutrition-specific interventions and programs
According to the Lancet Framework, nutrition-specific interventions target the immediate
determinants of undernutrition: inadequate dietary intake and ill health. The 2013 Lancet Series
recommended high-impact nutrition-specific interventions to achieve optimum maternal, fetal, and
child nutrition and development, which are largely delivered through the health sector. The costs
and effects of scaling up these interventions have been estimated across the life cycle addressing
undernutrition and micronutrient deficiencies in women of reproductive age, pregnant women,
neonates, infants, and children (Figure 37 and Table 5).
Figure 37: Conceptual framework
Source: Butta et al. 2013.
Globally, it is estimated that US$9.6 billion per year is needed for scaling up the recommended 10
essential nutrition-specific interventions to reach 90 percent coverage in 34 countries (Table 5). If
continued investment and sustainable delivery strategies are ensured, then the prevalence of
stunting and severe wasting could be reduced by 20 percent and 60 percent, respectively, and
around 33 million children prevented from suffering stunted growth.

ASSESSING PUBLIC FINANCING FOR NUTRITION IN SRI LANKA
63
Table 5: Cost for scaling up nutrition-specific interventions per year globally
Nutrition-specific intervention Cost for scaling up per year (US$,
billions)
Micronutrient interventions 3.7
Educational interventions 1.0
Management of SAM 2.6
Provision of food for pregnant women and children ages 6–23 months in
poor households
2.3
Source: Butta et al. 2013.
IYCF in the first two years of life
Breastfeeding practices
Breastfeeding is one of the fundamental elements that determine the development, survival, and
health of children. The IYCF program includes promotion and support for early initiation of
breastfeeding (newborns to be breastfed within one hour after birth), exclusive breastfeeding for
the first six months, and continued breastfeeding until the age of two and beyond and age-
appropriate complementary feeding from six months of age. Apart from preventing undernutrition,
breastfeeding and adequate complementary feeding are also effective in preventing overweight
and various kinds of diseases. Breastfeeding could prevent 823,000 annual deaths in children
younger than five years and 20,000 maternal deaths from breast cancer every year if scaled up to
a near-universal level (Victora et al. 2016).
Despite the numerous benefits and improved health-related outcomes, globally only about 41
percent of infants ages less than six months were exclusively breastfed in 2017, and the rate of
continued breastfeeding at the age of two was 45 percent.10 Given the low rate of adequate
breastfeeding, the WHO recommends the following breastfeeding counseling practices (WHO
2019):
• Breastfeeding counseling should be provided to all pregnant women and mothers with
young children.
• Breastfeeding counseling should be provided in both the antenatal period and postnatally
and up to 24 months or longer.
• Breastfeeding counseling should be provided at least six times and additionally as needed.
• Breastfeeding counseling should be provided through face-to-face counseling. It may, in
addition, be provided through telephone or other remote modes of counseling.
10 https://data.unicef.org/topic/nutrition/infant-and-young-child-feeding/.
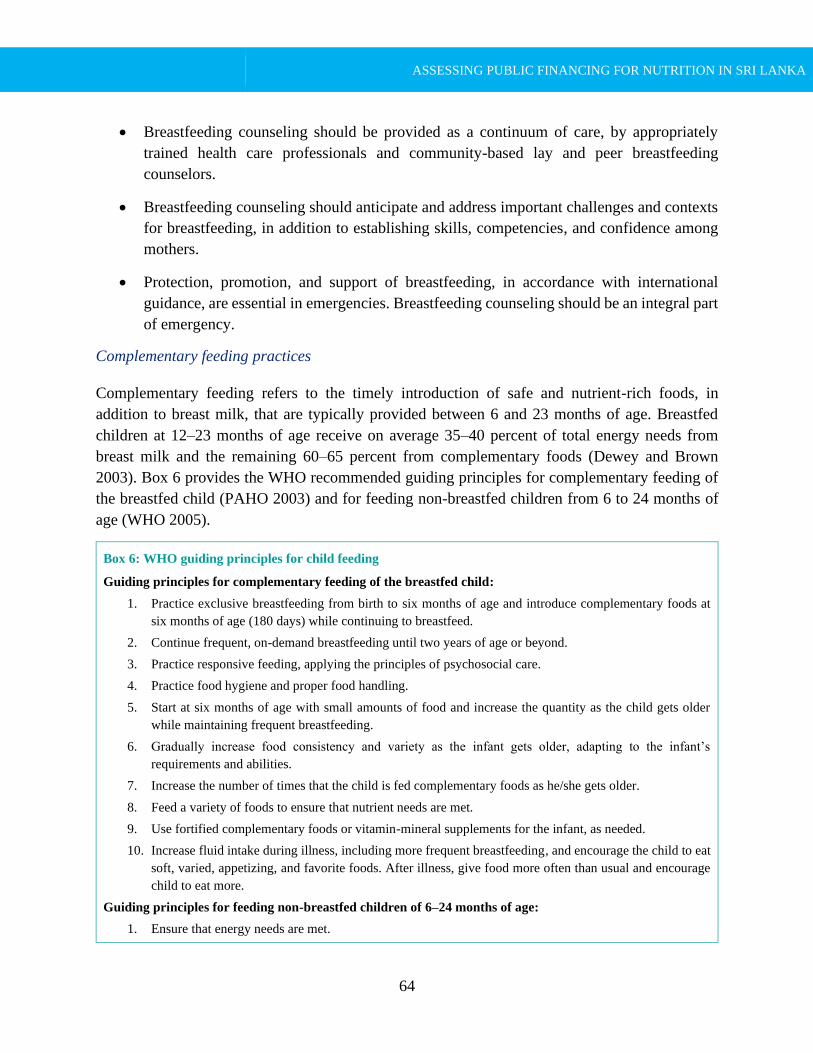
ASSESSING PUBLIC FINANCING FOR NUTRITION IN SRI LANKA
64
• Breastfeeding counseling should be provided as a continuum of care, by appropriately
trained health care professionals and community-based lay and peer breastfeeding
counselors.
• Breastfeeding counseling should anticipate and address important challenges and contexts
for breastfeeding, in addition to establishing skills, competencies, and confidence among
mothers.
• Protection, promotion, and support of breastfeeding, in accordance with international
guidance, are essential in emergencies. Breastfeeding counseling should be an integral part
of emergency.
Complementary feeding practices
Complementary feeding refers to the timely introduction of safe and nutrient-rich foods, in
addition to breast milk, that are typically provided between 6 and 23 months of age. Breastfed
children at 12–23 months of age receive on average 35–40 percent of total energy needs from
breast milk and the remaining 60–65 percent from complementary foods (Dewey and Brown
2003). Box 6 provides the WHO recommended guiding principles for complementary feeding of
the breastfed child (PAHO 2003) and for feeding non-breastfed children from 6 to 24 months of
age (WHO 2005).
Box 6: WHO guiding principles for child feeding
Guiding principles for complementary feeding of the breastfed child:
1. Practice exclusive breastfeeding from birth to six months of age and introduce complementary foods at
six months of age (180 days) while continuing to breastfeed.
2. Continue frequent, on-demand breastfeeding until two years of age or beyond.
3. Practice responsive feeding, applying the principles of psychosocial care.
4. Practice food hygiene and proper food handling.
5. Start at six months of age with small amounts of food and increase the quantity as the child gets older
while maintaining frequent breastfeeding.
6. Gradually increase food consistency and variety as the infant gets older, adapting to the infant’s
requirements and abilities.
7. Increase the number of times that the child is fed complementary foods as he/she gets older.
8. Feed a variety of foods to ensure that nutrient needs are met.
9. Use fortified complementary foods or vitamin-mineral supplements for the infant, as needed.
10. Increase fluid intake during illness, including more frequent breastfeeding, and encourage the child to eat
soft, varied, appetizing, and favorite foods. After illness, give food more often than usual and encourage
child to eat more.
Guiding principles for feeding non-breastfed children of 6–24 months of age:
1. Ensure that energy needs are met.
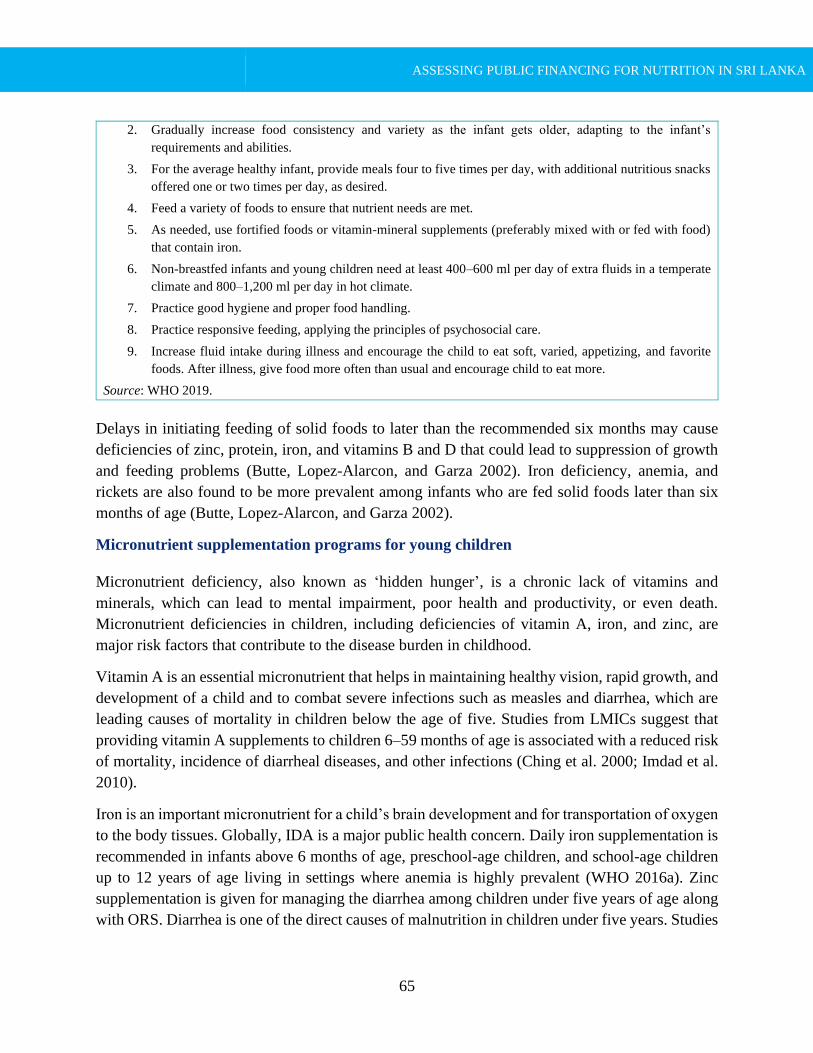
ASSESSING PUBLIC FINANCING FOR NUTRITION IN SRI LANKA
65
2. Gradually increase food consistency and variety as the infant gets older, adapting to the infant’s
requirements and abilities.
3. For the average healthy infant, provide meals four to five times per day, with additional nutritious snacks
offered one or two times per day, as desired.
4. Feed a variety of foods to ensure that nutrient needs are met.
5. As needed, use fortified foods or vitamin-mineral supplements (preferably mixed with or fed with food)
that contain iron.
6. Non-breastfed infants and young children need at least 400–600 ml per day of extra fluids in a temperate
climate and 800–1,200 ml per day in hot climate.
7. Practice good hygiene and proper food handling.
8. Practice responsive feeding, applying the principles of psychosocial care.
9. Increase fluid intake during illness and encourage the child to eat soft, varied, appetizing, and favorite
foods. After illness, give food more often than usual and encourage child to eat more.
Source: WHO 2019.
Delays in initiating feeding of solid foods to later than the recommended six months may cause
deficiencies of zinc, protein, iron, and vitamins B and D that could lead to suppression of growth
and feeding problems (Butte, Lopez-Alarcon, and Garza 2002). Iron deficiency, anemia, and
rickets are also found to be more prevalent among infants who are fed solid foods later than six
months of age (Butte, Lopez-Alarcon, and Garza 2002).
Micronutrient supplementation programs for young children
Micronutrient deficiency, also known as ‘hidden hunger’, is a chronic lack of vitamins and
minerals, which can lead to mental impairment, poor health and productivity, or even death.
Micronutrient deficiencies in children, including deficiencies of vitamin A, iron, and zinc, are
major risk factors that contribute to the disease burden in childhood.
Vitamin A is an essential micronutrient that helps in maintaining healthy vision, rapid growth, and
development of a child and to combat severe infections such as measles and diarrhea, which are
leading causes of mortality in children below the age of five. Studies from LMICs suggest that
providing vitamin A supplements to children 6–59 months of age is associated with a reduced risk
of mortality, incidence of diarrheal diseases, and other infections (Ching et al. 2000; Imdad et al.
2010).
Iron is an important micronutrient for a child’s brain development and for transportation of oxygen
to the body tissues. Globally, IDA is a major public health concern. Daily iron supplementation is
recommended in infants above 6 months of age, preschool-age children, and school-age children
up to 12 years of age living in settings where anemia is highly prevalent (WHO 2016a). Zinc
supplementation is given for managing the diarrhea among children under five years of age along
with ORS. Diarrhea is one of the direct causes of malnutrition in children under five years. Studies

ASSESSING PUBLIC FINANCING FOR NUTRITION IN SRI LANKA
66
show that zinc supplementation could help reduce the duration and severity of diarrhea. Therefore,
zinc supplementation is considered as an important intervention in preventing acute malnutrition.
Treatment and management of infants and young children with MAM/SAM
As per the WHO guidelines, children with MAM/SAM should receive supplementary/therapeutic
feeding and care either as inpatients (if there are medical complications) or as outpatients in their
communities (if there are no medical complications). Figure 38 shows the differences in definition
of MAM and SAM.
Figure 38: MAM versus SAM
Source: Bernardette 2019.
Note: MUAC = Mid-upper arm circumference; WHZ = Weight-for-height Z score.
Both MAM and SAM have serious consequences, contributing to increased morbidity and
mortality, impaired intellectual development, suboptimal adult work capacity, and increased risk
of disease in young children. Since the United Nations (UN) agencies issued their first-ever joint
statement on community-based management of wasting and other forms of acute malnutrition, the
total number of children receiving care has grown from just over 1 million in 2009 to almost 10
million in 2018. This collective success has been primarily driven by the efforts of national health
systems which, with the support of UNICEF and other UN agencies, civil society organizations,
and academic partners, have adopted solutions to simplify the way wasted children are found,
treated, and cared for. Guidelines on management of wasted and severely wasted children are
provided by the WHO (2013).
Interventions targeting adolescent nutrition
Adolescence is a period of rapid physical, social, and development changes (Story, Neumark-
Sztainer, and French 2002). The accelerated growth rate during puberty increases the need for
energy and nutrients to sustain healthy development. At the same time, adolescents are
increasingly exposed to influences on their eating behaviors (Banna et al. 2016) and have
increasing autonomy over their food choices (Basset, Chapman, and Beagan 2007) and use of

ASSESSING PUBLIC FINANCING FOR NUTRITION IN SRI LANKA
67
leisure time. As a result, adolescence is a nutritionally vulnerable time during which both dietary
excess and insufficiency can be common. Eating and physical activity behaviors established in
adolescence are known to continue into adulthood and may contribute to nutrition-related
problems that have consequences for their long-term health (Kelder et al. 1994; Singh et al. 2008).
It is suggested that adolescents avoid foods that are high in fat (saturated and trans fat); foods with
added sodium and sugars (including sweetened beverages); and fast foods high in energy, fat, and
sodium and low in nutrient density (WHO 2018). Multidimensional programs that integrate
traditional health education approaches within broader mental health promotion strategies appear
to have promising outcomes in improved adolescent nutrition practices (WHO 2018). Evidence
also suggests that regular physical activity is fundamental for energy balance, weight control,
prevention of obesity (WHO 2007, 2014c), development of musculoskeletal tissues and
enhancement of bone health, the cardiovascular system and neuromuscular awareness, and
reduction of symptoms of anxiety and depression (WHO 2014b). Another strategy which is crucial
for the health and well-being of women, children, and adolescents is to prevent unintended
pregnancies and reduce adolescent childbearing through universal access to sexual and
reproductive health care.
Women’s nutrition
A woman who is healthy at the time of conception gives birth to a healthy child. Therefore, the
nutritional status of women at the time of conception and during pregnancy plays a vital role in
determining the health of the mother and ensuring healthy fetal growth and development. Evidence
shows that maternal anemia, particularly during pregnancy, is an important contributor to both
maternal mortality (23 percent of total deaths) and morbidity. Maternal iron deficiency is
associated with LBW, which is a common predictor of wasting and the concurrence of wasting
and stunting in the region (Torlesse and Augayo 2018). Calcium deficiency is also known to
increase the risk of pre-eclampsia, currently the second leading cause of maternal mortality (19
percent of total deaths). Therefore, addressing these deficiencies could substantially reduce the
risk of maternal deaths. Further, maternal overweight and obesity have also shown to be associated
with maternal morbidity, preterm birth, increased infant mortality, and increase in the risk of
childhood obesity that continues into adolescence and early adulthood, heightening the
transgenerational transmission of obesity. Table 6 provides the list of nutrition interventions
recommended by the WHO.
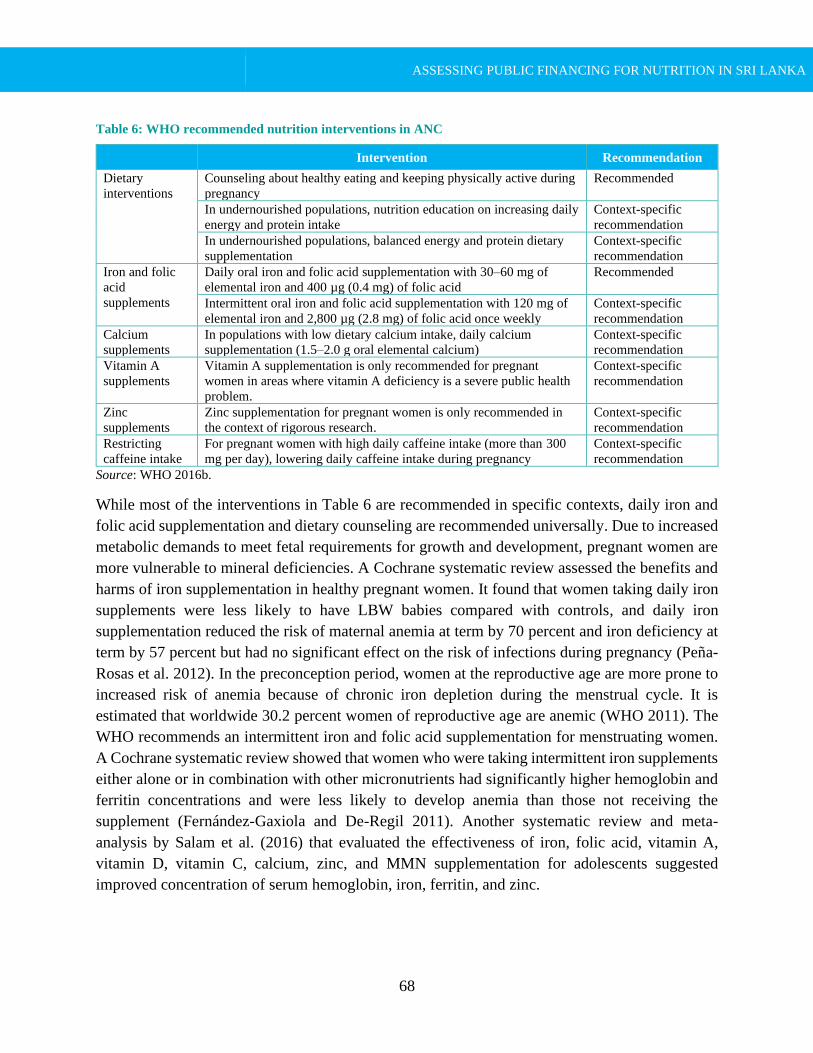
ASSESSING PUBLIC FINANCING FOR NUTRITION IN SRI LANKA
68
Table 6: WHO recommended nutrition interventions in ANC
Intervention Recommendation
Dietary
interventions
Counseling about healthy eating and keeping physically active during
pregnancy
Recommended
In undernourished populations, nutrition education on increasing daily
energy and protein intake
Context-specific
recommendation
In undernourished populations, balanced energy and protein dietary
supplementation
Context-specific
recommendation
Iron and folic
acid
supplements
Daily oral iron and folic acid supplementation with 30–60 mg of
elemental iron and 400 µg (0.4 mg) of folic acid
Recommended
Intermittent oral iron and folic acid supplementation with 120 mg of
elemental iron and 2,800 µg (2.8 mg) of folic acid once weekly
Context-specific
recommendation
Calcium
supplements
In populations with low dietary calcium intake, daily calcium
supplementation (1.5–2.0 g oral elemental calcium)
Context-specific
recommendation
Vitamin A
supplements
Vitamin A supplementation is only recommended for pregnant
women in areas where vitamin A deficiency is a severe public health
problem.
Context-specific
recommendation
Zinc
supplements
Zinc supplementation for pregnant women is only recommended in
the context of rigorous research.
Context-specific
recommendation
Restricting
caffeine intake
For pregnant women with high daily caffeine intake (more than 300
mg per day), lowering daily caffeine intake during pregnancy
Context-specific
recommendation
Source: WHO 2016b.
While most of the interventions in Table 6 are recommended in specific contexts, daily iron and
folic acid supplementation and dietary counseling are recommended universally. Due to increased
metabolic demands to meet fetal requirements for growth and development, pregnant women are
more vulnerable to mineral deficiencies. A Cochrane systematic review assessed the benefits and
harms of iron supplementation in healthy pregnant women. It found that women taking daily iron
supplements were less likely to have LBW babies compared with controls, and daily iron
supplementation reduced the risk of maternal anemia at term by 70 percent and iron deficiency at
term by 57 percent but had no significant effect on the risk of infections during pregnancy (Peña-
Rosas et al. 2012). In the preconception period, women at the reproductive age are more prone to
increased risk of anemia because of chronic iron depletion during the menstrual cycle. It is
estimated that worldwide 30.2 percent women of reproductive age are anemic (WHO 2011). The
WHO recommends an intermittent iron and folic acid supplementation for menstruating women.
A Cochrane systematic review showed that women who were taking intermittent iron supplements
either alone or in combination with other micronutrients had significantly higher hemoglobin and
ferritin concentrations and were less likely to develop anemia than those not receiving the
supplement (Fernández-Gaxiola and De-Regil 2011). Another systematic review and meta-
analysis by Salam et al. (2016) that evaluated the effectiveness of iron, folic acid, vitamin A,
vitamin D, vitamin C, calcium, zinc, and MMN supplementation for adolescents suggested
improved concentration of serum hemoglobin, iron, ferritin, and zinc.

ASSESSING PUBLIC FINANCING FOR NUTRITION IN SRI LANKA
69
Fortified food supplements
Cereals are the major source of energy and other nutrients for most modern societies worldwide.
Wheat, maize, and rice represent the most important cereal crops; if they are fortified appropriately
and implemented, it is an efficient, simple, and inexpensive strategy for supplying vitamins and
minerals to the diets of large segments of the population. This supplement can be fortified with
various micronutrients and vitamins such as iron, folic acid, vitamin A, vitamin D, zinc, calcium,
retinol, iodine, copper, and so on. However, the direct benefits of such fortified supplements do
not have strong evidence (WHO 2016c). Iodization of salt is another intervention that is widely
practiced to prevent iodine deficiency disorders. A systematic review has shown to reduce the risk
of goiter, cretinism, low cognitive function, and iodine deficiency (Aburto et al. 2014).
Nutrition-sensitive interventions and programs
This section covers interventions from sectors that have evidence base on nutritional outcomes
including health, agriculture, social services and protection, early childhood development,
education, and WASH. The programs reviewed in this section generally have several objectives
such as raising income, food security, women’s empowerment, and nutrition.
Agriculture programs
The growth in the agriculture sector has been shown to be associated with a reduction in
undernutrition. Hoddinott, Rosegrant, and Torero (2013) demonstrated that an extra investment of
US$8 billion per year globally would reduce the number of hungry people by 210 million and
reduce the number of underweight children by 10 million by 2050. Evidence also suggests that
targeted agricultural programs are more successful when they incorporate strong behavior change
communications strategies and a gender equity focus, especially for women engagement and
empowerment (Hoddinott, Rosegrant, and Torero 2013).

ASSESSING PUBLIC FINANCING FOR NUTRITION IN SRI LANKA
70
Box 7: Pathways by which agriculture can affect nutrition outcomes
• A source of food. Agriculture increases household availability and access to food from own production.
• A source of income. Agriculture increases income from wages earned by agricultural workers or through
the marketing of agriculture commodities produced.
• Food prices. Agricultural policies (national and global) affect a range of supply and demand factors that
establish the price of marketed food and non-food crops; this price, in turn, affects the income of net seller
households, the purchasing power of net buyers, and the budget choices of both.
• Women’s social status and empowerment. Women’s participation in agriculture can affect their access
to, or control over, resources and assets and increase their decision-making power regarding intra-
household allocation of food, health, and care.
• Women’s time. Women’s participation in agriculture can affect their time allocation and the balance
between time spent in income-generating activities and time allocated to household management and
maintenance, caregiving, and leisure.
• Women’s own health and nutritional status. Women’s participation in agriculture can affect their health
(for example, through exposure to agriculture-associated diseases) and nutritional requirements (for
example, through increased energy expenditure); their health and nutritional status can, in turn, affect their
agricultural productivity and hence their income from agriculture.
Source: World Bank 2007; Gillespie, Harris, and Kadiyala 2012.
Home gardens and homestead food production programs
An intervention that has been promoted in a number of LMICs by the agriculture sector is home
garden and homestead food production programs.11 Although several studies have investigated the
effects of homestead food production programs on maternal or child nutritional status
(anthropometry or micronutrient status), evidence is limited. A meta-analysis pooling studies from
four countries that examined the effects of agricultural interventions on nutritional status of
children has shown that vitamin A status as measured by serum retinol concentration had a small
difference between the intervention and control arms (0.08 μmol/L) (Masset et al. 2012). A cluster
randomized effectiveness study that examined the effects of the introduction of β carotene-rich
orange sweet potato in rural Uganda showed a 9.5 percent point reduction in the prevalence of low
serum retinol (<1.05 μmol/L) among children ages 3–5 years at baseline (Hotz et al. 2012).
Another study conducted in a resource poor area of Mozambique investigated the effects of
introduction of orange-fleshed sweet potato in an integrated agriculture and nutrition intervention
that aimed to increase vitamin A intake and serum retinol concentrations in young children. The
quasi-experimental intervention study followed households of 741 children (mean age 13 months
at baseline) through two agricultural cycles and found that vitamin A intake was significantly
higher among the intervention arm (median 426 versus 56 µg retinol activity equivalent). Another
impact pathway-focused assessment of a homestead food production system in Cambodia did not
11 The important distinction between home gardening and homestead food production is that the latter involves rearing of small
livestock, for example, chickens, which are an important source of nutrient-rich animal source foods.
ASSESSING PUBLIC FINANCING FOR NUTRITION IN SRI LANKA
71
show any effects on child anthropometry or anemia despite effects on improved household
production.
Biofortification
Another unique nutrition-sensitive intervention in the agriculture sector is biofortification, which
focuses on breeding of staple crops that are rich in essential micronutrients. All biofortified crops
have favorable agronomic qualities, including equal or higher yields than common varieties, and
greater disease resistance and drought tolerance. The advantage of this approach is well
documented (Ruel, Alderman, and Maternal and Child Nutrition Study Group 2013). However,
biofortification alone does not achieve high concentration of micronutrients that are needed for
treating severe deficiency cases or to fulfil the high nutritional requirements.
Box 8: Three milestones to be achieved for a successful biofortification program
1. Breeding objectives (minimum target concentration for each micronutrient) must be met.
2. Retention and bioavailability of micronutrients must be satisfactory so that intake leads to expected
improvements in status.
3. Farmer adoption rates and intakes by target populations must be adequate.
HarvestPlus is a program that has led a global effort to breed and disseminate staple food
biofortified with vitamin A, zinc, and iron in seven crops including cassava, maize, sweet potato,
bean, pearl millet, rice, and wheat. In 2017, a biofortified high-iron pearl millet program
demonstrated functional cognitive improvements that could profoundly affect women and teens’
daily lives, including their ability to succeed at school and work. In India, adolescents who
consumed biofortified pearl millet twice daily as bhakri (a local flatbread) or shev (a savory snack)
for six months significantly improved their learning and mental abilities related to perception,
attention, and memory (HarvestPlus 2019). Another two effectiveness trials in Uganda and
Mozambique (milestone three), which assessed the effects of rolling out orange sweet potato,
showed a favorable adoption by farmers and significant increases in vitamin A intake in both
countries. Iron-biofortified rice and beans were also associated with improved iron status.
Social protection programs
Social protection—a set of policies and programs aimed at preventing or protecting all people
against poverty, vulnerability, and social exclusion throughout their life courses, with a particular
emphasis toward vulnerable groups (UNICEF 2019)—provides a unique opportunity to improve
maternal and child nutrition outcomes.
Cash transfer
Among the nutrition-sensitive interventions, cash transfer programs have gained attention
worldwide partly due to the scale at which they are expanding and partly due to their proven impact
ASSESSING PUBLIC FINANCING FOR NUTRITION IN SRI LANKA
72
on poverty, inequality, and food insecurity. A UNICEF mapping exercise of social protection
broadly suggests that 108 countries (out of 136 countries surveyed) either had an active social
protection policy or strategy document in place or were planning such a document (UNICEF
2019). The rate of expansion is remarkable. In 1997, only two countries had introduced conditional
cash transfer (CCT) programs, while by 2015 the number had grown to 64 and, even more rapidly,
the number of countries in Africa with unconditional cash transfers doubled from 20 to 40 between
2010 and 2015. In LMICs, the share of government expenditures devoted to social protection has
been growing more rapidly than investments in other sectors (Alderman 2015).
The impacts of social protection, in particular cash transfers, on intermediate nutrition outcomes
are well established. Cash transfers not only raise the living standards of beneficiary households
but also enable parents and caregivers to invest more in their children. The most direct effect of a
cash transfer is the increased level of resources in the beneficiary household, which, assuming
equitable intra-household distribution, improves the standard of living of all members of the
household, including children. Evidence shows that food consumption and diet diversification are
a major focus of expenditure when families living in poverty receive social transfers (cash and
food transfers) (UNICEF 2019). Cash transfers therefore promote realization of Articles 26 and 27
of the Convention on the Rights of the Child (CRC) on the rights to social security and an adequate
standard of living. However, the impacts of cash transfers go far beyond the direct revenue effect
on beneficiaries’ level of consumption. They also have indirect knock-on effects on a wide range
of other rights, including those to food security, adequate nutrition, and access to basic social
services, such as education and health. Social protection has been shown to have a significant
impact both on the usage of health services and on mitigating the financial impact of a health crisis
in a household, as well as on uptake of health services (UNICEF 2019).
Where the empirical evidence is less clear is on the overall effects of cash transfers on final
nutrition outcomes, such as stunting and wasting rates. This is in large part because comparative
analysis of the nutritional impact of different programs, in different countries, is hindered by
differences in the nature of the programs. Evidence on the nutrition impacts of cash transfer
programs is available for programs in several countries, some of which have conditionalities, and
others are unconditional. In some programs, the transfers are accompanied by direct nutrition
interventions, such as the distribution of foods fortified with micronutrients, as in the Mexican
program Oportunidades, or the provision of micronutrient supplements, as in Nicaragua’s Red de
Protección Social. Adding to the complexity, the different studies measure nutrition impacts in
different age ranges (from 0–5 months up to 0–59 months), giving results that are therefore not
strictly comparable.
Evidence on cash transfer programs’ impact on nutrition is often derived from experimental or
quasi-experimental impact evaluations. Comparing evidence from evaluations of six programs in
ASSESSING PUBLIC FINANCING FOR NUTRITION IN SRI LANKA
73
middle-income countries,12 focusing on the impact of cash transfers on stunting, shows that most
but not all programs have helped reduce stunting. Programs in Mexico, Nicaragua, Colombia, and
South Africa have had a substantial positive and statistically significant impact on stunting,
although this has not been the case in Honduras and Brazil. Programs are more likely to reduce
stunting when they target households with very young children (under two years old) and transfer
amounts are quite large. Comparative studies (Leroy et al. 2010; Manley, Gitter, and Slavchevska
2011) show that cash transfers tend to have larger impacts on consumption expenditure, including
food expenditure, on beneficiaries’ poverty rates, and on the quality or diversity of food
consumed.13 Many also have impacts on child nutrition, but this is not always the case.
While evidence shows benefits of both conditional and unconditional transfers, evidence on the
added value of condition is mixed (UNICEF 2019). CCTs aim to incentivize households to invest
in health, nutrition, and education of their children (enhancing human capital) by providing cash
conditional to the utilization of certain services. Most CCTs target transfers to women on the
premise that it will lead to greater investments in nutritional status of children at each household
level. CCTs in Latin America have shown positive effects on poverty reduction, household food
consumption, and diversifying diet (Leroy et al. 2010; Manley, Gitter, and Slavchevska 2012).
The review conducted by Gaarder, Glassman, and Todd (2010) found that CCTs were associated
with increased use of preventive and curative health and nutrition services in almost all studies
analyzed. Studies from Mexico, Brazil, and Nicaragua (Adato et al. 2000; Adato and Hoddinott
2010; Skoufifias and McClafferty 2001) have indicated improvements in women’s control over
additional resources, enhanced self-esteem, heightened knowledge and awareness of health and
nutrition, and increased opportunities for women to strengthen their social networks.
Unconditional transfers, on the other hand, are given either as cash or in kind with so-called soft
conditions, which may facilitate behavior change communications or social marketing to
encourage health-seeking behavior in households. A randomized trial from Burkina Faso showed
that clinic visits have increased in cash programs provided with health conditionality, whereas it
did not in unconditional cash transfer (Akresh, De Walque, and Kazianga 2012). This implies that
unconditional transfer programs may be less effective in facilitating behavior change.
It is noteworthy, however, that one of the cash transfer programs with significant impacts on
stunting, the South African Child Support Grant, is unconditional. This program shows that cash
transfers can have a substantial impact on child nutrition from their income effect alone (Agüero,
Carter, and Woolard 2007). A meta-analysis of the nutritional impacts of 17 cash transfer
programs, including 5 without any conditionality, found that programs with conditionalities do no
12 The six programs examined were Child Support Grant in South Africa; ‘Oportunidades’ (ex-PROGRESA) in Mexico; ‘Red de
Protección Social’ (Social Protection Net) in Nicaragua; ‘Familias en Acción’ (Families in Action) in Colombia; ‘Programa de
Asignación Familiar’ (Family Allowance Program) in Honduras; and ‘Bolsa Alimentação’ (Food Grant) in Brazil, which was
subsequently integrated into the larger ‘Bolsa Família’ program. 13 A notable exception is the program in Honduras, where the transfer amount was particularly low.
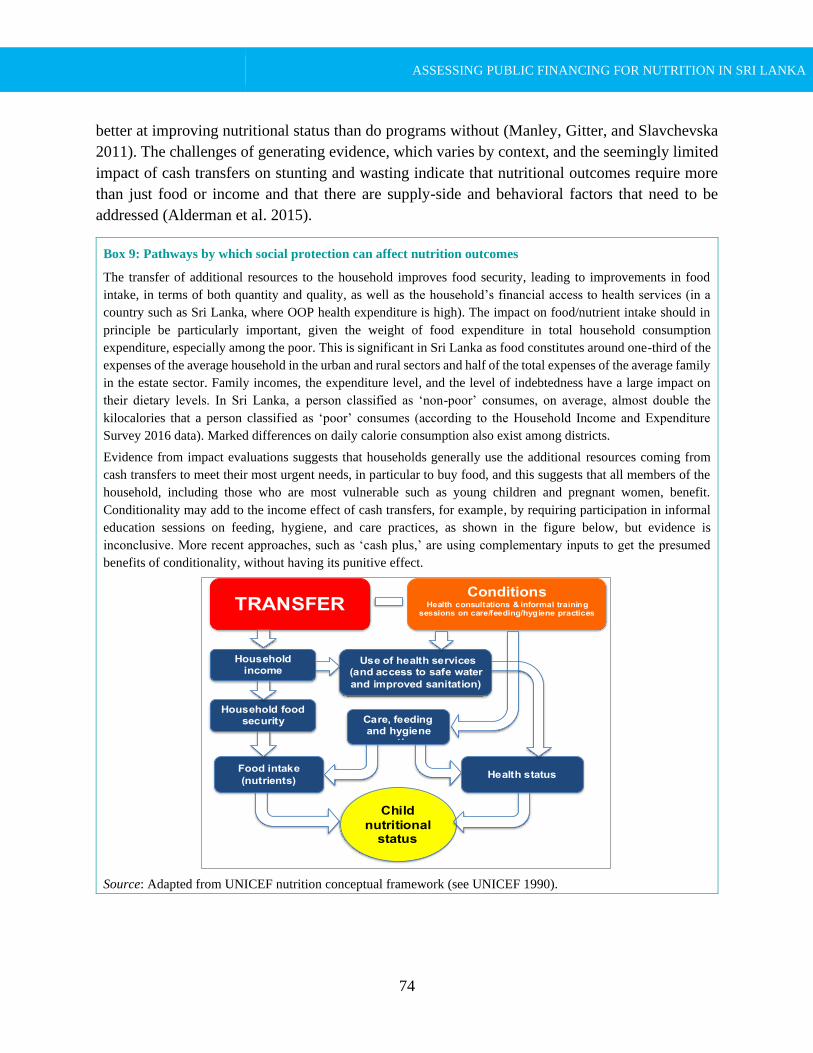
ASSESSING PUBLIC FINANCING FOR NUTRITION IN SRI LANKA
74
better at improving nutritional status than do programs without (Manley, Gitter, and Slavchevska
2011). The challenges of generating evidence, which varies by context, and the seemingly limited
impact of cash transfers on stunting and wasting indicate that nutritional outcomes require more
than just food or income and that there are supply-side and behavioral factors that need to be
addressed (Alderman et al. 2015).
Box 9: Pathways by which social protection can affect nutrition outcomes
The transfer of additional resources to the household improves food security, leading to improvements in food
intake, in terms of both quantity and quality, as well as the household’s financial access to health services (in a
country such as Sri Lanka, where OOP health expenditure is high). The impact on food/nutrient intake should in
principle be particularly important, given the weight of food expenditure in total household consumption
expenditure, especially among the poor. This is significant in Sri Lanka as food constitutes around one-third of the
expenses of the average household in the urban and rural sectors and half of the total expenses of the average family
in the estate sector. Family incomes, the expenditure level, and the level of indebtedness have a large impact on
their dietary levels. In Sri Lanka, a person classified as ‘non-poor’ consumes, on average, almost double the
kilocalories that a person classified as ‘poor’ consumes (according to the Household Income and Expenditure
Survey 2016 data). Marked differences on daily calorie consumption also exist among districts.
Evidence from impact evaluations suggests that households generally use the additional resources coming from
cash transfers to meet their most urgent needs, in particular to buy food, and this suggests that all members of the
household, including those who are most vulnerable such as young children and pregnant women, benefit.
Conditionality may add to the income effect of cash transfers, for example, by requiring participation in informal
education sessions on feeding, hygiene, and care practices, as shown in the figure below, but evidence is
inconclusive. More recent approaches, such as ‘cash plus,’ are using complementary inputs to get the presumed
benefits of conditionality, without having its punitive effect.
Source: Adapted from UNICEF nutrition conceptual framework (see UNICEF 1990).
Food intake
(nutrients)
Child
nutritional status
Health status
Household food security
Household income
TRANSFER
Use of health services (and access to safe water
and improved sanitation)
Care, feeding and hygiene
practices
Conditions Health consultations & informal training
sessions on care/feeding/hygiene practices
ASSESSING PUBLIC FINANCING FOR NUTRITION IN SRI LANKA
75
Social safety nets
Social safety net programs transfer funds to low-income households. The programs often aim to
raise the income levels of vulnerable population to enhance resilience against loss of assets in
times of crises. Transfers can be in the form of cash or in kind (food). Approximately 1.75 billion
people in LMICs receive cash support (DFID 2011) and the coverage varies from country to
country. For instance, Ethiopia’s Productive Safety Net Program reached 10 percent of the
country’s population (World Bank 2012), while transfer programs in Brazil and Mexico reached
25 percent and in Ecuador 40 percent (Fiszbein et al. 2009).
School feeding programs
Another type of conditional transfer program is the school feeding program. Although the
relationship between the program and the nutritional status of the targeted children is less evident,
the program can reduce hunger and stimulate learning of children at school and thus have been
widely implemented in nearly every country in the world (Bundy, Drake, and Burbano 2012). A
meta-analysis conducted by Kristjansson et al. (2007) suggested no significant anthropometric
effects in school children, and hence major improvements in height cannot be expected in school
children through this program. Conversely, school meals had a small effect on weight gain that
can have either a positive (in underweight) or a negative (in obese) impact.
Sometimes the school meal programs can benefit the other members of a child’s family, when
children are allowed to take the food back home (Afridi 2010). A few randomized control studies
in Uganda and Burkina Faso have shown increased weights among preschool boys (under five
years) whose siblings received either school meal or take home ration compared to the control
group (Kazianga, De Walque, and Alderman 2009). If designed according to needs, school feeding
programs also have the potential to improve micronutrient status. A review of randomized studies
of iron-rich school meals (fortified or provision of animal-source foods) demonstrated improved
iron status of adolescent girls, irrespective of the initial status (Adelman, Gilligan, and Lehrer
2008).
In-kind household food distribution
Due to the associated high cost, in-kind household food distributions have become less popular in
the past decades. This type of program is primarily used during an emergency response or in places
where the logistics of cash transfers are constrained. Sometimes these kinds of programs also
provide micronutrient fortified foods (for example, corn soy or wheat soy blend) to mothers and
young children in addition to general family rations. In Haiti, for instance, such rations were
provided to all mothers and children within the first 1,000 days that showed greater effects on child
growth than did targeting of underweight children under five (Ruel et al. 2008). Another similar
program which provided iron-fortified micronutrient powders reduced anemia prevalence by half

ASSESSING PUBLIC FINANCING FOR NUTRITION IN SRI LANKA
76
in as short a time as two months (Menon et al. 2007). However, these in-kind food transfer
programs can sometimes have unintended effects on overweight and obesity when the energy
contribution of the food basket exceeds the energy gap in the targeted population (Leroy et al.
2010, 2013).
Transfer programs in emergencies
These types of programs usually combine nutritionally enhanced complementary foods with
family rations or cash for pregnant and lactating women and their young children. If the transfers
are provided as targeted programs, they can aid in preventing major deteriorations in child
undernutrition during disasters or other emergency situations (Giles and Satriawan 2010; Yamano,
Alderman, and Christiaensen 2005).
Nurturing care
Recently, the Lancet Series on Early Childhood Development published new evidence that
supports the concept of ‘nurturing care’ as a stable environment that is sensitive to children’s health
and nutritional needs, with interactions that are responsive, emotionally supportive, and
developmentally stimulating. ‘Nurturing care’—defined as health, nutrition, security and safety,
responsive caregiving, and early learning—should be provided by parent and family interactions
and supported by an environment that enables these interactions. Holistic approach involving
families through service providers across many sectors—for example, health, nutrition, education,
water and sanitation, social protection—is therefore critical to enable young children to thrive.
Figure 39: Supporting families for nurturing care and home visiting resource package
Source: UNICEF and ISSA 2016.
ASSESSING PUBLIC FINANCING FOR NUTRITION IN SRI LANKA
77
The nurturing care framework was developed by the WHO, UNICEF, and the World Bank, in
collaboration with the Partnership for Maternal, Newborn and Child Health, the Early Childhood
Development Action Network to guide the program designs and implementation.
A program in Jamaica that provided both child stimulation and food supplementation for stunted
children ages between 9 and 24 months showed improvements in cognitive development
(Grantham-McGregor et al. 1991). A program from Bangladesh, which included stimulation and
home visits in addition to standard nutrition and health care for severely malnourished children,
has demonstrated better development outcomes and weight-for-age Z score (WAZ) (Nahar et al.
2009). Likewise, another study from Bangladesh that included responsive parenting (including
feeding) to an informal nutrition and child development education program showed improvements
in feeding and parenting, behavioral changes, child self-feeding, and development outcomes
(Aboud and Akhter 2011). Another intervention from Jamaica that provided zinc supplementation
and responsive stimulation intervention in underweight children showed synergistic effects on
child development compared to the control groups (Gardner et al. 2005). Reducing maternal
depression is another way that could address risk factors that are common to both nutrition and
child development (Black et al. 2009; Surkan et al. 2011). Early childhood development programs
can have various focuses and forms, and hence the potential contributions to nutrition depend on
what activities are included.
School education
The level of school education is a strong predictor of nutritional status of the next generation. The
impact of schooling on nutritional improvement can take a number of causal pathways such as by
(a) providing information on health and nutrition directly to the individuals and communities; (b)
assisting caregivers in acquiring information and nutrition knowledge through teaching numeracy
and literacy to their children; (c) exposing individuals to new environments that could enhance
receptiveness to modern medicine; (d) imparting self-confidence that can enhance women’s role
in decision making and interactions with health care professionals; and (e) providing women with
the opportunity to form social networks, which can be of particular importance in isolated rural
areas (Ruel, Alderman, and Maternal and Child Nutrition Study Group 2013).
Water, sanitation, and hygiene
Poor WASH can increase the risk of infection, which could lead to a vicious cycle of poor health,
poor absorption of nutrients, and reduced immune system. A major direct cause of undernutrition
in addition to inadequate diet is disease (Black et al. 2008; UNICEF 1990). Good hygiene
practices, safe water, and sanitation are crucial for maintaining good nutritional status primarily
by reducing infection and diseases.
ASSESSING PUBLIC FINANCING FOR NUTRITION IN SRI LANKA
78
WASH programs can potentially contribute to nutritional improvements in various pathways that
include
(a) Reduction of diarrheal diseases due to reduced fecal contacts with improved environment
(Checkley et al. 2004; Esrey 1996; Fink et al. 2011)—handwashing with soap can reduce
the risk of diarrhea by 40 percent (Freeman et al. 2014);
(b) Reduction of enteric infections due to reduced fecal contacts with improved environment
(Lin et al. 2013);
(c) Reduced exposure and infection with protozoa and helminths due to improved environment
(Barreto et al. 2010; Goto, Mascie-Taylor, Lunn 2009; Moraes et al. 2004; Ziegelbauer et
al. 2012); and
(d) Reduction in time spent fetching water and caring for sick children and time and costs of
seeking treatment (Pickering and Davis 2012).
However, findings from recent randomized controlled studies in three countries (Bangladesh,
Kenya, and Zimbabwe) suggested a different story. In Bangladesh, water, sanitation, and hygiene
interventions implemented individually or combined did not provide favorable evidence of
improvements in growth, although diarrheal diseases reduced (Luby et al. 2018). The trial in Kenya
found limited improvements of growth with WASH interventions at one year post intervention but
no effects at two years and no effects on diarrheal diseases (Stewart et al. 2018). Similarly, the
study in Zimbabwe did not demonstrate any effect of WASH on diarrheal diseases or growth
(Humphrey et al. 2019). Multiple interpretations of the negative results from the trials are possible.
However, one that likely stands out is that the WASH intervention alone was not sufficient to
reduce fecal contamination.
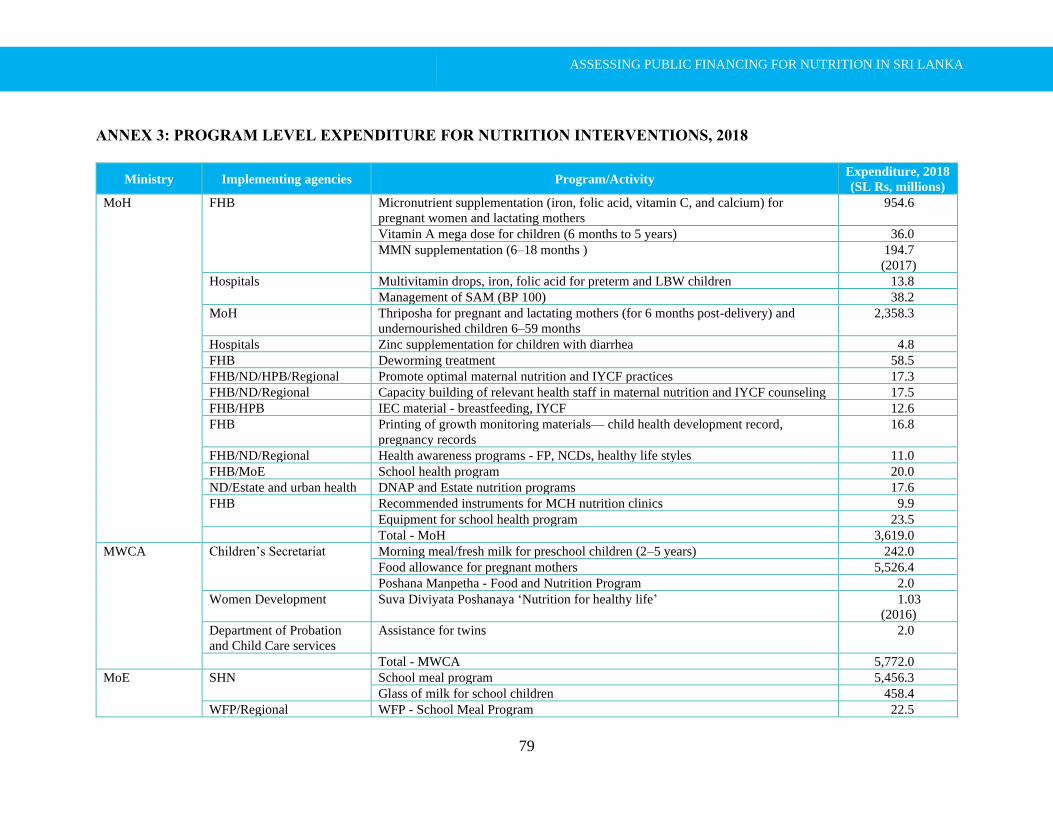
ASSESSING PUBLIC FINANCING FOR NUTRITION IN SRI LANKA
79
ANNEX 3: PROGRAM LEVEL EXPENDITURE FOR NUTRITION INTERVENTIONS, 2018
Ministry Implementing agencies Program/Activity Expenditure, 2018
(SL Rs, millions)
MoH FHB Micronutrient supplementation (iron, folic acid, vitamin C, and calcium) for
pregnant women and lactating mothers
954.6
Vitamin A mega dose for children (6 months to 5 years) 36.0
MMN supplementation (6–18 months ) 194.7
(2017)
Hospitals Multivitamin drops, iron, folic acid for preterm and LBW children 13.8
Management of SAM (BP 100) 38.2
MoH Thriposha for pregnant and lactating mothers (for 6 months post-delivery) and
undernourished children 6–59 months
2,358.3
Hospitals Zinc supplementation for children with diarrhea 4.8
FHB Deworming treatment 58.5
FHB/ND/HPB/Regional Promote optimal maternal nutrition and IYCF practices 17.3
FHB/ND/Regional Capacity building of relevant health staff in maternal nutrition and IYCF counseling 17.5
FHB/HPB IEC material - breastfeeding, IYCF 12.6
FHB Printing of growth monitoring materials— child health development record,
pregnancy records
16.8
FHB/ND/Regional Health awareness programs - FP, NCDs, healthy life styles 11.0
FHB/MoE School health program 20.0
ND/Estate and urban health DNAP and Estate nutrition programs 17.6
FHB Recommended instruments for MCH nutrition clinics 9.9
Equipment for school health program 23.5
Total - MoH 3,619.0
MWCA Children’s Secretariat Morning meal/fresh milk for preschool children (2–5 years) 242.0
Food allowance for pregnant mothers 5,526.4
Poshana Manpetha - Food and Nutrition Program 2.0
Women Development Suva Diviyata Poshanaya ‘Nutrition for healthy life’ 1.03
(2016)
Department of Probation
and Child Care services
Assistance for twins 2.0
Total - MWCA 5,772.0
MoE SHN School meal program 5,456.3
Glass of milk for school children 458.4
WFP/Regional WFP - School Meal Program 22.5

ASSESSING PUBLIC FINANCING FOR NUTRITION IN SRI LANKA
80
Ministry Implementing agencies Program/Activity Expenditure, 2018
(SL Rs, millions)
MoE School Health Promotion Program 7.2
School WASH 344.2
Total - MoE 6,289.0
MPISE Samurdhi Development Samurdhi welfare 39,239.0
MoA MoA FPNP 918.0
MoA/Regional Home gardening promotion and apiculture control project 29.8
Food crop production and improvement 147.3
Establishment of fruit village 9.6
Regional Promotion of alternative crops 15.8
Encourage the production and use of organic fertilizer 11.8
Commercial farming and agrobusiness development 20.5
MoA/Regional Farm mechanization program 65.1
(2017)
Regional Good Agricultural Practices 7.3
Post-harvest technology development projects 5.9
MoA Fertilizer subsidy 26,879.0
E-agriculture - agricultural database 14.0
MoA/Regional ‘Gamdora’ - gathering information of farming crops 4.0
Regional Research and technical development program 3.7
Agriculture exhibition and community awareness 11.6
MoA/Regional Hela Bojun' sales centers - changing food consumption patterns 14.8
Regional Supply of equipment, machinery, and so on 65.1
MoA/Regional Minor irrigation and renovation of small tanks 2,098.0
Regional Infrastructure facility improvement - stores and so on 29.5
Regional Construction of training centers 66.2
Total – MoA 30,352.0
MLRD MLRD/Regional Establishment of Animal Breeder Farms 113.2
DAPH livestock program 324.6
National food production program 96.5
Facilitation and Promotion of Liquid Milk Consumption 79.6
Development of Small and Medium Scale Poultry Farming System 33.5
Swine Industry Development 7.0
Farmer training and promotion 13.5
Provision of farm equipment 17.2
DAPH Construction - milk stalls, food demonstration unit 0.8

ASSESSING PUBLIC FINANCING FOR NUTRITION IN SRI LANKA
81
Ministry Implementing agencies Program/Activity Expenditure, 2018
(SL Rs, millions)
Total - MLRD 686.0
MFARD NAQDA National Food Production Program 221.1
Develop Inland Fisheries-Stocking of Fish Fingerlings, enhancing breeding capacity 237.5
FSDD Assistance for introducing new technology 8.3
Fishery community empowerment 115.0
Coastal rehabilitation and resources management program 75.3
Improvement of fishery villages in 10 costal districts 218.6
Establishment of integrated inland fishery villages ‘Wawak Sahitha Gamak
Program’
239.9
DFAR DFAR 251.0
Supply of boats and assistance for fishery sector 298.1
Promoting value added fish production and enhance marketing 0.2
CFC Infrastructure facilities for aquaculture, sales centers 180.2
Development and Rehabilitation of Fishery Harbors 1,010.9
Total - MFARD 2,856.0
MHC MHC Tikiri Shakthi - nutritional bar 43.4
MHC
MCPWS
Others (Nutrition and Food Program/Home Gardening) 2.4
MHC Upgrade Child Development Centers 8.6
WASH - estate sector 42.8
Total - MHC 97.0
MCPWS MCPWS Provision of safe drinking water for the areas affected by the chronic kidney disease 553.2
MCPWS/NWSDB Improvement of Rural Water Supply and Sanitation 533.7
MCPWS All Island Sanitation Programs 26.9
WASSIP (World Bank) 4,767.0
China Sri Lanka Research Grant Project 248.0
NWSDB Dry Zone Urban Water and Sanitation Project (ADB) 49.9
Large-scale water and waste water projects (disbursement of ongoing projects) 23,982.4
DNCWS Improvement of Community Water Supply Schemes 157.2
NWSDB Increasing household access to sewerage services (GPOBA -World Bank) 315.1
GOSL Allocation for Large Scale Water Supply and Sewerage Projects 1,1119.1
(2017)
Local Bank Loan for Large Scale Water Supply and Sewerage Projects 15,254.7
(2017)
Foreign Bank Loan for Large Scale Water Supply and Sewerage Projects 16,631.1

ASSESSING PUBLIC FINANCING FOR NUTRITION IN SRI LANKA
82
Ministry Implementing agencies Program/Activity Expenditure, 2018
(SL Rs, millions)
(2017)
Emerging Small Townships Water Supply Schemes 130.3
(2017)
UNICEF Drought Mitigation and Emergency Activities 56.36
(2017)
Provincial 70.4
Total - MCPWS 30,704.0
Note: HR costs not added.
ASSESSING PUBLIC FINANCING FOR NUTRITION IN SRI LANKA
83
REFERENCES
Aboud, F. E., and S. Akhter. 2011. “A Cluster-randomized Evaluation of a Responsive Stimulation
and Feeding Intervention in Bangladesh.” Pediatrics 127: e1191–e1197.
Aburto, N., M. Abudou, V. Candeias, and T. Wu. 2014. Effect and Safety of Salt Iodization to
Prevent Iodine Deficiency Disorders: A Systematic Review with Meta-analyses. WHO
eLibrary of Evidence for Nutrition Actions (eLENA). Geneva: WHO.
Adato, M., B. De la Brière, D. Mindek, and A. Quisumbing. 2000. The Impact of PROGRESA on
Women’s Status and Intrahousehold Relations. Final Report. Washington, DC:
International Food Policy Research Institute.
Adato, M., and J. Hoddinott. 2010. Conditional Cash Transfers in Latin America. Baltimore: Johns
Hopkins University Press.
Adelman, S., D. O. Gilligan, and K. Lehrer. 2008. “How Effective Are Food for Education
Programs? A Critical Assessment of the Evidence from Developing Countries.” IFPRI
Food Policy Review 9. Washington, DC: International Food Policy Research Institute.
Afridi, F. 2010. “Child Welfare Programs and Child Nutrition: Evidence from a Mandated School
Meal Program in India.” J Dev Econ. 92: 152–65.
Agüero, J., M. Carter, and I. Woolard. 2010. “The Impact of Unconditional Cash Transfers on
Nutrition: The South African Child Support Grant.” International Poverty Centre Working
Paper 37: 1–28.
Akresh, R., D. De Walque, and H. Kazianga. 2012. “Alternative Cash Transfer Delivery
Mechanisms: Impacts on Routine Preventative Health Clinic Visits in Burkina Faso.”
Policy Research Working Paper 5958, World Bank, Washington, DC.
Alderman, H. H. 2015. Leveraging Social Protection Programs for Improved Nutrition: Summary
of Evidence Prepared for the Global Forum on Nutrition-sensitive Social Protection
Programs. Global Forum on Nutrition-Sensitive Social Protection Programs, September
10-11, 2015. Washington, DC: World Bank Group.
Bangladesh Finance Division and UNICEF (United Nations Children’s Fund). 2019. Bangladesh
Public Expenditure Review on Nutrition. Dhaka: Ministry of Finance and UNICEF.
Banna, J. C., O. V. Buchthal, T. Delormier, H. M. Creed-Kanashiro, and M. E. Penny. 2016.
“Influences on Eating: A Qualitative Study of Adolescents in a Periurban Area in Lima,
Peru.” BMC Public Health 16 (1): 40.
ASSESSING PUBLIC FINANCING FOR NUTRITION IN SRI LANKA
84
Barreto, M. L., B. Genser, A. Strina, M. G. Teixeira, A. M. O. Assis, R. F. Rego, C. A. Teles, M.
S. Prado, S. M. A. Matos, N. M. Alcântara-Neves, and S. Cairncross. 2010. “Impact of a
Citywide Sanitation Program in Northeast Brazil on Intestinal Parasites Infection in Young
Children.” Environmental Health Perspectives 118 (11): 1637–1642.
Basset, R., G. E. Chapman, and B. L. Beagan. 2007. “Autonomy and Control: The Co-construction
of Adolescent Food Choice.” Appetite 50: 325 –332.
Bernardette, Cichon. 2019. Action Against Hunger UK and No Wasted Lives, Transforming
Nutrition Course. Brighton: Institute of Development Studies. Sussex University.
Bhutta, Z. A., T. Ahmed, R. E. Black, S. Cousens, K. Dewey, E. Giugliani, B. A. Haider, B.
Kirkwood, S. S. Morris, H. P. Sachdev, M. Shekar, and Maternal and Child Undernutrition
Study Group. 2008. “What Works? Interventions for Maternal and Child Undernutrition
and Survival.” The Lancet 371 (9610): 417– 440.
Bhutta, Z. A., J. K. Das, A. Rizvi, M. F. Gaffey, N.Walker, S. Horton, P. Webb, A. Lartey, R. E.
Black, and the Maternal and Child Nutrition Study Group. 2013. "Evidence-based
interventions for improvement of maternal and child nutrition: what can be done and at
what cost?" The lancet 382(9890): 452-477.
Black, R. E., L. H. Allen, Z. A. Bhutta, L. E. Caulfield, M. de Onis, M. Ezzati, C. Mathers, and J.
Rivera. 2008. “Maternal and Child Undernutrition: Global and Regional Exposures and
Health Consequences.” The Lancet 371 (9608): 243–260.
Black, M., A. H. Baqui, K. Zaman, S. El Arifeen, and R. E. Black. 2009. “Maternal Depressive
Symptoms and Infant Growth in Rural Bangladesh.” Am J Clin Nutr. 89: S951–57.
Black, R. E., C. G. Victora, S. P. Walker, Z. A. Bhutta, P. Christian, M. De Onis, M. Ezzati, S.
Grantham-McGregor, J. Katz, and R. Martorell. 2013. “Maternal and Child Undernutrition
and Overweight in Low-income and Middle-income Countries.” The Lancet 382 (9890):
427–451.
Bundy, D., L. Drake, and C. Burbano. 2012. “School Food, Politics, and Child Health.” Public
Health Nutr 16 (6): 1012–1019.
Butte, N.F., M. G. Lopez-Alarcon, and C. Garza. 2002. Nutrient Adequacy of Exclusive
Breastfeeding for the Term Infant during the First Six Months of Life. Geneva: WHO.
CBSL (Central Bank of Sri Lanka). 2019. Annual Report 2018. Colombo: CBSL.
Checkley, W., R. H. Gilman, R. E. Black, L. D. Epstein, L. Cabrera, C. R. Sterling, and L. H.
Moulton. 2004. “Effect of Water and Sanitation on Childhood Health in a Poor Peruvian
Peri-urban Community.” The Lancet 363 (9403): 112–118.
ASSESSING PUBLIC FINANCING FOR NUTRITION IN SRI LANKA
85
Ching, P., M. Birmingham, T. Goodman, R. Sutter, and B. Loevinsohn. 2000. “Childhood
Mortality Impact and Costs of Integrating Vitamin A Supplementation into Immunization
Campaigns.” American Journal of Public Health 90: 1526–1529.
DCS (Department of Census and Statistics). 2009. Sri Lanka Demographic and Health Survey
2006. Battaramulla: Department of Census and Statistics and Ministry of Health, Nutrition
and Indigenous Medicine.
———. 2017. Sri Lanka Demographic and Health Survey 2016. Battaramulla: Department of
Census and Statistics and Ministry of Health, Nutrition and Indigenous Medicine.
Dewey, K. G. and K. H. Brown. 2003. “Update on Technical issues concerning Complementary
Feeding of Young Children in Developing Countries and Implications for Intervention
Programs.” Food and Nutrition Bulletin 24 (1): 5–28.
DFID (U.K. Department for International Development). 2011. Cash Transfer Evidence Paper.
London: Department for International Development Policy Division.
Esrey, S. A. 1996. “Water, Waste, and Well-Being: A Multi-country Study.” American Journal of
Epidemiology 143 (6): 608–623.
Fernández-Gaxiola, A. C., and L. M. De-Regil 2011. “Intermittent Iron Supplementation for
Reducing Anaemia and Its Associated Impairments in Menstruating Women.” Cochrane
Database of Systematic Reviews 12: CD009218.
FHB (Family Health Bureau). 2018. STOP STUNTING: The Power of Maternal Nutrition.
Fiszbein, A, N. Schady, F. H. Ferreira, M. Grosh, N. Kelleher, P. Olinto, and E. Skoufias. 2009.
Conditional Cash Transfers for Attacking Present and Future Poverty. World Bank Policy
Research Report, Washington, DC: World Bank.
Fracassi, P., C. Picanyol, W. Knechtel, M. D’Alimonte, A. Gary, A. Pomeroy-Stevens, and R.
Watts. 2017. Budget Analysis for Nutrition: Guidance Note for Countries (update 2017).
Freeman, M. C., M. E. Stocks, O. Cumming, A. Jeandron, J. P. T. Higgins, J. Wolf, A. Pruss-
Ustun, S. Bonjour, P. R. Hunter, L. Fewtrell, and V. Curtis. 2014. “Hygiene and Health:
Systematic Review of Handwashing Practices Worldwide and Update of Health Effects.”
Tropical Medicine and International Health 19 (8): 906–916.
Gaarder, M. M., A. Glassman, and J. E. Todd. 2010. “Conditional Cash Transfers and Health:
Unpacking the Causal Chain.” J Dev Effect 2: 6–50.
Galasso, E., and A. Wagstaff. 2018. The Aggregate Income Losses from Childhood Stunting and
the Returns to a Nutrition Intervention Aimed at Reducing Stunting. Washington, DC:
World Bank.

ASSESSING PUBLIC FINANCING FOR NUTRITION IN SRI LANKA
86
Gardner, J. M. M., C. A. Powell, H. Baker-Henningham, S. P. Walker, T. J. Cole, and S. M.
Grantham-McGregor. 2005. “Zinc Supplementation and Psychosocial Stimulation: Effects
on the Development of Undernourished Jamaican Children.” Am J Clin Nutr. 82:399–405.
Giles, J., and E. Satriawan. 2010. “Protecting Child Nutritional Status in the Aftermath of a
Financial Crisis: Evidence from Indonesia.” Policy Research Working Paper 5471, World
Bank, Washington, DC.
Gillespie, S., J. Harris., and S. Kadiyala. 2012. “The Agriculture-nutrition Disconnect in India:
What Do We Know?” IFPRI Discussion Paper 01187, International Food Policy Research
Institute, Washington, DC.
GOSL (Government of Sri Lanka). 2013. Vision 2016: Sri Lanka, A Nourished Nation: Multi-
sector Action Plan for Nutrition. Colombo: National Nutrition Secretariat.
———. 2019. Multi-sector Action Plan for Nutrition 2018–2025, (Draft). Colombo: National
Nutrition Secretariat.
Goto, R., C. G. N. Mascie-Taylor, and P. G. Lunn. 2009. “Impact of Anti-Giardia and
Antihelmintic Treatment on Infant Growth and Intestinal Permeability in Rural
Bangladesh: A Randomised Double-Blind Controlled Study.” Transactions of the Royal
Society of Tropical Medicine and Hygiene 103 (5): 520–529.
Grantham-McGregor, S. M., C. A. Powell, S. P. Walker, and J. H. Himes. 1991. “Nutritional
Supplementation, Psychosocial Stimulation, and Mental Development of Stunted Children:
the Jamaican Study.” Lancet 338: 1–5.
Fink, G., I. Günther, and K. Hill. 2011. “The Effect of Water and Sanitation on Child Health:
Evidence from the Demographic and Health Surveys 1986–2007.” International Journal
of Epidemiology 40 (5): 1196–1204.
HarvestPlus. 2019. 2018. Annual Report. Washington, DC: HarvestPlus.
Headey, D., and J. Hoddinott. 2015. “Understanding the Rapid Reduction of Undernutrition in
Nepal 2001–2011.” PLOS ONE 10 (12): e0145738.
Hoddinott, J., M. Rosegrant, and M. Torero. 2013. “Investments to Reduce Hunger and
Undernutrition.” In Copenhagen Consensus 2012, edited by B. Lomborg. Cambridge:
Cambridge University Press.
Hotz, C., L. Cornelia, A. de Brauw, P. Eozenou, D. Gilligan, M. Moursi, B. Munhaua, P. Jaarsveld,
A. Carriquiry, and J. V. Meenakshi. 2012. “A Large-scale Intervention to Introduce Orange
Sweet Potato in Rural Mozambique Increases Vitamin A Intakes among Children and
Women.” British Journal of Nutrition 108: 163–76.
ASSESSING PUBLIC FINANCING FOR NUTRITION IN SRI LANKA
87
Humphrey, J. H., M. N. Mbuya, R. Ntozini, L. H. Moulton, R. J. Stoltzfus, N. V. Tavengwa, K.
Mutasa, F. Majo, B. Mutasa, and G. Mangwadu. 2019. “Independent and Combined Effects
of Improved Water, Sanitation, and Hygiene, and Improved Complementary Feeding, on
Child Stunting and Anaemia in Rural Zimbabwe: A Cluster-randomised Trial.” The Lancet
Global Health 7 (1): e132–e147.
Imdad, A., K. Herzer, E. Mayo-Wilson, M. Y. Yakoob, and Z. A. Bhutta. 2010. “Vitamin A
Supplementation for Preventing Morbidity and Mortality in Children from 6 Months to 5
Years of Age.” Cochrane Database of Systematic Reviews 12: CD008524.
Kazianga, H., D. De Walque, and H. Alderman. 2009. “Educational and Health Impact of Two
School Feeding Schemes: Evidence from a Randomized Trial in Rural Burkina Faso.”
World Bank Policy Research Working Paper 4976, World Bank, Washington, DC.
Kelder, S. H., C. L. Perry, K. I. Klepp, and L. L. Lytle. 1994. “Longitudinal Tracking of Adolescent
Smoking, Physical Activity, and Food Choice Behaviors.” American Journal of Public
Health 84 (7): 1121–1126.
Kristjansson, E. A., V. Robinson, M. Petticrew, B. MacDonald, J. Krasevec, L. Janzen, T.
Greenhalgh, G. A. Wells, J. MacGowan, A. P. Farmer and B. Shea. 2007. “School Feeding
for Improving the Physical and Psychosocial Health of Disadvantaged Elementary School
Children.” Cochrane Database Syst Rev. 1: CD004676.
Leroy, J. L., P. Gadsden, S. Rodríguez-Ramírez, and T. González de Cossiío. 2010. “Cash and In-
kind Transfers in Poor Rural Communities in Mexico Increase Household Fruit, Vegetable,
and Micronutrient Consumption But Also Lead to Excess Energy Consumption.” Journal
of Nutrition 140: 612–617.
Leroy, J. L., P. Gadsden, T. G. De Cossío, and P. Gertler. 2013. “Cash and In-kind Transfers Lead
to Excess Weight Gain in a Population of Women with a High Prevalence of Overweight
in Rural Mexico.” Journal of Nutrition 143: 378–383.
Lin, A., B. F. Arnold, S. Afreen, R. Goto, T. M. N. Huda, R. Haque, R. Raqib, L. Unicomb, T.
Ahmed, J. M. Colford Jr, and S. P. Luby. 2013. “Household Environmental Conditions Are
Associated with Enteropathy and Impaired Growth in Rural Bangladesh.” American
Journal of Tropical Medicine and Hygiene 89 (1): 130–137.
Luby, S. P., M. Rahman, B. F. Arnold, L. Unicomb, S. Ashraf, P. J. Winch, C. P. Stewart, F.
Begum, F. Hussain, and J. Benjamin-Chung. 2018. “Effects of Water Quality, Sanitation,
Handwashing, and Nutritional Interventions on Diarrhoea and Child Growth In Rural
Bangladesh: A Cluster Randomised Controlled Trial.” The Lancet Global Health 6 (3):
e302–e315.
ASSESSING PUBLIC FINANCING FOR NUTRITION IN SRI LANKA
88
Manley J., S. Gitter, and V. Slavchevska. 2011. “How Effective Are Cash Transfer Programs at
Improving Nutritional Status?” Working Paper 2010–2018, Department of Economics,
Towson University, Maryland, the United States.
———. 2012. How Effective Are Cash Transfer Programmes at Improving Nutritional Status? A
Rapid Evidence Assessment of Programmes’ Effects on Anthropometric Outcomes. London
EPPI Centre, Social Research Science Unit, Institute of Education, London: University of
London.
Masset, E., L. Haddad, A. Cornelius, and J. Isaza-Castro. 2012. “Effectiveness of Agricultural
Interventions That Aim to Improve Nutritional Status of Children: Systematic Review.”
BMJ 344: d8222.
Menon, P., M. T. Ruel, C. U. Loechl, M. Arimond, J. P. Habicht, G. Pelto and L. Michaud. 2007.
“Micronutrient Sprinkles Reduce Anemia among 9- to 24-mo-old Children When
Delivered through an Integrated Health and Nutrition Program in Rural Haiti.” Journal of
Nutrition 137: 1023–30.
MFARD (Ministry of Fisheries and Aquatic Resources Development). 2016. Ministry of Fisheries
and Aquatic Resources Development Annual Report 2016. Colombo: Ministry of Fisheries
and Aquatic Resources Development, Sri Lanka.
MCPWS (Ministry of City Planning, Water Supply, and Higher Education). 2018. Ministry of City
Planning, Water Supply and Higher Education, Performance Report 2018. Colombo:
Ministry of City Planning, Water Supply and Higher Education, Sri Lanka.
MoE (Ministry of Education). 2017. Nutrition Program Implemented for School Children:
Ministry of Education Circular 10/2017. Colombo: Ministry of Education, Sri Lanka.
MoH (Ministry of Health, Nutrition and Indigenous Medicine). 2010. National Nutrition Policy
(NNP) 2010. Colombo: Ministry of Health, Nutrition and Indigenous Medicine, Sri Lanka.
Moraes, L. R. S., J. A. Cancio, and S. Cairncross. 2004. “Impact of Drainage and Sewerage on
Intestinal Nematode Infections in Poor Urban Areas in Salvador, Brazil.” Transactions of
the Royal Society of Tropical Medicine and Hygiene 98 (4): 197–204.
MRI (Medical Research Institute). 2013. National Nutrition and Micronutrient Survey 2012.
Colombo: Ministry of Health, Sri Lanka.
Nahar, B., J. D. Hamadani, T. Ahmed, F. Tofail, A. Rahman, S. N. Huda, and S. M. Grantham-
McGregor. 2009. “Effects of Psychosocial Stimulation on Growth and Development of
Severely Malnourished Children in a Nutrition Unit in Bangladesh.” Eur J Clin Nutr. 63:
725–31.

ASSESSING PUBLIC FINANCING FOR NUTRITION IN SRI LANKA
89
PAHO (Pan American Health Organization). 2003. Guiding principles for complementary feeding
of the breastfed child. Washington, DC: PAHO.
Peña-Rosas, J. P., L. M. De-Regil, T. Dowswell, and F. E. Viteri. 2012. “Daily Oral Iron
Supplementation during Pregnancy.” Cochrane Database of Systematic Reviews 12:
CD004736.
Pickering, A. J., and J. Davis. 2012. “Freshwater Availability and Water Fetching Distance Affect
Child Health in Sub-Saharan Africa.” Environmental Science and Technology 46 (4):
2391–2397.
Ruel, M., H. Alderman, and Maternal and Child Nutrition Study Group. 2013. “Nutrition-Sensitive
Interventions and Programmes: How Can They Help to Accelerate Progress in Improving
Maternal and Child Nutrition?” Lancet 382: 536–551.
Ruel, M. T., P. Menon, J. P. Habicht, C. Loechl, G. Bergeron, G. Pelto, M. Arimond, J. Maluccio,
L. Michaud and B. Hankebo. 2008. “Age-based Preventive Targeting of Food Assistance
and Behaviour Change Communication for Reduction of Childhood Undernutrition in
Haiti: A Cluster Randomized Trial.” Lancet 371: 588–595.
Salam, R. A., M. Hooda, J. K. Das, A. Arshad, Z. S. Lassi, P. Middleton, and Z. A. Bhutta. 2016.
“Interventions to Improve Adolescent Nutrition: A Systematic Review and Meta-
Analysis.” Journal of Adolescent Health 59: S29eS39.
Singh, A. S., C. Mulder, J. W. R. Twisk, W. Van Mechelen, and W. J. M. Chinapaw. 2008.
“Tracking of Childhood Overweight into Adulthood: A Systematic Review of the
Literature.” Obesity Reviews 9 (5): 474–488.
Skoufifias, E., and B. McClafferty. 2001. “Is PROGRES A working? Summary of the Results of
an Evaluation by IFPRI.” Food Consumption and Nutrition Division Discussion Paper 118,
International Food Policy Research Institute, Washington, DC.
Stewart, C. P., A. J. Pickering, H. N. Dentz, B. F. Arnold, C. D. Arnold, J. Benjamin-Chung, T.
Clasen, K. G. Dewey, L. C. Fernald, and C. Null. 2018. “Effects of Water Quality,
Sanitation, Handwashing, and Nutritional Interventions on Diarrhoea and Child Growth in
Rural Kenya: A Cluster-Randomised Controlled Trial.” The Lancet Global Health 6 (3):
e316–e329.
Story, M., D. Neumark-Sztainer, and S. French. 2002. “Individual and Environmental Influences
on Adolescent Eating Behaviors.” Journal of American Dietary Association 102(3): S40–
S51.
ASSESSING PUBLIC FINANCING FOR NUTRITION IN SRI LANKA
90
Surkan, P.J., C. E. Kennedy, K. M. Hurley, and M. M. Black. 2011. “Maternal Depression and
Early Childhood Growth in Developing Countries: Systematic Review and Meta-analysis.”
WHO Bull 89: 608–15.
Torlesse, H., and V. M. Aguayo. 2018. “Aiming Higher for Maternal and Child Nutrition in South
Asia.” Maternal and Child Nutrition 14 (Suppl 4): e12739.
UNICEF (United Nations Children’s Fund). 1990. “Strategy for Improved Nutrition of Children
and Women in Developing Countries.” New York: UNICEF.
———. 2015. “UNICEF’s Approach to Scaling Up Nutrition for Mothers and Their Children.”
Discussion Paper, Program Division, UNICEF, New York.
———. 2019. UNICEF’s Global Social Protection Programme Framework. New York: UNICEF.
UNICEF (United Nations Children’s Fund) and ISSA (International Step by Step Association).
2016. Supporting Families for Nurturing Care. https://www.issa.nl/home_visiting.
UNICEF, WHO, and World Bank. 2019. UNICEF-WHO-World Bank Joint Child Malnutrition
Estimates. New York, Geneva, Washington, DC: UNICEF, WHO, World Bank.
Victora, C.G., R. Bahl, A. J. D. Barros, G. V. A. França, S. Horton, J. Krasevec, S. Murch, M. J.
Sankar, N. Walker, and N. C. Rollins. 2016. “Breastfeeding in the 21st Century:
Epidemiology, Mechanisms, and Lifelong Effect.” Lancet 387: 475–490.
Walker, S. P., S. M. Chang, C. A. Powell, E. Simonoff, and S. M. Grantham-McGregor. 2007.
“Early Childhood Stunting Is Associated with Poor Psychological Functioning in Late
Adolescence and Effects Are Reduced by Psychosocial Stimulation.” Journal of Nutrition
137 (11): 2464–2469.
WFP (World Food Programme). 2017. National Strategic Review of Food Security and Nutrition:
Towards Zero Hunger 2017.
https://www.wfp.org/publications/Sri_Lanka_Food_Security_Review.
WHO (World Health Organization). 2007. Promoting Physical Activity in Schools: An Important
Element of a Health-promoting School. Geneva: WHO.
———. 2011. Haemoglobin Concentrations for the Diagnosis of Anaemia and Assessment of
Severity: Vitamin and Mineral Nutrition Information System. Geneva: WHO.
———. 2013. Guideline: Updates on the Management of Severe Acute Malnutrition in Infants
And Children. Geneva: WHO.
———. 2014a. Global Nutrition Targets 2025: Stunting Policy Brief (WHO/NMH/NHD/14.3).
Geneva: WHO.
ASSESSING PUBLIC FINANCING FOR NUTRITION IN SRI LANKA
91
———. 2014b. Global Status Report on Noncommunicable Diseases 2014. Geneva: WHO.
———. 2016a. WHO Guideline: Daily Iron Supplementation in Infants and Children. Geneva:
WHO.
———. 2016b. WHO Guideline: Fortification of Maize Flour and Corn Meal with Vitamins and
Minerals. Geneva: WHO.
———. 2016c. WHO Recommendations on Antenatal Care for a Positive Pregnancy Experience.
Geneva: WHO.
———. 2018. Guideline: Implementing Effective Actions for Improving Adolescent Nutrition.
Geneva: WHO.
———. 2019. Essential Nutrition Actions: Mainstreaming Nutrition through the Life-course.
Geneva: WHO.
———. 2020. Global Health Expenditure Database.
https://apps.who.int/nha/database/Home/Index/en.
World Bank. 2007. From Agriculture to Nutrition: Pathways, Synergies and Outcomes.
Washington, DC: World Bank.
———. 2012. Managing Risk, Promoting Growth: Developing Systems for Social Protection in
Africa: The World Bank’s Africa Social Protection Strategy 2012–2022. Washington, DC:
World Bank.
———. 2017a. Sri Lanka Health Financing System Assessment. Washington, DC: World Bank.
______. 2017b. Multisectoral Nutrition Assessment in Sri Lanka’s Estate Sector. Washington, DC:
World Bank.
______. 2017c. Getting to Work: Unlocking Women’s Potential in Sri Lanka’s Labor Force.
Washington, DC: World Bank.
______. 2018. Improving Nutrition Outcomes for Children in Sri Lanka’s Estate Sector: The
Positive Deviance Approach. Washington, DC: World Bank.
———. 2019a. World Development Indicator. https://databank.worldbank.org/source/world-
development-indicators.
———. 2019b. Assessing Public Financing for Improving Nutrition Outcomes and Human
Capital in Bhutan: What Gets Measured Gets Managed. Washington, DC: World Bank.
———. 2019c. Assessing Public Financing for Nutrition in Nepal (2011–2017). Washington, DC:
World Bank.
ASSESSING PUBLIC FINANCING FOR NUTRITION IN SRI LANKA
92
Yamano, T., H. Alderman, and L. Christiaensen. 2005. “Child Growth, Shocks, and Food Aid in
Rural Ethiopia.” Am J Agric Econ. 87:273–288.
Ziegelbauer, K., B. Speich, D. Mausezahl, R. Bos, J. Keiser, and J. Utzinger. 2012. “Effect of
Sanitation on Soil-Transmitted Helminth Infection: Systematic Review and Meta-
analysis.” PLoS Medicine 9 (1): e1001162.