Embed Size (px)
Citation preview

Purdue UniversityPurdue e-PubsSchool of Engineering Education FacultyPublications School of Engineering Education
10-2008
Assessing Pedagogy in Bioengineering Classrooms:Quantifying Elements of the “How People Learn”Model Using the VaNTH Observation System(VOS)Monica F. CoxPurdue University - Main Campus, [email protected]
David S. CordrayVanderbilt University
Follow this and additional works at: http://docs.lib.purdue.edu/enepubsPart of the Other Engineering Commons
This document has been made available through Purdue e-Pubs, a service of the Purdue University Libraries. Please contact [email protected] foradditional information.
Cox, Monica F. and Cordray, David S., "Assessing Pedagogy in Bioengineering Classrooms: Quantifying Elements of the “How PeopleLearn” Model Using the VaNTH Observation System (VOS)" (2008). School of Engineering Education Faculty Publications. Paper 1.http://docs.lib.purdue.edu/enepubs/1

October 2008 Journal of Engineering Education 413
Assessing Pedagogy in BioengineeringClassrooms: Quantifying Elements of the “How People Learn” Model Using the VaNTH Observation System (VOS)
MONICA F. COX
Department of Engineering EducationPurdue University
DAVID S. CORDRAY
Department of Psychology and Human DevelopmentPeabody College at Vanderbilt University
ABSTRACT
One goal of the VaNTH Engineering Research Center is to esti-mate the effects of the “value added” to bioengineering studentlearning as a result of “How People Learn” (HPL) frameworkinterventions. A necessary step in that process is to assess peda-gogical differences in both lecture-based and HPL-orientedcourses. Data from 28 bioengineering courses, over five semes-ters, were analyzed using a newly developed HPL Index. Thisindex, developed from the Classroom Interaction Observationportion of the VaNTH Observation System, reports levels ofHPL-inspired pedagogy, traditional pedagogy, and classroomorganization within a class using codes for different types of facul-ty and student interactions assigned by an observer in real time.Results confirm the HPL Index’s ability to distinguish pedagogi-cal practices based on HPL principles and pedagogical practicesbased on traditional, non-HPL pedagogy.
Keywords: classroom assessment, engineering pedagogy, observa-tion systems
I. INTRODUTION
As the demand for innovative technology increases within theUnited States, the number of highly qualified engineers must alsoincrease. ABET requires that engineering graduates demonstrateseveral skills, such as the ability to solve engineering problems, toapply science-based, engineering, and mathematics knowledge,and to effectively work in interdisciplinary teams (Herkert, 1999).These requirements affect over 2,700 engineering programs atapproximately 550 colleges and universities nationwide.
In an effort to address these requirements within engineering,researchers have begun conducting empirical studies to identifypedagogical practices intended to optimize these desired skills inthe next generation of engineers. Teaching and learning within
engineering differs from teaching and learning within other disci-plines because engineering is a “hard/applied” field of study, fo-cusing on inquiry strategies, mastery of the environment, and thedevelopment and application of products and processes (Lodahland Gordon, 1972; Biglan, 1973; Neumann, Perry and Becher,2002). In-class student collaboration within engineering class-rooms increases students’ critical thinking skills and has positiveeffects on student achievement, persistence, and attitudes com-pared to lecture-based engineering classroom environments(Cooper and Robinson, 1998; Cudd and Wasser, 1999; Springer,Stanne, and Donovan, 1998). In addition, engineering classeswith greater emphases on faculty-student interactions and facultyguidance have positive effects on student learning (Cabrera,Colbeck, and Terenzini, 2001).
To meet the educational standards of ABET and to increasethe quality of the students’ educational experience within engi-neering classrooms, valid assessments of current engineering class-rooms are needed. One such discipline-specific instrument, theVaNTH Observation System (VOS), was developed to capturepedagogical practices in bioengineering classrooms (Harris andCox, 2003). It has been used to observe over thirty bioengineeringcourses at two research universities. Although the VOS capturesthe nature and quality of faculty and student interactions withinengineering courses, its use to date has not been optimized becauseof the absence of an algorithm for combining the distinct observa-tion segments into a coherent index that can be used to register thequality of pedagogy exhibited in courses.
This paper describes the development and application of a newlydeveloped index that parses data collected from one portion of theVOS into categories representing traditional and nontraditional in-struction and distinguishes pedagogical style from other activitiesassociated with classroom organization or management. Overviewsof VOS studies are described, and the criterion contrast of the indexis examined. Differences between traditional and HPL-orientedcourses within one biomedical engineering program (at VanderbiltUniversity) are explored and presented, and connections to practiceare discussed. The next section provides an overview of theVaNTH Engineering Research Center (ERC).
A. The VaNTH ERC Model of Learning and InstructionThe VaNTH Engineering Research Center (ERC) for Bio-
engineering Educational Technologies was established in 1999with funding from the National Science Foundation (NSF).VaNTH is a multi-university ERC developed to maximize the ed-ucational experiences of bioengineering students at Vanderbilt

University, Northwestern University, the University of Texas atAustin, and the Harvard/Massachusetts Institute of TechnologyDivision of Health Science and Technology. VaNTH involves acollaboration of professionals from Bioengineering Domains (e.g.,Biomechanics and Biotechnology), Learning Sciences, Assess-ment and Evaluation, and Learning Technology. The VaNTHERC is the only Center funded by NSF devoted solely to bioengi-neering educational technologies. The goal of the VaNTH ERC isto “unite educators and engineers, in industry and academia, to de-velop curricula and technologies that will educate future generationsof bioengineers (VaNTH, 2003). These curricular changes wereguided by the “How People Learn” (HPL) framework (Bransford,Brown, and Cocking, 1999), a synthesis of research on learningthat complements other pedagogical practices (e.g., constructivist,problem-based learning) that have been found to be effective with-in many classroom environments.
The HPL framework encourages teachers to diversify their teach-ing by incorporating the four lenses of knowledge-, learner-, assess-ment-, and community-centeredness into their current class lessons.A knowledge-centered environment emphasizes making academicconnections around foundational concepts across courses within adiscipline and using these concepts to understand and solve problems(Bransford, Vye, and Bateman, 1999). Within a learner-centered envi-ronment, an instructor explicitly incorporates the learning styles, pre-conceptions, skills, prior experiences, knowledge, and beliefs that stu-dents bring into a classroom and recognizes the challenges that novicelearners may experience within a classroom environment. Assessment-centered environments allow students to make their thinking andlearning visible through the use of both summative and formativetechniques. A community-centered learning environment encouragesstudents to develop a professional identity in class and out of class andto become lifelong learners via connections and collaborations thatthey have with faculty and students who share norms that value learn-ing and high standards. Successful implementation of HPL frame-work principles should result in the transfer of learning from students’previous academic experiences so that students become adaptive ex-perts in their areas of study (Cordray, Pion, Harris, and Norris, 2003;Harris, Cordray, and Harris, 2002; Jansen et al., 2003; Roselli andBrophy, 2001 and 2003).
II. RESEARH QUESTIONS AND SIGNIFICANCE
A. Research QuestionsCriterion contrast explores “the degree to which an instrument’s
scores are related to external criteria believed to measure the attributeof interest” (Doherty et al., 2002, p. 83). The study described in thispaper examines the criterion contrast of a newly developed HPL Indexderived from the Classroom Interaction Observation portion of theVOS. Within the Department of Biomedical Engineering at Van-derbilt University, there are courses that are known to be using theHPL framework. Observations have also been taken in courses thatare known to follow traditional pedagogical practices. If the HPLIndex adequately captures true HPL practices, it should be sensitiveenough to register pedagogical differences in these two types of cours-es. Being able to distinguish between two contrasting groups yieldsevidence of criterion contrast within the Index. It is hypothesized thathigher HPL instructional scores (on average) will be found withinHPL courses and that lower HPL instructional scores (on average)
will be found within traditional courses. For this reason, the mainquestion for this study asks, “Is the HPL Index sensitive enough tocapture HPL-related differences in courses that are known to employHPL-based or traditional pedagogy?” Additional information aboutthis HPL Index is detailed in a later section.
B. Significance of the ResearchThis research is significant for several reasons. First, it examines
ways of quantifying the amount of HPL-oriented instructionwithin VOS-observed classes using code strings that sum up to100 percent of classroom instruction. The current method of in-dexing the amount of HPL-oriented instruction in courses relieson the simple percentage of individual HPL dimensions that arepresent within Classroom Interaction Observation data. Thisstudy introduces a method of indexing HPL that improves uponcurrent practices by grouping code strings into categories that takeinto account the connection of these HPL lenses to classroom in-teractions, pedagogical methods, and technology use within theclassroom. Second, this research examines differences within andacross faculty in their use of HPL and traditional pedagogy, there-by setting the stage for faculty development programs targeted atimproving pedagogy within engineering classrooms.
III. OVERVIEW OF THE VANTH OBSERVATION SYSTEM (VOS)
A. Development of the VaNTH Observation SystemIn an effort to assess the presence or absence of HPL-inspired
pedagogical practices within postsecondary engineering class-rooms and to give bioengineering instructors feedback about theirteaching, Dr. Alene Harris and her colleagues within the VaNTHERC created the VaNTH Observation System (VOS), a directobservation system that could be used within bioengineering class-rooms. The VOS was developed from the Stallings ObservationSystem (Stallings and Kaskowitz, 1974; Stallings, 1977, 1978,1980, and 1986; Stallings and Frieberg, 1991), which consisted ofthree components that registered the presence and absence of over600 in-class student and teacher behaviors and activities (Stallings,1977, 1978, and 1980; Adolf, 1983).
Similar to other classroom observation systems used at boththe K-12 and postsecondary levels (Stallings, 1977; Piburn et al.,2000; Knight, 2001; Moran et al., 2003), the VOS provides infor-mation about the types of pedagogy and interactions occurringwithin a class along with information about levels of student en-gagement. Unlike these previous observation systems, however,the VOS contains a category that explicitly measures the presenceof the four HPL framework lenses and the interactions of theselenses within observed courses. The four components of the VOSinclude the following: (1) the Classroom Interaction Observation(CIO), sampled real-time, which records student and faculty in-teractions; (2) a time-sampled Student Engagement Observation(SEO), which notes whether students are engaged or unengagedwith academic tasks, (3) qualitative Narrative Notes (NN) on thelesson content, lesson context, extenuating circumstances, and ad-ditional information about the classroom, and (4) Global Ratings(GR), which provide summative information about major aspectsof the pedagogy underlying the class session (Harris and Cox,2003).
414 Journal of Engineering Education October 2008

B. Observer Training and Data Collection CycleSince fall 2000, training of VOS observers has occurred via obser-
vations of real-time and videotaped classroom sessions. To date, eightobservers at Vanderbilt University (one research assistant professor ofeducation, three education graduate students, and four bioengineer-ing graduate students) have been trained to use the VOS. In 2003, theVOS team developed a training CD that accompanies a trainingmanual developed by Dr. Alene Harris. Before becoming a certifiedtrainer, new VOS observers must code several videotaped vignettesthat have been coded previously by trained observers and mustachieve an overall inter-rater reliability score of 85 percent or higheracross these vignettes. When new observers joined the research team,inter-rater reliability was calculated again across all observers. If relia-bility was less than 85 percent, all observers discussed the coding sys-tem and practiced using classroom vignettes. When reliability of 85percent or greater was achieved, observers resumed classroom obser-vations.
Within a semester, observed courses were selected and classifiedas either lecture-based or HPL-oriented. Observation dates wereselected randomly throughout the semester. Depending upon thenumber of observers available per semester, each trained observerconducted a minimum of six observations per course (Harris andCox, 2003).
Collecting data with the VOS requires that an observer sit in aclassroom for an entire class period, start coding at the beginningof class, and stop coding when class is dismissed. The first threeparts of the VOS (Classroom Interaction Observation, StudentEngagement Observation, and Narrative Notes, respectively)record data in a cyclic pattern using a keyboard and a hand-heldPersonal Data Assistant (Figure 1). The CIO records data forthree consecutive minutes, the SEO collects data for approximatelythirty to sixty seconds, and the NNs record typewritten notesbetween one and two minutes. At the end of a class period, GRsare taken once. This data is then transferred from the handheldPersonal Data Assistant to a VaNTH-designed data managementprogram (Norris, Harris, and Washington, 2004).
C. The Classroom Interaction Observation (CIO) Portion of the VOS
Of the four components of the VOS, the Classroom Observa-tion Interaction portion is the only portion that explicitly recordsfaculty-student interactions, in real-time, within classes, using thefour dimensions of the HPL framework. For this reason, the CIOis the primary focus of this research. Each CIO coding session isthree minutes. As such, VOS observers record approximately thir-ty to forty-five code strings at the speed of speech during a typical
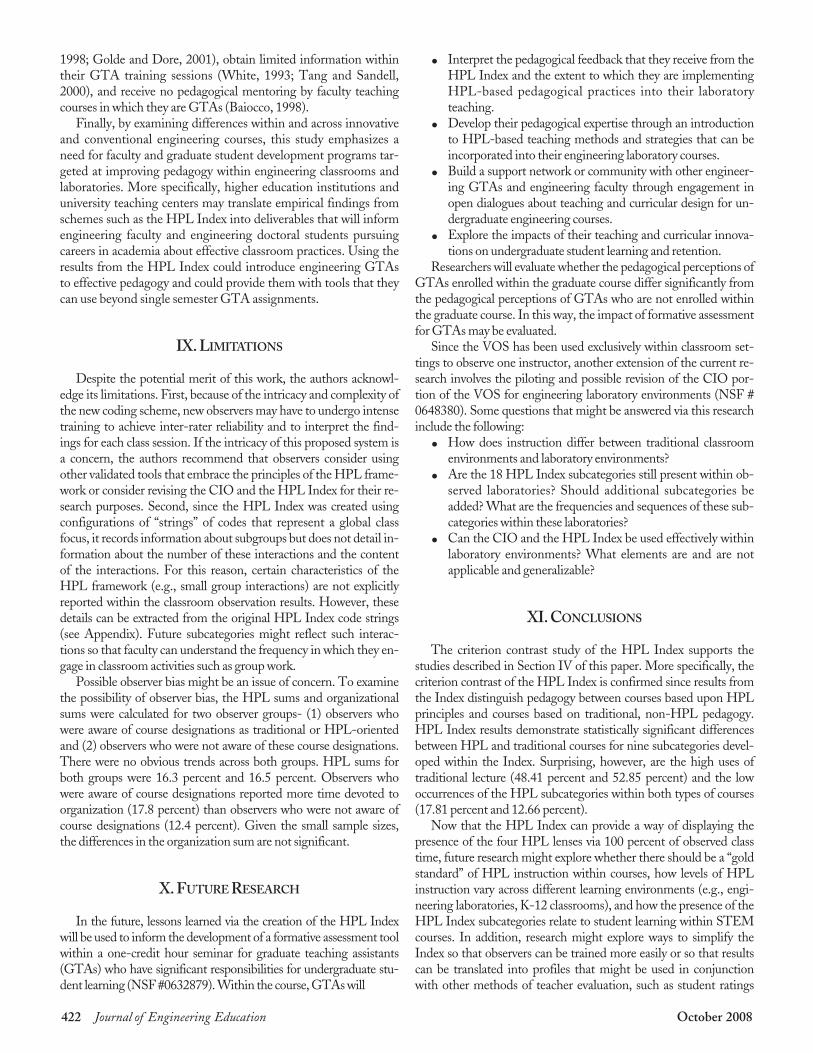
class session. These interactions are grouped into code strings ofwho - to whom - what - how - media (Figure 2) (Harris and Cox,2003).
Who and to-whom categories note who is initiating or respond-ing to in-class interactions. Interactions within both categoriesmay occur among the following: a professor or instructor (P), allstudents in the class (E), one student (F), the same student as theprevious interaction (S), a small group of students representingmore than one but not over half the class population (g), a largegroup of students representing half to all but one student in theclass (G), a visitor (V), or media (M).
The what category describes 12 types of in-class interactions thatmay occur during the CIO cycle. These interactions identify thepresence of questions, responses, acknowledgements and/or praise,guides, corrections, or professor-initiated student monitoring.More specifically, the what categories note the following: the initia-tion of a lower-level fact-based question (1), the initiation of a high-er order question (2), the response to a question (3), in-class instruc-tion (4), social comments (5), activity-related comments notdirectly related to academic content (6), acknowledgements orpraises by the professor (7), a guide by the professor (8), correctionby the professor (9), no response to a question asked by the profes-sor (0), active monitoring such that the professor walks among stu-dents during in-class activities (A), and passive monitoring suchthat the professor is standing at the front of the room and is watch-ing students during in-class activities (P).
The content of the how category within the VOS differs fromCIO portions of other instruments in its identification of present andabsent HPL framework lenses along with classroomorganization/management activities. More specifically, in the VOS,observers record activities using the lenses of the HPL framework-knowledge-centered (K), learner-centered (L), assessment-centered(A), and community-centered (C). Recognizing that not all classactivities relate to classroom instruction, an additional category oforganization (O) has been added to the how category. Of the how cat-egory components, VOS creators made only the knowledge-centeredand organization codes mutually exclusive. Other combinations ofthe four HPL dimensions can co-occur in any given observationwindow.
To understand additional information about the types of mediathat an instructor is using during an observed class session, a media cat-egory was created. The seven types of media noted within the CIO arethe board (B), the overhead projector (O), computer (C), simulation(S), demonstration (D), video (V), and a personal response system (R).Observers may also note the absence of media (N). All media cate-gories are mutually exclusive.
October 2008 Journal of Engineering Education 415
Figure 1. Observation cycle for the VaNTH Observation System.

For example, if a professor asks a student a higher order questionabout a diagram displayed on the board, the corresponding CIOcode string would be “P-F-2-K/L/A-B” such that “P” representsthe professor who is initiating the question (who), “F” represents thestudent to whom the professor is asking the question (to whom), and“2” represents the higher order question that was asked (what).HPL dimensions represented are knowledge-centered (K), learner-centered (L), and assessment-centered (A) (how). The use of theboard is represented by “B” (media). Additional code string exam-ples are presented in section V.
IV. PRIOR ANALYSES OF THE “HOW PEOPLE LEARN”FRAMEWORK USING THE VANTH OBSERVATION
SYSTEM
A. ReliabilityEvery semester since fall 2000, two to three observers have col-
lected CIO data within a sample of classrooms and have comparedcoding patterns across these courses. Using the CIO how categoryas a measure, comparisons across observers for the sample of obser-vations reported an overall inter-rater reliability of 85 percent orhigher across observers during each semester that the VOS has beenused (VaNTH, 2002; Cox, 2005 and 2006). Field-based reliabilitytests were also conducted throughout the semester. Brief descrip-tions of the prior studies along with results from these studies arelisted below.
B. Analysis of CIO Data Using the Four Lenses of the HPL Framework
Prior to the current study, CIO data were analyzed using only thecodes associated with the how portion of the CIO (i.e., knowledge-centered, learner-centered, assessment-centered, community-centered, and organization) (Figure 2). Specifically, to obtain anHPL instructional score, the percentages of CIO observation cyclesthat were coded as knowledge-, learner-, assessment-, and commu-nity-centeredness were added together to derive a cumulative indexof HPL-based pedagogical practices for each course (across 4–9 ob-servations per course). Using data from 182 observations within 28
bioengineering courses at Vanderbilt University, the cumulative per-centage of HPL-oriented pedagogy for both traditional and nontra-ditional bioengineering courses is shown in Figure 3 (Cox, 2005).
Not surprising, knowledge-centered instruction dominated bothtraditional and HPL-based courses (81–85 percent of observationperiods). Assessment-centered pedagogy was present in 8 to 29 per-cent of the observations. Both learner- and community-centeredpedagogy were less prevalent (5–22 percent and 2–12 percent,respectively). As shown in Figure 3, the HPL-oriented coursesshowed higher cumulative levels of HPL-based pedagogy com-pared to courses organized around traditional pedagogical practices.
This method of indexing HPL-oriented instruction has its lim-itations. First, it displays individual percentages of knowledge-,learner-, assessment-, and community-centeredness that equalmore than 100 percent when summed across the four dimensions.Without benchmarks indicating the optimal percent of each di-mension needed to enhance classroom environments, comparisonsof effective teaching across various types of classroom settingsproves difficult. Second, the current reporting of individual HPLdimensions does not represent the interdependencies of the fourHPL framework dimensions. By just noting individual HPL di-mensions, other aspects of classroom instruction (e.g., group work,higher order questioning, and guidance by the professor) are notreported in the analysis of data. Finally, in practice, coders did notdistinguish knowledge-centeredness as defined by HPL frame-work authors from the routine transmittal of information. As such,every activity that was not classroom organization was coded as“knowledge-centered” (Cox, 2005).
C. Content Validity Study Because of the limitations found in indexing HPL-oriented in-
struction, the authors examined the extent to which eleven contentexperts familiar with the HPL framework agreed with the currentclassifications of the four dimensions of the HPL framework asdefined within the VOS training manual. Across 20 classroomvignettes, the percent agreement between experts’ ratings and theVOS manual’s operationalization of the HPL framework dimen-sions was examined. The agreement across observers for individualHPL dimensions was less than 80 percent, and the agreement for
416 Journal of Engineering Education October 2008
Figure 2. VaNTH Observation System Classroom Interaction Observation (CIO) codes (Harris and Cox, 2003).

combinations of the dimensions was even lower (Cox, 2005). Thismeans that rating the four dimensions independently does not ap-pear to capture the HPL experience reliably. The low levels of agree-ment across observers within this study justify the creation of a newHPL index or assessment method that not only looks at one part of aCIO category, the how category (i.e., knowledge-centeredness,learner-centeredness, assessment-centeredness, community-centeredness, and organization), but uses an entire CIO code stringcategory to determine the amount of HPL-oriented instruction thatis present within a class session.
V. DEVELOPMENT OF THE HPL INDEX FROM
CLASSROOM INTERACTION CODE STRINGS
A. Development of a New HPL IndexBecause of the limitations of the existing cumulative index, a new
index for assessing the presence of HPL-oriented classroom activi-ties was developed that incorporates more information from theCIO. Specifically, this index of HPL uses specific CIO code stringsthat are classified as representing HPL-based or traditional instruc-tion, along with classroom organization or management activities. Inthis way all possible code strings (across all HPL, traditional peda-gogy, as well as classroom organization) sum to 100 percent of theobserved class time. Unlike the prior assessment method, which cat-egorizes the amount of HPL-oriented pedagogy within a class usingonly the how category within the CIO, the new HPL index reportsthe amount of HPL-oriented instruction within a class using codestrings representing all five CIO categories (i.e., who - to whom –what - how – media). Despite this added complexity in depictingpedagogy, the new integrated index actually simplifies the interpre-tation of the data, allowing for a single index from which to comparepedagogical styles in traditional and nontraditional engineeringclassrooms. More importantly, it better represents the interplay ofthe four HPL dimensions and the integration of other HPL-orientedbehaviors such as higher order questioning and group work.
B. Translation of CIO Code Strings into an Overall HPL Index and Subcategories
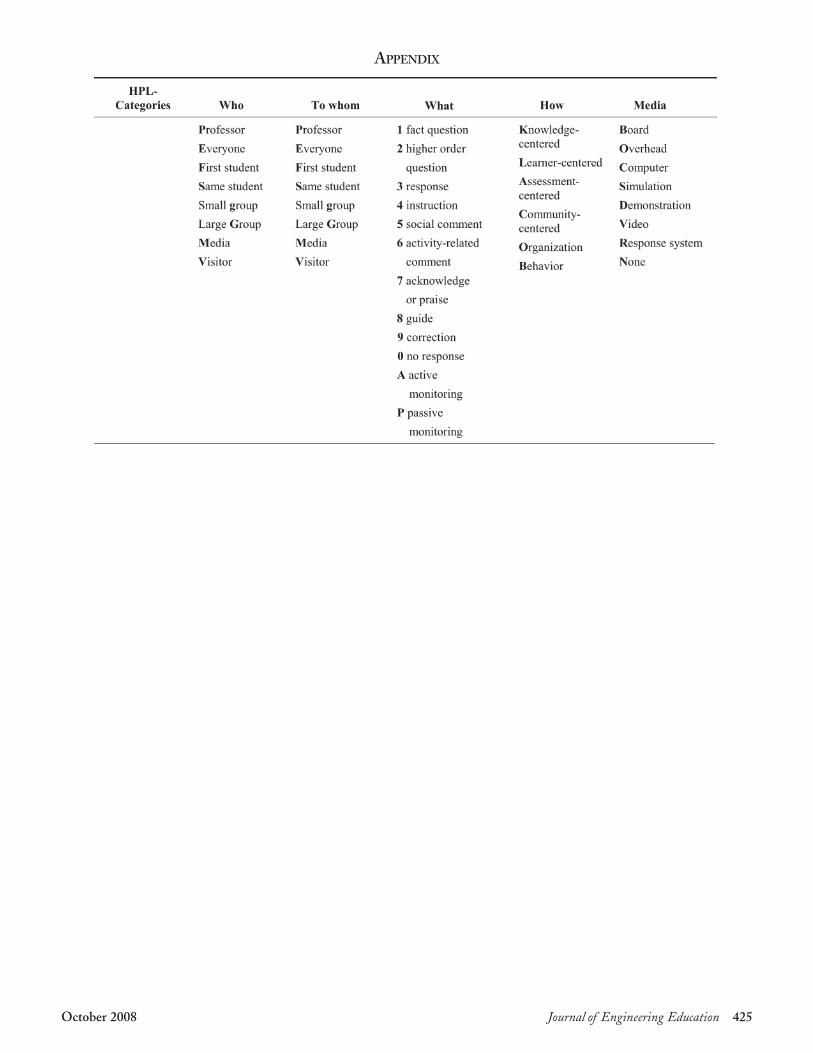
Given that there are five categories within the CIO componentof the VOS that comprise one code string and various interactionsamong the categories, permutations of these categories could pro-duce at least 24,500 potential code string combinations. However,most of the combinations are not meaningful or feasible. To createa workable index, members of the VOS assessment team classifiedpossible CIO code string combinations (i.e., who - to whom – what -how – media) as representations of either HPL-oriented instruction,traditional instruction, or classroom organization. The end product
of this review and assessment was the specification of 135 selectedcode strings. These are present in the appendix.
Code strings associated with HPL-oriented instruction and tra-ditional instruction were further grouped into eleven and seven sub-categories, respectively (Table 1). When combined with codestrings representing classroom organization, the sum of all codestrings equals 100 percent of recorded activities in each classroomobservation period. All courses were observed multiple times (4–15)per semester.
C. How People Learn (HPL) Pedagogical SubcategoriesDescriptions of the 11 HPL pedagogical subcategories within
the HPL Index, and the reasons for these subcategories’ classifica-tions as HPL are described below. Refer to Figure 2 for the CIOcode string categorizations (in the form of who -to whom – what -how – media categories). Note that although a class may be designatedas lecture-based, it can contain the HPL-oriented elements describedbelow.
● Higher-order questioning by the instructor and higher-orderquestioning by the class represent open-ended questions thatare asked within the observed class. These questions are morethought-provoking than fact-based, yes-or-no questions.Higher order questioning is a tenet of the HPL framework.Example #1: Higher-order questioning by the instructor occurswhen an instructor asks the entire class a higher order ques-tion that incorporates both knowledge-centered and assess-ment-centered dimensions as the professor uses the board(CIO Code String: P-E-2-K/A-B). Example #2: Higher-order questioning by the class occurs when an initial studentasks an instructor a higher-order question about the sameacademic content that is written on the board (CIO CodeString: F-P-2-K/A-B).
● Guidance by the instructor occurs when an instructor guidesstudents to correct answers that they are trying solve withinan observed class. Professor guidance is a tenet of the HPLframework, since it allows students to refine their thinkingabout academic content. Example: An instructor gives theentire class a hint about a problem solution when no one re-sponds to a knowledge-centered, learner-centered, and as-sessment-centered question that is displayed on an overhead(CIO Code String: P-E-8-K/L/A-O).
● HPL-oriented lecture occurs when an instructor lectures usingmultiple HPL dimensions (knowledge-, learner-, assess-ment-, and community-centered). Example: An instructoruses PowerPoint to lecture to an entire class of students aboutacademic content that incorporates knowledge-centered,learner-centered, and community-centered dimensions(CIO Code String: P-E-4-K/L/C-C).
October 2008 Journal of Engineering Education 417
Figure 3. Comparisons of traditional and HPL-oriented classes adding individual HPL dimensions to create an index.

● HPL-oriented comments occur when an instructor or studentsmake in-class comments about academic content using multi-ple HPL dimensions. Example: An instructor uses no mediaas she makes a comment that is tangentially related to academ-ic content that incorporates knowledge-centered and learner-centered dimensions (CIO Code String: P-E-6-K/L-N).
● HPL-oriented praise occurs when an instructor praises stu-dents after they respond to an HPL-oriented question orHPL-oriented comment. Example: An instructor compli-ments a small group of students who have developed a solu-tion to a higher-order question asked by the instructor earlierin the class period (CIO Code String: P-g-7-K/L/A/C-N).
● HPL-oriented monitoring occurs when an instructor observesstudents or walks among students as they work on in-classactivities that represent multiple HPL dimensions. Much ofthis monitoring occurs when students are working in groups.Example: An instructor stands at the front a classroom andwatches students as they work on seatwork that requiresthem to develop a solution to a problem that incorporatesknowledge-centered, learner-centered, and assessment-centered dimensions (CIO Code String: P-E-11-K/L/A-N).
● HPL-oriented questions and responses are lower-level (yes orno) questions and responses to questions that represent mul-tiple HPL dimensions. Example: An initial student in a classasks the instructor a question that incorporates knowledge-centered, assessment-centered, and community-centereddimensions (CIO Code String: F-P-1-K/A/C-N).
● HPL-oriented correction occurs when an instructor correctsstudents after they respond to an HPL-oriented question orHPL-oriented response. Example: An instructor solves aproblem on the board after a student incorrectly answer aquestion that incorporates knowledge-centered, learner-centered, and assessment-centered dimensions (CIO CodeString: P-S-9-K/L/A-B).
● Use of a Personal Response System occurs when an instructoruses a wireless response unit to obtain formative feedbackfrom students. The wireless response unit used withinVaNTH-observed classes is called a Personal Response Sys-tem (PRS). Every interaction that occurs while a PRS is inuse is placed in this subcategory, since the purpose for usingthe PRS is to make students’ thinking visible about their
understanding of academic content. Example: A student usesher PRS unit to reply to a higher-order question asked by aninstructor (CIO Code String: F-P-3-K/L/A-R).
D. Traditional Pedagogical SubcategoriesUsing the five CIO categories within the VOS as a guide, all pos-
sible traditional code strings can be classified into one of seven tradi-tional pedagogical subcategories. Relative to the HPL dimensions,traditional instruction is characterized by in-class instructional behav-iors that are typically noted within classrooms such that there is limitedintegration of all HPL dimensions within instruction. Specifically, thisinvolves the use of the knowledge-centered dimension (since VOScoders assigned this code to every activity that was not classroom orga-nization) or the use of only the knowledge-centered and assessment-centered dimensions. General descriptions of each subcategory andreasons for these subcategories’ classifications as traditional are de-scribed below. Note that although a class may be designated as HPL-oriented, it can contain the traditional elements described below.
● Instruction by media represents media-led classroom instruction(e.g., video) that represents the knowledge-centered dimen-sion. Example: A video presents lecture material to students(CIO Code String: M-E-4-K-V).
● Traditional question and response are lower-level (yes or no)questions and responses that represent only the knowledge-centered and assessment-centered dimensions. Example: Aninstructor replies to a student’s question that incorporatesboth knowledge-centered and assessment-centered dimen-sions (CIO Code String: P-S-3-K/A-N).
● Traditional lecture occurs when an instructor lectures usingonly the knowledge-centered dimension or the knowledge-centered and assessment-centered dimensions. Example: Aninstructor writes mathematical equations on the board (CIOCode String: P-E-4-K-B).
● Traditional comments occur when an instructor or studentsmake in-class comments about academic content using onlythe knowledge-centered dimension or knowledge-centeredand assessment-centered dimensions. Example: An instruc-tor presents the class with a comment about academic con-tent (CIO Code String: P-E-6-K-N).
● No response in a traditional manner relates to students notresponding to a professor’s question that uses only the
418 Journal of Engineering Education October 2008
Table 1. Subcategories of HPL-oriented instruction and traditional instruction.

knowledge-centered dimension or knowledge-centered andassessment-centered dimensions. Example: No studentswithin a class reply to the instructor’s lower-level questionthat incorporates knowledge-centered and assessment-centered dimensions (CIO Code String: E-P-10-K/A-N).
● Traditional praise occurs when an instructor praises studentsafter they respond to a lower-level “yes” or “no” question or toa question that does not represent the integration of multipleHPL dimensions. Example: An instructor praises a studentafter he answers a lower-level question that integrates knowl-edge-centered and assessment-centered dimensions (CIOCode String: P-S-7-K/A-N).
● Traditional correction occurs when a professor corrects stu-dents after they respond to a question that uses only theknowledge-centered dimension or knowledge-centeredand assessment-centered dimensions. Example: An in-structor corrects a student who incorrectly answers alower-level question that incorporates knowledge-centeredand assessment-centered dimensions (CIO Code String:P-F-9-K/A-N).
VI. METHODS
A. Research SampleThe analyses using the new HPL Index are based on 182 class-
room observations in 28 bioengineering courses at Vanderbilt Uni-versity. Seventeen of these courses were designated as experimental(primarily implemented HPL-oriented pedagogical practices)classes, and eleven were designated as control (primarily used tradi-tional, or nonHPL, engineering practices) classes. Although facultyteaching the HPL-oriented courses received no formal pedagogicaltraining within their classes, they helped to design and to imple-ment curricula that incorporated elements of the HPL frameworkwithin their courses. Indirectly, these faculty gained some under-standing about the HPL framework lenses. Traditional faculty, onthe other hand, were given no HPL-oriented materials to use intheir classrooms and were informed to teach their courses in theirusual manner. Both groups of faculty gave VOS observers permis-sion to observe their classrooms at various times throughout eachsemester. Data were collected by trained VOS observers during fiveacademic semesters between spring 2002 and spring 2004. Some ofthe observers were aware of the designation of courses as either tra-ditional or HPL-oriented, and some of the observers were not.Table 2 lists the courses observed each semester along with thenumber of classes observed within each course.
B. Data AnalysisBased upon VaNTH ERC researchers’ designations of the 28
courses within the sample as either HPL or nonHPL, the first au-thor grouped the sample of courses accordingly. Microsoft Excelfiles containing CIO data for each class session were created, andincomplete rows and columns of data were removed from each datafile. Excel files for each observed session were imported into SPSS,and the SPSS syntax, created by the first author, representing HPLand traditional subcategories within the HPL Index was run. (Acopy of the SPSS syntax for constructing the index is available fromeither author.) From here, the frequencies of all CIO code stringswithin each subcategory were reported. All frequencies representing
the seven traditional subcategories were summed to create a tradi-tional pedagogical instruction percentage, and all frequencies repre-senting the 11 HPL subcategories were summed to create an HPLpedagogical instruction percentage. Individual class profiles of aver-age percentages of traditional and HPL instruction and classroomorganization were then created.
VII. RESULTS
Using the HPL Index to categorize all 36,188 code strings across28 observed courses, independent sample t-tests were run withinSPSS. The t-test was used to compare the HPL Subcategory Sumand the Traditional Subcategory Sum using HPL-oriented or tra-ditional course classifications as a grouping variable. Mean occur-rences and t-test results for both instructional sums are displayed inTable 3. A Levene’s test for equality of variances was run. At a fami-ly p � 0.05, a Bonferroni correction was used to calculate an indi-vidual p � 0.025, since two independent hypotheses on the samedata were tested. Results reveal statistically significant differencesbetween HPL-oriented and traditional courses for both the HPLSubcategory Sum and the Traditional Subcategory Sum. Com-pared to lecture-based courses, HPL-oriented courses reported ahigher HPL Subcategory Sum ( –x � 17.81 and –x � 12.66, p �0.025), and compared to HPL-based courses, lecture-based coursesreported a higher Traditional Subcategory Sum (–x � 70.63 and–x � 65.38, p � 0.025) (Table 3).
Since the HPL Subcategory and Traditional SubcategorySums were found to be statistically significant for both HPL-ori-ented and traditional courses, additional independent t-tests wererun on the 18 subcategories (Table 4). A Levene’s test for equalityof variances was run. At a family p � 0.05, a Bonferroni correctionwas used to calculate an individual p � 0.003, since 18 indepen-dent hypotheses on the same data were tested. Five HPL subcate-gory items and four traditional subcategory items were found to bestatistically significant. Compared to traditional, lecture-basedclasses, HPL-designated classes reported higher occurrences forthe following five HPL subcategories: guidance by the instructor( –x � 0.99 and –x � 0.69, p � 0.003), comments ( –x � 2.94 and–x � 1.74, p � 0.003), praise (–x � 1.06 and –x � 0.58, p � 0.003),monitoring (–x � 2.32 and –x � 0.69, p � 0.003), and question andresponse ( –x � 3.56 and –x � 1.65, p � 0.003). Compared toHPL-designated classes, lecture-based classes reported higher oc-currences for the following three statistically significant traditionalsubcategory items: instruction by media ( –x � 0.99 and –x � 0.69,p � 0.003), lecture ( –x � 0.99 and –x � 0.69, p � 0.003), and noresponse ( –x � 0.99 and –x � 0.69, p � 0.003). The fourth statisti-cally significant traditional subcategory item, praise, had a higheroccurrence in HPL-oriented courses than within traditionalcourses ( –x � 0.99 and –x � 0.69, p � 0.003).
VIII. DISCUSSION
The HPL Index described in this paper provides informationabout the frequencies (percentages of observed instances) in whicheach of the HPL and traditional subcategories occur within lecture-based and HPL-oriented courses. Although subcategory trends aresimilar within both HPL-oriented and traditional courses, the
October 2008 Journal of Engineering Education 419

Index confirms that HPL courses promote supportive classroomenvironments so that instructors are more likely to praise their stu-dents when they answer questions correctly and are more likely toguide their students to correct answers instead of automatically cor-recting their answers or asking another student for a correct answer.In addition, group work (in the form of monitoring) is an occur-rence within HPL courses that allows students to interact with oneanother during class time.
Results from the Index also show that although lecture is moreprevalent within traditional courses than within HPL courses, it isthe most frequently used pedagogical practice within both coursetypes. Although faculty may think that they are introducing innova-tive curricula and pedagogy into their courses, without formal train-ing in pedagogical innovations and strategies, the majority of engi-neering faculty members rely upon lecture-based instruction as theirprimary method of instruction within engineering courses (Rugarciaet al., 2000). This is not surprising, since many engineering facultyreceive little or no teaching experience within their graduate pro-grams prior to accepting university positions (Ruscio, 1987; Boice,
1991; McDermott, 1990; Reinarz, 1991; Shea and Taylor, 1990;Stice et al., 2000; Seymour et al., 2005). With the added service andresearch responsibilities, by the time many engineering faculty enterthe professoriate, they have little or no time to develop into “expertteachers”—those faculty who excel in their content areas, possesspedagogical knowledge, and understand the integration of theirdisciplinary areas and pedagogy (Fink, Ambrose, and Wheeler,2005).
Future research is needed to provide details about both the fre-quencies and the sequence, or ordering, of code strings analyzed usingthe HPL Index. In this way, researchers may note whether there areinstructional patterns (e.g., higher order questioning followed bymonitoring) that positively impact student outcomes or if there areoverall course profiles that promote desired student outcomes withina variety of learning environments (e.g., laboratories, large lecturecourses). Additional research can explore whether there are certainlevels of HPL-oriented instruction that connect to decreases or in-creases in student outcomes and whether instructors’ pedagogical pat-terns change over time given the feedback they receive from HPL
420 Journal of Engineering Education October 2008
Table 3. Distribution of HPL and traditional categories of instructional practices and organization.
Table 2. Biomedical engineering courses and the number and sizes of classes* observed using the VaNTH Observation System.

Index data. In addition, studies may explore the role of lecture withininnovative and traditional courses and the role that class size plays inthe implementation of HPL-based practices.
Because of these limitations for faculty, results obtained fromthe HPL Index may be translated into deliverables that might givegraduate teaching assistants (GTAs) within engineering disci-
plines formative feedback on their teaching so that they can revisetheir pedagogical practices prior to entering the professoriate andcan identify and mitigate potential problems and hindrances tostudent learning within their courses. Often, GTAs receive little tono formal pedagogical training (White, 1993; Bomotti, 1994;Cahn, 1994, Rushin et al., 1997; Shannon, Twale, and Moore,
October 2008 Journal of Engineering Education 421
Table 4. Distribution of HPL and traditional sub-categories of instructional practices.
1998; Golde and Dore, 2001), obtain limited information withintheir GTA training sessions (White, 1993; Tang and Sandell,2000), and receive no pedagogical mentoring by faculty teachingcourses in which they are GTAs (Baiocco, 1998).
Finally, by examining differences within and across innovativeand conventional engineering courses, this study emphasizes aneed for faculty and graduate student development programs tar-geted at improving pedagogy within engineering classrooms andlaboratories. More specifically, higher education institutions anduniversity teaching centers may translate empirical findings fromschemes such as the HPL Index into deliverables that will informengineering faculty and engineering doctoral students pursuingcareers in academia about effective classroom practices. Using theresults from the HPL Index could introduce engineering GTAsto effective pedagogy and could provide them with tools that theycan use beyond single semester GTA assignments.
IX. LIMITATIONS
Despite the potential merit of this work, the authors acknowl-edge its limitations. First, because of the intricacy and complexity ofthe new coding scheme, new observers may have to undergo intensetraining to achieve inter-rater reliability and to interpret the find-ings for each class session. If the intricacy of this proposed system isa concern, the authors recommend that observers consider usingother validated tools that embrace the principles of the HPL frame-work or consider revising the CIO and the HPL Index for their re-search purposes. Second, since the HPL Index was created usingconfigurations of “strings” of codes that represent a global classfocus, it records information about subgroups but does not detail in-formation about the number of these interactions and the contentof the interactions. For this reason, certain characteristics of theHPL framework (e.g., small group interactions) are not explicitlyreported within the classroom observation results. However, thesedetails can be extracted from the original HPL Index code strings(see Appendix). Future subcategories might reflect such interac-tions so that faculty can understand the frequency in which they en-gage in classroom activities such as group work.
Possible observer bias might be an issue of concern. To examinethe possibility of observer bias, the HPL sums and organizationalsums were calculated for two observer groups- (1) observers whowere aware of course designations as traditional or HPL-orientedand (2) observers who were not aware of these course designations.There were no obvious trends across both groups. HPL sums forboth groups were 16.3 percent and 16.5 percent. Observers whowere aware of course designations reported more time devoted toorganization (17.8 percent) than observers who were not aware ofcourse designations (12.4 percent). Given the small sample sizes,the differences in the organization sum are not significant.
X. FUTURE RESEARCH
In the future, lessons learned via the creation of the HPL Indexwill be used to inform the development of a formative assessment toolwithin a one-credit hour seminar for graduate teaching assistants(GTAs) who have significant responsibilities for undergraduate stu-dent learning (NSF #0632879). Within the course, GTAs will
● Interpret the pedagogical feedback that they receive from theHPL Index and the extent to which they are implementingHPL-based pedagogical practices into their laboratoryteaching.
● Develop their pedagogical expertise through an introductionto HPL-based teaching methods and strategies that can beincorporated into their engineering laboratory courses.
● Build a support network or community with other engineer-ing GTAs and engineering faculty through engagement inopen dialogues about teaching and curricular design for un-dergraduate engineering courses.
● Explore the impacts of their teaching and curricular innova-tions on undergraduate student learning and retention.
Researchers will evaluate whether the pedagogical perceptions ofGTAs enrolled within the graduate course differ significantly fromthe pedagogical perceptions of GTAs who are not enrolled withinthe graduate course. In this way, the impact of formative assessmentfor GTAs may be evaluated.
Since the VOS has been used exclusively within classroom set-tings to observe one instructor, another extension of the current re-search involves the piloting and possible revision of the CIO por-tion of the VOS for engineering laboratory environments (NSF #0648380). Some questions that might be answered via this researchinclude the following:
● How does instruction differ between traditional classroomenvironments and laboratory environments?
● Are the 18 HPL Index subcategories still present within ob-served laboratories? Should additional subcategories beadded? What are the frequencies and sequences of these sub-categories within these laboratories?
● Can the CIO and the HPL Index be used effectively withinlaboratory environments? What elements are and are notapplicable and generalizable?
XI. CONCLUSIONS
The criterion contrast study of the HPL Index supports thestudies described in Section IV of this paper. More specifically, thecriterion contrast of the HPL Index is confirmed since results fromthe Index distinguish pedagogy between courses based upon HPLprinciples and courses based on traditional, non-HPL pedagogy.HPL Index results demonstrate statistically significant differencesbetween HPL and traditional courses for nine subcategories devel-oped within the Index. Surprising, however, are the high uses oftraditional lecture (48.41 percent and 52.85 percent) and the lowoccurrences of the HPL subcategories within both types of courses(17.81 percent and 12.66 percent).
Now that the HPL Index can provide a way of displaying thepresence of the four HPL lenses via 100 percent of observed classtime, future research might explore whether there should be a “goldstandard” of HPL instruction within courses, how levels of HPLinstruction vary across different learning environments (e.g., engi-neering laboratories, K-12 classrooms), and how the presence of theHPL Index subcategories relate to student learning within STEMcourses. In addition, research might explore ways to simplify theIndex so that observers can be trained more easily or so that resultscan be translated into profiles that might be used in conjunctionwith other methods of teacher evaluation, such as student ratings
422 Journal of Engineering Education October 2008

and course material evaluation, to provide a more comprehensivepicture about how faculty convey information to students withincourses over time.
ACKNOWLEDGMENTS
This work was supported primarily by the Engineering ResearchCenters program of the National Science Foundation under annualgrant EEC-9876363 .
The authors would like to thank members of the VaNTH Engi-neering Research Center’s VaNTH Observation System Assess-ment Team, Dr. Alene H. Harris, Mr. Robert Brychta, and Mr.Douglas Anderson, for their assistance in categorizing the codestrings within the HPL Index and VOS data collectors, Dr. Harris,Mr. Chad Washington, Ms. Jessica Bell, Mr. Ken Wright, andMr. Michael Gallucci, for their contributions to the data collectionprocess. The first author also wishes to thank Dr. John M. Braxton,Dr. Ellen Goldring, Dr. Alene Harris, Dr. Thomas R. Harris,Dr. Kenneth Wong, Dr. Sean Brophy, Dr. Bughran Yalvac, Dr.Barbara Olds, Dr. Mary Johnson, Dr. Georgine Pion, and Dr. HeidiDiefes-Dux for their valuable feedback concerning the revision ofthe HPL Index and of the presentation of this work to national andinternational engineering education audiences. Thanks to PurdueUniversity students Nathan McNeill, Rocio Chavela Guerra, JamesCawthorne, Tameka Clarke Douglas, Tenille Medley, and JeremiHayes for their conversations about future directions and applica-tions of this research. Finally, the authors acknowledge the qualityfeedback from reviewers and editors in the development of the finalmanuscript.
REFERENCES
Adolf, J.W. 1983. An examination of Stallings’ implementation and
child effects of teaching practices in follow through classrooms. ERIC
Ascension Number ED234907.
Baiocco, S.A., and J.N. DeWaters. 1998. Successful college teaching:
Problem-solving strategies of distinguished professors. Old Tappan, NJ: Allyn &
Bacon, Prentice Hall.
Biglan, A. 1973. Relationships between subject matter characteristics
and the structure and output of university departments. Journal of Applied
Psychology 57 (3): 204–13.
Boice R. 1991. Quick starters: New faculty who succeed. In Effective
practices for improving teaching. New directions for teaching and learning, eds.
Michael Theall and Jennifer Franklin, No. 48. San Francisco, California:
Jossey-Bass Publishers.
Bomotti, S. 1994. Teaching assistant attitudes toward college teaching.
Review of Higher Education 17: 371–93.
Bransford, J.D., A.L. Brown, and R.R. Cocking. 1999. How people learn:
Brain, mind, experience, and school. Washington, DC: National Academies Press.
Bransford, J., N. Vye, and H. Bateman. 2002. Creating high-quality
learning environments: Guidelines from research on How People Learn.
In The knowledge economy and postsecondary education: Report of a workshop.
National Research Council, Committee on the Impact of the Changing
Economy of the Education System, eds. P.A. Graham and N.G. Stacey.
Washington, DC: National Academies Press.
Cabrera, A.F., C.L. Colbeck, and P.T. Terenzini. 2001. Developing
performance indicators for assessing classroom teaching practices and stu-
dent learning: The case of engineering. Research in Higher Education 42 (3):
327–52.
Cahn, S.M. 1994. Saints and scamps: Ethics in academia (Rev. ed.).
Lanham, MD: Rowman and Littlefield.
Cooper, J., and P. Robinson. 1998. Small-group instruction in science,
mathematics, engineering, and technology (SMET) disciplines: A status
report and an agenda for the future. Journal of College Student Teaching 27
(6): 383–88.
Cordray, D.S., G.M. Pion, A. Harris, and P. Norris. 2003. The value
of the VaNTH Engineering Research Center. IEEE Engineering in Medi-
cine and Biology Magazine 22 (4): 47–54.
Cox, M.F. 2005. An examination of the validity of the VaNTH Observation
System (VOS), Unpublished doctoral dissertation. Nashville, TN: Vanderbilt
University.
Cox, M.F. 2006.VaNTH Observation System component assessment.
In Proceedings of the American Society for Engineering Education Annual Con-
ference and Exposition. Chicago, IL.
Cudd, T.A., and J.S. Wasser. 1999. Biomedical device design discovery
team approach to teaching physiology to undergraduate bioengineering
students. American Journal of Physiology 277 (22): S29–S41.
Doherty, R.W., Hillberg, R.S., Epaloose, G., and Tharp, R.G. 2002.
Standards performance continuum: Development and validation of measure
of effective pedagogy. The Journal of Educational Research 96 (2): 78–91.
Fink, L.D., S. Ambrose, and D. Wheeler. 2005. Becoming a profes-
sional engineering educator: A new role for a new era. Journal of Engineer-
ing Education 94 (1): 185–94.
Golde, C.M., and T.M. Dore. 2001. At cross purposes: What the expe-
riences of doctoral students reveal about doctoral education. Philadelphia,
PA: Pew Charitable Trusts.
Harris, A.H., D.S. Cordray, and T.R. Harris. 2002. Measuring what is
happening in bioengineering classrooms—An observation system to ana-
lyze teaching in traditional versus innovation classrooms. In CD Proceedings
of the Second Joint EMBS-BMES Conference, 2618–19. Houston, TX.
Harris, A.H., and M.F. Cox. 2003. Developing an observation system
to capture instructional differences in engineering classrooms. Journal of
Engineering Education 92 (4): 329–36.
Herkert, J.R. 1999. ABET ’s engineering criteria 2000 and engineering
ethics: Where do we go from here? Presentation at the Online Ethics Center
International Conference on Ethics in Engineering and Computer Sci-
ence. http://www.onlineethics.org/Default.aspx?id=8944 (last accessed,
August 2008).
Jansen, E.D., S.P. Brophy, A. McKenna, A. Mahdevan-Jansen, and
J.T. Walsh, Jr. 2003. Implementation and assessment of challenge-based
instruction in a biomedical optics course. In Proceedings of the American Soci-
ety for Engineering Education Annual Conference and Exposition, Session
1309. Nashville, TN.
Knight, S.L. 2001. Using technology to update traditional classroom obser-
vation instruments. Paper Presented at the Annual Meeting of the Ameri-
can Educational Research Association, Seattle, WA.
Lodahl, J.B., and G.G. Gordon. 1972. The structure of scientific fields
and the functioning of university graduate departments. American Sociologi-
cal Review 37 (1): 57–72.
McDermott, L.C. 1990. What we teach and what is learned: Closing the
gap. Paper presented at the American Association of Physics Teachers
Summer Meeting, Minneapolis, MN.
Moran, B.J., P. Haidet, C.L. Seidel, V. Schneider, R.O. Morgan,
P.A. Kelly, and B. Richards. 2003. Validation of an observation instrument
for measuring student engagement in health professions settings. Evalua-
tion and the Health Professions 26 (1): 86–103.
October 2008 Journal of Engineering Education 423

Norris, P.R., A.H. Harris, and C. Washington. 2004. The VOS data
manager: Providing immediate feedback on teaching effectiveness. In Pro-
ceedings of the American Society for Engineering Education Annual Conference
and Exposition, Session 1793. Salt Lake City, UT.
Neumann, R., S. Parry, and T. Becher. 2002. Teaching and learning in
their disciplinary contexts: A conceptual analysis. Studies in Higher Educa-
tion 27 (4): 405–17.
Piburn, M., D. Sawada, K. Falconer, J. Turley, R. Benford, and I.
Bloom. 2000. Reformed Teaching Observation Protocol (RTOP).
ACEPT IN-003. http://physicsed.buffalostate.edu/AZTEC/RTOP/
RTOP_full/index.htm (last accessed, August 2008).
Reinarz, A. 1991. Gatekeepers teaching introductory science. College
Teaching 39 (3), 94–96.
Roselli, R.J., and S.P. Brophy. 2001. Movement from a taxonomy-
driven strategy of instruction to a challenge-driven strategy in teaching
introductory biomechanics. In Proceedings of the American Society for
Engineering Education Annual Conference and Exposition, Session 1309.
Albuquerque, NM.
Roselli, R.J., and S.P. Brophy. 2003. Redesigning a biomechanics
course using challenge-based instruction. IEEE Engineering in Medicine
and Biology Magazine 22 (4): 66–70.
Rugarcia, A., R.M. Felder, D.M. Woods, and J.E. Stice. 2000. The
future of engineering education: 1. Learning how to teach. Chemical Engi-
neering Education 34 (2): 16–25.
Ruscio, K.P. 1987. Many sectors, many professions. In The academic
profession: National, disciplinary, and institutional settings, ed. Burton R.
Clark, 331–368. Berkeley: University of California Press.
Rushin, J., J. DeSaix, A. Lumsden, D. Streubel, G. Summers, and
C. Benson. 1997. Graduate teaching assistant training: A basis for im-
provement of college biology teaching and faculty development. American
Biology Teacher 59: 86–90.
Seymour, E., G. Melton, D.J. Wiese, and L. Pederson-Gallegos. 2005.
Partners in innovation: teaching assistants in college science courses. Lanham,
MD: Rowman and Littlefield Publishers.
Shannon, D.M., D.J. Twale, and M.S. Moore. 1998. TA teaching ef-
fectiveness: The impact of training and teaching experience. The Journal of
Higher Education 69 (4): 440–67.
Shea, M.A., and J.R. Taylor. 1990. Peer perspectives I: The teacher’s
story. The Physics Teacher, 454–56.
Springer, L., M.E. Stanne, and S.S. Donovan. 1998. Effects of small-
group learning on undergraduates in science, mathematics, engineering, and
technology: A meta-analysis. (Research Monograph No. 11). Madison:
University of Wisconsin-Madison: National Institute for Science Educa-
tion.
Stallings, J., and D.H. Kaskowitz. 1974. Follow through classroom ob-
servation evaluation, 1972–1973. Menlo Park, CA: Stanford Research
Institute.
Stallings, J. 1977. Learning to look: A handbook on classroom observation
and teaching models. Belmont, CA: Wadsworth Press.
Stallings, J. 1978. The development of the contextual observation system.
Paper presented at the American Education Research Association Confer-
ence. Toronto, Canada.
Stallings, J. 1980. Allocated academic learning time revisited, or beyond
time on task. Educational Researcher 40 (11): 11–16.
Stallings, J. 1986. Effective use of time in secondary reading programs.
In Effective teaching of reading: Research and practice, ed. J. Hoffman,
85–106. Newark, DE: International Reading Association.
Stallings, J., and H.J. Frieberg. 1991. Observation for the improvement
of teaching. In Effective teaching: Current research, eds. H.C. Waxman and
H.J. Walberg. Berkeley, CA: McCutchan.
Stice, J.E., R.M. Felder, D.M. Woods, and A. Rugarcia. 2000. The fu-
ture of engineering education: 1. learning how to teach. Chemical Engineer-
ing Education 34 (2): 118–27.
Tang, L., and K. Sandell. 2000. Going beyond the basic communica-
tion issues: New pedagogical training of international TAs in SMET fields
at two Ohio universities. Journal of Graduate Teaching Assistant Development
7: 163–72.
Vanderbilt-Northwestern-Texas-Harvard/MIT Engineering Research
Center for Bioengineering Educational Technologies (VaNTH), Annual
Report: Volume 1- Strategic Plan. 2002. http://www.vanth.org (last ac-
cessed, August 2008).
Vanderbilt-Northwestern-Texas-Harvard/MIT Engineering Research
Center for Bioengineering Educational Technologies (VaNTH).
http://www.vanth.org (last accessed, August 2008).
White, L. 1993. Future engineering faculty: An assessment of engi-
neering TAs. In TA experience: Preparing for multiple roles, ed. K. Lewis,
339–46. Stillwater, OK: New Forums Press.
AUTHORS’ BIOGRAPHIES
Monica F. Cox, Ph.D., is an assistant professor in the School ofEngineering Education at Purdue University. Her research interestsinclude teaching and learning in engineering education; engineeringfaculty and student development; and assessment and evaluation ofengineering curricula, faculty pedagogy, student learning, student re-tention, and student engagement within engineering courses. She isa recent NSF Faculty Early Career (CAREER) Award Recipientand is the Director of the Pedagogical Evaluation Laboratory Groupat Purdue.
Address: Purdue University, 701 West Stadium Avenue, NeilArmstrong Hall of Engineering, Room 1329, West Lafayette, IN,47907; telephone: (�1)765.496.3461; fax: (�1)765.494.5819;e-mail: [email protected].
David S. Cordray, Ph.D., is professor of Psychology andPublic Policy at Vanderbilt University. He is currently theThrust Leader in Assessment and Evaluation for the VaNTHEngineering Research Center. Professor Cordray has writtenextensively on research and evaluation methodology in educa-tion and human services areas. He has conducted experimental,quasi-experimental and meta-analytic assessments of interven-tion effectiveness in education, health, welfare, and other humanservice areas.
Address: Peabody College at Vanderbilt University, PeabodyCollege #512, 230 Appleton Place, Nashville, TN 37203-5727;telephone: (�1)615.343.2699; fax: (�1)615.343.9494; e-mail:[email protected].
424 Journal of Engineering Education October 2008
APPENDIX
October 2008 Journal of Engineering Education 425

HPL INDEX SUBCATEGORIES
426 Journal of Engineering Education October 2008
October 2008 Journal of Engineering Education 427

428 Journal of Engineering Education October 2008

October 2008 Journal of Engineering Education 429

430 Journal of Engineering Education October 2008

October 2008 Journal of Engineering Education 431