Embed Size (px)
Citation preview

ASSESSING MEASUREMENT SYSTEM ACCEPTABILITY FOR PROCESS
CONTROL AND ANALYSIS USING GAGE R&R STUDY
By
Jiahong Wang
A Research Paper
Submitted in Partial Fulfillment of the Requirements for the
Master of Science Degree In
Management Technology
Approved: 3 Semester Credits
Dr. John Dzissah
The Graduate School
University of Wisconsin-Stout
May 2004

The Graduate School
University of Wisconsin Stout
Menomonie, WI 54751
ABSTRACT
Wang Jiahong
(Writer) (Last Name) (First Name) (Initial)
Assessing Measurement System Acceptability for Process Control and
Analysis Using Gage R&R Study
(Title)
Management Technology
(Graduate Major)
John Dzissah May 2004 106
(Research Advisor) (Date) (No. of Pages)
Publication Manual of the American Psychological Association (APA)
(Name of Style Manual Used in this Study)
Gage R&R, which stands for gage repeatability and reproducibility, is a statistical
tool that is applied to measure the amount of variation in the measurement system
which arises from the people taking the measurement and the measurement device.
The purpose of conducting the GR&R is to quantify measurement error and to reduce
ii

the measurement system variation if it is excessive. In a typical gage R&R study,
several operators each measure a selected set of items more than once.
This study is pursued in a large-scale manufacturing plant in western Wisconsin
in order to evaluate the capability of a set of new measurement equipment that is just
purchased by the company. Some potential problems related to the measurement
system might be exposed after this study and recommendations would be made in
order to achieve a successful quality improvement.
iii

ACKNOWLEDGEMENTS
My sincere thanks you to, John Dzissah, my research director. John gave me
professional direction as well as his time to help me complete this study.
In addition, a deep thanks to Michelle Stewart, the Quality Manager at the
recreational vehicle manufacturing plant, who provided not only all the relevant data but
also opportunities for me to visit and research their plant.
iv

TABLE OF CONTENTS
Page
Abstract ......................................................................................................... ii
Acknowledgements ........................................................................................ iv
Table of Contents........................................................................................... v
List of Tables.................................................................................................. vii
List of Figures................................................................................................. vii
CHAPTER ONE: INTRODUCTION
Statement of the study ............................................................................... … 1
Needs for the study ...................................................................................... 2
Objectives ...................................................................................................... 2
Significance of the study ............................................................................... 2
Limitations of the study................................................................................... 2
Definitions ...................................................................................................... 2
CHARPTER TWO: LITERATURE REVIEW
Introduction ................................................................................................... 4
Measurement system error .......................................................................... 4
Measurement process variation .................................................................... 5
Location variation ..................................................................................... 5
Width variation ......................................................................................... 8
Concept of gage R&R ................................................................................... 10
Methods in gage R&R ................................................................................... 12
v

Average and Range method ................................................................... 12
ANOVA method ....................................................................................... 14
Evaluation of results ...................................................................................... 14
CHARPTER THREE: METHODOLOGY
Subjects ........................................................................................................ 16
Instrumentation .............................................................................................. 16
Method for data collection .............................................................................. 16
Data analysis.................................................................................................. 17
CHARPTER FOUR: REPORT OF FINDINGS
Results .......................................................................................................... 18
Summary of findings....................................................................................... 18
Data analysis tables ...................................................................................... 22
CHARPTER FIVE: CONCLUTIONS AND RECOMMENDATIONS
Statement of the problem .............................................................................. 28
Method and procedures ................................................................................ 28
Conclusions ................................................................................................... 28
Recommendations ........................................................................................ 29
REFERENCE ................................................................................................ 31
APPENDIX (a)................................................................................................ 32
APPENDIX (b)................................................................................................ 46
APPENDIX (c)................................................................................................ 70
APPENDIX (d)................................................................................................ 84
vi

List of Tables
Tables Page
1. Gage R&R Report for CMM (Round) ......................................................... 22
2. Gage R&R Report for CMM (Square) ........................................................ 23
3. Gage R&R Report for FARO arm (Round) ............................................... 24
4. Gage R&R Report for FARO arm (Square) .............................................. 25
5. R&R comparison sheet for CMM (Round).................................................. 26
6. R&R comparison sheet for CMM (Square)................................................. 26
7. R&R comparison sheet for FARO arm (Round) ......................................... 27
8. R&R comparison sheet for FARO arm (Square) ........................................ 27
List of Figures
Figures Page
1. Precision and accuracy .............................................................................. 5
2. Repeatability, Reproducibility, and R&R..................................................... 11
3. Average & Range Method, ANOVA Method............................................... 13
vii

CHAPTER ONE
Introduction
A successful quality improvement or statistical process control program needs
good measurement systems. More than often, a measurement system is evaluated by
performing a designed experiment known as a gauge repeatability and reproducibility
(R&R) study. The point of the study is to measure the measurement error in
measurement systems. In other words, an R&R study analyzes the variation of
measurements of a gage (repeatability) and variation of measurement by operators
(reproducibility). It is so important in today’s quality control process for the reason that
the goal of process control is reduction of variation in the process and ultimately the
products. Studies of measurement variation are a waste of time and money unless they
lead to action to reduce process variation and improve process control. Since you can’t
address something that cannot be measured precisely, the assessment of the gage
becomes an early priority (Barrentine, 2002).
Statement of the study
The purpose of this study is to evaluate a measurement system for a recreational
vehicle manufacturer in the mid-western United States. Data are retrieved from a set of
experiments that are set up on the manufacturing site. This study started in the fall
semester, 2003. The researcher observed the plant environment, assisted with the set-
up of the experiments and discussed potential problems with the vehicle maker in order
to develop the measuring system.
1

Needs for the study
This R&R study is specifically designed for the vehicle manufacturer who just
purchased a series of new measurement equipment and needs to identify the capability
of the measurement system in order to control the whole manufacturing system to
produce high quality and safe vehicles.
Objectives
1. Design and set up a gage R&R study on the Mt 4, Vector measuring system,
FARO arm, and the CMM using square tube and round tube.
2. Analyze the experimental data by using ANOVA method.
3. Assess the capability of the measurement system and make recommendations
for improvement.
Significance of the study
That the vehicle manufacturing process is in control highly relies on the capability
of the measurement system. A detailed and specific gage R&R study will be developed.
This study is planned to identify and thus prevent quality issues that are due to an
incapable measurement system. The gage R&R study is a necessary and efficient
quality control tool for the vehicle maker.
Limitations of this study
This study is limited to the researcher’s time and the work experience in the
vehicle manufacturing plant.
Definitions
Measurement: “the assignment of numbers or values to material things to
represent the relations among them with respect to particular properties.” This definition
2

was fist given by C. Eisenhart (1963). The process of assigning the numbers is defined
as the measurement process, and the value assigned is defined as the measurement
value (MSA, 1995).
Gage: any device used to obtain measurements; frequently used to refer
specifically to the devices used on the shop floor; includes go/no-go devices (MSA,
1995).
Measurement system: the collection of operations, procedures, gages and other
equipment, software, and personnel used to assign a number to the characteristic being
measured; the complete process used to obtain measurements (MSA, 2002).
Master: A standard that is used as a reference in a calibration process. May also
be termed as reference or calibration standard (MSA, 2002).
3

CHAPTER TWO
Literature Review
Introduction
This chapter will discuss the concept of measurement system variation as well as
the concept of gage R&R (repeatability & reproducibility) study and methods of a GRR
study. This chapter will conclude with a report of findings about the significance of Gage
R&R study on process control.
Measurement Systems Error
Typically, measurement system errors can be classified into two categories:
accuracy and precision.
1. Accuracy describes the difference between the measurement and the part’s
actual value.
2. Precision describes the variation you see when you measure the same part
repeatedly with the same device.
(MINITAB, 2000)
For any measurement system, there is always one or both of these problems in
it. For instance, a device may measures parts precisely but not accurately; or a device
is accurate but not precise, which means the measurements have large variance; or a
device is neither accurate nor precise (figure 1).
4

Accurate but not preciseAccurate & precise
Precise but not accurate Not accurate or precise
Figure1: Precision and accuracy
Measurement Process Variation
The measurement system’s variation can be characterized by location variation
and width vibration.
Location variation
The location variation shows how accurate the measurement system is.
Typically, it is broken into three components: stability, bias/accuracy, and linearity.
Stability is the total variation in the measurements obtained with a measurement
system of the same master or parts when measuring a single characteristic over an
extended time period. That is, stability is the change in bias over time (MSA, 2002).
Stability determination requires enough data sampled to cover a wide range of possible
variation contributors that apply to the process being measured (Niles, 2003).
Instability can be caused by:
5

1. Worn equipment or instrument
2. Normal obsolescence or aging
3. Poor maintenance – power, hydraulic, corrosion, rust, power
4. Instrument needs to be calibrated/ reducing calibration interval
5. Poor quality instrument – conformance or design
6. Damaged or worn master, error in master
7. Instrument design or method is not robust
8. Different measurement method – loading, setup, technique
9. Distortion of gage or part
10. Environmental drift – humidity, vibration, temperature
11. Improper use of the setting master
12. Violation of an assumption, error in an applied constant
13. Improper application – position, part size, operator skill, observation error
(MSA, 2002)
Bias is the difference between the true value (reference value) and the observed
average of measurements on the same characteristic on the same part (MSA, 2002). It
is the measure of the systematic error of the measurement system. Bias is the
contribution to the total error consisting of the combined effects of all sources of
variation, known or unknown. The variations’ contributions to the total error tend to
offset predictably and consistently all results of repeated applications of the same
measurement process at the measurement time period (MSA, 2002).
Excessive Bias can be resulted from:
1. Worn equipment, instrument or fixture
6

2. Equipment needs calibration
3. Damaged master/error in master
4. Poor quality instrument – conformance or design
5. Improper use of the setting master
6. Wrong gage for the application
7. Wrong Measuring characteristic
8. Linearity error
9. Distortion (part or gage)
10. Difference measurement method
11. Environmental drift – humidity, vibration, temperature
12. Improper use of the setting master
13. Violation of an assumption, error in an applied constant
(MSA, 2002)
Linearity is referred to as the difference of bias throughout the expected
operating range of the equipment (MSA, 2002). A measurement process may have the
capability of measuring small parts but much less accurate when measuring large parts
or one end of a long part can be measured more accurately than the other end. It can
be considered as a change of bias with respect to size.
If a measurement system has non-linearity, the possible causes can be:
1. Improper instrument calibration at both lower and upper end of the range
2. Damaged or worn instrument
3. Imprecise or inaccurate gage for application
4. Wrong instrument design characteristics
7

5. Environmental causes – humidity, vibration, or temperature
Width variation
The width variation shows how precise the measurement system is. Typically, it
is broken into two components: Repeatability and reproducibility.
Repeatability is usually considered as the “with appraiser” variability. It is the
measurement variation which is obtained with one measurement instrument used by
one appraiser several times while measuring the identical characteristic on the same
part (MSA, 2002). Usually, repeatability is regarded as equipment variation (EV),
although this is not correct. In fact, repeatability is the common cause (random error)
variation resulting from successive trials under defined and specific conditions of
measurement. The correct term for repeatability is within-system variation when the
condition of measurement are defined and fixed, (Fixed instrument, standard, operator,
part, method, and assumptions and environment) (MSA, 2002). Two common sources
of repeatability error are measurement variations due to the positional variation of the
part in the instrument and instrument itself. The range chart is used to show the
consistency of the measurement process because both of these variations are
represented by the subgroup ranges of repeated measurements.
Besides the two common sources of repeatability errors, other possible errors
include:
1. Within-instrument: wear, repair, fixture failure, poor maintenance or quality
2. Within-standard: class, wear or quality
3. Within-method: Variation in technique, setup, holding, zeroing, point density, or
clamping
8

4. Within-part (sample): position, surface finish, form, sample consistency and taper
5. Within-environment: temperature, humidity, lighting, cleanliness and vibration
6. Within-appraiser: Position, experience, technique, fell, fatigue or training/
manipulation skill
7. Wrong gage for the application
8. Lack of rigidity (gage or part)
9. Violation of an assumption – proper operation or stable
10. Instrument design or method is not robust and uniform
11. Application – position, observation error or part size
(MSA, 2002)
Reproducibility is the “between appraisers” variability. Typically, it is defined as
the variation in the average of the measurements which are made by different
appraisers who use the same measuring instrument when measuring the same
characteristic on the same part. This is often true when the manual instruments are
influenced by the operators’ skill. However, it is not true when the measurement
processes (i.e., automated systems) is used where the operator is not a significant
source of variation. Because of this reason, reproducibility is considered as the average
variation between-conditions or between systems of measurement (MINTAB, 2000)
Possible sources of reproducibility error in a measurement system include:
1. Between-instruments: average difference using instruments A, B, C, etc., for the
same operators, parts and environment.
2. Between-parts: average difference when measuring types of parts A, B, C, etc.,
using the same instrument, method and operators.
9

3. Between-methods: average difference caused by changing point densities,
zeroing, manual versus automated systems, clamping methods, or holding, etc.
4. Between-standards: average influence of different setting standards in the
measurement process.
5. Between-appraisers: average difference between appraisers caused by
technique, skill, training and experience. This is recommended study for process
qualification and product and a manual instrument.
6. Between-environment: average difference in measurements over time caused by
environmental cycles: this is the most common study for highly automated
systems in product and process qualification
7. Instrument design or method is not robust
8. Assumption violation
9. Ineffective operator training
10. Application – position, observation error or part size
(MSA, 2002)
Concept of Gage R&R
“Gage refers to any device used for making measurements.” (Barrentine (2002).
An R&R study analyzes the variation of measurements of a gage (repeatability) and
variation of measurement by operators (reproducibility). It plays a significant role in
today’s quality control process for the reason that the goal of process control is to
reduce variation in the process and the products. However, studies of measurement
variation are a waste of time and money unless they lead to action to reduce process
variation and improve process control. “Since you can’t address something that cannot
10

be measured precisely, the assessment of the gage becomes an early priority.”
(Barrentine, 2002). “Gage R&R is an estimate of the combined variation of repeatability
and reproducibility” (MSA, 2002) (figure 2). It amounts to the sum of between-system
variances and within-system variances.
Repeatability
Reproducibility
R&R
Distribution of repeated measurements on the same part by one owith the same gage
perator
Distribution of the averages of many operators using the same gage
The combined effect of gage variation among operators
Figure 2 Repeatability, Reproducibility, and R&R (Barrentine, 2002)
The capacity of a measurement system simply includes the components of:
1. Repeatability and reproducibility (GR&R), including short-term consistency
2. Uncorrected bias or linearity
When the measurement errors are random and independent (uncorrelated), the
capacity expression of combined variation can be quantified as:
σ2capacity = σ2
bias (linearity) + σ2GRR
11

Methods in Gage R&R study
Gage R&R can be applied to any kind of measurements (attribute or variables,
indeterminate or determinate).There are many methods overviewed in the literature that
can be used to perform Gage R&R. A few of these methods are as follows:
1. Average and range method
2. Analysis of variance (ANOVA) method
3. Within part variation (WIV) method
4. Automotive Industry Action Group (AIAG, Southfield, MI) method
5. Short range method for destructive testing
6. Short range method for non-destructive testing
7. Long range method for destructive testing
8. Long range method for non-destructive testing
9. The Instantaneous method (one appraiser for equipment variation only) (Keller,
2003)
However, the two most common method types used and supported by statistical
software are the ANOVA method (Analysis Of Variance) and the average and range
method.
Average and Range Method
The Average and Range method(X and R) is a mathematical method which
provides estimates for variability caused by reproducibility and repeatability. This
method allows the measurement systems to be broken down into three separate
components: part-to-part, repeatability and reproducibility, but not their interaction. The
12
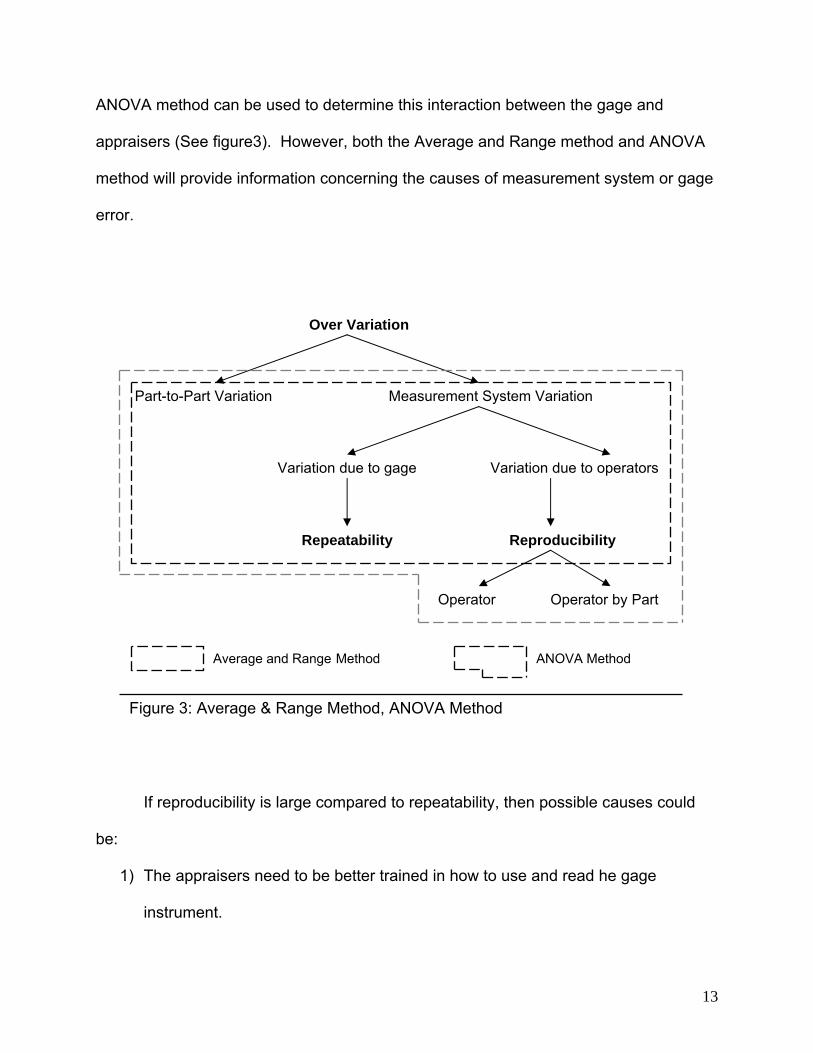
ANOVA method can be used to determine this interaction between the gage and
appraisers (See figure3). However, both the Average and Range method and ANOVA
method will provide information concerning the causes of measurement system or gage
error.
Over Variation
Part-to-Part Variation Measurement System Variation
Variation due to gage Variation due to operators
Repeatability Reproducibility
Operator Operator by Part
ANOVA Method Average and Range Method
Figure 3: Average & Range Method, ANOVA Method
If reproducibility is large compared to repeatability, then possible causes could
be:
1) The appraisers need to be better trained in how to use and read he gage
instrument.
13

2) Calibrations on the gage dial are not correct.
3) A fixture of some sort may be needed to help the appraiser use the gage more
consistently.
If repeatability is larger than reproducibly, the reasons may be:
1) The instrument needs to be well maintained.
2) The gage should be redesigned to be more rigid.
3) The location or clamping for gagging needs improvements.
4) There is excessive within-part variation.
(MSA, 1995)
ANOVA method
ANOVA is a standard statistical technique and can be used to analyze the
measurement error and other sources of variability of data in a measurement systems
study (MSA, 1995). In the analysis of variance, the variation can be broken down into
four categories: parts, appraisers, interaction between parts and appraisers, and
replication error due to the gage.
The advantages of ANOVA techniques as compared with Average and range
methods are that ANOVA techniques have the capability to handle any experimental
set-up, estimate the variances more precisely and accurately, can extract more
information from the experimental data. The information includes interaction between
parts and appraisers effect.
Evaluation of results
From a Gage study, %EV (the percent the repeatability or equipment variation),
%AV (the percent the appraiser variation), %R&R (the percent the measurement
14

system variation for repeatability and reproducibility) and %PV (the percent the part-part
variation) are calculated. Guidelines for acceptance of gage repeatability and
reproducibility are:
1. Under 10% error – the measurement system is acceptable(satisfactory)
2. 10% to 30% error – the measurement system may be acceptable depending
upon importance of application, cost of repairs or cost of gage, etc.,
3. Over 30% error – measurement system is not satisfactory. It needs improvement.
Problems need to be identified and corrected.
(MSA, 1995)
15

CHAPTER THREE
Methodology
Subjects:
The purpose of this study is to evaluate the capability of the measurement
system that the manufacturing plant has recently applied in their production process.
Instrumentation:
The data collection sheets were developed by this researcher and adjusted by
the plant personnel according to the real measuring environment. Both FARO Arm
machine and CMM machine were used to measure the experimental parts.
Methods for data collection:
For each measurement machine, three appraisers were used to measure ten
square parts and ten round parts. Each appraiser had to measure the same part three
times. Each round part had seven dimensional characteristics and each square part had
twelve dimensional characteristics.
To minimize the likelihood of misleading results, the following steps were taken.
1. The sample parts were selected from the process and had to represent its entire
operating range.
2. The measurements were made in a random order.
3. The appraisers were unaware of which numbered part was being checked in
order to avoid any possible knowledge bias.
4. Each appraiser used the same procedure, including all steps, to obtain the
readings.
16

Data analysis
The numerical data that was retrieved by the appraisers has been input to
MINITAB13 software for data analysis. MINITAB is a comprehensive statistical and
graphical analysis software package and it has been providing statistical software
solutions for over 25 years. Currently, MINITAB is used by thousands of companies
worldwide, including GE, 3M, Ford Motor Company, and the leading Six Sigma
consultants.
17

CHAPTER FOUR
Report of Findings
All the data has been analyzed through MINTAB 13 software. The capabilities of
the two measuring machines (CMM & FARO Arm) are to measure both round and
square parts. These have been revealed in the data result sheets. Therefore, they
could be applied to boost the quality control system in this plant to produce safe and
quality products.
Results
The data collection sheet and the original data results can be reviewed in the
appendix at the end of the report.
Summary of Findings
The data results have been categorized in each of the following eight tables.
Please see table 1 through table 8. Key numbers have been highlighted from the
original data results in order to clarify the results. After reviewing the results of this
study, it has been determined that the current measurement system is not adequate
enough to conduct the necessary daily measuring tasks.
The following Gage R&R data result for CMM machine on the dimensional
Characteristic with target value of 6.06 is used as a sample to explain some key result
numbers.
Gage R&R for 6.06
Two-Way ANOVA Table With Interaction
Source DF SS MS F P Part 9 0.0022591 0.0002510 8.1722 0.00009 Operator 2 0.0020687 0.0010343 33.6758 0.00000 Operator*Part 18 0.0005529 0.0000307 0.5337 0.93012 Repeatability 60 0.0034533 0.0000576
A
18

Total 89 0.0083340
Two-Way ANOVA Table Without Interaction Source DF SS MS F P Part 9 0.0022591 0.0002510 4.8871 0.00003 Operator 2 0.0020687 0.0010343 20.1385 0.00000 Repeatability 78 0.0040062 0.0000514 Total 89 0.0083340 Gage R&R
%Contribution Source VarComp (of VarComp) Total Gage R&R 8.41E-05 79.13 Repeatability 5.14E-05 48.31 Reproducibility 3.28E-05 30.82 Operator 3.28E-05 30.82 Part-To-Part 2.22E-05 20.87
B
Total Variation 1.06E-04 100.00
StdDev Study Var %Study Var Source (SD) (5.15*SD) (%SV) Total Gage R&R 9.17E-03 4.72E-02 88.96 Repeatability 7.17E-03 3.69E-02 69.51 Reproducibility 5.72E-03 2.95E-02 55.52 Operator 5.72E-03 2.95E-02 55.52 Part-To-Part 4.71E-03 2.43E-02 45.68 Total Variation 1.03E-02 5.31E-02 100.00
Number of Distinct Categories = 1
C
AGMisc:Tolerance:Reported by:Date of study:Gage name:
0
6.07
6.06
6.05
6.04
KENDIANEAMI
Xbar Chart by Operator
Sam
ple
Mea
n
Mean=6.052
UCL=6.065
LCL=6.039
0
0.03
0.02
0.01
0.00
KENDIANEAMI
R Chart by Operator
Sam
ple
Ran
ge
R=0.01263
UCL=0.03252
LCL=0
10 9 8 7 6 5 4 3 2 1
6.065
6.055
6.045
6.035Part
OperatorOperator*Part Interaction
Aver
age
AMI DIANE KEN
KENDIANEAMI
6.07
6.06
6.05
6.04
6.03
6.02Operator
By Operator10 9 8 7 6 5 4 3 2 1
6.07
6.06
6.05
6.04
6.03
6.02Part
By Part%Contribution %Study Var
Part-to-PartReprodRepeatGage R&R
100
50
0
Components of Variation
Per
cent
CMMR6.06
EG
CG
BG
DG
19

A. When the p-value for “Operator by Part” is < 0.25, MINITAB fits the full model. In this
case, the ANOVA method will be more accurate than the Xbar and R method. If the
value is >0.25, MINITAB fits the model without the interaction and uses the reduced
model to define Gage R&R statistics (MINITAB User’s Guide, 2000).
B. If the percent contribution form Part-Part is larger than that of Total Gage R&R, it
tells us that most of the variation is due to differences between parts; very little is
due to measurement system error. If the percent contribution form Total gage R&R
is larger than that of Part-To-Part, it means that most of the variation is due to the
measuring system; very little is due to differences between parts (MINITAB User’s
Guide, 2000).
C. According to AIAG, number “5” represents an adequate measuring system. The
lower the number is, the poorer the measurement system would be. A very low
number tells us that the measurement system cannot distinguish differences
between parts (MINITAB User’s Guide, 2000).
AG This graph visualizes the “B” part, which shows the percentage differences between
Part-Part and Total Gage R&R (MINITAB User’s Guide, 2000).
BG If the graph represents an erratic line (a non-level line), it tells us there are large
differences between Parts. If it is almost a level-line, it tells us there is little difference
between parts (MINITAB User’s Guide, 2000).
CG If the graph represents a nearly level line; it tells us there are small differences
between operators. If it is a level-line, it tells us there is little difference between
operators (MINITAB User’s Guide, 2000).
20

DG If most of the points in the Xbar chart are outside the control limits, indicating the
variation is mainly caused by differences between parts. If most of the points in the
Xbar are inside the control limits, indicating the variation is mainly due to the
measurement system (MINITAB User’s Guide, 2000).
EG This graph is a visualization of the p-value for Oper*Part. If the value is <0.25, the
shape of each line tends to follow the same pattern and all the lines are close to
each other, which indicates a significant interaction between Part and Operator
(MINITAB User’s Guide, 2000).
21

CMM (Round)
*DC A B C Components of Variation By Part
By Operator
Xbar Chart by Operator
Operator *Part
Interaction
6.06 0.93012
No interaction
79.13: 20.87 Due to
measurement system error
1 Poor
Due to measurement
system
Some differences
Small differences
No differences
between operators
Insignificant
6.38 0.23274 Interaction
84.49: 15.51 Due to
measurement system error
1 Poor
Due to measurement
system
Some differences
Small differences
No differences
between operators
Insignificant
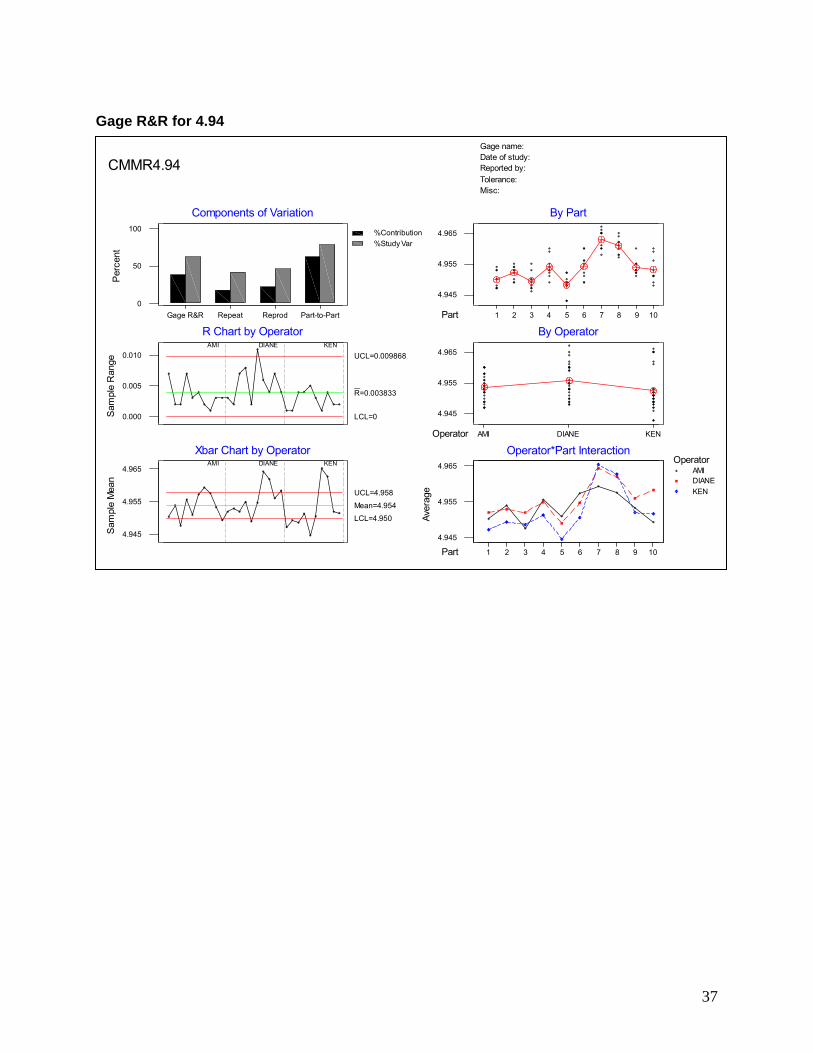
4.94 0.00009 Interaction
38.12: 61.88
Due to both
2 Poor
Due to measurement
system
Some differences
Small differences
No differences
between operators
Insignificant
14.98 0.47268
No interaction
100.00: 0.00 Due to
measurement system error
0 Poor
Due to measurement
system
Some differences
Small differences
No differences
between operators
Insignificant
6.63 0.01806 Interaction
19.96: 80.04
Due to parts’ differences
3 Poor
Due to measurement
system
Some differences
Small differences
No differences
between operators
Insignificant
3.82 0.62742
No interaction
34.97: 65.03 Due to
measurement system error
2 Poor
Due to measurement
system
Some differences
Small differences
No differences
between operators
Insignificant
29.96 0.50748
No interaction
8.26: 91.74
Due to parts’ differences
5 Adequate
Due to Differences
between parts
Large differences
Small differences
Due to Differences
between parts
Significant
Table 1: Gage R&R Report for CMM (Round)
22

CMM (Square)
*DC A B C Components of Variation By Part
By Operator
Xbar Chart by Operator
Operator *Part
Interaction
16.66 0.00000 Interaction
71.35: 28.65 Due to
measurement system error
1 Poor
Due to measurement
system
Some differences
Small differences
Due to Differences
between parts
Insignificant
22.68 0.00000 Interaction
55.24: 44.76
Due to both
1 Poor Due to both Some
differences Small
differences
Due to Differences
between parts
Insignificant
1.63a 0.00000 Interaction
58.33: 41.67
Due to both
1 Poor Due to both Some
differences Small
differences
Due to Differences
between parts
Insignificant
25.44 0.49920
No interaction
97.33: 2.67 Due to
measurement system error
0 Poor
Due to measurement
system
Some differences
Small differences
Due to Differences
between parts
Insignificant
1.00 0.00455 Interaction
20.40 79.60
Due to parts’ differences
3 fine
Due to Differences
between parts
Big differences
Small differences
Due to Differences
between parts
significant
38.03 0.44177
No interaction
39.57: 60.43
Due to both
2 Poor Due to Both Some
differences Small
differences Due to both Insignificant
40.34 0.30950
No interaction
5.07: 94.93
Due to parts’ differences
6 Adequate
Due to Differences
between parts
Large differences
Small differences
Due to Differences
between parts
Significant
1.63b 0.00000 Interaction
80.67: 19.33 Due to
measurement system error
1 Poor
Due to Differences
between parts
Some differences
Small differences
Due to Differences
between parts
Insignificant
2.91 0.03593 Interaction
11.64: 88.36
Due to parts’ differences
4 Adequate
Due to Differences
between parts
Large differences
Small differences
Due to Differences
between parts
Significant
40.1 0.04431 Interaction
76.15: 23.85
Due to both
1 Poor Due to Both Some
differences Small
differences Due to both Insignificant
145 0.58448
No Interaction
93.80: 6.20 Due to
measurement system error
0 Poor
Due to measurement
system
Some differences
Small differences
Due to both Insignificant
13.78 0.01229 Interaction
62.38: 37.62
Due to both
1 Poor Due to Both Some
differences Small
differences Due to both Insignificant
Table 2: Gage R&R Report for CMM (Square)
*Due to both: Due to measurement system error and parts’ differences
23

FARO Arm (Round)
*DC A B C Components of Variation By Part
By Operator
Xbar Chart by Operator
Operator *Part
Interaction
4.94 0.00065 Interaction
30.04: 69.96
Due to both
2 Poor Due to both Some
differences Small
differences
Due to Differences
between parts
significant
6.63 0.01627 Interaction
18.24: 81.76
Due to parts’ differences
3 Fine
Due to Differences
between parts
big differences
Small differences
Due to Differences
between parts
significant
29.96 0.29209
No interaction
8.37: 91.63
Due to parts’ differences
5 Adequate
Due to Differences
between parts
Large differences
Small differences
Due to Differences
between parts
Significant
3.82 0.47269
No interaction
100.00: 0.00 Due to
measurement system error
0 Poor
Due to measurement
system
Some differences
Small differences
No differences
between operators
Insignificant
14.98 0.07371 Interaction
41.91: 58.09
Due to both
2 Poor Due to both Some
differences Small
differences Due to both Insignificant
6.38 0.49904
No interaction
43.12: 56.88
Due to both
2 Poor Due to both Some
differences Small
differences Due to both Insignificant
6.06 0.53097
No interaction
82.16: 17.84 Due to
measurement system error
1 Poor
Due to measurement
system
Some differences
Small differences
No differences
between operators
Insignificant
Table 3: Gage R&R Report for FARO Arm (Round)
24

FARO Arm (Square)
*DC A B C Components of Variation By Part
By Operator
Xbar Chart by Operator
Operator *Part
Interaction
16.66 0.00002 Interaction
93.79: 6.21 Due to
measurement system error
0 Poor
Due to measurement
system
Some differences
Small differences
Due to Differences
between parts
Insignificant
22.68 0.00167 Interaction
46.32: 53.68
Due to both
2 Poor Due to both Some
differences Small
differences Due to both Insignificant
1.63a 0.00000 Interaction
69.06: 30.94
Due to both
1 Poor Due to both Some
differences Small
differences
Due to Differences
between parts
insignificant
25.44 0.01423 Interaction
87.82: 12.18 Due to
measurement system error
1 Poor
Due to measurement
system
Some differences
Small differences
Due to both Insignificant
38.03 0.23682 Interaction
48.92: 51.08
Due to both
1 Poor Due to Both Some
differences Small
differences Due to both Insignificant
40.34 0.19404 Interaction
3.13: 96.87
Due to parts’ differences
8 Adequate
Due to Differences
between parts
Large differences
Small differences
Due to Differences
between parts
Significant
1.63b 0.00000 Interaction
53.09 46.91
Due to both
1 Poor
Due to Differences
between parts
Some differences
Small differences
Due to Differences
between parts
Insignificant
1.00 0.25522
No interaction
8.11: 91.89
Due to parts’ differences
5 Adequate
Due to Differences
between parts
Large differences
Small differences
Due to Differences
between parts
Significant
2.91 0.08407 Interaction
3.62 96.38
Due to parts’ differences
7 Adequate
Due to Differences
between parts
Large differences
Small differences
Due to Differences
between parts
Significant
40.1 ** Error ** No variation within part/operator subgroups;
Execution aborted.
145 0.02855 Interaction
87.98: 12.02 Due to
measurement system error
1 Poor
Due to measurement
system
Some differences
Small differences
Due to both Insignificant
13.78 0.40928
No interaction
5.51: 94.49
Due to parts’ differences
6 Adequate
Due to Differences
between parts
Large differences
Small differences
Due to Differences
between parts
Significant
Table 4: Gage R&R Report for FARO Arm (Square)
25

CMM (Round) *DC Repeatability(%) Reproducibility(%) Total GR%R
6.06 48.31 30.82 79.13
6.38 39.22 45.27 84.49
4.94 16.99 21.13 38.12
14.98 100.00 0.00 100.00
6.63 10.80 9.16 19.96 <30%
3.82 30.07 4.89 34.97
29.96 4.10 4.16 8.26 <30%
Table 5: R&R comparison sheet for CMM (Round)
CMM (Square) *DC Repeatability(%) Reproducibility(%) Total GR%R
16.66 12.45 58.90 71.35
22.68 7.99 47.25 55.24
1.63a 17.65 40.68 58.33
25.44 33.50 63.83 97.33
1.00 8.09 12.31 20.4 <30%
38.03 31.32 8.24 39.57
40.34 2.39 2.67 5.07 <30%
1.63b 12.06 68.61 80.67
2.91 5.6 6.05 11.64 <30%
40.1 44.51 31.65 76.15
145 83.45 10.34 93.8
13.78 28.14 34.24 62.38
Table 6: R&R comparison sheet for CMM (Square)
26

FARO Arm (Round) *DC Repeatability(%) Reproducibility(%) Total GR%R
4.94 17.36 12.67 30.04
6.63 9.87 8.37 18.24
29.96 2.57 5.80 8.37 <30%
3.82 100.00 0.00 100.00
14.98 23.66 18.25 41.91
6.38 14.79 28.33 43.12
6.06 23.67 58.49 82.16
Table 7: R&R comparison sheet for FARO Arm (Round)
FARO Arm (Square) *DC Repeatability(%) Reproducibility(%) Total GR%R
16.66 15.77 78.02 93.79
22.68 26.17 20.15 46.32
1.63a 13.04 56.02 69.06
25.44 40.42 47.4 87.82
38.03 27.59 21.34 48.92
40.34 1.7 1.44 3.13 < 30%
1.63b 11.55 41.55 53.09
1.00 7.08 1.03 8.11 < 30%
2.91 3 0.62 3.62 < 30%
40.1
145 52.38 35.6 87.98
13.78 5.13 0.37 5.51 < 30%
Table 8: R&R comparison sheet for FARO Arm (Square)
27

CHAPTER FIVE
Conclusions and Recommendations
Statement of the Problem
The study was designed to evaluate the capability of a measurement system for
a recreational vehicle manufacturer in the mid-western United States in order to improve
the quality of its products.
Methods and Procedures
The Gage R&R study used ANOVA method which estimates the variances more
precisely and accurately than Average and Range Method. Two measuring devices,
CMM and FARO arm have been evaluated through the study. Data results were
retrieved from MINTAB 13 software and based on these results further analysis was
achieved.
Conclusions
The data results indicated that the overall measurement system is not acceptable
for its intended application.
For the CMM machine as shown on table 5 and table 6, only five target values
out of 19 fall into the less-than-30% category which indicates the measurement system
may be acceptable. For the FARO arm as shown on table 7 and table 8, it is the same
that only five target values out of 19 fall into the less-than-30% category. This also can
be proved from table 1 to table 4 in the category C which uses a “5” as a watershed to
roughly indicate whether a measurement system is capable or not. Overall, only about a
quarter of total target values is satisfying. Thus, both machines represent a poor
capability for measuring tasks.
28

Further investigation reveals that the poor capability is resulted from both
measuring device itself and operators who were involved in the measurement
processes. As shown on table 5 to table 8, for the %GR&R of those target values which
are far away from satisfaction, the proportion of EV (repeatability%) value and AV
(Reproducibility%) value varies. Neither of measuring device itself and measuring
process assumes a dominating influence on the overall poor capability. However, to
some degree, the error from the measuring device itself could be due to improper set-up
and poor training for operators, considering the whole measuring system is rather
advanced, sophisticated and up-to-date and was purchased by the company before
long.
Recommendations
A thorough understanding of measurement variation and the contribution is
essential. It is important to clearly define the problems or issues. Historical flowchart of
the measurement system and process should be reviewed to lead to discussion of
known and unknown information on the measurement system itself and its
interrelationship to the process. A Cause and Effect Diagram could be applied to give
valuable information resulting in a solution or a partial solution.
If the possible major causes lied in the measurement system itself, it will become
necessary to analyze and resolve those issues before working on the rest of the
system. Sometimes the errors in the measurement system itself are overlooked. Doing
that may cause loss of resources and time since the focus is made on the process,
when the actual problems are due the measurement device.
29

It is magnificent from this study that improvement of operator training and usage
of qualified operators are compulsory. As the measuring devices are partially manual
instruments, the study indicates that operator is a significant source of variation.
The changes made in the measurement system and the process should be
tested until they reach an appropriate solution.
30

REFERENCE
Devor, E.R., Chang, T., & Sutherland, W.J. (1992) Statistical Quality Design and
Control. New York: Macmillan Publishing Company
Early, A.T., & Neagu, R. (1999). ANOVA Models and Data Reduction: Application to
GR&R Studies. Retrieved November 10, 2003, from
web.utk.edu/~asaqp/qpr/QPRC1999/ papers/early_and_neagu.pdf
Gage R&R. (n.d.). Retrieved November 6, 2003, from
www.statlets.com/gage_randr.htm
Measurement Systems Analysis Reference Manual, 2nd ed., (1995, February). Chrysler
Corp., Ford Motor Corp., General Motors Corp.
Measurement Systems Analysis Reference Manual, 3rd ed., (2002, March). Chrysler
Corp., Ford Motor Corp., General Motors Corp.
MINITAB User’s Guide 2: Data analysis and Quality Tools (2000). Minitab Inc.
Niles, K. (2001). Characterizing the Measurement Process. Retrieved November 2,
2003, from http://healthcare.isixsigma.com/library/content/c020527a.asp
Scutoski, H., & Sekar, C. (1998). Introduction to Gage R&R Study. Retrieved November
5, 2003, from www.swtest.org/swtw_library/1998proc/PDF/T1_Hank.PDF
Steve, D. P. and Keith, R. E. (1997). Guidelines for Expressing the Uncertainty of
Measurement Results Containing Uncorrected Bias, NIST Journal of Research,
102, No. 5.
31

APPENDIX (a)
Data Results for CMM (Round)
————— 12/21/03 11:10:48 AM ———————————————————— Welcome to Minitab, press F1 for help. Gage R&R Study - ANOVA Method Gage R&R for 6.06 Two-Way ANOVA Table With Interaction Source DF SS MS F P Part 9 0.0022591 0.0002510 8.1722 0.00009 Operator 2 0.0020687 0.0010343 33.6758 0.00000 Operator*Part 18 0.0005529 0.0000307 0.5337 0.93012 Repeatability 60 0.0034533 0.0000576 Total 89 0.0083340 Two-Way ANOVA Table Without Interaction Source DF SS MS F P Part 9 0.0022591 0.0002510 4.8871 0.00003 Operator 2 0.0020687 0.0010343 20.1385 0.00000 Repeatability 78 0.0040062 0.0000514 Total 89 0.0083340 Gage R&R %Contribution Source VarComp (of VarComp) Total Gage R&R 8.41E-05 79.13 Repeatability 5.14E-05 48.31 Reproducibility 3.28E-05 30.82 Operator 3.28E-05 30.82 Part-To-Part 2.22E-05 20.87 Total Variation 1.06E-04 100.00 StdDev Study Var %Study Var Source (SD) (5.15*SD) (%SV) Total Gage R&R 9.17E-03 4.72E-02 88.96 Repeatability 7.17E-03 3.69E-02 69.51 Reproducibility 5.72E-03 2.95E-02 55.52 Operator 5.72E-03 2.95E-02 55.52 Part-To-Part 4.71E-03 2.43E-02 45.68 Total Variation 1.03E-02 5.31E-02 100.00 Number of Distinct Categories = 1
32

Gage R&R for 6.06
Misc:Tolerance:Reported by:Date of study:Gage name:
0
6.07
6.06
6.05
6.04
KENDIANEAMI
Xbar Chart by Operator
Sam
ple
Mea
n
Mean=6.052
UCL=6.065
LCL=6.039
0
0.03
0.02
0.01
0.00
KENDIANEAMI
R Chart by Operator
Sam
ple
Ran
ge
R=0.01263
UCL=0.03252
LCL=0
10 9 8 7 6 5 4 3 2 1
6.065
6.055
6.045
6.035Part
OperatorOperator*Part Interaction
Aver
age
AMI DIANE KEN
KENDIANEAMI
6.07
6.06
6.05
6.04
6.03
6.02Operator
By Operator10 9 8 7 6 5 4 3 2 1
6.07
6.06
6.05
6.04
6.03
6.02Part
By Part%Contribution %Study Var
Part-to-PartReprodRepeatGage R&R
100
50
0
Components of Variation
Perc
ent
CMMR6.06
33

Gage R&R Study - ANOVA Method Gage R&R for 6.38 Two-Way ANOVA Table With Interaction Source DF SS MS F P Part 9 0.0119429 0.0013270 3.7777 0.00790 Operator 2 0.0181473 0.0090736 25.8307 0.00001 Operator*Part 18 0.0063229 0.0003513 1.2813 0.23274 Repeatability 60 0.0164493 0.0002742 Total 89 0.0528625 Gage R&R %Contribution Source VarComp (of VarComp) Total Gage R&R 5.91E-04 84.49 Repeatability 2.74E-04 39.22 Reproducibility 3.16E-04 45.27 Operator 2.91E-04 41.59 Operator*Part 2.57E-05 3.68 Part-To-Part 1.08E-04 15.51 Total Variation 6.99E-04 100.00 StdDev Study Var %Study Var Source (SD) (5.15*SD) (%SV) Total Gage R&R 2.43E-02 0.125157 91.92 Repeatability 1.66E-02 0.085272 62.63 Reproducibility 1.78E-02 0.091614 67.28 Operator 1.71E-02 0.087814 64.49 Operator*Part 5.07E-03 0.026111 19.18 Part-To-Part 1.04E-02 0.053623 39.38 Total Variation 2.64E-02 0.136161 100.00 Number of Distinct Categories = 1
34

Gage R&R for 6.38
Misc:Tolerance:Reported by:Date of study:Gage name:
0
6.466.456.446.436.426.416.406.396.38
KENDIANEAMI
Xbar Chart by Operator
Sam
ple
Mea
n
Mean=6.421
UCL=6.449
LCL=6.392
0
0.080.070.060.050.040.030.020.010.00
KENDIANEAMI
R Chart by Operator
Sam
ple
Ran
ge
R=0.02797
UCL=0.07199
LCL=0
10 9 8 7 6 5 4 3 2 1
6.466.456.446.436.426.416.406.396.38Part
OperatorOperator*Part Interaction
Aver
age
AMI DIANE KEN
KENDIANEAMI
6.50
6.45
6.40
Operator
By Operator10 9 8 7 6 5 4 3 2 1
6.50
6.45
6.40
Part
By Part%Contribution %Study Var
Part-to-PartReprodRepeatGage R&R
100
50
0
Components of Variation
Per
cent
CMMR6.38
35

Gage R&R Study - ANOVA Method Gage R&R for 4.94 Two-Way ANOVA Table With Interaction Source DF SS MS F P Part 9 0.0018200 0.0002022 10.0565 0.00002 Operator 2 0.0001638 0.0000819 4.0734 0.03473 Operator*Part 18 0.0003620 0.0000201 3.6196 0.00009 Repeatability 60 0.0003333 0.0000056 Total 89 0.0026791 Gage R&R %Contribution Source VarComp (of VarComp) Total Gage R&R 1.25E-05 38.12 Repeatability 5.56E-06 16.99 Reproducibility 6.91E-06 21.13 Operator 2.06E-06 6.30 Operator*Part 4.85E-06 14.83 Part-To-Part 2.02E-05 61.88 Total Variation 3.27E-05 100.00 StdDev Study Var %Study Var Source (SD) (5.15*SD) (%SV) Total Gage R&R 3.53E-03 1.82E-02 61.74 Repeatability 2.36E-03 1.21E-02 41.22 Reproducibility 2.63E-03 1.35E-02 45.97 Operator 1.44E-03 7.39E-03 25.10 Operator*Part 2.20E-03 1.13E-02 38.52 Part-To-Part 4.50E-03 2.32E-02 78.66 Total Variation 5.72E-03 2.95E-02 100.00 Number of Distinct Categories = 2
36
Gage R&R for 4.94
Misc:Tolerance:Reported by:Date of study:Gage name:
0
4.965
4.955
4.945
KENDIANEAMI
Xbar Chart by Operator
Sam
ple
Mea
n
Mean=4.954
UCL=4.958
LCL=4.950
0
0.010
0.005
0.000
KENDIANEAMI
R Chart by Operator
Sam
ple
Ran
ge
R=0.003833
UCL=0.009868
LCL=0
10 9 8 7 6 5 4 3 2 1
4.965
4.955
4.945
Part
OperatorOperator*Part Interaction
Aver
age
AMI DIANE KEN
KENDIANEAMI
4.965
4.955
4.945
Operator
By Operator10 9 8 7 6 5 4 3 2 1
4.965
4.955
4.945
Part
By Part%Contribution %Study Var
Part-to-PartReprodRepeatGage R&R
100
50
0
Components of Variation
Perc
ent
CMMR4.94
37

Gage R&R Study - ANOVA Method Gage R&R for 14.98 Two-Way ANOVA Table With Interaction Source DF SS MS F P Part 9 22556750 2506306 0.99999 0.47416 Operator 2 5012365 2506182 0.99994 0.38744 Operator*Part 18 45113868 2506326 1.00000 0.47268 Repeatability 60 150379079 2506318 Total 89 223062062 Two-Way ANOVA Table Without Interaction Source DF SS MS F P Part 9 22556750 2506306 0.99999 0.44731 Operator 2 5012365 2506182 0.99995 0.37257 Repeatability 78 195492947 2506320 Total 89 223062062 Gage R&R %Contribution Source VarComp (of VarComp) Total Gage R&R 2506320 100.00 Repeatability 2506320 100.00 Reproducibility 0 0.00 Operator 0 0.00 Part-To-Part 0 0.00 Total Variation 2506320 100.00 StdDev Study Var %Study Var Source (SD) (5.15*SD) (%SV) Total Gage R&R 1583.14 8153.15 100.00 Repeatability 1583.14 8153.15 100.00 Reproducibility 0.00 0.00 0.00 Operator 0.00 0.00 0.00 Part-To-Part 0.00 0.00 0.00 Total Variation 1583.14 8153.15 100.00 Number of Distinct Categories = 0
38

Gage R&R for 14.98
Misc:Tolerance:Reported by:Date of study:Gage name:
0
50004000300020001000
0-1000
KENDIANEAMI
Xbar Chart by Operator
Sam
ple
Mea
n
Mean=181.9UCL=694.1LCL=-330.2
0
15000
10000
5000
0
KENDIANEAMI
R Chart by Operator
Sam
ple
Ran
ge
R=500.6UCL=1289LCL=0
10 9 8 7 6 5 4 3 2 1
5000
4000
3000
2000
1000
0
Part
OperatorOperator*Part Interaction
Aver
age
AMI DIANE KEN
KENDIANEAMI
15000
10000
5000
0
Operator
By Operator10 9 8 7 6 5 4 3 2 1
15000
10000
5000
0
Part
By Part%Contribution %Study Var
Part-to-PartReprodRepeatGage R&R
100
50
0
Components of Variation
Perc
ent
CMMR14.98
39

Gage R&R Study - ANOVA Method Gage R&R for 6.63 Two-Way ANOVA Table With Interaction Source DF SS MS F P Part 9 0.0124945 0.0013883 33.0668 0.00000 Operator 2 0.0006756 0.0003378 8.0462 0.00319 Operator*Part 18 0.0007557 0.0000420 2.0796 0.01806 Repeatability 60 0.0012113 0.0000202 Total 89 0.0151371 Gage R&R %Contribution Source VarComp (of VarComp) Total Gage R&R 3.73E-05 19.96 Repeatability 2.02E-05 10.80 Reproducibility 1.71E-05 9.16 Operator 9.86E-06 5.28 Operator*Part 7.27E-06 3.89 Part-To-Part 1.50E-04 80.04 Total Variation 1.87E-04 100.00 StdDev Study Var %Study Var Source (SD) (5.15*SD) (%SV) Total Gage R&R 6.11E-03 3.15E-02 44.68 Repeatability 4.49E-03 2.31E-02 32.87 Reproducibility 4.14E-03 2.13E-02 30.27 Operator 3.14E-03 1.62E-02 22.97 Operator*Part 2.70E-03 1.39E-02 19.72 Part-To-Part 1.22E-02 6.30E-02 89.46 Total Variation 1.37E-02 7.04E-02 100.00 Number of Distinct Categories = 3
40

Gage R&R for 6.63
Misc:Tolerance:Reported by:Date of study:Gage name:
0
6.73
6.72
6.71
6.70
6.69
6.68
KENDIANEAMI
Xbar Chart by Operator
Sam
ple
Mea
n
Mean=6.706UCL=6.713
LCL=6.698
0
0.02
0.01
0.00
KENDIANEAMI
R Chart by Operator
Sam
ple
Ran
ge
R=0.007567
UCL=0.01948
LCL=0
10 9 8 7 6 5 4 3 2 1
6.725
6.715
6.705
6.695
6.685Part
OperatorOperator*Part Interaction
Aver
age
AMI DIANE KEN
KENDIANEAMI
6.73
6.72
6.71
6.70
6.69
6.68Operator
By Operator10 9 8 7 6 5 4 3 2 1
6.73
6.72
6.71
6.70
6.69
6.68Part
By Part%Contribution %Study Var
Part-to-PartReprodRepeatGage R&R
100
50
0
Components of Variation
Perc
ent
CMMR6.63
41

Gage R&R Study - ANOVA Method Gage R&R for 3.82 Two-Way ANOVA Table With Interaction Source DF SS MS F P Part 9 0.0252442 0.0028049 23.0632 0.00000 Operator 2 0.0016124 0.0008062 6.6290 0.00696 Operator*Part 18 0.0021891 0.0001216 0.8583 0.62742 Repeatability 60 0.0085020 0.0001417 Total 89 0.0375478 Two-Way ANOVA Table Without Interaction Source DF SS MS F P Part 9 0.0252442 0.0028049 20.4640 0.00000 Operator 2 0.0016124 0.0008062 5.8819 0.00418 Repeatability 78 0.0106911 0.0001371 Total 89 0.0375478 Gage R&R %Contribution Source VarComp (of VarComp) Total Gage R&R 1.59E-04 34.97 Repeatability 1.37E-04 30.07 Reproducibility 2.23E-05 4.89 Operator 2.23E-05 4.89 Part-To-Part 2.96E-04 65.03 Total Variation 4.56E-04 100.00 StdDev Study Var %Study Var Source (SD) (5.15*SD) (%SV) Total Gage R&R 1.26E-02 0.065015 59.13 Repeatability 1.17E-02 0.060294 54.84 Reproducibility 4.72E-03 0.024322 22.12 Operator 4.72E-03 0.024322 22.12 Part-To-Part 1.72E-02 0.088668 80.64 Total Variation 2.13E-02 0.109950 100.00 Number of Distinct Categories = 2
42

Gage R&R for 3.82
Misc:Tolerance:Reported by:Date of study:Gage name:
0
3.813.803.793.783.773.763.753.74
KENDIANEAMI
Xbar Chart by Operator
Sam
ple
Mea
n
Mean=3.772
UCL=3.786
LCL=3.759
0
0.10
0.05
0.00
KENDIANEAMI
R Chart by Operator
Sam
ple
Ran
ge
R=0.01347
UCL=0.03467
LCL=0
10 9 8 7 6 5 4 3 2 1
3.813.803.793.783.773.763.753.74Part
OperatorOperator*Part Interaction
Aver
age
AMI DIANE KEN
KENDIANEAMI
3.85
3.80
3.75
Operator
By Operator10 9 8 7 6 5 4 3 2 1
3.85
3.80
3.75
Part
By Part%Contribution %Study Var
Part-to-PartReprodRepeatGage R&R
100
50
0
Components of Variation
Perc
ent
CMMR3.82
43

Gage R&R Study - ANOVA Method Gage R&R for 29.96 Two-Way ANOVA Table With Interaction Source DF SS MS F P Part 9 0.0303293 0.0033699 207.703 0.00000 Operator 2 0.0010464 0.0005232 32.247 0.00000 Operator*Part 18 0.0002920 0.0000162 0.967 0.50748 Repeatability 60 0.0010067 0.0000168 Total 89 0.0326744 Two-Way ANOVA Table Without Interaction Source DF SS MS F P Part 9 0.0303293 0.0033699 202.396 0.00000 Operator 2 0.0010464 0.0005232 31.423 0.00000 Repeatability 78 0.0012987 0.0000167 Total 89 0.0326744 Gage R&R %Contribution Source VarComp (of VarComp) Total Gage R&R 3.35E-05 8.26 Repeatability 1.67E-05 4.10 Reproducibility 1.69E-05 4.16 Operator 1.69E-05 4.16 Part-To-Part 3.73E-04 91.74 Total Variation 4.06E-04 100.00 StdDev Study Var %Study Var Source (SD) (5.15*SD) (%SV) Total Gage R&R 5.79E-03 0.029823 28.74 Repeatability 4.08E-03 0.021014 20.25 Reproducibility 4.11E-03 0.021162 20.39 Operator 4.11E-03 0.021162 20.39 Part-To-Part 1.93E-02 0.099408 95.78 Total Variation 2.02E-02 0.103785 100.00 Number of Distinct Categories = 5
44

Gage R&R for 29.96
Misc:Tolerance:Reported by:Date of study:Gage name:
0
30.2130.2030.1930.1830.1730.1630.1530.14
KENDIANEAMI
Xbar Chart by Operator
Sam
ple
Mea
n
Mean=30.18UCL=30.18
LCL=30.17
0
0.02
0.01
0.00
KENDIANEAMI
R Chart by Operator
Sam
ple
Ran
ge
R=0.006467
UCL=0.01665
LCL=0
10 9 8 7 6 5 4 3 2 1
30.2130.2030.1930.1830.1730.1630.1530.14Part
OperatorOperator*Part Interaction
Aver
age
AMI DIANE KEN
KENDIANEAMI
30.2130.2030.1930.1830.1730.1630.1530.14
Operator
By Operator10 9 8 7 6 5 4 3 2 1
30.2130.2030.1930.1830.1730.1630.1530.14
Part
By Part%Contribution %Study Var
Part-to-PartReprodRepeatGage R&R
100
50
0
Components of Variation
Perc
ent
CMMR29.96
45

APPENDIX (b)
Data results for CMM (Square)
————— 12/21/03 11:18:28 AM ———————————————————— Welcome to Minitab, press F1 for help. Gage R&R Study - ANOVA Method Gage R&R for 16.66 Two-Way ANOVA Table With Interaction Source DF SS MS F P Part 9 0.0160458 0.0017829 3.43072 0.01248 Operator 2 0.0091772 0.0045886 8.82968 0.00213 Operator*Part 18 0.0093542 0.0005197 8.52084 0.00000 Repeatability 60 0.0036593 0.0000610 Total 89 0.0382365 Gage R&R %Contribution Source VarComp (of VarComp) Total Gage R&R 3.50E-04 71.35 Repeatability 6.10E-05 12.45 Reproducibility 2.89E-04 58.90 Operator 1.36E-04 27.69 Operator*Part 1.53E-04 31.21 Part-To-Part 1.40E-04 28.65 Total Variation 4.90E-04 100.00 StdDev Study Var %Study Var Source (SD) (5.15*SD) (%SV) Total Gage R&R 1.87E-02 0.096281 84.47 Repeatability 7.81E-03 0.040219 35.28 Reproducibility 1.70E-02 0.087478 76.75 Operator 1.16E-02 0.059977 52.62 Operator*Part 1.24E-02 0.063680 55.87 Part-To-Part 1.18E-02 0.061013 53.53 Total Variation 2.21E-02 0.113985 100.00 Number of Distinct Categories = 1
46

Gage R&R for 16.66
Misc:Tolerance:Reported by:Date of study:Gage name:
0
16.6616.6516.6416.6316.6216.6116.6016.5916.58
KENDIANEAMI
Xbar Chart by Operator
Sam
ple
Mea
n
Mean=16.62UCL=16.64
LCL=16.61
0
0.03
0.02
0.01
0.00
KENDIANEAMI
R Chart by Operator
Sam
ple
Ran
ge
R=0.01257
UCL=0.03235
LCL=0
10 9 8 7 6 5 4 3 2 1
16.6616.6516.6416.6316.6216.6116.6016.5916.58Part
OperatorOperator*Part Interaction
Aver
age
AMI DIANE KEN
KENDIANEAMI
16.66516.65516.64516.63516.62516.61516.60516.59516.58516.575Operator
By Operator10 9 8 7 6 5 4 3 2 1
16.66516.65516.64516.63516.62516.61516.60516.59516.58516.575
Part
By Part%Contribution %Study Var
Part-to-PartReprodRepeatGage R&R
100
50
0
Components of Variation
Perc
ent
CMMS16.66
47

Gage R&R Study - ANOVA Method Gage R&R for 22.68 Two-Way ANOVA Table With Interaction Source DF SS MS F P Part 9 0.0370648 0.0041183 5.3623 0.00123 Operator 2 0.0110834 0.0055417 7.2157 0.00500 Operator*Part 18 0.0138242 0.0007680 11.5606 0.00000 Repeatability 60 0.0039860 0.0000664 Total 89 0.0659584 Gage R&R %Contribution Source VarComp (of VarComp) Total Gage R&R 4.59E-04 55.24 Repeatability 6.64E-05 7.99 Reproducibility 3.93E-04 47.25 Operator 1.59E-04 19.13 Operator*Part 2.34E-04 28.12 Part-To-Part 3.72E-04 44.76 Total Variation 8.32E-04 100.00 StdDev Study Var %Study Var Source (SD) (5.15*SD) (%SV) Total Gage R&R 2.14E-02 0.110385 74.32 Repeatability 8.15E-03 0.041976 28.26 Reproducibility 1.98E-02 0.102092 68.74 Operator 1.26E-02 0.064964 43.74 Operator*Part 1.53E-02 0.078756 53.03 Part-To-Part 1.93E-02 0.099364 66.90 Total Variation 2.88E-02 0.148519 100.00 Number of Distinct Categories = 1
48

Gage R&R for 22.68
Misc:Tolerance:Reported by:Date of study:Gage name:
0
22.65
22.60
22.55
KENDIANEAMI
Xbar Chart by Operator
Sam
ple
Mea
n
Mean=22.61UCL=22.62
LCL=22.60
0
0.060.050.040.030.020.010.00
KENDIANEAMI
R Chart by Operator
Sam
ple
Ran
ge
R=0.01217
UCL=0.03132
LCL=0
10 9 8 7 6 5 4 3 2 1
22.66
22.61
22.56
Part
OperatorOperator*Part Interaction
Aver
age
AMI DIANE KEN
KENDIANEAMI
22.65
22.60
22.55Operator
By Operator10 9 8 7 6 5 4 3 2 1
22.65
22.60
22.55Part
By Part%Contribution %Study Var
Part-to-PartReprodRepeatGage R&R
100
50
0
Components of Variation
Perc
ent
CMMS22.68
49

Gage R&R Study - ANOVA Method Gage R&R for 1.63a Two-Way ANOVA Table With Interaction Source DF SS MS F P Part 9 0.0036834 0.0004093 4.53179 0.00312 Operator 2 0.0007504 0.0003752 4.15471 0.03284 Operator*Part 18 0.0016256 0.0000903 6.01620 0.00000 Repeatability 60 0.0009007 0.0000150 Total 89 0.0069601 Gage R&R %Contribution Source VarComp (of VarComp) Total Gage R&R 4.96E-05 58.33 Repeatability 1.50E-05 17.65 Reproducibility 3.46E-05 40.68 Operator 9.50E-06 11.17 Operator*Part 2.51E-05 29.51 Part-To-Part 3.54E-05 41.67 Total Variation 8.50E-05 100.00 StdDev Study Var %Study Var Source (SD) (5.15*SD) (%SV) Total Gage R&R 7.04E-03 3.63E-02 76.37 Repeatability 3.87E-03 2.00E-02 42.01 Reproducibility 5.88E-03 3.03E-02 63.78 Operator 3.08E-03 1.59E-02 33.42 Operator*Part 5.01E-03 2.58E-02 54.33 Part-To-Part 5.95E-03 3.07E-02 64.55 Total Variation 9.22E-03 4.75E-02 100.00 Number of Distinct Categories = 1
50

Gage R&R for 1.63a
Misc:Tolerance:Reported by:Date of study:Gage name:
0
1.64
1.63
1.62
1.61
1.60
KENDIANEAMI
Xbar Chart by Operator
Sam
ple
Mea
n
Mean=1.617UCL=1.623
LCL=1.612
0
0.02
0.01
0.00
KENDIANEAMI
R Chart by Operator
Sam
ple
Ran
ge
R=0.005633
UCL=0.01450
LCL=0
10 9 8 7 6 5 4 3 2 1
1.6351.6301.6251.6201.6151.6101.6051.600Part
OperatorOperator*Part Interaction
Aver
age
AMI DIANE KEN
KENDIANEAMI
1.64
1.63
1.62
1.61
1.60
Operator
By Operator10 9 8 7 6 5 4 3 2 1
1.64
1.63
1.62
1.61
1.60
Part
By Part%Contribution %Study Var
Part-to-PartReprodRepeatGage R&R
100
50
0
Components of Variation
Perc
ent
CMMS1.63a
51

Gage R&R Study - ANOVA Method Gage R&R for 25.44 Two-Way ANOVA Table With Interaction Source DF SS MS F P Part 9 0.11229 0.012476 1.7508 0.14906 Operator 2 0.84533 0.422665 59.3137 0.00000 Operator*Part 18 0.12827 0.007126 0.9748 0.49920 Repeatability 60 0.43861 0.007310 Total 89 1.52449 Two-Way ANOVA Table Without Interaction Source DF SS MS F P Part 9 0.11229 0.012476 1.7167 0.09916 Operator 2 0.84533 0.422665 58.1567 0.00000 Repeatability 78 0.56688 0.007268 Total 89 1.52449 Gage R&R %Contribution Source VarComp (of VarComp) Total Gage R&R 0.021114 97.33 Repeatability 0.007268 33.50 Reproducibility 0.013847 63.83 Operator 0.013847 63.83 Part-To-Part 0.000579 2.67 Total Variation 0.021693 100.00 StdDev Study Var %Study Var Source (SD) (5.15*SD) (%SV) Total Gage R&R 0.145307 0.748333 98.66 Repeatability 0.085251 0.439041 57.88 Reproducibility 0.117671 0.606008 79.89 Operator 0.117671 0.606008 79.89 Part-To-Part 0.024056 0.123891 16.33 Total Variation 0.147285 0.758520 100.00 Number of Distinct Categories = 0
52

Gage R&R for 25.44
Misc:Tolerance:Reported by:Date of study:Gage name:
0
25.4
25.3
25.2
25.1
KENDIANEAMI
Xbar Chart by Operator
Sam
ple
Mea
n
Mean=25.27
UCL=25.36
LCL=25.19
0
0.80.70.60.50.40.30.20.10.0
KENDIANEAMI
R Chart by Operator
Sam
ple
Ran
ge
R=0.08563UCL=0.2204
LCL=0
10 9 8 7 6 5 4 3 2 1
25.4
25.3
25.2
25.1
Part
OperatorOperator*Part Interaction
Aver
age
AMI DIANE KEN
KENDIANEAMI
25.625.525.425.325.225.125.024.924.824.724.6
Operator
By Operator10 9 8 7 6 5 4 3 2 1
25.625.525.425.325.225.125.024.924.824.724.6Part
By Part%Contribution %Study Var
Part-to-PartReprodRepeatGage R&R
100
50
0
Components of Variation
Perc
ent
CMMS25.44
53

Gage R&R Study - ANOVA Method Gage R&R for 1.00 Two-Way ANOVA Table With Interaction Source DF SS MS F P Part 9 0.0413668 0.0045963 36.7411 0.00000 Operator 2 0.0033669 0.0016834 13.4567 0.00027 Operator*Part 18 0.0022518 0.0001251 2.4767 0.00455 Repeatability 60 0.0030307 0.0000505 Total 89 0.0500161 Gage R&R %Contribution Source VarComp (of VarComp) Total Gage R&R 1.27E-04 20.40 Repeatability 5.05E-05 8.09 Reproducibility 7.68E-05 12.31 Operator 5.19E-05 8.32 Operator*Part 2.49E-05 3.98 Part-To-Part 4.97E-04 79.60 Total Variation 6.24E-04 100.00 StdDev Study Var %Study Var Source (SD) (5.15*SD) (%SV) Total Gage R&R 1.13E-02 0.058110 45.17 Repeatability 7.11E-03 0.036602 28.45 Reproducibility 8.76E-03 0.045135 35.08 Operator 7.21E-03 0.037117 28.85 Operator*Part 4.99E-03 0.025679 19.96 Part-To-Part 2.23E-02 0.114789 89.22 Total Variation 2.50E-02 0.128659 100.00 Number of Distinct Categories = 3
54

Gage R&R for 1.00
Misc:Tolerance:Reported by:Date of study:Gage name:
0
1.051.041.031.021.011.000.990.980.970.96
KENDIANEAMI
Xbar Chart by Operator
Sam
ple
Mea
n
Mean=1.005UCL=1.013
LCL=0.9960
0
0.04
0.03
0.02
0.01
0.00
KENDIANEAMI
R Chart by Operator
Sam
ple
Ran
ge
R=0.0084
UCL=0.02162
LCL=0
10 9 8 7 6 5 4 3 2 1
1.051.041.031.021.011.000.990.980.970.96Part
OperatorOperator*Part Interaction
Aver
age
AMI DIANE KEN
KENDIANEAMI
1.05
1.00
0.95
Operator
By Operator10 9 8 7 6 5 4 3 2 1
1.05
1.00
0.95
Part
By Part%Contribution %Study Var
Part-to-PartReprodRepeatGage R&R
100
50
0
Components of Variation
Perc
ent
CMMS1.00
55

Gage R&R Study - ANOVA Method Gage R&R for 38.03 Two-Way ANOVA Table With Interaction Source DF SS MS F P Part 9 0.0066830 0.0007426 17.9495 0.00000 Operator 2 0.0007194 0.0003597 8.6944 0.00228 Operator*Part 18 0.0007446 0.0000414 1.0302 0.44177 Repeatability 60 0.0024093 0.0000402 Total 89 0.0105563 Two-Way ANOVA Table Without Interaction Source DF SS MS F P Part 9 0.0066830 0.0007426 18.3639 0.00000 Operator 2 0.0007194 0.0003597 8.8951 0.00033 Repeatability 78 0.0031540 0.0000404 Total 89 0.0105563 Gage R&R %Contribution Source VarComp (of VarComp) Total Gage R&R 5.11E-05 39.57 Repeatability 4.04E-05 31.32 Reproducibility 1.06E-05 8.24 Operator 1.06E-05 8.24 Part-To-Part 7.80E-05 60.43 Total Variation 1.29E-04 100.00 StdDev Study Var %Study Var Source (SD) (5.15*SD) (%SV) Total Gage R&R 7.15E-03 3.68E-02 62.90 Repeatability 6.36E-03 3.27E-02 55.97 Reproducibility 3.26E-03 1.68E-02 28.71 Operator 3.26E-03 1.68E-02 28.71 Part-To-Part 8.83E-03 4.55E-02 77.74 Total Variation 1.14E-02 5.85E-02 100.00 Number of Distinct Categories = 2
56

Gage R&R for 38.03
Misc:Tolerance:Reported by:Date of study:Gage name:
0
37.96
37.95
37.94
37.93
37.92
KENDIANEAMI
Xbar Chart by Operator
Sam
ple
Mea
n
Mean=37.94
UCL=37.95
LCL=37.93
0
0.04
0.03
0.02
0.01
0.00
KENDIANEAMI
R Chart by Operator
Sam
ple
Ran
ge
R=0.009367
UCL=0.02411
LCL=0
10 9 8 7 6 5 4 3 2 1
37.96
37.95
37.94
37.93
37.92
Part
OperatorOperator*Part Interaction
Aver
age
AMI DIANE KEN
KENDIANEAMI
37.9637.9537.9437.9337.9237.9137.90
Operator
By Operator10 9 8 7 6 5 4 3 2 1
37.9637.9537.9437.9337.9237.9137.90
Part
By Part%Contribution %Study Var
Part-to-PartReprodRepeatGage R&R
100
50
0
Components of Variation
Perc
ent
CMMS38.03
57

Gage R&R Study - ANOVA Method Gage R&R for 40.34 Two-Way ANOVA Table With Interaction Source DF SS MS F P Part 9 0.0199172 0.0022130 316.648 0.00000 Operator 2 0.0004269 0.0002134 30.539 0.00000 Operator*Part 18 0.0001258 0.0000070 1.176 0.30950 Repeatability 60 0.0003567 0.0000059 Total 89 0.0208265 Two-Way ANOVA Table Without Interaction Source DF SS MS F P Part 9 0.0199172 0.0022130 357.777 0.00000 Operator 2 0.0004269 0.0002134 34.506 0.00000 Repeatability 78 0.0004825 0.0000062 Total 89 0.0208265 Gage R&R %Contribution Source VarComp (of VarComp) Total Gage R&R 1.31E-05 5.07 Repeatability 6.19E-06 2.39 Reproducibility 6.91E-06 2.67 Operator 6.91E-06 2.67 Part-To-Part 2.45E-04 94.93 Total Variation 2.58E-04 100.00 StdDev Study Var %Study Var Source (SD) (5.15*SD) (%SV) Total Gage R&R 3.62E-03 1.86E-02 22.51 Repeatability 2.49E-03 1.28E-02 15.47 Reproducibility 2.63E-03 1.35E-02 16.35 Operator 2.63E-03 1.35E-02 16.35 Part-To-Part 1.57E-02 8.06E-02 97.43 Total Variation 1.61E-02 8.28E-02 100.00 Number of Distinct Categories = 6
58

Gage R&R for 40.34
Misc:Tolerance:Reported by:Date of study:Gage name:
0
40.3240.3140.3040.29
40.2840.2740.26
KENDIANEAMI
Xbar Chart by Operator
Sam
ple
Mea
n
Mean=40.29UCL=40.30LCL=40.29
0
0.015
0.010
0.005
0.000
KENDIANEAMI
R Chart by Operator
Sam
ple
Ran
ge
R=0.003667
UCL=0.009439
LCL=0
10 9 8 7 6 5 4 3 2 1
40.32
40.3140.3040.29
40.2840.2740.26Part
OperatorOperator*Part Interaction
Aver
age
AMI DIANE KEN
KENDIANEAMI
40.32
40.3140.3040.29
40.2840.2740.26
Operator
By Operator10 9 8 7 6 5 4 3 2 1
40.32
40.3140.3040.29
40.2840.2740.26Part
By Part%Contribution %Study Var
Part-to-PartReprodRepeatGage R&R
100
50
0
Components of Variation
Perc
ent
CMMS40.34
59
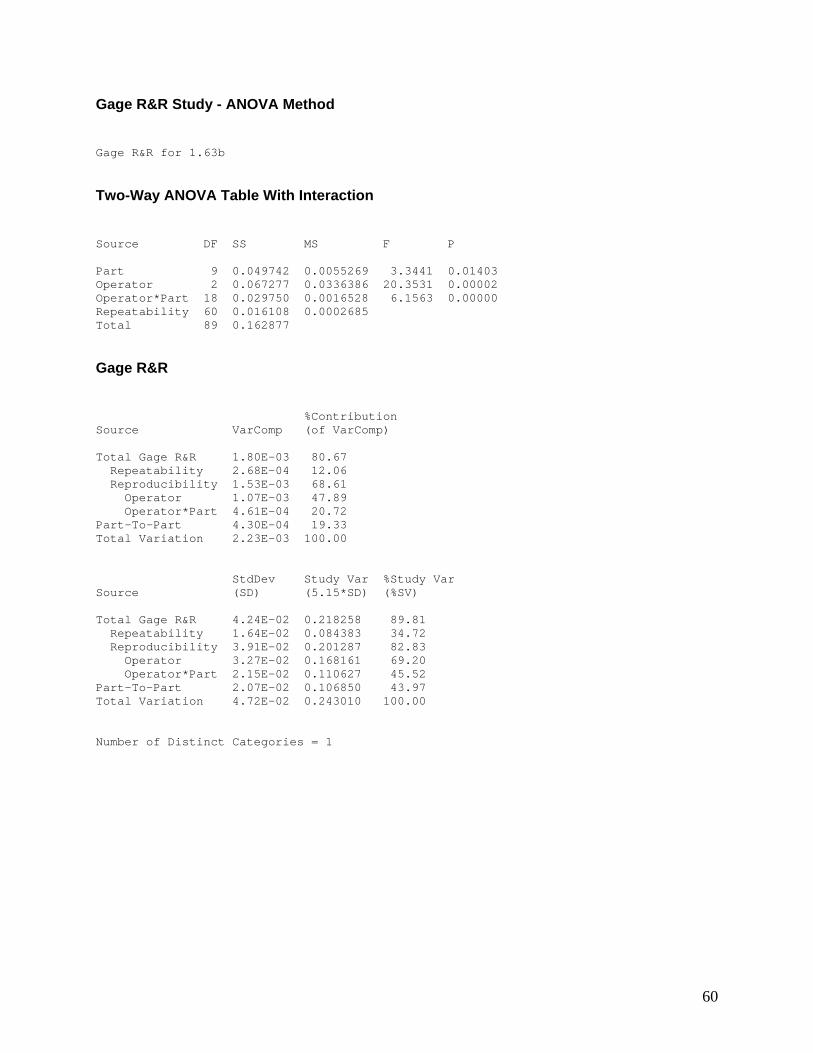
Gage R&R Study - ANOVA Method Gage R&R for 1.63b Two-Way ANOVA Table With Interaction Source DF SS MS F P Part 9 0.049742 0.0055269 3.3441 0.01403 Operator 2 0.067277 0.0336386 20.3531 0.00002 Operator*Part 18 0.029750 0.0016528 6.1563 0.00000 Repeatability 60 0.016108 0.0002685 Total 89 0.162877 Gage R&R %Contribution Source VarComp (of VarComp) Total Gage R&R 1.80E-03 80.67 Repeatability 2.68E-04 12.06 Reproducibility 1.53E-03 68.61 Operator 1.07E-03 47.89 Operator*Part 4.61E-04 20.72 Part-To-Part 4.30E-04 19.33 Total Variation 2.23E-03 100.00 StdDev Study Var %Study Var Source (SD) (5.15*SD) (%SV) Total Gage R&R 4.24E-02 0.218258 89.81 Repeatability 1.64E-02 0.084383 34.72 Reproducibility 3.91E-02 0.201287 82.83 Operator 3.27E-02 0.168161 69.20 Operator*Part 2.15E-02 0.110627 45.52 Part-To-Part 2.07E-02 0.106850 43.97 Total Variation 4.72E-02 0.243010 100.00 Number of Distinct Categories = 1
60

Gage R&R for 1.63b
Misc:Tolerance:Reported by:Date of study:Gage name:
0
1.75
1.70
1.65
1.60
KENDIANEAMI
Xbar Chart by Operator
Sam
ple
Mea
n
Mean=1.663UCL=1.686
LCL=1.639
0
0.10
0.05
0.00
KENDIANEAMI
R Chart by Operator
Sam
ple
Ran
ge
R=0.02317
UCL=0.05964
LCL=0
10 9 8 7 6 5 4 3 2 1
1.70
1.65
1.60
Part
OperatorOperator*Part Interaction
Aver
age
AMI DIANE KEN
KENDIANEAMI
1.75
1.70
1.65
1.60
Operator
By Operator10 9 8 7 6 5 4 3 2 1
1.75
1.70
1.65
1.60
Part
By Part%Contribution %Study Var
Part-to-PartReprodRepeatGage R&R
100
50
0
Components of Variation
Perc
ent
CMMS1.63b
61

Gage R&R Study - ANOVA Method Gage R&R for 2.91 Two-Way ANOVA Table With Interaction Source DF SS MS F P Part 9 0.0810063 0.0090007 76.6645 0.00000 Operator 2 0.0031901 0.0015950 13.5859 0.00025 Operator*Part 18 0.0021133 0.0001174 1.8775 0.03593 Repeatability 60 0.0037520 0.0000625 Total 89 0.0900616 Gage R&R %Contribution Source VarComp (of VarComp) Total Gage R&R 1.30E-04 11.64 Repeatability 6.25E-05 5.60 Reproducibility 6.75E-05 6.05 Operator 4.93E-05 4.41 Operator*Part 1.83E-05 1.64 Part-To-Part 9.87E-04 88.36 Total Variation 1.12E-03 100.00 StdDev Study Var %Study Var Source (SD) (5.15*SD) (%SV) Total Gage R&R 1.14E-02 0.058737 34.12 Repeatability 7.91E-03 0.040725 23.66 Reproducibility 8.22E-03 0.042325 24.59 Operator 7.02E-03 0.036143 21.00 Operator*Part 4.28E-03 0.022025 12.80 Part-To-Part 3.14E-02 0.161798 94.00 Total Variation 3.34E-02 0.172129 100.00 Number of Distinct Categories = 4
62

Gage R&R for 2.91
Misc:Tolerance:Reported by:Date of study:Gage name:
0
3.05
3.00
2.95
KENDIANEAMI
Xbar Chart by Operator
Sam
ple
Mea
n
Mean=2.991UCL=3.002
LCL=2.981
0
0.04
0.03
0.02
0.01
0.00
KENDIANEAMI
R Chart by Operator
Sam
ple
Ran
ge
R=0.01023
UCL=0.02634
LCL=0
10 9 8 7 6 5 4 3 2 1
3.05
3.00
2.95
Part
OperatorOperator*Part Interaction
Aver
age
AMI DIANE KEN
KENDIANEAMI
3.05
3.00
2.95
2.90Operator
By Operator10 9 8 7 6 5 4 3 2 1
3.05
3.00
2.95
2.90Part
By Part%Contribution %Study Var
Part-to-PartReprodRepeatGage R&R
100
50
0
Components of Variation
Perc
ent
CMMS2.91
63

Gage R&R Study - ANOVA Method Gage R&R for 40.1 Two-Way ANOVA Table With Interaction Source DF SS MS F P Part 9 0.099556 0.0110617 3.65714 0.00924 Operator 2 0.050000 0.0250000 8.26531 0.00284 Operator*Part 18 0.054444 0.0030247 1.81481 0.04431 Repeatability 60 0.100000 0.0016667 Total 89 0.304000 Gage R&R %Contribution Source VarComp (of VarComp) Total Gage R&R 2.85E-03 76.15 Repeatability 1.67E-03 44.51 Reproducibility 1.19E-03 31.65 Operator 7.33E-04 19.56 Operator*Part 4.53E-04 12.09 Part-To-Part 8.93E-04 23.85 Total Variation 3.74E-03 100.00 StdDev Study Var %Study Var Source (SD) (5.15*SD) (%SV) Total Gage R&R 5.34E-02 0.275024 87.27 Repeatability 4.08E-02 0.210248 66.71 Reproducibility 3.44E-02 0.177297 56.26 Operator 2.71E-02 0.139384 44.23 Operator*Part 2.13E-02 0.109572 34.77 Part-To-Part 2.99E-02 0.153898 48.83 Total Variation 6.12E-02 0.315155 100.00 Number of Distinct Categories = 1
64

Gage R&R for 40.1
Misc:Tolerance:Reported by:Date of study:Gage name:
0
40.35
40.25
40.15
KENDIANEAMI
Xbar Chart by Operator
Sam
ple
Mea
n
Mean=40.25
UCL=40.30
LCL=40.21
0
0.2
0.1
0.0
KENDIANEAMI
R Chart by Operator
Sam
ple
Ran
ge
R=0.04667
UCL=0.1201
LCL=0
10 9 8 7 6 5 4 3 2 1
40.35
40.25
40.15Part
OperatorOperator*Part Interaction
Aver
age
AMI DIANE KEN
KENDIANEAMI
40.4
40.3
40.2
40.1
Operator
By Operator10 9 8 7 6 5 4 3 2 1
40.4
40.3
40.2
40.1
Part
By Part%Contribution %Study Var
Part-to-PartReprodRepeatGage R&R
100
50
0
Components of Variation
Perc
ent
CMMS40.1
65

Gage R&R Study - ANOVA Method Gage R&R for 145 Two-Way ANOVA Table With Interaction Source DF SS MS F P Part 9 0.115667 0.0128519 1.81675 0.13432 Operator 2 0.072667 0.0363333 5.13613 0.01719 Operator*Part 18 0.127333 0.0070741 0.89671 0.58448 Repeatability 60 0.473333 0.0078889 Total 89 0.789000 Two-Way ANOVA Table Without Interaction Source DF SS MS F P Part 9 0.115667 0.0128519 1.66889 0.11084 Operator 2 0.072667 0.0363333 4.71809 0.01163 Repeatability 78 0.600667 0.0077009 Total 89 0.789000 Gage R&R %Contribution Source VarComp (of VarComp) Total Gage R&R 8.66E-03 93.80 Repeatability 7.70E-03 83.45 Reproducibility 9.54E-04 10.34 Operator 9.54E-04 10.34 Part-To-Part 5.72E-04 6.20 Total Variation 9.23E-03 100.00 StdDev Study Var %Study Var Source (SD) (5.15*SD) (%SV) Total Gage R&R 9.30E-02 0.479124 96.85 Repeatability 8.78E-02 0.451936 91.35 Reproducibility 3.09E-02 0.159102 32.16 Operator 3.09E-02 0.159102 32.16 Part-To-Part 2.39E-02 0.123206 24.90 Total Variation 9.61E-02 0.494711 100.00 Number of Distinct Categories = 0
66

Gage R&R for 145
Misc:Tolerance:Reported by:Date of study:Gage name:
0
144.9
144.8
144.7
144.6
KENDIANEAMI
Xbar Chart by Operator
Sam
ple
Mea
n
Mean=144.7
UCL=144.9
LCL=144.6
0
0.60.50.40.30.20.10.0
KENDIANEAMI
R Chart by Operator
Sam
ple
Ran
ge
R=0.1233
UCL=0.3175
LCL=0
10 9 8 7 6 5 4 3 2 1
144.85
144.75
144.65
Part
OperatorOperator*Part Interaction
Aver
age
AMI DIANE KEN
KENDIANEAMI
145.0144.9144.8144.7144.6144.5144.4
Operator
By Operator10 9 8 7 6 5 4 3 2 1
145.0144.9144.8144.7144.6144.5144.4
Part
By Part%Contribution %Study Var
Part-to-PartReprodRepeatGage R&R
100
50
0
Components of Variation
Perc
ent
CMMS145
67

Gage R&R Study - ANOVA Method Gage R&R for 13.78 Two-Way ANOVA Table With Interaction Source DF SS MS F P Part 9 0.0109064 0.0012118 6.4905 0.00039 Operator 2 0.0045648 0.0022824 12.2245 0.00044 Operator*Part 18 0.0033607 0.0001867 2.1911 0.01229 Repeatability 60 0.0051127 0.0000852 Total 89 0.0239446 Gage R&R %Contribution Source VarComp (of VarComp) Total Gage R&R 1.89E-04 62.38 Repeatability 8.52E-05 28.14 Reproducibility 1.04E-04 34.24 Operator 6.99E-05 23.07 Operator*Part 3.38E-05 11.17 Part-To-Part 1.14E-04 37.62 Total Variation 3.03E-04 100.00 StdDev Study Var %Study Var Source (SD) (5.15*SD) (%SV) Total Gage R&R 1.37E-02 7.08E-02 78.98 Repeatability 9.23E-03 4.75E-02 53.05 Reproducibility 1.02E-02 5.24E-02 58.52 Operator 8.36E-03 4.30E-02 48.03 Operator*Part 5.82E-03 3.00E-02 33.43 Part-To-Part 1.07E-02 5.50E-02 61.33 Total Variation 1.74E-02 8.96E-02 100.00 Number of Distinct Categories = 1
68

Gage R&R for 13.78
Misc:Tolerance:Reported by:Date of study:Gage name:
0
13.86513.85513.84513.83513.82513.81513.80513.795
KENDIANEAMI
Xbar Chart by Operator
Sam
ple
Mea
n
Mean=13.83
UCL=13.84
LCL=13.81
0
0.04
0.03
0.02
0.01
0.00
KENDIANEAMI
R Chart by Operator
Sam
ple
Ran
ge
R=0.01383
UCL=0.03561
LCL=0
10 9 8 7 6 5 4 3 2 1
13.86
13.8513.8413.8313.8213.8113.80Part
OperatorOperator*Part Interaction
Aver
age
AMI DIANE KEN
KENDIANEAMI
13.8813.8713.8613.8513.8413.8313.8213.8113.8013.7913.78
Operator
By Operator10 9 8 7 6 5 4 3 2 1
13.8813.8713.8613.8513.8413.8313.8213.8113.8013.7913.78Part
By Part%Contribution %Study Var
Part-to-PartReprodRepeatGage R&R
100
50
0
Components of Variation
Perc
ent
CMMS13.78
69

APPENDIX (c)
Data results for FARO arm (Round)
Gage R&R Study - ANOVA Method Gage R&R for 4.94 Two-Way ANOVA Table With Interaction Source DF SS MS F P Part 9 0.0019058 0.0002118 12.9479 0.00000 Operator 2 0.0000494 0.0000247 1.5103 0.24754 Operator*Part 18 0.0002944 0.0000164 3.0348 0.00065 Repeatability 60 0.0003233 0.0000054 Total 89 0.0025729 Gage R&R %Contribution Source VarComp (of VarComp) Total Gage R&R 9.32E-06 30.04 Repeatability 5.39E-06 17.36 Reproducibility 3.93E-06 12.67 Operator 2.78E-07 0.90 Operator*Part 3.66E-06 11.78 Part-To-Part 2.17E-05 69.96 Total Variation 3.10E-05 100.00 StdDev Study Var %Study Var Source (SD) (5.15*SD) (%SV) Total Gage R&R 3.05E-03 1.57E-02 54.81 Repeatability 2.32E-03 1.20E-02 41.67 Reproducibility 1.98E-03 1.02E-02 35.60 Operator 5.27E-04 2.72E-03 9.47 Operator*Part 1.91E-03 9.85E-03 34.32 Part-To-Part 4.66E-03 2.40E-02 83.64 Total Variation 5.57E-03 2.87E-02 100.00 Number of Distinct Categories = 2
70

Gage R&R for 4.94
Misc:Tolerance:Reported by:Date of study:Gage name:
0
4.965
4.955
4.945
KENDIANEAMI
Xbar Chart by Operator
Sam
ple
Mea
n
Mean=4.952
UCL=4.956
LCL=4.948
0
0.010
0.005
0.000
KENDIANEAMI
R Chart by Operator
Sam
ple
Ran
ge
R=0.003733
UCL=0.009611
LCL=0
10 9 8 7 6 5 4 3 2 1
4.965
4.955
4.945
Part
OperatorOperator*Part Interaction
Aver
age
AMI DIANE KEN
KENDIANEAMI
4.965
4.955
4.945
Operator
By Operator10 9 8 7 6 5 4 3 2 1
4.965
4.955
4.945
Part
By Part%Contribution %Study Var
Part-to-PartReprodRepeatGage R&R
100
50
0
Components of Variation
Perc
ent
FAROR4.94
71

Gage R&R Study - ANOVA Method Gage R&R for 6.63 Two-Way ANOVA Table With Interaction Source DF SS MS F P Part 9 0.0130824 0.0014536 36.3232 0.00000 Operator 2 0.0006239 0.0003119 7.7950 0.00364 Operator*Part 18 0.0007203 0.0000400 2.1099 0.01627 Repeatability 60 0.0011380 0.0000190 Total 89 0.0155646 Gage R&R %Contribution Source VarComp (of VarComp) Total Gage R&R 3.50E-05 18.24 Repeatability 1.90E-05 9.87 Reproducibility 1.61E-05 8.37 Operator 9.06E-06 4.72 Operator*Part 7.02E-06 3.65 Part-To-Part 1.57E-04 81.76 Total Variation 1.92E-04 100.00 StdDev Study Var %Study Var Source (SD) (5.15*SD) (%SV) Total Gage R&R 5.92E-03 3.05E-02 42.71 Repeatability 4.36E-03 2.24E-02 31.42 Reproducibility 4.01E-03 2.07E-02 28.93 Operator 3.01E-03 1.55E-02 21.72 Operator*Part 2.65E-03 1.36E-02 19.11 Part-To-Part 1.25E-02 6.45E-02 90.42 Total Variation 1.39E-02 7.14E-02 100.00 Number of Distinct Categories = 3
72

Gage R&R for 6.63
Misc:Tolerance:Reported by:Date of study:Gage name:
0
6.74
6.736.72
6.71
6.70
6.696.68
KENDIANEAMI
Xbar Chart by Operator
Sam
ple
Mea
n
Mean=6.708UCL=6.714
LCL=6.701
0
0.03
0.02
0.01
0.00
KENDIANEAMI
R Chart by Operator
Sam
ple
Ran
ge
R=0.006233
UCL=0.01605
LCL=0
10 9 8 7 6 5 4 3 2 1
6.735
6.725
6.715
6.705
6.695
6.685Part
OperatorOperator*Part Interaction
Aver
age
AMI DIANE KEN
KENDIANEAMI
6.74
6.73
6.726.71
6.706.69
6.68Operator
By Operator10 9 8 7 6 5 4 3 2 1
6.74
6.73
6.726.71
6.706.69
6.68Part
By Part%Contribution %Study Var
Part-to-PartReprodRepeatGage R&R
100
50
0
Components of Variation
Perc
ent
FAROR6.63
73

Gage R&R Study - ANOVA Method Gage R&R for 29.96 Two-Way ANOVA Table With Interaction Source DF SS MS F P Part 9 0.0331224 0.0036803 280.461 0.00000 Operator 2 0.0015700 0.0007850 59.823 0.00000 Operator*Part 18 0.0002362 0.0000131 1.198 0.29209 Repeatability 60 0.0006573 0.0000110 Total 89 0.0355860 Two-Way ANOVA Table Without Interaction Source DF SS MS F P Part 9 0.0331224 0.0036803 321.265 0.00000 Operator 2 0.0015700 0.0007850 68.527 0.00000 Repeatability 78 0.0008935 0.0000115 Total 89 0.0355860 Gage R&R %Contribution Source VarComp (of VarComp) Total Gage R&R 3.72E-05 8.37 Repeatability 1.15E-05 2.57 Reproducibility 2.58E-05 5.80 Operator 2.58E-05 5.80 Part-To-Part 4.08E-04 91.63 Total Variation 4.45E-04 100.00 StdDev Study Var %Study Var Source (SD) (5.15*SD) (%SV) Total Gage R&R 6.10E-03 0.031428 28.93 Repeatability 3.38E-03 0.017431 16.05 Reproducibility 5.08E-03 0.026151 24.07 Operator 5.08E-03 0.026151 24.07 Part-To-Part 2.02E-02 0.103980 95.72 Total Variation 2.11E-02 0.108626 100.00 Number of Distinct Categories = 5
74

Gage R&R for 29.96
Misc:Tolerance:Reported by:Date of study:Gage name:
0
30.2130.2030.1930.1830.1730.1630.1530.1430.13
KENDIANEAMI
Xbar Chart by Operator
Sam
ple
Mea
n
Mean=30.18UCL=30.18LCL=30.17
0
0.03
0.02
0.01
0.00
KENDIANEAMI
R Chart by Operator
Sam
ple
Ran
ge
R=0.0038
UCL=0.009782
LCL=0
10 9 8 7 6 5 4 3 2 1
30.2030.1930.1830.1730.1630.1530.1430.13Part
OperatorOperator*Part Interaction
Aver
age
AMI DIANE KEN
KENDIANEAMI
30.2130.2030.1930.1830.1730.1630.1530.1430.13
Operator
By Operator10 9 8 7 6 5 4 3 2 1
30.2130.2030.1930.1830.1730.1630.1530.1430.13Part
By Part%Contribution %Study Var
Part-to-PartReprodRepeatGage R&R
100
50
0
Components of Variation
Perc
ent
FAROR29.96
75

Gage R&R Study - ANOVA Method Gage R&R for 3.82 Two-Way ANOVA Table With Interaction Source DF SS MS F P Part 9 1417672 157519 0.99999 0.47416 Operator 2 315013 157507 0.99991 0.38745 Operator*Part 18 2835383 157521 1.00000 0.47269 Repeatability 60 9451312 157522 Total 89 14019381 Two-Way ANOVA Table Without Interaction Source DF SS MS F P Part 9 1417672 157519 0.999983 0.44732 Operator 2 315013 157507 0.999904 0.37258 Repeatability 78 12286695 157522 Total 89 14019381 Gage R&R %Contribution Source VarComp (of VarComp) Total Gage R&R 157522 100.00 Repeatability 157522 100.00 Reproducibility 0 0.00 Operator 0 0.00 Part-To-Part 0 0.00 Total Variation 157522 100.00 StdDev Study Var %Study Var Source (SD) (5.15*SD) (%SV) Total Gage R&R 396.890 2043.98 100.00 Repeatability 396.890 2043.98 100.00 Reproducibility 0.000 0.00 0.00 Operator 0.000 0.00 0.00 Part-To-Part 0.000 0.00 0.00 Total Variation 396.890 2043.98 100.00 Number of Distinct Categories = 0
76

Gage R&R for 3.82
Misc:Tolerance:Reported by:Date of study:Gage name:
0
1500
1000
500
0
KENDIANEAMI
Xbar Chart by Operator
Sam
ple
Mea
n
Mean=45.61UCL=174.0LCL=-82.80
0
4000
3000
2000
1000
0
KENDIANEAMI
R Chart by Operator
Sam
ple
Ran
ge
R=125.5UCL=323.1LCL=0
10 9 8 7 6 5 4 3 2 1
1000
500
0
Part
OperatorOperator*Part Interaction
Aver
age
AMI DIANE KEN
KENDIANEAMI
4000
3000
2000
1000
0
Operator
By Operator10 9 8 7 6 5 4 3 2 1
4000
3000
2000
1000
0
Part
By Part%Contribution %Study Var
Part-to-PartReprodRepeatGage R&R
100
50
0
Components of Variation
Perc
ent
FAROR3.82
77

Gage R&R Study - ANOVA Method Gage R&R for 14.98 Two-Way ANOVA Table With Interaction Source DF SS MS F P Part 9 0.0053665 0.0005963 14.3122 0.00000 Operator 2 0.0009134 0.0004567 10.9624 0.00077 Operator*Part 18 0.0007499 0.0000417 1.6598 0.07371 Repeatability 60 0.0015060 0.0000251 Total 89 0.0085358 Gage R&R %Contribution Source VarComp (of VarComp) Total Gage R&R 4.45E-05 41.91 Repeatability 2.51E-05 23.66 Reproducibility 1.94E-05 18.25 Operator 1.38E-05 13.04 Operator*Part 5.52E-06 5.20 Part-To-Part 6.16E-05 58.09 Total Variation 1.06E-04 100.00 StdDev Study Var %Study Var Source (SD) (5.15*SD) (%SV) Total Gage R&R 6.67E-03 3.43E-02 64.74 Repeatability 5.01E-03 2.58E-02 48.64 Reproducibility 4.40E-03 2.27E-02 42.72 Operator 3.72E-03 1.92E-02 36.11 Operator*Part 2.35E-03 1.21E-02 22.81 Part-To-Part 7.85E-03 4.04E-02 76.22 Total Variation 1.03E-02 5.30E-02 100.00 Number of Distinct Categories = 2
78

Gage R&R for 14.98
Misc:Tolerance:Reported by:Date of study:Gage name:
0
15.09
15.08
15.07
15.06
15.05
15.04
KENDIANEAMI
Xbar Chart by Operator
Sam
ple
Mea
n
Mean=15.06
UCL=15.07
LCL=15.06
0
0.02
0.01
0.00
KENDIANEAMI
R Chart by Operator
Sam
ple
Ran
ge
R=0.008833
UCL=0.02274
LCL=0
10 9 8 7 6 5 4 3 2 1
15.085
15.075
15.065
15.055
15.045
Part
OperatorOperator*Part Interaction
Aver
age
AMI DIANE KEN
KENDIANEAMI
15.09
15.08
15.07
15.06
15.05
15.04
Operator
By Operator10 9 8 7 6 5 4 3 2 1
15.09
15.08
15.07
15.06
15.05
15.04
Part
By Part%Contribution %Study Var
Part-to-PartReprodRepeatGage R&R
100
50
0
Components of Variation
Perc
ent
FAROR14.98
79

Gage R&R Study - ANOVA Method Gage R&R for 6.38 Two-Way ANOVA Table With Interaction Source DF SS MS F P Part 9 0.0062156 0.0006906 36.3059 0.00000 Operator 2 0.0022678 0.0011339 59.6098 0.00000 Operator*Part 18 0.0003424 0.0000190 0.9749 0.49904 Repeatability 60 0.0011707 0.0000195 Total 89 0.0099965 Two-Way ANOVA Table Without Interaction Source DF SS MS F P Part 9 0.0062156 0.0006906 35.6020 0.00000 Operator 2 0.0022678 0.0011339 58.4542 0.00000 Repeatability 78 0.0015131 0.0000194 Total 89 0.0099965 Gage R&R %Contribution Source VarComp (of VarComp) Total Gage R&R 5.65E-05 43.12 Repeatability 1.94E-05 14.79 Reproducibility 3.72E-05 28.33 Operator 3.72E-05 28.33 Part-To-Part 7.46E-05 56.88 Total Variation 1.31E-04 100.00 StdDev Study Var %Study Var Source (SD) (5.15*SD) (%SV) Total Gage R&R 7.52E-03 3.87E-02 65.67 Repeatability 4.40E-03 2.27E-02 38.46 Reproducibility 6.10E-03 3.14E-02 53.23 Operator 6.10E-03 3.14E-02 53.23 Part-To-Part 8.64E-03 4.45E-02 75.42 Total Variation 1.15E-02 5.90E-02 100.00 Number of Distinct Categories = 2
80

Gage R&R for 6.38
Misc:Tolerance:Reported by:Date of study:Gage name:
0
6.41
6.40
6.39
6.38
6.37
KENDIANEAMI
Xbar Chart by Operator
Sam
ple
Mea
n
Mean=6.393
UCL=6.401
LCL=6.385
0
0.02
0.01
0.00
KENDIANEAMI
R Chart by Operator
Sam
ple
Ran
ge
R=0.007467
UCL=0.01922
LCL=0
10 9 8 7 6 5 4 3 2 1
6.41
6.40
6.39
6.38
Part
OperatorOperator*Part Interaction
Aver
age
AMI DIANE KEN
KENDIANEAMI
6.42
6.41
6.40
6.39
6.38
6.37Operator
By Operator10 9 8 7 6 5 4 3 2 1
6.42
6.41
6.40
6.39
6.38
6.37Part
By Part%Contribution %Study Var
Part-to-PartReprodRepeatGage R&R
100
50
0
Components of Variation
Perc
ent
FAROR6.38
81

Gage R&R Study - ANOVA Method Gage R&R for 6.06 Two-Way ANOVA Table With Interaction Source DF SS MS F P Part 9 0.0015059 0.0001673 8.1321 0.00009 Operator 2 0.0032299 0.0016149 78.4889 0.00000 Operator*Part 18 0.0003704 0.0000206 0.9453 0.53097 Repeatability 60 0.0013060 0.0000218 Total 89 0.0064121 Two-Way ANOVA Table Without Interaction Source DF SS MS F P Part 9 0.0015059 0.0001673 7.7853 0.00000 Operator 2 0.0032299 0.0016149 75.1421 0.00000 Repeatability 78 0.0016764 0.0000215 Total 89 0.0064121 Gage R&R %Contribution Source VarComp (of VarComp) Total Gage R&R 7.46E-05 82.16 Repeatability 2.15E-05 23.67 Reproducibility 5.31E-05 58.49 Operator 5.31E-05 58.49 Part-To-Part 1.62E-05 17.84 Total Variation 9.08E-05 100.00 StdDev Study Var %Study Var Source (SD) (5.15*SD) (%SV) Total Gage R&R 8.64E-03 4.45E-02 90.64 Repeatability 4.64E-03 2.39E-02 48.65 Reproducibility 7.29E-03 3.75E-02 76.48 Operator 7.29E-03 3.75E-02 76.48 Part-To-Part 4.03E-03 2.07E-02 42.24 Total Variation 9.53E-03 4.91E-02 100.00 Number of Distinct Categories = 1
82

Gage R&R for 6.06
Misc:Tolerance:Reported by:Date of study:Gage name:
0
6.07
6.06
6.05
6.04
KENDIANEAMI
Xbar Chart by Operator
Sam
ple
Mea
n
Mean=6.059
UCL=6.067
LCL=6.051
0
0.02
0.01
0.00
KENDIANEAMI
R Chart by Operator
Sam
ple
Ran
ge
R=0.007733
UCL=0.01991
LCL=0
10 9 8 7 6 5 4 3 2 1
6.07
6.06
6.05
6.04
Part
OperatorOperator*Part Interaction
Aver
age
AMI DIANE KEN
KENDIANEAMI
6.0756.0706.0656.0606.0556.0506.0456.0406.0356.030
Operator
By Operator10 9 8 7 6 5 4 3 2 1
6.0756.0706.0656.0606.0556.0506.0456.0406.0356.030Part
By Part%Contribution %Study Var
Part-to-PartReprodRepeatGage R&R
100
50
0
Components of Variation
Perc
ent
FAROR6.06
83

APPENDIX (d)
Data Results for FARO arm (Square)
————— 12/21/03 11:44:35 AM ———————————————————— Welcome to Minitab, press F1 for help. Gage R&R Study - ANOVA Method Gage R&R for FAROS16.66 Two-Way ANOVA Table With Interaction Source DF SS MS F P Part 9 0.0087920 0.0009769 1.8548 0.12651 Operator 2 0.0307718 0.0153859 29.2125 0.00000 Operator*Part 18 0.0094804 0.0005267 4.1453 0.00002 Repeatability 60 0.0076233 0.0001271 Total 89 0.0566676 Gage R&R %Contribution Source VarComp (of VarComp) Total Gage R&R 7.56E-04 93.79 Repeatability 1.27E-04 15.77 Reproducibility 6.29E-04 78.02 Operator 4.95E-04 61.48 Operator*Part 1.33E-04 16.54 Part-To-Part 5.00E-05 6.21 Total Variation 8.06E-04 100.00 StdDev Study Var %Study Var Source (SD) (5.15*SD) (%SV) Total Gage R&R 2.75E-02 0.141562 96.85 Repeatability 1.13E-02 0.058050 39.71 Reproducibility 2.51E-02 0.129112 88.33 Operator 2.23E-02 0.114616 78.41 Operator*Part 1.15E-02 0.059440 40.66 Part-To-Part 7.07E-03 0.036424 24.92 Total Variation 2.84E-02 0.146173 100.00 Number of Distinct Categories = 0
84

Gage R&R for FAROS16.66
Misc:Tolerance:Reported by:Date of study:Gage name:
0
16.68
16.63
16.58
KENDIANEAMI
Xbar Chart by Operator
Sam
ple
Mea
n
Mean=16.63
UCL=16.65
LCL=16.61
0
0.050.04
0.03
0.02
0.01
0.00
KENDIANEAMI
R Chart by Operator
Sam
ple
Ran
ge
R=0.01837
UCL=0.04728
LCL=0
10 9 8 7 6 5 4 3 2 1
16.6816.6716.6616.6516.6416.6316.6216.6116.6016.5916.58Part
OperatorOperator*Part Interaction
Aver
age
AMI DIANE KEN
KENDIANEAMI
16.70
16.65
16.60
Operator
By Operator10 9 8 7 6 5 4 3 2 1
16.70
16.65
16.60
Part
By Part%Contribution %Study Var
Part-to-PartReprodRepeatGage R&R
100
50
0
Components of Variation
Perc
ent
FAROS16.66
85

Gage R&R Study - ANOVA Method Gage R&R for FAROS22.68 Two-Way ANOVA Table With Interaction Source DF SS MS F P Part 9 0.0267649 0.0029739 7.67726 0.00014 Operator 2 0.0023022 0.0011511 2.97158 0.07670 Operator*Part 18 0.0069725 0.0003874 2.76511 0.00167 Repeatability 60 0.0084053 0.0001401 Total 89 0.0444449 Gage R&R %Contribution Source VarComp (of VarComp) Total Gage R&R 2.48E-04 46.32 Repeatability 1.40E-04 26.17 Reproducibility 1.08E-04 20.15 Operator 2.55E-05 4.76 Operator*Part 8.24E-05 15.40 Part-To-Part 2.87E-04 53.68 Total Variation 5.35E-04 100.00 StdDev Study Var %Study Var Source (SD) (5.15*SD) (%SV) Total Gage R&R 1.57E-02 0.081097 68.06 Repeatability 1.18E-02 0.060955 51.15 Reproducibility 1.04E-02 0.053491 44.89 Operator 5.05E-03 0.025984 21.81 Operator*Part 9.08E-03 0.046756 39.24 Part-To-Part 1.70E-02 0.087306 73.27 Total Variation 2.31E-02 0.119160 100.00 Number of Distinct Categories = 2
86

Gage R&R for FAROS22.68
Misc:Tolerance:Reported by:Date of study:Gage name:
0
22.6722.6622.6522.6422.6322.6222.6122.6022.5922.5822.57
KENDIANEAMI
Xbar Chart by Operator
Sam
ple
Mea
n
Mean=22.62
UCL=22.64
LCL=22.60
0
0.060.050.040.030.020.010.00
KENDIANEAMI
R Chart by Operator
Sam
ple
Ran
ge
R=0.0197
UCL=0.05071
LCL=0
10 9 8 7 6 5 4 3 2 1
22.66522.65522.64522.63522.62522.61522.60522.59522.58522.575
Part
OperatorOperator*Part Interaction
Aver
age
AMI DIANE KEN
KENDIANEAMI
22.69
22.64
22.59
22.54
Operator
By Operator10 9 8 7 6 5 4 3 2 1
22.69
22.64
22.59
22.54
Part
By Part%Contribution %Study Var
Part-to-PartReprodRepeatGage R&R
100
50
0
Components of Variation
Perc
ent
FAROS22.68
87

Gage R&R Study - ANOVA Method Gage R&R for FAROS1.63a Two-Way ANOVA Table With Interaction Source DF SS MS F P Part 9 0.0057223 0.0006358 4.0026 0.00594 Operator 2 0.0033458 0.0016729 10.5313 0.00094 Operator*Part 18 0.0028593 0.0001589 7.1092 0.00000 Repeatability 60 0.0013407 0.0000223 Total 89 0.0132681 Gage R&R %Contribution Source VarComp (of VarComp) Total Gage R&R 1.18E-04 69.06 Repeatability 2.23E-05 13.04 Reproducibility 9.60E-05 56.02 Operator 5.05E-05 29.46 Operator*Part 4.55E-05 26.56 Part-To-Part 5.30E-05 30.94 Total Variation 1.71E-04 100.00 StdDev Study Var %Study Var Source (SD) (5.15*SD) (%SV) Total Gage R&R 1.09E-02 5.60E-02 83.11 Repeatability 4.73E-03 2.43E-02 36.12 Reproducibility 9.80E-03 5.05E-02 74.85 Operator 7.10E-03 3.66E-02 54.28 Operator*Part 6.75E-03 3.47E-02 51.54 Part-To-Part 7.28E-03 3.75E-02 55.62 Total Variation 1.31E-02 6.74E-02 100.00 Number of Distinct Categories = 1
88

Gage R&R for FAROS1.63a
Misc:Tolerance:Reported by:Date of study:Gage name:
0
1.64
1.631.62
1.61
1.60
1.591.58
KENDIANEAMI
Xbar Chart by Operator
Sam
ple
Mea
n
Mean=1.611UCL=1.618
LCL=1.604
0
0.03
0.02
0.01
0.00
KENDIANEAMI
R Chart by Operator
Sam
ple
Ran
ge
R=0.0066
UCL=0.01699
LCL=0
10 9 8 7 6 5 4 3 2 1
1.63
1.62
1.61
1.60
1.59
1.58Part
OperatorOperator*Part Interaction
Aver
age
AMI DIANE KEN
KENDIANEAMI
1.635
1.625
1.6151.605
1.5951.585
1.575Operator
By Operator10 9 8 7 6 5 4 3 2 1
1.635
1.625
1.6151.605
1.5951.585
1.575Part
By Part%Contribution %Study Var
Part-to-PartReprodRepeatGage R&R
100
50
0
Components of Variation
Perc
ent
FAROS1.63a
89

Gage R&R Study - ANOVA Method Gage R&R for FAROS25.44 Two-Way ANOVA Table With Interaction Source DF SS MS F P Part 9 0.132867 0.0147630 2.2623 0.06711 Operator 2 0.156968 0.0784840 12.0272 0.00048 Operator*Part 18 0.117460 0.0065256 2.1488 0.01423 Repeatability 60 0.182209 0.0030368 Total 89 0.589504 Gage R&R %Contribution Source VarComp (of VarComp) Total Gage R&R 6.60E-03 87.82 Repeatability 3.04E-03 40.42 Reproducibility 3.56E-03 47.40 Operator 2.40E-03 31.92 Operator*Part 1.16E-03 15.48 Part-To-Part 9.15E-04 12.18 Total Variation 7.51E-03 100.00 StdDev Study Var %Study Var Source (SD) (5.15*SD) (%SV) Total Gage R&R 8.12E-02 0.418335 93.71 Repeatability 5.51E-02 0.283802 63.57 Reproducibility 5.97E-02 0.307345 68.85 Operator 4.90E-02 0.252225 56.50 Operator*Part 3.41E-02 0.175623 39.34 Part-To-Part 3.03E-02 0.155806 34.90 Total Variation 8.67E-02 0.446408 100.00 Number of Distinct Categories = 1
90

Gage R&R for FAROS25.44
Misc:Tolerance:Reported by:Date of study:Gage name:
0
25.65
25.55
25.45
25.35
KENDIANEAMI
Xbar Chart by Operator
Sam
ple
Mea
n
Mean=25.51
UCL=25.60
LCL=25.41
0
0.2
0.1
0.0
KENDIANEAMI
R Chart by Operator
Sam
ple
Ran
ge
R=0.09357
UCL=0.2409
LCL=0
10 9 8 7 6 5 4 3 2 1
25.65
25.55
25.45
25.35Part
OperatorOperator*Part Interaction
Aver
age
AMI DIANE KEN
KENDIANEAMI
25.7
25.6
25.5
25.4
25.3Operator
By Operator10 9 8 7 6 5 4 3 2 1
25.7
25.6
25.5
25.4
25.3Part
By Part%Contribution %Study Var
Part-to-PartReprodRepeatGage R&R
100
50
0
Components of Variation
Perc
ent
FAROS25.44
91

Gage R&R Study - ANOVA Method Gage R&R for FAROS38.03 Two-Way ANOVA Table With Interaction Source DF SS MS F P Part 9 0.0086276 0.0009586 14.0674 0.00000 Operator 2 0.0023221 0.0011610 17.0378 0.00007 Operator*Part 18 0.0012266 0.0000681 1.2751 0.23682 Repeatability 60 0.0032067 0.0000534 Total 89 0.0153829 Gage R&R %Contribution Source VarComp (of VarComp) Total Gage R&R 9.48E-05 48.92 Repeatability 5.34E-05 27.59 Reproducibility 4.13E-05 21.34 Operator 3.64E-05 18.81 Operator*Part 4.90E-06 2.53 Part-To-Part 9.89E-05 51.08 Total Variation 1.94E-04 100.00 StdDev Study Var %Study Var Source (SD) (5.15*SD) (%SV) Total Gage R&R 9.74E-03 5.01E-02 69.95 Repeatability 7.31E-03 3.76E-02 52.53 Reproducibility 6.43E-03 3.31E-02 46.19 Operator 6.04E-03 3.11E-02 43.37 Operator*Part 2.21E-03 1.14E-02 15.90 Part-To-Part 9.95E-03 5.12E-02 71.47 Total Variation 1.39E-02 7.17E-02 100.00 Number of Distinct Categories = 1
92

Gage R&R for FAROS38.03
Misc:Tolerance:Reported by:Date of study:Gage name:
0
37.975
37.965
37.955
37.945
37.935
37.925
KENDIANEAMI
Xbar Chart by Operator
Sam
ple
Mea
n
Mean=37.95
UCL=37.96
LCL=37.94
0
0.03
0.02
0.01
0.00
KENDIANEAMI
R Chart by Operator
Sam
ple
Ran
ge
R=0.01233
UCL=0.03175
LCL=0
10 9 8 7 6 5 4 3 2 1
37.97
37.96
37.95
37.94
37.93
Part
OperatorOperator*Part Interaction
Aver
age
AMI DIANE KEN
KENDIANEAMI
37.9837.9737.9637.9537.9437.9337.9237.91
Operator
By Operator10 9 8 7 6 5 4 3 2 1
37.9837.9737.9637.9537.9437.9337.9237.91Part
By Part%Contribution %Study Var
Part-to-PartReprodRepeatGage R&R
100
50
0
Components of Variation
Perc
ent
FAROS38.03
93

Gage R&R Study - ANOVA Method Gage R&R for FAROS40.34 Two-Way ANOVA Table With Interaction Source DF SS MS F P Part 9 0.0215558 0.0023951 383.328 0.00000 Operator 2 0.0002164 0.0001082 17.319 0.00006 Operator*Part 18 0.0001125 0.0000062 1.345 0.19404 Repeatability 60 0.0002787 0.0000046 Total 89 0.0221634 Gage R&R %Contribution Source VarComp (of VarComp) Total Gage R&R 8.58E-06 3.13 Repeatability 4.64E-06 1.70 Reproducibility 3.93E-06 1.44 Operator 3.40E-06 1.24 Operator*Part 5.35E-07 0.20 Part-To-Part 2.65E-04 96.87 Total Variation 2.74E-04 100.00 StdDev Study Var %Study Var Source (SD) (5.15*SD) (%SV) Total Gage R&R 2.93E-03 1.51E-02 17.69 Repeatability 2.16E-03 1.11E-02 13.02 Reproducibility 1.98E-03 1.02E-02 11.98 Operator 1.84E-03 9.49E-03 11.14 Operator*Part 7.31E-04 3.77E-03 4.42 Part-To-Part 1.63E-02 8.39E-02 98.42 Total Variation 1.66E-02 8.52E-02 100.00 Number of Distinct Categories = 8
94

Gage R&R for FAROS40.34
Misc:Tolerance:Reported by:Date of study:Gage name:
0
40.3240.3140.3040.2940.2840.2740.26
KENDIANEAMI
Xbar Chart by Operator
Sam
ple
Mea
n
Mean=40.30UCL=40.30LCL=40.29
0
0.010
0.005
0.000
KENDIANEAMI
R Chart by Operator
Sam
ple
Ran
ge
R=0.003567
UCL=0.009181
LCL=0
10 9 8 7 6 5 4 3 2 1
40.32
40.31
40.30
40.29
40.28
40.27
Part
OperatorOperator*Part Interaction
Aver
age
AMI DIANE KEN
KENDIANEAMI
40.325
40.31540.30540.295
40.28540.27540.265
Operator
By Operator10 9 8 7 6 5 4 3 2 1
40.325
40.31540.30540.295
40.28540.27540.265
Part
By Part%Contribution %Study Var
Part-to-PartReprodRepeatGage R&R
100
50
0
Components of Variation
Perc
ent
FAROS40.34
95

Gage R&R Study - ANOVA Method Gage R&R for FAROS1.63b Two-Way ANOVA Table With Interaction Source DF SS MS F P Part 9 0.090921 0.0101024 6.87999 0.00027 Operator 2 0.029278 0.0146392 9.96972 0.00122 Operator*Part 18 0.026431 0.0014684 6.21751 0.00000 Repeatability 60 0.014170 0.0002362 Total 89 0.160800 Gage R&R %Contribution Source VarComp (of VarComp) Total Gage R&R 1.09E-03 53.09 Repeatability 2.36E-04 11.55 Reproducibility 8.50E-04 41.55 Operator 4.39E-04 21.47 Operator*Part 4.11E-04 20.08 Part-To-Part 9.59E-04 46.91 Total Variation 2.05E-03 100.00 StdDev Study Var %Study Var Source (SD) (5.15*SD) (%SV) Total Gage R&R 3.30E-02 0.169710 72.87 Repeatability 1.54E-02 0.079144 33.98 Reproducibility 2.92E-02 0.150126 64.46 Operator 2.10E-02 0.107908 46.33 Operator*Part 2.03E-02 0.104373 44.81 Part-To-Part 3.10E-02 0.159511 68.49 Total Variation 4.52E-02 0.232907 100.00 Number of Distinct Categories = 1
96

Gage R&R for FAROS1.63b
Misc:Tolerance:Reported by:Date of study:Gage name:
0
1.7
1.6
1.5
KENDIANEAMI
Xbar Chart by Operator
Sam
ple
Mea
n
Mean=1.621UCL=1.642
LCL=1.601
0
0.10
0.05
0.00
KENDIANEAMI
R Chart by Operator
Sam
ple
Ran
ge
R=0.02037
UCL=0.05243
LCL=0
10 9 8 7 6 5 4 3 2 1
1.70
1.65
1.60
1.55
Part
OperatorOperator*Part Interaction
Aver
age
AMI DIANE KEN
KENDIANEAMI
1.7
1.6
1.5
Operator
By Operator10 9 8 7 6 5 4 3 2 1
1.7
1.6
1.5
Part
By Part%Contribution %Study Var
Part-to-PartReprodRepeatGage R&R
100
50
0
Components of Variation
Perc
ent
FAROS1.63b
97

Gage R&R Study - ANOVA Method Gage R&R for FAROS1.00 Two-Way ANOVA Table With Interaction Source DF SS MS F P Part 9 0.0311078 0.0034564 99.7507 0.00000 Operator 2 0.0003141 0.0001570 4.5319 0.02547 Operator*Part 18 0.0006237 0.0000347 1.2479 0.25522 Repeatability 60 0.0016660 0.0000278 Total 89 0.0337116 Two-Way ANOVA Table Without Interaction Source DF SS MS F P Part 9 0.0311078 0.0034564 117.745 0.00000 Operator 2 0.0003141 0.0001570 5.349 0.00665 Repeatability 78 0.0022897 0.0000294 Total 89 0.0337116 Gage R&R %Contribution Source VarComp (of VarComp) Total Gage R&R 3.36E-05 8.11 Repeatability 2.94E-05 7.08 Reproducibility 4.26E-06 1.03 Operator 4.26E-06 1.03 Part-To-Part 3.81E-04 91.89 Total Variation 4.14E-04 100.00 StdDev Study Var %Study Var Source (SD) (5.15*SD) (%SV) Total Gage R&R 5.80E-03 0.029857 28.48 Repeatability 5.42E-03 0.027903 26.62 Reproducibility 2.06E-03 0.010624 10.13 Operator 2.06E-03 0.010624 10.13 Part-To-Part 1.95E-02 0.100496 95.86 Total Variation 2.04E-02 0.104837 100.00 Number of Distinct Categories = 5
98

Gage R&R for FAROS1.00
Misc:Tolerance:Reported by:Date of study:Gage name:
0
1.051.041.031.021.011.000.99
KENDIANEAMI
Xbar Chart by Operator
Sam
ple
Mea
n
Mean=1.021UCL=1.029
LCL=1.013
0
0.03
0.02
0.01
0.00
KENDIANEAMI
R Chart by Operator
Sam
ple
Ran
ge
R=0.0079
UCL=0.02034
LCL=0
10 9 8 7 6 5 4 3 2 1
1.05
1.041.031.02
1.011.000.99Part
OperatorOperator*Part Interaction
Aver
age
AMI DIANE KEN
KENDIANEAMI
1.0651.0551.0451.0351.0251.0151.0050.9950.985
Operator
By Operator10 9 8 7 6 5 4 3 2 1
1.0651.0551.0451.0351.0251.0151.0050.9950.985Part
By Part%Contribution %Study Var
Part-to-PartReprodRepeatGage R&R
100
50
0
Components of Variation
Perc
ent
FAROS1.00
99

Gage R&R Study - ANOVA Method Gage R&R for FAROS2.91 Two-Way ANOVA Table With Interaction Source DF SS MS F P Part 9 0.0663248 0.0073694 179.531 0.00000 Operator 2 0.0000607 0.0000303 0.739 0.49142 Operator*Part 18 0.0007389 0.0000410 1.619 0.08407 Repeatability 60 0.0015213 0.0000254 Total 89 0.0686457 Gage R&R %Contribution Source VarComp (of VarComp) Total Gage R&R 3.06E-05 3.62 Repeatability 2.54E-05 3.00 Reproducibility 5.23E-06 0.62 Operator 0.00E+00 0.00 Operator*Part 5.23E-06 0.62 Part-To-Part 8.14E-04 96.38 Total Variation 8.45E-04 100.00 StdDev Study Var %Study Var Source (SD) (5.15*SD) (%SV) Total Gage R&R 5.53E-03 0.028482 19.03 Repeatability 5.04E-03 0.025932 17.32 Reproducibility 2.29E-03 0.011779 7.87 Operator 0.00E+00 0.000000 0.00 Operator*Part 2.29E-03 0.011779 7.87 Part-To-Part 2.85E-02 0.146957 98.17 Total Variation 2.91E-02 0.149691 100.00 Number of Distinct Categories = 7
100

Gage R&R for FAROS2.91
Misc:Tolerance:Reported by:Date of study:Gage name:
0
3.05
3.00
2.95
KENDIANEAMI
Xbar Chart by Operator
Sam
ple
Mea
n
Mean=2.998UCL=3.005LCL=2.991
0
0.03
0.02
0.01
0.00
KENDIANEAMI
R Chart by Operator
Sam
ple
Ran
ge
R=0.0071
UCL=0.01828
LCL=0
10 9 8 7 6 5 4 3 2 1
3.043.033.023.013.002.992.982.972.962.95
Part
OperatorOperator*Part Interaction
Aver
age
AMI DIANE KEN
KENDIANEAMI
3.05
3.00
2.95
Operator
By Operator10 9 8 7 6 5 4 3 2 1
3.05
3.00
2.95
Part
By Part%Contribution %Study Var
Part-to-PartReprodRepeatGage R&R
100
50
0
Components of Variation
Perc
ent
FAROS2.91
101

Gage R&R Study - ANOVA Method Gage R&R for FAROS40.1 ** Error ** No variation within part/operator subgroups; execution aborted.
102

Gage R&R Study - ANOVA Method Gage R&R for FAROS145 Two-Way ANOVA Table With Interaction Source DF SS MS F P Part 9 0.204556 0.0227284 2.06159 0.09151 Operator 2 0.146000 0.0730000 6.62150 0.00699 Operator*Part 18 0.198444 0.0110247 1.94553 0.02855 Repeatability 60 0.340000 0.0056667 Total 89 0.889000 Gage R&R %Contribution Source VarComp (of VarComp) Total Gage R&R 0.009519 87.98 Repeatability 0.005667 52.38 Reproducibility 0.003852 35.60 Operator 0.002066 19.09 Operator*Part 0.001786 16.51 Part-To-Part 0.001300 12.02 Total Variation 0.010819 100.00 StdDev Study Var %Study Var Source (SD) (5.15*SD) (%SV) Total Gage R&R 0.097563 0.502449 93.80 Repeatability 0.075277 0.387678 72.37 Reproducibility 0.062063 0.319626 59.67 Operator 0.045452 0.234075 43.70 Operator*Part 0.042261 0.217645 40.63 Part-To-Part 0.036061 0.185715 34.67 Total Variation 0.104014 0.535673 100.00 Number of Distinct Categories = 1
103

Gage R&R for FAROS145
Misc:Tolerance:Reported by:Date of study:Gage name:
0
144.9
144.8
144.7
144.6
144.5
144.4
KENDIANEAMI
Xbar Chart by Operator
Sam
ple
Mea
n
Mean=144.6
UCL=144.7
LCL=144.5
0
0.3
0.2
0.1
0.0
KENDIANEAMI
R Chart by Operator
Sam
ple
Ran
ge
R=0.1167
UCL=0.3003
LCL=0
10 9 8 7 6 5 4 3 2 1
144.9
144.8
144.7
144.6
144.5
Part
OperatorOperator*Part Interaction
Aver
age
AMI DIANE KEN
KENDIANEAMI
145.0144.9144.8144.7144.6144.5144.4
Operator
By Operator10 9 8 7 6 5 4 3 2 1
145.0144.9144.8144.7144.6144.5144.4
Part
By Part%Contribution %Study Var
Part-to-PartReprodRepeatGage R&R
100
50
0
Components of Variation
Perc
ent
FAROS145
104

Gage R&R Study - ANOVA Method Gage R&R for FAROS13.78 Two-Way ANOVA Table With Interaction Source DF SS MS F P Part 9 0.0147758 0.0016418 159.012 0.00000 Operator 2 0.0000626 0.0000313 3.032 0.07333 Operator*Part 18 0.0001858 0.0000103 1.063 0.40928 Repeatability 60 0.0005827 0.0000097 Total 89 0.0156069 Two-Way ANOVA Table Without Interaction Source DF SS MS F P Part 9 0.0147758 0.0016418 166.630 0.00000 Operator 2 0.0000626 0.0000313 3.177 0.04717 Repeatability 78 0.0007685 0.0000099 Total 89 0.0156069 Gage R&R %Contribution Source VarComp (of VarComp) Total Gage R&R 1.06E-05 5.51 Repeatability 9.85E-06 5.13 Reproducibility 7.15E-07 0.37 Operator 7.15E-07 0.37 Part-To-Part 1.81E-04 94.49 Total Variation 1.92E-04 100.00 StdDev Study Var %Study Var Source (SD) (5.15*SD) (%SV) Total Gage R&R 3.25E-03 1.67E-02 23.47 Repeatability 3.14E-03 1.62E-02 22.66 Reproducibility 8.46E-04 4.35E-03 6.10 Operator 8.46E-04 4.35E-03 6.10 Part-To-Part 1.35E-02 6.93E-02 97.21 Total Variation 1.39E-02 7.13E-02 100.00 Number of Distinct Categories = 6
105

Gage R&R for FAROS13.78
Misc:Tolerance:Reported by:Date of study:Gage name:
0
13.85
13.84
13.83
13.82
13.81
13.80
KENDIANEAMI
Xbar Chart by Operator
Sam
ple
Mea
n
Mean=13.83UCL=13.84
LCL=13.83
0
0.015
0.010
0.005
0.000
KENDIANEAMI
R Chart by Operator
Sam
ple
Ran
ge
R=0.004733
UCL=0.01218
LCL=0
10 9 8 7 6 5 4 3 2 1
13.85
13.84
13.83
13.82
13.81
13.80Part
OperatorOperator*Part Interaction
Aver
age
AMI DIANE KEN
KENDIANEAMI
13.85
13.84
13.83
13.82
13.81
13.80Operator
By Operator10 9 8 7 6 5 4 3 2 1
13.85
13.84
13.83
13.82
13.81
13.80Part
By Part%Contribution %Study Var
Part-to-PartReprodRepeatGage R&R
100
50
0
Components of Variation
Perc
ent
FAROS13.78
106


![Gauge & R&R [Repeatability & Reproducibility] Analysis](https://img.dokumen.tips/doc/110x75/54becf3e4a7959a67f8b4696/gauge-rr-repeatability-reproducibility-analysis.jpg)