Embed Size (px)
Citation preview

Assessing landscape-level variations in human
propensity to kill lions in Samburu, Isiolo and
Laikipia counties, northern Kenya
Clio Maggi
September 2014
A thesis submitted for the partial fulfillment of the requirements for the degree of Master of
Science/Research at Imperial College London
Submitted for the MSc in Conservation Science
i
Declaration of own work
I declare that this thesis, “Assessing landscape-level variations in human propensity to kill
lions in Samburu, Isiolo and Laikipia counties, northern Kenya” is entirely my own work,
and that where material could be construed as the work of others, it is fully cited and
referenced, and/or with appropriate acknowledgement given.
Signature
Name of student Clio Maggi
Name of Supervisor(s) Dr Aidan Keane
Dr Alayne Cotterill
ii
Contents List of figures .................................................................................................................................... iv
List of tables ...................................................................................................................................... vi
List of acronyms and abbreviations .................................................................................................. vi
Abstract ........................................................................................................................................... viii
Acknowledgements ........................................................................................................................... ix
1. Introduction ................................................................................................................................ 1
1.1 Problem statement .................................................................................................................... 1
1.2 Study Aims ......................................................................................................................... 4
1.3 Study Objectives and Hypotheses ...................................................................................... 4
2. Background .................................................................................................................................... 5
2.1 Study area ................................................................................................................................. 5
2.1.1 The Ewaso ecosystem: Samburu, Isiolo and Laikipia counties ........................................ 5
2.1.2 Westgate and Nakuprat-Gotu Community Conservancies ............................................. 6
2.1.3 Laikipia Pastoral Areas ................................................................................................ 7
2.1.4 Samburu and Turkana tribes ............................................................................................ 7
2.1.5 Ewaso Lions ..................................................................................................................... 8
2.2 Study species ............................................................................................................................ 8
2.2.1 Lions of the Ewaso ecosystem .......................................................................................... 8
2.2.2 Dynamics of livestock depredation and retaliatory killing of large carnivores .............. 10
2.3 Understanding human behaviour in human-wildlife conflict ................................................. 11
2.4 Mapping spatial variation in human-wildlife conflict ............................................................ 13
3. Methods ........................................................................................................................................ 15
3.1 Location selection .................................................................................................................. 15
3.2 Methodological Framework ................................................................................................... 16
3.3 Semi-structured Interviews .................................................................................................... 17
3.3.1 Data collection and sampling strategy ............................................................................ 17
3.3.2 Defining “Propensity to Kill” ......................................................................................... 18
3.3.3 Theory of Planned Behaviour (TPB) ............................................................................... 19
3.3.4 Laikipia surveys............................................................................................................... 19
3.4 Ethics ...................................................................................................................................... 19
3.5 Data Analysis ......................................................................................................................... 20
3.6 Participatory Mapping ............................................................................................................ 22
4.Results ........................................................................................................................................... 24
4.1 Sample summary .................................................................................................................... 24
4.2 Perceptions of livestock depredation ...................................................................................... 26

iii
4.3 Variations in propensity to kill lions in different study areas ................................................ 28
4.3.1 Behavioural Intention by Area ........................................................................................ 28
4.3.2 Normal Response to Livestock Depredation by Area ...................................................... 28
4.3.3. Tolerance by Area .......................................................................................................... 30
4.3.4. Killing Scale by Area ...................................................................................................... 33
4.4 Methods of killing lions ......................................................................................................... 35
4.5 Perceptions of lion killing in the study areas ......................................................................... 35
4.6 PCA and Linear Models – WCC and NGCC ......................................................................... 37
4.6.1. PCA ................................................................................................................................ 37
4.6.2. Linear models with area ................................................................................................. 38
4.7 PCA and Linear Models – WCC, NGCC and Laikipia .......................................................... 40
4.7.1. PCA ................................................................................................................................ 40
4.7.2. Linear models with area (including Laikipia) ................................................................ 40
4.8 Effects of socio-demographics on propensity to kill lions ..................................................... 42
4.9 Effects of attitudes, subjective norms and perceived controls on propensity to kill lions ..... 44
4.10 Risk maps ............................................................................................................................. 45
5. Discussion .................................................................................................................................... 47
5.1 Summary of key findings ....................................................................................................... 47
5.2 Patterns of propensity to kill lions in the study areas ............................................................. 48
5.3 Influence of socio-demographics and individual experiences on propensity to kill lions ...... 51
5.4 Influences of attitudes, social norms and perceived behavioural control on propensity to kill
lions .............................................................................................................................................. 53
5.5 Where do lions risk being killed the most? ............................................................................ 54
5.6 Recommendations for future management and conclusions .................................................. 54
References ........................................................................................................................................ 57
Appendices ....................................................................................................................................... 64
Appendix 1: Questionnaire (Westgate Community Conservancy and Nakuprat Gotu Community
Conservancy) (Rescaled for thesis presentation) ......................................................................... 64
Appendix 2: Laikipia Questionnaire (rescaled for thesis presentation) ....................................... 69
Appendix 3: Participatory mapping exercise guidelines .............................................................. 72
Appendix 4: Household composition ........................................................................................... 73
Appendix 5: Problem predators in different study locations ........................................................ 75
Appendix 6: Parallel Analysis Scree Plots ................................................................................... 76
Appendix 7: Linear models with Area. ........................................................................................ 77

iv
Appendix 8: Linear models with socio-demographic variables ................................................... 79
Appendix 9: Linear models with Theory of Planned Behaviour constructs ................................ 83
Appendix 10: Participatory maps (examples) .............................................................................. 84
Appendix 11: Risk maps including livestock movements ........................................................... 87

v
List of figures
Figure 2.1: Map of the Ewaso Ecosystem............................................................................................5
Figure 2.2: Aerial view of a traditional Samburu “manyatta”.............................................................7
Figure 2.3: Map showing predicted lion movement corridors within the Ewaso ecosystem...............9
Figure 2.4: The Theory of Planned Behaviour (TPB).........................................................................12
Figure 3.1: Map of the study area with the survey locations indicated by the red triangles................15
Figure 3.2: Samburu warriors (above) and Samburu women (below) engaging in PM exercises in
WCC.....................................................................................................................................................22
Figure 4.1: Reported frequency of livestock (cattle, shoats, donkeys and camels) depredation in the
different study locations.......................................................................................................................27
Figure 4.2: Level of agreements of respondents to the statement “I intend to kill lions in the next
year” in the different study locations...................................................................................................28
Figure 4.3: Normal responses to livestock depredation by lions in different study areas....................29
Figure 4.4: Proportion of respondents at each location who would never kill a lion which has killed
livestock, who would only kill it after a threshold number of livestock killed, or who would kill it
regardless of the number of livestock killed........................................................................................31
Figure 4.5: Mean number of cattle, shoats, donkeys and camels respondents in different areas are
willing to lose to a lion before they retaliate by killing the lion..........................................................32
Figure 4.6: Boxplots showing the pattern of responses scores to eight killing scale statements in the
different study areas.............................................................................................................................34
Figure 4.7: Choice of methods respondents would use to kill a lion in different areas.......................35
Figure 4.8a-b: Perceptions of lion killing in the study area.................................................................36
Figure 4.9 a-c: Linear model coefficients for RC1, RC2, RC3............................................................39
Figure 4.10 a-c: Linear model coefficients for RC1(2), RC2(2), RC3(2)............................................41
Figure 4.11:Risk map of WCC.............................................................................................................45
Figure 4.12: Risk map of NGCC..........................................................................................................46

vi
List of tables
Table 1.1:Research objectives and hypotheses....................................................................................4
Table 2.1: Estimated number of lions in the Ewaso ecosystem....................................................... ....9
Table 3.1: Structure and content of the semi-structured questionnaire...............................................17
Table 3.2: Description of the four measures of propensity to kill used in this study..........................18
Table 3.3: Predictor variables used in linear models...........................................................................21
Table 4.1: Number of individuals and proportion of population surveyed in each study location......24
Table 4.2: Mean rank score for each of the causes of livestock loss in different areas.......................26
Table 4.3: Kruskal-Wallis results for the difference in normal response to livestock depredation by
lions in the different study locations...................................................................................................30
Table 4.4: Kruskal-Wallis results for the differences in tolerance thresholds in the different study
locations..............................................................................................................................................32
Table 4.5: Kruskal-Wallis results for each of the eight killing scale statements in different study
areas....................................................................................................................................................33
Table 4.6: Loadings for varimax-rotated PCA components...............................................................37
Table 4.7: Loadings for varimax-rotated PCA components (Laikipia)..............................................40
Cover photo: Lions watch over the Ewaso Nyiro river, Samburu National Reserve, July
2014.
Credit: Clio Maggi

vii
List of acronyms and abbreviations
BSNR Buffalo Springs National Reserve
Cheetah Cheetah (Acinonyx jubatus)
EL Ewaso Lions
Hyena Spotted hyena (Crocuta crocuta)
HWC Human-Wildlife Conflict
KWS Kenya Wildlife Service
Leopard Leopard (Panthera pardus)
NGCC Nakuprat-Gotu Community Conservancy
NGO Non-Governmental Organisation
NRT Northern Rangelands Trust
PA Protected Area
PCA Principal Component Analysis
PM Participatory Mapping
PRA Participatory Rural Appraisal
Shoats Sheep and goats
SNR Samburu National Reserve
SSI Semi-Structured Interview
TPB Theory of Planned Behaviour
WCC Westgate Community Conservancy
Wild dog Wild dog (Lycaon pictus)

viii
Abstract
African lions (Panthera leo leo) have experienced drastic population declines and range
contractions throughout the continent, primarily due to retaliatory killing by local people
triggered by livestock depredation. This study aims to investigate the spatial variations in
human propensity to kill lions in areas connecting known populations within the Ewaso
ecosystem in northern Kenya and to identify the factors that determine high risk of human-
caused lion mortality. Semi-structured interviews were conducted in two community
conservancies (Westgate and Nakuprat-Gotu) and compared to previously collected surveys
in two pastoral communities in Laikipia. Participatory mapping exercises were carried out to
illustrate livestock movement patterns and perceived human-lion conflict hotspots, to
identify the areas where retaliatory killing of lions is most likely to occur. Results showed
respondents in Westgate Community Conservancy had a lower propensity to kill lions
compared to both Nakuprat-Gotu Community Conservancy and Laikipia pastoral areas.
Demographic variables, cultural differences, wealth indicators and individual experiences all
influenced propensity to kill lions. Attitudes, subjective norms and perceived behavioural
controls also predicted inclination to kill lions. Recommendations for future landscape-level
management are made in light of these findings.
Word Count: 15,790

ix
Acknowledgements
Firstly, I would like to thank my supervisors Aidan Keane (Imperial College) and Alayne
Cotterill (Ewaso Lions) for their precious guidance and support throughout this project.
This project would not have been possible without Shivani Bhalla. I thank her for her
hospitality, her invaluable advice and suggestions and her inspiring devotion and passion for
conservation and lions.
I would like to express my deep gratitude to my research assistants Ngila Ltenesi and
Thomas Ekiru, who did a fantastic job with my surveys and always worked with dedication
and enthusiasm.
I would also like to thank all the staff at Ewaso Lions: Jeneria Lekilelei, for making me learn
so many things about Samburu and lions; Ngarus Letoyie, for taking me on patrols and for
our great conversations in an unlikely mix of languages; Yesalai Lemachokoti, for his
Samburu lessons; Lpuresi Lenawasae, for always making me laugh; Laikos Letupukwa, for
all the great food and chai; Samson Lerosion, for being such great company at camp; and
Kura, for waking me up every morning trying to destroy my tent.
I am also grateful to my nganashe Mercy and all the people of Sasaab for making me
experience the life of a Samburu manyatta.
I am indebted to all my friends in Silwood Park and my family for all the support during the
write-up.
I would also like to thank Imperial College London for awarding me a bursary to conduct
this research and Ewaso Lions for further financial support.

1
1. Introduction
1.1 Problem statement
Human-wildlife conflict (HWC) is considered one of the main wildlife conservation issues,
threatening the survival of many globally endangered species by causing population
declines, range contractions and even entire species extinctions (Dickman, 2013; Ocholla
et al, 2013). People can experience a wide array of negative consequences from living in
close proximity to wildlife, such as crop-raiding, attacks on humans, competition for wild
prey, disease transmission and livestock depredation, the last of which is the most common
cause of HWC at the global scale (Mateo-Tomàs et al, 2012; Woodroffe et al, 2005). In
turn, humans often respond to these threats with lethal control, threatening species survival
and undermining conservation efforts. In addition, the rapid human population growth
worldwide, together with the resulting habitat loss and fragmentation, has led to an
increase in the frequency and intensity of interactions between humans and wildlife (Inskip
and Zimmermann, 2009).
Large carnivores have experienced dramatic reductions in range (for example, wild dogs
only occupy 7% of their historical range, while cheetahs occupy only 6%; Dickman et al,
2011) and severe global population declines (Weber and Rabinowitz, 1996). The African
lion (Panthera leo leo) population, in particular, has declined by 30-50% in the past 20
years (Bauer and Van Der Merwe, 2004; Bauer et al, 2012) and its range has experienced a
reduction of 83% (Ray et al, 2005). Lion populations are declining throughout most of
Africa, from 500,000 individuals in the 1950s to the most recent estimates of 16,500-
30,000 (IUCN, 2006; McDonald and Sillero-Zubiri, 2002; Bauer and Van Der Merwe,
2004). For this reason they are listed as Vulnerable on the IUCN Red List of Endangered
Species (Bauer et al, 2012). HWC is the major driver of this decline (Woodroffe and
Ginsberg, 1998), followed by habitat loss and inter-specific competition over resources
(Ray et al, 2005). Livestock depredation, in particular, is the primary cause of conflict and
leads to retaliatory killings of lions and other large carnivores by local pastoralists. Such
killings are single most important reason for the lion populations declines (Ogada et al,
2003; Woodroffe and Ginsberg, 1998). An estimated 100 individual lions are lost every

2
year in Kenya, a substantial loss considering that the country’s total population currently
counts less than 2000 individuals (KWS, 2009).
Lions, like all large carnivores are particularly vulnerable to the threats posed by HWC
because of their slow life histories, low population growth rates and, especially, wide
ranging behaviour, which leads them to range beyond protected area boundaries (Cardillo
et al, 2004; Woodroffe and Ginsberg, 1998), where conflict with humans is more likely
(Ripple et al., 2014). Protected Areas (PAs) are often too small to provide large enough
dispersal areas for large carnivores (Brashares et al, 2001) and, as a consequence, buffer
zones adjacent to PAs risk becoming population sinks, which lead to a high risk of
extinction both outside and inside PAs (Woodroffe and Ginsberg, 1998; Harcourt et al,
2001). In Kenya, only 35% of wildlife is found within formal PAs, which cover 8% of the
country’s total landmass (Giorgiadis, 2011). Given the low coverage of Kenya’s wildlife
ranges, PAs alone are not sufficient to maintain viable populations and thus conservation
must be focused on land beyond PAs (Ripple et al, 2014). In these buffer areas, however,
habitat loss and fragmentation, along with poaching and competition with domestic stock,
can deplete the natural prey base, forcing lions to turn to livestock for food (Sillero-Zubiri
et al, 2006), exacerbating HWC.
In West and Central Africa, lion populations are particularly threatened and several local
extinctions have been documented (Riggio et al, 2013). The Laikipia-Samburu ecosystem
within the Ewaso Nyiro region contains an estimated 330 lions and potentially hosts the
largest and most secure sub-population of the west-central subspecies (Riggio, 2011). The
west-central African lion populations are genetically distinct from the rest of southern and
eastern lion distributions (Bertola, 2011), highlighting the importance of understanding
connectivity between northern Kenyan lion populations and populations in Ethiopia and
beyond. Habitat connectivity is critically important, as male dispersal plays a vital role in
conserving genetic variation (Bjorklund, 2003). Maintaining landscape connectivity is a
challenge, especially in Laikipia, Samburu and Isiolo counties, where less than 25% of the
area is formally protected. The region is made up of a mosaic of different land-use types,
most of which include people and livestock and it is one of the few areas in Africa where
lions exist in reasonable densities in non-protected human-dominated rangelands, including
pastoral lands and commercial ranchland. Although fatal encounters with livestock owners
do occur, these buffer areas around the National Reserves are important dispersal areas for

3
lions (Didier et al, 2011) that may otherwise face genetic erosion and inbreeding if isolated
into small “islands” (Bertola et al, 2011). The continued movement of lions through this
region largely relies on tolerance shown towards lions by people sharing the landscape.
There are variations in attitudes and behaviours towards lions, however, influenced by the
cultural values of the different ethnic groups, and experiences of the individuals
comprising those groups (Romanach et al, 2007). It is vital that conservation efforts focus
on increasing lion survival by facilitating human coexistence with carnivores across the
landscape (Ripple et al, 2014; Dolrenry et al, 2014) and ensuring that important dispersal
areas between PAs are maintained.
Investigating the propensity to kill lions across parts of the Laikipia-Samburu-Isiolo
landscape is key to identifying which potential connectivity routes have the best chance of
persistence, and where conservation efforts should thus be focused. Nonetheless, there
have only been a few studies which have looked at the individual variables that underlie
retaliation against carnivores in response to depredation (Hazzah et al, 2009), and even
fewer studies that analyse these variables at the landscape scale (Hazzah et al, 2013).
4
1.2 Study Aims
To identify landscape-level variations in the causes and intensity of human-lion
conflict and human propensity to kill lions within the areas connecting known
populations in Samburu, Isiolo and Laikipia counties.
To produce maps showing perceived conflict hotspots and combine them with data
on propensity to kill lions, with the purpose of guiding lion conservation at the
landscape scale.
1.3 Study Objectives and Hypotheses
Table 1.1:Research objectives and hypotheses
Research Objectives Hypotheses
1.To understand how propensity to kill
lions varies according to survey location
and to identify hotspots of higher
propensity to kill lions.
Location will have a significant influence
on propensity to kill lions and there will be
clusters of higher propensity to kill lions
within the study area.
2.To determine how differences in cultural
values influence propensity to kill lions in
the study area.
There will be a significant difference in the
propensity to kill lions between Samburu
and Turkana tribes.
3.To determine how socio-economic
factors influence propensity to kill lions in
the study area.
People who have more years of formal
education, who do not have any religious
affiliations, who own more livestock and
who have additional sources of income
other than livestock, will exhibit a lower
propensity to kill lions.
4.To determine how differences in
individual experiences with livestock
depredation by large carnivores influence
propensity to kill lions.
People who experience more conflict with
large carnivores will exhibit a higher
propensity to kill lions.
5. To determine how attitudes, subjective
norms and perceived behavioural controls
influence propensity to kill lions.
Attitudes, subjective norms and perceived
behavioural controls predict propensity to
kill lions in the study area.
6.To investigate local people’s perceptions of human-lion conflict hotspots within the
landscape and identify, combining qualitative and quantitative approaches, the dispersal
corridors where lions are most likely to be persecuted.
5
2. Background
2.1 Study area
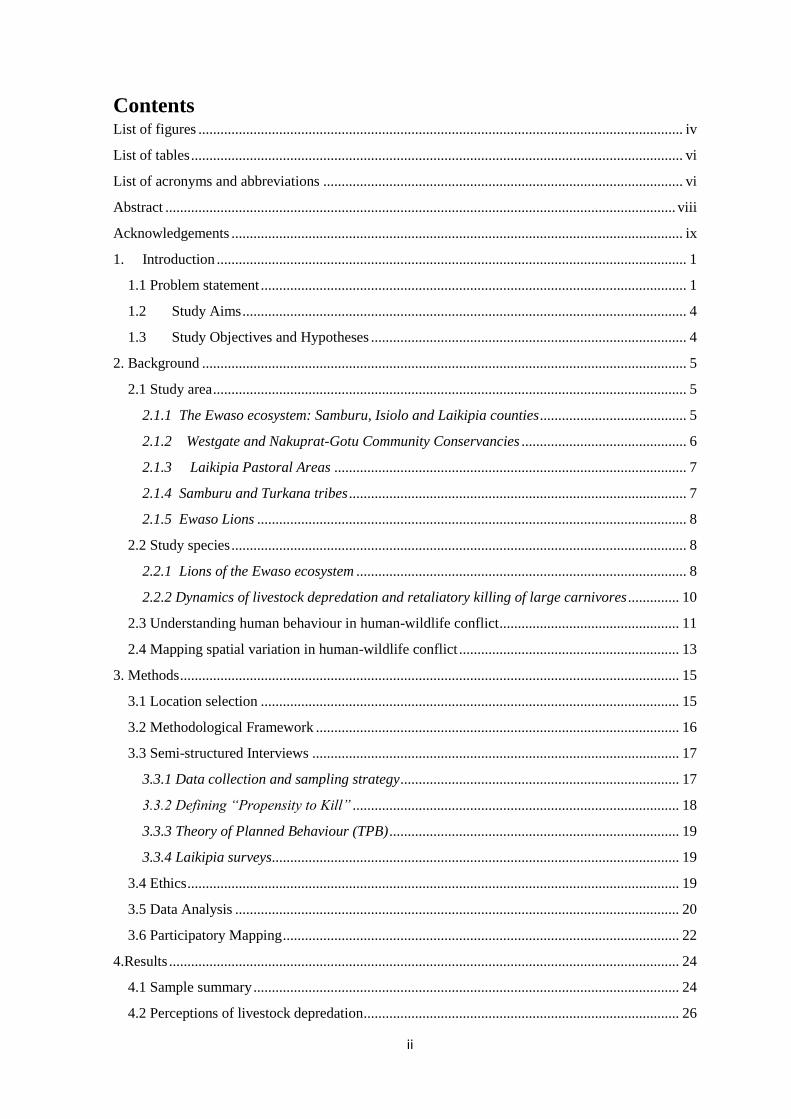
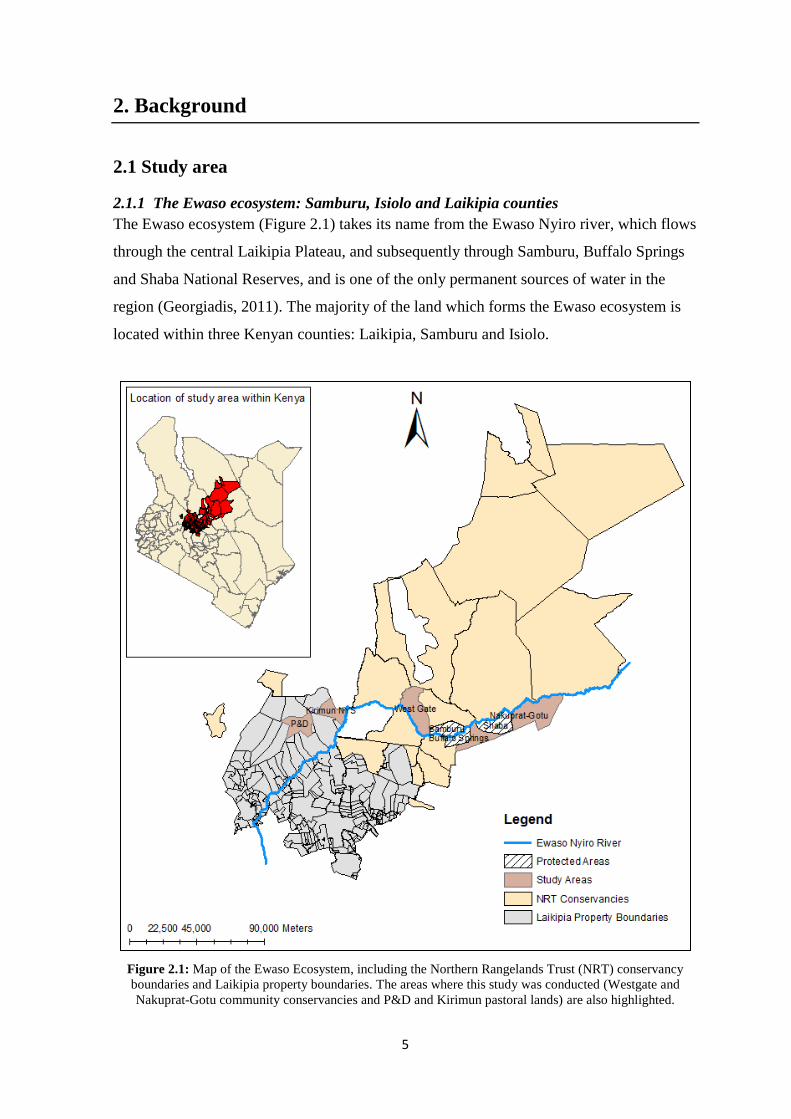
2.1.1 The Ewaso ecosystem: Samburu, Isiolo and Laikipia counties
The Ewaso ecosystem (Figure 2.1) takes its name from the Ewaso Nyiro river, which flows
through the central Laikipia Plateau, and subsequently through Samburu, Buffalo Springs
and Shaba National Reserves, and is one of the only permanent sources of water in the
region (Georgiadis, 2011). The majority of the land which forms the Ewaso ecosystem is
located within three Kenyan counties: Laikipia, Samburu and Isiolo.
Figure 2.1: Map of the Ewaso Ecosystem, including the Northern Rangelands Trust (NRT) conservancy
boundaries and Laikipia property boundaries. The areas where this study was conducted (Westgate and
Nakuprat-Gotu community conservancies and P&D and Kirimun pastoral lands) are also highlighted.
6
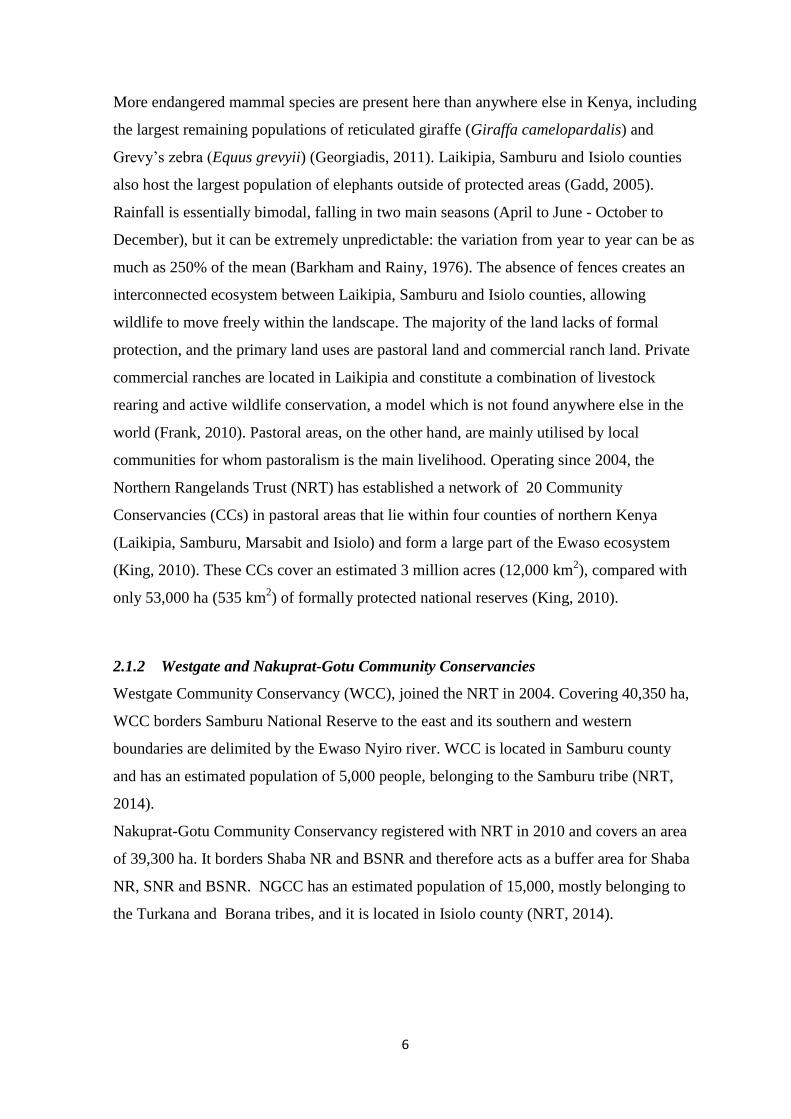
More endangered mammal species are present here than anywhere else in Kenya, including
the largest remaining populations of reticulated giraffe (Giraffa camelopardalis) and
Grevy’s zebra (Equus grevyii) (Georgiadis, 2011). Laikipia, Samburu and Isiolo counties
also host the largest population of elephants outside of protected areas (Gadd, 2005).
Rainfall is essentially bimodal, falling in two main seasons (April to June - October to
December), but it can be extremely unpredictable: the variation from year to year can be as
much as 250% of the mean (Barkham and Rainy, 1976). The absence of fences creates an
interconnected ecosystem between Laikipia, Samburu and Isiolo counties, allowing
wildlife to move freely within the landscape. The majority of the land lacks of formal
protection, and the primary land uses are pastoral land and commercial ranch land. Private
commercial ranches are located in Laikipia and constitute a combination of livestock
rearing and active wildlife conservation, a model which is not found anywhere else in the
world (Frank, 2010). Pastoral areas, on the other hand, are mainly utilised by local
communities for whom pastoralism is the main livelihood. Operating since 2004, the
Northern Rangelands Trust (NRT) has established a network of 20 Community
Conservancies (CCs) in pastoral areas that lie within four counties of northern Kenya
(Laikipia, Samburu, Marsabit and Isiolo) and form a large part of the Ewaso ecosystem
(King, 2010). These CCs cover an estimated 3 million acres (12,000 km2), compared with
only 53,000 ha (535 km2) of formally protected national reserves (King, 2010).
2.1.2 Westgate and Nakuprat-Gotu Community Conservancies
Westgate Community Conservancy (WCC), joined the NRT in 2004. Covering 40,350 ha,
WCC borders Samburu National Reserve to the east and its southern and western
boundaries are delimited by the Ewaso Nyiro river. WCC is located in Samburu county
and has an estimated population of 5,000 people, belonging to the Samburu tribe (NRT,
2014).
Nakuprat-Gotu Community Conservancy registered with NRT in 2010 and covers an area
of 39,300 ha. It borders Shaba NR and BSNR and therefore acts as a buffer area for Shaba
NR, SNR and BSNR. NGCC has an estimated population of 15,000, mostly belonging to
the Turkana and Borana tribes, and it is located in Isiolo county (NRT, 2014).

7
2.1.3 Laikipia Pastoral Areas
Laikipia County covers an area of 9,700 km2 and it borders Samburu and Isiolo counties to
the north. It is characterised by a mosaic of different land uses, including commercial
ranches, agricultural land and traditional pastoral areas. Commercial cattle ranches occupy
~42% of the land, where wildlife conservation is a primary land use (Laikipia Predator
Project, 2014). Smallholder plots cover 37% of the land, but some of them have been
abandoned and are in use by pastoralists. The remaining proportion of the land is under
traditional livestock pastoralism (Graham, 2007). The county is mainly inhabited by
Laikipiak Maasai, Samburu, Pokot and Turkana tribes as well as white settlers (Gadd,
2005). Despite the lack of formally protected areas in the region, Laikipia hosts the second
highest densities of wildlife in Kenya after the Masaai Mara, making it a popular tourism
destination (Georgiadis et al, 2007).
2.1.4 Samburu and Turkana tribes
Samburu and Turkana are the two main ethnic groups in the study area, and are the focus
of this study. The Samburu are a Nilotic Maa speaking society who inhabit Kenya's
northern plains (Ocholla et al, 2013).
They are traditional semi-nomadic
pastoralists who keep mixed herds of
cattle, shoats (sheep and goats),
donkeys and camels. Samburu’s
semi-permanent settlements,
“manyattas”, have a common
structure which involves a control
thornbush corral or “boma”
traditionally made of acacia, which
contains houses and inner bomas where livestock is kept overnight (Figure 2.2). Samburu
society has a patriarchal age structure: all males undergo circumcision after which they
become warriors (“moran”) a status that lasts for a period of approximately 15 years until
marriage, when they first become junior elders before becoming elders (“wazee”)
(Spencer, 2004).
Figure 2.2: Aerial view of a traditional Samburu
“manyatta”. Source: http://www.chicamod.com/samburu-
tribe

8
The Turkana are also a semi-nomadic pastoralist Nilotic tribe. Their society is not as
rigidly structured as the Samburu, but there are some similarities in the two cultures, such
as the heavy reliance on livestock (McGabe, 1990). There are differences between Turkana
and Samburu settlements, for example the absence of the external boma around Turkana
villages: livestock is kept in a brush wood pen built close to the houses (J Lekilelei, pers.
comm., 2014).
For both Turkana and Samburu, livestock is the main source of livelihood as it provides
milk, meat and blood, and it is also used as a form of currency (Konaka, 1997). Livestock
is a measure of wealth and status in pastoral societies and it has economic worth as well as
a strong cultural significance, encompassing social, political and religious values (Dickman
et al, 2011). In this context, even small losses of livestock to predators can be devastating
to herders (Dickman et al, 2011; Sillero-Zubiri et al, 2006).
2.1.5 Ewaso Lions
Ewaso Lions (EL) is a Kenya-based NGO founded in 2007 that aims to conserve lions and
other large carnivores by promoting coexistence between people and wildlife. EL is based
in WCC and their study area includes SNR, BSNR and Shaba NR, as well as other
neighbouring Community Conservancies. In addition to monitoring the lion population in
the region, EL runs various conservation programs with the local communities with the
purpose of ensuring the long-term conservation of lions in community areas.
2.2 Study species
2.2.1 Lions of the Ewaso ecosystem
The Ewaso ecosystem contains approximately 450 lions (Panthera leo leo) (Didier et al,
2011). The highest abundances are found on Laikipia’s commercial ranches and Samburu,
Buffalo Springs and Shaba National Reserves (Table 2.1) (Didier et al, 2011). Given the
strong influence of seasonality in the Ewaso Nyiro ecosystem, prey densities are variable
and this in turn influences the stability of lion territories and the group sizes they support
(Ogutu and Dublin, 2002). Lions tend to disperse outside PAs during the wet season, when

9
wild prey is more widely distributed. It is in these conditions that conflict is more intense
and the risk of retaliatory killing is highest (Frank, 2010).
Table 2.1: Estimated number of lions in the Ewaso ecosystem
Area Estimated number of lions Reference
Laikipia 200-250 Frank, 2011
Samburu NR, Buffalo
Springs NR, Shaba NR
40 S Bhalla, pers. comm.,
2014
Lions have to move within a complex mosaic of land uses to disperse between PAs and
other wildlife-friendly areas such as Laikipia’s commercial ranch lands, passing through
traditional pastoralist lands where they are more likely to be persecuted (Figure 2.3).
Figure 2.3: Map showing predicted lion movement corridors within the Ewaso ecosystem. Source: Ewaso
Lions.
For example, NGCC constitutes a corridor for lions, as it is the main passageway between
Shaba NR and the SNR and BSNR complex. In addition, dispersing lions will move across

10
a network of conservancies, including WCC, which separate SNR and BSNR from
Laikipia.
2.2.2 Dynamics of livestock depredation and retaliatory killing of large carnivores
Even if large carnivores play a regulatory and structuring role in the ecosystem, as well as
delivering economic services (for example through tourism) (Ripple et al, 2014; Ogada et
al, 2003), local people only perceive them as a nuisance when they predate on livestock
(Hazzah et al, 2009). Predators kill livestock mostly at night, when they enter livestock
enclosures (“bomas”), but conflict can also occur during the day, when predators attack
grazing herds (Kissui, 2008). Depredation by large carnivores is not usually the main cause
of livestock loss (Kissui, 2008), but when it occurs in addition to other severe threats such
as lack of food and water, injuries, or raiding by other tribes, it can be the cause of
significant resentment in local people (Dickman et al, 2013).
Lions are particularly vulnerable to direct persecution by people as they are more easily
tracked and killed than are other predators (Hazzah et al, 2009). A common traditional
means of killing lions is spearing, although in recent years poison has become more readily
available, making killing lions and other carnivores easier and such illegal behaviour more
difficult to detect. Because lions return to the carcass of their prey over several days, they
are an easy target and a poisoned carcass can lead to the death of entire prides. Poison use
was found to be widespread in Laikipia, where 52 lions were poisoned in 2003 alone
(Frank, 2010). Lion killing is also embedded in Samburu culture as a rite of passage for
young men and it is a symbol of strength and prestige in the community (Richardson,
2014). Nowadays, this practice is no longer widespread, and most episodes of lions being
killed appear to occur in response to livestock depredation (Goldman et al, 2013).

11
2.3 Understanding human behaviour in human-wildlife conflict
Understanding the drivers of human behaviour is essential to alleviate the negative
consequences of HWC, such as retaliatory killing of carnivores (Kansky et al, 2014). There
has been a recent shift in the conservation literature away from understanding human
behaviour and decision making using economic theory to employing frameworks
developed in socio-psychology (St. John et al, 2010). Behaviour is in fact the result of
multiple interacting internal social and psychological factors, including attitudes, tolerance,
beliefs, individual experiences, social norms and barriers to specific behaviours (Jochum et
al, 2014).
Tolerance (the ability to accept damage from wildlife) can influence behaviours, as low
tolerances can provoke reactions with negative implications for conservation (Kansky et al,
2014). For this reason, researchers have tried to quantify tolerance towards livestock
depredation by carnivores and understand the factors that lead to differences in tolerance in
order to design appropriate mitigation strategies (Romanach et al, 2007; Treves and
Bruskotter, 2014).
Many studies have also used attitudes towards a behaviour of interest in order to predict
the likeliness of someone performing that specific behaviour. However, even if attitudes
have been shown to be a good predictor of behaviour in some contexts (St. John et al,
2012), the relationship between attitudes and behaviour is often not as straightforward. For
example, Liu et al (2011) found that Tibetan people with the most negative attitudes were
less likely to kill bears due to their religious beliefs, and hence attitudes did not translate
directly into actions. Social-psychological models have attempted to fill this existing gap
between attitudes and behaviours by integrating other predictors of behaviour rather than
focusing solely on attitudes. Between the existing social psychological models used to
explain behaviours, the Theory of Reasoned Action (TRA; Fishbein and Ajzen, 1975), and
its extension the Theory of Planned Behaviour (TPB; Ajzen, 1991) (Figure 2.4) are the
most frequently used in conservation (Mastrangelo et al, 2014). According to the TPB,
behavioural intention is the most proximate measure of actual behaviour, and behavioural
intention is in turn influenced by three determinants: attitudes towards the behaviour,
subjective norms and perceived behavioural controls (Hardeman, 2002; Francis et al,
2004). Attitudes are defined as a person’s tendency to value the behaviour favourably or
unfavourably; subjective norm is a person’s estimate of the social pressure to perform or

12
not perform the target behaviour; and perceived behavioural control is defined as the extent
to which a behaviour is perceived to be under volitional control (McCleery, 2005;
Mastrangelo et al, 2014).
Figure 2.4: The Theory of Planned Behaviour (TPB).
When included in social surveys, TPB constructs are typically measured through a series of
Likert-type statements, both directly and indirectly. Indirect measures use salient beliefs to
explain attitude, subjective norms and perceived behavioural controls, while direct
measurements use statements to measure attitudes (e.g. “Killing lions in the next year
would be a good thing to do”), subjective norms (e.g. “Most people who are important to
me would approve of me killing lions in the next year”) and perceived behavioural controls
(e.g. “It would be easy for me to kill a lion in the next year if I wanted to”) directly. The
TPB has proven to be effective at predicting behaviours and behavioural intentions,
especially for highly specific behaviours (McCleery, 2009) and it can be useful to
understand the propensity of people to practice a behaviour of interest (Mastrangelo et al,
2014).

13
2.4 Mapping spatial variation in human-wildlife conflict
The spatial heterogeneity of HWC prevents the adoption of targeted solutions at the
appropriate scale, unless the spatial patterns of conflict are properly understood. To
overcome this problem, various studies have attempted to identify the spatial variability in
HWC by taking different approaches. For example, Karanth et al (2012) used households’
self-reported crop and livestock loss to wildlife to map perceived conflict distribution
around a National Park in India. Sitati et al (2002), predicted hotspots of human-elephant
conflict by mapping recorded conflict incidents in Tanzania.
Livestock depredation events, in particular, are seldom homogeneous throughout the
landscape and some areas are more likely to experience higher levels of conflict than
others. Due to the strong influence of seasonality on the movements of wildlife, people and
livestock, there are complex spatio-temporal variations in human-lion conflict and in turn,
on people’s perceptions of it. Understanding people’s perceptions of conflict is critical to
managing it, as affected communities tend to value perceptions and anecdotes more than
scientific measures of conflict, and perceptions often have a strong influence on people’s
behaviour (Sillero-Zubiri et al, 2006; Treves et al, 2006; Dickman, 2010).
Participatory mapping (PM), or the creation of maps by local communities, is a method
used in Participatory Rural Appraisal (PRA) that provides a visual representation of how a
community values, understands and interacts with its traditional lands and immediate space
(NOAA, 2009; IFAD, 2009). PM can be used to create maps that represent resource use, as
well as community values and perceptions and it is a great way to gather traditional
knowledge in order to supplement other data collection such as formal surveys and
interviews (NOAA, 2009). Specifically, PM can be particularly useful in the initial phase
of research in order to gather people’s perceptions and traditional knowledge that can
contribute to deeper scientific understanding (NOAA, 2009). Perceptions and scientific
measures can therefore be seen as complementary, both helping to serve different purposes
and different audiences (Treves et al, 2006).
PRA and PM have been particularly important in conservation and development processes
(King, 2002). However, it has rarely been used in a HWC context, where it can capture
important information on the spatial nature of conflict which is not obtained in interviews
(NOAA, 2009). One of the main advantages of PM is that it can be used in illiterate

14
communities: local people generally have a good spatial understanding and knowledge of
the landscape in which they live and move that they can use to produce detailed maps of
the area, which in turn can be used to understand their perceptions of HWC.
15
3. Methods
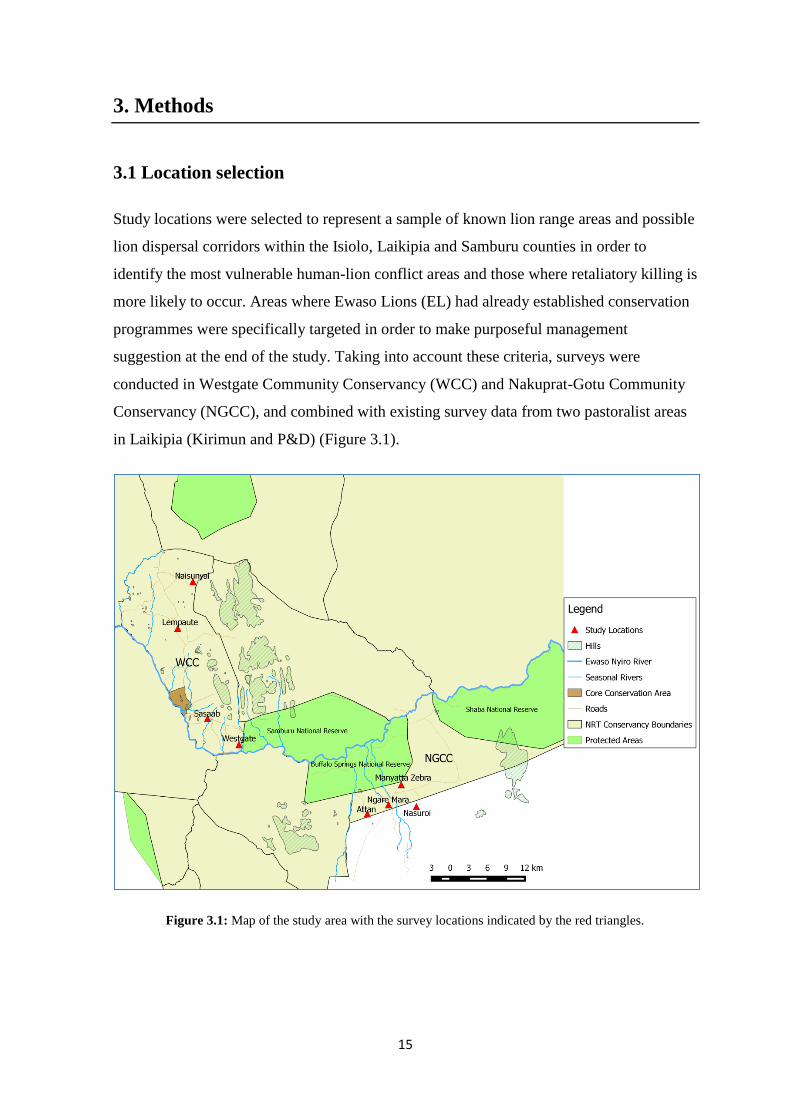
3.1 Location selection
Study locations were selected to represent a sample of known lion range areas and possible
lion dispersal corridors within the Isiolo, Laikipia and Samburu counties in order to
identify the most vulnerable human-lion conflict areas and those where retaliatory killing is
more likely to occur. Areas where Ewaso Lions (EL) had already established conservation
programmes were specifically targeted in order to make purposeful management
suggestion at the end of the study. Taking into account these criteria, surveys were
conducted in Westgate Community Conservancy (WCC) and Nakuprat-Gotu Community
Conservancy (NGCC), and combined with existing survey data from two pastoralist areas
in Laikipia (Kirimun and P&D) (Figure 3.1).
Figure 3.1: Map of the study area with the survey locations indicated by the red triangles.

16
NGCC is an important lion corridor connecting populations in Shaba NR to those in other
PAs such as SNR and BSNR. WCC is also a corridor allowing lion dispersal from Laikipia
Commercial ranches to other conservancies before ultimately reaching SNR.
Within each conservancy, sites were chosen based on suggestions from EL so that they
would give spatially representative results on the risks posed by humans to lions. Four sites
(Westgate, Sasaab, Lempaute and Naisunyai) were selected in WCC and four sites (Attan,
Ngare Mara, Manyatta Zebra and Nasuroi) were selected in NGCC.
3.2 Methodological Framework
Both quantitative and qualitative methodologies were combined in this study. Semi-
structured interviews were carried out using questionnaires with the purpose of analysing
the variations in propensity to kill lions in different locations within the study area, as well
as the factors that influence propensity to kill lions (Objectives 1, 2, 3, 4, 5). A
participatory mapping (PM) exercise was conducted at all eight study sites in order to
understand how local people move within the landscape and where they perceive the major
conflict hotspots to be (Objective 6).
Two research assistants (RAs) conducted both participatory mapping exercises and
questionnaire surveys. Ngila Ltenesi (NL) worked in WCC and Thomas Ekiru (TE)
worked in NGCC. RAs were both local to the conservancies and worked within their
cultural context. RAs spoke the local language of their respective areas: NL conducted the
surveys within Samburu communities in WCC and translated the questionnaires from
English to Samburu. TE, on the other hand, worked in NGCC with Turkana communities,
and translated the questionnaires from English to Turkana. Non-Samburu presence (and
non-Turkana in the case of NGCC) was limited during the surveys in order to avoid
introducing bias (Browne-Nunez and Jonker, 2008). RAs were trained in both PM and SSI
prior to the start of the data collection process.

17
3.3 Semi-structured Interviews
3.3.1 Data collection and sampling strategy
A four-page semi-structured, individual-level questionnaire was designed and adapted
from an existing questionnaire which was used to collect data on propensity to kill lions in
Laikipia in 2012 (Appendix 1). The questionnaire was used to evaluate the propensity to
kill lions within the study locations, and how this varies with different respondents’
characteristics. The questionnaire was composed of four main sections (Table 3.1).
Table 3.1: Structure and content of the semi-structured questionnaire
Section Description of content
I) Respondents’ background
information
Age group, Education, Religious
affiliation, Sources of income, Livestock
assets, Number of family members.
II) Unmatched Count Technique
(UCT)
Three UCT questions (including one
training question) to calculate the
proportion of the surveyed population
practicing the sensitive behaviour.
III) Conflict questions General questions about conflict with
predators and specific questions about
lions to quantify propensity to kill.
IV) Theory of Planned Behaviour
(TPB)
Statements on attitudes, social norms,
perceived behavioural controls and
behavioural intention to kill lions.
Section II (UCT) was later excluded from this study. A hand-held GPS was used to record
the location of interviews so they could subsequently be represented on maps. Since men
are the ones actually carrying out the killing of lions, a stratified sampling strategy was
adopted and only warriors and elders were interviewed (Hazzah et al, 2009). Due to the
fluid nature of Samburu and Turkana settlements, robust random sampling techniques
could not be applied and opportunistic sampling was required. Nevertheless, precautions
were taken so that interviewees belonged to different households and did not share the
same livestock assets, in order to avoid replication and achieve a representative sample.
Questionnaires were administered to 25 warriors and 25 elders/junior elders (n=50) at each
of the eight study sites, resulting in a sample size of n= 400.

18
The questionnaire was piloted over a 7-day period (n = 20; 10 warriors and 10 elders) at
one site in WCC and one in NGCC. The pilot was used to identify issues with the duration
of interviews, the understanding of questions by respondents and the formulation of
questions. The wording of some questions was modified after receiving feedback from the
pilot study in order to make them more compatible with the local language and culture
(Gadd, 2005). Nevertheless, as no major changes were necessary, the pilot was
subsequently included in the analysis. Data collection was carried out from the 8th
May
2014 to the 23rd
June 2014.
3.3.2 Defining “Propensity to Kill”
Propensity to kill lions, or in other words the likelihood of people killing lions, was
investigated at eight different locations using the semi-structured questionnaires. For the
purpose of this study, a measure of “propensity to kill” was constructed using questions
falling into four different categories illustrated in Table 3.2.
Table 3.2: Description of the four measures of propensity to kill used in this study.
Measures of propensity to kill Definition
Tolerance towards livestock depredation by
lions
Number of cattle, shoats, donkeys and camels
respondents were willing to lose before attempting
to kill the lion responsible or before they would
consider it acceptable for someone to kill the lion.
Intention to kill lions Score for behavioural intention to kill lions within
the TPB.
Normal response to livestock depredation by
lions
The behaviours respondent would normally carry
out in the event of livestock depredation, including
killing the lion and poisoning the lion.
Killing scale Beliefs and potential behaviours according to
different hypothetical situations concerning lions.
To quantify tolerance towards lions, the amount of livestock that respondents were willing
to lose to a lion before they would kill it or before they would consider it acceptable for
someone to kill it was used as an index (Romanach et al, 2007). The TPB was used to
quantify behavioural intention to kill lions, which is the most proximate predictor of actual
behaviour. Respondents’ normal response to livestock depredation was investigated with a
list of behaviours including killing and poisoning the lion, to which interviewees were
asked to state if they always, sometimes or never practiced each behaviour. A 5-point
19
Likert scale composed of eight items was used to investigate beliefs and potential
behaviours in hypothetical situations concerning lions (“killing scale”).
3.3.3 Theory of Planned Behaviour (TPB)
The final section of the questionnaire consisted of questions designed to measure
constructs in the TPB. Question design was based on guidelines from Francis et al (2004)
and St. John et al (2010). Using a 5-point Likert scale (-2 = Strongly Disagree to +2=
Strongly Agree), respondents were required to indicate their level of agreement with 23
statements, representing both direct and indirect measures of attitudes, social norms,
perceived behavioural control and behavioural intention. The order of statements was
randomised within the TPB framework as suggested by Francis et al, 2004.
3.3.4 Laikipia surveys
Data from two pastoral communities in Laikipia (Kirimun and P&D) were obtained from a
survey conducted in 2012 by Dr. Alayne Cotterill. The semi-structured questionnaire
which was used in Laikipia was shorter than the one which was designed for this study,
although some sections were kept identical for comparative purposes (Appendix 2). For
instance, only two of the four indicators of propensity to kill which were measured in this
study were present in the Laikipia questionnaire: response to livestock depredation and the
“killing scale”. Comparisons between Laikipia communities, WCC and NGCC were
therefore limited to these indicators.
3.4 Ethics
Interviews were strictly anonymous and this was clearly specified at the beginning of the
questionnaire. Participation to the survey was voluntary and people were asked if they
were willing to participate, ensuring Free Prior Informed Consent. Any demographic data
recorded did not include any private and personal information that could link back to
specific individuals. Study objectives were made clear and explicit in the introduction to
the survey to prevent inflated expectations. Sensitive questions, such as the ones relating to
the illegal killing of lions, were formulated so that respondents would not feel threatened
and would not have to reveal any information that would incriminate them.

20
3.5 Data Analysis
Data analysis was conducted using R statistics package (version 3.0.1; R Core Team,
2013). Firstly, the four measures of propensity to kill were tested for variations in the
different study locations (Objective 1). Initially, Kruskal-Wallis tests including multiple
comparisons were used to assess the differences in tolerance between the eight study
locations in WCC and NGCC, differences in responses to the “killing scale” statements
between the study locations (including Laikipia), and the differences in behavioural
intention and normal response to livestock depredation at all the study locations.
Next, combined measures of propensity to kill lions were constructed using a Principal
Components Analysis (PCA) to extract a small number of components capable of
representing a high proportion of the variance in the variables measuring propensity to kill
lions. Parallel analysis scree plots were used to identify the number of components which
explained a higher proportion of variance in the data set (Franklin et al, 1995). Once the
number of components to be extracted for analysis was identified, a varimax rotation was
applied to the PCA in order to maximise the contrast between the variables contributing to
each of the new components and to identify the constructs which each component was
measuring. Components’ scores were then extracted from the rotated PCA as measures of
propensity to kill in further analysis, obtaining three Rotated Components, referred to as
RC1, RC2 and RC3. A separate PCA using the same procedure was conducted on data
including Laikipia locations, as only two of the four measures of propensity to kill lions
were investigated there and could not therefore be analysed together with the full dataset.
The scores extracted from the PCAs were used as response variables in linear models in
order to identify the socio-demographic attributes which influence propensity to kill lions
(Objectives 2, 3, 4). Data was simplified before inclusion in the models by reducing the
number of levels within a variable when some levels were not a representative sample. The
predictor variables which were tested to identify their effects on propensity to kill lions are
illustrated in Table 3.3. On both the “full” dataset and the one including Laikipia, linear
models with Area as the only predictor were conducted first to test whether individuals
from different study locations differed in their propensity to kill lions (Objective 1).
Subsequently, linear models including all the remaining predictor variables were fitted to
explore correlates of any differences in propensity to kill lions between locations
21
(Objectives 2, 3,4). In addition, linear regression was also used to test whether propensity
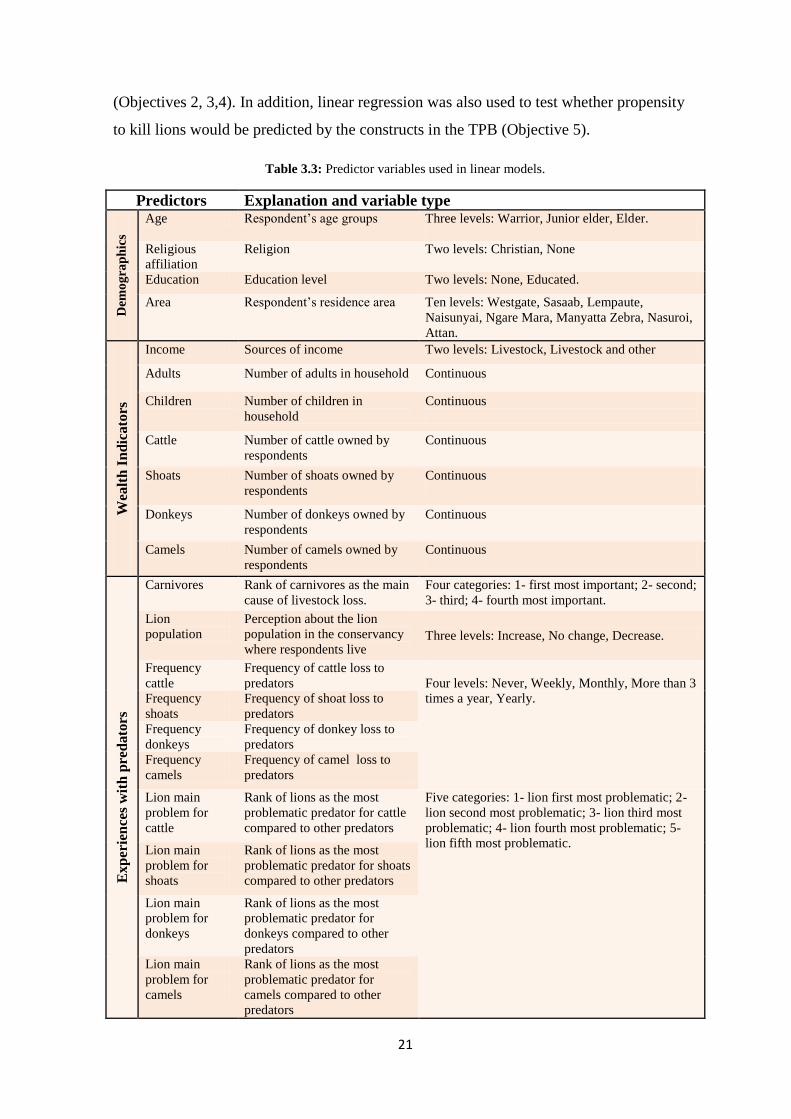
to kill lions would be predicted by the constructs in the TPB (Objective 5).
Table 3.3: Predictor variables used in linear models.
Predictors Explanation and variable type
Dem
og
rap
hic
s
Age Respondent’s age groups Three levels: Warrior, Junior elder, Elder.
Religious
affiliation
Religion Two levels: Christian, None
Education Education level Two levels: None, Educated.
Area Respondent’s residence area Ten levels: Westgate, Sasaab, Lempaute,
Naisunyai, Ngare Mara, Manyatta Zebra, Nasuroi,
Attan.
Wea
lth
In
dic
ato
rs
Income Sources of income Two levels: Livestock, Livestock and other
Adults Number of adults in household Continuous
Children Number of children in
household
Continuous
Cattle Number of cattle owned by
respondents
Continuous
Shoats Number of shoats owned by
respondents
Continuous
Donkeys Number of donkeys owned by
respondents
Continuous
Camels Number of camels owned by
respondents
Continuous
Ex
per
ien
ces
wit
h p
red
ato
rs
Carnivores Rank of carnivores as the main
cause of livestock loss.
Four categories: 1- first most important; 2- second;
3- third; 4- fourth most important.
Lion
population
Perception about the lion
population in the conservancy
where respondents live Three levels: Increase, No change, Decrease.
Frequency
cattle
Frequency of cattle loss to
predators
Four levels: Never, Weekly, Monthly, More than 3
times a year, Yearly.
Frequency
shoats
Frequency of shoat loss to
predators
Frequency
donkeys
Frequency of donkey loss to
predators
Frequency
camels
Frequency of camel loss to
predators
Lion main
problem for
cattle
Rank of lions as the most
problematic predator for cattle
compared to other predators
Five categories: 1- lion first most problematic; 2-
lion second most problematic; 3- lion third most
problematic; 4- lion fourth most problematic; 5-
lion fifth most problematic. Lion main
problem for
shoats
Rank of lions as the most
problematic predator for shoats
compared to other predators
Lion main
problem for
donkeys
Rank of lions as the most
problematic predator for
donkeys compared to other
predators
Lion main
problem for
camels
Rank of lions as the most
problematic predator for
camels compared to other
predators

22
3.6 Participatory Mapping
Samburu and Turkana pastoralists travel long distances in search for pasture and suitable
grazing land and therefore conflict is not limited to the semi-permanent settlements in
which the semi-structured interviews took place, but also to other grazing grounds beyond
the settlements. PM was used in this context to map perceived hotspots of conflict in order
to integrate them with the estimates of propensity to kill derived from the questionnaires.
PM exercises were conducted at each of the eight study sites in WCC and NCC. Cultural
considerations were taken into
account in the design of the PM
approach. For instance, given the
strong gender and age structure of
Samburu communities, each of the
social groups represented in one
community within WCC (women,
warriors and elders) conducted a
separate PM exercise, as subordinate
social groups might not have been
willing to express their views in the
presence of others (Figure 3.2). In
Turkana communities within NCC,
conversely, gender and age
demarcation is not as strong as in
Samburu culture, and therefore
women, warriors and elders could
conduct the exercise in one group.
Thus, the final output was three maps
for each of the four WCC locations
(12 maps in total), and one map for each of the four NCC locations.
Participating individuals were selected opportunistically: at each study location, RAs asked
people they encountered in the manyatta if they were willing to participate, aiming to reach
approximately 10 individuals for each map. PM procedure was standardised at each
location: RAs acted as facilitators, following written instructions (Appendix 3). Maps were
Figure 3.2: Samburu warriors (above) and Samburu women
(below) engaging in PM exercises in WCC. Photo credit:
Ngila Ltenesi.

23
drawn on white paper (size in= 24x32) using pens, markers and coloured stickers.
Participants were asked to locate their manyatta on paper as a starting reference point for
placing the rest of the features. Main landmarks such as natural features (e.g. rivers, hills,
mountains) and man-made features (other manyattas, dams, roads, towns) were also
represented on the maps. Subsequently, arrows representing the movements of people and
livestock to other grazing grounds were traced. Finally, participants were asked to mark on
the maps the areas where they perceived human-lion conflict to be highest (i.e. the areas
where they lose more livestock to lions).
Maps produced through PM were subsequently entered and combined into QGIS 2.0.1. by
the principal investigator. Using the OpenLayersPlugin, a Google satellite image (Kalberer
and Walker, 2010) was used to identify the features on the PMs and import them onto the
digitised maps.

24
4.Results
Results will be presented in the following order. The first section (4.1) describes the
characteristics of the sample population. The following section (4.2) illustrates perceptions
of predators and livestock depredation in the different study locations to provide further
context to understand variations in propensity to kill lions. Section 4.3 compares individual
measures of propensity to kill lions in the different study locations. The methods people in
different locations would use to kill a lion are presented in section 4.4, followed by
people’s perceptions of the number of lions killed and the proportion of people who knew
someone who had killed a lion in the different locations (4.5). Results from the PCA for
the full dataset and for the one including Laikipia are presented in sections 4.6 and 4.7
respectively. Effects of socio-demographic variables on propensity to kill lions are
illustrated in section 4.8, while effects of attitudes, subjective norms and perceived
behavioural controls are presented in section 4.9. Finally, the risk maps showing perceived
human-lion conflict hotspots which were composed using the participatory mapping
exercises are illustrated in section 4.10.
4.1 Sample summary
Interviews conducted in WCC and NGCC had a mean duration of 36 minutes. A total of
400 questionnaires were completed (200 in WCC and 200 in NGCC) (Table 4.1).
Table 4.1: Number of individuals and proportion of population surveyed in each study location
Total adult
population
Number
of
warriors
surveyed
Number of
junior
elders
surveyed
Number
of elders
surveyed
Total
number
surveyed
Proportion
of total
population
surveyed
WC
C Westgate 125 25 3 22 50 40.0
Sasaab 92 26 9 15 50 54.3
Lempaute 304 26 4 20 50 16.4
Naisunyai 359 25 11 14 50 13.9
NG
CC
Ngare Mara Unknown 13 19 18 50 Unknown
Manyatta
Zebra
Unknown 25 8 17 50 Unknown
Nasuroi Unknown 26 4 20 50 Unknown
Attan Unknown 25 5 20 50 Unknown
Laik
ipia
Kirimun
Unknown 19 2 49 70 Unknown
P&D
Unknown 11 19 22 52 Unknown
25
All respondents belonged to the Samburu tribe in WCC and Laikipia, while in NGCC all
respondents belonged to the Turkana tribe. At all WCC and NGCC locations the majority
of respondents did not receive any kind of formal education (81.5%). Most respondents in
both WCC did not have any religious affiliation (86%), while the remaining (14%) were
Christian. In NGCC, 27.5% had no religious affiliation and 72.5% were Christian. In
Laikipia, 53% of respondents did not have any religious affiliation and 47% were
Christian. All respondents (100%) in WCC and NGCC derived income from livestock,
with only 20% of respondents having diversified livelihoods (different combinations of
livestock with tourism, business, charcoal burning and farming; WCC = 27.5%; NGCC =
12%). Despite receiving financial benefits from tourism in WCC, only 13% of
interviewees cited tourism as one of their main sources of income.
The number of cattle respondents owned was significantly different in the study locations
(Kruskal-Wallis; χ2 = 141.43, df = 9, p-value < 0.001), with respondents in Nasuroi having
a significantly higher number of cattle than all the other locations. P&D also had a
significantly higher number of cattle than all other locations apart from Lempaute. The
number of shoats was also significantly different between locations (Kruskal-Wallis; χ2 =
144.35, df = 9, p-value < 0.001): respondents in Westgate, Sasaab, Lempaute, Naisunyai,
Nasuroi and P&D owned more shoats than in other locations. Number of donkeys was
significantly different between locations (Kruskal-Wallis; χ2 = 227.15, df = 9, p-value <
0.001), and there were more donkeys in Westgate and Sasaab than in other locations, while
in Laikipia there were less donkeys. The number of camels owned was also significantly
different between locations (Kruskal-Wallis; χ2 = 61.73, df = 9, p-value < 0.001), and
people in Lempaute, Naisunyai had more camels than in most locations. A full breakdown
of household composition including livestock assets in each location is presented in
Appendix 4. There was no correlation between the number of cattle, shoats, donkeys and
camels owned, for example people who owned more cattle did not necessarily own more
shoats, donkeys or camels.
26
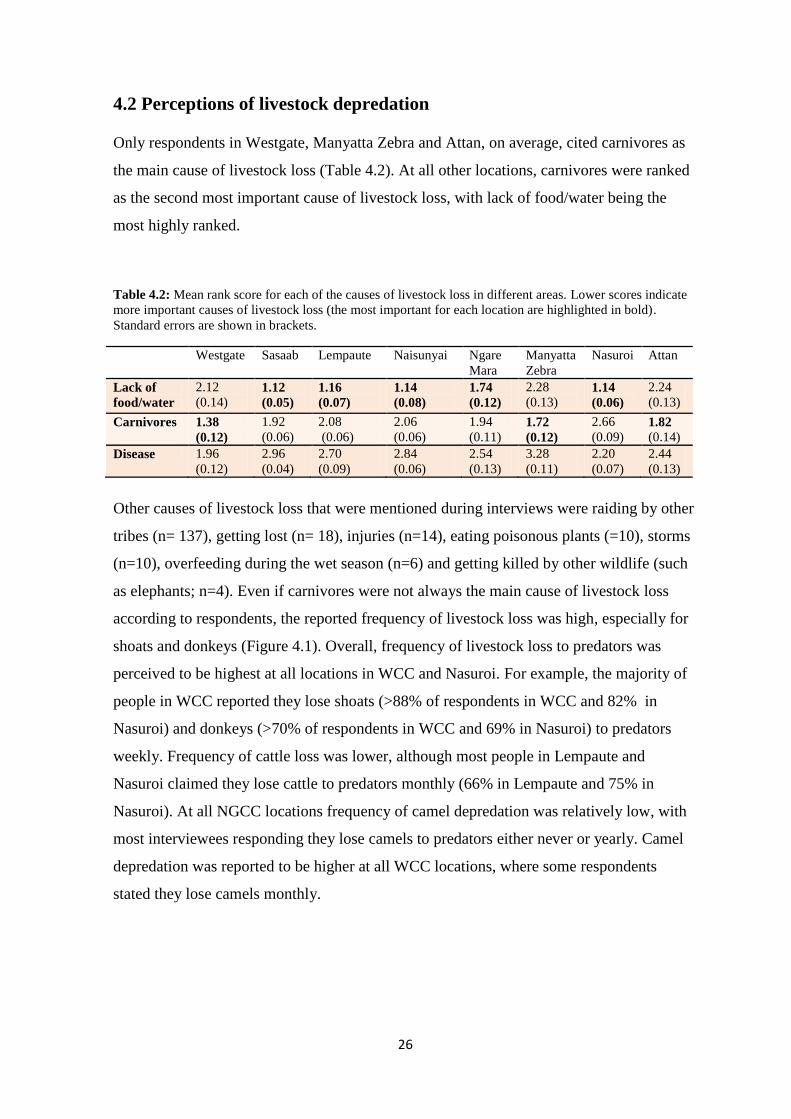
4.2 Perceptions of livestock depredation
Only respondents in Westgate, Manyatta Zebra and Attan, on average, cited carnivores as
the main cause of livestock loss (Table 4.2). At all other locations, carnivores were ranked
as the second most important cause of livestock loss, with lack of food/water being the
most highly ranked.
Table 4.2: Mean rank score for each of the causes of livestock loss in different areas. Lower scores indicate
more important causes of livestock loss (the most important for each location are highlighted in bold).
Standard errors are shown in brackets.
Westgate Sasaab Lempaute Naisunyai Ngare
Mara
Manyatta
Zebra
Nasuroi Attan
Lack of
food/water
2.12
(0.14) 1.12
(0.05)
1.16
(0.07)
1.14
(0.08)
1.74
(0.12)
2.28
(0.13) 1.14
(0.06)
2.24
(0.13)
Carnivores 1.38
(0.12)
1.92
(0.06)
2.08
(0.06)
2.06
(0.06)
1.94
(0.11) 1.72
(0.12)
2.66
(0.09) 1.82
(0.14)
Disease 1.96
(0.12)
2.96
(0.04)
2.70
(0.09)
2.84
(0.06)
2.54
(0.13)
3.28
(0.11)
2.20
(0.07)
2.44
(0.13)
Other causes of livestock loss that were mentioned during interviews were raiding by other
tribes (n= 137), getting lost (n= 18), injuries (n=14), eating poisonous plants (=10), storms
(n=10), overfeeding during the wet season (n=6) and getting killed by other wildlife (such
as elephants; n=4). Even if carnivores were not always the main cause of livestock loss
according to respondents, the reported frequency of livestock loss was high, especially for
shoats and donkeys (Figure 4.1). Overall, frequency of livestock loss to predators was
perceived to be highest at all locations in WCC and Nasuroi. For example, the majority of
people in WCC reported they lose shoats (>88% of respondents in WCC and 82% in
Nasuroi) and donkeys (>70% of respondents in WCC and 69% in Nasuroi) to predators
weekly. Frequency of cattle loss was lower, although most people in Lempaute and
Nasuroi claimed they lose cattle to predators monthly (66% in Lempaute and 75% in
Nasuroi). At all NGCC locations frequency of camel depredation was relatively low, with
most interviewees responding they lose camels to predators either never or yearly. Camel
depredation was reported to be higher at all WCC locations, where some respondents
stated they lose camels monthly.

27
Lions were seldom ranked as the main problem predators in WCC: only respondents in
Westgate thought lions were the main problem predator for cattle and camels (Appendix
5). In the remaining locations hyenas were perceived as causing more conflict. In NGCC,
however, lions were thought to be more problematic, especially in Manyatta Zebra (for
cattle and camels), in Nasuroi (for cattle, shoats and camels) and in Attan (for cattle and
camels). In Laikipia, lions were ranked as the main problem predators only in Kirimun (for
cattle and donkeys).
Figure 4.1: Reported frequency of livestock (cattle, shoats, donkeys and camels) depredation in the
different study locations.

28
4.3 Variations in propensity to kill lions in different study areas
4.3.1 Behavioural Intention by Area
Behavioural intentions to kill lions differed significantly between the different sampling
locations (Kruskal-Wallis χ2 = 71.7474, df = 7, p-value < 0.001).
Figure 4.2: Level of agreements of respondents to the statement “I intend to kill lions in the next year” in the
different study locations. Scores are on a scale from -2 (Strongly disagree) to +2 (Strongly agree).
At all study areas, most respondents either disagreed or strongly disagreed to the statement
“I intend to kill lions in the next year” (Figure 4.2). Although in a small number of
respondents, significantly stronger intentions to kill lions were found in Attan and
Manyatta Zebra. A small number of respondents agreed or strongly agreed. For example,
only two respondents in both Sasaab, Lempaute, Naisunyai and one respondent in both
Ngare Mara and Attan said they intend to kill lions in the next year.
4.3.2 Normal Response to Livestock Depredation by Area
Interviewees’ normal response to livestock depredation by lions was different depending
on location (Figure 4.3). The most popular response at all locations was scaring the lion
and changing husbandry technique, apart from in Kirimun where doing nothing was the
most popular. Leaving the area where the attack occurred was a popular response in all
WCC locations, but less so in other areas, especially Attan, Kirimun and P&D. Most
respondents in Kirimun (97%) and P&D (91%) asserted they never report the attack to
KWS or to the conservancy staff/ranch owners, while in other locations people reported
attacks more often.

29
Figure 4.3: Normal responses to livestock depredation by lions in different study areas
30
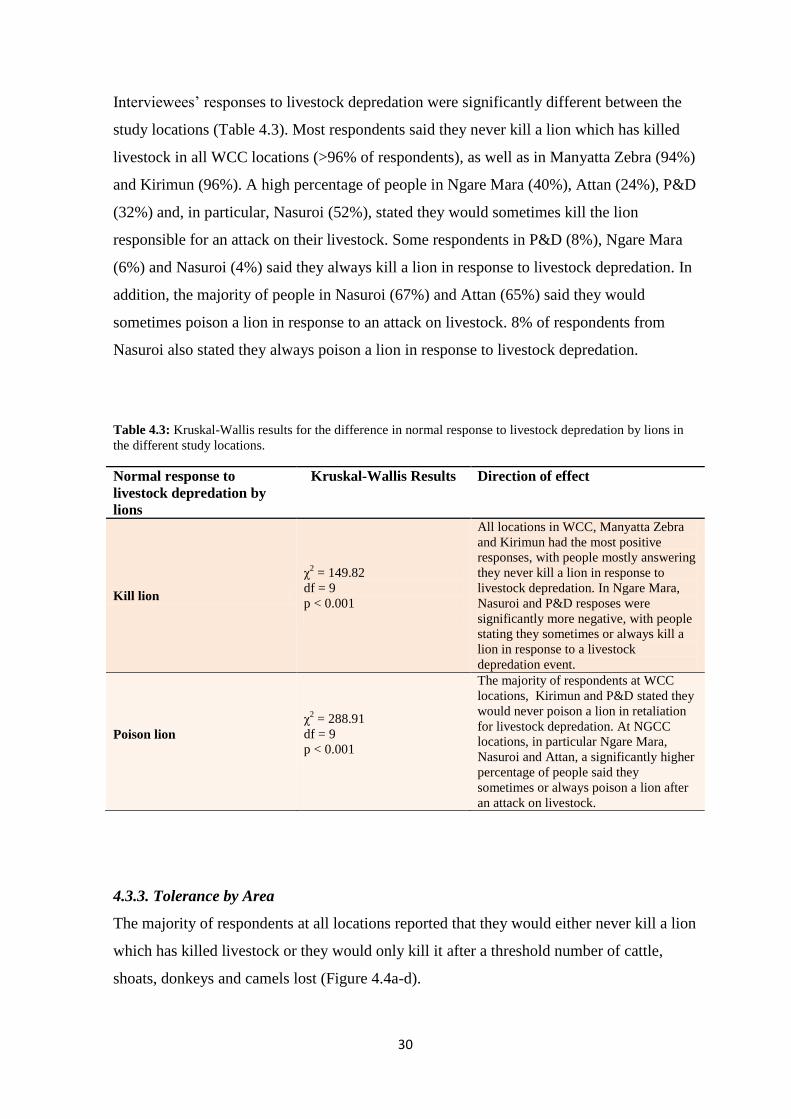
Interviewees’ responses to livestock depredation were significantly different between the
study locations (Table 4.3). Most respondents said they never kill a lion which has killed
livestock in all WCC locations (>96% of respondents), as well as in Manyatta Zebra (94%)
and Kirimun (96%). A high percentage of people in Ngare Mara (40%), Attan (24%), P&D
(32%) and, in particular, Nasuroi (52%), stated they would sometimes kill the lion
responsible for an attack on their livestock. Some respondents in P&D (8%), Ngare Mara
(6%) and Nasuroi (4%) said they always kill a lion in response to livestock depredation. In
addition, the majority of people in Nasuroi (67%) and Attan (65%) said they would
sometimes poison a lion in response to an attack on livestock. 8% of respondents from
Nasuroi also stated they always poison a lion in response to livestock depredation.
Table 4.3: Kruskal-Wallis results for the difference in normal response to livestock depredation by lions in
the different study locations.
Normal response to
livestock depredation by
lions
Kruskal-Wallis Results Direction of effect
Kill lion
χ2 = 149.82
df = 9
p < 0.001
All locations in WCC, Manyatta Zebra
and Kirimun had the most positive
responses, with people mostly answering
they never kill a lion in response to
livestock depredation. In Ngare Mara,
Nasuroi and P&D resposes were
significantly more negative, with people
stating they sometimes or always kill a
lion in response to a livestock
depredation event.
Poison lion
χ2 = 288.91
df = 9
p < 0.001
The majority of respondents at WCC
locations, Kirimun and P&D stated they
would never poison a lion in retaliation
for livestock depredation. At NGCC
locations, in particular Ngare Mara,
Nasuroi and Attan, a significantly higher
percentage of people said they
sometimes or always poison a lion after
an attack on livestock.
4.3.3. Tolerance by Area
The majority of respondents at all locations reported that they would either never kill a lion
which has killed livestock or they would only kill it after a threshold number of cattle,
shoats, donkeys and camels lost (Figure 4.4a-d).

31
Prop
In Naisunyai, a high number of respondents said they had a kill-on-sight policy (“No
tolerance”) for all types of livestock, and especially for camels (29%) and cattle (14%).
Respondents with no tolerance towards cattle (4%), shoats (8%) and camels (4%)
depredation were also present in Ngare Mara. A low proportion of respondents also had no
tolerance towards camel depredation in Westgate (5%) and Lempaute (4%). The number of
cattle, shoats, donkeys and camels respondents were willing to lose to a lion before they
would try to kill it was significantly different in the different study locations (Table 4.4).
Figure 4.4: Proportion of respondents at each location who would never kill a lion which has killed livestock
(Never kill), who would only kill it after a threshold number of livestock killed (After threshold), or who would
kill it regardless of the number of livestock killed (No tolerance). Plot (a) is for cattle, (b) is for shoats, (c) is for
donkeys and (d) is for camels.
(a) (b)
(c) (d)

32
Table 4.4: Kruskal-Wallis results for the differences in tolerance thresholds in the different study locations.
Tolerance thresholds Kruskal-Wallis
Results
Direction of effect
Cattle tolerance threshold
χ2 = 59.42
df = 7
p < 0.001
Lempaute, Naisunyai, Sasaab and
Westgate have the highest
tolerance. Tolerance is lower in
sites in NGCC.
Shoats tolerance threshold
χ2 = 61.88
df = 7
p < 0.001
Sasaab, Lempaute and Westgate
have significantly higher tolerance
than all the other sites. Ngare Mara
has lower tolerance than Sasaab,
Lempaute and Westgate, but not
statistically significant.
Donkeys tolerance threshold χ2 = 50.09
df = 7
p < 0.001
Attan has higher tolerance than the
other sites.
Camels tolerance threshold
χ2 = 33.29
df = 7
p < 0.001
Lempaute and Attan have higher
tolerance than all the other sites.
The mean tolerance threshold (i.e. the number of different types of livestock respondents
would be willing to lose before they retaliate against the lion responsible for the loss) was
highest for shoats at all locations, apart from in Attan and Manyatta Zebra, where people
were more tolerant for donkeys loss (Figure 4.5). The lowest mean tolerances, on the other
hand, were for camels at all locations.
Figure 4.5: Mean number of cattle, shoats, donkeys and camels respondents in different areas are willing to
lose to a lion before they retaliate by killing the lion. Bars represent +/- 2 standard errors.

33
4.3.4. Killing Scale by Area
Responses to the killing scale statements were significantly different between study
locations (Table 4.5; Figure 4.6 a-h).
Table 4.5: Kruskal-Wallis results for each of the eight killing scale statements in different study areas.
Killing Scale Statement Kruskal-Wallis
Results
Direction of effect
a: If a lion kills livestock it should be
killed
χ2 = 267.2
df = 9
p < 0.001
Respondents in Kirimun and P&D
agreed significantly more to this
statement than those in the other
locations, while they agreed
significantly less in Westgate and
Sasaab
b: If a lion threatens humans it should
be killed
χ2 = 148.15
df = 9
p < 0.001
Respondents in Kirimun, P&D,
Lempaute and Naisunyai agreed more
than those in the other locations
c: If a lion is seen in the bush it should
be killed
χ2 = 98.25
df = 9
p < 0.001
Respondents in Naisunyai and NGCC
locations agreed more often than those
in other locations (however, most
respondents disagreed at all locations)
d: If a lion entered my boma I would kill
it
χ2 = 248.3
df = 9
p < 0.001
Respondents in Nasuroi and Kirimun
agreed more than those at the other
locations, while Westgate, Sasaab and
Lempaute agreed less
e: If a family member was injured by a
lion I would kill it
χ2 = 187.35
df = 9
p < 0.001
Respondents in Kirimun, P&D,
Nasuroi, Nasuroi, Ngare Mara,
Naisunyai and Lempaute agreed more
than those in the other locations
f: If my family asked me to go kill a lion
in revenge of our cows I would kill it
χ2 = 281.79
df = 9
p < 0.001
Respondents in Kirimun and P&D
agreed more than those in the other
locations
g: If my neighbour asked me to go kill a
lion in revenge of their cows I would kill
it
χ2 = 243.89
df = 9
p < 0.001
Respondents in Kirimun and P&D
agreed more than those in the other
locations
h: When I see a lion in the bush I would
kill it
χ2 = 144.18
df = 9
p < 0.001
Respondents in Nasuroi and Attan
agreed more often than those in other
locations (however, most respondents
disagreed at all locations)
Overall, respondents in WCC disagreed to most killing scale statements, meaning that they
would not kill a lion or accept the killing in the hypothetical situations described in the
statements. However, more people in these locations were concerned with human security
(statements b and e), and therefore they would kill a lion or accept the killing of a lion if it
threatens a family member or human beings in general. Respondents in Kirimun and P&D
agreed more to most statements, excluding statement c and h, which represent the killing of
a lion regardless of attacks on human or livestock (Figure 4.6, a-h).

34
Figure 4.6: Boxplots showing the pattern of responses scores (from -2 = Strongly disagree to 2=Strongly
agree) to eight killing scale statements (a-h) in the different study areas.
(a) (b)
(c) (d)
(e) (f)
(g) (h)

35
4.4 Methods of killing lions
Respondents claimed they would use different methods to kill lions in the study areas
(Figure 4.7).
Figure 4.7: Choice of methods respondents would use to kill a lion in different areas.
The extent of poison and poisoned arrow use seems to be limited to mainly four locations:
Naisunyai, Ngare Mara, Manyatta Zebra and, in particular, Attan. In all other WCC
locations, spear and machete were the most preferred methods. Shooting the lion was not a
popular choice of method in most locations, apart from in Nasuroi.
4.5 Perceptions of lion killing in the study areas
The majority of respondents at all locations stated they did not know anybody who had
killed a lion in the past 2 years (Figure 4.8a). A moderate proportion of respondents in
Ngare Mara (36%) and Attan (32%) said they knew someone who had killed a lion in the
past two years.
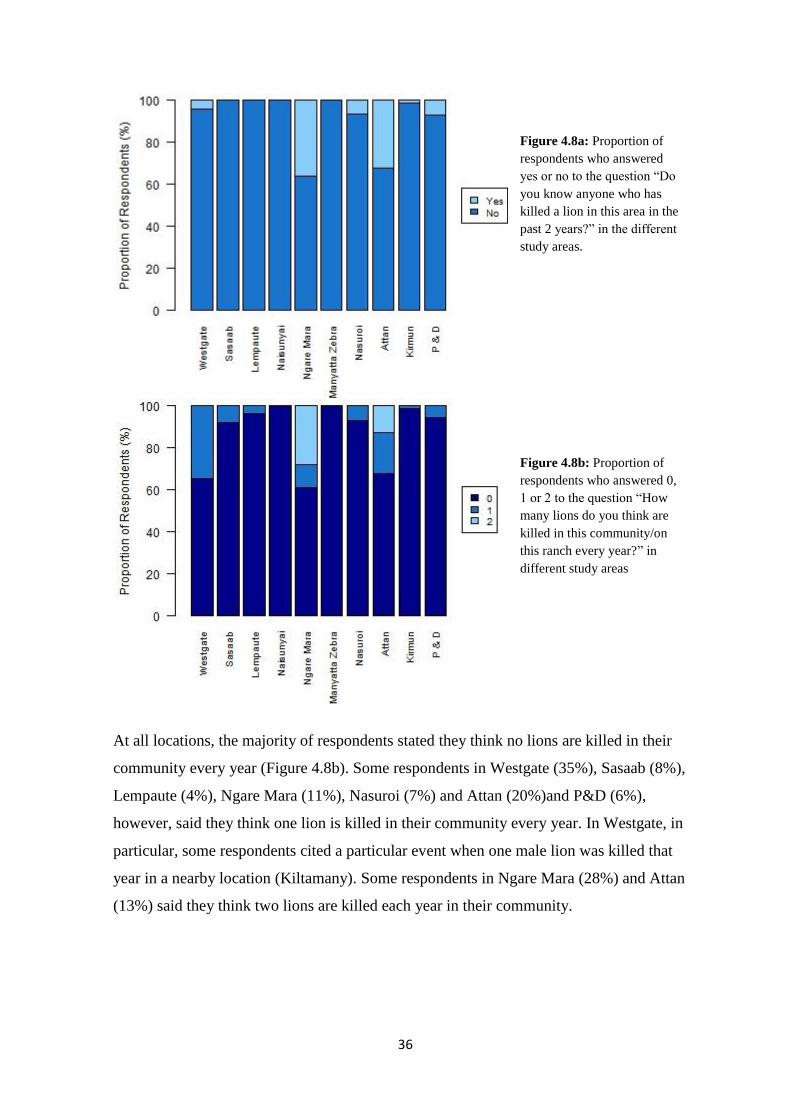
36
At all locations, the majority of respondents stated they think no lions are killed in their
community every year (Figure 4.8b). Some respondents in Westgate (35%), Sasaab (8%),
Lempaute (4%), Ngare Mara (11%), Nasuroi (7%) and Attan (20%)and P&D (6%),
however, said they think one lion is killed in their community every year. In Westgate, in
particular, some respondents cited a particular event when one male lion was killed that
year in a nearby location (Kiltamany). Some respondents in Ngare Mara (28%) and Attan
(13%) said they think two lions are killed each year in their community.
Figure 4.8a: Proportion of
respondents who answered
yes or no to the question “Do
you know anyone who has
killed a lion in this area in the
past 2 years?” in the different
study areas.
Figure 4.8b: Proportion of
respondents who answered 0,
1 or 2 to the question “How
many lions do you think are
killed in this community/on
this ranch every year?” in
different study areas
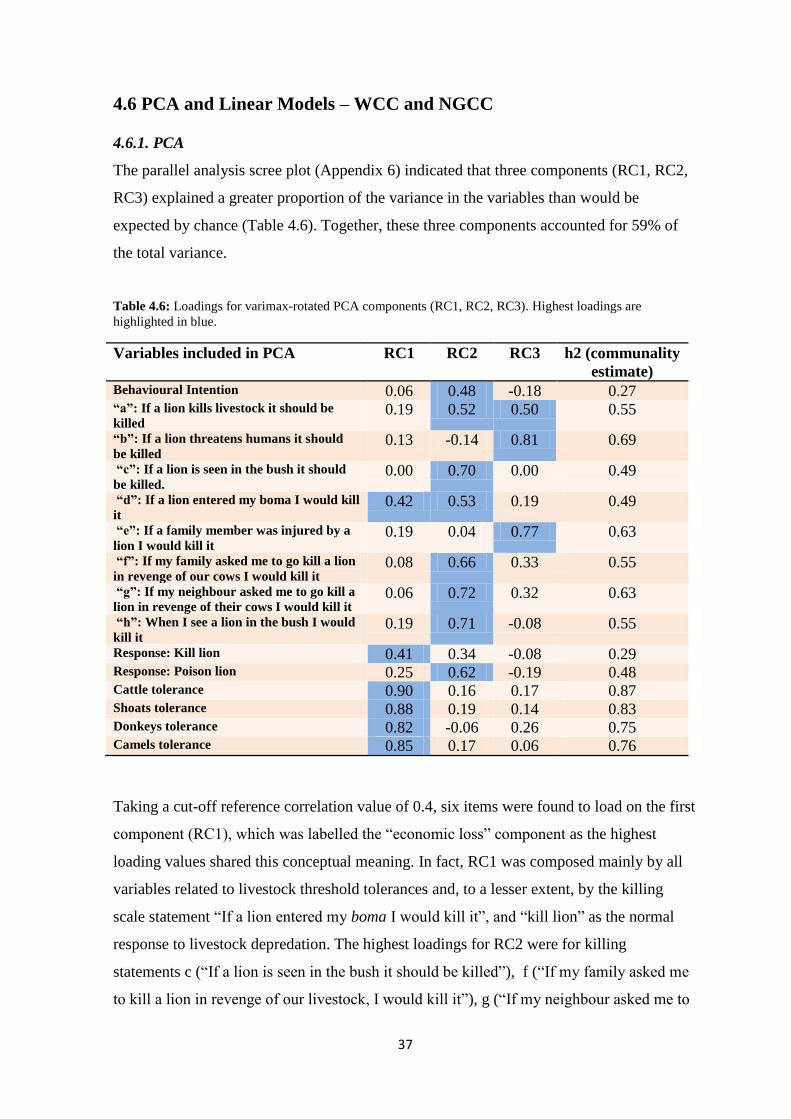
37
4.6 PCA and Linear Models – WCC and NGCC
4.6.1. PCA
The parallel analysis scree plot (Appendix 6) indicated that three components (RC1, RC2,
RC3) explained a greater proportion of the variance in the variables than would be
expected by chance (Table 4.6). Together, these three components accounted for 59% of
the total variance.
Table 4.6: Loadings for varimax-rotated PCA components (RC1, RC2, RC3). Highest loadings are
highlighted in blue.
Variables included in PCA RC1 RC2 RC3 h2 (communality
estimate) Behavioural Intention 0.06 0.48 -0.18 0.27 “a”: If a lion kills livestock it should be
killed 0.19 0.52 0.50 0.55
“b”: If a lion threatens humans it should
be killed 0.13 -0.14 0.81 0.69
“c”: If a lion is seen in the bush it should
be killed. 0.00 0.70 0.00 0.49
“d”: If a lion entered my boma I would kill
it 0.42 0.53 0.19 0.49
“e”: If a family member was injured by a
lion I would kill it 0.19 0.04 0.77 0.63
“f”: If my family asked me to go kill a lion
in revenge of our cows I would kill it 0.08 0.66 0.33 0.55
“g”: If my neighbour asked me to go kill a
lion in revenge of their cows I would kill it 0.06 0.72 0.32 0.63
“h”: When I see a lion in the bush I would
kill it 0.19 0.71 -0.08 0.55
Response: Kill lion 0.41 0.34 -0.08 0.29 Response: Poison lion 0.25 0.62 -0.19 0.48 Cattle tolerance 0.90 0.16 0.17 0.87 Shoats tolerance 0.88 0.19 0.14 0.83 Donkeys tolerance 0.82 -0.06 0.26 0.75 Camels tolerance 0.85 0.17 0.06 0.76
Taking a cut-off reference correlation value of 0.4, six items were found to load on the first
component (RC1), which was labelled the “economic loss” component as the highest
loading values shared this conceptual meaning. In fact, RC1 was composed mainly by all
variables related to livestock threshold tolerances and, to a lesser extent, by the killing
scale statement “If a lion entered my boma I would kill it”, and “kill lion” as the normal
response to livestock depredation. The highest loadings for RC2 were for killing
statements c (“If a lion is seen in the bush it should be killed”), f (“If my family asked me
to kill a lion in revenge of our livestock, I would kill it”), g (“If my neighbour asked me to
38
kill a lion in revenge of their livestock, I would kill it”) and h (“When I see a lion in the
bush I would kill it”), as well as poisoning the lion as the main response to livestock
depredation. RC2 was therefore labelled “social norms and indiscriminate killing”. RC3
was labelled “human security”, as the variables which loaded most highly were killing
scale statements b (“If a lion threatens humans it should be killed”) and e (“If my family
member was injured by a lion I would kill it”).
4.6.2. Linear models with area
Linear models revealed further differences between the eight study areas in propensity to
kill lions. Patterns of propensity to kill were different for the three different models using
RC1 (“Economic loss”), RC2 (“Social norms and indiscriminate killing”) and RC3
(“Human security”) as response variables (model output summaries are presented in
Appendix 7), a consequence of the fact that the three components measure different
constructs. For the component representing propensity to kill in response to economic loss
(RC1), respondents in Ngare Mara and Nasuroi had significantly higher propensity to kill
lions than in the other locations. Naisunyai and Attan also had relatively high propensity to
kill lions.

39
Figure 4.9a: Linear model
coefficients for RC1
(“economic loss”) with
95% confidence intervals
in the different study
locations.
Figure 4.9b: Linear model
coefficients for RC2
(“social norms and
indiscriminate killing”)
with 95% confidence
intervals in the different
study locations.
Figure 4.9c: Linear model
coefficients for RC3
(“human security”) with
95% confidence intervals
in the different study
locations.
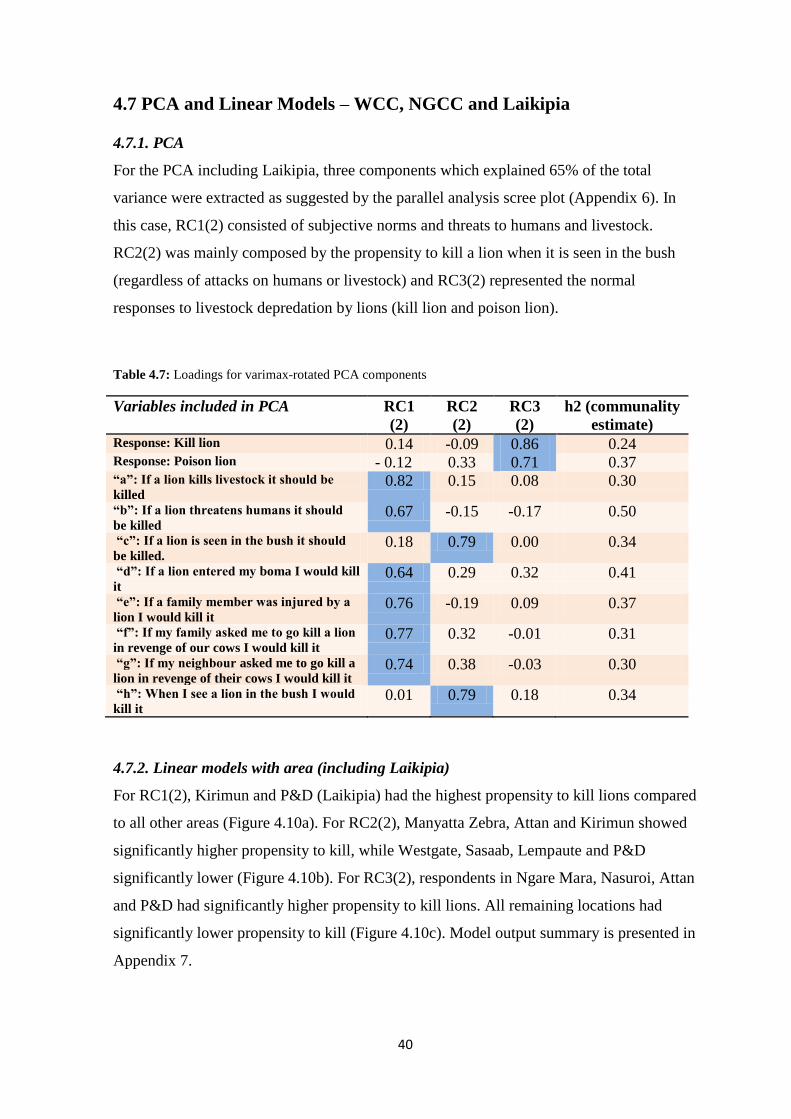
40
4.7 PCA and Linear Models – WCC, NGCC and Laikipia
4.7.1. PCA
For the PCA including Laikipia, three components which explained 65% of the total
variance were extracted as suggested by the parallel analysis scree plot (Appendix 6). In
this case, RC1(2) consisted of subjective norms and threats to humans and livestock.
RC2(2) was mainly composed by the propensity to kill a lion when it is seen in the bush
(regardless of attacks on humans or livestock) and RC3(2) represented the normal
responses to livestock depredation by lions (kill lion and poison lion).
Table 4.7: Loadings for varimax-rotated PCA components
Variables included in PCA RC1
(2)
RC2
(2)
RC3
(2)
h2 (communality
estimate) Response: Kill lion 0.14 -0.09 0.86 0.24 Response: Poison lion - 0.12 0.33 0.71 0.37 “a”: If a lion kills livestock it should be
killed 0.82 0.15 0.08 0.30
“b”: If a lion threatens humans it should
be killed 0.67 -0.15 -0.17 0.50
“c”: If a lion is seen in the bush it should
be killed. 0.18 0.79 0.00 0.34
“d”: If a lion entered my boma I would kill
it 0.64 0.29 0.32 0.41
“e”: If a family member was injured by a
lion I would kill it 0.76 -0.19 0.09 0.37
“f”: If my family asked me to go kill a lion
in revenge of our cows I would kill it 0.77 0.32 -0.01 0.31
“g”: If my neighbour asked me to go kill a
lion in revenge of their cows I would kill it 0.74 0.38 -0.03 0.30
“h”: When I see a lion in the bush I would
kill it 0.01 0.79 0.18 0.34
4.7.2. Linear models with area (including Laikipia)
For RC1(2), Kirimun and P&D (Laikipia) had the highest propensity to kill lions compared
to all other areas (Figure 4.10a). For RC2(2), Manyatta Zebra, Attan and Kirimun showed
significantly higher propensity to kill, while Westgate, Sasaab, Lempaute and P&D
significantly lower (Figure 4.10b). For RC3(2), respondents in Ngare Mara, Nasuroi, Attan
and P&D had significantly higher propensity to kill lions. All remaining locations had
significantly lower propensity to kill (Figure 4.10c). Model output summary is presented in
Appendix 7.

41
Figure 4.10a: Linear
model coefficients for
RC1 (2)(propensity to kill
in response to social norms
and threats to humans and
livestock) in the different
study locations.
Figure 4.10c: Linear
model coefficients for
RC3(2) (propensity to
kill/poison lion) in the
different study locations.
Figure 4.10b: Linear
model coefficients for
RC2 (2)(propensity to kill
a lion regardless of attacks
on livestock) in the
different study locations.

42
4.8 Effects of socio-demographics on propensity to kill lions
Propensity to kill lions in relation to economic loss (RC1) was significantly related to the
number of camels respondents owned: people who owned more camels were significantly
more likely to respond to questions concerning economic loss by saying they would kill a
lion (p < 0.001). The frequency of livestock loss to predators also had an effect on
propensity to kill in response to economic loss: people who lost cattle to predators yearly
(p = 0.048) or never (p = 0.006) had significantly less propensity to kill lions than people
who reported losing cattle more frequently. Similarly, people who lost shoats to predators
more than three times a year had significantly less propensity to kill than people who lost
shoats monthly or weekly (p < 0.001). In addition, people who perceived lions as the main
problem predators for cattle, had higher propensity to kill lions than people who ranked
lions as less problematic (p < 0.001). The proportion of variance explained by the model
was R2= 0.387.
Propensity to kill in relation to social norms and indiscriminate killing (RC2) had a
positive relationship with the number of cattle owned, meaning that people who owned
more cattle were more likely to respond to questions concerning social norms by saying
they would kill a lion (p < 0.001). For example, people who owned more cattle were more
likely to kill a lion in revenge of their cattle if a family member or neighbour asked them to
do it. The number of shoats owned, on the other hand, had a negative relationship with
propensity to kill lions in response to social norms: people who owned less shoats had
higher scores for propensity to kill (p = 0.005). People who ranked lions as main problem
predators for cattle had higher propensity to kill lions in response to social norms
(p<0.001), but people who ranked lions as the main problem predators for shoats (p<0.001)
and donkeys (p=0.002) had less propensity to kill lions. Respondents who thought the lion
population had not changed in the area had higher propensity to kill lions in response to
social norms compared to those who thought the lion population had decreased (p= 0.009).
The proportion of variance explained by the model was R2= 0.4671.
Propensity to kill in relation to human security (RC3) was affected by the age group of
respondents, with junior elders demonstrating more propensity to kill lions than other age
groups (p=0.018). Respondents with a higher number of adults in their household were
more likely to answer to questions related to human security saying they would kill a lion
(p=0.018). People with diversified livelihoods had significantly less propensity to kill lions
43
than people who only derived income from livestock (p=0.029). People who perceived
carnivores as the main cause of livestock loss relative to other causes of loss (p=0.019) and
who lost shoats to predators weekly (p=0.009) also had higher propensity to kill. The
proportion of variance explained by the model was R2: 0.1456.
Education, religion, the number of children in the household, did not appear to have any
effects on propensity to kill lions, and these variables were dropped early during stepwise
model selection process.
The patterns of factors affecting propensity to kill were similar when Laikipia was
included in the analysis. For RC1(2), which comprised measures of propensity to kill lions
related to social norms and threats to humans and livestock, respondents who owned a
higher number of cattle had higher propensity to kill lions (p<0.001). People who cited
lions as main problem predator for cattle were more likely to answer questions concerning
social norms and threats to humans and livestock by saying they would kill a lion than
those who ranked lions lower (p=0.009), while the opposite was true for shoats (p<0.001).
People who stated they lose shoats weekly had more propensity to kill lions than those who
lost them less frequently (p<0.001). People who never lost donkeys were more likely to
answer questions about social norms and threats to humans and livestock by saying they
would kill a lion (p<0.001). The proportion of variance explained by the model was R2:
0.4919.
For RC2(2), which was mainly related to the propensity to kill lions regardless of any
attacks on livestock, people who owned more shoats had less propensity to kill lions
(p=0.008). People who cited lions as the main problem predators for cattle had more
propensity to kill lions (p<0.001), while people who cited them as main problem for
donkeys had less propensity to kill (p<0.001). Respondents who never lost donkeys to
predators, or lost them yearly, had higher propensity to kill lions than people who lost them
more frequently (p<0.001). On the contrary, people who lost camels weekly (p=0.032) or
more than three times a year (p=0.008) had higher propensity to kill than those who lost
them less frequently. The proportion of variance explained by the model was R2: 0.3779.
For RC3(2), which was mainly related to how interviewees normally respond to livestock
depredation by lions (killing/poisoning the lion), people who owned more cattle showed
more propensity to kill/poison a lion (p<0.001), while people who owned more donkeys
had lower propensity to kill/poison a lion (p<0.001). Respondents who ranked lions as the
44
main problem predator for camels showed higher propensity to kill/poison lions (p<0.001),
while those who ranked them as main problem predators for shoats had lower propensity to
kill/poison lions (p<0.05). Finally, people who never lost cattle to predators or lost them
yearly had lower propensity to kill lions than those who lost them more frequently
(p<0.001). The proportion of variance explained by the model was R2: 0.3892. Model
output summaries are presented in Appendix 8.
4.9 Effects of attitudes, subjective norms and perceived controls on
propensity to kill lions
Attitudes, subjective norms and perceived behavioural controls were found to have an
effect on propensity to kill lions and these effects varied depending on the different
constructs measured by each component.
Propensity to kill lions in response to economic loss (RC1) was affected by social norms
and perceived behavioural control. If people thought there was nothing stopping them (for
example laws, equipment, fear or skills) from killing a lion, they were more likely to
answer questions about economic loss by saying they would kill a lion (p<0.001).
Respondents who thought people who are important to them would approve of them killing
a lion had higher propensity to kill lions in response to economic loss (p<0.001).
Conversely, people who thought it was expected of them to kill a lion which has killed
livestock had lower propensity to kill lions (p=0.032). Overall model fit was R2: 0.1767.
Attitudes towards killing lions affected propensity to kill lions in response to social norms
(RC2): respondents who agreed that killing lions in the next year would be useful had
higher propensity to kill lions (p<0.001). Respondents who thought people who are
important to them want them to kill a lion (p=0.038), and would admire them if they killed
a lion (p=0.009) reported higher propensity to kill lions in response to social norms.
Moreover, if people thought there was nothing stopping them from killing a lion they also
had higher inclination to kill lions (p<0.001). Overall model fit was R2: 0.2352.
When human security was concerned (RC3), believing that “it is expected from me that I
kill a lion which has killed livestock” (p<0.001) and that “people who are important to me
want me to kill a lion in the next year” (p=0.007) significantly predicted higher propensity
to kill lions. Respondents who thought it would be easy for them to kill a lion if they
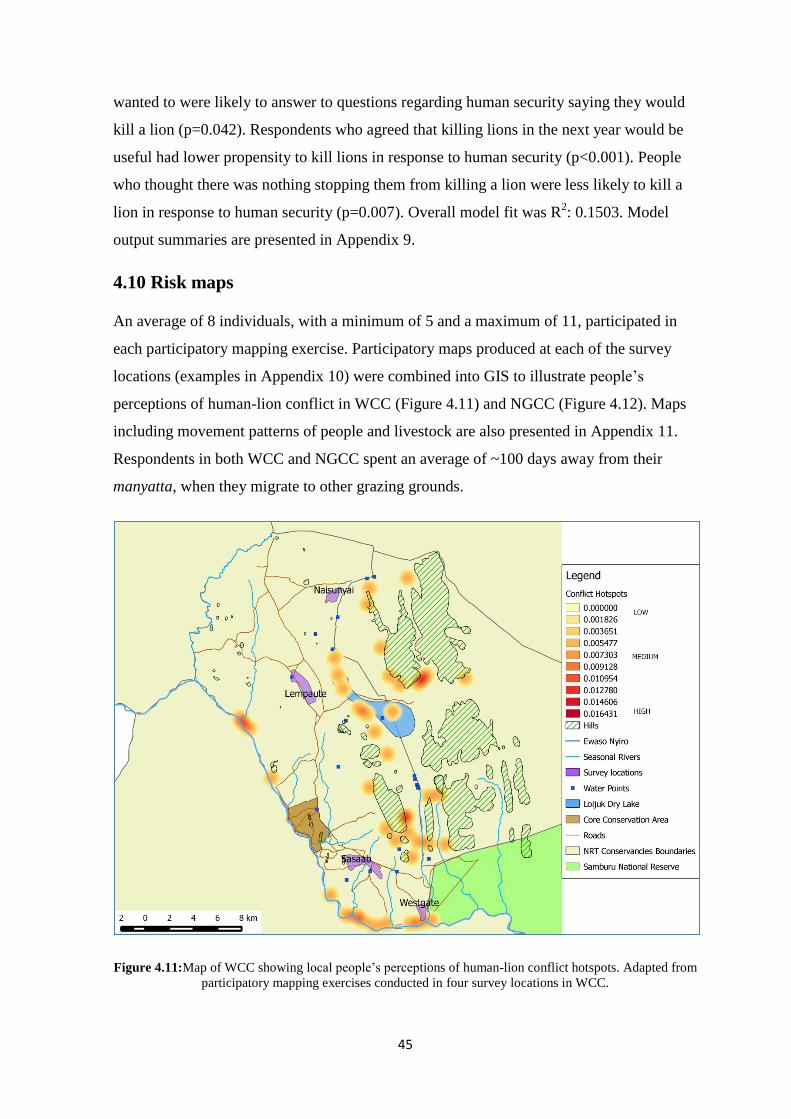
45
wanted to were likely to answer to questions regarding human security saying they would
kill a lion (p=0.042). Respondents who agreed that killing lions in the next year would be
useful had lower propensity to kill lions in response to human security (p<0.001). People
who thought there was nothing stopping them from killing a lion were less likely to kill a
lion in response to human security (p=0.007). Overall model fit was R2: 0.1503. Model
output summaries are presented in Appendix 9.
4.10 Risk maps
An average of 8 individuals, with a minimum of 5 and a maximum of 11, participated in
each participatory mapping exercise. Participatory maps produced at each of the survey
locations (examples in Appendix 10) were combined into GIS to illustrate people’s
perceptions of human-lion conflict in WCC (Figure 4.11) and NGCC (Figure 4.12). Maps
including movement patterns of people and livestock are also presented in Appendix 11.
Respondents in both WCC and NGCC spent an average of ~100 days away from their
manyatta, when they migrate to other grazing grounds.
Figure 4.11:Map of WCC showing local people’s perceptions of human-lion conflict hotspots. Adapted from
participatory mapping exercises conducted in four survey locations in WCC.

46
In WCC, human-lion conflict hotspots were concentrated especially on the eastern and
southern boundaries of the conservancy. Only one high conflict hotspot was present on the
western boundary, where Nchoro seasonal river meets the Ewaso Nyiro river.
In NGCC (Figure 4.12) conflict hotspots were mostly concentrated along the Plateau and
within BSNR. People reported grazing their livestock inside the national reserves.
Figure 4.12: Map of NGCC showing local people’s perceptions of human-lion conflict hotspots. Adapted
from participatory mapping exercises conducted in four survey locations in NGCC.
47
5. Discussion
5.1 Summary of key findings
Turkana areas (NGCC) generally exhibited higher propensity to kill lions than
Samburu areas (WCC).
In WCC, propensity to kill lions in response to livestock depredation was low, but
people were more inclined to kill a lion in the case of threats to human life.
NGCC locations expressed significantly higher propensity to kill lions than locations in
WCC.
When locations in Laikipia were compared with the other study areas, it was found that
respondents had significantly higher scores for the killing scale statements, meaning
that they would kill a lion or accept the killing of a lion more readily in hypothetical
situations compared to other locations, including those in NGCC.
A kill-on-sight policy towards lions was rare at most locations. However, people said
they would kill a lion regardless of any attack on livestock in Naisunyai, Ngare Mara,
Nasuroi, Attan, Kirimun and P&D.
Respondents in NGCC and Naisunyai were more likely to use poison to kill lions,
while in other locations they were more likely to use traditional methods such as
spearing. In both WCC and Laikipia poison use did not appear to be an issue.
Variables which most influenced propensity to kill lions were the number of livestock
owned, the frequency of livestock loss to predators, the perception of lions being the
most problematic predators, the age group of respondents, their sources of income, the
number of adults in the household, and the perceived trend in lion population. Contrary
to other studies (Hazzah et al., 2009; Hazzah et al, 2013), education and religion were
not found to be predictors of propensity to kill lions in the study areas.
Propensity to kill lions can be predicted by attitudes, subjective norms and perceived
behavioural controls. The more people feel it would be useful to kill lions, perceive
people’s approval and admiration for the behaviour, and believe that it would be easy
for them to kill a lion and that there is nothing stopping them from doing it, the greater
will be their propensity to kill lions.
Participatory maps identified where conflict with lions is perceived to be highest and
consequently where retaliatory killing is most likely to occur.

48
5.2 Patterns of propensity to kill lions in the study areas
There are clearly defined clusters of higher propensity to kill lions within the study area. At
the larger scale, there were differences in reported inclination to kill lions between WCC,
NGCC and Laikipia. Respondents in WCC showed a significantly more positive outlook
on livestock depredation by lions and most respondents would never kill a lion or accept
the killing of a lion that has killed livestock. An exception, however, was on killing scale
questions which addressed threats to family members of respondents or to humans in
general. Respondents reported higher propensity to kill lions when they were presented
with a hypothetical scenario in which lions posed a threat to human security: therefore, in
WCC most respondents would only kill a lion in response to threats to family members or
human beings in general. This is an encouraging result, indicating that people in WCC may
be more tolerant of dispersing lions even if they predate on their livestock. Previous
research has focused more on livestock depredation than on attacks on humans (Inskip and
Zimmermann, 2009) and this study represents a first attempt at analysing differences in
people’s propensity to kill predators in response to livestock loss compared to threats to
human life.
The fact that people in WCC are more tolerant towards livestock depredation and exhibited
a lower propensity to kill lions might be attributed to the presence of Ewaso Lions (EL) in
the area since 2007. EL’ programmes are shaping how people perceive lions and other
wildlife in WCC. Evidence for this was found by Gurd (2012), who conducted an
evaluation of an EL programme, reporting that the majority of community members stated
an improvement in their tolerance towards lions over the preceding 2 years, a change they
attributed to EL projects. EL also provides jobs and employs community members to work
on their projects, therefore contributing to the perception of lions being a benefit rather
than only a cost. In addition, tourism in WCC brings benefits to communities and could
increase people’s acceptance of wildlife. However, only 13% of WCC respondents cited
tourism as one of their main sources of income, and thus this link is not necessarily
perceived by local people. Potentially, propensity to kill lions in WCC could have been
underestimated due to response bias and social desirability bias: respondents might have
been unwilling to disclose information on their propensity to practice illegal behaviour and
could have therefore been dishonest when answering the questionnaire. Moreover,
respondents might have been wary of the interviewer’s association with EL (Browne-
Nunez and Jonker, 2008). A few studies have attempted to overcome the bias associated
49
with sensitive questions about the illegal killing of wildlife by utilising methods
specifically designed to investigate sensitive behaviours (St John et al, 2011; Fairbrass,
2012). Using such methods (e.g. the Unmatched Count Technique) was beyond the scope
of this study, but it could represent an interesting addition for future research, allowing to
understand how propensity to kill lions relates to the actual prevalence of the behaviour in
the study area.
Surprisingly, although consistent with other studies (Bagchi and Mishra, 2006), propensity
to kill lions was not directly related to the frequency of livestock loss, as WCC locations
reported losing livestock more frequently to predators, but still had the lowest propensity to
kill lions compared to the other locations. However, since lions were not considered to be
the most problematic predator species in WCC, they might not cause resentment as much
as hyenas and leopards which were ranked as the most troublesome predators at most
locations.
Significantly higher propensity to kill lions was reported in NGCC. One of the main
concerns which arise is that higher propensity to kill lions in NGCC is also combined with
a higher inclination to use poison as the method of killing. This could potentially have
tragic consequences for the lion population in the surrounding National Reserves, which
uses NGCC as a corridor between PAs. In addition, in NGCC respondents reported not
only propensity to kill lions in response to economic loss (retaliatory killing), but they
were also more likely to kill a lion or accept the killing of a lion regardless of livestock
depredation, possibly as a form of prevention from future attacks. The frequency of
livestock loss to predators was reported to be lower in NGCC than in WCC and Laikipia
(apart from in Nasuroi, where frequency of livestock loss was relatively high), but lions
were ranked as the main problem predator mainly for cattle and camels (in Manyatta Zebra
and Attan), and for all livestock types in Nasuroi. In Ngare Mara, on the other hand,
hyenas were still ranked as the main problem predator. Perception of the level of conflict
caused by lions could therefore be a reason for the lower tolerances and higher propensity
to kill lions in NGCC. Additionally, cattle are particularly valuable from both an economic
and cultural standpoint, and as a result areas where lions are the main problem predators
for cattle are likely to exhibit lower tolerance (Kissui, 2008). It is not unexpected, then,
that Nasuroi had very high propensity to kill lions compared to other areas, since reported
frequency of livestock loss was high and lions were considered the main problem
predators. Turkana bomas are not as secure as Samburu ones, as the control boma which

50
surrounds the manyatta is not present in Turkana villages: this could allow lions to enter
more easily, making them more problematic than in other areas where livestock is better
protected (J Lekilelei, pers.comm., 2014).
Respondents in Laikipia were more likely to kill a lion or accept the killing of a lion in a
broader range of hypothetical situations (“killing scale” statements) compared to both
WCC and NGCC. Tolerance was not measured in Laikipia, as the original questionnaire
did not include it. However, other studies conducted in pastoral areas in Laikipia revealed
very low levels of tolerance, with most respondents being willing to lose only one head of
livestock before responding with retaliatory killing (Romanach et al, 2010), suggesting that
tolerance in this area might be even lower than in NGCC. This, combined with the high
propensity to kill lions found in this study, suggests that Laikipia pastoral areas are likely
to be a population sink. Most of the lions in Laikipia are found on commercial ranches but
sometimes cross the boundaries into pastoral areas, including Kirimun and P&D (Cotterill,
2013). The reason for this behaviour could be that lions preferentially select habitats with
lower densities of people and livestock (Frank et al, 2005), but also that they have adapted
their behaviour to minimise the risk of human-caused mortality (Cotterill, 2013). Thus,
even if lions can avoid areas where they are more likely to be killed by humans, they are
still experiencing a cost from not using parts of the landscape where wild prey is abundant
(commercial ranches and pastoral areas have similar wild prey densities) (Cotterill, 2013)
and they are also limited in their dispersal potential from commercial ranches towards SNR
and BSNR.
When looking at a finer spatial scale, further differences were found between locations
within the same conservancy, for example Naisunyai had lower tolerance (and more people
expressed a kill-on-sight policy) compared to the other three locations in WCC and
respondents in this location were also more likely to use poison/poisoned arrows to kill a
lion. The behaviour investigated in this study is peculiar because even a small proportion
of the population retaining low tolerances towards lions could have negative consequences
for lions. As has been seen elsewhere, a few intolerant individuals could kill many lions at
a given location, even if the rest of the community does not approve of the behaviour
(Hazzah et al, 2009). Low tolerance hotspots such as Naisunyai, combined with a higher
likeliness of poison use, can constitute a risk to lions not only in Naisunyai itself but within
the entire conservancy and other areas to which people and livestock migrate to.
51
Between all NGCC locations, Manyatta Zebra was the one with the least propensity to kill
lions, even if it still had low tolerance. Respondents in Ngare Mara and Attan also reported
knowing someone who has killed a lion in the past two years, and they also thought two
lions are killed each year in their communities, reinforcing the finding that propensity to
kill lions is highest in NGCC locations. The two locations in Laikipia also differed from
each other. People in Kirimun were significantly more likely than people in P&D to kill a
lion in response to social norms and threats to humans and livestock, and also more likely
to kill a lion regardless of any livestock depredation events. In P&D, on the other hand,
respondents were more likely to say killing a lion was their normal response to livestock
depredation.
A main limitation of this study was the sensitive nature of the behaviour being studied,
which may have led to an underestimation of propensity to kill lions as respondents might
have been reluctant to disclose such information for fear of retribution (Gavin et al, 2010).
For example, even though four measures of propensity to kill were used, including the
most proximate predictor of behaviour (behavioural intention) (Hardeman et al, 2002),
actual behaviour cannot be quantified unless methods for researching sensitive behaviours
are incorporated. This could explain why behavioural intention, which should be the
strongest predictor of actual behaviour, yielded positive results at all locations (in other
words, most people at all study locations indicated they do not intend to kill lions in the
next year). Such findings, however, were not reflected in the other measures of propensity
to kill, which give a different picture and indicate higher propensity to kill lions. The
reason for this discrepancy could be that future intention to kill lions is a particularly
sensitive question to which respondents might be fearful to respond.
5.3 Influence of socio-demographics and individual experiences on
propensity to kill lions
From the results in this study, it is clear that a distinction should be made between different
types of livestock when considering the importance of livestock losses, as livestock
depredation will trigger different responses depending on whether cattle, shoats, donkeys
or camels are killed. For instance, there seems to be a fundamental difference in the way
people perceive shoats and donkeys and, conversely, cattle and camels. People who owned
more cattle and more camels were more likely to have higher propensity to kill lions, while

52
people who owned more shoats and donkeys had lower propensity to kill lions. This can be
explained by the fact that cattle and camels are direct indicators of wealth and have higher
financial value than shoats or donkeys (the latter are also valuable financially, but are only
used for transport and do not provide meat or milk, unlike other livestock; Twerda et al,
1997). Cattle and camels are also used for marriage dowries as traditional gifts from a man
to the parents of the bride and carry a large cultural significance (Spencer, 2004). People
who own more cattle and camels are therefore wealthier and more likely to engage in a
cash economy through livestock trade, which would make them more inclined to eliminate
predators to avoid the financial costs of livestock depredation (Frank, 2010). A similar
study conducted in Maasai communities revealed that people involved in the livestock
trade showed higher propensity to kill lions than those who only bred livestock for
subsistence purposes (Hazzah et al, 2009). Lions’ predatory behaviour makes them more
susceptible to people’s resentment, as they mainly attack cattle and camels, which are the
most valuable livestock assets, rather than small stock (Kissui, 2008). This could explain
why locations where respondents ranked lions as the main problem predators for cattle
were also more likely to kill a lion, for example in NGCC. However, the opposite
relationship is true for donkeys, reinforcing the hypothesis that cattle are given more
importance than other types of livestock.
Other wealth indicators also predicted propensity to kill lions, for example respondents’
sources of income. People with diversified livelihoods (deriving income from livestock as
well as other activities, such as small businesses or tourism) reported lower propensity to
kill a lion that threatens human life, and were less likely to kill/poison a lion in response to
livestock depredation. This finding suggests that, as expected, people who rely solely on
livestock have more vulnerable livelihoods and livestock loss carries a higher financial
weight on the household, leading to retaliatory killing of lions. The financial aspect of
livestock depredation seems to be an important factor affecting propensity to kill lions.
Individuals’ dependence on livestock was also found to be a predictor of attitudes towards
livestock depredation by Hazzah et al (2009).
Junior elders expressed a greater propensity to kill a lion which threatens human life than
did warriors and elders. This could have several explanations: junior elders already have
wives and children to care for and might therefore be more concerned about family
security compared to warriors. Moreover, they are also still actively responsible for their

53
livestock and families, unlike elders who are often too old to do so (S. Bhalla, pers.
comm.).
5.4 Influences of attitudes, social norms and perceived behavioural
control on propensity to kill lions
Attitudes were found to be a predictor of propensity to kill lions: respondents who believed
killing lions in the next year would be useful expressed higher propensity to kill lions,
especially as a measure of preventing future depredation on livestock, rather than in
retaliation for livestock loss. Community members’ approval and admiration were also
important in shaping respondents’ propensity to kill lions. In addition, people also valued
significant others’ opinions, as respondents who thought that people important to them
wanted or expected them to kill lions were more inclined to do it. Marchini and McDonald
(2012) found similar results in Brazil, where ranchers with greater perceptions of others’
approval of the behaviour had stronger intentions to kill jaguars. A change in perception at
the community level is therefore necessary, so that retaliatory killing of lions is not seen as
something to approve of, but instead as something to dislike. Conservation programmes in
this area should therefore try to change views and perceptions regarding retaliatory killing
by targeting all social groups, as they can all influence each others’ attitudes and beliefs
(Goldman et al, 2013). EL is already taking this approach in WCC, where it has established
a number of different community programmes devoted to specifically to warriors, elders,
women and children.
People who perceived that it would be easy for them to kill a lion, or that there was nothing
stopping them from doing so, were more likely to express higher propensity to kill lions in
retaliation for economic loss. Killing lions is illegal, but enforcement is rare, as it is
difficult to detect and community members are unlikely to report it to the relevant
authorities (e.g. KWS) (Hazzah et al, 2009). Results from this study therefore suggest that
an increase in enforcement could reduce people’s propensity to kill lions, providing an
effective behavioural control that would prevent people from retaliating against lions.
54
5.5 Where do lions risk being killed the most?
The fact that Westgate and Sasaab had the least propensity to kill lions compared to all
other locations is reassuring, as those are the locations in WCC closest to Samburu NR,
and therefore constitute the first corridor for lions when they exit the PA. People in
Westgate reported they move inside SNR to graze their livestock: this could have negative
implications on the ecosystem as livestock can outcompete native herbivores (Pringle et al,
2011), but it does not seem to be of particular concern in terms of lion human-caused
mortality, as Westgate had one of the lowest propensity to kill lions.
On the contrary, an issue that arises when looking at the participatory maps in combination
with survey results is that in NGCC, where respondents have low tolerances and higher
propensity to kill (and poison) lions, people tend to encroach into BSNR and Shaba NR to
graze their livestock. Therefore conflict is not limited to community land but also occurs in
PAs which are the only remaining strongholds for lions. Enforcement of National
Reserves’ rules in order to reduce, and ideally avoid, encroachment by people and
livestock is therefore necessary to minimise the risk of livestock depredation and, as a
consequence, retaliatory killing of lions.
5.6 Recommendations for future management and conclusions
Due to the variations in propensity to kill lions, different management approaches should
be adopted in the different study locations.
On its own, increasing livestock protection might not be able to improve the situation, as
frequency of livestock loss was not always related to higher propensity to kill lions (as in
Romanach et al, 2007). Moreover, a higher level of damage does not always necessarily
translate into lower tolerances or more negative attitudes (Treves and Bruskotter, 2014;
Marchini and McDonald, 2012). For example, in WCC respondents stated they lost
livestock more frequently to predators than in other locations, but they still had the lowest
inclination to kill lions. Increasing boma protection and providing effective predator
deterrents (such as domestic dogs and anti-predator lights; Frank, 2010) could instead be
helpful in NGCC, where both frequency of livestock loss and propensity to kill lions were
higher, and where lions were mostly ranked as the main problem predators.

55
Financial incentives for conservation, also termed payments to encourage coexistence
(PEC), are another management option which has proven successful in similar contexts.
For example, in Mbirikani Group Ranch, in southern Kenya, the number of lions killed by
local people was drastically reduced after a compensation scheme was put in place
(Maclennan et al, 2009). A compensation scheme is in operation in the study area, but it
has many flaws, for example that claims have to be made within 24 hours, making it is
difficult for local people to receive compensation (S. Bhalla, pers.comm., 2014). For the
scheme to be successful, the appropriate institutional mechanisms have to be present to
avoid some of the negative outcomes of poorly managed financial incentives, such as risks
of false claims and corruption, as well as raising expectations that cannot be met
financially in the long term, which could further reduce tolerances towards predators
(Maclennan et al, 2009; Dickman et al, 2011).
One of the major problems associated with compensation is that it does not change the
fundamental issues behind illegal killing of lions. Firstly, it only addresses the outcomes
and does not try to prevent conflict in the first place (Deinet et al, 2013). Secondly,
compensation might not always result in higher tolerances (Dickman et al, 2011). In fact,
livestock loss is linked to cultural and emotional values which cannot be compensated for
with money and therefore solutions should not be limited to financial incentives. Goldman
(2010) investigated how Masaai people in southern Kenya perceived lions and found that
there are positive dimensions in how lions are perceived as they play a special role in their
culture. Even if a similar study was not conducted for the Samburu, the cultural context is
similar, and lions are an integral part of Samburu culture. Conservation interventions can
build on this by highlighting the positive aspects of having lions as part of the cultural
heritage (Goldman et al, 2013). Programmes like EL’ Warrior Watch, in which local
warriors are employed to monitor lion movements, record conflicts and act as ambassadors
for conservation in their respective communities, can enhance people’s acceptance of lions
and build capacity for lion conservation. This approach has been successful in WCC
(Gurd, 2012), where coupled to benefits from tourism it has resulted in increased tolerance
and lower propensity to kill lions. Conservation efforts of this kind should therefore be
expanded to NGCC, while taking into account the cultural differences between Samburu
and Turkana people, and to pastoral areas in Laikipia, where propensity to kill lions is
highest.
56
As negative attitudes were a predictor of higher propensity to kill lions, conservation
efforts should also attempt to change the perception that killing lions would be useful to
avoid future depredation events. Benefits received from tourism have been shown to
increase attitudes towards tigers in Nepal (Carter et al, 2013), as tigers were seen as a
benefit rather than a cost. For this reason, there is a need to ensure that local people receive
benefits from tourism at the individual level and that they acknowledge the link between
these benefits and the presence of lions in the ecosystem (Archabald and Naughton-Treves,
2001) in both WCC and Laikipia, where tourism is already operating.
In conclusion, WCC is likely to be a viable corridor for lions while NGCC and Laikipia
pastoral areas risk becoming a population “sink” if precautions are not taken to minimise
conflict and to improve people’s tolerance. The main corridor connecting Shaba with
Samburu and Buffalo Springs NRs could be compromised if conservation initiatives are
not undertaken not only to reduce the occurrence of livestock depredation by improving
methods of livestock protection and designing effective deterrents, but also to change
people’s perceptions of lions and increase tolerance. Continuation of community
conservation programmes in WCC is vital (with particular effort in Naisunyai, where
tolerance is lowest), as well as expanding the reach of those programmes to areas with a
high propensity to kill lions.

57
References
Ajzen, I. (1991). The theory of planned behavior. Organizational Behavior and Human Decision
Processes, 50, 179–211.
Archabald, K., & Naughton-Treves, L. (2001). Tourism revenue-sharing around national parks in
Western Uganda: early efforts to identify and reward local communities. Environmental
Conservation, 28(2), 135-149.
Bagchi, S., & Mishra, C. (2006). Living with large carnivores: predation on livestock by the snow
leopard (Uncia uncia). Journal of Zoology, 268(3), 217-224.
Barkham, J.P. and Rainy, M.E. (1976). The vegetation of the Samburu-Isiolo Game Reserve. East
African Wildlife Journal, 14, 297-329.
Bauer, H., & Van Der Merwe, S. (2004). Inventory of free-ranging lions Panthera leo in Africa.
Oryx, 38(01), 26–31.
Bauer, H., Nowell, K. & Packer, C. (2012). Panthera leo. The IUCN Red List of Threatened
Species. [Online] Available from: www.iucnredlist.org. [Accessed: August 28th 2014].
Bertola, L. D., van Hooft, W. F., Vrieling, K., Uit de Weerd, D. R., York, D. S., Bauer, H., Prins,
H.H.T., Funston, P.J., Udo de Haes, H.A., Leirs, H., van Haeringen, W.A., Sogbohossou, E.,
Tumenta, P.N., & de Iongh, H. H. (2011). Genetic diversity, evolutionary history and
implications for conservation of the lion (Panthera leo) in West and Central Africa. Journal
of Biogeography, 38(7), 1356–1367.
Bhalla, S. Founder and Executive Director, Ewaso lions. (Personal communication, August 28th
2014).
Björklund, M. (2003). The risk of inbreeding due to habitat loss in the lion (Panthera leo).
Conservation Genetics, 4(4), 515–523.
Brashares, J. S., Arcese, P., & Sam, M. K. (2001). Human demography and reserve size predict
wildlife extinction in West Africa. Proceedings. Biological Sciences / The Royal Society,
268(1484), 2473–2478.
Browne-Nuñez, C., & Jonker, S. A. (2008). Attitudes Toward Wildlife and Conservation Across
Africa: A Review of Survey Research. Human Dimensions of Wildlife, 13(1), 47–70.
Carter, N.H., Riley, S.J., Shortridge, A., Shreshta, B.K., & Liu, J. (2013). Spatial Assessment of
Attitudes Toward Tigers in Nepal. Ambio, 43(2):125-37.
Cardillo, M., Purvis, A., Sechrest, W., Gittleman, J. L., Bielby, J., & Mace, G. M. (2004). Human
population density and extinction risk in the world’s carnivores. PLoS Biology, 2(7), E197.
doi:10.1371/journal.pbio.0020197
Cotterill, A. (2013). Behavioural Adjustments of Lion (Panthera leo) in Response to Risk of
Human-Caused Mortality. DPhil Thesis. University of Oxford.

58
Coutts, E., & Jann, B. (2011). Sensitive questions in online surveys: experimental results for the
randomized response technique (RRT) and the unmatched count technique (UCT).
Sociological Methods & Research, 40, 169–193.
Deinet, S., Ieronymidou, C., McRae, L., Burfield, I.J., Foppen, R.P., Collen, B., & Bohm, M.
(2013). Wildlife comeback in Europe. The recovery of selected mammal and bird species.
Final report to Rewilding Europe. ZSL, BirdLife International & European Bird Census
Council. London, UK.
Dickman, A. J. (2010). Complexities of conflict: The importance of considering social factors for
effectively resolving human-wildlife conflict. Animal Conservation, 13(5), 458–466.
Dickman, A. J. (2013). From Cheetahs to Chimpanzees: A comparative review of the drivers of
human-carnivore conflict and human-primate conflict. Folia Primatologica, 83(3-6), 377–
387.
Dickman, A. J., Macdonald, E. a, & Macdonald, D. W. (2011). A review of financial instruments to
pay for predator conservation and encourage human-carnivore coexistence. Proceedings of
the National Academy of Sciences of the United States of America, 108(34), 13937–13944.
Dickman, A., Marchini, S., & Manfredo, M. (2013). The human dimension in addressing conflict
with large carnivores. In: Macdonald, D. & Service, K. (eds.) Key Topics in Conservation
Biology 2. Chichester, UK, Wiley-Blackwell, pp. 110–125.
Didier, K. A., Cotterill, A., Douglas-Hamilton, I., Frank, L., Georgiadis, N.J., Graham, M., Ihwagi,
F., King, J., Malleret-King, D., Rubenstein, D., Wilkie, D., & Woodroffe, R. (2011).
Landscape-Scale Conservation Planning of the Ewaso Nyiro: A Model for Land Use
Planning in Kenya? Smithsonian Contributions to Zoology , 632, 105-123.
Dolrenry, S., Stenglein, J., Hazzah, L., Lutz, R. S., & Frank, L. (2014). A metapopulation approach
to African lion (Panthera leo) conservation. PLoS ONE, 9(2), e88081.
doi:10.1371/journal.pone.0088081
Fairbrass, A.J. (2012). Using novel techniques to measure illegal killing of birds in Southern
Portugal: The Unmatched Count Technique. MSc Thesis. Imperial College London.
Fishbein M., & Ajzen, I. (1975). Belief, Attitude, Intention and Behaviour: an Introduction to
Theory and Research. Reading, MA, Addison-Wesley Publishing Company.
Francis, J. J., Eccles, M. P., Johnston, M., Walker, A., Grimshaw, J., Foy, R., Kaner, E.F.S., Smith,
L., & Bonetti, D. (2004). Constructing questionnaires based on the theory of planned
behaviour. A manual for health services researchers. Newcastle, UK, Centre for Health
Services Research.
Frank, L. (2010). Living with lions: lessons from Laikipia. In: Georgiadis N.J. (ed.) Conserving
Wildlife in African Landscapes: Kenya's Ewaso Ecosystem. Washington DC, USA,
Smithsonian.
59
Frank, L., Woodroffe, R., Ogada, M.O. (2005). People and predators in Laikipia district, Kenya. In:
Woodroffe, R., Hirgood, S.& Rabinowitz, A. (eds.) People and Wildlife: Conflict or co-
existence?. Cambridge, UK, Cambridge University Press, pp. 286–304.
Frank, L., Gelber, L., Cotterill, A., Ekwanga, S., Hazzah, L., Dolrenry, S., Blackburn, S., Howard,
A., Briggs, P., Napao, M., Nkiinti, L., Mamaai, L., & Kesoi, E.O. (2010). Living With Lions
Annual Report. [Online] Available from:
http://www.lionconservation.org/AnnualReports/2010-LWL-Annual-Report.pdf [Accessed:
September 1st 2014]
Franklin, S. B., Gibson, D. J., Robertson, P. A., Pohlmann, J.T., & Fralish, J.S. (1995). Parallel
Analysis: a Method for Determining Significant Principal Components. Publications, 9.
[Online] Available from:
http://opensiuc.lib.siu.edu/pb_pubs/9/?utm_source=opensiuc.lib.siu.edu%2Fpb_pubs%2F9&
utm_medium=PDF&utm_campaign=PDFCoverPages [Accessed: September 1st 2014]
Gadd, M. E. (2005). Conservation outside of parks: attitudes of local people in Laikipia, Kenya.
Environmental Conservation, 32(1), 50–63.
Gavin, M., Solomon, J. & Blank, S. G. (2010). Measuring and monitoring the illegal use of natural
resources. Conservation Biology, 24, 89–100.
Georgiadis, N. J. (2011). Conserving wildlife in African Landscapes: Kenya's Ewaso Ecosystem.
Smithsonian Contributions to Zoology, 632. [Online] Available from:
https://repository.si.edu/bitstream/handle/10088/16714/SCZ632_Georgiadis_web_FINALrev
.pdf?sequence=1&isAllowed=y [Accessed: September 1st 2014]
Georgiadis, N. J., Olwero, J.G.N., Ojwang, G., & Romanach, S.S. (2007). Savanna herbivore
dynamics in a livestock-dominated landscape: I. Dependence on land use, rainfall, density,
and time. Biological Conservation , 137 (3), 461-472.
Goldman, M. J., de Pinho, J. R., & Perry, J. (2010). Maintaining complex relations with large cats:
Maasai and Lions in Kenya and Tanzania. Human Dimensions of Wildlife, 15, 332-346.
Goldman, M. J., de Pinho, J. R., & Perry, J. (2013). Beyond ritual and economics: Maasai lion
hunting and conservation politics. Oryx, 47(04), 490–500.
Graham, M.D. (2007). Coexistence in a land use mosaic? Land use, risk and elephant ecology in
Laikipia District, Kenya. PhD thesis, University of Cambridge, Cambridge, UK.
Gurd, H. (2012) Evaluating the success of “ W arrior Watch ”: A Community-Based Conservation
Initiative in Samburu, northern Kenya. MSc Thesis. Imperial College London.
Harcourt, A. H., Parks, S. A. & Woodroffe, R. (2001). Human density as an influence on
species/area relationships: double jeopardy for small African reserves? Biodiversity &
Conservation, 10(6), 1011-1026.
Hardeman, W., Johnston, M., Johnston, D., Bonetti, D., Wareham, N., & Kinmonth, A. L. (2002).
Application of the Theory of Planned Behaviour in Behaviour Change Interventions: A
Systematic Review. Psychology & Health, 17(2), 123–158.
60
Hazzah, L., Borgerhoff Mulder, M., & Frank, L. (2009). Lions and Warriors: Social factors
underlying declining African lion populations and the effect of incentive-based management
in Kenya. Biological Conservation, 142(11), 2428–2437.
Hazzah, L., Dolrenry, S., Kaplan, D., & Frank, L. (2013). The influence of park access during
drought on attitudes toward wildlife and lion killing behaviour in Maasailand, Kenya.
Environmental Conservation, 40(03), 266–276.
IFAD, 2009. Good practices for participatory mapping. [Online] Available from:
http://www.ifad.org/pub/map/pm_web.pdf [Accessed: September 1st 2014]
Inskip, C., & Zimmermann, A. (2009). Human-felid conflict: a review of patterns and priorities
worldwide. Oryx, 43(1), 18-34.
IUCN (2006). Conservation strategy for the lion in eastern and southern Africa. IUCN SSC Cat
Specialist Group, Gland, Switzerland and Cambridge, UK.
Jochum, K.A., Kliskey, A.A., Hundertmark, K.J., & Alessa, L. (2014). Integrating complexity in
the management of human-wildlife encounters. Global Environmental Change, 26, 73-86.
Kalberer, P., & Walker, M. (2010). QGis OpenLayers Plugin, Sourcepole, AG.
Kansky, R., Kidd, M., & Knight, A.T. (2014). Meta-Analysis of Attitudes toward Damage-Causing
Mammalian Wildlife. Conservation Biology, 28(4), 924-938.
Karanth, K.K., Gopalaswamy, A.M., DeFries, R., & Ballal, N. (2012). Assessing Patterns of
Human-Wildlife Conflicts and Compensation around a Central Indian Protected Area. PLoS
ONE, 7(12), e50433. doi:10.1371/journal.pone.0050433
King, B. H. (2002). Towards a Participatory GIS: Evaluating Case Studies of Participatory Rural
Appraisal and GIS in the Developing World. Cartography and Geographic Information
Science, 29(1), 43–52.
King, 2010. Development of a joint conservancy anti-poaching team to protect African elephants in
Northern Kenya. Northern Rangelands Trust. Annual Report. [Online] Available from:
http://www.elephantconservation.org/northern-rangelands-trust-report-2010/[Accessed:
September 1st 2014]
Kissui, B. M. (2008). Livestock predation by lions, leopards, spotted hyenas, and their vulnerability
to retaliatory killing in the Maasai steppe, Tanzania. Animal Conservation, 11(5), 422–432.
Konaka, S. (1997). The Samburu livestock market in northcentral Kenya. African Study
Monographs, 18 (3), 137-155.
KWS, 2009. National Conservation and management Strategy for Lion & Spotted Hyena in Kenya
(2009-2014). [Online]. Available from:
http://www.kws.org/export/sites/kws/info/publications/strategies/Conservation_and_manage
ment_for_Lion_x_Spotted_Hyena_layout.pdf [Accessed: September 1st 2014].
Laikipia Predator Project, 2014. Laikipia Predator Project. [Online]. Available from:
http://www.lionconservation.org/laikipia-predator-project.html [Accessed: September 1st
2014]
61
Lekilelei, J. Senior field officer, Ewaso Lions. (Personal communication, June 28th 2014).
Liu, F., McShea, W. J., Garshelis, D. L., Zhu, X., Wang, D., & Shao, L. (2011). Human-wildlife
conflicts influence attitudes but not necessarily behaviors: Factors driving the poaching of
bears in China. Biological Conservation, 144(1), 538–547.
Macdonald, D. W., & Sillero-Zubiri, C. (2002). Large carnivores and conflict : Lion conservation
in context. Lion Conservation Research. Workshop 2: Modelling Conflict, 1–8.
Maclennan, S.D., Groom, R.J., Macdonald, D.W., & Frank, L.G. (2009). Evaluation of a
compensation scheme to bring about pastoralist tolerance of lions. Biological Conservation,
142, 2419-2427.
Marchini, S., & Macdonald, D.W. (2012). Predicting ranchers' intention to kill jaguars: case studies
in Amazonia and Pantanal. Biological Conservation, 147(1), 213-221.
Mastrangelo, M. E., Gavin, M. C., Laterra, P., Linklater, W. L., & Milfont, T. L. (2014). Psycho-
Social Factors Influencing Forest Conservation Intentions on the Agricultural Frontier.
Conservation Letters, 7(2), 103–110.
Mateo-Tomás, P., Olea, P. P., Sánchez-Barbudo, I. S., & Mateo, R. (2012). Alleviating human-
wildlife conflicts: Identifying the causes and mapping the risk of illegal poisoning of wild
fauna. Journal of Applied Ecology, 49(2), 376–385.
McCleery, R. A. (2009). Improving Attitudinal Frameworks to Predict Behaviors in Human-
Wildlife Conflicts. Society & Natural Resources, 22(4), 353–368.
McCabe, T., (1990). Turkana Pastoralism: A Case Against the Tragedy of the Commons. Human
Ecology, 18 (1), 81-103.
Naughton-Treves L., Grossberg R., & Treves, A. (2003). Paying for tolerance: rural citizens’
attitudes toward wolf depredation and compensation. Conservation Biology, 17,1500–1511.
NOAA, 2009. Stakeholder engagement strategies for participatory mapping. [Online] Available
from:http://www.csc.noaa.gov/digitalcoast/sites/default/files/files/1366314383/participatory_
mapping.pdf [Accessed: September 1st 2014]
NRT, 2014. Northern Rangelands Trust. [Online]. Available from: http://www.nrt-kenya.org/
[Accessed: September 1st 2014]
Ocholla, G. O., Koske, J., Asoka, G. W., Bunyasi, M. M., Pacha, O., Omondi, S. H., & Mireri, C.
(2013). Assessment of Traditional Methods Used by the Samburu Pastoral Community in
Human Wildlife Conflict Management. Department of Environmental Planning and
Management, 3(11), 292–302.
Ogada, M. O., Woodroffe, R., Oguge, N. O., & Frank, L. G. (2003). Limiting Depredation by
African Carnivores: The Role of Livestock Husbandry. Conservation Biology, 17(6), 1521–
1530.
Ogutu, J. O., & Dublin, H. T. (2002). Demography of lions in relation to prey and habitat in the
Maasai Mara National Reserve, Kenya. African Journal of Ecology, 40(2), 120–129.

62
Pringle, R.M., Palmer, T.M., Goheen, J.R., McCauley, D.J., & Keesing, F. (20). The ecological
importance of large herbivores in the Ewaso Ecosystem. In: Georgiadis, (ed.) Conserving
wildlife in African Landscapes: Kenya's Ewaso Ecosystem. Smithsonian Contributions to
Zoology, 632.
R Core Team (2013). R: A language and environment for statistical computing. R Foundation for
Statistical Computing, Vienna, Austria. [Online] Available from: http://www.R-
project.org/[Accessed: September 1st 2014].
Ray, J., Hunter, L., & Zigouris, J. (2005). Setting Conservation and Research Priorities for Larger
African Carnivores. Working Paper No. 24. Wildlife Conservation Society (WCS), New
York.
Richardson, N. (10 February 2014). Kenya: learning to live in harmony with lions. The Telegraph.
[Online] Available from:
http://www.telegraph.co.uk/travel/destinations/africaandindianocean/kenya/10628014/Kenya
-Learning-to-live-in-harmony-with-lions.html. [Accessed 30th August 2014]
Riggio, J. (2011). The African lion (Panthera leo leo): a continent-wide species distribution study
and population analysis. MSc Thesis. Duke University.
Riggio, J., et al. (2013) The size of savannah Africa: a lion’s (Panthera leo) view. Biodiversity and
Conservation , 22 (1), 17-35.
Ripple, W. J., Estes, J. a, Beschta, R. L., Wilmers, C. C., Ritchie, E. G., Hebblewhite, M., Berger,
J., Elmhagen, B., Letnic, M., Nelson, M. P., Schmitz, O.J., Smith, D. W., Wallach, A.D., &
Wirsing (2014). Status and ecological effects of the world ’ s largest carnivores. Science,
343, 1–11. doi:10.1126/science.1241484
Romañach, S. S., Lindsey, P.A., & Woodroffe, R. (2010). Attitudes toward predators and options
for their conservation in the Ewaso Ecosystem. A Chronology of Middle Missouri Plains
Village Sites 85.
Romañach, S. S., Lindsey, P. A., & Woodroffe, R. (2007). Determinants of attitudes towards
predators in central Kenya and suggestions for increasing tolerance in livestock dominated
landscapes. Oryx, 41(02), 185.
Sillero-Zubiri, C., Sukumar, R., & Treves, A. (2006). Living with wildlife : the roots of conflict and
the solutions. In: Macdonald, D. & Service, K. (eds.) Key Topics in Conservation Biology.
Chichester, UK, Wiley-Blackwell, pp. 255–272.
Sitati, N. W., Walpole, M. J., Smith, R. J., & Leader‐Williams, N. (2003). Predicting spatial aspects
of human–elephant conflict. Journal of Applied Ecology, 40(4), 667-677.
Spencer, P. (2004). The Samburu: a study of gerontocracy. [Google Books version] 2nd ed.
London, Routledge.
St John, F. A.V., Keane, A. M., Edwards-Jones, G., Jones, L., Yarnell, R. W., & Jones, J. P.G.
(2012). Identifying indicators of illegal behaviour: carnivore killing in human-managed
landscapes. Proceedings of the Royal Society B: Biological Sciences, 279, 1729, 804-812.

63
St John, F. A. V., Edwards-Jones, G. & Jones, J. P. G. (2010). Conservation and human behaviour:
lessons from social psychology. Wildlife Research, 37, 658 –667.
Tsuchiya, T., Hirai, Y., & Ono, S. (2007). A study of the properties of the item count technique.
Public Opinion Quarterly, 71, 253–272.
Treves, A., Wallace, R. B., Naughton-Treves, L., & Morales, A. (2006). Co-managing human–
wildlife conflicts: a review. Human Dimensions of Wildlife, 11(6), 383-396.
Treves, A., & Bruskotter, J. (2014). Tolerance for Predatory Wildlife. Science, 344 (6183), 476-
477.
Treves, A., Andiamampianina, L., Didier, K., Gibson, J., Plumptre, A., Wilkie, D., & Zahler, P.
(2006). A simple, cost-effective method for involving stakeholders in spatial assessments of
threats to biodiversity. Human Dimensions of Wildlife, 11(1), 43–54.
Twerda, M., Fielding, D., & Field, C. (1997). Role and management of donkeys in samburu and
turkana pastoralist societies in Northern Kenya. Tropical animal health and production,
29(1), 48-54.
Weber, W., & Rabinowitz A. (1996). A global perspective on large carnivore conservation.
Conservation Biology, 10(4), 1046-1054.
Woodroffe, R., Thirgood, S. & Rabinowitz, A.(2005). People and wildlife, conflict or co-
existence? Cambridge University Press.
Woodroffe, R., & Ginsberg, J.R. (1998). Edge effects and the extinction of populations inside
protected areas. Science, 280(5372), 2126-2128.

64
Appendices
Appendix 1: Questionnaire (Westgate Community Conservancy and
Nakuprat Gotu Community Conservancy) (Rescaled for thesis
presentation)
Questionnaire
Reference Number: ______________ Date:____/______/_________ Area Name:_________
GPS Coordinates_________________________ Interviewer:___________________________
Time Start:__________am/pm Time End:___________am/pm
INSTRUCTIONS FOR INTERVIEWER:
Before starting the questionnaire, you must “play a game” to know which cards to use. Here are the
rules:
Throw the coin I gave you, if you get:
Heads, please use cards H.
Tails, please use cards T.
Did you get Heads or Tails? Heads □ Tails □
Which cards will you use? ______________________
Good morning/afternoon. My name is ____. I am conducting a survey on behalf of Clio, a student
from Italy. We are interested in understanding the relationships between people and wildlife in the
Samburu/Isiolo landscape. This questionnaire is strictly confidential, your name will not be
recorded and your answers will not be shared with other members of the community or the
authorities. The survey will take approximately 30 min to complete. If you don’t want to answer
any specific question, tell me. Would you like to continue with the questions?
Section 1: Background information
Community Name:________________________________________________________
Age Group: a) Warrior b) Junior elder c) Elder
How long have you lived in this boma/worked on this ranch? Number of years________
How many of the following do you currently have living with you?
a) Adults_____ b) Children_____ c) Cattle_____ d) Shoats_____ e) Donkeys_____ f)
Camels______
Please indicate the highest level of education you have received:
None □ Some primary □ Finished Primary □ Some secondary □ Finished Secondary □
Tertiary □

65
Religious affiliation:
KAG Catholic ACK PCEA AIC None Other_______________(specify)
In one month, how many days do you attend church (Sunday included)? __________/mth
Where does most of your family’s income come from?
Tourism □ Livestock □ Other (specify):________________________
Do you have other grazing grounds? Yes No
If yes, where is your other grazing ground?________________________________
Can you point the location of your grazing grounds in the map?
Since last year until now, approximately how many days do you think you have spent away
from this boma? _____________________
Do you leave any livestock/family at this boma when you leave for the other grazing grounds?
a) Number of people left behind________ b) Number of shoats left behind_________ c) Number
of cattle left behind_______ d) Number of donkeys left behind_______ e) Number of camels left
behind_______
Section 2: UCT- Unmatched Count Technique
I have three cards here with different items on them. I will read the items on the cards to you, and I
would like you to tell me how many of the items on the cards apply to you. Please don’t tell me
which ones, just how many. The first card is going to be an example.
Training Card - How many of the following items apply to you?
1 2 3 4 5
Card 2- How many of the following items apply to you?
1 2 3 4 5
Card 3- How many of the following items apply to you?
1 2 3 4 5
Section 3: Conflict Questions
In your opinion, what are the main causes of livestock loss in your community? Please rank
from most frequent (1) to least frequent (4):
Cause Rank (1-4)
Lack of food/water
Carnivores
Disease
Other(specify)

66
How often do you lose livestock to carnivores?
Cattle a) weekly b) monthly c) more than 3 times a year d) yearly e) never
Shoats a) weekly b) monthly c) more than 3 times a year d) yearly e) never
Donkeys a) weekly b) monthly c) more than 3 times a year d) yearly e) never
Camels a) weekly b) monthly c) more than 3 times a year d) yearly e) never
In your opinion, what carnivores cause the most problems (Please rank from most
problematic (1) to least problematic (5)?
Cattle ____Lion ____Cheetah ____Hyena ____Leopard ____Wild dog
Shoats ____Lion ____Cheetah ____Hyena ____Leopard ____ Wild dog
Donkeys ____Lion ____Cheetah ____Hyena ____Leopard ____ Wild dog
Camels ____Lion ____Cheetah ____Hyena ____Leopard ____ Wild dog
Do you think the lion population in this conservancy has: a) Increased b) Decreased
c) No change
If your livestock is killed by a lion what is your normal response? (circle response)
How effective are these responses at preventing future livestock loss(Score on a scale from 1:
very ineffective to 5: very effective)?
Response Effectiveness score
a)Report KWS Always Sometimes Never 1 2 3 4 5
b) Report to ranch owner Always Sometimes Never 1 2 3 4 5
c) Hunt/kill animal Always Sometimes Never 1 2 3 4 5
d) Poison animal Always Sometimes Never 1 2 3 4 5
e) Scare animal Always Sometimes Never 1 2 3 4 5
f) Change husbandry techniques Always Sometimes Never 1 2 3 4 5
g) Leave area Always Sometimes Never 1 2 3 4 5
h) Do nothing Always Sometimes Never 1 2 3 4 5
i)Other Always Sometimes Never 1 2 3 4 5
Killing threshold: How many livestock would you be willing to lose to a lion in one month
before you attempt to kill the lion or before you would think it is acceptable for someone in
your family to kill the lion? Please give the reason for your answer.
Never kill: Never kill or accept the killing of a lion (no matter how many livestock lost)
No tolerance: Always kill a lion even before it has attacked livestock.
Cattle Never kill lion No tolerance After ____ killed in 1 month
Shoats Never kill lion No tolerance After ____ killed in 1 month
Donkeys Never kill lion No tolerance After ____ killed in 1 month
Camels Never kill lion No tolerance After ____ killed in 1 month
Do you know anyone who has killed a lion in this area in the past 2 years? Yes No
How many lions do you think are killed in this community/on this ranch every year?
_________/year
I would now like to ask you some questions specifically about lions:
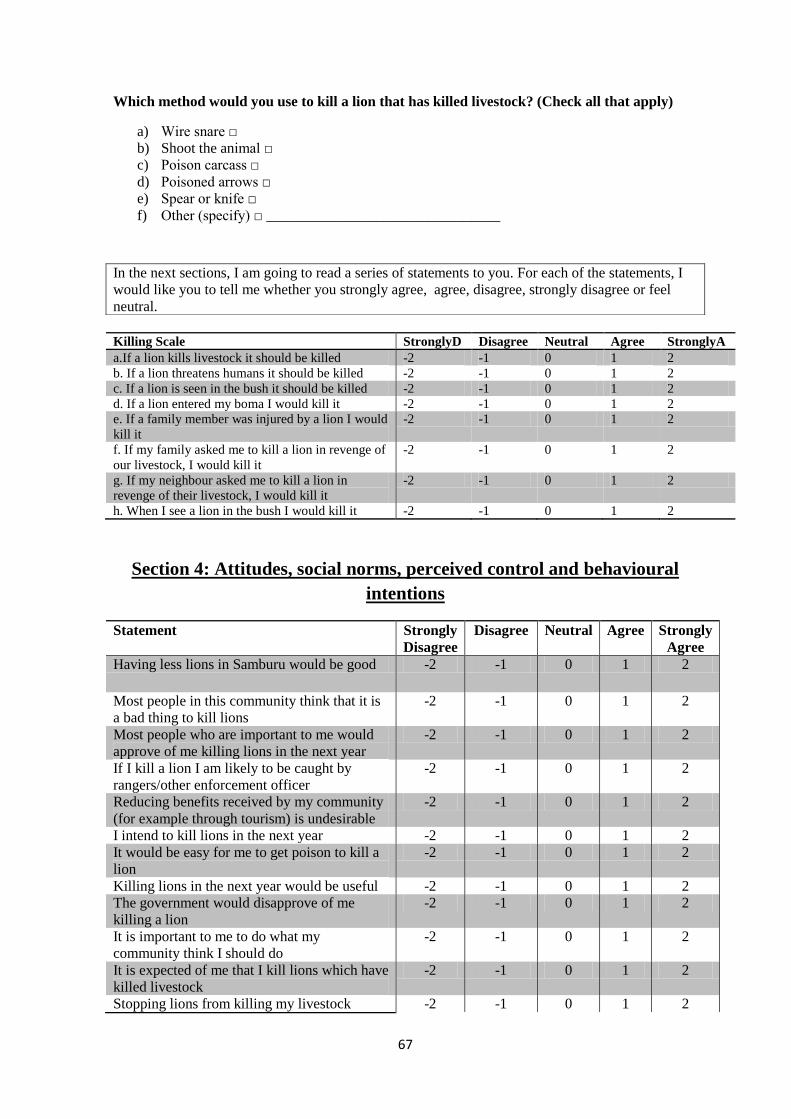
67
Which method would you use to kill a lion that has killed livestock? (Check all that apply)
a) Wire snare □
b) Shoot the animal □
c) Poison carcass □
d) Poisoned arrows □
e) Spear or knife □
f) Other (specify) □ ________________________________
Killing Scale StronglyD Disagree Neutral Agree StronglyA
a.If a lion kills livestock it should be killed -2 -1 0 1 2
b. If a lion threatens humans it should be killed -2 -1 0 1 2
c. If a lion is seen in the bush it should be killed -2 -1 0 1 2
d. If a lion entered my boma I would kill it -2 -1 0 1 2
e. If a family member was injured by a lion I would
kill it
-2 -1 0 1 2
f. If my family asked me to kill a lion in revenge of
our livestock, I would kill it
-2 -1 0 1 2
g. If my neighbour asked me to kill a lion in
revenge of their livestock, I would kill it
-2 -1 0 1 2
h. When I see a lion in the bush I would kill it -2 -1 0 1 2
Section 4: Attitudes, social norms, perceived control and behavioural
intentions
Statement Strongly
Disagree
Disagree Neutral
Agree Strongly
Agree
Having less lions in Samburu would be good -2 -1 0 1 2
Most people in this community think that it is
a bad thing to kill lions
-2 -1 0 1 2
Most people who are important to me would
approve of me killing lions in the next year
-2 -1 0 1 2
If I kill a lion I am likely to be caught by
rangers/other enforcement officer
-2 -1 0 1 2
Reducing benefits received by my community
(for example through tourism) is undesirable
-2 -1 0 1 2
I intend to kill lions in the next year -2 -1 0 1 2
It would be easy for me to get poison to kill a
lion
-2 -1 0 1 2
Killing lions in the next year would be useful -2 -1 0 1 2
The government would disapprove of me
killing a lion
-2 -1 0 1 2
It is important to me to do what my
community think I should do
-2 -1 0 1 2
It is expected of me that I kill lions which have
killed livestock
-2 -1 0 1 2
Stopping lions from killing my livestock -2 -1 0 1 2
In the next sections, I am going to read a series of statements to you. For each of the statements, I
would like you to tell me whether you strongly agree, agree, disagree, strongly disagree or feel
neutral.
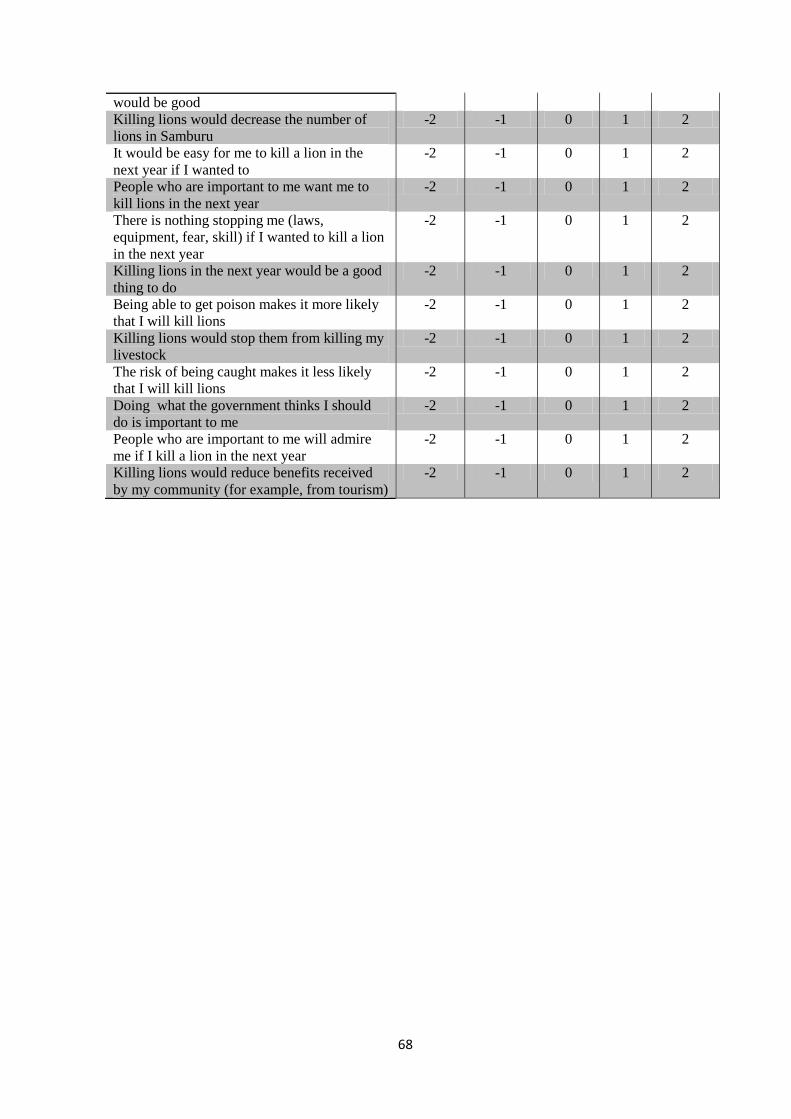
68
would be good
Killing lions would decrease the number of
lions in Samburu
-2 -1 0 1 2
It would be easy for me to kill a lion in the
next year if I wanted to
-2 -1 0 1 2
People who are important to me want me to
kill lions in the next year
-2 -1 0 1 2
There is nothing stopping me (laws,
equipment, fear, skill) if I wanted to kill a lion
in the next year
-2 -1 0 1 2
Killing lions in the next year would be a good
thing to do
-2 -1 0 1 2
Being able to get poison makes it more likely
that I will kill lions
-2 -1 0 1 2
Killing lions would stop them from killing my
livestock
-2 -1 0 1 2
The risk of being caught makes it less likely
that I will kill lions
-2 -1 0 1 2
Doing what the government thinks I should
do is important to me
-2 -1 0 1 2
People who are important to me will admire
me if I kill a lion in the next year
-2 -1 0 1 2
Killing lions would reduce benefits received
by my community (for example, from tourism)
-2 -1 0 1 2

69
Appendix 2: Laikipia Questionnaire (rescaled for thesis presentation)
Check if entered ______
Reference Number __ __ __ __ Date __ __/__ __ /__ __ Area Name ______________
Time Start: ________ am/pm Time End: ________ am/pm Interviewer: ___________
Comments:
I would like you to know that all the information you will provide today will be strictly
confidential. Your name and anything you mention will not be given to anyone outside our project.
If you would rather not answer a question please let me know. If there is any part of a question that
is difficult to understand please ask us to explain further. Please take your time to fully think about
your answers. The information you will provide today will be used to help find solutions to your
conflict problems. I thank you for taking the time to talk with me today!
Background Information
1. Interviewee ______________________
2. Community name: __________________________________
3. Age- group: a) Warrior b) Junior elder c) elder d) Woman
4. How long have you lived in this boma/worked on this ranch (number of
years)? _______
5. How many of the following do you currently have living with you?
(a) Adults_____(b) Children _____(c) Cattle ____ (e) Shoats ____(d) Donkeys____(e) Camels_____
6. Religious affiliation:
KAG Catholic ACK PCEA AIC None Other ____________(specify)
7. In one month, how many days to do you attend church (Sunday’s included)? ________/mth
8. Do you have other grazing grounds (communities only)? Yes No
9. If yes, where is your other grazing ground (communities only)?__________
10. Please outline what periods you were away over the following years: 2009 2010
2011
Laikipia Questionnaire
70
11. Do you leave any livestock/family at this boma when you leave for the other
grazing ground (communities only)? a) number of people left behind______b)
number of shoats left behind________c) number of cattle left behind______d) number of
donkeys left behind___________ e) number of camels left behind____________
Conflict questions
12. 14. How often do you lose livestock to carnivores? Cattle a)weekly b) monthly c) more than 3 times a year d) yearly e) never
Shoats a)weekly b) monthly c) more than 3 times a year d) yearly e) never
Donkeys a)weekly b) monthly c) more than 3 times a year d) yearly e) never
Camels a)weekly b) monthly c) more than 3 times a year d) yearly e) never
13. What carnivores cause the most problems (rank response)?
a) Cows: ___ Lion ___ Cheetah ___ Hyena ___Leopard ___ Other _____
b) Shoats: ___Lion ___ Cheetah ___ Hyena ___ Leopard ___Other _______
c) Donkeys: ___Lion ___ Cheetah ___ Hyena ___ Leopard ___Other _____
d) Camels: ___Lion ___ Cheetah ___ Hyena ___ Leopard ___Other ______
14. Do you think the lion population in this areas has: a) Increased b) Decreased
c) No change
15. If your livestock is killed by a predator what is your normal response (circle
response)? a) Report KWS Always Sometimes Never
b) Report to ranch owner Always Sometimes Never
c) Hunt/kill animal Always Sometimes Never
d) Poison animal Always Sometimes Never
e) Scare animal Always Sometimes Never
f) Change husb. techniques Always Sometimes Never
g) Leave area Always Sometimes Never
h) Do nothing Always Sometimes Never
i) Other Always Sometimes Never
16. Do you know anyone who has killed a lion in this area in the past 2 years?
Yes No
17. How many lions do you think are killed in this community/on this ranch every
year? _________/year

71
18. Killing Scale StrongD Disagree Neutral Agree StrongA
a. If a lion kills livestock it should be killed 0 1 2 3 4
b. If a lion threatens humans it should be killed 0 1 2 3 4
c. If a lion is seen in the bush it should be killed 0 1 2 3 4
d. If a lion entered my boma I would kill it 0 1 2 3 4
e. If a family member was injured by a lion I would kill it 0 1 2 3 4
f. If my family asked me to go kill a lion in revenge of 0 1 2 3 4
our cows, I would kill it
g. If my neighbour asked me to go kill a lion in revenge
of their cows, I would kill it 0 1 2 3 4
h. When I see a lion in the bush I would kill it 0 1 2 3 4
READ TRHOUGH QUESTIONNAIRE TO MAKE SURE EACH QUESTION WAS
ANSWERED
Initial after check________________ _____

72
Appendix 3: Participatory mapping exercise guidelines
Participatory Mapping Exercise.
Good morning/afternoon. My name is __________. I am conducting research on behalf of
Clio, a student from Italy. We would like you to contribute to Clio’s research by drawing a
map of the area where you live. With this map, we want to understand the movements of
people and livestock in Westgate/Nakuprat and we want to see where wildlife causes the
most problems. You can draw your map using the papers and any materials you prefer
from the ones provided. I am going to guide you during the process. Please let everyone
contribute and express their opinion.
1. Start: Draw your manyatta and your boma as an initial reference point. This is the
reference from which you can start to draw the rest of the features.
2. Place the main landmarks:
- Location of natural features: Rivers. Seasonal rivers (luggas). Hills. Water points
(natural dams).
- Location of man-made features: Other manyattas and bomas. Towns. Roads.
Agricultural areas. Water points (manmade dams, boreholes)
- Location of other important areas: For example, National Reserves, Conservation
Areas, other conservancies.
- Location of grazing grounds.
Write as many names of locations as possible.
3. Movements of people and livestock: Can you draw in the most accurate way the
movements of people from this community to other grazing grounds? You can do
this by drawing lines or arrows on the map.
4. Conflict hotspots: Which are the areas where you have most problems with lions
killing your livestock? Mark on the map the location of areas of major conflict with
lions.
5. Make the legend, so that we can identify all the different features later.
Is there anything you would like to add to the map? Is any information incomplete?
Thank you very much for your collaboration!
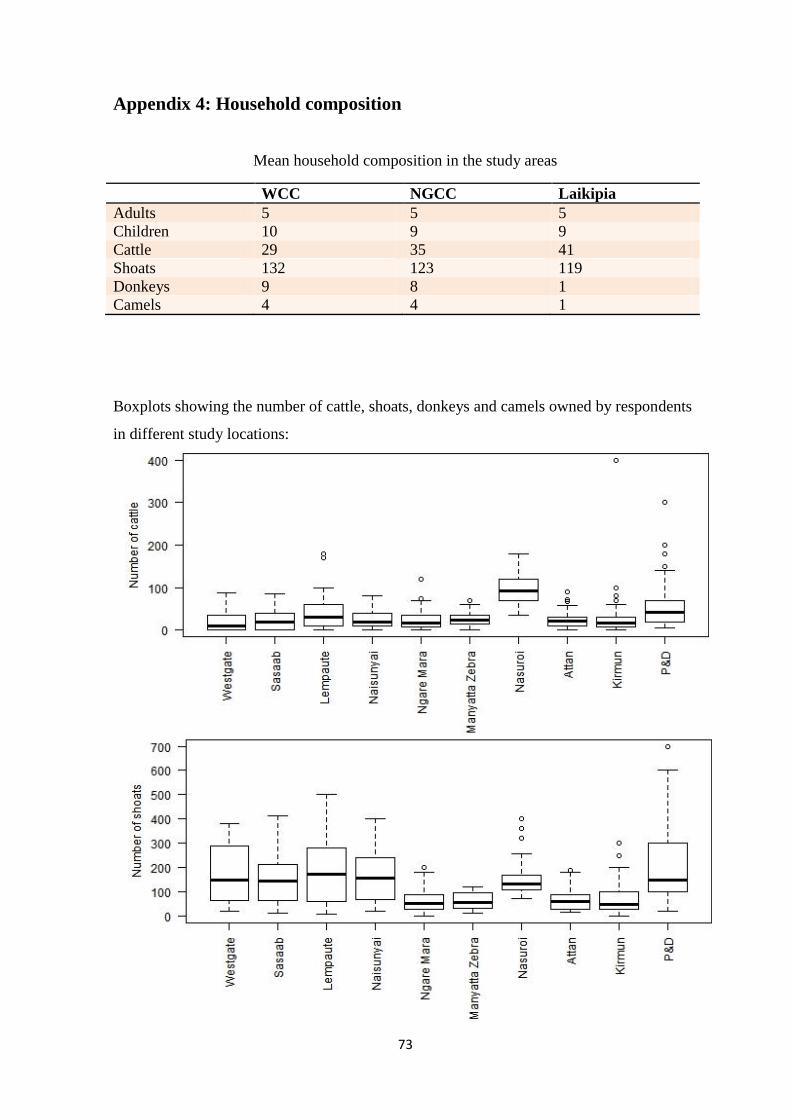
73
Appendix 4: Household composition
Mean household composition in the study areas
WCC NGCC Laikipia
Adults 5 5 5
Children 10 9 9
Cattle 29 35 41
Shoats 132 123 119
Donkeys 9 8 1
Camels 4 4 1
Boxplots showing the number of cattle, shoats, donkeys and camels owned by respondents
in different study locations:

74

75
Appendix 5: Problem predators in different study locations
Mean ranks for problem predators for cattle, shoats, donkeys and camels at all study locations. Lower
numbers represent higher rank scores:
Lion Cheetah Hyena Leopard Wild dog
Wes
tga
te Cattle 1.85 4.59 2.26 3.56 4.36
Shoats 2.00 3.12 1.46 1.73 2.78
Donkeys 1.87 4.68 1.85 3.37 4.36
Camels 1.90 4.68 2.56 3.56 4.51
Sa
saa
b
Cattle 4.02 3.72 1.18 1.88 4.18
Shoats 4.02 3.72 1.18 1.89 4.18
Donkeys 4.02 3.72 1.18 1.88 4.18
Camels 4.02 3.72 1.18 1.89 4.18
Lem
pa
ute
Cattle 4.08 3.71 1.13 1.90 4.17
Shoats 4.08 3.71 1.13 1.90 4.17
Donkeys 4.08 3.71 1.13 1.90 4.17
Camels 4.08 3.71 1.13 1.90 4.17
Nais
un
yai
Cattle 4.21 3.04 1.19 2.06 4.50
Shoats 4.21 3.04 1.20 2.04 4.50
Donkeys 4.22 3.04 1.17 2.04 4.50
Camels 4.21 3.04 1.20 2.02 4.50
Ngare
Mara
Cattle 2.71 3.89 1.92 2.47 4.18
Shoats 3.19 3.59 1.77 2.09 3.99
Donkeys 3.10 3.99 1.20 2.62 4.11
Camels 2.72 3.97 1.98 2.44 4.20
Man
yatt
a Z
ebra
Cattle 1.00 3.30 4.20 2.15 4.35
Shoats 2.95 2.72 3.58 1.85 3.93
Donkeys 2.68 3.63 1.33 3.03 4.30
Camels 1.00 3.20 4.18 2.33 4.25
Nasu
roi
Cattle 1.00 4.50 2.00 3.50 4.00
Shoats 1.00 5.00 3.00 2.50 3.50
Donkeys 2.00 5.00 1.00 3.50 3.50
Camels 1.00 5.00 3.00 3.50 3.00
Att
an
Cattle 1.00 3.19 4.31 2.38 4.13
Shoats 2.78 2.47 4.38 2.13 3.25
Donkeys 2.87 3.66 1.00 3.84 3.63
Camels 1.03 3.63 4.00 2.69 3.66
Kir
imu
n Cattle 1.29 3.00 1.72 2.67 NA
Shoats 2.98 3.04 1.14 2.36 3.17
Donkeys 1.50 NA 1.50 NA NA
Camels NA NA NA NA NA
P&
D Cattle 1.72 NA 1.48 1.60 NA
Shoats 3.2 2.14 1.06 2.29 1.5
Donkeys 1.5 NA 1.00 NA NA
Camels 2.00 NA 1.00 1.00 NA
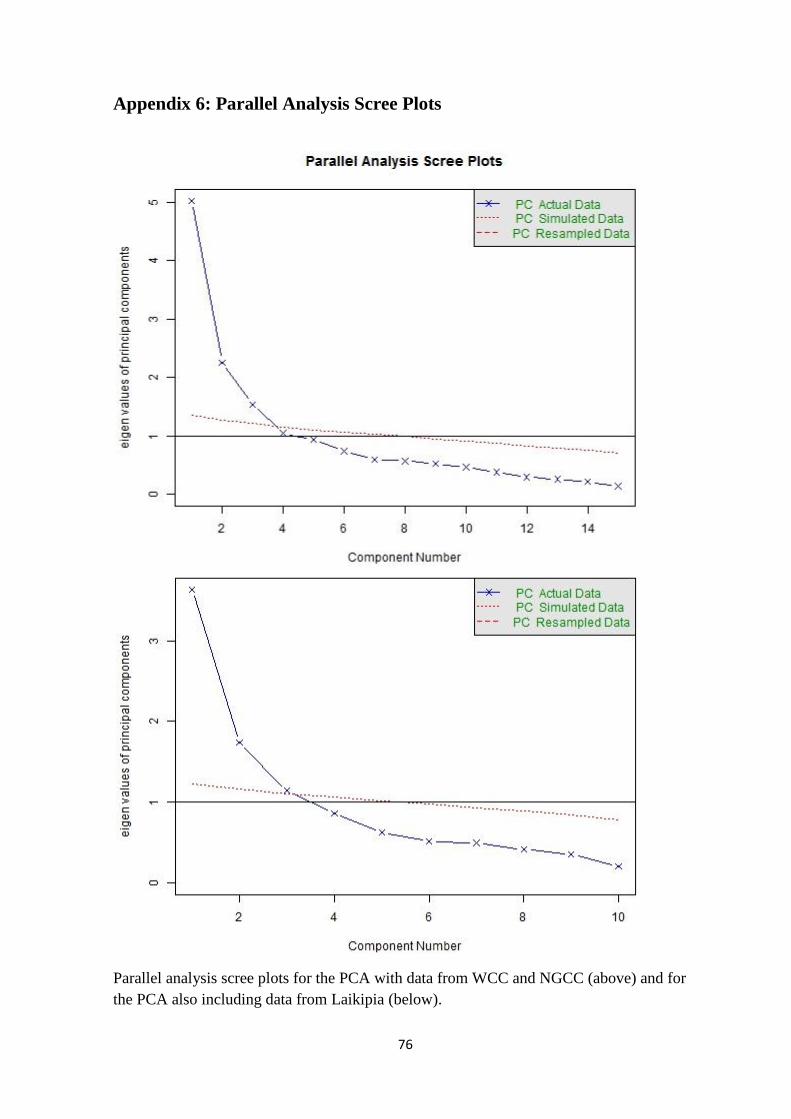
76
Appendix 6: Parallel Analysis Scree Plots
Parallel analysis scree plots for the PCA with data from WCC and NGCC (above) and for
the PCA also including data from Laikipia (below).

77
Appendix 7: Linear models with Area.
Linear model with RC1, RC2 and RC3 as response variables and area (study locations in
WCC and NGCC) as predictors:
Dependent variable:
RC1 RC2 RC3
Westgate -0.209 -0.821*** -0.143
(0.171) (0.163) (0.186)
Sasaab -0.752*** -0.766
*** 0.199
(0.156) (0.149) (0.170)
Lempaute -0.462*** -0.696
*** 0.507***
(0.145) (0.138) (0.157)
Naisunyai 0.202 -0.107 0.584***
(0.151) (0.144) (0.164)
Ngare Mara 0.505*** 0.625
*** 0.107
(0.143) (0.136) (0.155)
Manyatta Zebra -0.665*** 0.869
*** -0.311**
(0.137) (0.130) (0.149)
Nasuroi 0.873*** 0.436
*** -0.182
(0.134) (0.127) (0.145)
Attan 0.176 0.923*** -0.550
***
(0.137) (0.130) (0.149)
Observations 277 277 277
R2 0.303 0.433 0.144
Adjusted R2 0.283 0.417 0.118
Residual Std. Error (df = 269) 0.855 0.814 0.930
F Statistic (df = 8; 269) 14.641*** 25.723
*** 5.638***
Note: *p
**p
***p<0.01
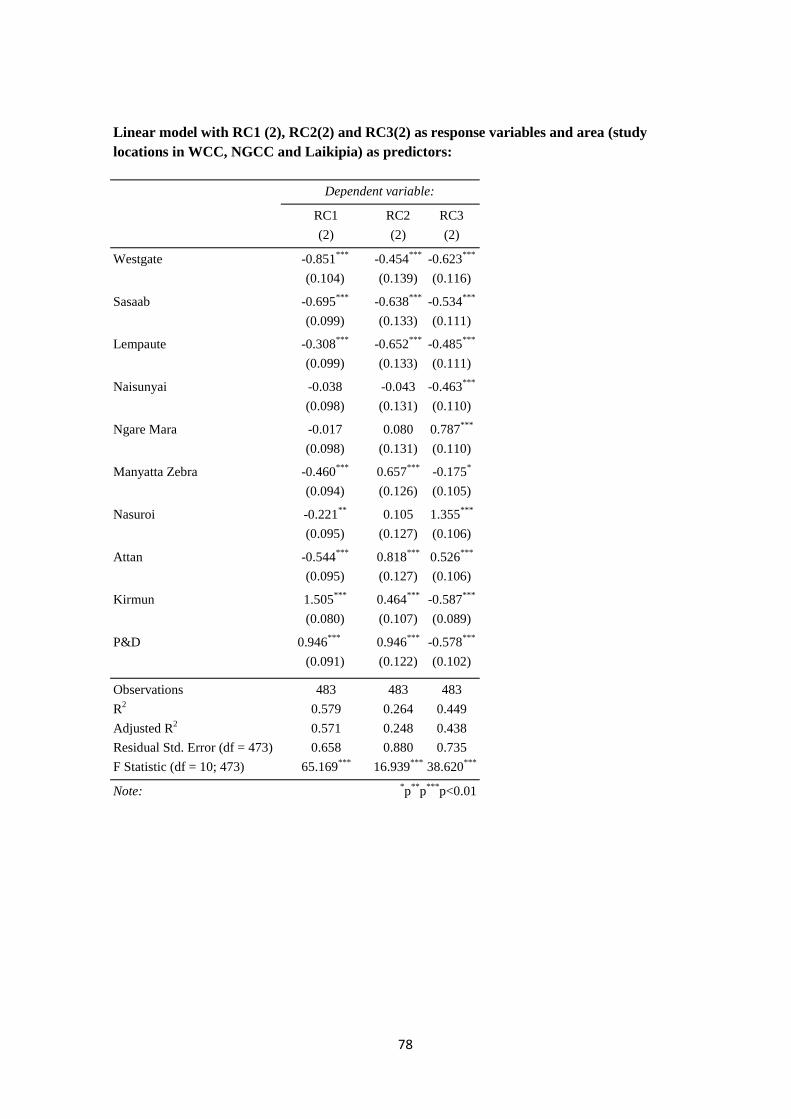
78
Linear model with RC1 (2), RC2(2) and RC3(2) as response variables and area (study
locations in WCC, NGCC and Laikipia) as predictors:
Dependent variable:
RC1 RC2 RC3
(2) (2) (2)
Westgate -0.851*** -0.454
*** -0.623***
(0.104) (0.139) (0.116)
Sasaab -0.695*** -0.638
*** -0.534***
(0.099) (0.133) (0.111)
Lempaute -0.308*** -0.652
*** -0.485***
(0.099) (0.133) (0.111)
Naisunyai -0.038 -0.043 -0.463***
(0.098) (0.131) (0.110)
Ngare Mara -0.017 0.080 0.787***
(0.098) (0.131) (0.110)
Manyatta Zebra -0.460*** 0.657
*** -0.175*
(0.094) (0.126) (0.105)
Nasuroi -0.221** 0.105 1.355
***
(0.095) (0.127) (0.106)
Attan -0.544*** 0.818
*** 0.526***
(0.095) (0.127) (0.106)
Kirmun 1.505*** 0.464
*** -0.587***
(0.080) (0.107) (0.089)
P&D 0.946*** 0.946
*** -0.578***
(0.091) (0.122) (0.102)
Observations 483 483 483
R2 0.579 0.264 0.449
Adjusted R2 0.571 0.248 0.438
Residual Std. Error (df = 473) 0.658 0.880 0.735
F Statistic (df = 10; 473) 65.169*** 16.939
*** 38.620***
Note: *p
**p
***p<0.01

79
Appendix 8: Linear models with socio-demographic variables
Linear model with RC1, RC2 and RC3 as response variables and socio-demographic
variables as predictors for the dataset excluding Laikipia:
Dependent variable:
RC1 RC2 RC3
Constant 0.949*** -0.521
** -0.625**
(0.265) (0.232) (0.271)
Camels owned 0.015***
(0.005)
Cattle owned
0.006***
(0.002)
Shoats owned
-0.002***
(0.001)
Age: Junior Elder
0.451**
(0.191)
Age: Warrior
-0.123
(0.121)
Adults in household
0.052**
(0.022)
Income: Livestock and other
-0.325**
(0.149)
Carnivores
0.170**
(0.072)
Lion population: Inc 0.235 0.163 -0.448***
(0.163) (0.162) (0.145)
Lion population: No change -0.332 0.535*** -0.190
(0.201) (0.205) (0.204)
Lion main predator: Cattle -0.251*** -0.450
***
(0.049) (0.069)
Cattle: more than 3times/yr -0.078
(0.175)
Cattle: never -0.814***
(0.299)
Cattle: weekly 0.022
(0.253)
Cattle: yearly -0.257**
(0.130)
Shoats: more than 3 times/yr -1.078***
0.026

80
(0.203)
(0.211)
Shoats: weekly 0.117
0.426***
(0.173)
(0.162)
Donkeys: more than 3 times/yr -0.305
(0.217)
Donkeys: never -1.238
(0.848)
Donkeys: weekly -0.388**
(0.151)
Donkeys: yearly -0.356**
(0.179)
Lion main predator: Shoats
0.209***
(0.058)
Lion main predator: Donkeys
0.223***
(0.072)
Camels: more than 3times/yr
0.592***
(0.220)
Camels: never
0.440**
(0.187)
Camels: weekly
0.988*
(0.568)
Camels: yearly
0.304**
(0.142)
Observations 277 277 277
R2 0.418 0.488 0.173
Adjusted R2 0.387 0.467 0.146
Residual Std. Error 0.792 (df = 262) 0.772 (df = 265) 0.917 (df = 267)
F Statistic 13.444***
(df = 14; 262) 22.995***
(df = 11; 265) 6.227***
(df = 9; 267)
Note: *p
**p
***p<0.01

81
Linear model with RC1 (2), RC2(2) and RC3(2) as response variables and socio-demographic
variables as predictors for the dataset including Laikipia:
Dependent variable:
RC1 RC2 RC3
(2) (2) (2)
Constant -0.822*** -0.087 0.536
***
(0.127) (0.187) (0.117)
Cattle owned 0.004***
0.011
***
(0.001)
(0.001)
Shoats owned
-0.001***
(0.0005)
Lion main predator Cattle -0.116*** -0.272
***
(0.045) (0.054)
Donkeys owned
-0.034***
(0.008)
Lion main predator Shoats 0.149***
0.087
**
(0.040)
(0.044)
Shoats: more than 3 times/yr -0.069
(0.139)
Shoats: never 0.070
(0.303)
Shoats: weekly 0.414***
(0.108)
Shoats: yearly -0.403
(0.500)
Lion main predator Donkeys
0.240***
(0.055)
Donkeys: more than 3times/yr 0.153 -0.010
(0.165) (0.193)
Donkeys: never 1.724*** 2.116
***
(0.134) (0.545)
Donkeys: weekly -0.197* -0.161
(0.113) (0.119)
Donkeys: yearly -0.025 0.637***
(0.132) (0.143)
Camels: more than 3 times/yr
0.514***
(0.193)
Camels: never
0.047
(0.162)
Camels: weekly
1.173**
(0.545)
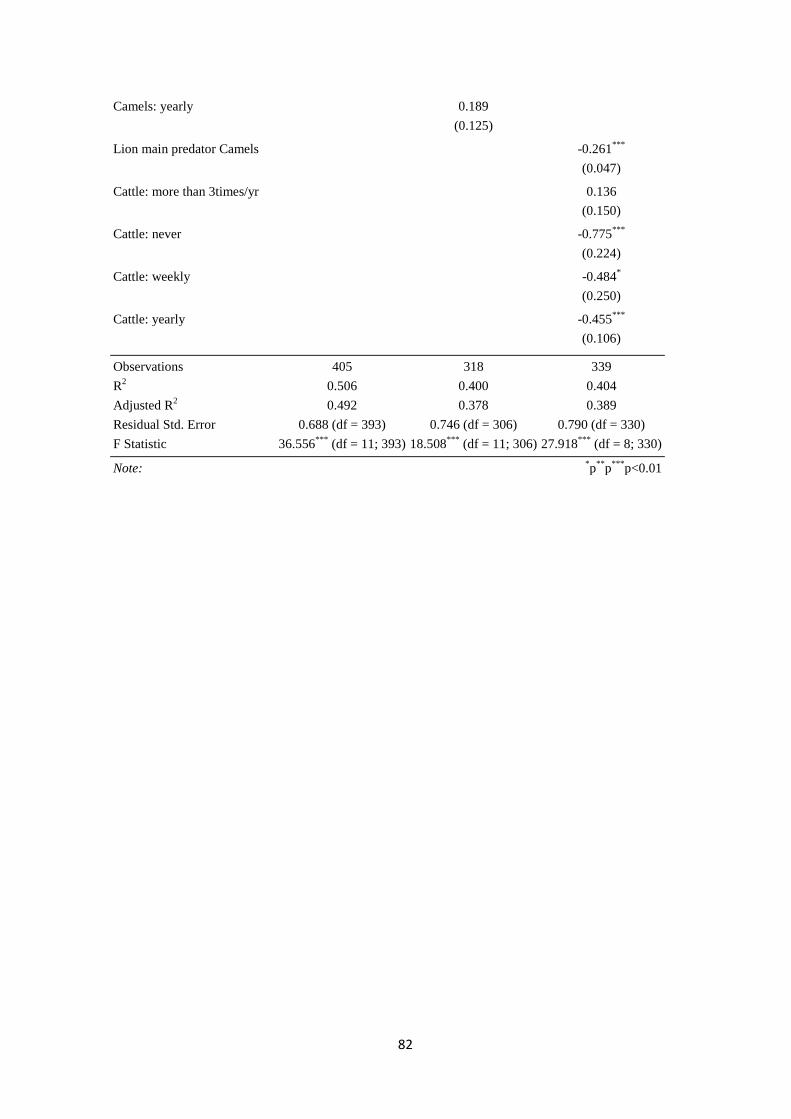
82
Camels: yearly
0.189
(0.125)
Lion main predator Camels
-0.261***
(0.047)
Cattle: more than 3times/yr
0.136
(0.150)
Cattle: never
-0.775***
(0.224)
Cattle: weekly
-0.484*
(0.250)
Cattle: yearly
-0.455***
(0.106)
Observations 405 318 339
R2 0.506 0.400 0.404
Adjusted R2 0.492 0.378 0.389
Residual Std. Error 0.688 (df = 393) 0.746 (df = 306) 0.790 (df = 330)
F Statistic 36.556***
(df = 11; 393) 18.508***
(df = 11; 306) 27.918***
(df = 8; 330)
Note: *p
**p
***p<0.01

83
Appendix 9: Linear models with Theory of Planned Behaviour constructs
Linear model with RC1 (2), RC2(2) and RC3(2) as response variables and TPB constructs as
predictors:
Dependent variable:
RC1 RC2 RC3
Constant 0.300***
1.042***
0.063
(0.078) (0.134) (0.137)
Subjective norm: Most people who are important to me
would approve of me killing lions in the next year 0.225
***
(0.052)
Subjective norm: It is expected of me that I kill lions which
have killed livestock -0.100
**
0.199
***
(0.047)
(0.047)
Attitude: Killing lions in the next year would be useful
0.390***
-0.251***
(0.064) (0.066)
Subjective norm: People who are important to me want me to
kill lions in the next year 0.142
** 0.196
***
(0.068) (0.073)
Subjective norm: People who are important to me will
admire me if I kill a lion in the next year 0.130
***
(0.050)
Behavioural control: It would be easy for me to kill a lion in
the next year if I wanted to 0.117
**
(0.058)
Behavioural control:There is nothing stopping me (laws,
equipment, fear, skill) if I wanted to kill a lion in the next
year
0.225***
0.177***
-0.118***
(0.038) (0.037) (0.044)
Observations 302 302 302
R2 0.185 0.245 0.164
Adjusted R2 0.177 0.235 0.150
Residual Std. Error 0.918 (df =
298)
0.881 (df =
297)
0.908 (df =
296)
F Statistic 22.541
*** (df =
3; 298)
24.144***
(df =
4; 297)
11.650***
(df =
5; 296)
Note: *p
**p
***p<0.01

84
Appendix 10: Participatory maps (examples)
Map produced by Warriors in Naisunyai.

85
Map produced by women in Lempaute

86
Map produced by elders in Sasaab
Map produced by elders, warriors and women in Ngare Mara.

87
Appendix 11: Risk maps including livestock movements
Map of Westgate Community Conservancy (above) with livestock movements indicated by
the arrows.

88
Map of Nakuprat-Gotu Community Conservancy with livestock movements indicated by
the arrows.

![Untitled-1 [] · CHOCOMILO; Bouillon - MAGGI CUBE, MAGGI CHICKEN, MAGGI CRAYFISH, MAGGI MIX'PY; and table water ... and marketing company](https://img.dokumen.tips/doc/110x75/5aedc9577f8b9a6625906f43/untitled-1-bouillon-maggi-cube-maggi-chicken-maggi-crayfish-maggi-mixpy.jpg)