Embed Size (px)
Citation preview

RESEARCH Open Access
Assessing intake and consumption level ofspices among urban and rural householdsof Ludhiana district of Punjab, IndiaSimranpreet Kaur Bhathal1* , Harpreet Kaur1, Kiran Bains1 and Amrit Kaur Mahal2
Abstract
Background: Spices are the esoteric food adjuncts that are used for enhancing the sensory quality of the food inPunjabi diets and add many health benefits. Estimating the intake of spices at the individual level is a challengingtask as they are consumed in very small quantities as compared to other foods. The present study aimed to assessthe intake and spices consumption level of spices among urban and rural households.
Methods: A study was carried out among 100 households each from urban and rural areas from Ludhiana districtof Punjab, India to collect the information regarding frequency of spice usage and portion sizes using aquestionnaire. The information pertaining to sociodemographic characteristics of female respondents from urbanand rural households were also collected. The commonly used 25 spices in Punjabi diets were selected to assesstheir dietary intake at the individual level among households.
Results: Spice consumption frequency was more in urban households in comparison to rural households. Themaximum mean consumption frequency score among urban and rural households was observed for red chillipowder (5.00) and turmeric powder (5.00). Maximum percentage (76 and 72%) of urban and rural householdspreferred to use the unroasted form of spices, respectively. The highest mean intake and range was observed forred chilli powder (3.19 g with range 0.35–5.23 g) among urban women and (2.41 g with range 0.25–3.75 g) for ruralwomen. Spice intake from individual dishes showed the maximum number of portion sizes for red chilli powderthat were from vegetable>dhal > curry preparations among urban and dhal > vegetable>curry preparation amongrural households. Average amount of spices consumed by urban adult women was 10.04 g per day which washigher as compared to spices consumed by rural adult women per day (7.68 g).
Conclusions: The study concluded that the urban households showed higher consumption of spices as comparedto rural households thus assessing the quantifying intake of spices. Urban adult women consumed more spices perday as compared to rural women. Therefore, more encouragement for increased use of spices is required to reapvarious health benefits of spices in combating metabolic disorders.
Keywords: Spices, Consumption, Frequency, Intake, Portion size
© The Author(s). 2020 Open Access This article is licensed under a Creative Commons Attribution 4.0 International License,which permits use, sharing, adaptation, distribution and reproduction in any medium or format, as long as you giveappropriate credit to the original author(s) and the source, provide a link to the Creative Commons licence, and indicate ifchanges were made. The images or other third party material in this article are included in the article's Creative Commonslicence, unless indicated otherwise in a credit line to the material. If material is not included in the article's Creative Commonslicence and your intended use is not permitted by statutory regulation or exceeds the permitted use, you will need to obtainpermission directly from the copyright holder. To view a copy of this licence, visit http://creativecommons.org/licenses/by/4.0/.The Creative Commons Public Domain Dedication waiver (http://creativecommons.org/publicdomain/zero/1.0/) applies to thedata made available in this article, unless otherwise stated in a credit line to the data.
* Correspondence: [email protected] of Food and Nutrition, Punjab Agricultural University, Ludhiana,Punjab, IndiaFull list of author information is available at the end of the article
Bhathal et al. Nutrition Journal (2020) 19:121 https://doi.org/10.1186/s12937-020-00639-4

BackgroundIn the culinary arts, spices are the esoteric food adjunctsthat are used for enhancing the sensory quality of thefood. The leaf or the herbaceous part of a fresh plantused for flavoring the food preparation is often referredto as a culinary herb where as, any dried part of theplant is known as a spice [1]. Thus, spices can be thebud (cloves), the stigma of flower (saffron), root (driedginger), aromatic seeds (cumin seeds), berries (pepper-corn), bark (cinnamon), etc. Spices have been effectivelyused in the indigenous systems of medicine in manycountries. Due to the redox properties and capacity toblock the production of reactive oxygen species, phen-olic compounds present in herbs, spices, some fruits andvegetables are being closely associated with their antioxi-dant activity. Many of the effective antioxidant com-pounds present that can be derived from spices are ofgreat interest to clinicians as well as biologists due totheir ability to protect the human body against variousinflammatory processes and oxidative stress [2]. In contextto spices which are consumed in very small quantities andare considered as a good source of antioxidants contributeto the total antioxidant activity of the whole meal. Further-more, being the source of antioxidants, spices also warrantfurther attention to deal with age-related degenerative dis-orders and several metabolic diseases [3]. India is an idealsetting to evaluate the consumption of these food items asthey are key components of traditional diets. A few smallstudies in India have assessed these foods but have gener-ally been limited by querying a small number of food itemsor utilizing methods that may not be practical in largepopulation-based studies [4–6]. Spice intake determinationis being acknowledged as they possess bioactive compoundsand antioxidant properties. At an individual level, spice in-take measurement is a tough and challenging task than esti-mating the intake of staple foods like cereals and otherfoods that are consumed in large quantities daily. Theworld in recent years has witnessed many changes in termsof economy, culture and social life of the people, differentdemographics, productivity changes, changes in the prefer-ences of domestic consumers for food items, changes inconsumption, social factors and globalization. This has ledto a change in the food habits of the people, ultimatelyaffecting the spice consumption.In the present study, an attempt was made to assess the
intake and consumption level of spices among adultwomen of urban and rural households based on the fre-quency of spice usage and portion size of spice consumed.
MethodsSelection of households and spicesThe study population consisted of selected 100 urbanand 100 rural households in different areas of Ludhianadistrict of Punjab, India. The households belonged to
different socioeconomic groups and to different reli-gions. One day intake was noted from adult womenfrom urban and rural households. The commonly used25 spices in Punjabi diets, were selected to assess theirdietary intake among households. Standard householdmeasuring spoons that measure 1 teaspoon, 1/2 tea-spoon and 1/4th teaspoon were used to standardize theweight of each selected whole or powdered form ofspices as most of them are used in small quantities. Fur-ther, some of the spices used in a minute quantity wereverified with an electronic balance.
Development of questionnaire and data collectionAn interview schedule cum questionnaire was developedto elicit the information pertaining to the sociodemo-graphic characteristics, the pattern of spice use andintake, frequency of usage, the quantity of spices in rou-tine dishes in each household. The questionnaire waspretested in ten households and was found satisfactoryfor collecting the required information. The final ques-tionnaire was prepared by undertaking a pilot study in-volving suitable urban and rural female respondents toensure the validity of the questionnaire which was ex-cluded from the final sample. The required data werecollected using a pre-structured non-disguised question-naire cum interview schedule from female respondentsin the households, who were involved in a cooking activ-ity to elicit information regarding the spice consumptionas described in the questionnaire. An individual if doesnot cook most of their own food, they may not know allthe food items contained in mixed dishes, therefore thefood preparer was selected to provide information onitems that added during cooking.
Consumption frequency and spice intakeSpice intake pattern in urban and rural households wasassessed based on the spice usage in the householdswhich include the information regarding the type ofspice used, intake and frequency of usage with optionsof ‘daily’, ‘twice’ or ‘thrice’ a week, weekly and occasion-ally options as described in the questionnaire. For theeasy identification of various spices, common nameswere also mentioned in the questionnaire. Mean con-sumption frequency scores were also calculated by givingscores: daily (5), thrice a week (4), twice a week (3),weekly (2) and occasionally (1). For the spice intake, thedetailed recipe was noted regarding the type and quan-tity of different spices added to routine dishes. The mostfrequently used spices in these dishes were identified bythe number of households using them. For each mealconsumed by responding women herself, name of thedishes and portion size of spices in individual disheswere elicited using a 24-h recall method. To calculatethe portion size of the added spice consumed, the
Bhathal et al. Nutrition Journal (2020) 19:121 Page 2 of 12

quantity of prepared dish consumed by an individualand number of portions obtained from that quantity wasnoted. One day 24-h recall method determined thequantity of spice intake by an individual based on thespice intake per portion size consumed from all dishesin 1 day. Spice intake per portion size of each individualdish consumed like dhal, vegetable and curry were alsonoted separately from adult women of urban and ruralhouseholds.
Statistical analysisThe intake of individual spices was presented as frequencyintake. The quantity of spices intake was expressed asmean ± standard deviation (S.D), median, 90th percentileand ranges. Statistically, results were analyzed using Chi-square test of independence of attributes. Wilcoxon-Mann-Whitney test was used to compare the mean consumptionfrequency of spices among the adult women of urban andrural households. Results were considered statistically sig-nificant at p < 0.01, p < 0.05. For the analysis of data SPSS(Statistical Package for the Social Sciences) and SAS (Statis-tical Analysis System) were used.
ResultsIn recent times, consumption frequency and measure-ment of dietary intake of spices is gaining much signifi-cance due to various phytochemicals and presence ofantioxidant potential in spices that have been recognizedto have health-promoting benefits and protective roleagainst chronic diseases.
Sociodemographic characteristics of female respondentsfrom urban and rural householdsThe sociodemographic characteristics of female respon-dents from urban and rural households is given in Table 1.All the selected respondents were female who performedthe cooking activities in the households. The majority ofthe urban (67%) and rural (56%) respondents belong to40–60 years age group. It was observed that 53 and 15% ofrespondents were postgraduate in urban and rural areas,respectively. Further, majority of rural respondents (43%)studied up to the secondary level and only 19% weregraduate. While in urban areas, 33% of respondents weregraduate, 10% studied up to the secondary level and theremaining 4% studied up to the primary level of education.The majority of rural respondents (57%) were home-makers and urban households (68%) were involved in ser-vice. Sixty-five percent of urban respondents belonged tonuclear families whereas, 71% of rural respondentsbelonged to the joint families. It was observed that 62% ofurban respondents were in the category of up to 4 mem-bers in the family whereas 53% of rural respondents fall inthe category of 4–7 members in a family. Fifty-eight per-cent of rural respondents reported their monthly family
income below Rs 50,000 while 55% of urban respondentshad their monthly family income between Rs 50,000 to Rs1,00,000.
Consumption frequency of spicesThe consumption frequency of spices among urbanand rural households is shown in Table 2. A spice in-take survey among urban households showed that allthe urban households consumed red chilli powderand turmeric powder daily. Spices consumed by morethan 90% of urban households were cumin seeds(99%), green cardamom (94%), asafoetida, fennel seedsand carom seeds, black pepper (93% each) and cori-ander seeds (91%). Consumption frequency of dill,saffron, mace, nigella seeds, nutmeg, mace and staranise were found to be lower, less than 50% of urbanhouseholds consumed these spices. The least con-sumed spice was star anise as 30% of urban house-holds preferred to consume this on an occasionalbasis. Contrarily among rural households, red chillipowder and turmeric powder were consumed by allthe households and only 13% of households con-sumed star anise which was least consumed among
Table 1 Sociodemographic characteristics of femalerespondents from urban and rural households
Particulars Urban (n = 100) Rural (n = 100)
Age (years)
25–39 33 44
40–60 67 56
Education level
Primary 4 23
Secondary 10 43
Graduate 33 19
Postgraduate 53 15
Occupation
Service 68 35
Homemaker 19 57
Business 13 8
Type of family
Nuclear 65 29
Joint 35 71
Family size (members)
Upto 4 62 25
4–7 34 53
> 7 4 22
Family income (Rs/month)
> 1,00,000 8 4
50,000-1,00,000 55 38
< 50,000 37 58
Bhathal et al. Nutrition Journal (2020) 19:121 Page 3 of 12

Table
2Con
sumptionfre
quen
cyof
spices
amon
gurbanandruralh
ouseho
lds
SPICES
FREQ
UEN
CY
No.
ofHou
seho
lds
URB
AN(n
=10
0)No.
ofHou
seho
lds
RURA
L(n=10
0)
Daily
Days/Wee
kWee
kly
Occasio-nally
Daily
Days/Wee
kWee
kly
Occasi-o
nally
pvalue
Thrice
Twice
Thrice
Twice
Redchillip
owde
r100
100
00
00
100
100
00
00
–
Turm
ericpo
wde
r100
100
00
00
100
100
00
00
–
Cum
inseed
s99
7818
11
197
5616
813
40.003
Green
cardam
om94
4019
918
891
3413
2010
100.0593
Asafoetida
9438
2411
912
9113
1121
1431
<0.001
Fenn
elseed
s94
3411
2512
1290
2712
1317
200.1177
Carom
seed
s94
3130
198
689
3221
1513
100.374
Blackpe
pper
9334
2812
136
8830
106
2718
0.0002
Coriand
erseed
s91
1918
2518
1187
159
3015
190.179
BlackSalt
8724
1814
1813
7320
1022
95
0.0826
Cinnamon
841
1927
1522
704
27
2327
<0.0001
Dry
mango
powde
r81
615
1521
2470
26
2517
23<0.0001
Fenu
greekseed
s79
314
1624
2269
03
1921
270.0317
Mustard
Seed
s75
57
1626
2166
02
1422
320.0347
Pomeg
ranate
seed
s74
012
1416
3263
01
1012
460.0049
Cloves
710
36
2933
630
26
2233
0.876
Blackcardam
om70
03
625
3652
01
415
300.766
BayLeaf
660
515
1036
500
16
736
0.176
Goo
sebe
rrypo
wde
r60
219
105
2450
01
110
40<0.0001
Saffron
550
63
2026
390
06
528
0.003
Nigellaseed
s42
03
416
1928
00
11
220.002
Nutmeg
370
24
427
250
01
225
0.339
Mace
350
56
420
240
00
718
0.014
Dill
330
24
720
230
00
122
0.028
Star
Anise
300
05
520
130
00
112
0.174
Statistical
Test
performed
on5catego
ries(Daily,twiceaweek,thriceaweek,weeklyan
doccasion
ally):TTest,statistically
sign
ificancedifferen
ce(p
value<0.05
)
Bhathal et al. Nutrition Journal (2020) 19:121 Page 4 of 12

all 25 spices studied. Among rural households, thetop six most frequently consumed spices (higher cat-egory) were red chilli powder and turmeric powderconsumed on daily basis by households followed bycumin seeds (97%), carom seeds (91%), black pepper(91%), asafoetida (90%). Further, intermediate spiceconsumption frequency ranged between 89 and 63%of households consuming fennel seeds, corianderseeds, green cardamom, dry mango powder, mustardseeds, fenugreek seeds, pomegranate seeds, black salt,cinnamon and cloves. Spices consumed on a weeklyor on occasional basis were gooseberry powder, bayleaf, black cardamom, saffron, nutmeg, mace, nigellaseeds, dill and star anise contributing less than 50%of adult women in rural households consuming thesespices.
Mean consumption frequency score among householdsThe mean consumption frequency score of major spiceshas been depicted in Table 3. The maximum mean con-sumption frequency score among urban and ruralhouseholds was observed for red chilli powder (5.00)and turmeric powder (5.00). The lowest scores were ob-tained by star anise 0.45 and 0.14 among urban andrural households, respectively. The consumption fre-quency score revealed that spice consumption was sig-nificantly (p < 0.01) higher among urban households forcumin seeds, asafoetida, black pepper, gooseberry pow-der, mustard seeds, pomegranate seeds, dill, nigella, cin-namon and saffron when compared to rural households.The mean frequency score of bay leaf, black salt, blackcardamom, carom seeds, green cardamom, fennel seeds,coriander seeds, dry mango powder and clove showednon-significant difference among the adult women ofurban and rural households.
Usage form of spices by rural and urban householdsThe form of spices used among households is presentedin the Table 4. Results depicted that the spices namelynigella seeds, mace, nutmeg, fennel seeds, star anise andgreen cardamom were used in their unroasted form bythe majority of urban and rural households. A significantdifference (p < 0.05) was found in using a different formof spices namely green cardamom, black pepper, asafoe-tida, cinnamon, fenugreek seeds, coriander seeds, bayleaf, clove, carom seeds and black cardamom amongurban and rural households. The overall result, itshowed that a maximum of 76% of urban and 72% ofrural households preferred to use the unroasted form ofspices followed by 19% of urban and 21% of rural house-holds using roasted form of spices and remaining usingboth roasted and unroasted form of spices.
Spice intake by adult women among urban and ruralhouseholdsSpice intake among adult women based on the portionsize and quantity of individual spice consumed from alldishes and foods expressed as mean, median, 90th per-centile levels and ranges are presented in Table 5. Themean intakes among urban women above 0.18 g/portionsize were observed for red chilli powder, turmeric pow-der, black salt, fennel seeds, cumin seeds, asafoetida,black pepper, green cardamom and for red chilli powder,turmeric powder, cumin seeds, asafoetida, black pepper,carom seeds, fennel seeds, green cardamom, and mus-tard seeds were observed among rural women. The high-est mean intake and range was observed for red chillipowder (3.19 g with range 0.35–5.23 g, respectively) forurban women and (2.41 g with range 0.25–3.75 g,
Table 3 Mean consumption frequency score of major spicesconsumed by urban and rural households
Spices Consumption Frequency Score p-value
Urban (n = 100) Rural (n = 100)
Red chilli powder 5.00 ± 0.00 5.00 ± 0.00 –
Turmeric powder 5.00 ± 0.00 5.00 ± 0.00 –
Cumin seeds 4.68 ± 0.78 3.98 ± 1.42 0.00010
Carom seeds 3.54 ± 1.45 3.25 ± 1.67 0.24509
Asafoetida 3.49 ± 1.62 2.32 ± 1.56 < 0.00001
Black Pepper 3.48 ± 1.54 2.80 ± 1.75 0.00397
Green cardamom 3.44 ± 1.65 3.12 ± 1.78 0.2877
Fennel seeds 3.25 ± 1.60 2.82 ± 1.79 0.10748
Black Salt 3.05 ± 1.74 2.29 ± 1.94 0.38208
Coriander seeds 2.88 ± 1.53 2.50 ± 1.56 0.05155
Cinnamon 2.42 ± 1.74 1.22 ± 1.29 0.00007
Dry mango powder 2.01 ± 1.52 1.65 ± 1.37 0.18406
Fenugreek seeds 1.87 ± 1.39 1.38 ± 1.18 0.02018
Mustard seeds 1.74 ± 1.43 1.26 ± 1.09 0.00402
Gooseberry powder 1.55 ± 1.71 0.67 ± 0.77 < 0.00001
Pomegranate seeds 1.54 ± 1.33 1.04 ± 0.96 0.00071
Cloves 1.21 ± 1.02 1.03 ± 1.00 0.27759
Bay Leaf 1.21 ± 1.20 0.76 ± 1.00 0.32275
Black cardamom 1.18 ± 1.01 0.76 ± 0.92 0.15865
Saffron 0.99 ± 1.15 0.56 ± 0.84 0.00786
Nigella seeds 0.75 ± 1.05 0.26 ± 0.48 0.00009
Mace 0.66 ± 1.13 0.32 ± 0.60 0.03593
Nutmeg 0.55 ± 0.90 0.32 ± 0.56 0.04551
Dill 0.54 ± 0.93 0.24 ± 0.45 0.00144
Star Anise 0.45 ± 0.80 0.14 ± 0.37 0.03514
Mean ± SD, Mean consumption frequency scores calculated: daily (5), thrice aweek (4), twice a week (3), weekly (2) and occasionally (1). Wilcoxon-Mann-Whitney test, statistically significance difference (p value < 0.05)
Bhathal et al. Nutrition Journal (2020) 19:121 Page 5 of 12

Table 4 Usage form of spices by urban and rural householdsSpices Urban Rural p value
Unroasted Roasted Both Unroasted Roasted Both
Nigella seeds 97 3 0 89 10 1 0.077
Mace 96 3 1 97 2 1 0.902
Nutmeg 96 4 0 88 11 1 0.099
Fennel seeds 95 5 0 89 10 1 0.239
Star Anise 93 7 0 97 2 1 0.145
Green cardamom 90 10 0 97 2 1 0.037
Black Pepper 87 13 0 66 27 7 0.003
Asafoetida 86 9 5 65 34 1 < 0.001
Pomegranate seeds 84 16 0 92 7 1 0.086
Cinnamon 82 16 2 54 34 12 < 0.001
Fenugreek seeds 79 19 2 65 26 9 0.031
Mustard Seeds 72 27 1 82 17 1 0.232
Coriander seeds 70 29 1 62 25 13 0.004
Bay Leaf 68 32 0 81 18 1 0.048
Cloves 51 40 9 40 36 24 0.015
Carom seeds 41 37 22 58 41 1 < 0.001
Cumin seeds 41 37 22 27 39 34 0.286
Black cardamom 32 35 33 50 37 13 0.001
Total 1360 342 98 1299 378 123
Statistical Test: T Test, statistically significance difference (p value < 0.05)
Table 5 Daily intake of spices by adult women of selected urban and rural households
Spice Mean (g) p-value Range (g) Median (g) 90th percentile
Urban Rural Urban Rural Urban Rural Urban Rural
Red chilli powder 3.19 ± 1.26 2.41 ± 0.83 < 0.00001 0.35–5.23 0.25–3.75 2.04 1.20 4.41 2.71
Turmeric powder 2.98 ± 0.90 2.80 ± 1.2 0.09 0.63–4.23 0.28–5.20 1.89 1.55 3.32 3.23
Cumin seeds 0.74 ± 0.79 0.43 ± 0.50 0.0007 0.07–2.71 0.01–1.98 0.83 0.61 2.33 1.30
Black pepper 0.67 ± 1.10 0.27 ± 0.58 0.0008 0.04–4.25 0.03–4.25 1.25 0.19 1.25 2.50
Fennel seeds 0.66 ± 0.99 0.29 ± 0.71 0.0018 0.06–5.00 0.02–5.00 1.25 0.20 1.87 2.50
Green cardamom 0.36 ± 0.38 0.22 ± 0.42 0.0779 0.06–1.63 0.02–2.02 0.44 0.17 1.25 0.94
Black salt 0.25 ± 0.55 0.12 ± 0.31 0.0205 0.25–2.50 0.06–1.25 1.25 0.87 1.37 2.50
Asafoetida 0.24 ± 0.36 0.27 ± 0.44 0.3021 0.18–1.66 0.06–1.96 0.41 0.63 1.50 1.25
Coriander seeds 0.17 ± 0.34 0.11 ± 0.25 0.1017 0.04–1.66 0.01–1.30 0.25 0.12 0.85 0.80
Carom seeds 0.16 ± 0.29 0.20 ± 0.33 0.1905 0.18–1.56 0.06–1.23 0.42 0.44 1.06 0.83
Gooseberry powder 0.16 ± 0.41 0.02 ± 0.08 0.0004 0.02–0.98 0.03–0.71 0.36 0.11 0.66 0.97
Dry pomegranate 0.10 ± 0.34 0.03 ± 0.13 0.2490 0.01–0.90 0.06–0.98 0.12 0.25 0.94 0.86
Mustard seeds 0.08 ± 0.19 0.20 ± 0.36 0.0018 0.11–0.83 0.04–1.85 0.33 0.42 1.24 0.83
Clove 0.07 ± 0.18 0.07 ± 0.15 0.4721 0.03–0.83 0.03–0.78 0.07 0.10 0.63 0.80
Dry mango powder 0.06 ± 0.14 0.08 ± 0.33 0.2490 0.21–0.63 0.20–1.98 0.31 0.60 0.98 0.63
Black cardamom 0.06 ± 0.15 0.07 ± 0.16 0.4170 0.06–0.89 0.01–0.89 0.23 0.08 0.57 0.58
Fenugreek seeds 0.05 ± 0.15 0.03 ± 0.13 0.1264 0.08–0.89 0.04–0.98 0.22 0.06 0.92 0.84
Cinnamon 0.04 ± 0.11 0.06 ± 0.10 0.1391 0.04–0.71 0.04–0.63 0.07 0.10 0.30 0.45
Total 10.04 7.68
Mean ± SD, one day intake of spices from vegetable preparations, paranthas, dhal and other dishes consumed Statistical Test: T Test, statistically significancedifference (p value < 0.05)
Bhathal et al. Nutrition Journal (2020) 19:121 Page 6 of 12

respectively) for rural women. Mean turmeric powderintake among urban and rural households was 2.98 and2.80 g, respectively. Cinnamon had the lowest mean in-take (0.04 g/portion) among urban and 0.2 g/portion forgooseberry powder, 0.03 g/portion for fenugreek seedsand dry pomegranate powder among rural women. Asignificant difference was obtained between urban andrural households for the intake of red chilli powder,cumin seeds, black pepper, fennel seeds, gooseberrypowder and mustard seeds at p < 0.01 level of signifi-cance. The percent of spice median intakes of spicesrepresenting below 1 g were 72 and 89% of urban andrural median intakes, respectively. Out of 18, 10 and 7spices among urban and rural were having 90th percent-ile above 1 g, respectively. The highest 90th percentilevalue was observed for red chilli powder (4.41 g) amongurban and turmeric powder (3.23 g) among rural. Over-all, an average adult woman consumed 10.04 g of spicesper day as compared to 7.68 g per day for rural womenindicating higher consumption of spices among urbanhouseholds.The distribution of the level of spice intake based on
portion sizes is depicted in the Table 6. The total numberof 1395 and 1107 portion sizes was obtained from the
aggregate of all spices consumed from all dishes by adultwomen among urban and rural households, respectivelyin 1 day. Maximum number of portion sizes representingmore than 8% of total portion sizes belonged to red chillipowder (20.7%), turmeric powder (17.4%), cumin seeds(8.5%), green cardamom (8.4%) and black pepper (8.2%)among urban women and red chilli powder (18.3%), tur-meric powder (19%), cumin seeds (8.9%) and black pepper(8%) among rural women. Further, it showed that exceptfor red chilli powder, turmeric powder, cumin seeds, fen-nel seeds, black pepper and black salt, the rest of thespices showed more than 50% of the portion sizes con-sumed below 1 g among urban women. While amongrural women, except for red chilli powder, rest of thespices showed more than 50% of portion sizes consumedbelow 1 g. Percent of portion sizes consumed between 1and 3 g were highest for fennel seeds (70%) followed byturmeric powder (66.7%), cumin seeds (60.1%) and redchilli powder (51.2%) among urban intake. The corre-sponding highest value was observed for turmeric powder(65.5%) portion sizes consumed between 1 and 3 g.Greater than 3 g, percent portion sizes were observed forred chilli powder (33.9%), turmeric powder (16.9%), blackpepper (23.4%) and fennel (3.70%) among urban and red
Table 6 Distribution of levels of spice intake based on portion size consumed among adult women of urban and rural households
Spice Urban (n = 100) Rural (n = 100)
Number ofportion sizes
Level of intake (% of portion sizes) Number ofportion sizes
Level of intake (% of portion sizes)
< 1.0 g 1.0–3.0 g > 3.0 g < 1.0 g 1.0–3.0 g > 3.0 g
Red chilli powder 289 (20.7) 14.8 51.3 33.9 203 (18.3) 13.3 65.5 21.2
Turmeric powder 243 (17.4) 16.5 66.6 16.9 210 (19.0) 61.4 31.9 6.7
Cumin seeds 119 (8.5) 39.8 60.2 – 99 (8.9) 69.7 30.3 –
Green cardamom 117 (8.4) 89.0 11.0 – 75 (6.8) 78.7 21.3 –
Black pepper 115 (8.2) 30.8 45.8 23.4 89 (8.0) 65.2 34.8 –
Fennel seeds 81 (5.8) 26.3 70.0 3.7 62 (5.6) 74.2 25.8 –
Clove 58 (4.2) 100.0 – – 40 (3.6) 100.0 – –
Coriander 57 (4.1) 83.0 17.0 – 43 (3.9) 97.7 2.3 –
Asafoetida 54 (3.9) 81.8 18.2 – 45 (4.1) 80.0 20.0 –
Cinnamon 54 (3.9) 100.0 – – 42 (3.8) 100.0 – –
Black cardamom 52 (3.7) 100.0 – – 39 (3.5) 100.0 – –
Carom seeds 37 (2.7) 94.6 5.4 – 42 (3.8) 88.1 11.9 –
Black salt 29 (2.1) 44.8 55.2 – 34 (3.1) 61.8 38.2 –
Mustard 22 (1.6) 100.0 – – 45 (4.1) 80.0 20.0 –
Dry mango powder 19 (1.4) 100.0 – – 11 (1.0) 54.5 45.5
Fenugreek 18 (1.3) 100.0 – – 16 (1.4) 100.0 – –
Dry pomegranate 16 (1.1) 64.7 35.3 – 7 (0.6) 71.4 28.6 –
Gooseberry powder 15 (1) 62.5 37.5 – 5 (0.5) 70.0 30.0 –
Total 1395 1107
Values in parenthesis are percentages, ‘-‘Nil, Coriander, fenugreek and mustard refer to seeds. Portion size of each spice consumed: an aggregate of intakes fromvegetable preparations, paranthas, dhal and other dishes. No. of Portion sizes is no. of portions of each mentioned spice through all dishes consumed in one dayby women. Portion size is amount of food that you actually consumed or eat
Bhathal et al. Nutrition Journal (2020) 19:121 Page 7 of 12

chilli powder (6.7%) and turmeric powder (21.2%) amongrural, respectively.
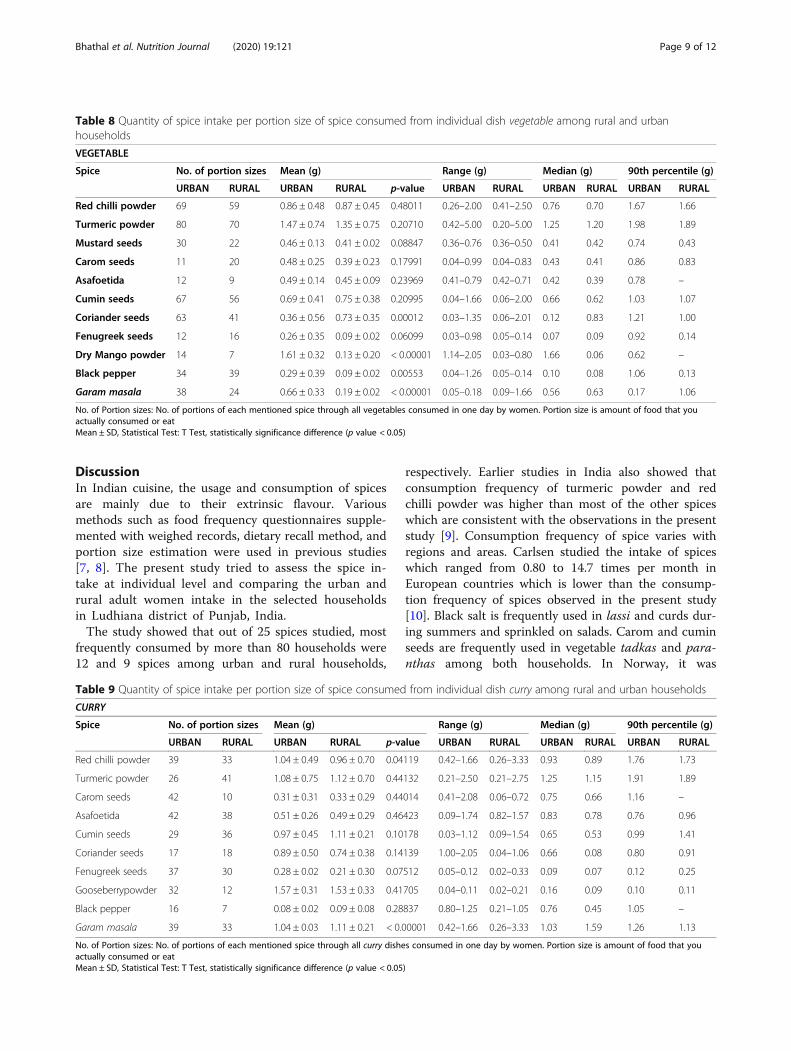
Quantity of spice intake per portion size of spiceconsumed from individual dishesThe spice intake from individual dishes like dhal, vege-table and curry were evaluated given in the Tables 7, 8and 9, respectively. Dhal (legume preparation), vegetable(dry vegetables) and curry (preparations like rajmah,curry, black channa). Maximum number of portion sizesconsumed were highest from dhal followed by vegetableand curry among rural households.Mean intakes were highest for red chilli powder
(1.88 g) from dhal among urban households and tur-meric powder (1.04) from dhal among rural house-holds elicited in Table 7. Common spices added todhal were red chilli powder, turmeric powder, mus-tard seeds, carom seeds, cumin seeds, garam masala,black pepper and asafoetida among urban and ruralhouseholds. Median intakes above 0.5 g were observedfor red chilli powder and turmeric powder amongurban households while red chilli powder, turmericpowder and mustard seeds among rural households.The significant difference was obtained for turmericpowder, mustard seeds, carom seeds, black pepper andgaram masala intake among urban and rural house-holds (p < 0.05). While, red chilli powder, asafoetida,cumin seeds and dry mango powder showed a non-significant difference between both households. Thehighest 90th percentile intake level was observed forturmeric powder 1.66 and 2.71 from dhal amongurban and rural households, respectively.Data on the intake of spices from vegetables was
depicted in Table 8. The number of portion sizes con-sumed from vegetables having more than 50 portionsizes were from red chilli powder, turmeric powder and
cumin seeds among urban and rural households. Tur-meric powder, red chilli powder, mustard seeds, caromseeds, asafoetida, cumin seeds and fenugreek seeds hadshown a non-significant difference among the intake ofthe above-mentioned spices among urban and ruralhouseholds. Turmeric powder had a median intake of1.25 and 1.20 g in urban and rural households, respect-ively. The highest 90th percentile intake level from vege-tables among urban and rural households was observedfrom turmeric powder 1.98 and 1.89 g, respectively.Another routinely prepared dishes like rajmah, black
channa, curry, etc., their spice intake has been presentedin Table 9. Mean intake of turmeric powder from currypreparation was highest among urban (1.08 g) and rural(1.12 g) households. The non-significant difference wasseen among all spices mentioned with exception of redchilli powder and garam masala, which showed a sig-nificant difference (p < 0.05) among urban and ruralhouseholds. Median values obtained above 0.60 g wereobserved by red chilli powder, turmeric powder, caromseeds, asafoetida, cumin seeds, coriander seeds, blackpepper and garam masala among urban householdswhile red chilli powder, turmeric powder, carom seeds,asafoetida and garam masala among rural households.The highest 90th percentile of 1.91 and 1.89 g for tur-meric powder among urban and rural households,respectively.Legumes and vegetables (Dhal, vegetables, curry) are
considered as the main contributor of spices apart fromother dishes in 1 day intake. A maximum number ofportion sizes for red chilli powder and turmeric werefrom vegetables>dhal > curry preparation among urbanhouseholds. While among rural households the max-imum number of portion sizes were from dhal > vege-tables>curry preparation for red chilli powder andturmeric powder.
Table 7 Quantity of spice intake per portion size of spice consumed from individual dish dhal among rural and urban households
DHAL
Spice No. of portion sizes Mean (g) Range (g) Median (g) 90th percentile (g)
URBAN RURAL URBAN RURAL p-value URBAN RURAL URBAN RURAL URBAN RURAL
Red chilli powder 62 69 1.88 ± 0.42 1.04 ± 0.64 0.0723 0.41–2.00 0.25–2.75 0.85 0.94 1.45 2.12
Turmeric powder 77 82 1.03 ± 0.63 1.44 ± 0.69 0.0009 0.42–3.00 0.41–3.23 1.00 1.25 1.66 2.71
Mustard seeds 11 25 0.45 ± 0.06 0.80 ± 0.47 0.0042 0.30–0.50 0.11–1.84 0.50 0.81 0.5 1.59
Carom seeds 12 23 0.31 ± 0.14 0.64 ± 0.34 0.0004 0.06–0.42 0.21–1.21 0.42 0.50 0.41 1.14
Asafoetida 34 28 0.43 ± 0.14 0.58 ± 0.37 0.0552 0.21–0.83 0.08–1.5 0.42 0.48 0.71 1.25
Cumin seeds 74 62 0.66 ± 0.44 0.54 ± 0.53 0.1224 0.09–1.66 0.01–1.98 0.41 0.36 1.25 1.42
Dry Mango powder 11 5 0.15 ± 0.23 0.38 ± 0.40 0.18252 0.02–0.75 0.06–0.83 0.06 0.25 0.75 –
Black pepper 35 45 0.11 ± 0.11 0.35 ± 0.39 0.0003 0.02–0.63 0.02–1.42 0.10 0.17 0.14 1.11
Garam masala 52 47 0.13 ± 0.20 0.89 ± 1.00 0.00006 0.02–1.25 0.06–0.37 0.32 0.28 0.14 0.63
No. of Portion sizes: No. of portions of each mentioned spice through all dhals consumed in one day by women. Portion size is amount of food that you actuallyconsumed or eatMean ± SD, Statistical Test: T Test, statistically significance difference (p value < 0.05)
Bhathal et al. Nutrition Journal (2020) 19:121 Page 8 of 12
DiscussionIn Indian cuisine, the usage and consumption of spicesare mainly due to their extrinsic flavour. Variousmethods such as food frequency questionnaires supple-mented with weighed records, dietary recall method, andportion size estimation were used in previous studies[7, 8]. The present study tried to assess the spice in-take at individual level and comparing the urban andrural adult women intake in the selected householdsin Ludhiana district of Punjab, India.The study showed that out of 25 spices studied, most
frequently consumed by more than 80 households were12 and 9 spices among urban and rural households,
respectively. Earlier studies in India also showed thatconsumption frequency of turmeric powder and redchilli powder was higher than most of the other spiceswhich are consistent with the observations in the presentstudy [9]. Consumption frequency of spice varies withregions and areas. Carlsen studied the intake of spiceswhich ranged from 0.80 to 14.7 times per month inEuropean countries which is lower than the consump-tion frequency of spices observed in the present study[10]. Black salt is frequently used in lassi and curds dur-ing summers and sprinkled on salads. Carom and cuminseeds are frequently used in vegetable tadkas and para-nthas among both households. In Norway, it was
Table 9 Quantity of spice intake per portion size of spice consumed from individual dish curry among rural and urban households
CURRY
Spice No. of portion sizes Mean (g) Range (g) Median (g) 90th percentile (g)
URBAN RURAL URBAN RURAL p-value URBAN RURAL URBAN RURAL URBAN RURAL
Red chilli powder 39 33 1.04 ± 0.49 0.96 ± 0.70 0.04119 0.42–1.66 0.26–3.33 0.93 0.89 1.76 1.73
Turmeric powder 26 41 1.08 ± 0.75 1.12 ± 0.70 0.44132 0.21–2.50 0.21–2.75 1.25 1.15 1.91 1.89
Carom seeds 42 10 0.31 ± 0.31 0.33 ± 0.29 0.44014 0.41–2.08 0.06–0.72 0.75 0.66 1.16 –
Asafoetida 42 38 0.51 ± 0.26 0.49 ± 0.29 0.46423 0.09–1.74 0.82–1.57 0.83 0.78 0.76 0.96
Cumin seeds 29 36 0.97 ± 0.45 1.11 ± 0.21 0.10178 0.03–1.12 0.09–1.54 0.65 0.53 0.99 1.41
Coriander seeds 17 18 0.89 ± 0.50 0.74 ± 0.38 0.14139 1.00–2.05 0.04–1.06 0.66 0.08 0.80 0.91
Fenugreek seeds 37 30 0.28 ± 0.02 0.21 ± 0.30 0.07512 0.05–0.12 0.02–0.33 0.09 0.07 0.12 0.25
Gooseberrypowder 32 12 1.57 ± 0.31 1.53 ± 0.33 0.41705 0.04–0.11 0.02–0.21 0.16 0.09 0.10 0.11
Black pepper 16 7 0.08 ± 0.02 0.09 ± 0.08 0.28837 0.80–1.25 0.21–1.05 0.76 0.45 1.05 –
Garam masala 39 33 1.04 ± 0.03 1.11 ± 0.21 < 0.00001 0.42–1.66 0.26–3.33 1.03 1.59 1.26 1.13
No. of Portion sizes: No. of portions of each mentioned spice through all curry dishes consumed in one day by women. Portion size is amount of food that youactually consumed or eatMean ± SD, Statistical Test: T Test, statistically significance difference (p value < 0.05)
Table 8 Quantity of spice intake per portion size of spice consumed from individual dish vegetable among rural and urbanhouseholds
VEGETABLE
Spice No. of portion sizes Mean (g) Range (g) Median (g) 90th percentile (g)
URBAN RURAL URBAN RURAL p-value URBAN RURAL URBAN RURAL URBAN RURAL
Red chilli powder 69 59 0.86 ± 0.48 0.87 ± 0.45 0.48011 0.26–2.00 0.41–2.50 0.76 0.70 1.67 1.66
Turmeric powder 80 70 1.47 ± 0.74 1.35 ± 0.75 0.20710 0.42–5.00 0.20–5.00 1.25 1.20 1.98 1.89
Mustard seeds 30 22 0.46 ± 0.13 0.41 ± 0.02 0.08847 0.36–0.76 0.36–0.50 0.41 0.42 0.74 0.43
Carom seeds 11 20 0.48 ± 0.25 0.39 ± 0.23 0.17991 0.04–0.99 0.04–0.83 0.43 0.41 0.86 0.83
Asafoetida 12 9 0.49 ± 0.14 0.45 ± 0.09 0.23969 0.41–0.79 0.42–0.71 0.42 0.39 0.78 –
Cumin seeds 67 56 0.69 ± 0.41 0.75 ± 0.38 0.20995 0.04–1.66 0.06–2.00 0.66 0.62 1.03 1.07
Coriander seeds 63 41 0.36 ± 0.56 0.73 ± 0.35 0.00012 0.03–1.35 0.06–2.01 0.12 0.83 1.21 1.00
Fenugreek seeds 12 16 0.26 ± 0.35 0.09 ± 0.02 0.06099 0.03–0.98 0.05–0.14 0.07 0.09 0.92 0.14
Dry Mango powder 14 7 1.61 ± 0.32 0.13 ± 0.20 < 0.00001 1.14–2.05 0.03–0.80 1.66 0.06 0.62 –
Black pepper 34 39 0.29 ± 0.39 0.09 ± 0.02 0.00553 0.04–1.26 0.05–0.14 0.10 0.08 1.06 0.13
Garam masala 38 24 0.66 ± 0.33 0.19 ± 0.02 < 0.00001 0.05–0.18 0.09–1.66 0.56 0.63 0.17 1.06
No. of Portion sizes: No. of portions of each mentioned spice through all vegetables consumed in one day by women. Portion size is amount of food that youactually consumed or eatMean ± SD, Statistical Test: T Test, statistically significance difference (p value < 0.05)
Bhathal et al. Nutrition Journal (2020) 19:121 Page 9 of 12

observed that out of 27 different herbs and spices inves-tigated only eight were consumed by one-third of thepopulation which indicated the lower consumption ofspices [10]. Ferruci et al. observed regional differences inper capita spice consumption with the Northern andWestern regions consuming a lesser number of spices ascompared to the Southern regions of India. In Trivan-drum, Mumbai and New Delhi, 95% of the total partici-pants (3625) reported consuming 12, 5 and 4 spices,respectively and turmeric powder was the only spiceconsumed by more than 95% of the population [11].The usage form of spices in the households also varied
indicating that the unroasted form of spices consumedby the majority of urban and rural households. Generally,spices preferred for roasting are black pepper, asafoetida,carom seeds, cumin seeds, fenugreek seeds, mustard seeds,cinnamon, clove and black cardamom during food prepa-rations. Susheela stated that some spices are processed fortheir microbial stability and removal of extraneous matterand roasting is one of the cooking processes to releasecharacteristic flavour volatiles and undesirable particles[12]. Moreover, there is a possibility that some naturalcomponents could be significantly lost during thermalprocessing because some bioactive compounds are un-stable to heat. Thus, heat-processed foods are consideredto have lower health-promoting capacity than the freshone [13]. In order to save time on the roasting process,women preferred to use an unroasted form of spices. InIndian tradition, most of the spices are subjected to roast-ing before addition to food preparation as roasting en-hances the flavour [14].Spice intake determination is being acknowledged as
they possess bioactive compounds and antioxidant prop-erties. Frequency data of intake together with portionsize estimations provided a good quantitative estimationof spice intake at individual level rather than opting forthe frequency of spice intake alone. The spice intake var-ies substantially between different countries, states, geo-graphical regions within the same country possessingdifferent dietary habits and patterns and cuisines withinthe same region. At an individual level, spice intakemeasurement is a tough and challenging task than esti-mating the intake of staple foods like cereals and otherfoods that are consumed in large quantities daily. Shermanand Hash reviewed through traditional cookbooks whichrevealed the mean number of spices used in 36 countrieswere 6.5 and 9.3 spices through vegetable and meat-basedrecipes in India while in European countries mean num-ber of spices ranged from 1.6 to 4.5 and 0.6 to 4.2 spicesthrough meat and vegetable based recipes, respectively[15]. The mean intake of black pepper (0.97 g/portion)and contributing 40% of total portion sizes were from theintake of salads in Hyderabad city [16]. Ferruciet al. statedthe median per capita consumption (g/month/person) of
chilli powder (35.7%), garam masala (33.3%), coriander(33.3%) and turmeric powder (28.6%) in New Delhi. Whilein Mumbai, chilli powder (58.3%) had the highest medianper capita consumption (g/month/person), followed byturmeric powder (21.7%) and cumin seeds (20.0%).Trivandrum was characterized by high consumption(g/month/person) of chilli powder (166.7%) coriander(102.0%) and ginger (373%). Further study revealedthat the per capita monthly median intake level of0.17–4.6 and 3.1 g for cinnamon and cloves, respect-ively in different regions of India which were foundto be higher than stated in the present study [11].This may be due to different methods of enumeratingthe spice intake. Per capita intake represents the aver-age consumption of spices at household level whilemeasurements as a portion sizes are based on the ac-tual quantity of spice consumed from the dish in aneating occasion by an individual. In European coun-tries, cinnamon is used in bakery and confectionaryitems whereas in India it is rarely consumed alongwith other spices such as cloves and cardamom forrice or sweet preparations. The maximum intake of0.22 g/kg body weight was noted through rice pud-ding consumption in Europe. Carlsen et al.assessedthe intakes of individual herbs and spices and esti-mated the median of total spice and herb consump-tion which was found to be 2.7 g/person/day inNorway and average total intake of herbs and spiceswas 1.1 g per day with range from 0.19 to 45.0 g fromthe food frequency questionnaire (FFQ). The total in-take of herbs and spices estimated by food frequencyquestionnaire (FFQ) between men and women showednon-significant results [10]. Intake of total spices fromfood frequency questionnaire (FFQ) and 3 D weighedfood record in Italian diet elicited that FFQ overesti-mated total spice intake by an average of 3.2 g perday among women subjects [7]. The total intake ofseasoning and spice from food frequency question-naire used in Japan Public Health Center showed thatthe food frequency questionnaire (FFQ) underesti-mated the total intake of seasoning and spice i.e.average intake of 5 g/day by more than 85% [8].Worldwide, the daily consumption of spices variesand often reported as a mixture of common spicesused frequently such as red chilli powder, turmericpowder, mustard, black pepper and white pepper. Theaverage daily intake of common spices per person hasbeen estimated as 4.0 g in the USA, 0.5 g in Europeand 1.0 g in New Zealand [17]. In South India, anaverage daily intake per person of a few spices, 3.08 gfor red chilli powder, 0.33 g for black pepper and0.87 g for turmeric powder were observed [18]. Inmost households, fennel seeds were consumed asafter-meal digestion but in various preparations, their
Bhathal et al. Nutrition Journal (2020) 19:121 Page 10 of 12

inclusion as a spice was found to be limited. Informa-tion regarding the consumption of spices such ascloves, star anise, dill, black cardamom, cinnamon,nutmeg and mace was less documented as comparedto red chilli powder and turmeric powder which indi-cated the low quantity and occasional use of thesespices. Studies reported from Norway and Thailandreported the portion size intake of individual spices.The portion eaten per meal of each appropriate spiceor herb from the most frequently consumed dishesfrom 24 Hour recall method showed that variousherbs and spices were widely consumed in localNorth-east Thai diets. Each popular recipe contains atleast 3 spices/herbs and total spice/herbs intake wasmore than 14.7 g/day in Thai diets [19]. Several earl-ier studies support the observations and indicate therelated information made in the present investigation.The average total intake of spices was 3.2 g per dayand determined the portion sizes per eating occasionfor 5 individual spices (basil dry, basil fresh, cinna-mon, oregano and pepper) and 3 spice blends theirmean and median ranged from 0.5–1.3 g and 0.2–0.9g, respectively [10]. The intake of spices in the Hy-derabad districtdepicted that intake was as low as0.01 g for clove and cinnamon and as high for redchilli powder (20 g). Further, high-frequency con-sumption of spices was indicated by most portionsizes of spices consumed represented by chillies(19%), turmeric powder (18.4%) and cumin (10.4%).Furthermore, this study reported that chillies wereconsumed between 1 and 5 g by 70% of portion sizesand the remaining 15% were above 5 g [15]. Similarresults were observed regarding the spice intake inThailand and Mexico (5 and 20 g/person/day, respectively)[20]. These intakes were higher as compared to thepresent study. The regular consumption of turmeric pow-der and asafoetida in everyday Nepali diets as they con-sider them as popular household remedies andcomponents of prescriptions used in traditional healing[21]. On the basis of food production statistics, Europeancountries reported the per capita intake of nutmeg andmace to be 0.1 g [22] while in Hyderabad city it was 0.14–0.23 g/portion size found to lowest as compared to otherspice consumption [15].These observations assume relevance for quantifying
spice intake since all spices are not consumed on dailybasis and intake of individual spices varied with fre-quency of consumption of dishes. Dishes are consideredas main contributor of spices on daily basis. In thepresent study, intake portion size of spices was estimatednot herbs and it depends upon the number of spicesused and consumed on a daily basis as monthly intakecould not provide relevant results. An average portionsize intake of total spices and herbs from habitual dishes
which ranged from 4.9 g to 26.1 g in Thailand [18]. Tur-meric powder and red chilli powder had maximumnumber of portion sizes from curry which is prepareddaily among all households in Southern India. Further,the highest 90th and 97th percentile values for chillies(6.0 and 11.1 g/portion, respectively) were observed fromchutney and dhal [15]. These obtained values were muchhigher than the results obtained in present study pre-senting the consumption of spices in Southern India ismore as compared to Northern region. Dishes consumedweekly or monthly showed a lower mean total intake ofspices than from those consumed daily (10.4 g/day).Conferred that intake of spices differs with a frequencyof the type of dish consumed and use of spices whichfurther facilitates in calculating spice intake at the indi-vidual level.
ConclusionThe intake levels of spices were relatively much lowerthan the other foods. It does not necessarily mean thatspices are of little value. It is pertinent to mention thatspices do not only add flavor and taste but also havehigh polyphenolic content and antioxidant potential ofvital importance. The frequency of spice intake and por-tion size at the individual level of adult women in urbanand rural households will provide a quantitative estimateof spice intake. The present study conducted in Lud-hiana district of Punjab (India) showed the most fre-quently consumed spices among rural and urbanhouseholds in Punjabi diets were red chilli powder, tur-meric powder, cumin seeds, carom seeds, black pepper,asafoetida, green cardamom, black salt, fennel seeds andcoriander seeds. The spice consumption was higher inurban adult women as compared to rural adult women.Further studies are required to explore the importanceand intake of spices.
AcknowledgementsThe cooperation of the various households both during standardization ofquestionnaire and regular survey is acknowledged.
Authors’ contributionsSKB and HK conceived the study and participated in design and conduct ofstudy including diet survey, data collection, tabulation, review andmanuscript preparation. KB contributed to the design and conduct of study,data tabulation and manuscript. AKM contributed to data tabulation andstatistical analysis in manuscript preparation. The author(s) read andapproved the final manuscript.
FundingNot applicable.
Availability of data and materialsThe authors declared that data supporting the findings of this study areavailable within the article. Relevant data and its supplementary informationare included in the article.
Ethics approval and consent to participateConsent was taken from households for regular survey regarding the spiceintake.
Bhathal et al. Nutrition Journal (2020) 19:121 Page 11 of 12

Consent for publicationI, Simranpreet Kaur Bhathal hereby declare that I participated in the studyand in the development of the manuscript titled (Assessing intake andconsumption level of spices among urban and rural households of Ludhianadistrict of Punjab, India). I have read the final version and give my consentfor the article to be published in Nutrition Journal.
Competing interestsThe authors declared that they have no competing interests.
Author details1Department of Food and Nutrition, Punjab Agricultural University, Ludhiana,Punjab, India. 2Department of Mathematics, Statistics and Physics, PunjabAgricultural University, Ludhiana, Punjab, India.
Received: 2 March 2020 Accepted: 29 October 2020
References1. Tapsell LC, Hemphill I, Cobiac L, Patch CS, Sullivan DR, Fenech M, Roodenrys S,
Keogh JB, Clifton PM, Williams PG, Fazio VA, Inge KE. Health benefits of herbsand spices: the past, the present, the future. Med J Aust. 2006;185:4–24.
2. Rubio L, Motilva MJ, Romero MP. Recent advances in biologically activecompounds in herbs and spices: a review of the most effective antioxidantand anti-inflammatory active principles. Crit Rev Food Sci Nutr. 2013;53:943–53.
3. Jacobs DR, Steffen LM. Nutrients, foods and dietary patterns as exposures inresearch: a framework for food synergy. Am J Clin Nutr. 2003;78:508–13.
4. Mathew A, Gangadharan P, Varghese C, Nair MK. Diet and stomach cancer:a case-control study in South India. Eur J Cancer Prev. 2000;9:89–97.
5. Phukan RK, Chetia CK, Ali MS, Mahanta J. Role of dietary habits in thedevelopment of esophageal cancer in Assam, the north-east ern region ofIndia. Nutr Cancer. 2001;39:204–9.
6. Nayak SP, Sasi MP, Sreejayan MP, Mandal S. A case-control study of roles ofdiet in colorectal carcinoma in a south Indian population. Asian Pac JCancer Prev. 2009;10:565–8.
7. Pellegrini N, Salvatore S, Valtuena S, Bedogni G, Porrini M, Pala V, Del RD,Sieri S, Miglio C, Krogh V, Zavaroni I, Brighenti F. Development andvalidation of a food frequency questionnaire for the assessment of dietarytotal antioxidant capacity. J Nutr. 2007;137:93–8.
8. Sasaki S, Kobayashi M, Tsugane S. Validity of s self-administered foodfrequency questionnaire used in the 5-year follow-up survey of teh JPHCstudy cohort I: comparison with dietary records for food groups. JEpidemiol. 2003;13:57–63.
9. Madhyastha MS. Mycotoxic Fungi and Mycotoxins in Major Spices withSpecial Reference to Piper nigrum L. Ph.D. Thesis, Mangalore, Karnataka,India: University of Mysore; 1985.
10. Carlsen MH, Blomhoff R, Andersen LF. Intakes of culinary herbs and spicesfrom a food frequency questionnaire evaluated against 28-days estimatedrecords. Nutr J. 2011;10:50.
11. Ferrucci LM, Daniel CR, Kapur K, Chadha P, Shetty H, Graubard BI, GeorgePS, Osborne W, Yurgalevitch S, Devasenapathy N, Chatterjee N, PrabhakaranD, Gupta PC, Mathew A, Sinha R. Measurement of spices and seasonings inIndia: opportunities for cancer epidemiology and prevention. Asian Pac JCancer Prev. 2010;11:1621–9.
12. Susheela RU. Handbook of spices, seasonings and flavourings. Lancaster:Technomic Publishing; 2000. p. 47–8.
13. Nikousaleh A, Prakash J. Effect of dry heat treatment of six spices onantioxidant activity of their water extracts. Food. 2008;2:139–44.
14. Behera S, Nagarajan S, Rao LJM. Microwave heating and conventionalroasting of cumin seeds (Cuminumcyminum L.) and effect on chemicalcomposition of volatiles. Food Chem. 2004;87:25–9.
15. Sherman PW, Hash GA. Why vegetable recipes are not spicy. EvolHumBehav. 2001;22:147–63.
16. Siruguri V, Bhat RV. Assessing intake of spices by pattern of spice use,frequency of consumption and portion size of spices consumed fromroutinely prepared dishes in southern India. Nutr J. 2015;14:1–9.
17. Lampe JW. Spicing up a vegetarian diet: chemo preventive effects ofphytochemicals. Am J Clin Nutr. 2003;78:579–83.
18. Pradeep KU, Geervani P, Eggum BO. Common Indian spices: nutrientcomposition, consumption and contribution to dietary value. Plant FoodsHum Nutr. 1993;44:137–48.
19. Tantipopipat S, Boonpraderm A, Charoenkiatkul S, Wasantwisut E,Winichagoon P. Dietary intake of spices and herbs in habitual northeastThai diets. Malays J Nutr. 2010;16:137–48.
20. Nesheim RO. Measurement of food consumption-past, present, future. AmJClin Nutr. 1982;35:1292–6.
21. Eigner D, Scholz D. Ferula asafoetida and Curcuma longa in traditionalmedical treatment and diet in Nepal. J Ethnopharmacol. 1999;67:1–6.
22. WHO Global Environment Monitoring Programme. GEMS/FoodConsumption Cluster Diets - Country Assignments to Clusters – versionOctober 2010 - Fanny Heraud.
Publisher’s NoteSpringer Nature remains neutral with regard to jurisdictional claims inpublished maps and institutional affiliations.
Bhathal et al. Nutrition Journal (2020) 19:121 Page 12 of 12


![Herbs and Spices- Biomarkers of Intake Based on …...cular health benefits [16]. Most of the positive health effects of herbs and spices towards preventing or ameliorating chronic](https://img.dokumen.tips/doc/110x75/5f0a86a97e708231d42c10e8/herbs-and-spices-biomarkers-of-intake-based-on-cular-health-benefits-16.jpg)