Embed Size (px)
Citation preview

June 2008
Assessing hidden risk in traditional and alternative asset classes

Unigestion at a glance
An independent company, dedicated to investment management since 1971
A highly capitalised and solid structure, aligned with its clients
More than € 100 million equity
A culture of innovation as the pillarfor long term development
First investment in Hedge Funds in 1986*
Early European investor in Private Equity(since 1988)*
A pioneer in the implementationof Minimum Variance (since 1995)
Corporate Profile
Strategies: Minimum Variance EquitiesHedge FundsPrivate Equity
Offices: GenevaLondonParisMunichNew YorkSingapore Guernsey
Employees: 155 total
Data as at 31st March 2008*Investment for own account

Unigestion: 20 years of experience in assessing risk for various asset classes
Minimum Variance Equities
Fundamental risk
Volatility
Correlation
Specific risk
Market risk
Liquidity
At the fund level:Market risk andCredit risk
Operational risk
Systemic risk
At the fund of funds level:Liquidity
At the fund level:Specific risk
Market risk
Credit risk
At the fund of funds level:Liquidity
Hedge Funds Private Equity
Daily, with real-time data Monthly, with weekly/monthly data
Yearly, with quarterly data
Tim
e ho
rizon
Exam
ples
of p
aram
eter
s lo
oked
at

Our speakers
Jean-François HirschelHead of Marketing
Alexei JourovskiHead of Investments - Equities
Christophe de DardelHead of Investments - Private Equity
Gabriele SusinnoHead of Quantitative Research & Risk Control - Hedge Funds

Agenda for today
1. Correlation
Correlation is relevant for linearly-related normal variables, which are not so frequent in the real world
Correlation spikes when risk aversion is high
2. Liquidity
Overcoming the difficulties of estimating liquidity in equities: Liquidity at Risk
The challenge of managing illiquidity in Private Equity: cash flow modeling
3. Leverage
Hedge Funds: adjusting leverage to assets’ volatility
Private Equity: assessing the true impact of leverage

1. Correlation
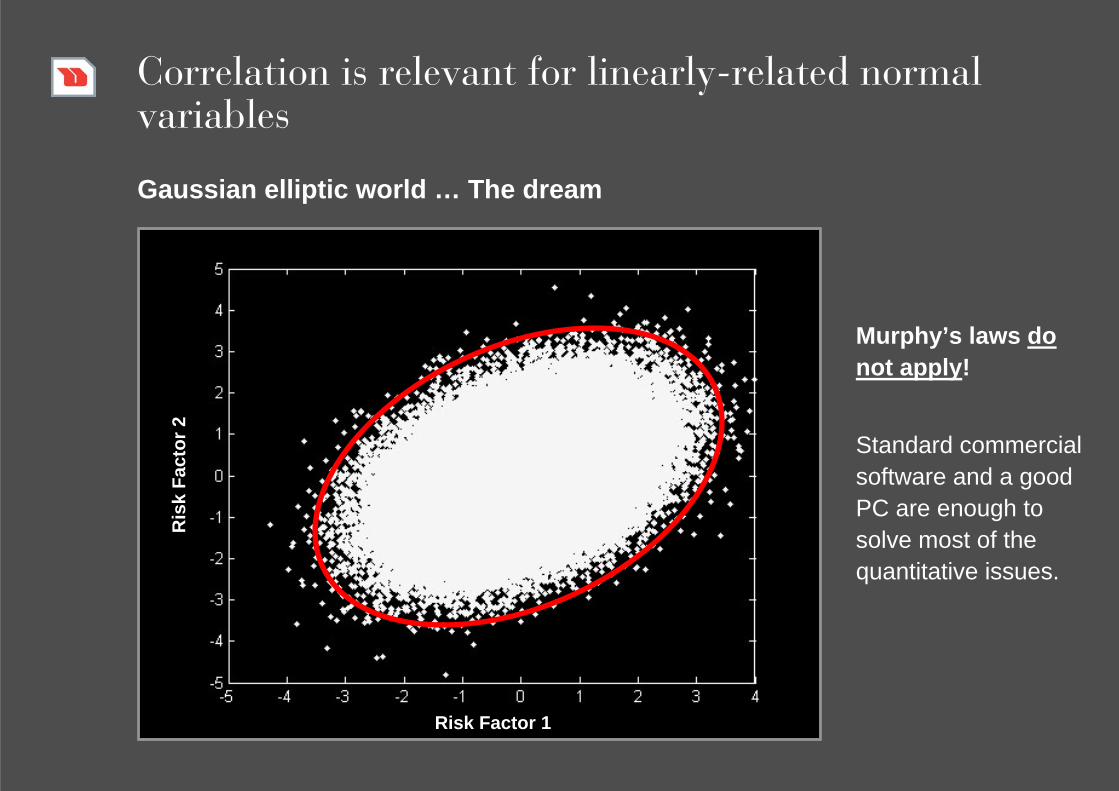
Correlation is relevant for linearly-related normal variables
Risk Factor 1
Ris
k Fa
ctor
2Gaussian elliptic world … The dream
Murphy’s laws do not apply!
Standard commercial software and a good PC are enough to solve most of the quantitative issues.
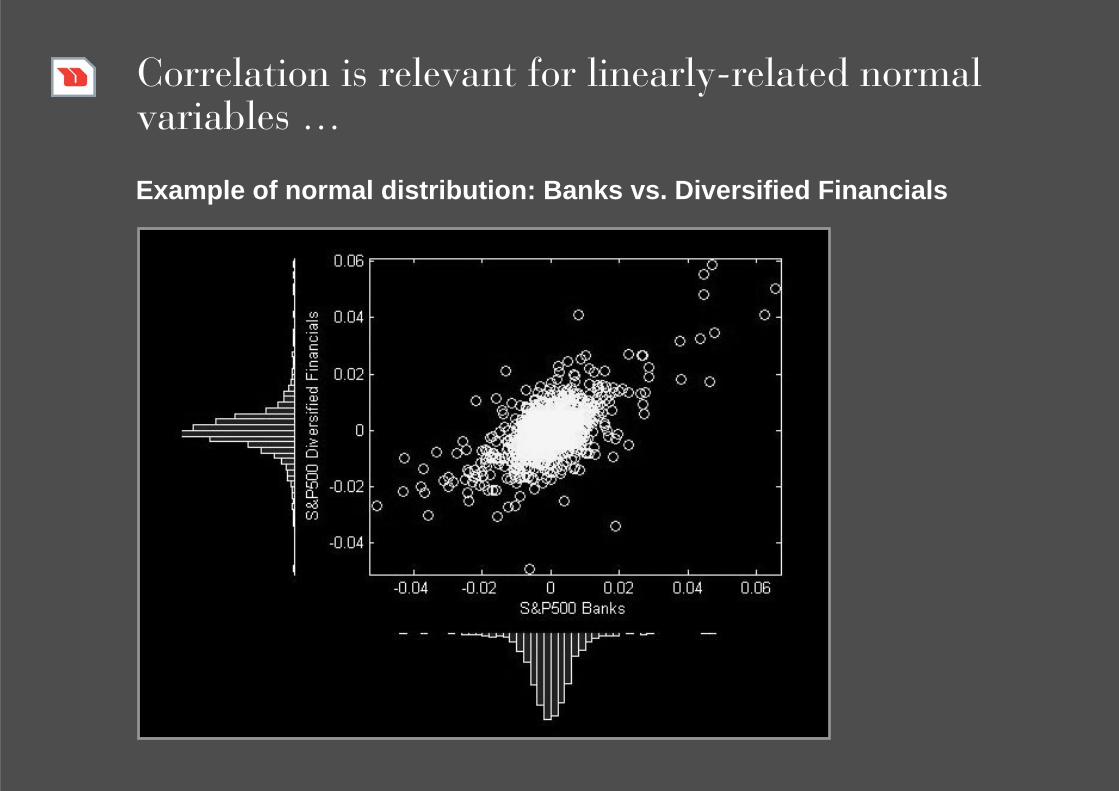
Correlation is relevant for linearly-related normal variables …
Example of normal distribution: Banks vs. Diversified Financials

… which are not so frequent in the real world
Example of fat-tail distribution: Energy vs. Materials

Correlation is misleading in non-normal worldsNon-normal world … The real world … The HF world
Classical Risk Management tools break down! VaR does not work; Standard Deviation is misleadingPortfolio optimization is risk-measure dependentCorrelation based methods are insufficient
Murphy’s laws do apply!
No Universal Recipebut ad hoc approaches.
Risk Factor 1
the “perfect storm”scenario
Ris
k Fa
ctor
2
-0.2 -0.15 -0.1 -0.05 0 0.05 0.1 0.15-0.06
-0.04
-0.02
0
0.02
0.04
0.06
0.08
EDHEC Index: Emerging Markets (Monthly returns)
EDH
EC In
dex:
L/S
Equ
ity(M
onth
lyre
turn
s)
Storm event 31/08/1998
2 sigma event
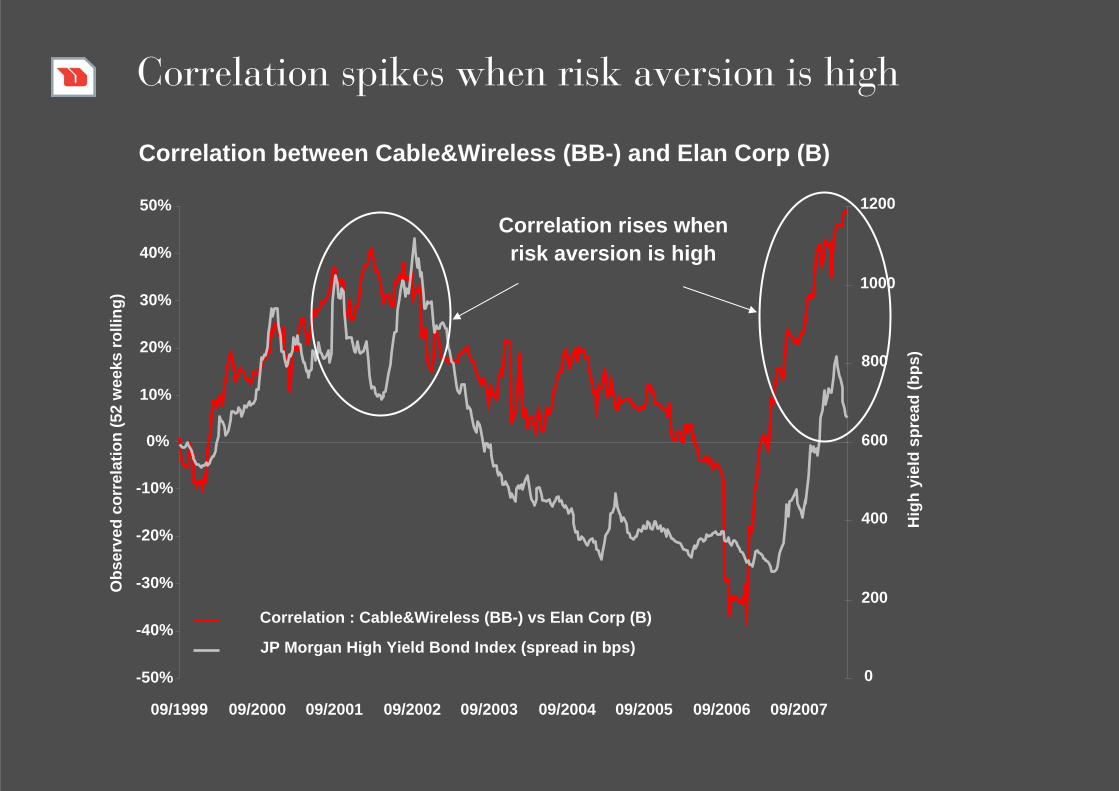
Correlation spikes when risk aversion is high
Correlation between Cable&Wireless (BB-) and Elan Corp (B)
-50%
-40%
-30%
-20%
-10%
0%
10%
20%
30%
40%
50%
09/1999 09/2000 09/2001 09/2002 09/2003 09/2004 09/2005 09/2006 09/2007
Obs
erve
d co
rrel
atio
n (5
2 w
eeks
rolli
ng)
0
200
400
600
800
1000
1200
Hig
h yi
eld
spre
ad(b
ps)
Correlation : Cable&Wireless (BB-) vs Elan Corp (B)
JP Morgan High Yield Bond Index (spread in bps)
Correlation rises whenrisk aversion is high

2. Liquidity

Liquidity is a very unstable parameterObserved volume of J Sainsbury PLC
Seasonal effect : Liquidity dry up in December
Extreme events :M&A news, earnings announcements

Median daily volume: a realistic liquidity forecast
Liquidity distribution of J Sainsbury PLC
0%
1%
2%
3%
4%
5%
6%
7%
0 40 80 120 160 200 240 280 320 360 400
Daily volume traded (GBP millions)
% O
ccur
renc
e
Median : 65.3 M GBP / dayConfidence : 50%
Average : 99.4 M GBP / dayConfidence : 29%

Overcoming the difficulties of estimating liquidity in equities: Liquidity at RiskLiquidity at Risk estimator for J Sainsbury PLC7%
0%
1%
2%
3%
4%
5%
6%
0 40 80 120 160 200 240 280 320 360 400
Daily volume traded (GBP millions)
% O
ccur
renc
e
Median : 65.3 M GBP / dayConfidence : 50%
Average : 99.4 M GBP / dayConfidence : 29%
Liquidity at Risk : 30 M GBP / dayConfidence : 75%
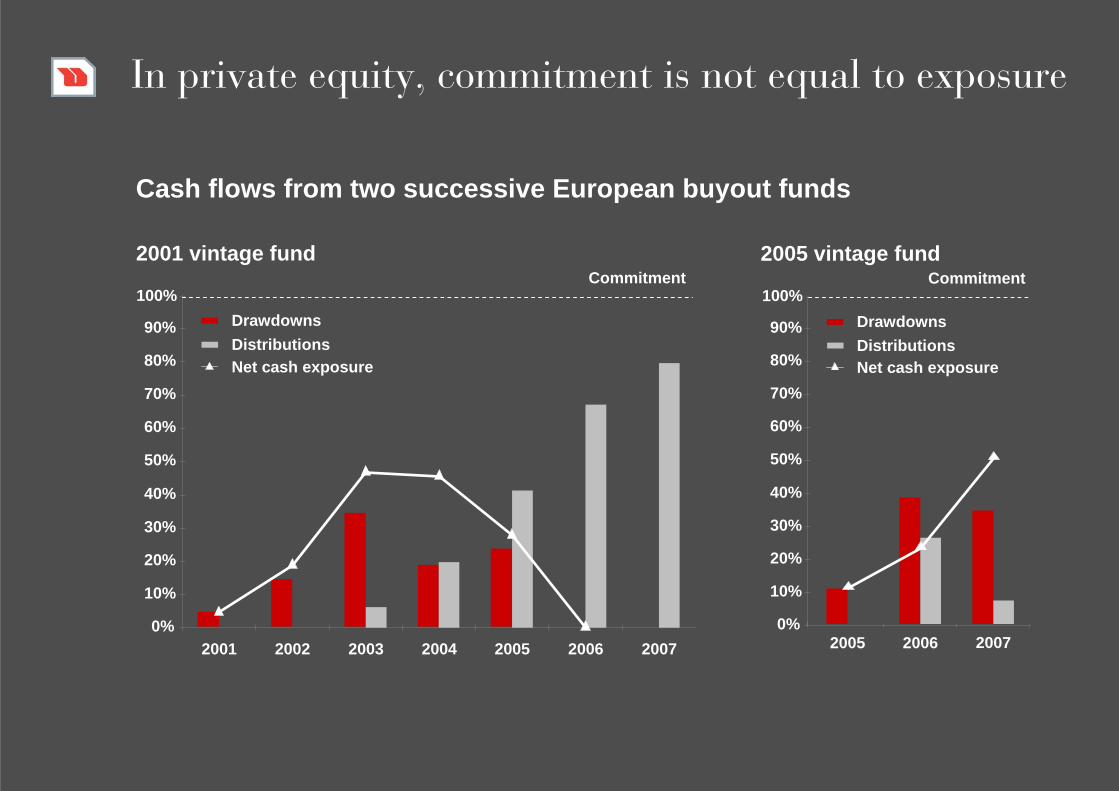
In private equity, commitment is not equal to exposure
Cash flows from two successive European buyout funds
2001 vintage fund
0%
10%
20%
30%
40%
50%
60%
70%
80%
90%
2001 2002 2003 2004 2005 2006 2007
DrawdownsDistributionsNet cash exposure
Commitment100%
2005 vintage fund
2005 2006 20070%
10%
20%
30%
40%
50%
60%
70%
80%
90%
Commitment100%
DrawdownsDistributionsNet cash exposure

Cash flow forecasting requires sophisticated modeling
Realised portfolio companies
Unrealised portfolio companies
Undrawn commitments
Future commitments
Exit projections
Actual data
Actual data
Assumptions on drawdowns, holding periods, exit multiples, fees, etc…
Assumptions on drawdowns, holding periods, exit multiples, fees, etc…
Portfolio levelassumption (operating expenses, dividends, etc…)
Optimizer: maximiseinvestment level / remain cash positive
Commitment plan
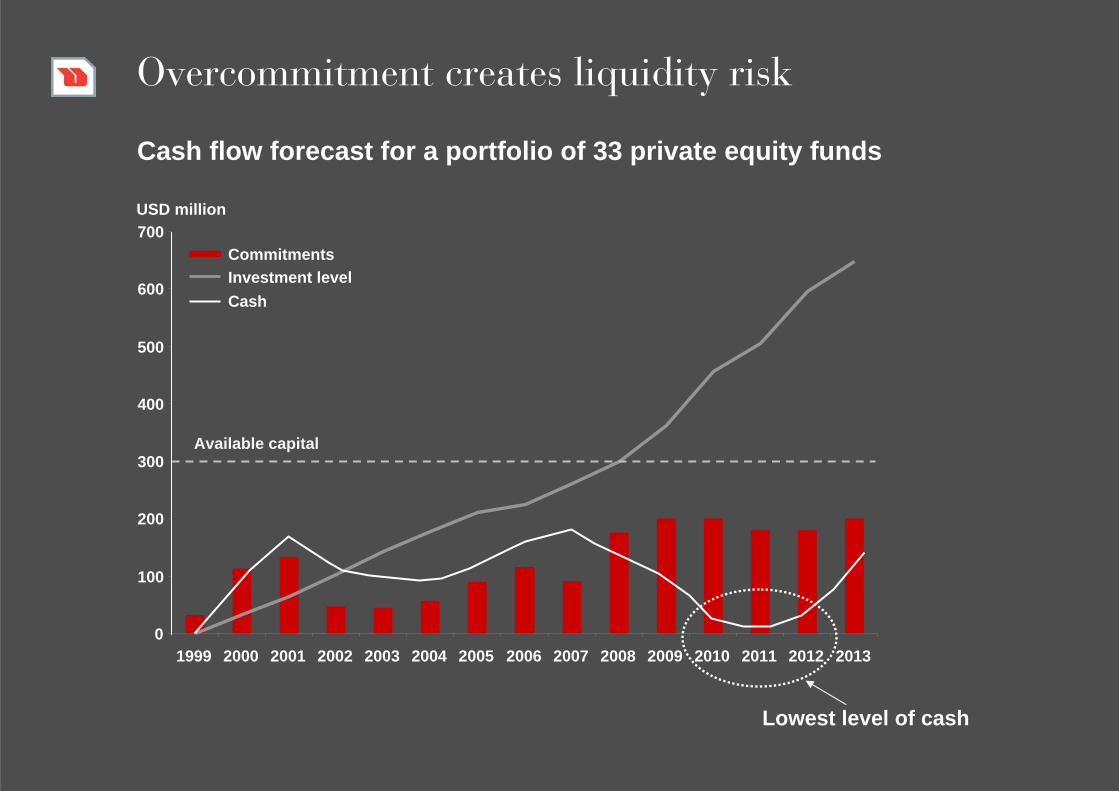
Overcommitment creates liquidity risk
Cash flow forecast for a portfolio of 33 private equity funds
0
100
200
300
400
500
600
700
1999 2000 2001 2002 2003 2004 2005 2006 2007 2008 2009 2010 2011 2012 2013
USD million
Available capital
Lowest level of cash
CommitmentsInvestment levelCash

3. Leverage

Adjusting leverage to assets’ volatility
Two ways to the same risk profile:
High Market risk and low leverage
Low Market Risk and high leverage
Leverage: “A creation of exposure greater in magnitude than the initial cash amount posted to an investment.”1
1. cf AIMA Canada Strategy Paper Series October 2006
Financial Risk
Beta
Leverage
Market Risks
Risk Amplifier
Thus leverage is strategy dependent
Examples of typical leverage:2 to 10 X for Arbitrage Strategies2 X for directional strategies such as Equity Hedge.

In Hedge Funds, leverage measure must be adapted to the strategy
The Leverage can be quantified in absolute terms or with respect to the risk profile of a reference index (effective beta equivalent).
Types of Leverage
Financial Leverage or Borrowing Leverage
Strategy Leverage : Impact of portfolio construction rules on the overall portfolio’s risk
Instrument Leverage (Gearing) : intrinsic internal leverage of financial instruments.
In Hedge Funds Leverage measure must be adapted to the strategy:
L/S Strategies: Gross Financial Leverage = (longs + shorts)/Capital
MKT Neutrals: Net Financial Leverage = (longs – shorts)/Capital
Arbitrage and Derivative Strategies: Leverage = Financial Leverage * Gearing

Adjusting leverage to assets’ volatility
Maximum Leverage
There is an optimal level of leverage to maximize the compound rate of growth over the long term, calculated according to what is known as the “Kelly Criterion* ”:
The rule can be used to scale the level of leverage to the strategy’s intrinsic volatility.
CAUTION :
Just considering volatility in Hedge Funds can be risky as FAT TAIL risk is magnified by the leverage.
Neglecting Leverage represents a suboptimal use of capital.
*J. L. Kelly, Jr, A New Interpretation of Information Rate, Bell System Technical Journal, 35, (1956), 917-926

Private Equity: assessing the true impact of leverage
2.5 to 1 leveraged investment in a European white goods company
Value creation before restatement Value creation after restatement
Equity at
entry
700
600
500
400
300
200
100
0
8%14%
60%
18%
2001 2005
Reven
ue incre
ase
Margin im
prove
ment
Multiple
arbitr
age
Levera
geEquity
at ex
it
EUR m
233
64013%
30%
17%
40%
Equity at
entry
Reven
ue incre
ase
Margin im
prove
ment
Multiple
arbitr
age
Debt r
educti
onEquity
at ex
it
2005
700
600
500
400
300
200
100
0
EUR m
233
640
2001

Highly leveraged companies are very sensitive to changes in market conditions
2.5 to 1 leveraged investment in a European white goods company
Investmentin 2001
Exitin 2005
Theoretical exit in down market
Revenue 600 720 620
EBITDA 100 130 100
EV / EBITDA 7.0x 8.5x 6.0x
Enterprise Value (EV) 700 1,105 600
Debt / EBITDA 5.0x
Debt 500 400 415
Equity 200 705 185
Exit multiple 3.5x 0.9x

One size does not fit all

Important information
This presentation has been prepared for your personal use and is for information only. It must not be published, reproduced or disclosed (in whole or in part) by recipients to any other person. All information contained herein is subject to change without notice. This document should be considered current as of the date of publication without regard to the date on which you may access the information.
This presentation is a promotional statement of our investment philosophy and services and does not constitute an offer or a solicitation to subscribe in the strategies or in the investment vehicles described or alluded to herein which may be construed as high risk and not readily realisable investments and may experience substantial and sudden loss including total loss of investment. Such investment is not suitable for all types of investors. All investors must obtain and carefully read the prospectuses which contain additional information needed to evaluate the potential investment and provide important disclosures regarding risks, fees and expenses.
The investment vehicles mentioned herein may not be authorized for public distribution in certain jurisdictions. Most Hedge Funds have only been authorized as a Class B scheme by the Guernsey Financial Services Commission. The Unicapital Investments Funds referred to in this presentation are only registered for public distribution in Luxembourg and are not offered or distributed on a public basis in or from any country where such distribution would be prohibitedby law.
Some figures contained in this document have not been independently verified although they have been obtained from sources believed reliable. As a result, Unigestion SA does not give any warranty or representation as to the accuracy, reliability or completeness of these figures. Data and graphical information as well as some statements contained herein are based on information supplied to Unigestion SA by third parties. No separate verification has been made as to the accuracy or completeness of these data and, as a result, no representations are made by Unigestion in this respect.
Past performance is not indicative of future performance. The value of investments may go down or up. There are no guaranteed returns. The Uni-Benchmark Composites are created by Unigestion SA and are made of single strategy benchmarks composed of the main investable indices.
Unless otherwise mentioned, source of data is Unigestion SA and Bloomberg .

www.unigestion.com
1) Supervised by the Federal Banking Commission.2) Regulated by the Guernsey Financial Services Commission.3) Authorised and regulated by the Financial Services Authority. Registered in England and Wales N°3886428.4) Authorised by BaFin.5) Supervised by “L’Autorité des Marchés Financiers”.
SINGAPORE UNIGESTION ASIA Pte Ltd152 Beach Road Suite #23-05/06The Gateway EastSingapore 189721Singapore
PARIS 5)
UNIGESTION ASSETMANAGEMENT (France) SA12 avenue MatignonF-75008 Paris
MUNICH 4)
UNIGESTION (UK) LtdGerman BranchZweigniederlassung PlaneggBahnhofstrasse 34D-82152 Planegg
NEW YORKUNIGESTION (US) LtdPlaza 10 – HarborsideFinancial CenterSuite 203Jersey City, NJ 07311USA
LONDON 3)
UNIGESTION (UK) Ltd105 PiccadillyUK-London W1J 7NJ
GUERNSEY 2)
UNIGESTION (Guernsey) LtdFarnley HouseLa CharroterieSt. Peter PortGuernsey, GY1 1EJChannel Islands
GENEVA 1)
UNIGESTION SA8C avenue de ChampelCP 387CH-1211 Genève 12
Contacts
Jean-François HirschelManaging Director, Head of MarketingTel. +41 (0)22 704 42 76E-mail : [email protected]
Alexei JourovskiExecutive Director, Head of Investments - EquitiesTel. +41 (0)22 704 43 19E-mail : [email protected]
Christophe de DardelExecutive Director, Head of Investments - Private EquityTel. +41 (0)22 704 42 61E-mail : [email protected]
Gabriele SusinnoExecutive Director, Head of Quantitative Research & Risk Control - Hedge FundsTel. +41 (0)22 704 43 63E-mail : [email protected]