Embed Size (px)
Citation preview

Impact Evaluation Study
Of
Reaching Out of School Children (ROSC) Project of
the Ministry of Primary and Mass Education
Carried out by
Evaluation Sector
Implementation Monitoring and Evaluation Division (IMED)
Ministry of Planning, Government of People’s Republic of Bangladesh
Conducted by
Bangladesh Institute of Development Studies (BIDS)
June 2014

Impact Evaluation Study of the Project “Reaching Out of School
Children (ROSC) Project of the Ministry of Primary and Mass
Education”
BIDS Professonals
1. Dr. S. M. Zulfiqar Ali
Senior Research Fellow
2. Dr. Mustafa K. Mujeri
Director General
3. Badrun Nessa Ahmed
Research Associate
With Assistance from,
1. Nadia Farnaz
Research Officer
2. Md. Faizul Islam
Research Officer
IMED Officials
1. Ms. Salma Mahmud
Director General
2. Mr. Md. Abdul Quiyum
Director
3. Quamrun Nessa
Director
4. Mr. Md. Mosharaf Hossain
Deputy Director
Carried out by:
Evaluation Sector
Implementation Monitoring and Evaluation Division (IMED)
Ministry of Planning, Government of People’s Republic of Bangladesh
Conducted by:
Bangladesh Institute of Development Studies (BIDS)
E-17 Agargaon, Sher-e-Bangla Nagar
Dhaka-1207, Bangladesh
June 2014


ACKNOWLEDGEMENT
The study “Evaluation of the Reaching Out of School Children (ROSC) Project” of the
Ministry of Primary and Mass Education” has been conducted by the Bangladesh Institute of
Development Studies (BIDS) for the Implementation Monitoring and Evaluation Division
(IMED) of the Monistry of Planning. The study would not have been possible without the
active and continuous support from IMED. We are, therefore, thankful to IMED for putting
trust on us and for giving us the opportunity to accomplish such an interesting and important
assignment. The study team would also like to express its gratitude to the Steering and
Technical Committee Members of the study. We are also very thankful to project officials of
ROSC for providing necessary support throughout the progree of the study.
We greatly appreciate the cooperation of the Upazilla Education Officers (UEO) who were
extremely cordial and supportive to the study team members. We are also thankful to the
Teachers of all the schools visited during the study for their excellent support not only in
providing school data but also in establishing linkage with the community. We would also
like to thank the CMC members for their participation in the discussion at such a short notice.
We are grateful to the children and their parents for being very cooperative. We would also
like to thank the local government representatives who participated in this evaluation as
individual and also provided valuable information which otherwise would not have been
available.
We highly appreciate the efforts and hard work of all the members of the study team
especially the enumerators and the facilitators who had taken real trouble of traveling some
really remote and inaccessible areas of the country.
While credit goes to all, errors and omissions are entirely of the study team.
Dr. S. M. Zulfiqar Ali
Senior Research Fellow and
Study Coordinator, BIDS

1
Contents
ABBREVIATION ............................................................................................................................. 3
EXECUTIVE SUMMARY ....................................................................................................................... 4
CHAPTER ONE: INTRODUCTION ......................................................................................................... 7
1.1 Background....................................................................................................................... 7
1.2 Overview of the ROSC Project .......................................................................................... 9
1.3 Objectives and Scope of the Current Assignment/Study ............................................... 11
Objectives of the Study ................................................................................................................. 11
Scope of the Study ........................................................................................................................ 12
Evaluation Challenges and Limitation of the Study ...................................................................... 12
CHAPTER TWO: ........................................................................................................................... 13
ANALYTICAL FRAMEWORK AND METHODOLOGY ............................................................. 13
2.1 Research Questions ........................................................................................................ 13
2.2 Issues and Indicators ...................................................................................................... 13
2.3 Analytical Framework .................................................................................................... 14
Measuring the Program Impact ............................................................................................... 15
2.4 Sampling and Coverage .................................................................................................. 16
Sample size determination........................................................................................................ 17
CHAPTER THREE: ............................................................................................................................. 19
IMPLEMENTATION STATUS OF THE PROJECT ................................................................................... 19
3.1 Implementation Status ................................................................................................... 19
3.2 Procurement under the Project ...................................................................................... 22
CHAPTER FOUR: SOCIO-ECONOMIC CHARACTERISTICS OF SAMPLED HOUSEHOLDS . 23
CHAPTER FIVE: IMPACT OF ROSC TO BRING OUT OF SCHOOL CHILDREN TO SCHOOL 29
5.1 Impact on Enrollment: .................................................................................................... 29
5.2 Impact on School Dropout .............................................................................................. 31
5.3 About the School, Gender Parity and Employment ........................................................ 32

2
5.4 Primary School Pass Rate .................................................................................................... 34
5.5 Quality of Education in the ROSC Learning Centers ............................................................ 34
5.6 Proportion of Ananda School Students Graduated to Secondary Level .............................. 35
CHAPTER SIX: MAJOR FINDINGS AND LIMITATIONS ......................................................................... 36
CHAPTER SEVEN: CONCLUSIONS AND RECOMMENDATIONS ........................................................... 38
APPENDIX ..................................................................................................................................... 41

3
ABBREVIATION
BBS Bangladesh Bureau of Statistics
BIDS Bangladesh Institute of Development Studies
CMC Center Management Committee
DPE Directorate of Primary Education
DPP Development Project Proposal
EFA Education for All
ESP Education Service Provider
FGD Focus Group Discussion
GoB Government of Bangladesh
IMED Implementation Monitoring and Evaluation Division
IDA International Development Association
KII Key Informants‟ Interview
LC Learning Centre
LGED Local Government Engineering Department
MDG Millennium Development Goal
MICS Multiple Indicator Cluster Survey
MoPME Ministry of Primary and Mass Education
NEP National Education Policy
NER Net enrollment rate
NGO Non-government Organization
OSC Out of School Children
PPR Public Procurement Rules
SDC Swiss Agency for Development & Cooperation
UEO Upazila Education Officer

4
EXECUTIVE SUMMARY
The Government of Bangladesh, with support from development partners (International
Development Association, Swiss Agency for Development & Cooperation (SDC) and other
Development Partners) has undertaken the “Reaching out of School Children (ROSC)
Project” in 2004 to give a chance to be educated to the children who dropped-out from
school or never went to school for primary education ever. The project blends formal
education with non-formal means of delivery to the young learners, providing them with an
opportunity to complete grade five and transition to secondary education.
The project has now moved on to its second phase and, hence, it is important to evaluate the
impact of phase one of the project. The current study has therefore been undertaken by the
Bangladesh Institute of Development Studies (BIDS) for Implementation Monitoring and
Evaluation Division (IMED) of the Ministry of Planning (MoP). The study specifically
designs with the aim of rigorously evaluate the outputs and impact of the project activities
with investigating any major difficulties and flaws that impeded the proper implementation
and management of project activities.
Major components of the ROSC project include the following: improving access to quality
education for out of school children, communications and social awareness, project
Management and Institutional Strengthening and monitoring, Evaluation and Research. In
consequence with PEDPII, the key objective of this project was to use demand-side
mechanisms to support the Government of Bangladesh towards achieving its National
Education for All (EFA) goals. In particular the project aims to provide access to primary
education and ensure retention of disadvantaged children who are currently out-of-school,
improve the quality and efficiency of primary education specially for these children and
strengthening the capacity of and building of learning centers and related organizations.
The methodology of impact evaluation included: household survey, key informant interview,
Focus group discussion, reviewing implementation status using secondary data and
discussion with concerned officials. The study selects 25 percent of upazilas where the ROSC
project is being implemented. Hence, a total of 23 upazilas are selected (out of 90 upazilas)
which cover 10 districts. Among these 23 upazilas 50 percent of the upazilas (11 upazilas) are
selected from ROSC phase one which is completed and the rest 50 percent of the upazilas (12

5
upazilas) covers the ongoing phase two of ROSC project. In the next stage, a total of 12
learning centers (one from currently implementing 12 upazilas) are chosen and 23
villages/communities where the learning centers are/were situated are chosen for data
collection. In addition, another 23 villages/communities are chosen from the same 10 districts
as control villages/communities which possess the common socio-economic characteristics to
that of the learning center villages/communities. Households that have children aged 7-14
years are chosen for data collection from both the groups of villages/communities. It may be
mentioned here that in selecting the learning centers and the associated villages/communities,
both the on-going and previous learning centers (which are not in operation now) are taken
into consideration.
The study finds that the project was implemented fully in terms of numbers but not quite as
per the rules and regulations of the project. Schools were established without taking the need
of the community into consideration in many places and school management and monitoring
were also weak in most cases. Several GO and NGO agencies were involved in implementing
the project and there were co-ordination problem between them. However, new phase is
trying to take care of the problem faces during phase-I implementation.
Despite the fact that there have been some bottlenecks in implementing the project activities,
it has been successful in creating some significant positive impacts upon its target
beneficiaries in case of increasing school enrollment, reduction in dropout rate, providing
schooling to children from poor and disadvantaged households and children with disability
due to „close proximity‟ and „flexi –time‟, increasing primary school pass rates and giving
priority to females in getting teaching jobs in these schools. However, there are still OOSC
children in the project areas.
Some observations also emerged from the results of our assessment of the ROSC Project. The
number of out of school children is still a major cause of concern in the project area. One
time admission process in Ananda school is the main reason behind failure of targeting 100
percent of out of school children of any particular area. Hence, adjusting some of the major
criteria of school setup and continuation and ensuring the responsibilities of communities as a
whole, this model (in rural areas) can go further to provide second chance education to all
disadvantaged children in the country. The adjustment can come through relaxing one time
cohort admission of 30 students and allowing yearly admission to incorporate as many as out
of school children, reducing class size, providing technical training (i.e. electrician, master

6
mason, cow fattening, livestock rearing etc.) through vocational education with formal
schooling.
At the same time, in implementation process, before setting up any Ananda School, there
should be a survey done to justify the need of schools in any particular area. This justification
can be done through identifying the areas with highest number of out of school children.
Finally, ensuring proper and timely inputs/logistics to the school and communicating these
with all the relevant stakeholders is also important so that it can draw attention and support
from them in all stages of implementation.

7
Evaluation of the Reaching Out of School Children
(ROSC) Project of the Ministry of Primary and
Mass Education
CHAPTER ONE: INTRODUCTION
1.1 Background
Bangladesh achieved major gains in education despite a very low starting point in terms of
socioeconomic development at the time of independence and considerable challenges
related to its geography and climate. The country has made significant progress in education
in the last two decades, especially in respect of increasing access to both primary and
secondary education. Net enrollment rate (NER) at the primary level has increased from 64%
in 1981 to 98% now. Gender parity has also been achieved. Initiatives have also been taken to
introduce pre-school education to prepare the children for formal schooling. The Constitution
of Bangladesh has provision for free and compulsory primary education in the country. The
government is now in the process of implementing the comprehensive National Education
Policy (2010) to achieve its objectives. However, estimates showed that a good number of
children have been remaining out-of-school. This number included children who had never
been enrolled in school, dropped-out from the formal primary education system, street
children, and children of disadvantaged families.
According to the Multiple Indicator Cluster Survey (MICS)1, 1.1 million children of pre-
primary school age (5 years), 2.6 million children of primary school age (6-10 years), and 3.0
million children of junior secondary school age (11-13 years) were out of school.
A recent report titled “Child Equity Atlas: Pockets of Social Deprivation in Bangladesh” of
2013 produced by the Bangladesh Institute of Development Studies (BIDS), Bangladesh
Bureau of Statistics (BBS) and UNICEF Bangladesh based on the Population Census 2011
illustrated that even in the best performing upazila, 13 out of 100 children were out of school
1 Multiple Indicator Cluster Survey was carried out by the Bangladesh Bureau of Statistics
(BBS). Financial and technical support was provided by the United Nations Children‟s Fund
(UNICEF).

8
while 45% children were not attending school in the worst performing upazila. Attendance in
pre-schools was also “fairly low” with only about two out of ten children under five attending
pre-school. In terms of school attendance, some parts of the country are performing well
while some are performing poorly, it said.
In the primary educational level, the following characteristics were linked with low school
participation as pointed out by several studies:
The rate of out of school children is twice as high among children age 6 (24%) than
among 8 year-olds (12%). This suggests that there is a problem with late entry.
Indeed, among children attending class 4, at least 25% are two years or older than the
expected age.
More boys are out of school than girls.
The percentage of out of school children does not differ particularly between urban
and rural areas.
There are, however, more visible differences between regions.
Access to education is lowest in specific areas with high concentrations of poor and
vulnerable people due to a combination of geographic, climatic and socio-economic
factors.
Low levels of maternal education are very closely associated with the probability that
the child is of out of school. For example, a child whose mother is not educated is
three times more likely to be out of primary school.
Households with low levels of wealth also face significant challenges in getting their
children to school. A child from the bottom quintile of the wealth index is two times
more likely to be out of primary school compared to a child from the top quintile.
The challenges of children living in disadvantaged areas are also not only related to
access but also to progression. Repetition and drop-out rates in upazilas situated in
adverse geographic condition were higher than average.
Given this context, the Government of Bangladesh, with support from development partners
has undertaken the “Reaching out of School Children (ROSC) Project” in 2004 to give a
chance to be educated to the children who drop-out school or never went to school for
primary education ever. The project blends formal education with non-formal means of

9
delivery to the young learners, providing them with an opportunity to complete grade five
and transition to secondary education.
The project has now moved on to its second phase and, hence, it is important to evaluate the
impact of phase one of the project. The current study has therefore been undertaken by the
Bangladesh Institute of Development Studies (BIDS) for Implementation Monitoring and
Evaluation Division (IMED) of the Ministry of Planning (MoP). The study specifically
designs with the aim of rigorously evaluate the outputs and impact of the project activities
with investigating any major difficulties and flaws that impeded the proper implementation
and management of project activities.
1.2 Overview of the ROSC Project
In 2004, nearly 1.5 million primary school-aged children were out of school in Bangladesh.
The government‟s Primary Education Development Program focused on the formal primary
sector that supported about 17 million students, yet still could not bring many children back
to school. These were the children who had missed out schooling at the right age or had been
forced to drop-out, mainly because of poverty. The ROSC project offers access to learning
opportunity for out-of-school children by providing stipend allowances to students and grants
to learning centers. From its initiation of the Reaching out of School Children (ROSC)
project in 2004, it has provided “second chance” primary education to over 790,000 out of
school children in more than 23,000 learning centers. Receiver students are mostly girls and
come from the 90 poorest upazilas of the country. Between 2005 and 2012, over 790,000 out-
of-school children, more than half of them girls, enrolled in more than 23,500 learning
centers. The pass rate of ROSC students that appeared in the nationally-conducted grade five
terminal examinations has risen to 83 percent in 2012, from 73 percent in 2011, providing
ample opportunity to students with primary completion equivalency for a transition to
secondary education. Initially the project was made operational in 60 Upazilas which had been
chosen based on the following variables - net enrollment rates, cycle completion rates, gender
disparity and poverty range. Specifically the following criteria had been applied a) Upazilas
that had the enrollment rate of 80% or less; b) Upazilas where the gender gap in net enrollment
was at least two percentage points (i.e. boys enrollment exceeded girls enrollment by at least
two percent); c) Upazilas where the cycle completion rate at the primary was 50% or less; and
d) Upazilas whose head count poverty was about 30%. It was decided that the selected

10
Upaziias should have the Net Enrollment Rate (NER) criterion plus any two of the remaining
three criteria. Upazilas which met these specified criteria had been identified. The project
duration was extended up to 2013 to enable all existing cohort of students to complete primary
education cycle. A short summary of the project is presented in the following box.
A short summary on the Reaching Out of School Children (ROSC) Project
The Reaching out of school children project (ROSC) was sponsored by ministry of
primary and mass education with the aim of supporting Government of Bangladesh (GoB)
towards achieving its national goal of Education for all (EFA). Besides the national goal,
the aims of this project were to provide access to primary education to those children who
are out of school and ensure retention of disadvantaged children. At the same time, it
targets to improve the quality and efficiency of primary education by strengthening the
capacity of learning centers and related organizations. At first, this project started
implementing in 60 upazilas of 34 districts. Then additional 30 new upazilas were selected
for scaling up ROSC activities. These additional upazilas belong to 17 districts.
ROSC created an opportunity for 7,80,000 children to complete their primary education
cycle through 23,000 learning centers (LCs) which are known as Ananda Schools (Schools
of Joy). Every LC is meant to provide non-formal education to 30 children through one
teacher (Source: World Bank (2013) Implementation Completion and Results Report).
The original project was implemented during July 2004 to 30 June 2010 with a 3rd
term
revision from July 2004 to 30 Jun 2013. The original project was co-financed by IDA
and SDC and GoB allocation. But for the extended period of July 2010 to June 2013, the
financing was balanced from grants and soft term credits.
The total cost of the project was Tk. 68432.29 lakh of which Tk. 3670.43 lakh came from
GoB and the rest Tk. 64761.86 was financed from grants (Tk. 40786.86 lakh) and credit
(Tk. 23975.00 lakh).

11
Major Components of the Project:
Major components of the ROSC project include the following:
Improving access to quality education for out of school children;
Communications and social awareness;
Project Management and Institutional Strengthening; and
Monitoring, Evaluation and Research.
Component wise allocation and expenditure of the project are presented in Appendix-A.
Objectives of the Project:
In consequence with PEDPII, the key objective of this project was to use demand-side
mechanisms to support the Government of Bangladesh towards achieving its National
Education for All (EFA) goals. In particular the project aims to:
Provide access to primary education and ensure retention of disadvantaged children
who are currently out-of-school;
Improve the quality and efficiency of primary education specially for these children;
and
Strengthening the capacity of and building of learning centers and related
organizations.
1.3 Objectives and Scope of the Current Assignment/Study
Objectives of the Study
Given the above, it is important to have a timely assessment of the ROSC project to see
whether the project components have been implemented properly or not; and whether and to
what extent the project have been able to make positive impact upon its beneficiaries.
Keeping this in perspective, the objectives of the current assignment include the following:
To investigate whether the project activities were fully implemented/achieved as targeted
in the DPP.
To review the present functional status of major inputs/activities of sampled areas and
reasons for any deviation and/or bottlenecks.

12
To examine whether the procurement process (Invitation of tender, evaluation of tender,
approval procedures, contract awards etc.) of the packages (goods, works and services)
under this project was done following PPR'08.
To assess the outputs and impact of the project activities with respect to:
i. Enrollment, attendance and retention of disadvantaged children by gender;
ii. Quality learning of these children through education allowances, dresses,
sanitation, etc.;
iii. Teachers' teaching capacity and efficiency of imparting education to the children;
iv. Improved management capacity of learning centers and related organizations;
v. Employment opportunity especially of women as teachers; and
vi. Improvement in poverty status.
To investigate any major difficulties and flaws that impeded the proper
implementation and management of project activities.
To provide specific recommendations for more effective management and
sustainability of project activities.
Scope of the Study
With the objectives outlined above, the study has two major sub-components: (i) assessment
of impacts; and (ii) review of the implementation of project components and activities.
Components (ii) has been addressed through reviewing various documents and reports as well
as carrying out interviews with the Project and respective other officials. Component (i) has
been addressed through carrying out a primary survey (both quantitative and qualitative).
Evaluation Challenges and Limitation of the Study
This study faces a couple of challenges during the evaluation period, which impose a certain
limitation over our study. The limitations of the study relates to the challenges during
evaluation time that may impacted or influenced the interpretation of the results of the study.
This phase of the project completed almost three years ago.
Most of the ROSC schools under this face no longer exist.
Absence of project officers and availability of CMC members in some of the program
villages.

13
CHAPTER TWO:
ANALYTICAL FRAMEWORK AND METHODOLOGY
2.1 Research Questions
To assess the implementation and impact of the project under consideration, we need to seek
answers of the following questions:
What were the primary objectives of the project?
Which groups of people were targeted and how would the project affect those groups?
What are the differences within and between the groups which might lead them
benefiting from the project in different ways and how could these be addressed?
What types of impacts would the project activities have, in particular for the
vulnerable groups identified?
If the project activities have positive effect, how these positive effects are achieved
and how they could be improved further?
Would the programme contribute to the achievement of MDG goals and targets?If
yes, how this was achieved and whether the position can be improved further? If no,
can anything be done so that it does contribute to the achievements of goals and
targets?
2.2 Issues and Indicators
To address the above mentioned research questions, the following issues and indicators have
been taken into consideration in the present study:
Enrollment in learning centers (LCs);
Project implementation status;
Academic achievement of children in LCs;
Facilities available for children in the LCs;
Capacity and management efficiency; and
Achievement, challenges and way forward.

14
2.3 Analytical Framework
Assessment of impacts of any intervention on the target beneficiaries requires both
quantitative and qualitative information with emphasis on the former due to the techniques of
measurement and other related indicators. The study, therefore, entails both quantitative and
qualitative exercises using cross-sectional data. In the former, comparisons of achievements
have been made between the experimental and the control groups. The summary indicators
broadly correspond to educational indicators, such as, enrollment, drop-out, completion,
literacy, educational attainment, etc. along with some household level indicators like parental
education, asset and income, etc. In addition to this quantitative approach, qualitative
methods have also been used to understand the processes.
The evaluation has been carried out keeping the initial goals and objectives in perspectives. It
has been carried out in several steps. First, the inputs given into the process of
implementation of the project have been taken into consideration. Second, outputs achieved
against original plan that are quantifiable have been looked into. Third, the processes through
the project activities have been implemented have also been critically reviewed. And, fourth,
attempts have been made to investigate the overall outcomes of the project at the beneficiary,
community and overall level. The diagram below presents the framework of the evaluation.

15
Figure 1: Framework of the proposed evaluation
Measuring the Program Impact
A program's effect can be measured accurately only if one knows what would have happened
without it. Because one obviously cannot observe the outcomes for the participants
themselves had they not enrolled in the programme, a proxy group of non-participants must
therefore be identified. Determining this hypothetical non-treatment (or counterfactual) state
is the crux of designing an evaluation exercise. The study therefore collected information for
groups/households in both the treatment and the control groups. This has enabled us to
Objectives
What were the
objectives of the
project
implemented?
Goal Alignment
How would
outcomes align
with intended
goals/objectives?
Inputs
What were put in
to achieve the
objectives?
Outcomes
What outcomes the
project has been
able to generate
upon its
beneficiaries
Outputs
What are the
measurable
results from the
project
activities?
Activities What has been
done to achieve
the project
objectives?

16
measure the size of the impact by comparing post program outcome indicators with pre-
program outcome indicators, and also match comparisons in which the post-program
behavior of the participants are compared with the behavior of a group of individuals who
were similar to the participants before they enrolled in the program. Hence, this compares the
outcomes before and after ROSC interventions among a group benefited by the project (i.e.,
experimental group) to a group not benefited by the project (i.e., control group).
2.4 Sampling and Coverage
It goes without saying that the impact assessment survey coverage must be of adequate size,
relative to the goals of the study. It must be large enough so that an effect of such magnitude
is of statistical significance. It is just as important, however, that the coverage should not be
too big, where an effect of little scientific importance is too statistically burdensome. Sample
size is important for economic reasons as well. An under-sized study can be a waste of
resources for not having the capability to produce useful and representative results, while an
over-sized one uses more resources than are necessary.
Keeping this in consideration and following the Terms of Reference, the study selects 25
percent of upazilas where the ROSC project is being implemented. Hence, a total of 23
upazilas are selected (out of 90 upazilas) which cover 10 districts. Among these 23 upazilas
50 percent of the upazilas (11 upazilas) are selected from ROSC phase one which is
completed and the rest 50 percent of the upazilas (12 upazilas) covers the ongoing phase two
of ROSC project. In the next stage, a total of 12 learning centers (one from currently
implementing 12 upazilas) are chosen and 23 villages/communities where the learning
centers are/were situated are chosen for data collection. In addition, another 23
villages/communities are chosen from the same 10 districts as control villages/communities
which possess the common socio-economic characteristics to that of the learning center
villages/communities. Households that have children aged 7-14 years are chosen for data
collection from both the groups of villages/communities. It may be mentioned here that in
selecting the learning centers and the associated villages/communities, both the on-going and
previous learning centers (which are not in operation now) are taken into consideration.
Detailed list of selected upazilas is presented in Appendix-B.

17
Sample size determination
There are several approaches to determining the sample size. However, probably the most
suitable and widely used sample size determination process for household surveys considers a
simple but efficient way. In this approach, one first specifies two critical considerations: (i)
desired width of a confidence interval; and (ii) the level of certainty with which inference can
be drawn about the population characteristics.
Based on the above, the sample size (n) can be determined using the following formula:
2
2 )1(*)(*
d
ppZn
(1)
where,
Z = Z value (e.g. with a normal distribution the value is 1.96 for the 95% confidence interval)
p = target parameter (30% in this case).
d = precision level.
Now, given that the 95 percent confidence interval is most widely used and given that the 5%
level of significance is recognized as fairly precise (we have however used here even less
than 5%, i.e, 3% level of significance), we work with a sample of 1,075 households
(considering design effect at 1.2 in this) from both the project and control
villages/communities from the selected districts and upazilas.
Hence, a total of approximately 30 households (that have children aged 7-14 years) from each
of the villages has been interviewed for data collection. Selection of households from each of
the villages has been made using the systematic random sampling technique. It may be
mentioned here that cautions is made in selecting the project as well as control villages so
that no other similar interventions are in place. This enables us to assess the impact of the
project fairly objectively. The number of sample districts and upazilas are shown in Table
2.1.

18
Table 2.1: Number of Sample Districts, Upazilas and Unions by Division
Division Sample
Districts
Sample
Upazilas
Sample
Villages
No. of Respondents
Program Control
Dhaka 2 6 12 6 x 30 = 180 6 x 15 = 90
Chittagong 2 5 10 5 x 30 = 150 5 x 15 = 75
Rajshahi 4 8 16 8 x 30 = 240 8 x 15 = 120
Khulna 1 2 4 2 x 30 = 60 2 x 15 = 30
Sylhet 1 2 4 2 x 30 = 60 2 x 15 = 30
All 10 23 46 690 345
The present evaluation study employs a variety of methods such as questionnaire survey, KII
and FGDs.
Household Survey has done in the sampled upazila based on systematic random sampling
technique. For applying the systematic random sampling, a list is prepared of all households
having children of the age group 7 to 14 in that particular village. Then a systematic random
sampling technique2 is applied to select the pre-determined sample from that list.
Focus Group Discussions (FGDs) are carried out with the representatives from both the
learning centers (CMC, Teachers, etc.), the respondents from the associated
villages/communities and parents of dropout children. A total of 23 FGDs are carried out in
each upazila to collect information in addition to collecting data from the learning centers and
the household surveys. Focus group discussions are carried out with 10-12 participants in
each.
Key Informants Interviews (KII) are also carried out with project officials, the
representatives from the project Office, school teacher and CMC chairman. A total of 23 KIIs
(excluding interviews with the project officials) are carried out to collect information.
Data are also collected from the selected learning centers on number of children, their
attendance and schooling environment and facilities available for the students in LCs. Besies,
review of all relevant documents of this project plays an important source of information
behind this evaluation.
2 In systematic random sampling, the researcher first randomly picks the first item or subject from the
population. Then, the researcher will select each n'th subject from the list.

19
CHAPTER THREE:
IMPLEMENTATION STATUS OF THE PROJECT
The key objective of the ROSC Project is to bring the out-of-school children, especially, the
disadvantaged children to school. To achieve this objective, a large number of Learning
Centers (LCs) are established in different upazilas and stipend allowance to students and
grants to LCs are provided. Besides, a large number of local NGOs are involved in the
different operational stage of the project to strengthen the capacity of local institutions for the
provision of quality education. The LCs that are established under the ROSC project are
called “Ananda School”3.
3.1 Implementation Status
Ministry of Primary and Mass Education (MoPME) is the responsible ministry for oversight
of the Project and implementing agency is the Directorate of Primary Education (DPE). A
ROSC unit is set up in DPE headed by a Project Director (PD) for day to day implementation
of the project.
At the Upazila level, the Upazila Education Office (UEO) processes applications for
establishing Ananda schools, facilitates disbursements of educational allowances and grants,
and coordinates monitoring of teacher and student attendance at Ananda schools. The UEO
reports directly to the PD, ROSC on project related matters, and shares project related
information with the District Primary Education Officer.
Center Management Committee (CMC) is responsible for managing each Ananda school. In
order to strengthen the involvement of local communities the CMC is composed of parents or
guardians of children, female ward member, Upazila Education Office (UEO), Education
Service Provider (ESP) and the Ananda school teacher. Here, UEO works as representative of
the Government and school teacher as the member secretary to the CMC.
At the local community level, CMCs are responsible for managing the Ananda schools with
support from Education Service Providers (ESPs) to assist in the day-to-day running of
3 ROSC created an opportunity to out of school children to complete their primary education cycle through
learning centers (LCs) which are known as Ananda Schools (Schools of Joy). Every LC is meant to provide
non-formal education to 30 children through one teacher.

20
Ananda schools in accordance with agreed terms and conditions. The ESPs are agencies (i.e.
NGOs) that lead community mobilization efforts to identify the target population, encourage
the CMC to start a school, and help to organize the appropriate Ananda schools. The criteria
of selecting ESPs are:
1. they could be NGOs or other educational institutions;
2. Should have a multi-district or national presence; and
3. Extensive experience in primary education, teacher training, and curriculum
development.
ROSC MIS Cell at Local Government Engineering Department (LGED) is responsible for the
services of data processing and monitoring of the activities. There work through the
Monitoring Officers under ROSC unit stationed in the upazilas to directly monitor activities
at the field level.
The ROSC Project is implemented on a limited scale in 20 Upazilas in 2005. By early 2006,
the project has expanded to 60 planned Upazilas and another 30 upazilas are added in 2010.
Hence, a total of 23 thousand LCs are opened in 90 upazilas (out of 483 rural upazilas in
Bangladesh) which created education opportunity for 7 lac 80 thousand children from poor
and disadvantaged families (ROSC 2012).
A large number of Ananda schools are established in different upazilas many of which didn‟t
follow the project criteria for the setup of Ananda School. The upazilas should have been
selected with poor performance based on selected indicators of net enrollment rates, gender
gap in enrollment, primary cycle completion rates and poverty level. There is also an Upazila
Education Committee responsible for deciding the feasibility to setup Ananda School in that
upazila. But in many cases preference of local and political influential, suggestions from
elected representatives of the local constituencies, choice of UEO are given priority. Hence,
the committee turns to be largely inactive during the whole implementation period. It is also
reported that some of the upazilas having less out of school children got the permission of
settling up Ananda school depriving some other deserving ones.
Involvement of NGOs as ESPs was a major cause of concern in the project in the first phase.
They were responsible for making the list of out of school children in communities,
monitoring the school and ensuring attendance of teachers and students in the school. ESPs
receive a service fee of Tk. 100 per students per month for monitoring. As a result the
tendency of showing and registering the name of fake students were noticeable in the LCs.

21
However, local people, community leaders and member of the CMC were not happy with the
service of NGOs. Majority of the NGOs fails to provide services whenever required despite
the substantial share of project cost incurred by them. During ROSC preparations, it was
totally infeasible to neither justify all such NGOs‟ capacities nor assess their provisions for
receiving funds (and accounting for how the money would be spent) since the NGOs could
not be identified in advance; indeed, some of them were even established instantaneously
upon hearing that ROSC was launched and there is a scope to be associated with it make
money out of it. According to the design of the project, CMC is expected to select the
responsible ESPs. In practice, however, it is decided from outside in most of the cases.
The idea of operating the LCs with oversight support from CMCs is a challenging decision
where a sizable portion of the membership was illiterate. The ROSC turns to be far more
ambitious assigning CMCs the responsibility of selecting teachers from the local community.
This challenging role is also played by Upazila Education Officer (UEO) in most of the cases.
CMC seems to be a committee of implementing the decision of UEO. In some of the cases
CMC enters into contracts with NGOs for services to help manage LCs and train the teachers.
For ROSC, DPE‟s Upazila level administration is expected to provide support for
management and capacity building to LCs and visit them regularly, but these functions are
not usually in the UEO‟s mandate. Hence, monitoring of Ananda school is an additional
responsibility in UEO‟s regular activity and turns to be an over burden for them. As a result,
most of the UEO visit Ananda school on the way back from their official visit of own
assigned work not as a part of regular monitoring activity.
According to parents, Ananda school teachers play a vital role in providing information
regarding sending their children in Ananda School and their participation in the project.
However, during the project running time a sizeable share of students in some places left
other schools and enrolled in the Ananda Schools due to its flexible timing. If this pattern
continues then the ability of ROSC project to reduce number of out of school children may be
compromised.
Ananda school teachers do not receive their salary regularly on a monthly basis. Usually they
receive their honorarium 4 to 6 months after. The payment is channeled through their bank
account. But some of the school teachers reported that the CMC members take away some
percentage of their honorarium after withdrawing from bank account.

22
At the local community level, CMC is responsible for managing the day-to-day running of
Ananda schools. However, the performance of CMCs is rather unsatisfactory. Most of the
CMC members do not monitor the activities of school regularly. Usually the visit occurs one
or two month after. Some of the CMC chairman report that NGOs are responsible for
monitoring the day to day running of Ananda schools and the responsible officers of those
NGOs were not playing their monitoring activities regularly. Similarly, the CMC members
meet irregularly 2 to 3 months after for reviewing project activities if it is needed. It is
reported that committee‟s meeting usually happens when any visitor comes from outside. In
some areas, CMC seems a committee only in paper. In reality, we did not find any proof of
their meeting after checking the regulation and monitoring book and having conversation
with the school teacher.
3.2 Procurement under the Project
There is no procurement reported through international competitive bidding. The major
portion of Grant proceeds comprises allowances for out-of-school children and grants
transferred to CMCs, who has the primary responsibility for procuring materials and hiring
teachers. Remaining procurement consisted of buying four new cars and some furniture for
the ROSC unit. There is no additional procurement planned and all procurements and
purchases have done following the Public Procurement Rules (PPR).

23
CHAPTER FOUR: SOCIO-ECONOMIC CHARACTERISTICS OF
SAMPLED HOUSEHOLDS
This chapter represents a discussion of socio-economic conditions of the households which
have 7-14 years aged children. We continue the discussion between program and control
households using selected number of parameters.
Profile of survey households
We start our analysis with some basic characteristics of the survey households i.e. gender and
educational status of household head, household size, average income and expenditure per
household to have some general idea about the socio-economic condition of these households
where children live. It has been seen from table 4.1 that the gender distribution of household
is almost similar between program and control village considering gender of household head.
In program households, around 96 percent of the households are headed by male while only 4
percent are headed by female, which is true for control households also.
4.1: Distribution of Households by Gender of Household‟s Head
Gender
Program Control
Number Percentage Number Percentage
Male 660 95.7 331 95.9
Female 30 4.3 14 4.1
Total 690 100 345 100
*Note: Some of the responses are dropped due to missing information.
If we look at Table-4.2, we see that children in ROSC village are more likely to live in
households that have less educated household head. Above 50 percent of households head has
no formal education while only 1.3 percent has education level Honours and above. In
control village statistics are somewhat worsen than that of program village. Around 54
percent of household‟s head has no formal education while only 0.9 percent has honours and
above education level.

24
4.2: Distribution of Households by Level of Education of Household‟s Head
Level of Education Program Control
Number Percentage Number Percentage
No Education 355 51.4 185 53.6
Class I to V 168 24.4 98 28.4
Class VI to IX 97 14.1 42 12.2
SSC 37 5.4 10 2.9
HSC 24 3.4 7 2.0
Honours 7 1.0 2 0.6
Masters 2 0.3 1 0.3
Total 690 100 345 100
*Note: Some of the responses are dropped due to missing information.
In case of income earnings, households derive their incomes from three major sources:
agriculture, wages and salaries received in exchange for labor and business. Agriculture
earnings come from sources like agricultural production, livestock and poultry rearing and
fish cultivation and catching. Around 31 of household income come from this major source.
27.4 percent come from wages (agri and non-agri) and 14.3 percent from business. For
control households, about 36 percent of household income receives from sources relates to
agriculture, 24 percent receive in the form of wages and 11.6 percent from business (Table
4.3).
Table 4.3: Main Income Earning Source by Program participation
Income Sources Program Control
Number Percentage Number Percentage
Agriculture 161 23.3 90 26.2
Rearing Livestock 21 3.0 16 4.7
Rearing Poultry 3 0.4 4 1.2
Catch Fish/Fish Sale 29 4.2 12 3.5
Agri. Labour Wage 121 17.5 64 18.6
Non-Agri. Labour Wage 68 9.9 29 8.4
Small Occupation 27 3.9 8 2.3
Small Business 61 8.8 29 8.4
Middle/Large Business 38 5.5 11 3.2
Service/Salary 45 6.5 24 7.0
Foreign Remittance 37 5.4 24 7.0
Gift/Donation 2 0.3 1 0.3
Other 77 11.2 32 9.3
Total 690 100.0 344 100.0

25
Findings from Table 4.4 suggest that both the program and control village respondents have
similar socio-economic characteristics in case of household size, income and expenditure.
The average household size is similar for both program and control households; 5.24 for the
program household compared to 5.26 for the control households. The average monthly
income of program households (Tk. 8784.74) is slightly higher (1.71%) than that of control
households (Tk. 8634.74); while the average monthly expenditure is only 3.92 percent higher
for program compared to control households. The mean difference4 of the selected outcomes
between program and control village shows that there is no significant difference between
control and program households which confirms the proper selection of control village
among all other alternative villages.
Table 4.4: Salient Characteristics of Households
Category Program Control Mean
difference
Averages
Household size 5.24 5.26 -0.026 (0.855)
Land holding size (in decimals) 39.79 32.37 7.42 (0.14)
Average household income
(monthly in Tk.)
8784.74 8634.74 150.0 (0.707)
Average household expenditure
(monthly in Tk.)
7971.37 7658.43 312.94 (0.415)
Note: *All values of mean comparison test are statistically insignificant.
*p values of mean comparison tests are given in the „()‟.
According to our survey, the total child population aged 7-14 years is 1597, of them 1070
belong to program households and 527 belong to control households. The male and female
ratio of children in the sample households is almost equal across program and control
villages. The data presented in Table 4.5 also include the distribution of the child population
for selected age categories. In the program households, the number of children of age 10 and
12 are highest, i.e. above 14 and around 16 percent of total children in program villages while
in control the highest number of children lies in age category 7 and 10, i.e. around 15 percent
of total children in control villages.
4 Mean difference test is the t tests on the equality of two group‟s means to determine if the difference
between the groups is statistically significant, that is, if the difference is due to something other than
random chance.

26
Table 4.5: Age-gender distribution of children in the sample villages (aged 7-14)
Age Program Control
Male Female Total Male Female Total
7
70
(53.44) [13.11]
61
(46.56 [11.38]
131
(100 [12.24]
37
(46.84 [13.26]
42
(53.16 [16.94]
79
(100 [14.99]
8
70
(54.69) [13.11]
58
(45.31) [10.82]
128
(100) [11.96]
38
(52.78) [13.62]
34
(47.22) [13.71]
72
(100) [13.66]
9
61 (46.92)
[11.42]
69 (53.08)
[12.87]
130 (100)
[12.15]
36 (56.25)
[12.9]
28 (43.75)
[11.29]
64 (100)
[12.14]
10
76
(50.33
[14.23]
75
(49.67)
[13.99]
151
(100)
14.11]
44
(57.14)
[15.77]
33
(42.86)
[13.31
77
(100)
[14.61]
11
61
(52.14)
[11.42]
56
(47.86)
[10.45]
117
(100)
[10.93]
28
(53.85)
[10.04]
24
(46.15)
[9.68]
52
(100)
[9.87]
12
75
(44.64) [14.04]
93
(55.36) [17.35]
168
(100) [15.7]
32
(45.07) [11.47]
39
(54.93) [15.73
71
(100) [13.47]
13
52 (46.02)
[9.74]
61 (53.98)
[11.38]
113 (100)
[10.56]
27 (48.21)
[9.68]
29 (51.79)
[11.69]
56 (100)
[10.63]
14
69 (52.27
[12.92]
63 (47.73)
[11.75]
132 (100)
[12.34]
37 (66.07)
[13.26]
19 (33.93)
[7.66
56 (100)
[10.63]
Total
534
(49.91
[100]
536
(50.09)
[100]
1,070
(100)
[100]
279
(52.94)
[100]
248
(47.06)
[100]
527
(100)
[100]
*() indicates row percentage and [] indicates column percentage.
To determine households‟ poverty status, three groups are created following the upper and
lower poverty line income of the poor as reported in the household income and expenditure
survey 2010.
1. Extreme poor: Households‟ per-capita income falls below the lower poverty line
income.
2. Moderate Poor: Households‟ per-capita income falls within the lower and upper
poverty line income.
3. Non-poor: Households‟ per-capita income is above the upper poverty line income.
The poverty status of the sample households shows that over forty percent of the
households in both the program and the control villages belong to the category of poor
households (Table 4.6 and Table 4.7).

27
Table 4.6: Household‟s Poverty Status using Income
Poverty Status Participation Category
Program Control Total
Extreme Poor:
183 (63.99)
[26.52]
103 (36.01)
[29.86]
286 (100)
[27.63]
Moderate Poor
104
(66.67)
[15.07]
52
(33.33)
[15.07]
156
(100)
[15.07]
Non Poor
403 (67.96)
[58.41]
190 (32.04)
[55.07]
593 (100)
[57.29]
Total 690
(66.67)
[100]
345 (33.33)
[100]
1,035 (100)
[100] Note: Poverty Status are determined using upper and lower poverty line income reported in the HIES 2010.
( ) indicates row percentage and [ ] indicates column percentage.
Besides, a sizeable number of household falls under the category of extreme poor and some
belongs to moderate poor category. According to per-capita income, around 27 and 30
percent of the households in program and control villages fall under extreme poor category.
The number is 24 percent in case of per-capita expenditure of program and control village‟s
households.
Table 4.7: Household‟s Poverty Status using Expenditure as a Proxy for Income
Poverty Status Participation Category
Program Control Total
Extreme Poor:
166
(66.14) [24.06]
85
(33.86) [24.64]
251
(100) [24.25]
Moderate Poor
80
(63.49) [11.59]
46
(36.51) [13.33]
126
(100) [12.17]
Non Poor
444
(67.48)
[64.35]
214
(32.52)
[62.03]
658
(100)
[63.57]
Total
690
(66.67)
[100]
345
(33.33)
[100]
1,035
(100)
[100] Note: Poverty Status are determined using upper and lower poverty line income as reported in the HIES 2010.
( ) indicates row percentage and [ ] indicates column percentage.

28
Which is interesting is that program and control village households‟ poverty status are quiet
similar. As the selection of the control village is based on similar socio-economic background
of program village, there exists no significant difference between the socio-economic
characteristics of program and control villages.

29
CHAPTER FIVE: IMPACT OF ROSC TO BRING OUT OF SCHOOL
CHILDREN TO SCHOOL
The Reaching Out-of-School Children (ROSC) Project is a new initiative by the government
to develop interventions to encourage the most disadvantaged out-of-school children to attend
Learning Centers that are designed to provide quality primary education to these children.
5.1 Impact on Enrollment:
A thorough evaluation of the ROSC Project through the analysis of the household level data
indicates that there is considerable variation in enrollment rates across project and control
locations. Around 92 percent of the children in program households are currently enrolled in
school where in control only 83 percent of them are currently enrolled (Table 5.1). That
means the prevalence of primary school-aged out-of-school children is considerably lower in
the program areas compared to that of the control areas.
Table 5.1: Number of Students currently attending school by Participation Category
Currently going to school Program Control
Number Percentage Number Percentage
Currently Going 983 91.87 440 83.49
Not Going 87 8.13 87 16.51
Total 1070 100 527 100
Primary schools in rural Bangladesh include government school, semi-government school,
private school, community school, madrassa (Islamic education school), non-formal schools
run by NGOs, and the recently introduced Ananda school. Majority of the students (48 and
55 percent in program and control villages respectively) are currently attending Government
school. Table 5.2 shows the percentage of all school students by program participation
category. Above 11 percent of students in all ROSC project areas go to Ananda school that
are currently running under ROSC phase II. Besides, students are also attending semi-
government and Madrasa school.

30
Table 5.2: Type of School Currently Attending by Participants Category
Type of School Program
(%)
Control
(%)
Ananda School 11.39 -
Government 48.02 55.00
Private 6.71 8.18
Semi-Government 18.41 17.95
Madrasa 12.00 13.86
NGO School 2.14 4.32
Others 1.32 0.68
Parents of the students from Ananda School mention that provision of allowances given to
the parents is the main reason behind the attraction of more children to attend Ananda school.
As majority of them belong to poor family, education stipends as well as distribution of free
books, stationery and school uniforms lessen the educational cost burdens on children
families. Besides, the distance of nearest primary school comes out as second major reason of
Ananda school participation. The rest (above 21 percent) replies the flexible timing of
Ananda School to suit the need of under privileged children as another reason behind Ananda
school participation (Table 5.3).
Table 5.3: Reason for attending Ananda School reported by Parents
Reasons N %
Distance of Primary school 37 33.04
Flexible timing 24 21.43
Stipend of Ananda school 49 43.75
Others 2 1.79
Total 112 100.00
This finding suggests that the incentive of education allowances provides to families to send
their children to Ananda schools is probably successful in attracting out-of-school children to
school along with setting up schools in close proximity with flexible timing.

31
5.2 Impact on School Dropout
One of the main reasons behind establishing Ananda schools is to attract out of school
children (OSC) who are away from formal schooling system. But still there is a sizable
proportion of out of school children prevails in program and control villages. Above 93
percent and 77 percent of the children in program and control villages are currently out of
school that have attended school previously but dropped out for various reasons. This
indicates that while ROSC has been successful in some respect to bring out of school children
to school, it has not been able to contribute much in reducing the overall dropouts of school
aged children in the respective areas.
Table 5.4: proportion of children went to school earlier by program participation
Whether went to school? Program Control
Number Percentage Number Percentage
Went to School 81 93.10 69 77.53
Never been to School 6 6.90 18 20.69
Total 87 100 87 100
The problem of out of school children is still a major cause of concern in the project area as
well in other areas. One time admission process in Ananda school is the main reason behind
failure of targeting 100 percent of out of school children of a particular area. Participants
from various FGDs mentioned that provision of only 30 students per school for the entire
duration and non-provision of yearly admission provide schooling opportunity to three-fourth
of total out of school children of the targeted upazilas. Still one-fourth out of school children
do not get the opportunity even at the time of school establishment, which certainly increases
over the time of five years period of the project, let alone afterwards.
From the survey, we tried to find out the reasons behind their drop out from school. Around
21 percent of the OSC are currently engaged in different work (Appendix Table C1), i.e.
work related to agriculture, household work with and without pay, work related to petty
business and work outside the locality as migrant worker. Above 20 percent of children‟s
guardian mention failure of bearing the cost of schooling as another main reason of children‟s
drop out from school. There are also reasons that are related to children‟s poor performance
in exam and unwillingness to go to school (Table 5.5).

32
Table 5.5: Reason for Dropping Out from Schools as Reported by Parents
Reasons Percentage
Don‟t want to go School 18.2
Not well in Exam 15.6
Engaged in work 20.8
Not possible to bear the schooling expenses 20.3
Unavailability of school in the locality 2.6
Preferred religious school 2.1
Siblings are going to school 1.6
Schooling is not important 1.0
Work in household chores / look after household members 5.7
Handicapped/ill or need special arrangement 2.2
Walking towards school is not safe 1.0
Others 8.9
Total 100
5.3 About the School, Gender Parity and Employment
Ananda schools are single classroom and single-teacher schools. The average size of the class
is 23 students among which 14 (63 percent) come from extreme poor household and 1 (6
percent) belong to the category of disable or special child (Table 5.6).
Female empowerment is one of the most marked achievements of ROSC. Over three-fourths
of the teachers of the LCs are female. In addition to the equity achieved in female and male
enrollment rates in the LCs, a greater proportion of female children (53 percent) than male
are actually enrolled in the LCs.
ROSC contributes to the creation of new job opportunities for women in rural areas directly
through employing teachers for LCs, and in the longer term, by encouraging female children
(males as well) to complete their primary education, moving on to secondary school and then
to remunerative employment.
The multiplier effects of educating poor children especially poor girls leading to a positive
impact on their career opportunities could have a far-reaching impact on Bangladesh‟s
economic and social development, especially in terms of poverty reduction.

33
Table 5.6: Detail Information about Ananda School
Information Number/%
Average Size of the class (Number) 22.67
Students from extreme poor family (Number) 14.17
Nunber of special children 1.25
% of student aged above 14 16.67
% of student below 7 0
Average Size during Establishment (Number) 33.67
% of female students 53
% of female teacher 75
Primary school pass rate (%) 98
Facility %
Have black board in the school 100
Sitting arrangements: 100
Sitting arrangement on bare floor 16.67
Sitting arrangement on jute burlap or mat 66.67
Sitting arrangement on bench 16.67
Have toilet facility 0.00
Have facility for drinking water in the
nearest/eighbor‟s house
100
Have sufficient space 27.27
Have sufficient light 81.82
Have attendance register in the school 100
Attendance rate %
School attendance rate 85.67
Average days of attendance per month (female) 23.75
Average days of attendance per month (male) 22.5

34
Basic facilities for conductive learning environment are not encouraging in most of the Ananda
Schools. Although in all Ananda Schools, almost all are observed to have black board, chalk and
attendance registration book, they suffer from lack of sufficient space, proper sitting arrangements,
lack of toilet and othet facilities.
5.4 Primary School Pass Rate
The study findings reflect that enrollment in ananda school is satisfactory with highly
satisfactory primary school pass rate (98 percent). The rate is higher than average national
rate of primary school completion examination, because not all the students enrolled in
Ananda School get the change of attending primary school completion exam. There is a
selection process based on previous performance to identify who may pass the exam. Only
those who quality are allowed to sit for the final exam. On an average around 12-15 students
among all 30 enrolled students sit for the exam. Hence, the primary education completion
rate for the Ananda school students turns out to be about 45%. Teachers of Ananda school
report that a large number of children put into the schooling process could not come out with
desired level of achievement.
The large number of dropouts from the system has created big gap between enrolment and
completion rate. Again the quality of school performance is affected by various factors like
lack of adequate infrastructure and attractive teaching learning environment, lack of
appropriate teaching materials, shortage of trained teachers, crowded classrooms, lack of
supervision and monitoring, lack of community participation and the passive role of CMCs.
5.5 Quality of Education in the ROSC Learning Centers
The quality of education of Ananda Schools may be assessed by evaluating the primary
school pass rates of the selected schools. For Ananda Schools, primary school pass rate is
highly satisfactory. About 98 percent of students of Ananda schools who appeared in primary
school completion exam passed successfully.

35
Although the achievement is satisfactory, students of Ananda School need to go through
several adverse circumstances to sit for completion exam. Some of the school teachers
reported that students of Ananda schools who sit for primary school completion exam sit in
the nearest primary school but in the floor as there is no arrangement of seats for the Ananda
school students in those schools. It also come out through focus group discussions that
students of Ananda school need to go through several checking for entering into exam hall as
some of them are looked aged than usual primary school students. In some cases, the
checking goes up to police, also sometimes for the possibility of identifying fake students.
However, despite the fact that the Ananda schools are doing relatively well and the
communities are also largely welcoming these schools, there are also challenges and barriers
that emerged from all the focus groups discussions. The one resounding complaint across all
focus groups is lack of educational environment such as, adequate classrooms, no bench for
students, etc. Our survey data also indicate that facilities provided in Ananda school is not
quite satisfactory. About 84 percent of Ananda students sit on the floor (on mat, jute burlap,
or bare floor). Students do not have any toilet facility and drinking water facility. All students
use the water source of nearest neighbor for drinking and use the neighbor‟s toilet for
defecation.
5.6 Proportion of Ananda School Students Graduated to Secondary Level
One of the primary objectives of ROSC project is to give education opportunity to out of
school children so that they can complete the primary school cycle and graduate to secondary
level. To capture this graduation rate to secondary level several questions have been asked.
Of the total students enrolled in Ananda schools, about 45% completes primary school cycle
with successfully passing the Primary School Certificate (PSC) examination. Those who
cpmpletes PSC, only about 30% of them get enrolled in the secondary level. Hence, a total of
only about 13-14% of the Ananda students graduate to the level of secondary schools.

36
CHAPTER SIX: MAJOR FINDINGS AND LIMITATIONS
The study identifies major findings of the project based on its strengths and weaknesses that
come out from review of secondary materials, discussion with beneficiaries, discussion with
project officials, key informant interview and focus group discussions. These findings of the
project are very important to prepare and implement similar project in the near future.
Implementation status
Implemented fully in terms of numbers
But not quite as per the rules and regulations of the project
Schools were established without taking the need of the community into consideration
in many places
School management and monitoring were also weak in most cases
Several GO and NGO agencies were involved in implementing the project and there
were co-ordination problem between them.
New phase is, however, trying to take care of the problem faces during phase-I
implementation
Present Functional Status
Phase-I schools do not exist in most cases
Few schools that started towards the end of phase-I are, however, still in operation
under the new phase
These schools are doing better than the earlier ones as it came through some learning
experiences
However, they are still facing some problems, such as: class rooms, logistics,
monitoring etc.
Procurement:
Not much procurement was done under the project apart from buying four vehicles
and some logistics
Procurements and purchases have been done following the PPR‟08.

37
Project Impacts:
Despite the fact that there have been some bottlenecks in implementing the project activities,
it has been successful in creating some significant positive impacts upon its target
beneficiaries as follows:
School enrollment has increased
Dropout rate has fallen
OOSC from poor and disadvantaged households and children with disability are now
getting the school opportunity due to „close proximity‟ and „flexi –time‟
Quality of teaching and learning is also quite encouraging; primary school pass rates
of these schools are good
Females are getting priority in getting teaching jobs in these schools
However, there are still OOSC children in the project areas.
Limitations of the Project:
Poor selection of place for Ananda School
Fake enrollments in Ananda School
Overlapping enrollment in some places
One-time enrollment in Ananda School
Inadequate logistics for students in Ananda School
Delay in transferring funds and providing logistics
Lack of proper monitoring in all stages of project implementation
Co-ordination problem with different agencies involved as well.

38
CHAPTER SEVEN: CONCLUSIONS AND RECOMMENDATIONS
ROSC creates a new dimension of alternative practices and methods in the delivery and
management of primary education. Although it faces some difficulties during project
implementation stage, the objectives and design of ROSC were and are still fully relevant to
the country strategy. There should be the provision of alternative practices of primary
education delivery because of several reasons including: remote and inaccessible areas that
still exists in the country (such as, Chittagong Hill Tracks, char lands, haor and coastal areas,
etc.), non-existence of primary schools in close proximity, inability of the children of some of
the families to attend schools during standard school timing, sending children to work by
many poor families, social stigma and lack of awareness of many poor and disadvantaged
parents as well. So, as alternative learning mechanism, the idea of ROSC is very much
relevant for the country like Bangladesh and is also appreciated by the local communities.
The Government of Bangladesh with support from development partners devotes a
significant amount of money to provide incentives to poor rural families to send their children
to school. This initiative makes good progress in the level of primary education since it‟s
inception. The achievements of this education intervention have been impressive as good
proportion of out of school children, particularly from poor and disadvantaged families are
now attending and enjoying school.
The analysis of data indicates that there is considerable variation in enrollment rates across
project and control locations. Flexible timing, schools in close proximity and incentive of
education allowances provided to families are emerged as important factors in attracting out-
of-school children to school. Besides, the primary school pass rate is also highly satisfactory
for Ananda school students although the facilities provided to them are so poor. ROSC also
contributes to the creation of new job opportunities for women in rural areas directly through
employing teachers for LCs.
Although the project takes some time to gain momentum, ROSC clearly performs well in
expanding access and making significant advances on education quality. But this innovative
approach of community-led learning centers and no-cost schooling incentives for the poor
children and former drop-outs come through some drawbacks also. Majority of the criticisms

39
belongs to selection and set up of Ananda Schools, the performance of CMCs, selection of
school teachers, responsibility of upazila education officers, etc.
A large number of Ananda schools are established in different upazilas without following the
selection criteria for the setup of Ananda School. Involvement of NGOs as ESPs and their
roles and responsibilities were also major cause of concern in the project implementation
stage. At the same time the performance of CMCs was unsatisfactory. Most of the CMC
members do not monitor the activities of school regularly.
Some observations also emerged from the results of our assessment of the ROSC Project. The
number of out of school children is still a major cause of concern in the project area. One
time admission process in Ananda school is the main reason behind failure of targeting 100
percent of out of school children of any particular area. Hence, adjusting some of the major
criteria of school setup and continuation and ensuring the responsibilities of communities as a
whole, this model (in rural areas) can go further to provide second chance education to all
disadvantaged children in the country.
But the way it is implementing need some major change to attract and admit more out of
school children to school. According to various focus group discussion and interviews with
other stakeholders this changes can come through:
Relaxing one time cohort admission of 30 students and allowing yearly admission to
incorporate as many as out of school children.
Class size can be reduced to 15 to 20 depending on student availability. This will
allow the placement of Ananda School in inaccessible and remote areas, where out of
school children are not that much.
Technical training (i.e. electrician, master mason, cow fattening, livestock rearing
etc.) through vocational education can be provided to students who are above 10 year
old. So that if for some reason they are dropped out from school they can engaged
with some kind of income generating activities.
Hence, the concept of one teacher in one school may be relaxed due to the demand of
vocational training. Additional teacher can be recruited who is expert of giving
vocational training.

40
Before setting up any Ananda School, there should be a survey done to justify the
need of schools in any particular area. This justification can be done through
identifying the highest number of out of school children of the areas.
Ensuring proper and timely inputs/logistics to the school
Communicating these with all the relevant stakeholders so that it can draw attention
and support from them.

41
APPENDIX
Appendix A: Component-wise Allocation and Expenditure (as per latest approved PP)
( Taka in Lakh)
Item of Works
(as per PP) Unit
Target as per PP Actual Progress
Finance Physical
Quantity Finance
Physical
Quantity
1 2 3 4 5 6
1. Manpower 20 person 336.09 20 320.81 20
2. Grant 22482 LC 36529.6 22482 LC 35244.80 22482 LC
3. Education Allocation 750000 student 21418.73 750000 student 21401.23 750000 student
4. Vehicle (Motor Car) 5 86.72 LS 86.72 5
5. Equipment LS 33.97 LS 33.97 LS
6. Furniture LS 4 LS 4 LS
7. Local Training /
Workshop
3515 pm/ 267
unit 823.5 0 741.26
3515 pm/ 267
unit
8. Study Tour 40 mm 250 40 mm 241.07 38.04 mm
9. Consultant (Local) 446 mm 366.57
1292.85 446 mm
10. Stationary LS 16.59 LS 16.59 LS
11. Goods (Printing) LS 84.21 LS 63.7 LS
12. Fuel LS 68.37 LS 64.91 LS
13. Maintenance LS 57.08 LS 54.8 LS
14. Registration of Vehicle LS 1.54 LS 1.54 LS
15. Monitoring (LGED) LS 1728.01 LS 1722.01 LS
16. Operating Cost of
Education Allowances &
Grants
LS 1485.04 LS 1484.66 LS
17. Traveling Allowances &
Others LS 27.78 LS 23.19 LS
18. Tax LS 1.53 LS 1.52 LS
19. Contingency LS 180.68 LS 145.98 LS
20. Miscellaneous LS 38.17 LS 38.15 LS
Total - 64538.18 - 62983.77 -
Source: IMED, Ministry of Planning, GoB: „Project Completion Report; IMED 04/2003 (Revised)‟.

42
Appendix B: List of Selected Districts and Upazilas
Division District Upazila Union Village
Dhaka
Manikgonj
Daulatpur Chak Mirpur Chandra Khola
Chak Mirpur Mulkandi
Sibaloy Ulail MuktaNagar
Ulail HafezNagar
Manikganj Sadar Krishnapur ImamNagar
Saturia Saturia Koujuri
Tangail
Bhuapur Aloya Bil Amula
Aloya Golabari
Gopalpur Dhopakandi Jangalia
Dhopakandi Shajanpur
Kalihati Narandia Tarabari
Kokdohra Ghaturia Bari
Chittagong
Cox‟s Bazar
Mohishkhali Kutub Jom Horiaghona
Kutub Jom Tajia Kata
Ukhia Holdia Palang Keorachori
Rajapalang Digalia
Teknaf Shabrang Fateh Ali Para
Teknaf DakkhinLangurBil, Adarsho Gram
Comilla
Chandina KeronKhal Kuyarpar
MaijKhar Bamni Khola
Nangalkot Peria Khosarpar
Mokrabpur Mokrabpur
Rajshahi
Rajshahi
Naogaon
Atrai Kalikapur Baipur
Sahagola Mirapur
Manda Manda Bholam
Paranpur Fetgram
Porsha Nitpur Jugi Danga
Nitpur Kalaibari
Rajshahi Bhaga Gargari Bramman Danga
Monigram Tulsipur
Bogra
BograSadar Rajapur Rajapur (Mathpara)
Baghopara Sultanpara
Gabtoli
Torupmeru (Dakkhin)
Torupmeru 7 no.
Naruamala Mendipur
Nilphamari
Jaldhaka Koimari Mouyamari (Chowdhurypara)
Kathali Poschim Kathali (Daktarpara)
Syedpur Botlagari Majhipara
Botlagari Uttar Sonakhuli
Khulna Khustia
Daulatpur Daulatpur Bejpur Uttarpara
Hogalbaria Taragunia Kacharipara
Mirpur Bohalbaria Sathbaria Malithapara
Bohalbaria Naoda Khadimpur Malithapara
Sylhet Moulvibazar
Kamalganj 8 no. Madhabpur Nurjahan Tea Garden (6 no. Line)
8 no. Madhabpur Nurjahan Tea Garden (Gangpar)
MoulvibazarSadar Kamalpur Raipur
Kamalpur Goykhor
5 10 23 46 46
*Highlighted ones denote currently implementing ROSC phase II upazilas.

43
Appendix C: Additional Tables
Table C1: Occupation of OOSC
Activity N %
Agri. Work 6 18.75
Household work 4 12.5
Maid servant (with pay) 2 6.25
Work outside locality 14 43.75
Business 3 9.375
Other 3 9.375
Total 32 100

44
D: Matrix form of FGDs
Issues/Questionnaire Response from FGDs Percentage
1. GjvKvq cwiPvwjZ Avb›` ¯‥zjwU
m¤ú‡K© aviYv |
1. mevB fv‡jvfv‡e Rv‡b 86.96
2. †gvUv‡gvwU Rv‡b 13.04
2. Avb›` ¯‥z‡ji wk¶v_x©‡`i aiY|
(Kviv ¯‥z‡ji wk¶v_x© )
1. AwZ `wi ª cwiev‡ii wkï 47.83
2. `wi ª cwiev‡ii wkï 82.61
3. 7-14 eQi eqmx wkï 60.87
4. ¯‥z‡j bv Avmv wk¶v_x© 39.13
5. S‡i cov wkï 73.91
6. cÖwZeÜx 4.35
7. myweav ewÂZ 4.35
8. Kg©Rwwe `wi`ª wkï 4.35
3. wk¶v_x©‡`i wbe©vPb cÖwµqv |
1. Rix‡ci gva¨‡g 13.04
2. wkw¶Kv evwo evwo wM‡q msMÖn K‡i‡Q 34.78
3. ¯‥z‡ji cÖwZôvZv ev D‡Ïv³v (hvi evwo ¯‥zj) msMÖn K‡i‡Q| 8.70
4. AwffveK ev ¯D‡Ïv‡M fwZ© K‡i‡Q 21.74
5. `wi ª I nZ`wi ª wbe©vPb K‡i 8.70

45
6. Rv‡b bv 4.35
7. NGO Kgx©‡`i Rwi‡ci gva¨‡g 17.39
8. `wi ª I S‡i cov‡`i cÖvavb¨ 13.04
9. Dc‡Rjv wk¶v Awdmvi I ROSC-Gi gva¨‡g 4.35
4. wbe©vPb cÖwµqv wb‡q wK mš‘óy ? 1. nu¨v 100.00
2. bv 0.00
5. nu¨v n‡j mš‘wói KviYmg~n | 1. wk¶v_x©‡`i wbe©vPb cÖwµqv ¯^‛Q wQj 17.39
2. hviv S‡o c‡o‡Q g~jZ Zv‡`i‡KB wPwýZ Kiv n‡q‡Q 47.83
3. nZ`wi ª‡`i cÖvavb¨ †`Iqv n‡q‡Q 30.43
4. NGO evox evox wM‡q mwVK ev‛Pv‡`i wPwýZ K‡i‡Q 13.04
5. miKvix cÖvBgvix ¯‥z‡ji wk¶K Øviv wjó n‡q‡Q 26.09
6. cÖwZeÜx wkïiv fwZ©i my‡hvM †c‡q‡Q 4.35
7. hviv KLbI ¯‥z‡j hvq bv Zviv my‡hvM †c‡q‡Q 30.43
8. 6 eQ‡ii Kg eqmx wkïiv fwZ©i my‡hvM †c‡q‡Q 17.39
9. myweav ewÂZ `wi`ª wkïiv covi my‡hvM cv‡‛Q 47.83
10. wba©vwiZ 30 R‡bi †ekx wk¶v_x© fwZ©i my‡hvM †c‡q‡Q| 8.70
11. wk¶K Ges Management †hfv‡e KvR K‡i‡Q Zv‡Z Avgiv mš‘ó 17.39

46
6. bv n‡j Amš‘wói KviYmg~n | -- -
7. wkw¶K‡`i wbe©vPb cÖwµqv |
1. ‡g․wLK cwi¶vi gva¨‡g 17.39
2. AwfÁZvi Av‡jv‡K 13.04
3. wk¶vMZ †hvM¨Zv 26.09
4. Ab¨vb¨ NGO-Gi wk¶KZvi AwfÁZv 4.35
5. Dc‡Rjv wk¶v Awdm wb‡qvM w`‡q‡Q 43.48
6. ivR‣bwZK e¨w³‡`i mycvwik 4.35
7. gv`vi ¯‥z‡ji cÖavb wk¶‡Ki mycvwi‡k 8.70
8. SSC cvk 21.74
9. HSC cvk 13.04
10. cÖfvekvjx 4.35
11. AvZ¥xqKiY 8.70
12. Rv‡b bv 17.39
13. wb‡qvM weÁwßi gva¨‡g wjwLZ I †g․wLK cix¶v w`‡q 13.04
14. Avb›` ¯‥z‡j wk¶vKZv Kivi AwfÁZv 4.35
15. Ab¨vb¨ ¯‥z‡j wk¶vKZv Kivi AwfÁZv 8.70
16. NGO‟Kg©KZ©v‡`i mycvwi‡k wb‡qvM 4.35

47
17. f ªZv †`‡L 8.70
8. ¯‥z‡ji wkw¶K‡`i AwfÁZvi aiY| 1. Brac ¯‥z‡j `k eQi wk¶KZvi AwfÁZv 4.35
2. Foundation and Ref. Training cÖvß 4.35
3. wk¶KZvi c~‡e© †Kvb AwfÁZv bvB 13.04
4. ¯‥z‡j wk¶K‡`i AwfÁZv fv‡jv 17.39
5. cÖwk¶‡Yi AwfÁZv 43.48
6. wk¶vKMZ †hvM¨Zv 26.09
7. †gvUvgywU 8.70
8. Ab¨vb¨ NGO ¯‥z‡j wk¶KZvi 10-15 eQ‡ii AwfÁZv 13.04
9.cÖ_g ch©v‡q Avb›` ¯‥z‡j cvV`v‡bi AwfÁZv 34.78
10. †KvwPs †m›Uv‡i cvV`v‡bi Awf¶Zv 4.35
11. ¯‥z‡ji wk¶K‡`i SSC †_‡K B A ch©š— cvk wk¶K wQj hviv B‡Zvc~‡e© Ab¨ †Kvb
NGO wk¶KZv K‡i‡Q|
17.39
9. wk¶K‡`i wk¶v`v‡bi ¸YvMZ gvb
evov‡bvi Dcvq|
1. †Uªwbs Gi gva¨‡g 56.52
2. wk¶v DcKi‡Yi gva¨‡g 13.04
3. cÖwk¶Y e„w× 34.78
4. welq wfwËK cÖwk¶‡Yi e¨e¯’v 13.04
5. wk¶KZvq AwfÁZv‡K cÖvavb¨ †`Iqv 8.70

48
6. wk¶K‡`i †eZb e„w× 13.04
7. cvV¨cy¯—K cwieZ©‡bi mv‡_ mv‡_ H wel‡q cÖwk¶Y w`‡Z n‡e 8.70
8. Moniroring †Rvi`vi Ki‡Z n‡e 4.35
9. ¯‥zj wkw¶Kvi evwo †_‡K Ab¨Î ¯’vbvš—i Ki‡Z n‡e 13.04
10 wk¶K‡`i Bs‡iRx, AsK wel‡q wi‡d«kvm© †Uªwbs 4.35
11. wk¶K‡`i †eZb wbqwgZfv‡e (wej¤^ Qvov) w`‡Z n‡e 4.35
12. Avb›` ¯‥z‡j GKvwNK wk¶K wb‡qvM w`‡Z n‡e 4.35
10. Avb›` ¯‥z‡ji Kvh©µg wK ch©‡e¶b
Kiv nq ?
1. nu¨v 95.65
2. bv 4.35
11. GB Kvh©µg ch©‡e¶‡bi aiY | 1. wbqwgZ 56.52
2. AwbqwgZ 39.13
12. Kviv ch©‡e¶Y K‡i ? 1. NGO Kgx©iv 43.48
2. Dc‡Rjv wk¶v Awdmvi 30.43
3. cÖKí Kg©KZ©v 13.04
4. gv`vi ¯‥z‡ji cÖavb wk¶K 17.39
5. GjvKvi RbcÖwZwbwaMY 4.35
6. Training Coordinator 26.09
7. mnKvix wk¶v Awdmvi 39.13
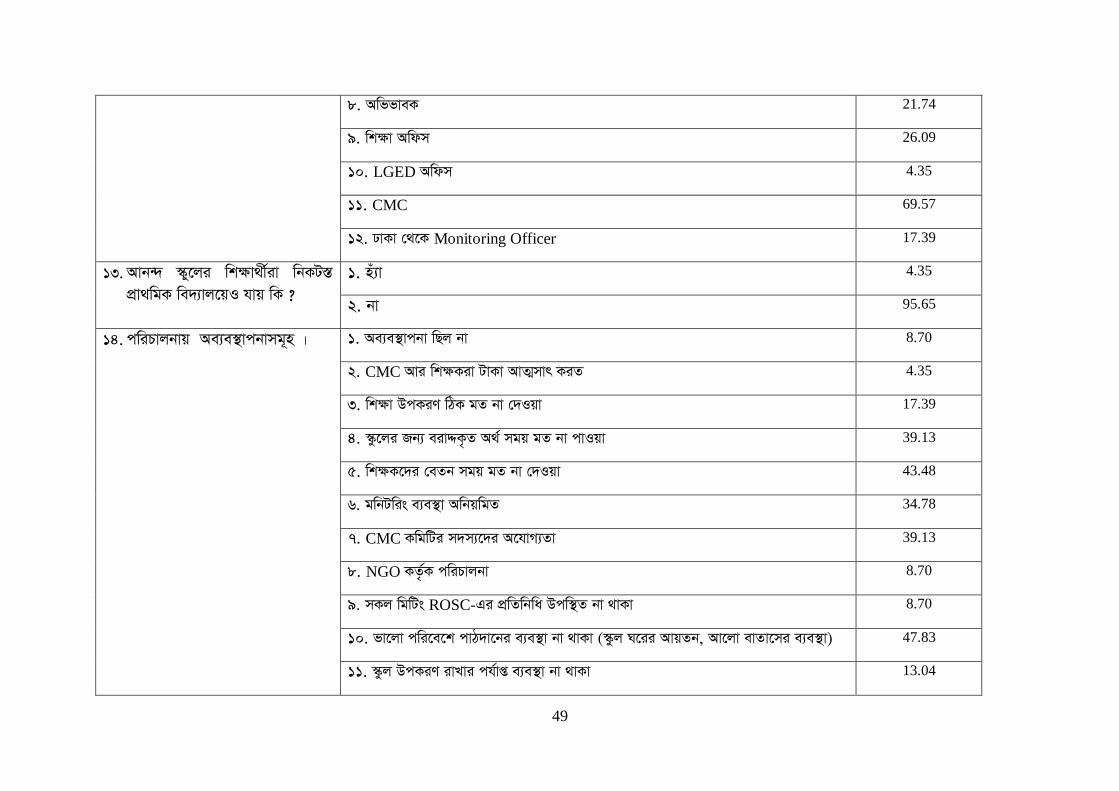
49
8. AwffveK 21.74
9. wk¶v Awdm 26.09
10. LGED Awdm 4.35
11. CMC 69.57
12. XvKv †_‡K Monitoring Officer 17.39
13. Avb›` ¯‥y‡ji wk¶v_x©iv wbKU¯Í
cÖv_wgK we`¨vj‡qI hvq wK ?
1. nu¨v 4.35
2. bv 95.65
14. cwiPvjbvq Ae¨e¯’vcbvmg~n |
1. Ae¨e ’vcbv wQj bv 8.70
2. CMC Avi wk¶Kiv UvKv AvZ¥mvr KiZ 4.35
3. wk¶v DcKiY wVK gZ bv †`Iqv 17.39
4. ¯‥z‡ji Rb¨ eivÏK…Z A_© mgq gZ bv cvIqv 39.13
5. wk¶K‡`i †eZb mgq gZ bv †`Iqv 43.48
6. gwbUwis e¨e¯’v AwbqwgZ 34.78
7. CMC KwgwUi m`m¨‡`i A‡hvM¨Zv 39.13
8. NGO KZ…©K cwiPvjbv 8.70
9. mKj wgwUs ROSC-Gi cÖwZwbwa Dcw¯’Z bv _vKv 8.70
10. fv‡jv cwi‡e‡k cvV`v‡bi e¨e ’v bv _vKv (¯‥zj N‡ii AvqZb, Av‡jv evZv‡mi e¨e¯’v) 47.83
11. ¯‥zj DcKiY ivLvi ch©vß e¨e¯’v bv _vKv 13.04

50
12. ¯‥zj cÖwZôvq NGO †`i Awbqg 8.70
13. Dce„wË †_‡K UvKv †K‡U ivLv nq 4.35
14. CMC MV‡b ¯RbcÖxwZ 13.04
15. CMC KwgwU‡Z ïaygvÎ gwnjv‡`i †bIqv n‡q‡Q 8.70
16. GK eQ‡ii †cvkvK Ab¨ eQ‡i cÖ`vb Kiv nq 4.35
17. eivÏK…Z A_© mwVKfv‡e e¨envi bv Kiv 17.39
18. wk¶‡Ki †eZb Ges QvÎ Dce„wË mgq gZ Qvo †`Iqv nq bv 21.74
19. wbgœgv‡bi wk¶v DcKiY mieivn Kiv nq 8.70
20. ¯‥z‡j mvBb †evW© †bB 4.35
21. †e I †Uwe‡ji e¨e ’v †bB 21.74
22. ¯‥z‡ji Ni wk¶‡Ki emZ N‡i ¯’vcb Kiv n‡q‡Q 13.04
23. ¯‥zj Ni e‡bi g‡a¨ d‡j mevi `„wó †MvPi nq bv| 4.35
15. Ae¨e¯’vcbv ~ixKi‡Yi Dcvq|
1. wgwUs G mK‡ji Dcw¯’wZ wbwðZKiY 4.35
2. fv‡jv cwi‡e‡k cvV`v‡bi e¨e ’v Kiv 8.70
3. ¯‥z‡ji DcKiY ivLvi Rb¨ Avjgvixi e¨e¯’v Kiv 4.35
4. cÖ‡qvRbxq wk¶v DcKiY mieivn Ki‡Z n‡e 17.39
5. CMC †K kw³kvjx Kiv 56.52

51
6. gvwmK wgwUs wbqwgZ Kiv Ges cÖK‡íi mewKQz mvaviY gvbyl‡K Rvbv‡bv 8.70
7. wbqwgZ gwbUwis Gi e¨e¯’v Kiv 39.13
8. wk¶K‡`i †eZb mgqgZ †`Iqv 4.35
9. ¯‥z‡ji Rb¨ eivÏK…Z UvKv mgqgZ cvIqv 34.78
10. Rv‡b bv 4.35
11. ¯Rb cÖxwZ gy³ CMC MVb 17.39
12. ¯‥z‡ji Rb¨ eivÏ e„w× Ki‡Z n‡e 13.04
13. wk¶K‡`i Rb¨ †Uªwbs Gi e¨e¯’v 17.39
14. wk¶K‡`i †eZb, Dce„wË I DKi‡Yi UvKv mgqgZ Qvo 21.74
15. †e †Uwe‡ji e¨e ’v Ki‡Z n‡e 21.74
16. Avb›` ¯‥z‡j we`y¨‡Zi e¨e ’v Ki‡Z n‡e 13.04
17. ¯‥zj N‡ii AvqZb e„w× Ki‡Z n‡e 13.04
18. gwbUwis wd e„w×KiY 13.04
19. gwbUwis e¨e¯’v †Rvi`vi miKvix gwbUwis e¨e¯’v 4.35
20. Avb›` ¯‥z‡ji Rb¨ wba©vwiZ Rwg‡Z ¯‥zj w`‡Z n‡e 17.39
16. ‥z‡ji my‡hvM myweav Av‡iv
evov‡bvi / S‡o cov ev ¯‥z‡j bv
Avmv wk¶v_©x‡`i AvK…ó Kivi
1. ¯‥z‡ji Rb¨ wbw`©ó RvqMvi e¨e¯’v 26.09
2. wk¶‡Ki msL¨v evov‡Z n‡e 17.39

52
Dcvq|
3. gwbUwis evov‡Z n‡e 4.35
4. †eZb e„w× Kiv 30.43
5. wk¶v DcKiY e„w× Kiv 21.74
6. fv‡jv wk¶K wb‡qvM 4.35
7. QvÎ-QvÎx‡`i Dce„wË e„w× Kiv 39.13
8. mvs¯‥…wZK Abyôv‡bi Av‡qvRb Kiv 4.35
9. Avš—:¯‥zj cÖwZ‡hvwMZvi e¨e¯’v 34.78
10. c~‡e©i b¨vq QvÎ-QvÎx‡`i Rb¨ cÖvBgvix ¯‥z‡ji 1wU i‚g eivÏ ivLv 4.35
11. cÖwZ eQi QvÎ-QvÎx‡`i fwZ©i e¨e¯’v ivL‡Z n‡e| 13.04
12. †e †Pqvi †Uwe‡ji e¨e¯’v 21.74
13. CMC-Gi m`m¨M‡Yi AwffveK‡`i mv‡_ †hvMv‡hvM i¶v Kiv 4.35
14. wUwd‡bi e¨e ’v 56.52
15. †Ljv yjvi e¨e¯’v Kiv 26.09
16. †jLvcovi Rb¨ eo Ni †`Iqv 8.70
17. cÖvBgvix ¯‥z‡ji mggvb Dce„wË e„w× 17.39
18. DbœZ Kvc‡oi †Wª‡mi e¨e¯’v Kiv 21.74
19. ¯v¯’¨ m¤§Z Uq‡j‡Ui e¨e ’v 13.04
20. cvwb cv‡bi e¨e ’v 13.04

53
21. ¯‥zj NiwU‡Z ch©vß Av‡jv evZvm Av‡Q wKbv Zv †`Lv 8.70
22. d¨v‡bi e¨e ’v Kiv 8.70
23. Ni fvov e„w× Ki‡Z n‡e 8.70
24. Avb›` ¯‥z‡j 2 Rb wk¶K wb‡qvM `vb 4.35
25. wk¶K‡`i cÖwk¶Y cÖ`v‡bi e¨e¯’v 13.04
26. Mixe wk¶v_x©‡`i cwievi‡K DcvR©b e„wׇZ mnvqZv Ki‡Z n‡e 8.70
27. †mwb‡Uk‡bi e¨e¯’v 4.35
28. weï× Lvevi cvwbi e¨e¯’v 13.04
29. †cvkv‡Ki gvb e„w× Ki‡Z n‡e 13.04
17. ROSC cÖKíwUi Amyweav ev
wUmg~n|
1. CMC-i KwgwUi MVb cÖwµqv gwbUwis Gi Ae¨e¯’v 26.09
2. mgqgZ eivÏK…Z A_© bv cvIqv 21.74
3. wk¶K wb‡qvM cÖwµqv 8.70
4. ¯‥z‡ji Rb¨ eivÏK…Z A‡_©i cwigvY Kg 26.09
5. 5 eQi ci ¯‥zj eÜ n‡q hvq 13.04
6. gvÎ 1 Rb wk¶K Øviv wk¶v Kvh©µg cwiPvjbv 17.39
7. bZzb S‡ocov wk¶v_x©‡`i cybivq fwZ©i e¨e¯’v bv Kiv 8.70
8. ¯‥zj N‡ii Rb¨ ch©vß ev‡RU bv _vKv 4.35

54
9. h_vmg‡q wk¶K‡`i †eZb cwi‡kva bv Kiv 21.74
10. cÖK‡íi ¯‥zj¸‡jv‡Z Av‡jvi ¯íZv wQj 8.70
11. 30 Rb Gi †ekx QvÎ-QvÎx‡`i fwZ©i e¨e¯’v bv _vKv 17.39
12. wbqwgZ ¯‥zj cwi`k©‡bi e¨e¯’v bv _vKv 4.35
13. wk¶v_x©i Zzjbvq wk¶K Kg 4.35
14. ivR‣bwZK we‡ePbvq Avb›` ¯‥zj ¯’vcb 13.04
15. wk¶v_x©‡`i Dce„wËi UvKv mgqgZ bv cvIqv 13.04
16. NGO †`i ¯‥zj ’vc‡b A`¶Zv 17.39
17. cÖK‡íi ¯‥zj¸‡jv‡Z ‡Kvb wba©vwiZ Ni wQj bv 17.39
18. Amyweav ev wUmg~n `~ixKi‡bi
Dcvq|
1. kw³kvjx CMC MVb Ki‡Z n‡e 39.13
2. gwbUwis e¨e¯’v †Rvi`vi Ki‡Z n‡e 52.17
3. ¯‥zj NiwU‡Z Av‡jv evZv‡mi e¨e¯’v Av‡Q wKbv Zv j¶ ivL‡Z n‡e 26.09
4. wk¶v_x©‡` Dce„wËi UvKv mgqgZ w`‡Z n‡e 21.74
5 wk¶K‡`i †eZb mgqgZ w`‡Z n‡e 13.04
6. d¨v‡bi e¨e ’v Ki‡Z n‡e 8.70
7. ¯‥z‡ji Kvh©µg Pjgvb _vKv `iKvi 4.35
8. wk¶‡Ki msL¨v e„w× Kiv 8.70

55
9. ch©vß wk¶v DcKiY mieivn Kiv 8.70
10. GKvwaK K¬v‡mi e¨e¯’v Kiv 4.35
11. ¯‥z‡ji Rb¨ ch©vß ev‡R‡Ui e¨e ’v Kiv 8.70
12. mgqgZ eivÏK…Z A_© †`qvi e¨e¯’v Kiv 8.70
13. ’vbxq RbcÖwZwbwa I MY¨gvb¨ e¨w³‡`i cÖKífy³ Ki‡Z n‡e 4.35
14. `jxq we‡ePbvq ¯‥zj eivÏ bv †`Iqv 8.70
15. ROSC cÖK‡íi Rb¨ wba©vwiZ Rwg‡Z Ni •Zix Ki‡Z n‡e 17.39
16. ROSC cÖK‡íi ¯‥zj¸‡jv‡Z †Q‡j-‡g‡q‡`i emvi Rb¨ †e‡Âi e¨e¯’v Ki‡Z n‡e 43.48
19. GjvKvi wk¶v e¨e ’vi Dbœq‡b
ROSC cÖKíwUi f~wgKv|
1. `wi ª I nZ`wi ª‡`i Avw_©K mn‡hvwMZv 43.48
2. S‡i cov ev‛Pv‡`i †jLvcovi my‡hvM 39.13
3. hviv ¯‥z‡j †h‡Z PvBZ bv Zv‡`i ¯‥zjg~Lx Kiv 34.78
4. Kg©Rxwe wkïiv †jLv cov Ki‡Z cvi‡Q 8.70
5. wk¶vi nvi e„wׇZ mnvqK f~wgKv cvjb Ki‡Q 30.43
6. Avb›` ¯‥z‡j cov †k‡l nvB ¯‥z‡j †jLv cov Ki‡Q 4.35
7. mš—vb‡`i ~‡ii ¯‥z‡j cvVv‡bvi SuywK K‡g‡Q 8.70
8. †g‡q wkï‡`i Aš—Z cÂg †kªYx ch©š— covi my‡hvM •Zix n‡q‡Q 8.70
9. Ag‡bv‡hvMxi wk¶v_x©iv g‡bv‡hvMx n‡q‡Q 8.70

56
10. `wi ª wkï‡`i †jLvcovi my‡hvM 4.35
20. Avb›` ¯‥z‡ji cvV`v‡bi ¸YvMZ
gv‡bi g~j¨vqb |
1. fv‡jv 13.04
2. ‡gvUvgywU 17.39
3. wk¶v nvi e„w× †c‡q‡Q 26.09
4. `wi ª wkïiv covi my‡hvM †c‡q‡Q 26.09
5. Avb›` ¯‥z‡ji QvÎ-QvÎxiv mgvcbx cix¶vq fv‡jv Ki‡Q 30.43
6. Avb›` ¯‥zj †kl K‡i A‡b‡K nvB ¯‥z‡j cov‡jLv Ki‡Q 26.09
7. Ab¨vb¨ cÖvBgvix ¯‥z‡ji †P‡q cvV`vb fv‡jv 13.04
8. cÖwZeÜx †Q‡j-‡g‡qiv wbKZg Avb›` ¯‥z‡ji wk¶v MÖnY Ki‡Z †c‡i‡Q 4.35
21. ‥zj e›a nIqvq wk¶v_©x‡`i wK
Amyweav n‡q‡Q ?
1. nu¨v 47.83
2. bv 0.00
22. nu¨v n‡j wK ai‡bi Amyweav ? 1. wk¶vi nvi K‡g G‡m‡Q 4.35
2. Kg©Rxwe wkïiv ¯‥z‡j †jLvcov †_‡K ewÂZ n‡‛Q 4.35
3. evj¨ weevn e„w× †c‡q‡Q 13.04
4. S‡i cov e„w× †c‡q‡Q 26.09
5. wkï kªg e„w× †c‡q‡Q 4.35
6. wk¶v DcKiY †_‡K Mwie cwievi ewÂZ n‡‛Q 13.04

57
7. `wi ª cwiev‡ii wkïiv wk¶vi my‡hvM †_‡K ewÂZ n‡‛Q 13.04
8. cÖv_wgK we`¨vjq ~‡i nIqvq wkïiv Kó K‡i ¯‥z‡j hv‡‛Q 30.43
9. Ag‡bv‡hvMx QvÎ-QvÎx‡`i msL¨v evo‡Q 13.04
10. A‡bK wkï ¯‥z‡j hvevi Dc‡hvMx wKš‘ ¯‥z‡j hvq bv 13.04
11. Avw_©K Amyweav n‡q‡Q 8.70
12. ¯‥zj eÜ nevi cÖwZ cuvP eQ‡i 20wU Q‡j †g‡q cÂg †kªYx cvk Ki‡Z cvi‡e bv 4.35

58
E: Survey Questionnaire
Evaluation of the Reaching Out of School
Children (ROSC) Project
Lvbv Rwi‡ci cÖkœgvjv
(GB Rwi‡ci gva¨‡g msMÖnxZ mKj Z_¨ †Mvcb ivLv n‡e Ges †Kvb e¨w³i bvg ev wVKvbv wi‡cv‡U© cÖKvk Kiv n‡e bv| msM„nxZ
Z_¨ ïaygvÎ M‡elYvi Kv‡R e¨eüZ n‡e| D³ Rwic Kvh©µ‡g Avcbvi mvwe©K mvnvh¨ I mn‡hvwMZv GKvšÍfv‡e Kvg¨|)
GwcÖj 2014
evsjv‡`k Dbœqb M‡elYv cÖwZôvb (BIDS)
B-17, AvMviMuvI, XvKv-1207

59
Lvbv Rwi‡ci cÖkœgvjv
(‡h mKj Lvbvq 7-14 eQi eqmx wkï Av‡Q)
1. Lvbv cÖav‡bi bvgt Lvbv †KvWt
2. wcZvi bvgt
3. MÖvg/gnjøvt BDwbqb/IqvW©t
Dc‡Rjv †KvWt †Rjv †KvW t
4. GB LvbvwU Kvi Aax‡b t
[1. Program village 2. Control village]
5. DËi`vZvi m¤ú©wKZ Z_¨vejx
µwgK
bs
cÖkœgvjv ‡KvW emvb/mwVK Dˇi √
wPý w`b
5.1 DËi`vZvi bvgt
5.2 DËi`vZvi wj½ 1. cyiæl 2. gwnjv
5.3 Lvbv cÖav‡bi wj½? 1. cyiæl 2. gwnjv
5.4 Lvbv cÖav‡bi cÖavb †ckv?
[‡KvWt 1= K…lK, 2= K…wl kªwgK, 3= AK…wl kªwgK, 4= PvKzix, 5=
ÿz`ª ‡ckvRxex (Kvgvi/Kzgvi/ZvuZx/‡R‡j BZ¨vw`), 6= ÿz`ª e¨emv, 7=
gvSvix/ eo e¨emv, 8= wPwKrmK/AvBbRxex/wkÿK, 9=
wi·v/f¨vb/Mvwo PvjK, 10= ‡eKvi/wKQz K‡i bv, 11= Ab¨vb¨ D‡jøL
Kiæbt_________]
5.5 Lvbv cÖav‡bi wk¶vMZ †hvM¨Zv?
[Completed years of schooling]
5.6 Lvbvi m`m¨ msL¨v KZRb? cyiæl __________ Rb
gwnjv__________ Rb

60
6. Av_©-mvgvwRK Z_¨vejx
µwgK bs cÖkœgvjv ‡KvW (mwVK Dˇi √ wPý)
6.1 Lvbvi wbR¯^ gvwjKvbvaxb K…wl Rwgi cwigvbt _________ kZvsk
6.2 Lvbvi gvwjKvbvaxb evwoi cÖK„wZt
[‡KvWt 1= wbRm¦, 2= fvov, 3= A‡b¨i evwo‡Z, 4= Ab¨vb¨ D‡jøL
Kiæbt_________]
6.3 evwo‡Z wK wK m¤ú` Av‡Q? (GKvwaK DËi n‡Z cv‡i)
[‡KvWt 1= ‡gvUimvB‡Kj, 2= mvB‡Kj, 3= ‡Uwjwfkb, 4= ‡iwWI,
5= ‡gvevBj ‡dvb, 6= Miæ/gwnl, 7= QvMj/†fov, 8= nuvm/gyiMx, 9=
Uªv±i, 10= †mjvB †gwkb, 11= †b․Kv, 12= LvU/‡P․Kx, 13= †Pqvi I
†Uwej, 14= Avjgvix, 15= Ab¨vb¨ D‡jøL Kiæbt _______]
6.4 Avcbvi Lvbvi Av‡qi cÖavb Drm wK?
[‡KvWt 1= K…wl, 2= Miæ/QvMj jvjb cvjb, 3= nvum/gyiMx jvjb
cvjb, 4= gvQ aiv/weµq, 5= K…wl gRyix, 6= AK…wl gRyix, 7= ÿz ª
‡ckvRxex (Kvgvi/Kzgvi BZ¨vw`), 8= ÿz`ª e¨emv, 9= gvSvix/eo
e¨emv, 10= PvKzix/‡eZb, 11= †iwg‡UÝ (we‡`k †_‡K), 12= Dcnvi/
`vb, 13= Ab¨vb¨ D‡jøL Kiæbt________]
6.5 MZ 12 gv‡m Lvbvi Mo gvwmK Avq KZ wQj? UvKv ______
6.6 MZ 12 gv‡m Lvbvi Mo gvwmK e¨q KZ wQj? UvKv ______
6.7 mviv eQ‡ii Lv`¨ MÖnb we‡ePbvq Avcwb Avcbvi Lvbv‡K wb‡¤œv³ †Kvb
†kªbxf~³ Ki‡eb?
[‡KvWt 1= mviv eQi NvUwZ, 2= KLbI KLbI NvUwZ= 3. NvUwZI
bv, DØ„Ë bv, 4= DØ„Ë]

61
7. wk¶v msµvšÍ Z_¨vejx
7-14 eQi eqmx
†Q‡j/‡g‡qi
ID
Code
7.1 7.2 7.3 7.4 7.5 7.6
eqm wj½
1. cyiæl
2. gwnjv
‡m wK eZ©gv‡b
¯‥z‡j c‡o?
(‡KvW)
[1. nu¨v, 2. bv]
(hw` DËi bv nq
Z‡e †mKkb 9-G
hvb)
nu¨v n‡j,
†Kvb K¬v‡m
c‡o?
(K¬vm)
†Kvb ¯‥z‡j
hvq?
(‡KvW)
(hw` DËi
Avb›` ¯‥zj bv
nq Z‡e cÖkœ
7.8-G hvb)
Avcbvi mšÍvb‡K
cÖv_wgK ¯‥z‡j bv
w`‡q †Kb Avb›`
¯‥z‡j w`‡q‡Qb?
(‡KvW)
¯‹z‡ji aib †KvW (cÖkœ 7.5): 1= Avb›` ¯‥zj, 2= miKvwi, 3= †emiKvwi, 4= Avav-miKvix, 5= gv`ªvmv, 6= GbwRI
¯‥zj, 7= KvwiMvwi ¯‥zj, 8= Ab¨vb¨ D‡jøL Kiæb_________________|
Avb›` ¯‹z‡j ‡`evi Kvib †KvW(cÖkœ 7.6) t 1= cÖv_wgK ¯‥zj `~‡i, 2= Avb›` ¯‥z‡ji mgqUv cÖv_wgK ¯‥z‡ji gZ evauv bq,
3= Avb›` ¯‥z‡j hvevi Rb¨ UvKv †`qv nq, 4= Ab¨vb¨ D‡jøL Kiæb_______________________|
µgk:
7-14 eQi
eqmx
†Q‡j/‡g‡qi
ID
Code
7.7 7.8 7.9 7.10
¯‥z‡ji wk¶vi ¸bMZ
gvb †Kgb?
(‡KvW)
Avcbvi mšÍvb
¯‥z‡j †Kgb
Ki‡Q?
(‡KvW)
eZ©gvb ¯‥z‡j fwZ© nIqvi
c~‡e© Avcbvi mšÍvb wK Ab¨
†Kvb ¯‥z‡j c‡o‡Q?
(‡KvW)
[1. nu¨v, 2. bv]
nu¨v n‡j, †Kvb
¯‥z‡j c‡o‡Q?
(‡KvW)
¯‹z‡ji ¸YvMZ gvb (cÖkœ 7.7)t 1= GjvKvi me‡P‡q fv‡jv ¯‥zj, 2= fv‡jv ¯‥zj, 3= †gvUvgywU, 4= GjvKvq Ab¨vb¨
¯‥z‡ji Zzjbvq Lvivc|
ev”Pviv ¯‹z‡j †Kgb Ki‡Q (cÖkœ 7.8)t 1= Lye fv‡jv, 2= fv‡jv, 3= †gvUvgywU, 4= ZZ fv‡jv bv, 5= Lvivc|
¯‹z‡ji aib †KvW (cÖkœ 7.10)t 1= Avb›` ¯‥zj, 2= miKvwi, 3= †emiKvwi, 4= Avav-miKvix, 5= gv ªvmv, 6=
GbwRI ¯‥zj, 7= KvwiMvwi ¯‥zj, 8= Ab¨vb¨ D‡jøL Kiæb_________________|

62
8. ¯‹z‡j Aa¨qbiZ QvÎ-QvÎxi Rb¨
7-14 eQi
eqmx
†Q‡j/‡g‡qi
ID
Code
8.1 8.2 8.3 8.4 8.5 8.6 8.7
MZ eQi wK miKvi/ Avb›`
¯‥zj /Ab¨ †Kvb cÖwZôvb †_‡K
wb‡gœv³ wRwbm †c‡q‡Qb?
Avcbvi
‡Q‡j/‡g‡q
M‡o mßv‡n
mvavibZ
KZw`b ¯‥z‡j
hvq?
wbqwgZ
¯‥z‡j bv
†M‡j Zvi
Kvib wK?
(‡KvW)
Avcbvi
ev‛Pv wK
†Kvb e„wË
cvq?
1. nu¨v
2. bv
(hw` DËi bv
nq Z‡e cÖkœ
8.5 -G hvb)
hw` nu¨v nq
Z‡e, MZ
12 gv‡m
KZ UvKv
†c‡q‡Q?
(UvKv)
¯‥z‡j wK †Kvb
ai‡bi
Lvevi/wUwdb
cÖ`vb Kiv nq?
1. nu¨v
2. bv
eB?
1. nu¨v
2. bv
webvg~‡j¨
†cvkvK?
1. nu¨v
2. bv
¯‹z‡j bv hvevi Kvib †KvW (cÖkœ 8.2) 1= Amy¯’Zv, 2= evwn‡i KvR Ki‡Z hvq, 3= N‡ii KvR K‡i/cwiev‡ii
m`m¨‡`i †`L‡Z nq, 4= ¯‥zj `~‡i, 5= ¯‥z‡j †h‡Z Pvq bv, 6= ¯‥zj fv‡jv jv‡M bv, 7= Ab¨vb¨ D‡jøL
Kiæb_____________|

63
9. S‡i cov/‡jLv-cov eÜ Kiv wkï‡`i Rb¨
7-14 eQi
eqmx
†Q‡j/‡g‡qi
ID Code
9.1 9.2 9.3 9.4 9.5 9.6
hw` eZ©gv‡b
¯‥z‡j bv hvq
Z‡e KL‡bv wK
¯‥z‡j wM‡qwQj?
1. nu¨v
2. bv
(hw` DËi bv nq
Z‡e GB Lvbv‡Z
Rwic †kl)
†Kvb ¯‥z‡j
wM‡qwQj?
(‡KvW)
‡Kvb K¬v‡m
_vKv Ae¯’vq
¯‥z‡j hvIqv
eÜ Ki‡Q?
(‡kÖbx)
wK Kvi‡b
¯‥z‡j hvIqv
eÜ Ki‡Q?
(‡KvW)
Avcbvi ev‛Pv
¯‥z‡j
cov‡jLvq
†Kgb wQj?
(‡KvW)
eZ©gv‡b †m
wK Ki‡Q?
(‡ckv
‡KvW)
¯‹z‡ji aib †KvW (cÖkœ 9.2)t 1= Avb›` ¯‥zj, 2= miKvwi, 3= †emiKvwi, 4= Avav-miKvix, 5= gv`ªvmv, 6= GbwRI
¯‥zj, 7= KvwiMvwi ¯‥zj, 8= Ab¨vb¨ D‡jøL Kiæb_________________|
¯‹zj eÜ Kivi Kvib †KvW (cÖkœ 9.4) 1= ¯‥z‡j †h‡Z Pvq bv, 2= cix¶vq fv‡jv K‡iwb/†dj K‡i‡Q, 3= Kv‡R
wb‡qvwRZ, 4= ¯‥z‡ji Avw_©Z e¨q enb m¤¢e bq, 5= Kv‡Q †Kvb ¯‥zj bvB/¯‥zj `~‡i, 6= ¯‥z‡ji Ae ’v fv‡jv bv/wk¶vi
gvb fvj bv/my‡hvM myweav fv‡jv bv, 7= †KejgvÎ agx©q ¯‥zj/gv ªvmvq cov‡Z B‛QzK, 8= Ab¨vb¨ fvB-‡ev‡biv ¯‥z‡j hv‡‛Q
ZvB Gi cov e›a i‡q‡Q, 9= ¯‥z‡j hvIqvUv ¸iæZ¡c~Y© bq, 10= N‡ii KvR K‡i/cwiev‡ii m`m¨‡`i †`L‡Z nq, 11=
wk¶K‡`i cvV`vb gvbm¤§Z bq, 12= cÖwZeÜx/Amy¯’ ZvB we‡kl e¨e¯’v `iKvi, 13= weevwnZ/Mf©eZx/ †QvU ev‛Pv Av‡Q,
14= ¯‥z‡j hvevi eqm nqwb, 15= ¯‥z‡j †nu‡U hvIqvUv wbivc` bq, 16= Ab¨vb¨ D‡jøL Kiæb_________________|
ev”Pviv ¯‹z‡j †Kgb K‡iwQj (cÖkœ 9.5) 1= Lye fv‡jv, 2= fv‡jv, 3= †gvUvgywU, 4= ZZ fv‡jv bv, 5= Lvivc
‡ckv †KvW (cÖkœ 9.6) 1= K…wl KvR, 2= N‡ii KvR (cvwb Avbv/ivbœvevbœv/Ab¨vb¨ m`m¨‡`i †`Lvïbv), 3= evmv evwo‡Z
KvR K‡i (UvKvi wewbg‡q), 4= N‡ii evwn‡i/GjvKvi evB‡i KvR K‡i, 5= e¨emv K‡i, 6= Ab¨ RvqMvq _v‡K wKš‘ wK
K‡i Zv ARvbv, 7= evmvq _v‡K wKš‘ wKPz K‡i bv, 8= Ab¨vb¨ D‡jøL Kiæb_________________|