Embed Size (px)
Citation preview

Assessing Catch Shares’ Effects Evidence from Federal United States and Associated British Columbian
Fisheries
Dietmar Grimm,a, 1 Ivan Barkhorn,a David Festa,b Kate Bonzon,b Judd Boomhower,b,2 Valerie Hovland,a Jason Blaua (corresponding author)
aRedstone Strategy Group, LLC
777 29th Street, Suite 500, Boulder, CO 80303, USA
Tel: 1-303-606-7109 Fax: 1-303-606-7120 E-mail: [email protected]
bEnvironmental Defense Fund
123 Mission Street, 28th Floor, San Francisco, CA 94105, USA
Tel: 1-415-293-6071 Fax: 1-415-293-6051 E-mail: [email protected]
Citation Grimm, D., Barkhorn, I., Festa, D., Bonzon, K., Boomhower, J., Hovland, V., & Blau, J. (2012). Assessing catch shares’ effects: Evidence from Federal United States and associated British Columbian fisheries. Marine Policy, 36(3), 644-657. doi:10.1016/j.marpol.2011.10.014
1 Present address: Trout Unlimited; [email protected] 2 Present address: Energy and Resources Group, University of California, Berkeley; 310 Barrows Hall, UC Berkeley, Berkeley CA 94720; [email protected]

Abstract What are the effects of transitioning traditionally managed fisheries to incentive-based catch shares fisheries? In a study of all major United States federal catch share fisheries and associated shared stock fisheries in British Columbia, catch shares result in environmental improvements, economic improvements, and a mixture of changes in social performance, relative to the race for fish under traditional management. Environmentally, compliance with total allowable catch increases and discards decrease. Economically, vessel yields rise, total revenues grow, and long-term stock increases are encouraged. Socially, safety increases, some port areas modestly consolidate, needed processing capacity often reduces, and labor markets shift from part time jobs to full time jobs with similar total employment. Newer catch shares address many social concerns through careful design.
Keywords: Catch shares; sustainability; fishery management; recovery
Highlights:
Catch shares end the race for fish leading to environmental and economic recovery
Job quality improves, but other social shifts can have mixed effects
Careful catch share design and implementation can address concerns
Funding: The authors gratefully acknowledge the Gordon and Betty Moore Foundation and the Walton Family Foundation for their financial support. The funders had no role in the collection, analysis, or interpretation of data, nor in the preparation of this paper.
Acknowledgements The authors thank Rod Fujita and Johanna Thomas of the Environmental Defense Fund for their support for this project and for providing helpful direction. In addition, the authors thank Jeremy Avins of Redstone Strategy Group, LLC, and C. Kent Strauss of the Environmental Defense Fund for their research assistance.
1. Introduction Catch shares are an important approach for fishery managers as they seek to achieve environmental, economic, and social objectives within fisheries. Catch shares, as defined by the National Oceanic and Atmospheric Administration (NOAA), are:
[Any of] several fishery management strategies that allocate a specific portion of the total allowable fishery catch to individuals, cooperatives, communities, or other entities. Each recipient of a catch share is directly accountable to stop fishing when its exclusive allocation is reached. [1]
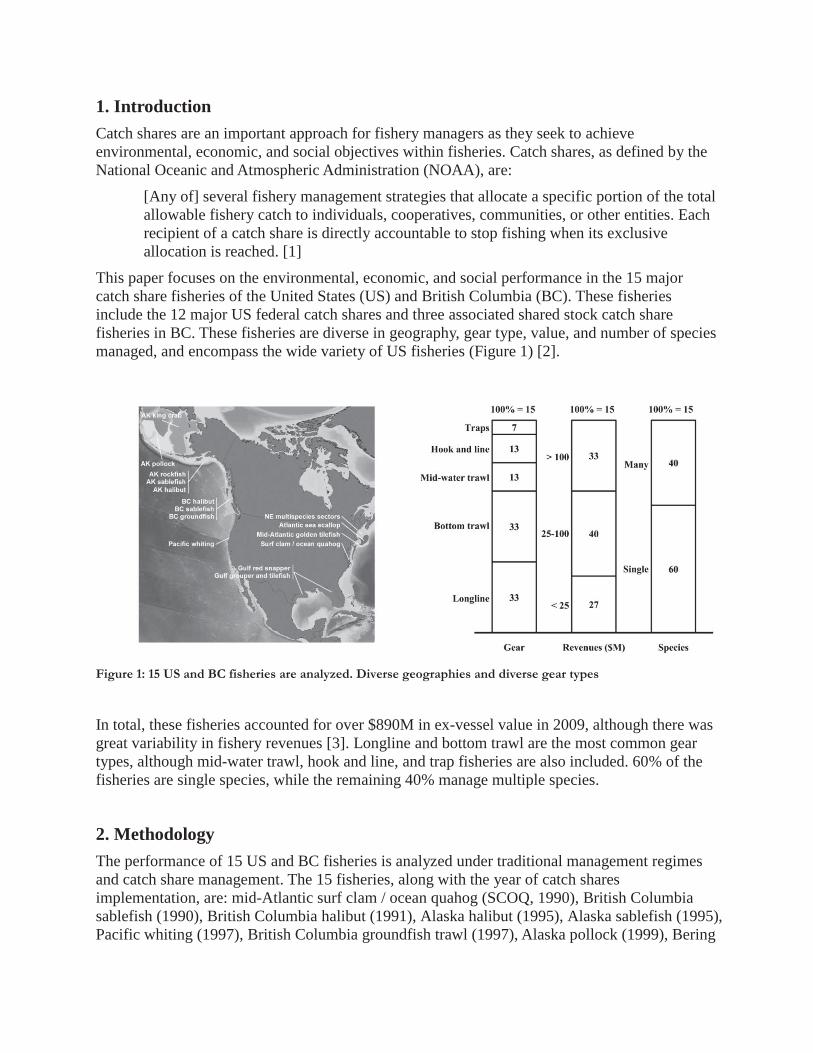
This paper focuses on the environmental, economic, and social performance in the 15 major catch share fisheries of the United States (US) and British Columbia (BC). These fisheries include the 12 major US federal catch shares and three associated shared stock catch share fisheries in BC. These fisheries are diverse in geography, gear type, value, and number of species managed, and encompass the wide variety of US fisheries (Figure 1) [2].
Figure 1: 15 US and BC fisheries are analyzed. Diverse geographies and diverse gear types
In total, these fisheries accounted for over $890M in ex-vessel value in 2009, although there was great variability in fishery revenues [3]. Longline and bottom trawl are the most common gear types, although mid-water trawl, hook and line, and trap fisheries are also included. 60% of the fisheries are single species, while the remaining 40% manage multiple species.
2. Methodology The performance of 15 US and BC fisheries is analyzed under traditional management regimes and catch share management. The 15 fisheries, along with the year of catch shares implementation, are: mid-Atlantic surf clam / ocean quahog (SCOQ, 1990), British Columbia sablefish (1990), British Columbia halibut (1991), Alaska halibut (1995), Alaska sablefish (1995), Pacific whiting (1997), British Columbia groundfish trawl (1997), Alaska pollock (1999), Bering

Sea and Aleutian Island King and Tanner crab (Alaska crab, 2005), Gulf of Alaska rockfish (2007), Gulf of Mexico red snapper (2007), Atlantic sea scallop (2010), Gulf of Mexico grouper and tilefish (2010), mid-Atlantic tilefish (2010), Northeast multispecies groundfish (2010). The three BC fisheries are included in the analysis due to their interdependency and co-management with the Alaskan and Pacific coast catch share fisheries in the US. One additional catch shares program, the South Atlantic wreckfish fishery, is excluded from this study due to the low commercial activity, and therefore low data availability (see Appendix 1). All results discussed in Section 4 refer to this set of studied fisheries, or a subset thereof depending on data availability. Table 1 contains a detailed table of data availability and metrics used in this study.
Table 1: Data availability
Environmental, economic, and social data are collected from up to ten years before catch shares implementation up to the tenth year of full catch shares implementation for each fishery, where available. For each fishery, year 0, the baseline year, is the year immediately prior to full catch shares implementation. In some instances, year 0 is therefore a transition year where catch shares are implemented near the end of the fishing season. Year 1 is the first full year of catch shares implementation. Data collection utilized public data available through government sources as well as private industry data sources where necessary. Post-transition data, or indices dependent on post-transition data, for fisheries that transition to catch shares since 2007 are not used in summary charts due to those fisheries’ limited experience with catch shares management. Initial data collection took place in 2006 for nine fisheries that transitioned before 2007. In addition, interviews were conducted with 41 stakeholders, including fishermen, processors, conservationists, government personnel, and industry representatives. These preliminary findings were compiled in a previous, unpublished draft of this paper in 2007 pending additional data collection. Since 2007, the US’s experience with catch shares has grown considerably. With six new fisheries implementing catch shares management and further years of experience in the nine previous fisheries, there is now sufficient data to warrant an update and publication of the previous draft.
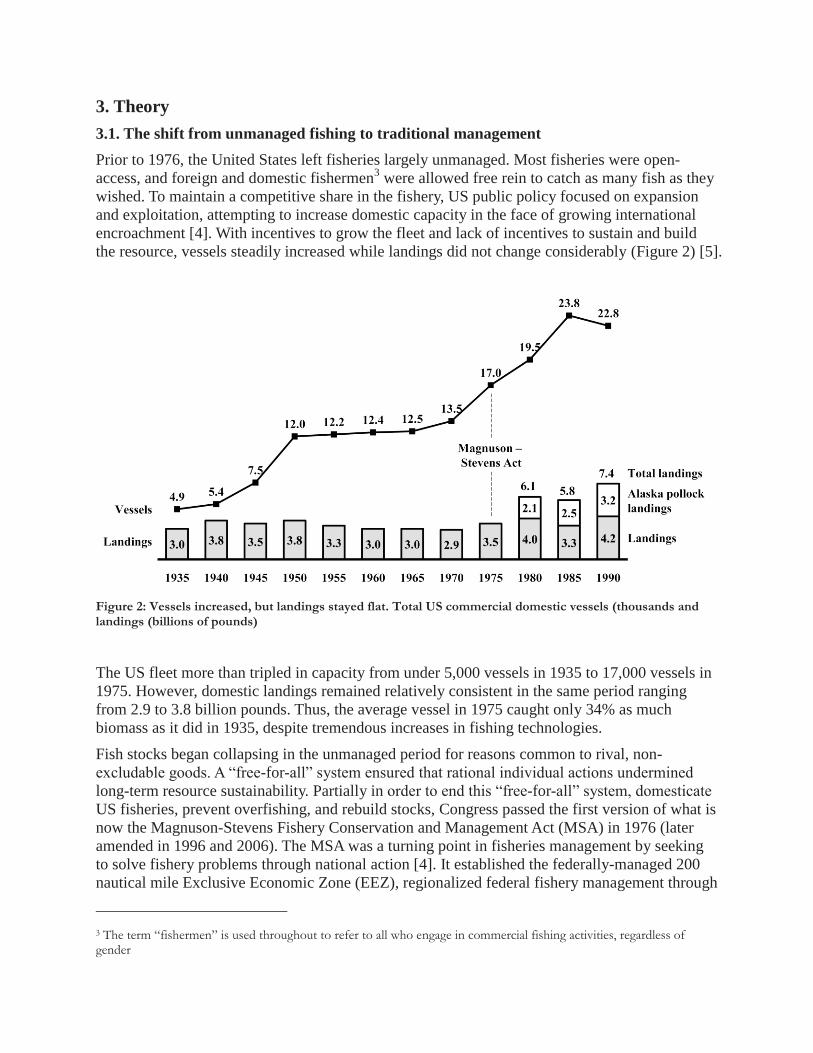
3. Theory 3.1. The shift from unmanaged fishing to traditional management Prior to 1976, the United States left fisheries largely unmanaged. Most fisheries were open-access, and foreign and domestic fishermen3 were allowed free rein to catch as many fish as they wished. To maintain a competitive share in the fishery, US public policy focused on expansion and exploitation, attempting to increase domestic capacity in the face of growing international encroachment [4]. With incentives to grow the fleet and lack of incentives to sustain and build the resource, vessels steadily increased while landings did not change considerably (Figure 2) [5].
Figure 2: Vessels increased, but landings stayed flat. Total US commercial domestic vessels (thousands and landings (billions of pounds)
The US fleet more than tripled in capacity from under 5,000 vessels in 1935 to 17,000 vessels in 1975. However, domestic landings remained relatively consistent in the same period ranging from 2.9 to 3.8 billion pounds. Thus, the average vessel in 1975 caught only 34% as much biomass as it did in 1935, despite tremendous increases in fishing technologies.
Fish stocks began collapsing in the unmanaged period for reasons common to rival, non-excludable goods. A “free-for-all” system ensured that rational individual actions undermined long-term resource sustainability. Partially in order to end this “free-for-all” system, domesticate US fisheries, prevent overfishing, and rebuild stocks, Congress passed the first version of what is now the Magnuson-Stevens Fishery Conservation and Management Act (MSA) in 1976 (later amended in 1996 and 2006). The MSA was a turning point in fisheries management by seeking to solve fishery problems through national action [4]. It established the federally-managed 200 nautical mile Exclusive Economic Zone (EEZ), regionalized federal fishery management through
3 The term “fishermen” is used throughout to refer to all who engage in commercial fishing activities, regardless of gender

eight fishery management councils, and created ten national standards for fishery management plans [6]. Despite these novel management attempts, fleet capacity remained too high for the available resource (Figure 2), and rational individual actions continued to undermine stock rebuilding [4].
By domesticating US fisheries, the MSA made the highly productive Alaska pollock fishery exclusive to US fleets. Previous to 1977, pollock was not included in landings data as the fishery only had a minor domestic component, while post 1977 it dominates domestic US landings and is shown separately in Figure 2 [7]. Empirically, the rise in pollock landings does not explain the continued rise in the total number of US vessels, as the Alaska pollock fishery only includes 100 to 200 vessels.
In the post-MSA 1970s and 1980s, the “traditional management” approach to fisheries was implemented. Traditional management fisheries are non-catch share fisheries that use any or all of the following management tools: limited entry, effort control, trip limits, and total catch limits [8]. As of 2010, traditional management still covers 70% of federal fisheries (50% by value) [8]. However, this style of management contains inherent imbalances. In theory, it reins in overfishing through input and output controls that limit how a fisherman can fish and how much a fisherman can produce. In practice, fisherman innovation leads to increased fishing capacity and effort, which then leads to progressively more Draconian command-and-control measures [6]. Thus, by 1990, non-pollock landings were still only 40% higher than in 1935 despite a 460% increase in vessels resulting in the average vessel catching even less than it did in 1975. This process locks fishermen into a cycle of increasing effort and control called the “race for fish.” In a race for fish, fisheries are closed either for the remainder of the season or until the next pre-determined opening as soon as the TAC is reached. Thus, an individual fisherman must catch the fish quickly; otherwise, other fishermen will catch the limited supply of fish. This situation has negative environmental, economic, and social repercussions.
Traditional management also includes further responses to the problems of overfishing. Managers turn to a suite of tools to prevent resource depletion, such as monitoring to enforce TACs, days-at-sea (DAS), and trip limits. Managers also implement closures that protect the health of juveniles, ecosystems, and sensitive habitats where necessary. Finally, managers institute bycatch measures that reduce the environmental footprint of fishing and improve the food web. While these measures may be helpful, they do not address the underlying poor incentives of traditional fishery management.
3.2. Catch shares align incentives for long-term management The large failures with traditional open-access and limited-access management approaches in the studied fisheries generally led to catch shares implementation. Catch shares remedy the shortcomings of traditional management by directly addressing the common property problem of rival, non-excludable fish stocks. As each fisherman’s stake in the fishery is secure, there is no incentive to race for fish. Similarly, since the value of a fisherman’s quota is directly dependent on the long-term stock level, there is an incentive to support long-term management for high biomass levels. By changing fishery management institutions to properly align incentives, catch shares can end the race for fish, helping to avoid fisheries’ collapse [9].
Further, catch shares management more frequently uses management tools that help ensure sustainable fishing without causing a race for fish. Specifically, monitoring is more common and rigorous in catch share fisheries [8]. Total catch limits are used in all catch share fisheries,

whereas traditionally-managed fisheries did not need to set catch limits (now referred to as annual catch limits, ACLs) until 2011 [10]. Spawning closures and bycatch regulations can be established in cooperation with fishermen who recognize the importance of long-term management.
Two New Zealand fisheries with multiple decades of catch shares experience provide useful examples of the long-term outcomes of catch shares management. The rock lobster and orange roughy fisheries show how catch shares enable fishermen and managers to invest in longer-term ecosystem health and catch levels. In both fisheries, lower TACs were set by managers and met by fishermen through the mutual incentive to reduce catch in the near term to increase long-term biomass. In the rock lobster fishery, catch was reduced to 50% of historic levels, which was also 15% lower than the initial catch share TAC. Due to the rock lobster’s high resilience, these reduced catch levels resulted in biomass doubling within ten years, at which point managers raised the TAC (Figure 3) [11-13]. The orange roughy catch shares fishery demonstrates a similar outcome. Despite initial incomplete science that set the TAC too high and the allocation of shares as a fixed tonnage (making TAC reductions difficult), catch shares management has lifted the stock to over 60% higher than the historic lows (Figure 3) [14-16]. In both fisheries, catch shares provided the incentives for managers and fishermen to choose optimal inter-temporal tradeoffs, whereas traditional management made such long-term investment much more difficult.
Figure 3: Stocks recover as managers adjust TACs. TAC and biomass relative to the first year of catch share introduction
4. Calculations and results Consistent with theory, traditional management and the race for fish have poor environmental, economic, and social results. Catch shares lead to clear gains in environmental performance, major economic improvements, and a mixture of changes in social performance.
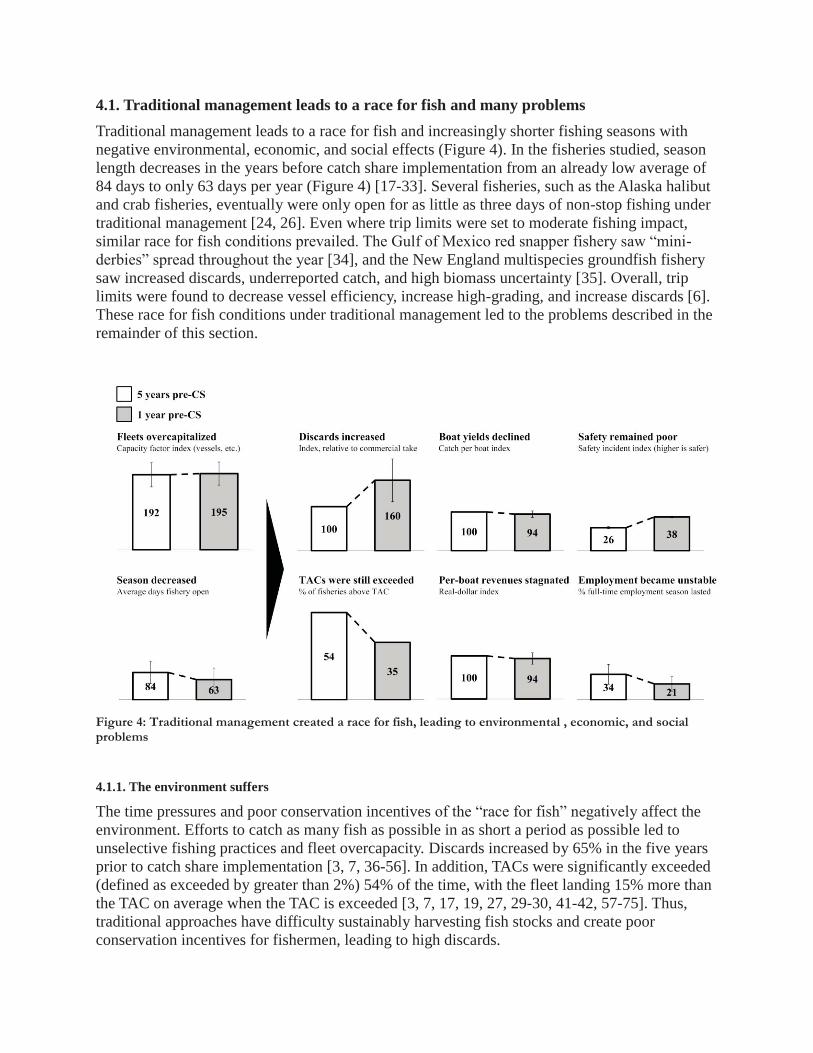
4.1. Traditional management leads to a race for fish and many problems Traditional management leads to a race for fish and increasingly shorter fishing seasons with negative environmental, economic, and social effects (Figure 4). In the fisheries studied, season length decreases in the years before catch share implementation from an already low average of 84 days to only 63 days per year (Figure 4) [17-33]. Several fisheries, such as the Alaska halibut and crab fisheries, eventually were only open for as little as three days of non-stop fishing under traditional management [24, 26]. Even where trip limits were set to moderate fishing impact, similar race for fish conditions prevailed. The Gulf of Mexico red snapper fishery saw “mini-derbies” spread throughout the year [34], and the New England multispecies groundfish fishery saw increased discards, underreported catch, and high biomass uncertainty [35]. Overall, trip limits were found to decrease vessel efficiency, increase high-grading, and increase discards [6]. These race for fish conditions under traditional management led to the problems described in the remainder of this section.
Figure 4: Traditional management created a race for fish, leading to environmental , economic, and social problems 4.1.1. The environment suffers
The time pressures and poor conservation incentives of the “race for fish” negatively affect the environment. Efforts to catch as many fish as possible in as short a period as possible led to unselective fishing practices and fleet overcapacity. Discards increased by 65% in the five years prior to catch share implementation [3, 7, 36-56]. In addition, TACs were significantly exceeded (defined as exceeded by greater than 2%) 54% of the time, with the fleet landing 15% more than the TAC on average when the TAC is exceeded [3, 7, 17, 19, 27, 29-30, 41-42, 57-75]. Thus, traditional approaches have difficulty sustainably harvesting fish stocks and create poor conservation incentives for fishermen, leading to high discards.
4.1.2. Economic harms result
The short seasons caused by the race for fish reduce fishery profitability. Per-vessel yields declined slightly by 6%, as did per-vessel revenues [3, 17, 19, 29, 41, 48, 52-53, 67-68, 74-76]. There are numerous reasons for the decline in revenues beyond decreasing stocks. Ex-vessel prices decreased as supply ‘gluts’ placed too much product on the market in a short period of time [personal communication].4 Furthermore, time pressure led to poor handling, declining product quality, and more frozen fish [personal communication]. In addition, fishermen’s financial conditions declined as they redesigned their vessels to meet increasingly limited fishing constraints without landing additional fish [personal communication]. 4.1.3. Social problems result
Social problems such as declining safety and unstable employment also accompanied traditional management’s negative economic and environmental impacts. A safety index based on a combination of injuries, search and rescue missions, vessels lost, and lives lost (depending on data availability for each fishery) demonstrates that fisheries under traditional management were, on average, only 26% to 38% as safe as the same fisheries under catch shares [77-79]. For example, search and rescue missions in Alaska halibut and sablefish fisheries rose from 25 to 33 per year in the years before catch shares [77]. At the same time, employment became unstable in many fisheries as seasons lasted only a few days or weeks. Opportunities for full-time employment dropped from 34% to only 21% in the studied fisheries in the five years before catch shares implementation [17-33, 79-80]. Job quality further declined as limited time at sea meant that fishermen were more willing to risk the safety of their crews by fishing in adverse weather and water conditions [81]. Employment stability also decreases when traditional management leads to fishery closures. In 2009, 17 of the 42 federal fishery management plans implemented early in-season closures or continued indefinite closures of specific species due to past overfishing, or closed specific areas [82].
4.2. Catch shares end the race for fish Catch shares management ends the race for fish by creating incentives for economic efficiency and long-term stewardship. The fleets studied rationalized, on average dropping from 195% of the efficient level to the post-catch shares efficient level [17, 23, 29-30, 32, 42, 45-48, 65-66, 68, 74, 76, 83-90]. Further, catch shares end the race for fish and remove the need for most input controls, and the available days to fish increased on average from 63 to 245 days [17-33]. Fleets rationalize under catch shares because secure shares in the fishery with individual accountability improve TAC compliance and allow fishermen to match their capitalization to their share of the catch. Further, when shares are tradable, some of the least efficient fishermen exit by selling their quota, reducing fleet capacity to align better with TACs. Seasons expand because, with a secure share, fishermen slow the pace of fishing by fishing when it is economically beneficial. They no longer need to worry about another fisherman catching all of the TAC. In addition, these valuable shares transformed the mindset of some fishermen, who developed a more concrete financial stake in the outcome of their fishing practices [personal communication]. This potent combination of economic incentive and a sense of environmental stewardship leads to improved fishery sustainability (Figure 5).
4 See list of personal communications in the “personal communications” section. Individual responses are maintained confidential

Figure 5: Catch shares end the race for fish, leading to environmental, economic, and social recovery
4.3. Catch shares improve environmental management and performance
Catch shares improve environmental outcomes primarily by reducing fishing impact on non-target species and consistently maintaining catch levels at or below set TACs, consistent with previous research that shows catch shares reduce variability in key environmental indicators [91]. 4.3.1. Discards decrease
Under catch shares, the studied fisheries’ discards-to-retained-catch average drops 31% over five years and 66% over ten years (Figure 6). Nearly all of the fisheries had lower discard rates than under traditional management. Discards in the British Columbia halibut fishery decrease by over 90% [41]. Discards in the Alaska pollock [7], Alaska sablefish [44-47], and Alaska halibut [41] fisheries also drop by 50% to 65% by the tenth year of catch shares. The SCOQ fishery, with an inherently low discard ratio due to the nature of the fishery, experienced little change under catch shares [personal communication]. Monitoring and enforcement made possible under catch shares reduces fishermen’s ability to high-grade and discard, while the elimination of the derby leads to reduced gear waste and ghost fishing.

Figure 6: Commercial discards reduced. % reduction vs. baseline year (year before catch shares)
While the data show an increase in discards in the first full year of catch shares implementation, this is largely due to idiosyncratic and transitional factors. The fishery with the largest increase in discards is the Alaska pollock fishery, where the discard rate nearly doubles to 3% during the first year of catch shares. However, this is due to abnormally low discards in the baseline year, when age class dynamics produced few fish below marketable size [7]. The “high” first year discards are still well below the pre-catch shares average of 8%. The Alaska sablefish fishery, where discards increased almost 30% in the first year of catch shares, similarly saw unusually low discards in the baseline year.
Comparing practices of fisheries that have both catch shares and traditionally managed sectors reveals similar results. Catch shares sectors have lower discard rates relative to traditional management sectors. In the Alaska groundfish fishery for example, the community development quota fishery managed with catch shares has a discard rate 40% lower than the traditionally managed sector [92]. As discussed in Section 4.6, the Pacific whiting catch share catcher-processor sector has a discard rate over 30% less than the traditionally managed mothership sector (0.8% versus 1.2%). In addition, the Pacific whiting catcher-processor cooperative established an explicit goal of reducing discards and bycatch [93].
Some fisheries also experience improvements in non-commercial and prohibited bycatch. For example, the Alaska sablefish fishery reduced crab and salmon discards under catch shares by nearly 90% and overall non-commercial bycatch by nearly 50%. Similarly, the Alaska pollock fishery decreased crab and salmon discards by 50% and overall non-commercial bycatch by 25% [92, 94-95].

4.3.2. Total Allowable Catch limits are not exceeded
In addition, catch shares improve environmental management by reducing the size and frequency of significant TAC overages (defined as greater than 2%) (Figure 7). Under traditional management, 44% of TACs are exceeded, and when they are exceeded, by an average of over 15%. Under catch shares, TAC overages are nearly eliminated. Of the 86 TACs set in catch share fisheries since implementation, only five (6%) have been exceeded, and by an average of only 7% [3, 7, 17, 19, 27, 29-30, 41-42, 57-75]. The BC halibut, Alaska pollock, and Alaska halibut fisheries saw overages ranging from 5% to 10% pre-catch shares transformed to underages of up to 5%. The SCOQ and Gulf of Alaska rockfish pilot coop saw historic underages in their fisheries continue under catch shares, but with more consistency. Managers of the BC groundfish fishery, in recognition of the complexities of multi-species trawl fishing, allow certain overages to be taken out of the following year’s TAC. The BC groundfish fishery therefore accounts for the largest of the overages under catch shares.
Figure 7: TAC overages reduced. Landings / TAC (average across fisheries) 4.3.3. Total Allowable Catch accuracy improves
TAC setting accuracy also improves under catch shares. TAC accuracy improves ecosystem health because overcapitalized fleets under traditional management allow small miscalculations to translate into catching much more biomass than is appropriate. TAC setting is based on biological stock assessments that inherently contain a degree of uncertainty, as survey methods cannot directly capture the entire fishery. Stock assessment uncertainty is measured by the relative magnitude of the 95% confidence interval, the margin of error of the point estimate necessary to ensure that there is a 95% chance that the true stock value lies within the margin of error. The 95% confidence interval of stock assessments decreases on average in the fisheries

studied by 25%, from ±28% five years before catch shares to ±21% five years after catch shares. The BC halibut and sablefish fisheries saw the most dramatic improvements with uncertainty shifting from ±106% and ±76% to ±47% and ±19%, respectively [96-98], and the BC groundfish trawl reduced uncertainty by 40% [99]. However, biomass uncertainty does not decrease in each fishery. The Alaska pollock [7] and SCOQ [59] saw minimal change in uncertainty, and uncertainty in the Alaska halibut, sablefish, and crab fisheries was variable or increased slightly [96, 100-102].
Biomass uncertainty decreases under catch shares because additional fishery science through industry participation improves data availability. For example, in many of the fisheries, including the BC groundfish trawl and the Alaska halibut fisheries, fishermen associations contribute major funds, data, and vessel participation to government scientific research so that TACs can be set more accurately and sustainably [103-104]. Further, when catch shares lead to increased monitoring, this ensures more accurate bycatch and landing estimates. These improved information sources allow fishery managers to improve their modeling systems, gaining a better idea of the actual biomass of the fishery and reducing biomass estimate uncertainty. 4.3.4. Management options for ecosystem health improves
As catch shares reduce discards, reduce TAC overages, and decrease biomass uncertainty, options to improve ecosystem health and rebuild stocks improve. Uncaught biomass (biomass previously lost to discards, TAC overages, or misestimated by stock assessments) can be available for achieving fishery goals. For example, the Alaska pollock fishery, despite its low discard and overage rates, had the most uncaught biomass, ranging from 165M to 270M pounds. The BC groundfish and whiting fisheries saw uncaught biomass range from 20M to 120M pounds. At a smaller scale the BC sablefish, BC halibut, AK halibut, AK sablefish, and SCOQ fisheries experienced uncaught biomass ranging from 1M to 10M pounds. As a result, if fisheries are under a rebuilding plan, biomass can be improved without necessarily lowering TACs.
4.4. Economic performance improves under catch shares 4.4.1. Total and per-vessel revenues increase
Under catch shares, fishermen and fleets recover economically. Overall revenues increase dramatically under catch shares (Figure 8). Combined with rationalization, this results in revenues per vessel nearly doubling [3, 17, 19, 29, 41, 48, 52-53, 67-68, 74-76]. Overall revenues increase for numerous reasons. Decreasing discards and more efficient fishing practices (such as decreased trawl time) increase efficiency, while the longer seasons eliminate the need for vessels to sustain a grueling pace while at sea. Slowing the fishery often results in higher prices from year-round availability of fresh fish, increasing quality from better handling, and increasing processing product recovery (the percentage of fish used in the finished product) [personal communication] [105]. In addition, many catch shares fisheries achieve certification from the Marine Stewardship Council (MSC), which can increase demand and raise prices. MSC certification is awarded to 58% of US catch share fisheries, versus fewer than 5% of traditionally managed fisheries [106].

Figure 8: Overall revenues increase. Average revenues across fisheries vs. baseline year (year before catch shares) 4.4.2. TACs can be increased
In addition to benefitting from vessel and fleet level efficiencies, catch shares can allow for higher TACs through more strategic management. Overall, TACs increase an average of 13% five years after catch shares implementation, and 19% ten years after catch shares implementation (see Section 4.3.2). The BC halibut, [60] Alaska pollock [7], and Alaska halibut [60] fisheries increased TACs the most, from 30% to 50%. In contrast, the SCOQ [65] and Alaska sablefish [57] decreased TACs between 10% and 40% in response to declining biomass due to general environmental performance [19, 107]. These data suggest that TACs can be adjusted upward due to increased biomass. However, they can be restricted by recruitment classes and other species-specific population patterns.
4.5. Mixed social changes accompany catch shares Social changes accompany these economic and environmental gains. The catch shares programs in this study note shifts in numerous areas of social interest. Safety increases as the pace of fishing decreases and seasons lengthen, benefiting all stakeholders. Ports in Alaska halibut and sablefish fisheries undergo a modest consolidation, with many mid-size ports having increased landings and most of the smaller ports having decreased landings. Processors that were tooled to process large amounts of fish in short periods are forced to adjust as seasons lengthen, although new processing entrants can benefit. The labor market shifts towards full-time crewmember positions, benefitting certain workers with increased hours while resulting in some part-time job losses. 4.5.1. Safety improves

Catch shares improve safety by eliminating the race for fish, removing the incentive to sacrifice safety for speed. Fishing safety nearly triples based on an index of relevant safety data across fisheries [6, 77, 78, 81, 108-110]. For example, the search and rescue missions in Alaska halibut and sablefish fisheries decrease from 33 per year before catch shares to fewer than ten per year after catch shares [77]. In addition, incentives for sensible fishing practices create better communication within the industry [personal communication]. 4.5.2. Ports modestly consolidate in Alaska fisheries
Port communities are affected by changes in fisheries management, including catch shares implementation. Ports used in the Alaska halibut and sablefish fisheries saw changes as catch shares removed the time pressure to land at the nearest port. As fishermen’s flexibility to choose ports increased, most ports of small value had decreased halibut and sablefish landings, while middle-tier ports, and one small-value port, benefited through increased and more evenly distributed landings (Figure 9) [57]. Halibut landings end in 37% of total ports; however, these ports only account for 8% of total value [3, 57]. Thus, while the economic effects on individuals and individual communities are sometimes considerable, port consolidation was limited in the Alaska sablefish and halibut fisheries. Most ports experienced a change of less than $500,000 in landings per year [57]. In addition, many fishermen choose to retire once tradable quota shares give them the means to do so, resulting in some communities losing sources of fishing heritage [personal communication]. Most middle-tier ports, in contrast, benefited from catch shares. As the fishery became more profitable and total revenues increased, these ports benefited from increased economic activity [57].
Figure 9: Alaska ports' landings moderately consolidated. Alaska halibut and sablefish ports after ten years of catch shares show that a wide distribution remained, but low-value ports were lost 4.5.3. Processors are overcapitalized relative to the new market
Fish processors are also affected by the transition from traditional management to catch share management when catch shares alters a fishery’s landing pattern. Under race for fish conditions that result in short annual seasons, the processing industry (along with fisheries) can become

overcapitalized to handle the glut of fish in short periods. When short-season fisheries transition to catch shares, the season stabilizes, landings smooth, the efficient amount of peak processing capacity reduces. For example, in the British Columbia halibut fishery, over 45% of the catch was typically landed in a large glut in April with a secondary spike of 33% in September. Under catch shares, April landings are merely 14% of the annual catch, and the highest month is May with 17% of the annual landings (Figure 10) [111-114].
Figure 10: Processing is impacted by more stable supply. % of BC halibut catch by month, two year average before and after catch shares
In some cases, excess processor capacity shifts pricing power to fishermen as processors compete to maintain high levels of fish supply [115-116]. In the Alaska halibut and sablefish fisheries, processors are estimated to have lost 56% and 76% of their pre-catch shares wealth, respectively [115]. In British Columbia, these shifts also allowed new processors to enter the field and gain economic benefits from catch shares. As fishery landings spread out throughout the year and fish no longer needed to be frozen, costs of entry declined and new processors entered [personal communication]. These new entrants can lead to stranded capital for incumbent processors if their equipment is highly specialized and cannot be sold to other fisheries.

4.5.4. Employment transitions from shorter-term part-time positions to fewer full-time positions
As discussed in Section 4.1.3, there are few opportunities for full time employment under the race for fish. While many people have some degree of employment in the fishery, the low number of days open to fishing (often under two weeks) means that few crew members were fully employed in the fishery.
Fisheries can therefore experience considerable structural shifts in the labor market when transitioning to catch shares [Weninger, personal communication, 2006]. Under catch shares, the season lengthens and effort is more spread out. As a result, there is a marked shift from shorter-term, part-time jobs in the years prior to catch shares to greater full-time employment after catch share implementation.
Overall, FTEs increase 2% in the first five years of catch shares, in contrast to the 51% decline that those same fisheries experienced during the five years preceding catch shares implementation. This average reflects a wide range of actual changes in FTEs, ranging from a 48% increase in the British Columbia sablefish fishery [18] to a 39% decline in the Alaska halibut fishery [76]
While the estimated total number of individuals with some degree of employment in the fishery (however marginal) decreases by 56% in the first five years of catch shares [6, 24, 27, 78, 98, [100, 105, 117-127], confounding factors, such as unsustainable temporary employment increases where overfishing was occurring, may explain part of this change.
In addition, remaining jobs transition into more stable positions under better working conditions. Job quality improves through hours per job increasing by an average of 69% in catch share fisheries, resulting in an improved economic situation for crewmembers who stay in the fishery. A separate study of the Alaska crab fishery finds that the median seasonal crew wage increased by 66% under catch shares, from an average of $14,000 to $23,000 (with significant variation among crewmembers), even as crab prices declined [117]. Beyond wages, remaining fishermen see their jobs as higher quality, reporting improvements in stability of employment and crew life under catch shares [personal communication].
4.6. The Pacific whiting fishery confirms catch shares management’s efficacy As one test of catch shares efficacy, two sectors of the same fishery, one under catch shares management and one under traditional management, are compared to control for other variables that might affect the results. Until the 2011 implementation of the Pacific coast groundfish rationalization program, the Pacific whiting fishery included a catch share in the catcher-processor cooperative sector, as well as traditionally managed mothership and shoreside sectors. Overall, the differences between these whiting sectors prior to 2011 are similar to the before-and-after analysis of the fifteen catch shares fisheries: catch shares lead to major environmental and economic improvements, as well as certain social gains.
Specifically, catch shares ended the race for fish in the Pacific whiting catch share fishery: the fleet rationalized to 70% of pre-catch shares levels, while the traditionally managed shoreside and mothership sectors saw little change [25, 42, 74, 80]. In addition, the season expanded by over 300% in the catch share fishery while the other two sectors saw only ±15% changes [25, 128]. Ending the race for fish led to better environmental behavior in the catch share sector versus the non-catch shares sectors. Although very low in general in the whiting fishery, discards were lower in the catch share fishery, 0.8% compared to 1.2% in the mothership sector [25].

Bycatch of Chinook salmon and rockfish were also 50% lower in the catch share fishery [25]. TAC compliance remained stable in both of the sectors [129]. Economic performance also improved in the catch share fishery, with revenue increasing by 15% more in the ten years following catch shares implementation than in the non-catch shares sectors [74]. Socially, employment also stabilized as the season expanded in the catch share sector.
5. Discussion Catch shares result in clear gains in environmental performance, major economic improvements, and a mixture of changes in social performance. This discussion section explores the significance of the complex and mixed social shifts by describing the subjective views of fishery participants, and how catch share design can have a considerable impact on these shifts.
5.1. Stakeholders rate catch shares as an improvement over traditional management While catch shares management results in mixed social shifts, it is subjectively rated by active participants as an improvement over traditional fisheries management systems. Catch share fishermen, environmentalists, managers, and other fishery stakeholder interviewees share the opinion that fisheries are better off under catch shares. These stakeholders, all of whom are active fishery participants, rate various fishery metrics under catch shares relative to traditional management as having considerably improved (Figure 11) [personal communication, see list in “personal communications” section]. In addition, a more detailed survey of Alaska halibut fishermen shortly after the catch shares implementation found that “[negative] attitudes towards the IFQ program were inversely correlated with the size of quota share holdings,” meaning that those with the fewest landings (often the least efficient fishermen), made up the majority of those dissatisfied with catch shares [130].

Figure 11: Participants rate catch shares transitions highly. Catch shares rated relative to traditional management, from 0 (much worse) to 5 (the same) to 10 (much better)
While interviewees are more ambivalent towards the social shifts of catch shares than the environmental and economic benefits, catch share design can have a considerable impact on these social shifts. Design can address issues of community development, ownership concentration, and public benefit. Catch shares increasingly integrate these options into their initial management program design (see, for example, [131]).
5.2. Community goals can guide design Catch shares design can help achieve community goals through a variety of mechanisms. Six of the programs studied allocated quota directly to communities to ensure their ongoing participation in the fishery. For example, dedicating 5% to 20% of the shares to certain communities in British Columbia and Alaska enabled those communities to remain in the fishery (Figure 12) [27, 132-133]. In Alaska, shares are set aside as Community Development Quotas (CDQs), which require that all fishery earnings further community development. These facilitate investments in education, infrastructure, and fisheries-related industries, thereby easing the transition to catch shares in vulnerable communities [133]. In an alternative model, the Northeast Multispecies Sectors program establishes seventeen cooperatives, each of which can be managed with different community interests in mind.

Figure 12: Quota can be allocated to communities. % of total fishery quota
Other community interests can also be aided in retaining quota allocation. For example, processor interests are sometimes addressed through direct compensation, cooperatives, or quota sharing [134]. The loss of part-time fishing jobs can be mitigated partially through assisting new fisherman entrants in purchasing stakes in the catch share fisheries. Catch share fisheries are also allowed under the MSA to create limited loan funds through cost-recovery fees to help new entrants purchase quota. These programs can help bring fishermen and communities into the fishery that would otherwise not be able to do so [135]. In the Alaska sablefish and halibut fisheries, the North Pacific Loan Program receives approximately $5 million per year for this purpose [104].
5.3. Ownership concentration can be limited through caps Catch shares design can help to limit ownership concentration through regulatory caps. However, fishery concentration is more a result of fishery economics than management system. Changes in the four firm concentration (a commonly used measure of industry concentration measuring the total market share of the top four firms) tend to be minimal in catch shares transitions (Figure 13). Most concentrated fisheries either remain stable or experience negligible concentration gains (e.g., less than 6% in the New Zealand deepwater and Atlantic surf clam fisheries). The most concentrated catch share fisheries are the same fisheries that were the most concentrated under traditional management (e.g., the New Zealand deepwater, New Zealand mid-water, the SCOQ fisheries, and others), maintaining their pre-catch shares concentrations of between 50% and 70% [14, 56, 65, 76, 83, 136]

Figure 13: Four-firm ownership does not considerably change. Percent of the total quota owned by the top four firms by year of catch share
Overall, concentration is focused in fisheries with major economies of scale, independent of management approach. Fisheries requiring large capital investments in vessels or equipment tend to provide greater returns to the most efficient operators, reducing the number of owners even before catch shares. For example, the SCOQ fishery requires major investment in large dredge vessels, resulting in high ownership concentration even under traditional management. In the SCOQ fishery, the main ownership shift is therefore not ownership concentration, but approximately 60% of owners leasing their quota instead of directly harvesting [137]. Thus, vessels rationalize (by over 70% from 142 to 41 in ten years) as owners cease directly harvesting, but the number of owners remains approximately constant [137]. In the New Zealand deepwater and middle-depth fisheries, steep capital requirements restrict entrance from smaller operators independent of quota-trading mechanisms [138]. In contrast, the BC and Alaska halibut fisheries use much smaller vessels, and therefore have lower ownership concentration.
At the same time, quota ownership measured as the change in number of owners in the first five years of catch shares does show some concentration due to rationalization. For example, the Gulf red snapper, SCOQ, BC sablefish, Alaska sablefish, and BC halibut fisheries experienced 10% to 20% reductions in the number of quota owners [56, 79, 139-140], while the Alaska halibut fishery experienced a 25% reduction [139].
Nevertheless, statutory concentration limits restrict potential ownership concentration where that is a management goal. For example, in the Alaska halibut, Alaska sablefish, and BC sablefish fisheries, limits of between 1% and 2% have been implemented to preserve the historic small

vessel fleets [6]. Additional refinements can help mitigate concentration. For example, it is possible to limit quota holdings by stock, species, or area. Local lending capacity or fishery funds can be developed, allowing new entrants a way of purchasing small amounts of quota. In addition, tools such as subsidized quota purchases and Justice Department interventions have been considered. However, these limits may also reduce the potential economic benefits of consolidation.
5.4. The public benefits from the shift to catch shares Catch shares provide greater fiscal benefits to the federal government than traditional management due to the improved economic conditions of fisheries under catch shares (see [8] for a more detailed discussion). First, as fishermen become more profitable they contribute more in tax payments. Second, catch share programs can recover some of the costs of fishery management. The combination of taxation, cost recovery, and other tools can thus be used to ensure that sustainable fisheries management supports both individuals and communities.
The public gains primarily through increasing tax revenues [8]. Under catch shares, fishermen are more profitable and therefore pay higher amounts in income taxes. Wealthier fishermen remit 25% to 35% of their new income to the public through the US federal income tax. 20% of the new quota value is also remitted to the government through federal capital gains taxes when sold.
Cost recovery also reduces the federal government’s fishery management costs. The MSA allows for levying direct ‘cost recovery’ fees of up to 3% of fishery revenue, which many fisheries have implemented (Figure 14) [6, 70-71, 141-142]. These fees help pay for the increasing government costs associated with transitioning to catch shares and allow for more robust public management options. In addition, a quota registration tax of 0.5% of transferred shares’ value, if widely implemented, could result in small government revenues [8]. Other tools can also create direct public value from catch shares, such as auctions of initial (or additional) quotas.
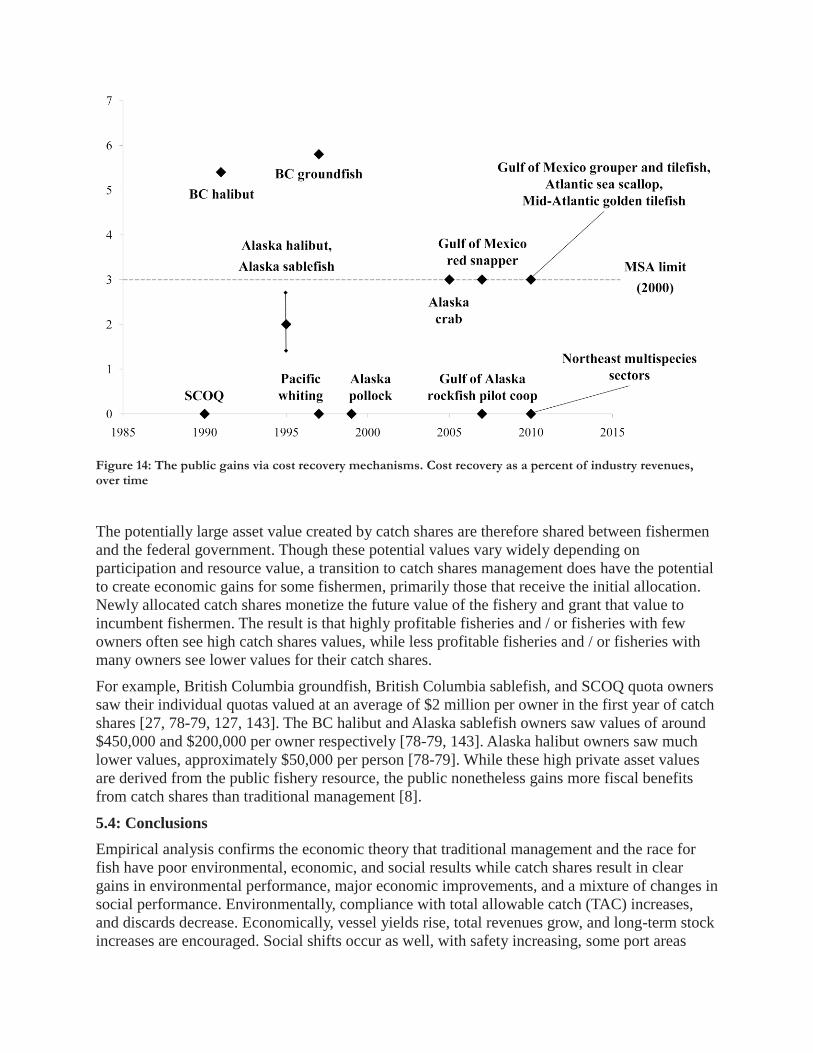
Figure 14: The public gains via cost recovery mechanisms. Cost recovery as a percent of industry revenues, over time
The potentially large asset value created by catch shares are therefore shared between fishermen and the federal government. Though these potential values vary widely depending on participation and resource value, a transition to catch shares management does have the potential to create economic gains for some fishermen, primarily those that receive the initial allocation. Newly allocated catch shares monetize the future value of the fishery and grant that value to incumbent fishermen. The result is that highly profitable fisheries and / or fisheries with few owners often see high catch shares values, while less profitable fisheries and / or fisheries with many owners see lower values for their catch shares.
For example, British Columbia groundfish, British Columbia sablefish, and SCOQ quota owners saw their individual quotas valued at an average of $2 million per owner in the first year of catch shares [27, 78-79, 127, 143]. The BC halibut and Alaska sablefish owners saw values of around $450,000 and $200,000 per owner respectively [78-79, 143]. Alaska halibut owners saw much lower values, approximately $50,000 per person [78-79]. While these high private asset values are derived from the public fishery resource, the public nonetheless gains more fiscal benefits from catch shares than traditional management [8].
5.4: Conclusions Empirical analysis confirms the economic theory that traditional management and the race for fish have poor environmental, economic, and social results while catch shares result in clear gains in environmental performance, major economic improvements, and a mixture of changes in social performance. Environmentally, compliance with total allowable catch (TAC) increases, and discards decrease. Economically, vessel yields rise, total revenues grow, and long-term stock increases are encouraged. Social shifts occur as well, with safety increasing, some port areas

consolidating, some processors becoming overcapitalized relative to market demand, and the labor market shifting towards fewer part-time and more full-time positions. Newer catch shares address many social concerns through careful design.

Appendix 1: South Atlantic wreckfish Although a catch shares program was implemented for the South Atlantic wreckfish fishery in 1992, the subsequent lack of commercial activity lowers data availability and makes it irrelevant to this analysis. Overall, exogenous economic factors compromised the fishery’s economic viability.
Fishermen could not profitably bring wreckfish to market due to rising fuel prices (an acute problem for this long-haul fishery), the difficulty and associated costs of fishing near the Gulf Stream, the difficulty of harvesting the fish due to low densities and the inability to locate fish with a fish finder, and general uncertainty regarding the fish’s biology and stock situation [144]. These factors result in little interest in fishing for wreckfish, independent of the management system. As one commercial wreckfish fisherman described the situation, “The reason there is no interest in participating in this fishery has absolutely nothing to do with ITQs. Wreckfishing is very difficult; you are working in the middle of the Gulf Stream, the gear is expensive, and it just isn’t a fishery for everyone” [145]
As a result, wreckfish vessels that had initially come from other regional fisheries simply returned to those fisheries that were more profitable than the wreckfish fishery. Because many wreckfish fishermen primarily fished for other species, when wreckfish became uneconomical to harvest, they transferred their shares or effort to enable themselves to focus on more profitable fisheries (e.g., snapper, grouper, and shrimp) [78, 145-146].

Glossary: ABC: Allowable Biological Catch
AK: Alaska
BC: British Columbia
Catcher vessel: a vessel that is used for catching fish and that does not process fish on board
Catcher-processor: a vessel that is used for catching fish and processing that fish
CDQ: Community Development Quota
CPC: Catcher-processor crew (sector)
CPO: Catcher-processor owner (sector)
CS: Catch shares
CVC: Catcher vessel crew (sector)
CVO: Catcher vessel owner (sector)
EEZ: Exclusive Economic Zone
FTE: Full Time Equivalent
ITQ: Individual Transferable Quota
IVQ: Individual Vessel Quota
LAPP: Limited Access Privilege program
M: Million
Mothership: a processor vessel that receives and processes groundfish from other vessels and is not used for, or equipped to be used for, catching fish
MPA: Marine Protected Area
MSA: Magnuson-Stevens Fishery Conservation and Management Act
MSC: Marine Stewardship Council
NMFS: National Marine Fishery Service
NOAA: National Oceanic and Atmospheric Administration
NZ: New Zealand
RAM: Restricted Access Management
SCOQ: Surf Clam Ocean Quahog fishery
TAC: Total Allowable Catch
US: United States

References [1] National Oceanic and Atmospheric Administration. NOAA catch share policy. 2010; retrieved from http://www.nmfs.noaa.gov/sfa/domes_fish/catchshare/docs/noaa_cs_policy.pdf.
[2] National Marine Fisheries Service. Essential fish habitat [data file]. 2011; retrieved from http://akr-mapping.fakr.noaa.gov/Website/EFH/viewer.htm.
[3] National Marine Fisheries Service. Annual commercial landing statistics. National Oceanic and Atmospheric Administration 2011; retrieved from http://www.st.nmfs.noaa.gov/st1/commercial/landings/annual_landings.html.
[4] United States Commission on Ocean Policy. An ocean blueprint for the 21st century. Washington, DC: United States Government Printing Office; 2004, retrieved from http://www.oceancommission.gov/documents/full_color_rpt/000_ocean_full_report.pdf.
[5] National Marine Fisheries Service. Our living oceans: the economic status of US fisheries 1996. National Oceanic and Atmospheric Administration 1996.
[6] Committee to Review Individual Fishing Quotas, National Research Council. Sharing the fish: toward a national policy on individual fishing quotas. Washington, DC: National Academies Press; 1999.
[7] Ianelli JN, Barbeaux S, Honkalehto T, Kotwicki S, Aydin K, Williamson N. Assessment of the walleye pollock stock in the Eastern Bering Sea. Alaska Fishery Science Center 2008, retrieved from http://www.afsc.noaa.gov/refm/docs/2008/EBSpollock.pdf.
[8] Grimm DG, Boomhower J, Blau JM. Can catch shares reduce the US federal deficit? Journal of Sustainable Development 2010; 3 (4): 118-131.
[9] Costello C, Gaines SD, Lynham J. Can catch shares prevent fisheries collapse? Science 2008; 321: 1678-1681.
[10] National Marine Fisheries Service. 2009 status of US fisheries. National Oceanic and Atmospheric Administration 2010; retrieved form http://www.nmfs.noaa.gov/sfa/statusoffisheries/sos_full28_press.pdf.
[11] Bray T, Gill S, Edwards R. Assessment of western rock lobster strategic management options: how do quota management systems work in rock lobster fisheries? Western Australia Department of Fisheries 2006; Fisheries Management Paper 212, retrieved from http://www.fish.wa.gov.au/docs/mp/mp212/fmp212.pdf.
[12] Donohue K, Barker E. Information on quota management of rock lobster fisheries in South Australia, Tasmania and New Zealand. Western Australia Department of Fisheries 2000; Fisheries Management Paper 138, retrieved from http://www.fish.wa.gov.au/docs/mp/mp138/fmp138.pdf.
[13] Sullivan KJ. Report from the Mid-Year Fishery Assessment Plenary, November 2004: stock assessments and yield estimates. New Zealand Ministry of Fisheries, Science Group 2004; retrieved from http://www.fish.govt.nz/NR/rdonlyres/372D116C-7628-4DFA-91A2-55EF00C76F8C/664/rklbstrplenary2004.pdf.
[14] Connor R. Changes in fleet capacity and ownership of harvesting rights in New Zealand fisheries. Food and Agriculture Organization of the United Nations 2001; In FAO Fisheries Technical Paper 412, retrieved from http://www.fao.org/docrep/005/Y2498E/y2498e00.htm.
[15] Straker G, Kerr S, Hendy J. A regulatory history of New Zealand’s quota management system: setting targets, defining and allocating quota. Motu Economic and Public Policy Research 2002; retrieved from http://www.motu.org.nz/files/docs/MEL0283.pdf.
[16] Sullivan KJ; Mace PM; Smith NW, McL NW, Griffiths MH, Todd PR, Livingston ME, Harley SJ, Key JM, Connell AM. Report from the Fishery Assessment Plenary, May 2005: stock assessments and yield estimates. Wellington, NZ: New Zealand Ministry of Fisheries; 2005.
[17] Munro GR, Turris B, Clark C, Sumaila UR, Bailey M. Impacts of harvesting rights in Canadian Pacific fisheries. Department of Fisheries and Oceans Canada, Economic Analysis and Statistics Branch 2009; Statistical and Economic Analysis Series Publication No. 1-3, retrieved from http://www.dfo-mpo.gc.ca/ea-ae/cat1/no1-3/N01-3_eng.pdf
[18] GSGislason and Associates, LTD. Employment impacts of ITQ fisheries in Pacific Canada. Canada Department of Fisheries and Oceans 2008.
[19] Hanselman DH, Fujioka JT, Lunsford CR, Rodgveller CJ. Alaska of the sablefish stock in Alaska for 2009. Alaska Fishery Science Center 2009; retrieved from http://www.afsc.noaa.gov/REFM/docs/2009/GOAsablefish.pdf.
[20] National Marine Fisheries Service, Restricted Access Management. Season dates for fishing under the individual fishing quota (IFQ) program for Pacific halibut and sablefish and for the Community Development Quota (CDQ) program for Pacific halibut. 2011; retrieved from http://www.alaskafisheries.noaa.gov/ram/reports/ifq_cdq_seasons.pdf.
[21] McCay BJ, Gatewood JB, Creed CF. Labor and the labor process in a limited entry fishery. Marine Resource Economics 1989; 6: 311-330.
[22] National Marine Fisheries Service. Surf clam and ocean quahog ITQ. 2009; retrieved from http://www.nmfs.noaa.gov/sfa/domes_fish/catchshare/docs/surfclam_oceanquahog.pdf.
[23] MRAG Americas. Economic analysis of the impacts of catch shares on fisheries employment and income. Environmental Defense Fund 2009.
[24] Knapp G. Selected economic impacts of crab rationalization on Kodiak: preliminary results. ComFish Alaska 2006; retrieved from http://www.iser.uaa.alaska.edu/Publications/Knapp_Kodiak_Crab_Rationalization_Final_Report.pdf.
[25] Pacific Fishery Management Council. Status of the Pacific Coast groundfish fishery through 2000 and recommended biological catches for 2001: stock assessment and fishery evaluation. 2000; retrieved from http://www.pcouncil.org/groundfish/background/document-library/safe-documents/october-2000-safe-document/.
[26] International Pacific Halibut Commission. Commercial opening dates. 2011; retrieved from http://www.iphc.washington.edu/commercial/19.html.
[27] Grafton R, Nelson H, Turris B. How to resolve the class II common property problem? The case of British Columbia’s multi-species groundfish trawl. Australian National University

Economics and Environment Network 2005; Working Paper 0506, retrieved from http://een.anu.edu.au/download_files/een0506.pdf.
[28] National Marine Fisheries Service, Alaska Region. Bering Sea and Aleutian Islands management area pollock seasons, 1991-2010. 2011; http://www.fakr.noaa.gov/sustainablefisheries/plckseas.pdf.
[29] Bowers FR, Schwenzfeier M, Herring K, Salmon M, Milani K, Shaishnikoff J, Barnhart H, Alas J, Burt R, Baechler B, Buetnner A. Annual management report for the commercial and subsistence shellfish fisheries of the Aleutian Islands, Bering Sea and the Westward Region's shellfish observer program, 2008-2009. Alaska Department of Fish and Game 2010; retrieved from http://www.sf.adfg.state.ak.us/FedAidPDFs/FMR10-24.pdf
[30] Gulf of Mexico Fishery Management Council and National Marine Fisheries Service. Final amendment 26 to the Gulf of Mexico reef fish fishery management plan to establish a red snapper individual fishing quota program. 2006; retrieved from http://www.gulfcouncil.org/Beta/GMFMCWeb/downloads/Amend26031606FINAL.pdf.
[31] National Marine Fisheries Service. Scallop general category IFQ program. 2010; retrieved from http://www.nmfs.noaa.gov/sfa/domes_fish/catchshare/docs/scallop_general_category_ifq2010.pdf.
[32] North Pacific Fishery Management Council and National Marine Fisheries Service. Regulatory impact review, and final environmental assessment for proposed amendment 68 to the Gulf of Alaska fishery management plan: central Gulf of Alaska rockfish demonstration program. 2006; retrieved from http://alaskafisheries.noaa.gov/analyses/amd68/finalgoaea_rir.pdf.
[33] National Marine Fisheries Service. Central Gulf of Alaska rockfish. 2009; retrieved from http://www.nmfs.noaa.gov/sfa/domes_fish/catchshare/docs/goa_rockfish.pdf.
[34] Weninger Q, Waters JR. Economic benefits of management reform in the Northern Gulf of Mexico reef fish fishery. Journal of Environmental Economics and Management 2003; 46: 207-230.
[35] Hennessey T, Healey M. Ludwig’s ratchet and the collapse of New England groundfish stocks. Coastal Management 2000; 28: 187–213.
[36] Ianelli JN, Barbeaux S, Honkalehto T, Kotwicki S, Aydin K, Williamson N. Assessment of the walleye pollock stock in the Eastern Bering Sea. Alaska Fishery Science Center 2010, retrieved from http://www.afsc.noaa.gov/refm/docs/2010/EBSpollock.pdf.
[37] Ianelli JN, Barbeaux S, Honkalehto T, Lauth B, Williamson N. Assessment of Alaska pollock stock in the Eastern Bering Sea. Alaska Fishery Science Center 2005; retrieved from http://www.afsc.noaa.gov/refm/docs/2005/EBSPollock.pdf.
[38] Alverson D, Freeberg M, Murawski S, Pope J. A global assessment of fisheries bycatch and discards. Food and Agriculture Organization of the United Nations 1996; Fisheries Technical Paper 339.
[39] Branch T, Hilborn R, Haynie A, Fay G, Flynn L, Griffiths J, Marshall K, Randall J, Scheuerell J, Ward E, Young M. Fleet dynamics and fishermen behavior: lessons for fisheries managers. Canadian Journal of Fisheries and Aquatics Sciences 2006; 63: 1647-1668.

[40] Branch T, Rutherford K, Hilborn R. Replacing trip limits with individual transferable quotas: implications for discarding. Marine Policy 2006; 30: 281-292.
[41] Clark WG, Hare S. Assessment of the Pacific halibut stock at the end of 2005. International Pacific Halibut Commission 2005; retrieved from www.iphc.washington.edu/papers/sa05.pdf.
[42] Pacific Fishery Management Council. Pacific whiting allocation and seasons: environmental assessment and regulatory impact review of the anticipated biological, social, and economic impacts of a proposal to allocate pacific whiting among non-tribal sectors and to establish a framework for modifying season opening dates. 1997.
[43] Pacific Fishery Management Council. Pacific whiting allocation: environmental assessment and regulatory impact review of the anticipated biological, social, and economic impacts of a proposal to allocate the resource in 1994, 1995 and 1996. 1993.
[44] Queirolo LE, Fritz LW, Livingston PA, Loefflad MR, Colpo DA, deReynier YL. Bycatch, utilization, and discards in the commercial groundfish fisheries of the Gulf of Alaska, Eastern Bering Sea, and Aleutian Islands. Alaska Fisheries Science Center 1995; Technical Memorandum NMFS-AFSC-58, retrieved from www.afsc.noaa.gov/publications/AFSC-TM/NOAA-TM-AFSC-58.pdf.
[45] Kinoshita RK, Grieg A, Colpo D, Terry JM. Economic status of the groundfish fisheries off Alaska, 1995. Alaska Fisheries Science Center 1997; retrieved from http://www.afsc.noaa.gov/publications/AFSC-TM/NOAA-TM-AFSC-72.pdf.
[46] Hiatt T, Terry J. Stock assessment and fishery evaluation report for the groundfish fisheries of the Gulf of Alaska and Bering Sea / Aleutian Island area: economic status of the groundfish fisheries off Alaska, 1999. Alaska Fisheries Science Center 2000; retrieved from http://www.afsc.noaa.gov/refm/docs/drafts/safes/econ00.pdf.
[47] Hiatt T, Felthoven R, Dalton M, Garber-Yonts B, Haynie A, Lew D, Sepez J, Seung C. Stock assessment and fishery evaluation report for the groundfish fisheries of the Gulf of Alaska and Bering Sea / Aleutian Island area: economic status of the groundfish fisheries off Alaska, 2007. Alaska Fisheries Science Center 2008; retrieved from http://www.afsc.noaa.gov/refm/docs/2007/economic.pdf.
[48] North Pacific Fishery Management Council. Gulf of Alaska rockfish pilot program review. 2008; retrieved from http://www.fakr.noaa.gov/npfmc/current_issues/groundfish/RPPreview508.pdf.
[49] Northeast Fisheries Science Center. 45th Northeast regional stock assessment workshop: summary report. 2007; reference document 07-11, retrieved from http://www.nefsc.noaa.gov/publications/crd/crd0711/crd0711.pdf.
[50] Gulf of Mexico Fishery Management Council. Stock assessment of red snapper in the Gulf of Mexico: SEDAR update assessment. 2009; retrieved from http://www.sefsc.noaa.gov/sedar/download/Red%20Snapper%20Update%202009%205.0.pdf?id=DOCUMENT.
[51] Northeast Fisheries Science Center. Assessment of 19 Northeast groundfish stocks through 2007. 2008; reference document 08-15, retrieved from http://www.nefsc.noaa.gov/publications/crd/crd0815/crd0815.pdf

[52] National Marine Fisheries Service, Northeast Regional Office. TAC report summary: commercial landings and target quota utilization (May 2008 – April 2009). 2009; retrieved from http://www.nero.noaa.gov/ro/fso/reports%5CTAC%5CTAC_1997_2009%5CTAC_FY2008_WEB.pdf.
[53] National Marine Fisheries Service, Northeast Regional Office. TAC report summary: commercial landings and target quota utilization (May 2009 – April 2010). 2010; retrieved from http://www.nero.noaa.gov/ro/fso/reports%5CTAC%5CTAC_1997_2009%5CTAC_FY2009_WEB.pdf.
[54] Harrington J, Myers R, Roseberg A. Wasted resources: bycatch and discards in US fisheries. Oceana 2005; retrieved from http://na.oceana.org/sites/default/files/o/fileadmin/oceana/uploads/Big_Fish_Report/PDF_Bycatch_July28.pdf.
[55] Pitcher T, Chuenpagdee R. Bycatch in fisheries and their impact on the ecosystem. University of British Columbia Fisheries Centre Research Reports 1994; 2:1-86, retrieved from http://www.fisheries.ubc.ca/publications/reports/report2_1.php.
[56] National Marine Fisheries Service, Southeast Region. 2009 Gulf of Mexico red snapper individual fishing quota annual report. 2010; retrieved from http://sero.nmfs.noaa.gov/sf/pdfs/2009%20Red%20Snapper%20IFQ%20Annual%20Report%20-10-25-10.pdf.
[57] National Marine Fisheries Service, Alaska Region. IFQ halibut / sablefish reports and CDQ halibut reports. 2011; retrieved from http://www.fakr.noaa.gov/ram/ifqreports.htm.
[58] National Marine Fisheries Service, Alaska Region. IFQ halibut / sablefish reports and CDQ halibut program reports: IFQ harvest by port of landing. 2011; retrieved from http://www.fakr.noaa.gov/ram/ifqreports.htm#harvest.
[59] Northeast Fisheries Science Center. 37th Northeast regional stock assessment workshop: stock assessment review committee consensus summary of assessments. 2010; reference document 03-16, retrieved from http://www.nefsc.noaa.gov/publications/crd/crd0316/saw37csa.pdf.
[60] International Pacific Halibut Commission. Pacific halibut catch limits: 1980-2004. 2004; retrieved from http://www.iphc.washington.edu/halcom/commerc/limits80299.htm.
[61] National Marine Fisheries Service, Northwest Regional Office. Catch accounting requirements for pacific whiting shoreside processors participating in the shore-based fishery. 2007; retrieved from http://www.nwr.noaa.gov/Groundfish-Halibut/Groundfish-Fishery-Management/NEPA-Documents/upload/Processor-Rule-Draft-EA.pdf.
[62] Schnute JT, Haigh R, Krishka, BA, Starr P. Pacific ocean perch assessment for the West coast of Canada in 2001. Department of Fisheries and Oceans Canada, Science Branch, Pacific Region 2001; Canadian Science Advisory Secretariat Research Document 2001/138, retrieved from http://www.dfo-mpo.gc.ca/csas/Csas/DocREC/2001/RES2001_138e.pdf.
[63] Dorn M, Saunders M, Wilson C, Guttormsen M, Cooke K, Kieser R, Wilkins M. Status of the coastal Pacific hake / whiting stock in U.S. and Canada in 1998. Canadian Stock Assessment Secretariat 1999; Research Document 99/90, retrieved from www.afsc.noaa.gov/REFM/wc/pwhiting99.pdf.

[64] Schnute JT, Olsen N, Haigh R. Slope rockfish assessment for the West coast of Canada in 1999. Department of Fisheries and Oceans Canada, Science Branch, Pacific Region 1999; Canadian Stock Assessment Secretariat Research Document 99/184, retrieved from http://www.dfo-mpo.gc.ca/csas/Csas/DocREC/1999/pdf/99_184e.pdf.
[65] McCay BJ, Brandt S. Changes in fleet capacity and ownership of harvesting rights in the United States surf clam and ocean quahog fishery. Food and Agriculture Organization of the United Nations 2001; In FAO Fisheries Technical Paper 412, retrieved from http://www.fao.org/docrep/005/Y2498E/y2498e00.htm.
[66] National Marine Fisheries Service, Restricted Access Management. Bering Sea and Aleutian Islands crab rationalization report: fishing year 2009/10. 2010; retrieved from http://www.fakr.noaa.gov/sustainablefisheries/crab/rat/ram/0910crabrpt.pdf.
[67] Northeast Fisheries Science Center. 48th Northeast regional stock assessment workshop: assessment report. 2009; reference document 09-15, retrieved from http://www.nefsc.noaa.gov/publications/crd/crd0915/crd0915.pdf.
[68] New England Fishery Management Council and National Marine Fisheries Service. Framework 21 to the Atlantic sea scallop FMP: including an environmental assessment, an initial regulatory flexibility analysis, and stock assessment and fishery evaluation report. 2010; retrieved from http://www.nefmc.org/scallops/frame/fw%2021/FW21_031610_FINALresubmit3.pdf.
[69] National Marine Fisheries Service, Alaska Region. Alaska groundfish fishery catch reports for groundfish, IFQ and CDQ fisheries. 2011; retrieved from http://www.fakr.noaa.gov/sustainablefisheries/catchstats.htm.
[70] Gulf of Mexico Fishery Management Council and National Marine Fisheries Service. Amendment 29 to the reef fish fishery management plan (including draft environmental impact statement and regulatory impact review): effort management in the commercial grouper and tilefish fisheries. 2008; retrieved from http://www.gulfcouncil.org/Beta/GMFMCWeb/downloads/Final%20Reef%20Fish%20Amdt%2029-Dec%2008.pdf.
[71] National Marine Fisheries Service, Northeast Regional Office. Permit holder letters and announcements. 2004-2011; retrieved from http://www.nero.noaa.gov/nero/nr/.
[72] Haist V, Hilborn R, Saunders M. Sablefish stock assessment for 1999 and recommended yield options for 2000 and 2001. Canadian Stock Assessment Secretariat 1999; Research Document 99/195, retrieved from http://www.dfo-mpo.gc.ca/csas/Csas/DocREC/1999/pdf/99_195e.pdf.
[73] Department of Fisheries and Oceans Canada. Sablefish (Anoplopoma fimbria) stock assessment and advice for 2005. 2005; Canadian Science Advisory Secretariat Science Advisory Report 2005/040, retrieved from http://www.dfo-mpo.gc.ca/csas/Csas/status/2005/SAR-AS2005_040_e.pdf.
[74] Pacific Fishery Management Council and National Marine Fisheries Service. Rationalization of the Pacific coast groundfish limited entry trawl fishery: final environmental impact statement including regulatory impact review and initial regulatory flexibility analysis.
2010; retrieved from http://www.pcouncil.org/wp-content/uploads/1_Pacific-Coast-Grounddfish-Limited-Entry-Trawl-Fishery-FEIS.pdf.
[75] Department of Fisheries and Oceans Canada. Preliminary summary commercial statistics 1996-2010. 2011; retrieved from http://www.pac.dfo-mpo.gc.ca/stats/comm/summ-somm/index-eng.htm.
[76] Hartley M, Fina M. Changes in fleet capacity following the introduction of individual vessel quotas in the Alaskan Pacific halibut and sablefish fishery. Food and Agriculture Organization of the United Nations 2001; In FAO Fisheries Technical Paper 412, retrieved from http://www.fao.org/docrep/005/Y2498E/y2498e00.htm.
[77] Woodley, CJ. Quota Based Fishery Management Regimes. International Fishing Industry Safety and Health Conference: Innovative Approaches to Investigating and Preventing Fishing Vessel Casualties; 2000, retrieved from http://www.cdc.gov/niosh/docs/2003-102/pdfs/2003102d.pdf.
[78] Iudicello S, Weber ML, Wieland R. Fish, markets, and fishermen: the economics of overfishing. Washington, DC: Island Press; 1999.
[79] Shotton R. Case studies on the effects of transferable fishing rights on fleet capacity and concentration of quota ownership. Food and Agriculture Organization of the United Nations 2001; Fisheries Technical Paper 412, retrieved from ftp://ftp.fao.org/docrep/fao/005/y2498e/y2498e00.pdf.
[80] Weeks H, Hutton L. Shoreside whiting observation program: 1997. Oregon Department of Fish and Wildlife, Marine Finfish Program 1997; retrieved from http://www.dfw.state.or.us/MRP/hake/Main%20Pages/SHOP%20Publications/docs/SHOP_1997rpt.pdf.
[81] Hughes SE, Woodley C. Transition from open access to quota based fishery management regimes in Alaska increased the safety of operations. International Maritime Health 2007; 58: 33-45.
[82] Bonzon K. Can catch shares lower the number of fishery closures? EDFish. Environmental Defense Fund 2011; retrieved from http://blogs.edf.org/edfish/2010/05/21/can-catch-shares-lower-the-number-of-fishery-closures/.
[83] Munro GR. The effect of introducing individual harvest quotas upon fleet capacity in the marine fisheries of British Columbia. Food and Agriculture Organization of the United Nations 2001; In FAO Fisheries Technical Paper 412, retrieved from http://www.fao.org/docrep/005/Y2498E/y2498e00.htm.
[84] Gislason GS. Stronger rights, higher fees, greater say: linkages for the Pacific halibut fishery in Canada. Food and Agriculture Organization of the United Nations 2000; In FAO Fisheries Technical Paper 404/2, retrieved from http://www.fao.org/docrep/003/X8985E/x8985e0d.htm
[85] National Marine Fisheries Service. Bering Sea and Aleutian Islands American fisheries act pollock cooperatives. 2009; retrieved from http://www.nmfs.noaa.gov/sfa/domes_fish/catchshare/docs/bsai_pollock.pdf;

[86] National Marine Fisheries Service, Southeast Region. 2008 Gulf of Mexico red snapper individual fishing quota annual report. 2009; retrieved from http://sero.nmfs.noaa.gov/sf/pdfs/2008RedSnapperIFQAnnualReport1.pdf.
[87] New England Fishery Management Council and National Marine Fisheries Service. Framework adjustment 44 to the Northeast multispecies fishery management plan: including an environmental assessment, regulatory impact review, and initial regulatory flexibility analysis. 2009; retrieved from http://www.savingseafood.org/images/documents/regulation/draft_fw44_nov_council.pdf.
[88] New England Fishery Management Council and National Marine Fisheries Service. Amendment 13 to the Northeast multispecies fishery management plan: including a final supplemental environmental impact statement and an initial regulatory flexibility analysis. 2003; retrieved from http://www.nefmc.org/nemulti/planamen/amend13_dec03.htm.
[89] National Marine Fisheries Service, Alaska Region. Central Gulf of Alaska rockfish program. 2011; retrieved from http://www.fakr.noaa.gov/sustainablefisheries/goarat/default.htm.
[90] Leal D. Fencing the fishery: a primer on ending the race for fish. Property and Environment Research Center 2002; retrieved from http://www.perc.org/pdf/guide_fish.pdf.
[91] Essington TE. Ecological indicators display reduced variation in North American catch share fisheries. Proceedings of the National Academy of Sciences of the United States of America 2010; 107: 16794-16799.
[92] Smoker J. Discards in the groundfish fisheries of the Bering Sea / Aleutian Islands and the Gulf of Alaska, 1998-2000. Alaska Department of Fish and Game 2010; Regional Information Report 5J10-04, retrieved from http://www.adfg.alaska.gov/FedAidPDFs/RIR.5J.2010.04.pdf.
[93] Pacific Whiting Conservation Cooperative. PWCC catch management program. 2007; retrieved from http://pacificwhiting.org/catchManagement.htm.
[94] Gaichas S, Fritz L, Ianelli J. Other species considerations for the Gulf of Alaska. In Stock assessment and fishery evaluation report for the groundfish resources of the Gulf of Alaska. North Pacific Fishery Management Council 1999; retrieved from http://www.afsc.noaa.gov/refm/docs/historic_assess/othspp99.pdf.
[95] Gaichas S. Summary of changes in the Bering Sea – Aleutian Islands squid and other species assessment. North Pacific Fishery Management Council 2002; retrieved from http://citeseerx.ist.psu.edu/viewdoc/download?doi=10.1.1.12.7067&rep=rep1&type=pdf.
[96] Clark WG, St-Pierre G, Brown ES. Estimates of halibut abundance from NMFS trawl surveys. International Pacific Halibut Commission 1997; Technical Report No. 37, retrieved from www.iphc.washington.edu/publications/techrep/tech0037.pdf.
[97] Haist V, Kronlund A, Wyeth M. Sablefish (Anoplopoma fimbria) in British Columbia, Canada: stock assessment for 2003 and advice to managers for 2004. Canadian Science Advisory Secretariat 2004; Research Document 2004/055, retrieved from http://www.dfo-mpo.gc.ca/csas/Csas/DocREC/2004/RES2004_055_e.pdf.
[98] Haist V, Kronlund A, Wyeth M. Sablefish (Anoplopoma fimbria) in British Columbia, Canada: stock assessment for 2004 and advice to managers for 2005. Canadian Science Advisory

Secretariat 2005; Research Document 2005/031, retrieved from http://www.dfo-mpo.gc.ca/csas/Csas/DocREC/2005/RES2005_031_e.pdf.
[99] Department of Fisheries and Oceans Canada. Pacific ocean perch British Columbia coast stock status. 1999; DFO Science Stock Status Report A6-11, retrieved from http://www.dfo-mpo.gc.ca/csas/CSAS/status/1999/a6-11e.pdf.
[100] Hanselman DH, Lunsford CR, Sigler M, Fujioka JT. Alaska sablefish assessment for 2006. Alaska Fishery Science Center 2005; retrieved from http://www.afsc.noaa.gov/refm/docs/2005/GOAsable.pdf.
[101] Barnard D, Bechtol B, Bowers F, Donaldson W, Eckert G, Foy RJ, Garber-Yonts B, Gish RK, Hamazaki H, Harrington G, Munk E, Pengilly D, Punt A, Rugolo L, Siddeek MSM, Soong J, Stram D, Turnock BJ, Van Sant S, Watson L, Zheng J. Stock assessment and fishery evaluation report for the king and tanner crab fisheries of the Bering Sea and Aleutian Islands regions. North Pacific Fishery Management Council 2010; retrieved from http://www.fakr.noaa.gov/npfmc/SAFE/2010/CRABSAFE2010.pdf.
[102] Hare SR. Assessment of the Pacific halibut stock at the end of 2009. International Pacific Halibut Commission 2010; retrieved from http://www.iphc.washington.edu/papers/sa09.pdf.
[103] Department of Fisheries and Oceans Canada. Pacific region integrated fisheries management plan for groundfish, February 21, 2011 to February 20, 2013. 2011; retrieved from http://www-ops2.pac.dfo-mpo.gc.ca/xnet/content/MPLANS/plans11/2011%20Groundfish%20IFMP_Final_Complete.pdf.
[104] National Marine Fisheries Service, Restricted Access Management. The Pacific halibut – sablefish IFQ report for fishing year 2003. 2007; retrieved from http://www.fakr.noaa.gov/ram/rtf03.pdf.
[105] Groundfish Trawl Special Industry Committee. Review of the groundfish trawl individual vessel quota / Groundfish Development Authority plan. Department of Fisheries and Oceans Canada 1999; retrieved from http://www-ops2.pac.dfo-mpo.gc.ca/xnet/content/groundfish/GFTrawl/paper.pdf.
[106] Marine Stewardship Council. List of all MSC fisheries. 2011; retrieved from http://www.msc.org/track-a-fishery/all-fisheries.
[107] National Marine Fisheries Service. Fishwatch: Atlantic surfclam. 2010; retrieved from http://www.nmfs.noaa.gov/fishwatch/species/atlantic_surfclam.htm
[108] Lincoln JM, Mode NA, Woodley CJ. An evaluation of quota-based management systems in Alaska. North Pacific Research Board 2007; retrieved from http://doc.nprb.org/web/05_prjs/533_final%20report.pdf.
[109] Woodley, CJ, Lincoln JM, Medlicott CJ. Improving fishing vessel safety through collaboration. The Coast Guard Proceedings of the Marine Safety and Security Council: Journal of Safety and Security at Sea 2009; 66: 38-44, retrieved from http://www.uscg.mil/proceedings/Spring2009/articles/38_Woodley,%20Lincoln,%20Medlicott_Improving%20Commercial%20Fishing%20Vessel.pdf.
[110] United States Coast Guard. USCG district 1 fishing casualties [data file]. 2010.
[111] Department of Fisheries and Oceans Canada, Pacific Region Statistics Unit. Annual summary of British Columbia commercial catch statistics 1989. 1990; retrieved from http://www.pac.dfo-mpo.gc.ca/stats/comm/ann/summary-resume/1989.pdf.
[112] Department of Fisheries and Oceans Canada, Pacific Region Statistics Unit. Annual summary of British Columbia commercial catch statistics 1990. 1991 retrieved from http://www.pac.dfo-mpo.gc.ca/stats/comm/ann/summary-resume/1990.pdf.
[113] Department of Fisheries and Oceans Canada, Pacific Region Statistics Unit. Annual summary of British Columbia commercial catch statistics 1991. 1992; retrieved from http://www.pac.dfo-mpo.gc.ca/stats/comm/ann/summary-resume/1991.pdf.
[114] Department of Fisheries and Oceans Canada, Pacific Region Statistics Unit. Annual summary of British Columbia commercial catch statistics 1992. 1993; retrieved from http://www.pac.dfo-mpo.gc.ca/stats/comm/ann/summary-resume/1992.pdf
[115] Matulich SC, Clark ML. North Pacific halibut and sablefish IFQ policy design: quantifying the impacts on processors. Marine Resource Economics 2003; 18: 149–166.
[116] United States General Accounting Office. Individual fishing quotas: better information could improve program management. GAO 2002; GAO-03-159, retrieved from http://www.gao.gov/products/GAO-03-159.
[117] Abbott JK, Garber-Yonts B, Wilen JE. Employment and renumeration effects of IFQs in the Bering Sea / Aleutian Islands crab fisheries. Marine Resource Economics 2010; 25: 333-354.
[118] Casey K, Dewees C, Turris B, Wilen J. The effects of individual vessel quotas in the British Columbia halibut fishery. Marine Resource Economics 1996; 10: 211-230.
[119] GSGislason and Associates, LTD. British Columbia seafood sector and tidal water recreational fishing: a strengths, weaknesses, opportunities, and threats assessment. Victoria, British Columbia: BC Ministry of Agriculture, Food and Fisheries; 2004, retrieved from http://www.env.gov.bc.ca/omfd/reports/SWOT/FULL_Report.pdf.
[120] Berman M, Leask L. On the eve of IFQs: fishing for Alaska’s halibut and sablefish. Alaska Review of Social and Economic Conditions 1994; retrieved from http://www.iser.uaa.alaska.edu/publications/formal/arsecs/arsec292p3.pdf.
[121] Olson J. Groundfish pelagic trawl fishing effort in the Gulf of Alaska, Bering Sea and Aleutian Islands. Alaska Fisheries Science Center, Resource Ecology and Ecosystem Modeling 2009; retrieved from http://access.afsc.noaa.gov/reem/ecoweb/EcoChaptMainFrame.cfm?ID=65.
[122] Knapp G, Hull D. The first year of the Alaska IFQ program: a survey of halibut quota share holders. Alaska Department of Commerce and Economic Development 1996; retrieved from http://www.iser.uaa.alaska.edu/publications/HalibutQuotaShareholders.pdf.
[123] Marcoul P, Weninger Q. Search and learning with correlated information: theory and evidence from professional fishermen. Journal of Economic Dynamics and Control 1998; 32: 1921-1948, doi:10.1016/j.jedc.2007.07.003.
[124] Sigler MF, Lunsford CR. Effects of individual quotas on catching efficiency and spawning potential in the Alaska sablefish fishery. Canadian Journal of Fisheries and Aquatic Sciences 2001; 58: 1300-1312.

[125] Standing Senate Committee on Fisheries. Privatization and quota licensing in Canada’s fisheries, third report. 1998; retrieved from http://www.parl.gc.ca/36/1/parlbus/commbus/senate/com-e/fish-e/rep-e/rep03dec98-e.htm.
[126] Turris BR. A comparison of British Columbia’s ITQ fisheries for groundfish trawl and sablefish: similar results from programmes with differing objectives, designs, and processes. Food and Agriculture Organization of the United Nations 2000; In FAO Fisheries Technical Paper 404/1, retrieved from http://www.fao.org/docrep/003/X7579E/x7579e0b.htm.
[127] Wang SD, Tang VH. The surf clam ITQ management: an evaluation. Marine Resource Economics 1995; 10:93-98.
[128] Anderson LG, Holliday MC. The design and use of limited access privilege programs. National Marine Fisheries Service 2007; Technical Memorandum NMFS-F/SPO-86, retrieved from http://www.nmfs.noaa.gov/sfa/PartnershipsCommunications/lapp/design_and_useLAPs2007.pdf.
[129] Helser T, Stewart I, Fleischer G, Martell S. Stock assessment of pacific hake (whiting) in US and Canadian waters in 2006. Pacific Fishery Management Council 2006; retrieved from http://www.pcouncil.org/wp-content/uploads/2006_hake_assessment_FINAL_ENTIRE.pdf.
[130] Knapp G. Initial effects of the Alaska halibut IFQ program: survey comments of Alaska fishermen. Marine Resource Economics 1997; 12: 239-248.
[131] Bonzon K, McIlwain K, Strauss CK, Van Leuven T. Catch shares design manual: a guide for managers and fishermen. Environmental Defense Fund 2010; retrieved from www.edf.org/documents/11387_catch-share-design-manual.pdf.
[132] National Marine Fisheries Service, Alaska Region. Community Development Quota allocation and catch information. 2011; retrieved from http://www.fakr.noaa.gov/cdq/current_historical.htm.
[133] Committee to Review the Community Development Quota Program, National Research Council. The Community Development Quota program in Alaska. Washington, DC: National Academies Press; 1999.
[134] Mittal A. Individual fishing quotas: economic effects on processors and methods available to protect communities. US General Accounting Office 2004; GAO-04-487T, retrieved from http://www.gao.gov/new.items/d04487t.pdf.
[135] National Panel on the Community Dimensions of Fisheries Catch Share Programs. Community dimensions of fisheries catch share programs: integrating economy, equity, and environment. EcoTrust 2011; retrieved from www.ecotrust.org/fisheries/NPCDFCSP_paper_031511.pdf.
[136] Waldeck D. About the Pacific whiting conservation cooperative. 2009; retrieved from http://www.pacificwhiting.org/.
[137] Brandt S. The equity debate: distributional impacts of individual transferable quotas. Oceans and Coastal Management 2005; 48: 15-30.
[138] Stewart J, Callagher P. Quota concentration in the New Zealand fishery: annual catch entitlement and the small fisher. Marine Policy 2011; 35: 631-646

[139] National Marine Fisheries Service, Restricted Access Management. Changes in halibut QS holdings between initial issuance and currently issued. 2011; retrieved from http://www.fakr.noaa.gov/ram/daily/ifqqscompare.pdf.
[140] Department of Fisheries and Oceans Canada. Commercial licence updates: statistics. 2011; retrieved from http://www.pac.dfo-mpo.gc.ca/fm-gp/licence-permis/index-eng.htm.
[141] Agar, Juan. Individual fishing quotas in the Gulf of Mexico red snapper fishery. National Marine Fisheries Service, Southeast Fisheries Science Center. 2009; retrieved from http://www.st.nmfs.noaa.gov/st5/workshop/2009/documents/Approved_Presentations/3b_GOM_Red_Snapper_Review_Agar_2009.pdf
[142] Mid-Atlantic Fishery Management Council and National Marine Fisheries Service. Amendment 1 to the tilefish fishery management plan: includes final environmental impact statement, preliminary regulatory economic evaluation and essential fish habitat assessment. 2008; retrieved from http://www.mafmc.org/fmp/pdf/Tilefish_Amend_1_Vol_1.pdf.
[143] EcoTrust. Catch-22: conservation, communities and the privatization of B.C. fisheries. Vancouver, British Columbia: EcoTrust; 2004, retrieved from http://ecotrust.ca/sites/all/files/Catch-22-November2004_0.pdf.
[144] South Atlantic Fishery Management Council. Draft wreckfish individual transferable quota (ITQ) program review. 2009; September, 2009 Council Meeting Briefing Book Tab 1 Attachment 6, retrieved from http://www.safmc.net/Portals/6/Meetings/Council/BriefingBook/Sept09/LAPP/Attach6WFProgramReview082809.pdf.
[145] Allen, RB. South Atlantic wreckfish. 2011; IFQ Summary Series Number 5, retrieved from http://www.lobsterconservation.com/wreckfish/.
[146] Gauvin JR. Changes in fleet capacity and ownership of harvesting rights in the United States wreckfish fishery. Food and Agriculture Organization of the United Nations 2001; In FAO Fisheries Technical Paper 412, retrieved from http://www.fao.org/docrep/005/Y2498E/y2498e06.htm.Personal communications
Interviews were conducted between February and June 2006 in British Columbia, the Mid-Atlantic and in Cape Cod. In addition, phone interviews were conducted between August and October of 2010. Interviewees included
• Fishermen: Brian Mose; Bob Morreau; Joe Garvella; John Kelleher; Rick Savage; John Our; Mike Russo; Mark Simonitsch; Peter Taylor; Matt Linell
• Processors: Murray Chatwin; Daniel Cohen; Dave Carnes; Dan Waldeck, Pacific Whiting Conservation Cooperative
• Fishermen organizations: John Pappalardo, CCCHFA; Paul Parker, CCCHFA; Tom Rudolph, CCCHFA
• Environmentalists: Terry Glavin, Sierra Club; Scott Wallace, David Suzuki Foundation; Sally McGee, Environmental Defense; Margaret Bowman, Pew Charitable Trusts; Astrid Scholz, Ecotrust
• Community representatives: Irv Figg, Fishermen Union

• Government agencies: Barry Ackerman, DFO; Kelly Ames, PFMC; Forrest Bowers, Alaska Department of Fish and Game; Captain Michael Cerne, USCG, Clay Heaton, MAFMC; Tom Hoff; Jesse Garrett, NMFS-RAM; Drew Kitts, NMFS; Phil Logan, NMFS; Jess Melgey, NEFMC; Glenn Merrill, NOAA; Sue Murphy, Lieutenant Kevin Saunders, USCG; NMFS; Eric Thunberg, NMFS; Tom Warren, NMFS;
• Other: Aaron Laing, Quota Trader; Bruce Turris, Consultant; Dave Wallace, Consultant