Embed Size (px)
Citation preview

February 2009Joe P. MahoneyMichael A. HansenNewton C. JacksonCarol A. HunterLinda M. Pierce
WA-RD 682.2
Office of Research & Library Services
WSDOT Research Report
Assessment of the I-5 Portland Cement Concrete Pavement in King County

Executive Summary Agreement T4118, Task 02
Pavement Deterioration
Assessment of the I-5 Portland Cement Concrete Pavements
in King County
Executive Summary
Joe P. Mahoney Michael A. Hansen Newton C. Jackson
Carol A. Hunter Linda M. Pierce
Washington State Transportation Center (TRAC) University of Washington, Box 354802
1107NE 45th Street, Suite 535 Seattle, Washington 98105-4631
Prepared for Washington State Transportation Commission
Department of Transportation and in cooperation with
U.S. Department of Transportation Federal Highway Administration
December 2007
TECHNICAL REPORT STANDARD TITLE PAGE
1. REPORT NO.
WA-RD 682.2 2. GOVERNMENT ACCESSION NO. 3. RECIPIENT’S CATALOG NO.
5. REPORT DATE
December 2007 4. TITLE AND SUBTITLE
ASSESSMENT OF THE I-5 PORTLAND CEMENT CONCRETE PAVEMENTS IN KING COUNTY— EXECUTIVE SUMMARY
6. PERFORMING ORGANIZATION CODE
7. AUTHORS
Joe P. Mahoney, Michael A. Hansen, Newton C. Jackson, Carol A. Hunter, Linda M. Pierce
8. PERFORMING ORGANIZATION CODE
10. WORK UNIT NO. 9. PERFORMING ORGANIZATION NAME AND ADDRESS
Washington State Transportation Center University of Washington, Box 354802 University District Building, 1107 NE 45th Street, Suite 535 Seattle, Washington (98105-7370)
11. CONTRACT OR GRANT NUMBER
T4118, Task 02
13. TYPE OF REPORT AND PERIOD COVERED
Executive Summary 12. SPONSORING AGENCY NAME AND ADDRESS
Research Office Washington State Department of Transportation Transportation Building, MS 47372 Olympia, Washington 98504-7372 Project Manager: Kim Willoughby, 360-705-7978
14. SPONSORING AGENCY CODE
15. SUPPLIMENTARY NOTES
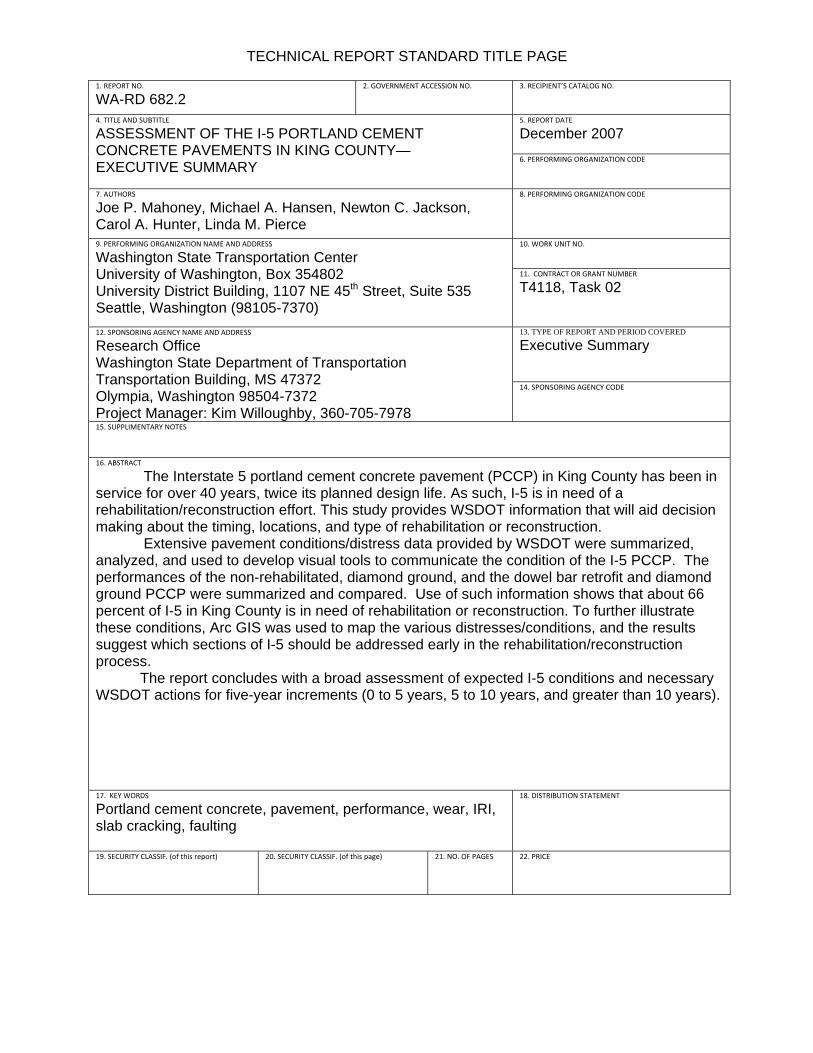
16. ABSTRACT
The Interstate 5 portland cement concrete pavement (PCCP) in King County has been in service for over 40 years, twice its planned design life. As such, I-5 is in need of a rehabilitation/reconstruction effort. This study provides WSDOT information that will aid decision making about the timing, locations, and type of rehabilitation or reconstruction. Extensive pavement conditions/distress data provided by WSDOT were summarized, analyzed, and used to develop visual tools to communicate the condition of the I-5 PCCP. The performances of the non-rehabilitated, diamond ground, and the dowel bar retrofit and diamond ground PCCP were summarized and compared. Use of such information shows that about 66 percent of I-5 in King County is in need of rehabilitation or reconstruction. To further illustrate these conditions, Arc GIS was used to map the various distresses/conditions, and the results suggest which sections of I-5 should be addressed early in the rehabilitation/reconstruction process.
The report concludes with a broad assessment of expected I-5 conditions and necessary WSDOT actions for five-year increments (0 to 5 years, 5 to 10 years, and greater than 10 years).
17. KEY WORDS
Portland cement concrete, pavement, performance, wear, IRI, slab cracking, faulting
18. DISTRIBUTION STATEMENT
19. SECURITY CLASSIF. (of this report) 20. SECURITY CLASSIF. (of this page) 21. NO. OF PAGES 22. PRICE

Disclaimer
The contents of this report reflect the views of the authors, who are responsible for the facts and
the accuracy of the data presented herein. The contents do not necessarily reflect the official
views or policies of the Washington State Transportation Commission, Washington State
Department of Transportation, or Federal Highway Administration. This report does not
constitute a standard, specification, or regulation.
iii

Contents
The Problem................................................................................................. 1 Current Condition Illustrations and Assessment........................................... 1
Worst Condition Illustration ……………………………………………………… 7 Conclusions.................................................................................................. 9 Consensus View…………………………………………………………………. 9
Figures Figure Page 1 IRI Values, Ship Canal Bridge to Northgate Way .............................. 3 2 Average Faulting, Ship Canal Bridge to Northgate Way.................... 4 3 Wheel Path Wear, Ship Canal Bridge to Northgate Way................... 5 4 Percentage of Panels with Two or More Cracks, Ship Canal Bridge to
Northgate Way................................................................................... 6 5 Worst Condition Illustration, Ship Canal Bridge to Northgate Way…. 8 6 I-5 at NE 130th in Seattle—view is to the north .................................. 11 7 I-5 at NE 130th in Seattle—view is to south ....................................... 12 8 I-5 at NE 130th in Seattle—view is to the north .................................. 13
Tables
Table Page
1 Average Distress of Non-Rehabilitated, Diamond Ground and Diamond Ground with Dowel Bar Retrofit PCCP in King County ....................... 2
2 Equivalent levels of Faulting and Cracking with Assigned Values, Colors, and Pavement Condition ...................................................................... 7
3 Interstate 5 Estimates for King County—A Consensus View ............... 10
iv

1
A Summary Assessment of Interstate 5 PCCP in King County
October 2007
The Problem
Most of the original Interstate 5 portland cement concrete pavement (PCCP) was placed 40 to 50 years ago and is still in service within King County. These 9-inch-thick PCC pavements were designed to provide 20 years of service but have served for more than twice that number of years.
Why has I-5 performed as well as it has? This could be due to Western Washington’s mild climate, which provides moderate environmental loading conditions in comparison to other regions of the U.S., or the durable aggregate sources available during the original construction.
Despite the good performance of I-5 PCC pavements, they are now showing high levels of distress and are in need of rehabilitation and/or replacement. High volumes of heavy truck traffic have resulted in extensive panel cracking and faulting of transverse joints. Studded tire use has created extensive wheel path wear and pavement surface polishing. The overall result is a PCCP that is uncomfortable for users and is on the verge of not being able to serve traffic.
Data and results in this summary stem from a study undertaken by WSDOT and the Urban Corridors Office. The project scope was originally focused on the Boeing Access Road to Northgate. The study team expanded the scope to include all of I-5 in King County.
Current Condition Illustrations and Assessment
Table 1 provides some insight into the current pavement conditions for I-5. It is important to note the following:
• An International Roughness Index (IRI) of greater than 170 inches/mile is the upper threshold at which drivers perceive the roughness of the pavement as unacceptable (i.e., a higher IRI is worse). Much of the unrehabilitated I-5 PCCP in King County is near or above that threshold value.
• Faulting at transverse joints of greater than 0.125 inches is perceivable to motorists and faults of more than 0.25 inches are very uncomfortable. Faulting effects are more noticeable to truck operators than to occupants of passenger cars. Many of the non-rehabilitated portions of I-5 are approaching or exceed the 0.125-inch level.
• Wheelpath wear depths of about 0.4 inches and greater create the risk of hydroplaning. The non-rehabilitated portions of I-5 average 0.34 inches, with about 40 percent greater than 0.4 inches. This wear is due to studded tires. The surface friction of the non-rehabilitated portions of I-5 is at low to modest levels.

• PCC panels (typically 15 ft. long and 12 ft. wide) that exhibit cracking are precursors for major structural failure. When 10 percent of the PCC panels are cracked, WSDOT typically considers PCCP replacement or major rehabilitation. Much of I-5 currently exceeds that level.
Table 1. Average Distress of Non-Rehabilitated, Diamond Ground, and Diamond Ground
with Dowel Bar Retrofit PCCP in King County
Direction, Distress and Age
Non-Rehabilitated
PCCP Diamond
Ground PCCP Dowel Bar Retrofit
and Diamond Ground PCCP
NB Mile Posts 139.5-177.75 103.75 ln-mi
154.14-158.24 14.16 ln-mi
N/A
SB Mile Posts 139.75-177.75 59.05 ln-mi
154.16-154.4 12.68 ln-mi
144.45-149.69 6.04 ln-mi
Average IRI (in/mi) 157 70 52
Average Wear Depth (in) 0.34 0.18 0.27
Average Faulting (in) 0.11 0.05 0.03
% PCCP Slabs Cracked 14 12 4
Average Age of PCCP (as of 2007) 43 40 40
Age of Rehabilitation (as of 2007) N/A 8.0 6.0
Note: Distress data obtained during 2004.
Plan views were prepared that illustrate existing conditions. Figures 1 through 4 show IRI (roughness), transverse joint faulting, wheelpath wear depths, and slab cracking for a section of I-5 from the Ship Canal Bridge to Northgate Way. As expected, the conditions of the separate lanes are not uniform. The orange and red portions indicate conditions that are marginal to critical. The full report (WA-RD 682.1) contains similar illustrations but for all of I-5 within King County.
2

Figure 1. IRI Values, Ship Canal Bridge to Northgate Way
3

Figure 2. Average Faulting, Ship Canal Bridge to Northgate Way
4

Figure 3. Wheel Path Wear, Ship Canal Bridge to Northgate Way
5

Figure 4. Percentage of Panels with Two or More Cracks, Ship Canal Bridge to Northgate
Way
6

Worst Condition Illustration The distress data were summarized to develop a straightforward illustration that aids seeing the bigger picture. All lanes in each direction and distress types were reduced to a representation of the overall pavement condition.
Three methods were evaluated for their ability to determine general pavement condition. These methods were (1) worst of the worst, (2) average of dominating distress, and (3) average of distresses. Each method was based on the assumption that particular levels of faulting and cracking result in equivalent pavement distress. These levels of distress were defined by the values shown in Table 2, faulting of 0 to 1/8 in. was considered equivalent to 0 to 5 percent of panels with two or more cracks, and so on. Each of these levels of distress was assigned a value of 1, 2, or 3, with 1 being the best condition and 3 being the worst.
Table 2. Equivalent Levels of Faulting and Cracking with Assigned Values, Colors, and
Pavement Condition
Faulting Cracking Assigned
Value Color Pavement Condition
0 – 1/8in. 0 – 5% 1 green Good 1/8in. – ¼in. 5% - 10% 2 orange/yellow Poor
¼in.+ 10%+ 3 red Extremely Poor Worst of the worst is based on the concept that all lanes of a roadway are controlled by the condition of the single worst lane—which is likely preferable since reconstruction or major rehabilitation is rarely done on just one or two lanes. The worst condition observed for any lane for a 1/10-mile section was selected to represent the pavement condition of that section of I-5. This method depicted I-5 pavements in their worst-case condition. Figure 5 provides an example of the images for the pavement conditions resulting from the worst of the worst method (all images for I-5 in King County are contained in the full report WA-RD 682.1). This figure, like figures 1 through 4, covers the portion of I-5 from Northgate Way to the Ship Canal Bridge that is in the worst condition of all I-5 segments through King County.
7

Figure 5. Worst Condition Illustration, Ship Canal Bridge to Northgate Way
8

Conclusions The analysis of the WSDOT distress data provides a quantitative understanding of the performance of the non-rehabilitated, diamond ground, and dowel bar retrofit PCCP on I-5 in King County. As the distress analysis highlighted, at least 80 lane miles of I-5 (and possibly up to 129 lane miles, out of 195 total lane miles, depending on the distress values used) need rehabilitation.
The analysis of wet surface accidents suggests a possible reduction in accidents attributable to diamond grinding. As stated earlier, this is difficult to prove but suggests further reasons for how and why I-5 PCCP needs to be rehabilitated.
The field study on I-5 at MP 175 shows that the condition of I-5 PCCP is deteriorating. The faulting, cracking, and spalling observed are worse than recorded in 1986—as expected. Furthermore, many of the new cracks are currently propagating across the slabs, suggesting that panel cracking is accelerating. The PCC on I-5 is still quite strong, as measured by compressive strength and, indirectly, by overall performance. The relatively high transverse joint load transfer efficiency (LTE) values at the MP 175 test section are encouraging. This is countered somewhat by the low LTEs for the longitudinal cracks. This suggests that a potential rehabilitation treatment may include overlaying the existing PCC with a hot mix asphalt (HMA) overlay.
The overall assessment reveals that the I-5 PCCP in King County is in poor condition. Diamond grinding and other rehabilitation efforts will help this condition, but only temporarily. Ultimately, I-5 must receive major rehabilitation or complete reconstruction.
Consensus View Table 3 was prepared by the WSDOT, University of Washington, and Nichols Consulting team to provide expected I-5 conditions for three broad time periods: 0 to 5 years, 5 to 10 years, and beyond 10 years. The assessment is based on existing conditions and the best estimate of how I-5 will continue to perform and the WSDOT actions that will be needed. A selection of photos, figures 6 through 8, is provided to illustrate current pavement conditions.
9

Table 3. Interstate 5 Estimates for King County—A Consensus View
Time Frame (years)
Expected PCC Distress During Time Frame Required WSDOT Activities
0 to 5
Increased faulting of the transverse joints and, to a lesser degree, slab cracking, with localized areas of increased cracking. Pavement wear depths due to studded tires will generally exceed safe levels (main concern is hydroplaning). Surface friction will be low throughout the corridor for PCCP that has not been ground or resurfaced.
Continuing WSDOT maintenance will be required by addressing localized problem areas—mostly broken slabs. Contract rehabilitation should include a focus on grinding the PCC surface to remove/reduce faulting and broken slab replacement. Major rehabilitation or reconstruction should be designed, funded, and under way. The traveling public will complain about the pavement condition and related noise.
5 to10
If only limited work is performed during the preceding 5 years, major faulting of the transverse joints throughout I-5 in King County is expected. A significant increase in slab cracking will occur. Without extensive grinding, pavement wheel path wear depths will continue to worsen, but slowly.
WSDOT Maintenance will be challenged to keep up with replacement/repair of broken slabs. Major rehabilitation or reconstruction must be designed, funded, and well under way. The traveling public will express increasing concern about the condition of the roadway including pavement related noise. Trucking interests will have special concerns.
Greater than 10
If limited work is performed during the preceding 10 years, I-5 will be highly distressed, largely in the form of major faulting of the transverse joints, extensive slab cracking, and wheel path wear depths. In essence, a fully “failed” condition.
WSDOT will be in a triage mode with respect to I-5. The required repair work will be extensive. The structural capacity of I-5 will be at risk. WSDOT can expect strong public complaints about the condition of the roadway.
10

11
Figure 6. I-5 at NE 130th in Seattle—view is to the north.

Figure 7. I-5 at NE 130th in Seattle—view is to south.
12

13
Figure 8. I-5 at NE 130th in Seattle—view is to the north.