Embed Size (px)
Citation preview

SCHOOL OF CHEMICAL AND LIFE SCIENCES
Diploma in Biotechnology
AY2011/2012
Assay Virtual Screening Compounds for the Inhibitory Potencies against BACE 1
CLS-12A154
A Report
Submitted by
Samuel Chen Angjie 1011195
Anselm Joachim Yap Pun Shern 1011140
Leong Yun Zen Ben 1011351
In partial fulfilment of the requirements for the Diploma in Biotechnology
January 2013
Project Supervisor: Mr Xu Weijun
Project Co-supervisor: Dr Ong Chye Sun


i
I Acknowledgement
We would like to express our sincere gratitude to our project supervisor, Mr. Xu Wei Jun, for
his perpetual guidance and supervision throughout the project. His encouragement and insight
in drug discovery aided us in times of uncertainty. We would also like to spread our
appreciation to Dr. Ong Chye Sun and Mr. Goh Tong Hng for their positive feedbacks and
continuous support. Our gratitude also extends to Mr. Wang Bao Shuang for sharing his
knowledge on dilution of the BACE1 assay kit. Furthermore, we would like to give special
thanks to Ms Jing Wan from the Centre of Biomedical and Life Sciences for her technical
support. Lastly, we would also like to thank Ms Sun Wei and Ms Ye Song for their help in
providing us with the necessary laboratory resources for our experiments.

ii
II Abstract
Alzheimer’s disease is progressively becoming common, and thus is a growing concern. The
disease is characterised by aggregates of amyloid beta (Aβ) peptides into plaques and the
initial step in their formation is catalysed by an aspartyl protease beta-secretase 1 (BACE1).
Herein we describe the measurement of the inhibitory properties of ten organic chemical
compounds against BACE1using a fluorescence resonance energy transfer (FRET) method
for their IC50, followed by a toxicology assay on an in vitro cell model SH-SY5Y using the
tetrazolium colorimetric assay (MTT) method. Structure-activity relationship (SAR) of the
compounds was subsequently analysed and discussed in detail. Six compounds showed
potent micro-molar inhibition of BACE1 and some of them exhibited low cytotoxic effects
on SH-SY5Y cells. Encouragingly, compound 7 posseses an IC50 of 4.49 µM in BACE1
enzymatic assay and exerted no toxic effect on SH-SY5Y cells even at 10 µM. Results from
this project suggest that the structural skeleton of the compounds may be novel
pharmacophore for developing drug leads against Alzheimer’s disease.

iii
III Table of Contents
Section Page
I Acknowledgements i
II Abstract ii
III Table of Contents iii
IV List of Abbreviations vi
V List of Illustrations viii
1. Introduction 1
2. Literature Review 6
2.1. Alzheimer’s disease (AD) 6
2.2. Hallmarks of AD 7
2.2.1. Neurofibrillary tangles 7
2.2.2. Senile plaques 8
2.3. Stages of AD 10
2.4. Risk factors of AD 11
2.4.1. Genetics 11
2.4.2. Aging 12
2.4.3. Vascular impairment in the brain 12
2.4.4. Hypoxia 12
2.4.5. Gender 13
2.5. AD as a major health issue 13
2.6. Therapeutic strategies against AD 14

iv
2.7. Localization and Expression of BACE1 15
2.8. Regulation of BACE1 16
2.9. Active Site of BACE1 17
2.10. Role of BACE1 in Aβ formation 18
2.11. β peptide 20
2.12. Role of blood-brain barrier (BBB) 21
2.13. Cytotoxicity Assay 22
2.14. MTT Assay 23
3. Materials and Methods 23
3.1. Initial screening: Percentage Inhibition of compounds at 3 µM 23
3.2. The IC50 assay 25
3.2.1. Positive Control 26
3.3. Toxicological Study 27
3.3.1. Cell Culture 27
3.3.2. 3-[4, 5-dimethylthiazol-2-yl]-2, 5-diphenyltetrazolium bromide (MTT)
assay
31
3.3.2.1. Preparation of MTT assay reagent and assay buffer 31
3.3.2.2. The determination of Cell Number required for MTT Assay 32
3.3.2.3. Toxicological Assay 32
4. Results 33
4.1. Enzyme Kinetics Assay 33
4.1.1. Initial Screening: Percentage Inhibition of compounds at 3 µM 33
4.1.2. IC50 assay 36

v
4.1.3. Structure-activity relationship (SAR) study 39
4.2. Toxicological study 40
4.2.1. The determination of Cell Number required for MTT Assay 40
4.2.2. MTT assay 41
5. Discussion 42
5.1. Enzyme-based assay 42
5.2. Toxicological Assay 46
5.2.1. Cell Culture 46
5.2.2. Challenges faced during culturing SH-SY5Y 51
5.2.2.1. Fungal Contamination 51
5.2.2.2. Unusual morphological conformations of SH-SY5Y cells 51
5.2.2.3. High confluence 52
5.2.2.4. Enumeration of cells 52
5.2.3. The determination of Cell Number required for MTT Assay 52
5.2.4. MTT assay 54
6. Conclusion 58
7. References 59
7.1. Websites 68
7.2. Softwares 69
8. Appendix 69
8.1. Compounds analysed in initial screening and IC50 assay 69

vi
IV List of Abbreviations
AD Alzheimer's disease
Aβ, Aβ40, Aβ42 Amyloid beta, Amyloid beta with 40 amino acids, Amyloid
beta with 42 amino acids
APP Amyloid precursor protein
BACE1, BACE2 Beta-secretase 1, Beta-secretase 2
CTF99 Carboxy-terminal fragment 99
CTF Carboxy-terminal fragment
IC50 Half-maximal inhibitory concentration
VHTS Virtual high throughput screening
HTS High throughput screening
SAR Structure-activity relationship
BBB Blood-brain barrier
PK Pharmacokinetics
MCI Mild cognitive impairment
PS1 Presenilin 1
PS2 Presenilin 2
DNA Deoxyribonucleic acid
TGN Trans-Golgi network
mRNA Messenger ribonucleic acid
N Amino
ROS Reactive oxygen species

vii
HIF-1 Hypoxia-inducible factors
JNK c-jun N-terminal kinase
ASP2 Aspartyl protease 2
TACE Tumour necrotic factor-α converting enzyme
AICD APP intracellular domain
ADAM Disintegrin and metalloprotease domain protein-9
HIV Human immunodeficiency virus
LDH Lactate dehydrogenase
MTT 3-[4, 5-dimethylthiazol-2-yl]-2, 5-diphenyltetrazolium
bromide
NADH Nicotinamide adenine dinucleotide
NADPH Nicotinamide adenine dinucleotide phosphate
DMSO Dimethyl sulfoxide
SEM Standard error of mean
PSA Polar Surface Area
MDR1 P-glycoprotein
MDCK Madin-Darby Canine Kidney Cell
ROF Lipinski’s Rule of Five
ELISA Enzyme-linked immunoabsorbent assay

viii
V List of Illustrations
List of figures
Figure Page
1 A 3D model of BACE1 (PDB code: 1M4H) depicts the interaction
between the inhibitor and the active site of BACE1.
2
2 The template compound, showing regions of it interacting with the
sub-sites of BACE1’s active site.
5
3 The molecular model of compound 9 and the amino acid to inhibitor
interactions.
6
4 Image of neurofibrillary tangles in Alzheimer's disease. 8
5 Production of Aβ40 and Aβ42 by enzymatic function of BACE1 and
gamma-secretase on amyloid precursor protein (APP).
8
6 Microscopic evaluation of the cerebral cortex with a silver stain in a
patient with Alzheimer's disease demonstrating “senile plaques”
with neuronal degeneration.
10
7 APP metabolism by the secretase enzymes: BACE1cleaves before
gamma-secretase in the amyloidogenic pathway.
20
8 Layout of the 96-well plate of our enzyme kinetics assay
experiment.
24
9 The layout of the 96-well plate. 26
10 A schematic of the proportions of the guide lines used to determine
the cell count and therefore the cell number per millilitre.
31
11 BACE1 initial screening results of compounds at 3 µM. 36
12 The % viability of SH-SY5Y against compounds at 10, 5 and 2.5
µM.
42
ix
13 200X microscopic view of SH-SY5Y cells. Day 1. 47
14 100X microscopic view of SH-SY5Y. Day 4. 48
15 100X microscopic view of SH-SY5Y. Day 38. 49
16 100X microscopic view of SH-SY5Y. Day 59. 50
17 100X microscopic view of SH-SY5Y. Day 63. 51
18 Vial B inside a T-25 flask with 5 mL of media in 5% CO2 53
19 Vial C inside a T-25 flask with 5 mL of media in 5% CO2 53
20 The cells from vial A, taken approximately at the same time as vials
B and C after thawing.
54
List of tables
Table
1 The positions of each concentration of the inhibitors. Triplicates
were done for each concentration.
26
2 The SAR of substitution patterns of R and X. 36
3 Percentage inhibition values from 10 to 0.08 µM of compounds 1, 4,
7, 8, 9 and 10 on BACE1.
37
4 The IC50 values of the compounds tested, arranged by the most
potent compound in terms of IC50 from top to bottom.
39
5 Comparisons between the cell number after 3 days of the two
experimental initial cell number of 104 cells and 10
5 cells.
40
6 The relationship between the compounds at concentrations of 10, 5
and 2.5 µM and SH-SY5Y percentage viability with an initial cell
concentration of 5 x 10⁴ cells per well.
41
7 The experimental numerical designations of the individual
compounds tested in this experiment.
69

x

1
1. Introduction
Alzheimer's disease (AD) is a neurodegenerative disease that increases in incidence for those
who are of age 65 and older. According to a study published by the United Nations, under the
mortality conditions projected for the period 2045 - 2050, approximately 7 of every 8
newborns would survive to age 60, and more than half to age 80. This makes AD more
common in the future, and thus is a growing concern (Brookmeyer, Johnson et al. 2007).
Accumulation of amyloid beta (Aβ) in plaques is one of the main pathological features of
AD. Aβ plaques are protein aggregates of Aβ and causes neuronal dysfunction, inflammation,
appearance of neurofibrillary tangles, and neuronal loss if they continue to grow. This
cascade plays a central role in pathogenesis of AD and is commonly referred to as the
amyloid hypothesis (Hardy et al., 2002). Considerable evidence shows that Aβ production is
important to the process of brain deterioration in AD (Hardy et al., 2002).
Aβ is produced by sequential cleavage of amyloid precursor protein (APP) by BACE1 (beta-
secretase 1). BACE1 is a potential drug target to delay the progression of the disease because
the enzyme catalyses the first step in Aβ production (John et al., 2003). Other possible targets
are BACE2 and gamma-secretase, although BACE2 is present in mostly in the kidney
(Bennett et al., 2000), less in the brain compared to BACE1 (Ahmed et al., 2010) and
gamma-secretase cleaves Notch protein, a substrate that plays an important role in cellular
differentiation. Inhibitors of gamma-secretase were also shown to produce carboxy-terminal
fragment 99 (CTF99), which was toxic to cells (Kammesheidt et al., 1992), raising safety
issues.
Developing potent BACE1 inhibitors in a hope to identify suitable AD drug candidates has
been fiercely pursued for the past decade. Several strategies of drug discovery have been
explored in the search for potent BACE1 inhibitors, e.g. substrate-based design, high-
throughput screening, and fragment-based lead generation approaches. In the following text,
we will briefly review the history and current preclinical situations of BACE1 inhibitors
being developed by these different approaches.
Substrate-based methods have often been used as the starting point for developing aspartyl
protease inhibitors. P10–P4’ by StatVal was the first substrate-based BACE1 inhibitor and
was developed by Elan Pharmaceuticals in order to purify BACE1 from human brain

2
homogenates. This non-peptidomimetic inhibitor is a P1 (S)-statine substituted substrate
analogue with an in vitro half-maximal inhibitory concentration (IC50) of 30 nM.
Shortly after the molecular cloning of BACE1, Tang (Oklahoma Medical Research
Foudation) and Ghosh (University of Illinois at Chicago/Purdue University) teamed up and
reported the inhibitor OM99-2 and the crystal structure of BACE1 with OM99-2 bound to its
active site. While OM99-2 exhibited excellent inhibitory potency in vitro (Ki = 1.6 nM), its
bulky non-peptidomimetic structure prevented its application in vivo. Nonetheless, the
BACE1/OM99-2 co-crystal structure provided promising molecular insight into the ligand
binding interactions with the enzyme active site and significantly advanced the BACE1
inhibitor design.
Figure 1: A 3D model of BACE1 (PDB code: 1M4H) depicts the interaction between the inhibitor and
the active site of BACE1. The nonpeptidomimetic inhibitor is colored in white. This model was
generated from PyMOL, version 1.5.
In parallel, Kiso’s group (Kyoto Pharmaceutical University) developed their own BACE1
inhibitor KMI-008 (IC50 = 413 nM). Further chemical modification of KMI-008 yielded more
potent BACE1 inhibitors KMI-420 (in vitro IC50 = 8.2 nM) and KMI-429 (in vitro IC50 = 3.9
nM). KMI-429 appears to significantly reduce brain Aβ peptide production when directly
injected into the hippocampus of both wild-type mice and APP transgenic mice.
3
In this juncture, various substrate-based peptidomimetic inhibitors were also developed by
large pharmaceutical companies and other academic research groups. Although these
peptidomimetic BACE1 inhibitors were highly potent in vitro, their poor drug properties or
pharmacokinetics (PK), i.e. high molecular weight, poor brain permeability, short half-life in
vivo, and low oral availability, have made them unsuitable drug candidates. However, using
structure-based approach as a guide, these first-generation inhibitors have laid the foundation
for the rational design of later generations of smaller, peptidomimetic BACE1 inhibitors with
better drug-like properties.
Encouragingly, GlaxoSmithKline reported the first orally available BACE1 inhibitor
GSK188909, a small peptidomimetic compound developed from substrate-based design,
displayed a IC50 value of 5 nM and showed excellent selectivity over other aspartic proteases.
When orally administered in vivo (in TASTPM mice), it effectively reduced brain Aβ peptide
levels. Subsequently, Schering-Plough also reported an orally effective 4-
phenoxypyrrolidine-based BACE1 inhibitor named compound 11 with good PK and
selectivity (Ki = 0.7 nM, cellular IC50 = 21 nM).
The most exciting news in the race of BACE1 drug discovery was the emergence of
CoMentis’ CTS-21166 (cellular IC50 = 1.2–3.6 nM), which is the only BACE1 inhibitor that
has passed Phase I clinical trial so far. It possessed excellent properties in brain penetration,
selectivity, metabolic stability, and oral availability; meeting the requirements of an ideal oral
drug candidate.
When administered via intraperitoneal injection (4 mg/kg over six weeks) into an APP
transgenic mouse, the drug reduced brain Aβ levels by over 35% and plaque load by 40%.
The data from human Phase I studies suggested that this compound appeared safe at a dose as
high as 225 mg. Following this, several companies such as Merck, Eli Lilly, and Takeda are
also considering Phase I human testing with their own BACE1 inhibitors. Interesting clinical
data will likely be available for these inhibitors in the near future (Luo and Yan, 2010).
As mentioned above, generation of nonpeptidomimetic compounds with low nanomolar IC50
potencies are being extensively studied (Durham and Shepherd, 2006). Although initial drug
development efforts with peptidomimetic BACE1 inhibitors were encouraging, BACE1 has
since proven to be a challenging medicinal chemistry target. There appears to be several
reasons for this. First, BACE1 has a large hydrophobic substrate-binding site designed to fit

4
polypeptides, thus making it difficult to inhibit the enzyme with small nonpeptidomimetic
compounds that have desirable drug-like characteristics.
Ideally, BACE1 inhibitor drugs should be of a molecular weight <500, orally bioavailable,
metabolically stable, intrinsically potent, and highly selective for BACE1 instead of other
aspartic proteases. Compounds must also be hydrophobic enough to penetrate both plasma
and intra cellular membranes to gain access to the lumen of the compartment where the
BACE1 active site is localized. Efficacious BACE1 drugs would need to efficiently cross the
blood-brain barrier (BBB) and achieve a high concentration in the cerebral parenchyma, thus
the drug molecule should not be a substrate for efflux transporters such as P-glycoproteins.
Therefore, developing a protease inhibitor, especially one that is intended to be active within
the CNS, is a challenging and time-consuming task (Silvestri, 2009).
Despite these challenges, potent nonpeptidomimetic small molecule BACE1 inhibitors have
shown success in lowering cerebral Aβ levels in mouse (Fukumoto et al., 2010),hamster
(Truong et al., 2010) and primate (Sankaranarayanan et al., 2009) models. Moreover, the
biopharmaceutical company CoMentis (South San Francisco, CA, USA) recently announced
the completion of the first human phase 1 clinical trial of a BACE1 inhibitor drug (Luo and
Yan, 2010). Other BACE1 inhibitor drug candidates will probably soon be entering into
human clinical trials. An interesting alternative to small-molecule inhibitors entails the use of
monoclonal antibodies to inhibit BACE1 enzymatic activity.
Recent reports hint at the potential of antibodies that inhibit BACE1 cleavage of APP by
either directly binding to BACE1 (Zhou et al., 2011) or by binding to the BACE cleavage site
of APP (Arbel et al., 2005). The latter has shown in vivo efficacy for decreasing Aβ in a
murine model (Rakover et al., 2007). These encouraging results suggest that therapeutic
approaches involving BACE1 inhibition for the treatment or prevention of AD may be a
reality in the future. Given recent data hinting at important physiological roles for BACE1
however, careful titration of the BACE1 drug dosage may be necessary to minimize
mechanism-based side effects.
Therefore, to further validate BACE1 as a therapeutic target for drug discovery, it is crucial
to fully understand the outcome of inhibiting the enzymatic function of BACE1 and its
substrates, aiding in the development of more efficient BACE1 inhibitors against AD (Jämsä
et al., 2011).
5
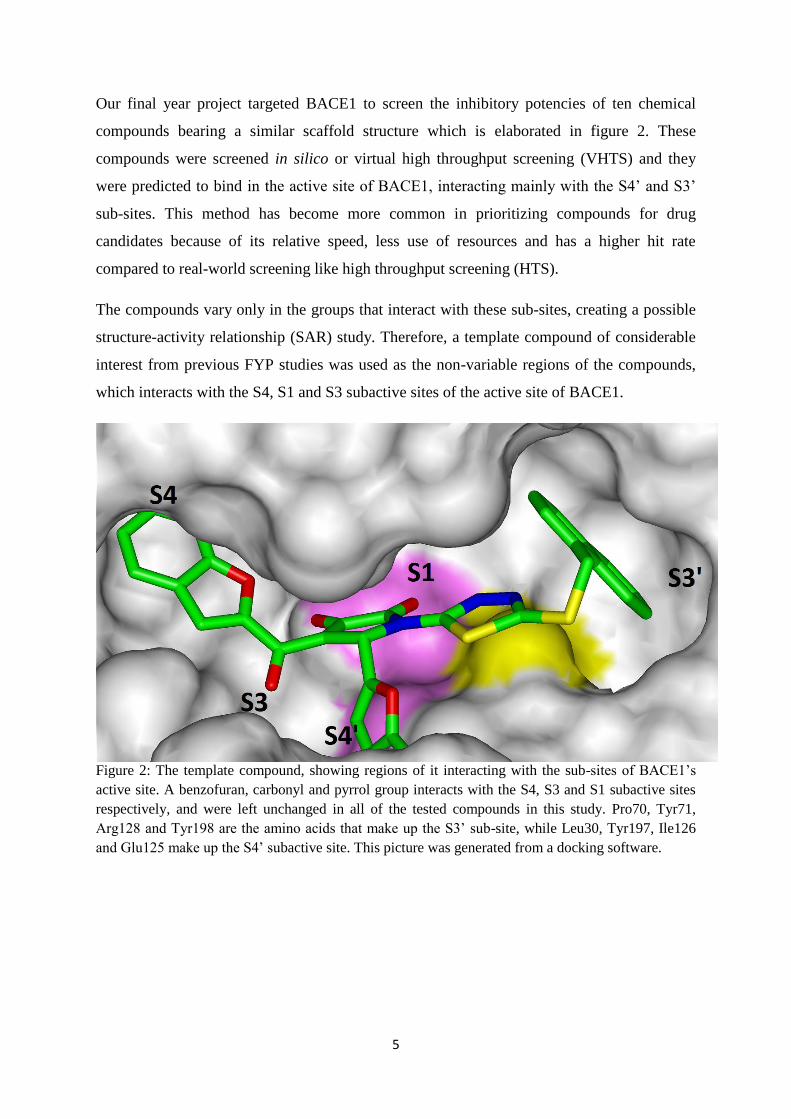
Our final year project targeted BACE1 to screen the inhibitory potencies of ten chemical
compounds bearing a similar scaffold structure which is elaborated in figure 2. These
compounds were screened in silico or virtual high throughput screening (VHTS) and they
were predicted to bind in the active site of BACE1, interacting mainly with the S4’ and S3’
sub-sites. This method has become more common in prioritizing compounds for drug
candidates because of its relative speed, less use of resources and has a higher hit rate
compared to real-world screening like high throughput screening (HTS).
The compounds vary only in the groups that interact with these sub-sites, creating a possible
structure-activity relationship (SAR) study. Therefore, a template compound of considerable
interest from previous FYP studies was used as the non-variable regions of the compounds,
which interacts with the S4, S1 and S3 subactive sites of the active site of BACE1.
Figure 2: The template compound, showing regions of it interacting with the sub-sites of BACE1’s
active site. A benzofuran, carbonyl and pyrrol group interacts with the S4, S3 and S1 subactive sites
respectively, and were left unchanged in all of the tested compounds in this study. Pro70, Tyr71,
Arg128 and Tyr198 are the amino acids that make up the S3’ sub-site, while Leu30, Tyr197, Ile126
and Glu125 make up the S4’ subactive site. This picture was generated from a docking software.

6
Figure 3: The molecular model of compound 9 and the amino acid to inhibitor interactions. Sub-site
names are in red while the interacting amino acids are in blue.
For the evaluation of SAR, ten compounds were tested for their antagonistic properties
against BACE1, using fluorescence resonance energy transfer (FRET) method where they
were first assayed for their percentage inhibition before they were assayed for their IC50
values. The compounds were nonpeptidomimetic, as opposed to peptidomimetic compounds.
Existing peptidomimetic inhibitors have low oral bioavailability, metabolic instability and
poor ability to penetrate BBB (Huang et al., 2009).
As mentioned before, problems with the potency and PK properties are one of the main
reasons why BACE1 inhibitors have not progressed well. Nonpeptidomimetic compounds are
more metabolically stable and have higher bioavailability, which reconciles with the
pharmacokinetic problems BACE1 inhibiting drugs face, and also with potency problems, as
less of the drug gets reduced in the body.
Following enzyme inhibition study, we then moved to the stage of toxicological assessment,
which is one of the major components of preclinical development in drug discovery.
2. Literature Review
2.1. Alzheimer’s disease (AD)
AD is a degenerative disease that slowly and progressively causes brain cells to deteriorate in
those who are of age 65 and older. It is caused by the formation and accumulation of two
unique structures associated within neurons known as neurofibrillary tangles and neuritic

7
plaques. These structures lead to neuronal death and thus cause atrophy on an Alzheimer’s
brain. There is a proportional correlation of the profundity of intellectual deterioration with
the severity of histological changes in the brain of a patient with AD. Apart from
neurodegenerative cognitive function, AD also causes the demise of bodily functions that
may bring about an array of psychological and behavioral changes in those afflicted by this
disease. It is neither infectious nor contagious, but it is the single most common cause of
dementia responsible for 60 to 80 percent of all episodes of dementia worldwide (Lisa et al.,
2012).
2.2. Hallmarks of AD
2.2.1. Neurofibrillary tangles
Neurofibrillary tangles are tightly linked to the degree of dementia, suggesting that the
formation of neurofibrillary tangles more directly correlates with neuronal dysfunction. The
region most affected by neurofibrillary tangle formation during the course of the disease is
found in the hippocampus, an area of the brain involved in processing experiences and the
formation of long term memory occurs. Neurofibrillary tangles are composed of the
hyperphosphorylated forms of the microtubule-associated protein called tau. Another
phenomenon observed in patients of AD is early hyperphosphorylated tau protein
accumulation in neurons, even before formation of neurofibrillary tangles, suggesting that an
imbalance between the activities of protein kinases and phosphatases acting on tau is an early
phenomenon (Brion, 1998).
Tau, a microtubule associated protein, which usually has a certain number of phosphate
molecules attached to it, binds to and stabilizes microtubules. In AD, an abnormally large
number of additional phosphate molecules attach to tau. As a result, hyperphosphorylation
occurs, which causes tau to disengage from the microtubules and begin to coalesce with
other tau threads. These tau threads form structures called paired helical filaments, which can
become enmeshed with one another, forming tangles within the cell. Microtubules
disintegrate as an aftermath, collapsing the neuron’s internal transport network. This collapse
impairs the ability of neurons to communicate and transmit signals with each other.
8
Figure 4. Image of neurofibrillary tangles in AD. Several neurofibrillary tangles can be visualized
with a silver stain in the cerebral cortex of a patient with AD (Chong, Li et al, 2005).
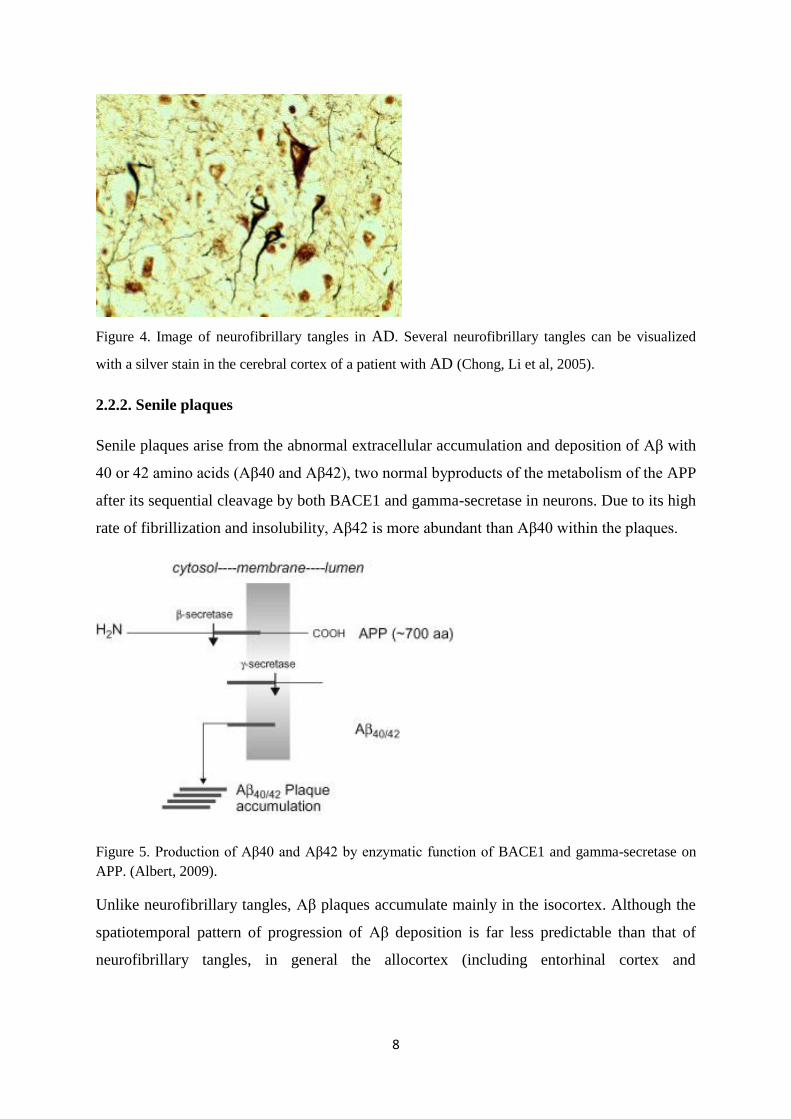
2.2.2. Senile plaques
Senile plaques arise from the abnormal extracellular accumulation and deposition of Aβ with
40 or 42 amino acids (Aβ40 and Aβ42), two normal byproducts of the metabolism of the APP
after its sequential cleavage by both BACE1 and gamma-secretase in neurons. Due to its high
rate of fibrillization and insolubility, Aβ42 is more abundant than Aβ40 within the plaques.
Figure 5. Production of Aβ40 and Aβ42 by enzymatic function of BACE1 and gamma-secretase on
APP. (Albert, 2009).
Unlike neurofibrillary tangles, Aβ plaques accumulate mainly in the isocortex. Although the
spatiotemporal pattern of progression of Aβ deposition is far less predictable than that of
neurofibrillary tangles, in general the allocortex (including entorhinal cortex and

9
hippocampal formation), the basal ganglia, relevant nuclei of the brainstem, and the
cerebellum, are involved to a lesser extent and later than the associative isocortex.
Senile plaques can be morphologically classified into two distinct types of amyloid plaque,
which are diffuse and dense-core plaques according to their staining with dyes specific for the
β-pleated sheet conformation such as Congo Red and Thioflavin-S. This simpler
categorization is relevant to the disease because, unlike diffuse Thioflavin-S negative
plaques, Thioflavin-S positive dense-core plaques are associated with detrimental effects on
the surrounding neuropil including increased neurite curvature and dystrophic neurites,
synaptic loss, neuron loss, and recruitment and activation of both astrocytes and microglial
cells.
Indeed, diffuse Aβ plaques are commonly present in the brains of cognitively intact elderly
people, whereas dense-core plaques, particularly those with neuritic dystrophies, are most
often found in patients with AD dementia. However, the pathological boundaries between
normal aging and AD dementia are not clear-cut. It was found that even cognitively normal
elderly people exhibited substantial amyloid burden in their brains (Serrano-Pozo et al.,
2011).
Because age does not necessarily play a role in the accumulation density of senile, it is
speculated that innocuous deposits of non-aggregated, supposed non-harmful Aβ plaques,
may undergo an intricate change into mature senile plaques. This maturation process is
assumed to be carried out by butyrycholinesterase (Mackenzie, 1994).
Overall, senile plaques and neurofibrillary tangles are similar in terms of regional distribution
and chemical composition in those who are afflicted by AD and those who are aging
normally. Hence, these plaques and tangles are closely associated with dementia (Mackenzie,
1994).
10
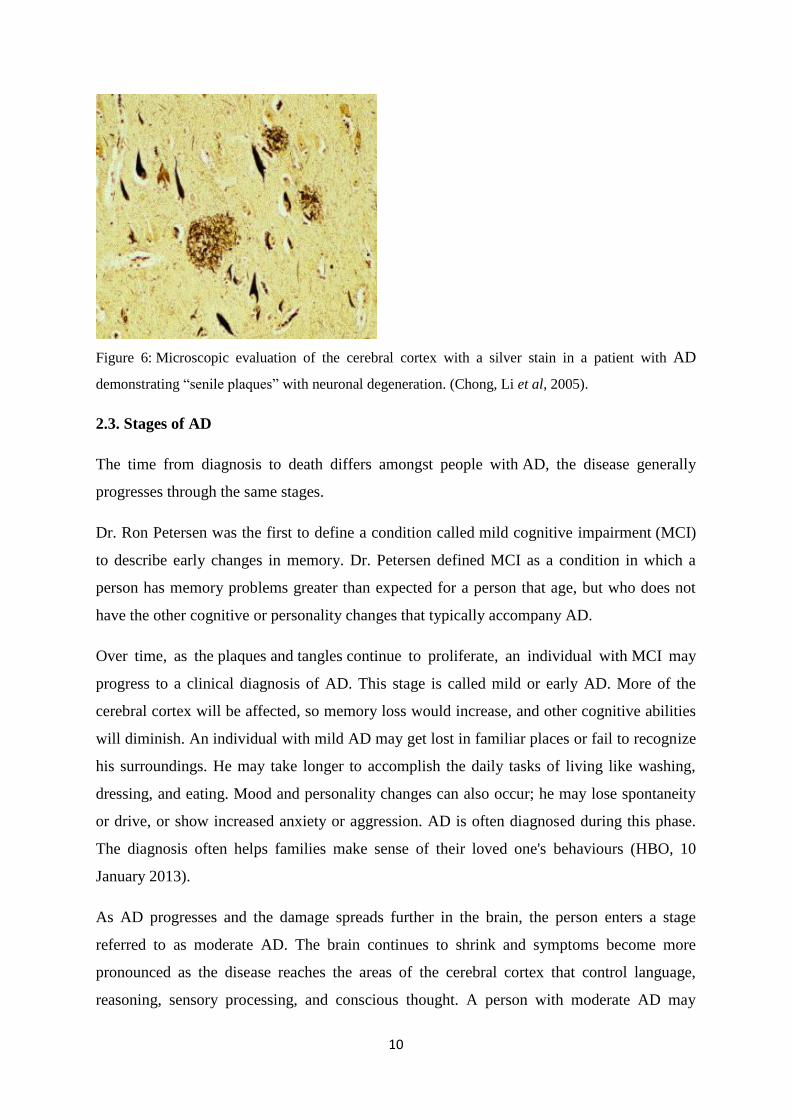
Figure 6: Microscopic evaluation of the cerebral cortex with a silver stain in a patient with AD
demonstrating “senile plaques” with neuronal degeneration. (Chong, Li et al, 2005).
2.3. Stages of AD
The time from diagnosis to death differs amongst people with AD, the disease generally
progresses through the same stages.
Dr. Ron Petersen was the first to define a condition called mild cognitive impairment (MCI)
to describe early changes in memory. Dr. Petersen defined MCI as a condition in which a
person has memory problems greater than expected for a person that age, but who does not
have the other cognitive or personality changes that typically accompany AD.
Over time, as the plaques and tangles continue to proliferate, an individual with MCI may
progress to a clinical diagnosis of AD. This stage is called mild or early AD. More of the
cerebral cortex will be affected, so memory loss would increase, and other cognitive abilities
will diminish. An individual with mild AD may get lost in familiar places or fail to recognize
his surroundings. He may take longer to accomplish the daily tasks of living like washing,
dressing, and eating. Mood and personality changes can also occur; he may lose spontaneity
or drive, or show increased anxiety or aggression. AD is often diagnosed during this phase.
The diagnosis often helps families make sense of their loved one's behaviours (HBO, 10
January 2013).
As AD progresses and the damage spreads further in the brain, the person enters a stage
referred to as moderate AD. The brain continues to shrink and symptoms become more
pronounced as the disease reaches the areas of the cerebral cortex that control language,
reasoning, sensory processing, and conscious thought. A person with moderate AD may

11
wander or become confused, anxious or agitated, engaging in angry outbursts, tearfulness,
irritability or restlessness. His attention span may shorten. He may have problems
recognizing family and friends, and difficulty with language, reading, writing, and arithmetic,
and with the logical organization of thoughts (HBO, 10 January 2013).
He may also be unable to learn new things and consequently be unable to cope with new
situations. At this stage, a person with AD might also experience hallucinations and paranoid
delusions, and lose impulse control, leading to things like inappropriate undressing or
vituperation. It is helpful for caregivers to understand the disease and be more prepared for
these behaviours before they happen.
At the last stage of this illness, severe AD, plaques and tangles are found throughout the
brain. Most areas have shrunken further, leaving only a thin ribbon of gray matter and even
larger fluid-filled ventricles. An individual at this final stage cannot communicate in any way
except moaning and grunting. He doesn't recognize loved ones and is completely dependent
on others for care. He may experience weight loss and difficulty swallowing, seizures, skin
infections, lack of bladder and bowel control, and increased sleeping. If bedridden, he is
likely to die from pneumonia as a result of having inhaled food or drink because of difficulty
swallowing (HBO, 10 January 2013).
2.4. Risk factors of AD
2.4.1. Genetics
Genetic research on AD shows that early-onset AD is rare and hereditary. Chromosomes 21,
14, and 1 became the focus of attention. It was found that some families had autosomal
dominant mutations in selected genes on these chromosomes (NIA, 14 Nov 2011).
It was found that the mutation in chromosome 21 causes an abnormal APP to be produced.
On chromosome 14, the mutation causes an abnormal protein called presenilin 1 (PS1) to be
produced. On chromosome 1, the mutation causes presenilin 2 (PS2) to be produced (NIA, 14
Nov 2011).
Mutations in these three genes do not play a role in the more common late-onset AD.
However, these findings were vital because they showed that genetics was indeed a factor in
AD, and they helped to identify some important cell pathways involved in the AD disease
process. This discovery showed that mutations in APP can cause AD, highlighting the

12
putative role of Aβ in the disease. Mutational changes to PS1 and 2 also caused an increased
amount of the damaging Aβ to be formed in the brain (NIA, 14 Nov 2011).
Apart from early-onset AD, studies also unravelled that a region in chromosome 19 was
linked to late-onset AD.
2.4.2. Aging
People are exposed to more free radicals, which are oxygen or nitrogen molecules that
combine easily with other molecules, as they age. Free radicals are generated in
mitochondria, which are organelles found in all cells, including neurons.
Free radicals can help cells in certain ways, such as fighting infection. However, because they
are very active and combine easily with other molecules, free radicals also can damage the
neuron’s cell membrane or DNA. The production of free radicals can set off a chain reaction,
releasing even more free radicals that can further damage neurons. Such damage is
called oxidative damage. The brain’s unique characteristics, including its high rate of
metabolism and its long-lived cells, may make it especially susceptible to oxidative damage
over the lifespan. Furthermore, it was discovered that Aβ generates free radicals in some
plaques; this identifies aging as a factor of AD (NIA, 14 Nov 2011).
2.4.3. Vascular impairment in the brain
Aging brings changes in the brain’s blood vessels; arteries can narrow and growths of new
capillaries are maimed. Research had found that whole areas of nervous tissue are, including
their capillaries, lost due to AD. Blood flow to and from various parts of the brain can be
affected and the ability for the brain to compensate for brain damage from AD is reduced.
Poor clearance of Aβ from the brain can, combined with diminished capabilities to develop
new capillaries, lead to chemical imbalances in the brain and damage neurons’ ability to
function and communicate with each other (NIA, 14 Nov 2011).
2.4.4. Hypoxia
Hypoxia, which can be triggered through smoking and severe head injury, can result in loss
of consciousness and systolic hypertension in the elderly, which may be a cause of hypoxia
directly or indirectly via neuronal ischemia (Kawahara and Kuroda, 2000).

13
Prolonged or chronic hypoxia has been shown to alter the excitability and functional
expression of ion channels, which possibly contributes to neurodegeneration. Reduced
oxygen levels result in the formation of Aβ, leading to upregulation of native L-type calcium
channels and disruption of calcium homeostasis (Kawahara and Kuroda, 2000). Cholinergic
neurons may be especially vulnerable to Aβ toxicity. The dysregulated calcium expression
following hypoxia in central neurons may contribute to the neurotoxicity of Aβ and
subsequent development of AD (Khan and Davies, 2008).
2.4.5. Gender
Women secrete higher oestrogen levels, which has an important role in the body in
maintaining healthy neural functions as well as to safeguard the brain from damage.
Oestrogen promotes neuronal cell survival and provides protection from neurotoxins. They
facilitate axonal sprouting and neuronal repair, reduce neuronal injury and enhance synaptic
transmission and neurogenesis. These beneficial effects have led to the supposed hypothesis
that oestrogen may exert protective measures against neurodegenerative diseases, such as
AD.
A finding (Cherry et al., 1992) showed that there was an increased AD prevalence in elderly
women. This suggests that oestrogen deficiency might play a role in the development of AD.
Studies have shown the prevalence of AD is greater in women than in men of a comparable
age, with women aged 50–64 years having 1.7 times higher incidence of AD, possibly as a
result of reduction of oestrogen levels during and after menopause (Cherry et al., 1992).
2.5. AD as a major health issue
AD ranks as the sixth-leading cause of death in the United States. According to data from the
National Center for Health Statistics, AD was reported as the underlying cause of the death of
eighty-two thousand people in 2008 (Lisa et al., 2012). The prevalence of AD in 2002 was
estimated to be 2.3 million individuals over age 70, based on a US population-based sample
(Plassman et al., 2007).
Another group estimated the prevalence of AD in 2000 at 4.5 million individuals aged 65 and
older, based on a U.S. regional sample (Hebert et al., 2003). This latter figure was updated to
an estimated 5.3 million individuals with AD in 2008. This translates into about one in 8 to 10
people over the age of 65 suffering from AD. The worldwide prevalence of dementia is

14
estimated to be 35.6 million in 2010, with the number exceeding 65 million in 2030 and 115
million in 2050, making AD a pressing global health concern (Lisa et al., 2009).
Although current Alzheimer's treatments cannot stop Alzheimer's from progressing, they can
temporarily slow the worsening of dementia symptoms and improve quality of life for those
with Alzheimer's and their caregivers. Today, there is a worldwide effort under way to find
better ways to treat the disease, delay its onset and prevent it from progressing further.
2.6. Therapeutic strategies against AD
Despite unresolved questions, sufficient progress in delineating the disease using the amyloid
hypothesis cascade has now been achieved to envision several discrete targets for treatment.
Inhibitors of Aβ production, small compounds that cross the BBB and decrease but do not
eliminate either BACE1 or gamma-secretase activity, could be therapeutic in the early
clinical phases of the disease, particularly in patients with minimal cognitive impairment, and
in subjects not suffering from dementia. In the case of gamma-secretase inhibitors, drugs
could be designed to decrease Aβ production by some 30–40% or so, hopefully without
interfering in a quantitatively meaningful way with Notch processing. The fact that very
small amounts of the Notch intracellular fragment are sufficient to activate signalling in cells
(Schroeter et al., 1998) may mean that some decrease in Notch proteolysis can be tolerated.
An alternate approach would be to use small molecules to bind Aβ monomers and prevent
their assembly into potentially cytotoxic oligomers. However, if an anti-aggregating
compound solely blocked amyloid fibril formation, this could allow increased accumulation
of metastable intermediates such as oligomers and therefore theoretically aggravate the
disease. One advantage of an anti-oligomerization strategy is that drugs produced would
target a pathological event in the disease rather than interfering with normal metabolic
reactions.
A third approach administers anti-inflammatory drugs that interfere with aspects of the
microglial, astrocytic, and cytokine responses that occur in the AD brain. It has been found
that consumption of nonsteroidal anti-inflammatory drugs is correlated with a lower
likelihood of developing AD (Selkoe, 2001). However, conventional anti-inflammatory drugs
may have considerable potential toxicity especially in older patients (Selkoe, 2001).
Neurorestorative factors like neurotrophins may be used and small compounds mimicking
their actions, which might rescue synapses and cell bodies undergoing active injury.
15
However, this approach would operate in the presence of ongoing new injury from the
putative cytotoxic effects of Aβ.
An intriguing approach to lower the levels of Aβ and reduce Aβ deposits in the brain comes
from a recent study in APP transgenic mice. Parenteral immunization with synthetic human
Aβ peptide led to a strong humoral response and the apparent movement of some of the Aβ
antibodies across the BBB into the brain parenchyma (Schenk et al., 1999). Although the
mechanism remains unclear, the anti-Aβ antibody response led to enhanced clearing of Aβ
deposits in mice that already had begun to develop plaques, possibly by the recruitment of
local microglia.
Moreover, immunization of young mice before the development of Alzheimer-type
histopathology was associated with a marked inhibition of subsequent plaque formation and
the associated gliosis and neuritic dystrophy. Presumably, the very high levels of Aβ
antibodies induced peripherally in these mice led to a small fraction crossing the BBB and
acting centrally. No untoward antigen-antibody reaction ensued, i.e., the inflammatory
cytopathology in the mouse was prevented rather than worsened. The recent initiation of
human trials using this Aβ vaccination approach will be followed with great interest.
Finally, antioxidants, free radical scavengers, calcium channel blockers and modulators of
certain signal transduction pathways might protect neurons from the downstream effects of
Aβ accumulation intracellularly and/or extracellularly. The problem with this approach is that
there may be potential lack of efficacy as there may be are multiple ways in which neurons
respond to Aβ and the Aβ-associated inflammatory process. As a result, blocking one or two
of these might not significantly decrease overall neuronal dysfunction and loss.
Because the success of these strategies cannot be predicted and because two or more
approaches might ultimately be combined, all such approaches and others not reviewed here
need to be pursued. Current, largely symptomatic treatments aimed at enhancing the levels of
depleted neurotransmitters, particularly acetylcholine, may continue to be useful, even if
more specific treatments aimed at early steps in the disease are forthcoming (Selkoe, 2001).
2.7. Localization and Expression of BACE1
The majority of BACE1 is located in Golgi and endosomal compartments in brain cells.
BACE1 undergoes a complex set of posttranslational modifications during its maturation.
Pro-BACE1 is cleaved by furin and other members of the furin family of convertases to

16
remove the 24-amino-acid amino (N) - terminal region of the propeptide within the trans-
Golgi network (TGN). The 24-amino-acid prodomain is required for the efficient exit of pro-
BACE1 from the endoplasmic reticulum. Mature BACE1 has four N glycosylation sites at
Asn153, -172, -223, and -354, and the BACE1 activity is dependent on the extent of N
glycosylation. The cytoplasmic domain of BACE1 and its phosphorylation are required for
efficient maturation and its intracellular trafficking through the TGN and endosomal system.
BACE1 has a tissue-specific expression pattern. BACE1 is expressed at the highest levels in
the pancreas and also at high levels in the brain (Michelle et al., 2004).. BACE1 mRNA
(messenger ribonucleic acid) was found in neurons of all brain regions but not in glial cells.
Although BACE1 enzymatic activity is high in the central nervous system, there is a relative
low level in peripheral tissues. Studies indicate that tissue-specific expression of BACE1 is
very important for normal APP processing, and dysregulation of BACE1 expression may
play a role in AD pathogenesis (Michelle et al., 2004).
2.8. Regulation of BACE1
There are multiple physiological stress signals and pathways that play a role in the regulation
of BACE1, causing an increase or decrease in BACE1 protein levels and enzymatic activity.
It was found that a possible link between stroke, brain ischemia and AD is hypoxia in Sun et
al., 2006. In the study, hypoxia increase BACE1 expression and activity, resulting in Aβ
overproduction, as shown in vitro as well as in AD transgenic mice (Sun et al., 2006). One
mechanism of the effect of hypoxia on BACE1 up-regulation is the activation of hypoxia-
inducible factor 1 (HIF-1), a transcription factor that regulates oxygen homeostasis, and has
been shown to bind to BACE1 promoter and regulate its gene expression (Zhang et al.,
2007). Similarly, BACE1 expression can be stimulated by presenilin as a result of oxidative
stress via c-jun N-terminal kinase (JNK) pathway.
Additionally, the mitochondria have been known to generate reactive oxygen species (ROS)
that has a causative role in mediating early hypoxia-dependent up-regulation of BACE1
transcription. The release of ROS, and the consequent up-regulation of BACE1 is paralleled
by the activation of the JNK/c-jun pathway, which is quiescent in the late phase of post-
hypoxic BACE1 increase, that depends on HIF-1 activity. The early post-hypoxic up-
regulation of BACE1 recapitulates the cascade of events induced by oxidant agents and 4-
hydroxynonenal in cells and in animal models: an increase of BACE1 mRNA, protein levels,

17
and activity that is mediated by the activation of the JNK/c-jun pathway (Tamagno et al.,
2008).
Recent studies have also shown that BACE1 expression is regulated by the gamma-secretase
activity, providing evidence of positive feedback loop between the BACE1 and gamma-
secretase cleavages on APP. In this connection it is significant that ischemic and hypoxic
condition produces an increase in gamma-secretase activity (Arumugam et al., 2006).
Moreover, the expression of BACE1 is decreased by the activation of extracellular signal
regulated mitogen activated protein kinase (ERK)1/2, that inhibits the gamma-secretase
(Tamagno et al., 2008).
The regulation of BACE1 can also be coupled to the influence of post-translational
modification after studies discovered the lack of correlation of mRNA and protein levels.
Moreover, it has been shown that BACE1 protein expression was up-regulated in the brain of
some sporadic AD patients without changes in the level of the corresponding mRNA, thereby
suggesting that these mechanisms can play a pathogenic role.
The 5′ UTR of BACE1 mRNA is long, evolutionally conserved has a high GC content and
four uAUGs, all features that suggest the potential of translational regulation. Two recent
studies have demonstrated that BACE1 5′ UTR is inhibitory to translation. However, they
differ in the interpretation of the data, with one report favoring a major role of uAUGs, while
the other suggests that the GC-rich region of the 5′ UTR forms a translation barrier that
prevents the ribosome from efficiently translating the BACE1 mRNA. In addition, a third
article suggests that a shunting mechanism can overcome the translational inhibition by
BACE1 5′ UTR in a cell-specific manner. Therefore, the exact mechanism of down-
regulation of translation exerted by BACE1 5′ UTR remains elusive (Mihailovich et al.,
2007).
2.9. Active Site of BACE1
BACE1 contains two active site aspartate residues in its extracellular protein domain. BACE1
moves interconvertibly from the endosomal system to the cell surface and breaks down
Amyloid Precursor Protein (APP) when it is activated. It has been reported that BACE1
molecules are localized within endosomal system and the trans-Golgi network, where they
colocalize with APP (Capell et. al., 2000).

18
Many X-ray crystallography studies on BACE1 have been conducted as it has become a
major target in the development of drugs for AD. Studies have indicated that the active site of
BACE1 is covered by a flexible antiparallel β-hairpin, or a flap. It is believed that this flap
controls substrate access to the active site and set the substrate into the correct geometry for
the catalytic process.
It has also been observed that this flap was packed into a closed conformation in an inhibitor-
bound BACE1 while the opposite was true for the apo structure of BACE1 (Hong, 2004).
This indicated that the conformational change was an important process upon
substrate/inhibitor binding.
Aspartic proteases should have two highly conserved water molecules, the first (Wat1) is
located between Asp32 and Asp228 in the case of BACE1, which after substrate binding is
activated by the free Asp pair by forming a hydrogen bond with it. Next, the activated Wat1
attacks the scissile-bond carbonyl in a nucleophilic reaction.
The resulting geminal diol intermediate is stabilized by hydrogen bonds with the carboxyl
group of Asp. Finally, decomposition of the scissile C-N bond is accompanied by the transfer
of a proton from Asp to the leaving amino group. Kinetic studies have suggested that Wat1
inhibits inhibitor binding to active site of BACE1 (Marcinkeviciene et. al., 2001). Reticulon 3
and 4 are examples of highly conserved natural inhibitors of BACE1 (He et al., 2004).
The second water molecule (Wat2) is involved in hydrogen bonding with a tyrosine residue
located in the flap. WAt2 also participates in a Wat2-Ser35-Asp32-Wat1-Asp228 hydrogen
bonding network that is also highly conserved (Gorfe and Caflisch, 2005). The significance
of these water molecules in substrate-active site binding suggests they directly affect the
functions of BACE1.
2.10. Role of BACE1 in Aβ formation
BACE1, also known as beta-site APP cleaving enzyme 1 (beta-site amyloid precursor protein
cleaving enzyme 1), memapsin-2(membrane-bound aspartic protease 2), and aspartyl
protease 2 (ASP2) is an enzyme found in humans that is encoded by the BACE1 gene. It acts
as the first catalyst of the Alzheimer’s amyloid cascade. Another enzyme known as gamma-
secretase appears as a complex of proteins consisting of PS1 or PS2 [5, 6], nicastrin [7],
Aph1 and Pen2 [8, 9]. It catalyses the next step in the cascade.

19
The first step in Aβ generation is cleavage of APP in which BACE1 synergizes with gamma-
secretase permitting the transition into the amyloidogenic pathway as shown in Figure 7. Aβ
genesis is initiated by BACE1 cleavage of APP at the Asp+1 residue of the Aβ sequence to
form the N-terminus of the peptide. This scission frees two cleavage fragments: a secreted
APP ectodomain, APPsβ and a membrane-bound carboxyl terminal fragment (CTF), CTF99.
CTF99 is subsequently cleaved by gamma-secretase to form the C-terminus of the Aβ peptide
and an APP intracellular domain (AICD) (Cao and Sudhof, 2004).
Cleavage by the gamma-secretase complex is not accurate, mainly producing Aβ40 while
releasing some Aβ42. It is this gamma-secretase-dependent cleavage that is responsible for
the excess generation of Aβ42 which stimulates the development of extracellular plaques that
are hallmarks of AD.
Conversely, as shown in Figure 7, Aβ genesis may be avoided if APP is cleaved by alpha-
secretase within the Aβ domain that initates the non-amyloidogenic pathway instead. alpha-
secretase have been presumably identified as TNF-α converting enzyme (TACE), disintegrin
and metalloprotease domain protein-9 (ADAM) and ADAM-10. Alpha-secretase cleavage of
APP occurs within the Aβ domain at Leu+17, and produces the secreted APPsα ectodomain,
and a CTF83, which in turn is cleaved by gamma-secretase to form the non-amyloidogenic 3
kDa fragment, p3.
In many instances, an increase in non-amyloidogenic APP metabolism is coupled to a
reciprocal decrease in the amyloidogenic processing pathway, and vice-versa, this is due to α-
and BACE1competitive nature for APP as a substrate (Vassar et al., 1999).
Therefore, as BACE1 is the catalyst in Aβ peptide generation as well as a putative rate-
limiting enzyme, it is highly regarded as a prime candidate for drug inhibition in the hope of
lowering cerebral Aβ peptide levels to treat or prevent AD.

20
Figure 7: APP metabolism by the secretase enzymes: BACE1cleaves before gamma-secretase in the
amyloidogenic pathway; alpha-secretase is involved in non-amyloidogenic pathway instead (Cole and
Vassar, 2007).
2.11. Aβ peptide
Aβ peptides populating the core of senile plaques are mainly produced by neuronal cells
(Rossner et al., 2001). Aside from the amyloidgenic pathway, an alternative and slightly
different processing of APP by alpha-secretase called the non-amyloidgenic pathway that
occurs at the center of the Aβ domain of APP (Wolfe et al., 1999). According to numerous
studies, Aβ peptides at least contribute to AD pathogenesis in one way or another. Notably,
three genes encoding proteins involved in Aβ production, mainly APP, and PS1 and 2, were
found to be involved in an earlier and more serious case of AD (St George-Hyslop, 2000).
Various Aβ peptides species are found in senile deposits as well as inside cells. The nature
and length are highly variable. Genuine “full length” Aβ peptides, that are Aβ1-40 or Aβ1-42,
can undergo a variety of secondary proteolytic cleavages (Sevalle et al., 2009). Moreover,
monomeric soluble Aβ peptides could associate to form small soluble aggregates including
oligomers and protofibrils. Soluble oligomeric species apparently exhibit higher toxic
potency on cells than Aβ monomers (Di Carlo, 2010).

21
Therefore, such pathology may arise from modifications of the nature and concentration of
Aβ peptides, or an alteration of their biophysical properties that encourages aggregation,
promoting subcellular production and accumulation that leads to Aβ-associated toxicity.
APP and its proteolytic fragments are known to be involved in sophisticated networks and
several feedback loops (Hunter and Brayne, 2012). Furthermore, Aβ peptides are also known
to induce their own production. This is done by Aβ peptide, in which it activates its own
production by binding to the promoters of APP and BACE1, as Aβ has been recently shown
to display transcription factor properties (Bailey et al., 2011) Thus, the treatment of human
NT2N neurons with Aβ peptide in one study, showed increased APP processing and
production of Aβ peptides [24].
2.12. Role of blood-brain barrier (BBB)
The BBB was discovered when dyes, injected into living animals, stained all tissues except
for most of the brain and spinal cord, leading to the postulated BBB. The BBB is a
physiologic matrix of tissue that is selectively permeable and protective of the central
nervous system (CNS). The BBB is located within the endothelium of cerebral capillaries and
the choroids plexus epithelium.
The BBB preserves concentrations within the CNS through reciprocal homeostatic processes.
The rate with which substances penetrate through to the brain tissue is inversely related to
their molecular size and directly related to their lipid solubility. The factors that are
responsible for the transfer across the capillary partition include vesicular transport, diffusion,
and filtration. Diffusion is quantitatively more important in terms of exchange of nutrients
and waste materials. Filtration depends upon a balance of forces between hydrostatic and
osmotic pressure gradients.
BBB integrity can be compromised by a list of diseases such as hypertension, cerebrovascular
ischemia, histologic and metabolic changes within barrier tissue cells, vascular disease,
systemic metabolic disease, trauma, tumors, medications, noxious stimulation, infection,
irradiation, transport and permeability alterations, and aging. Common central disease states
involving BBB integrity include ischemic cerebrovascular events, hypoxia-ischemia, human
immunodeficiency virus (HIV)-induced dementia, multiple sclerosis, and AD.
Vascular dystrophy has been shown to be involved in the deposition of the amyloid beta-
protein in the brains of AD. Although the mechanism remains undiscovered, it has, however,

22
been shown that a larger quantity of Aβ40 and Aβ42 can be found in the brains of
Alzheimer's patients than in non-demented controls. Together with evidence of no difference
in the level of Aβ40 and Aβ42 in peripheral sera between AD and controls, it is suggested
that a dysfunction of the BBB could induce abnormal transport of Aβ proteins from sera, and
accumulation, into the CNS, playing a critical role in the development of AD.
The aging of the central nervous system and the development of incapacitating neurological
diseases, such as AD, is associated with a wide spectrum of histological and
pathophysiological changes eventually leading to a diminished cognitive status. Various
forms of cerebrovascular insufficiency, such as reduced blood supply to the brain or disrupted
microvascular integrity, may occupy an initiating or intermediate position in the sequence of
events ending with cognitive malfunction. Although the diverse triggers and stages of neuro-
degenerative processes are incompletely defined, the contribution of cerebrovascular
deficiencies has become recognized as an important, if not a necessary, antecedent.
It is hypothesized that the BBB dysfunction may contribute to the development of
overlapping and disabling cerebrovascular conditions that include microvascular hemorrhage
and dementia. This hypothesis could explain the link between ischemic cerebral small-vessel
disease and several apparently clinically distinct dementia syndromes. This hypothesis is
supported by pathological, epidemiological, and experimental studies in lacunar stroke and
examinations of the BBB with magnetic resonance imaging (MRI). Critics have viewed the
significance of BBB dysfunction as an early neurophysiologic cascading step leading to
disabling brain diseases has been underappreciated.
Confirmation that BBB failure plays an essential and rate-limiting step to CNS disease
processes could provide a target for new treatments to reduce the effects of vascular disease
on the brain and prevent or reduce cognitive decline and dementia (Sondecker et al., 2005).
2.13. Cytotoxicity Assay
Cytotoxicity assays are widely used in in vitro toxicology studies. The LDH leakage assay, a
protein assay, the neutral red, trypan blue assay and the 3-[4, 5-dimethylthiazol-2-yl]-2, 5-
diphenyltetrazolium bromide (MTT) assay are the most common employed for the detection
of cytotoxicity or cell viability following exposure to toxic substances.
The predictive value of in vitro cytotoxicity tests is based on the idea of basal cytotoxicity
that toxic chemicals affect basic functions of cells which are common to all cells, and that the

23
toxicity can be measured by assessing cellular damage. The development of in vitro
cytotoxicity assays has been driven by the need to rapidly evaluate the potential toxicity of
large numbers of compounds and to carry out tests with small quantities of compound. By
carrying out cytotoxic assays, the identification of toxic effects at early stages of research can
aid in the drug discovery process by providing researchers with necessary information in
identifying structural-toxicity relationship that will help reduce time and costs in the
development of the drug of interest (NoAbBioDiscoveries, 2011).
2.14. MTT Assay
The MTT assay is a measurement of cell viability and proliferation that forms the basis for
numerous in vitro assays of a cell population’s response to external factors. The reduction of
tetrazolium salts is now widely accepted as a reliable way to examine cell proliferation.
The reduction of yellow tetrazolium MTT is reduced by metabolically active cells, in part by
the action of dehydrogenase enzymes, to generate reducing equivalents such as NADH and
NADPH. The resulting intracellular purple formazan can be solubilized and quantified by
spectrophotometric means.
In MTT Cell Proliferation Assay, it measures the cell proliferation rate and conversely, when
metabolic events lead to apoptosis or necrosis, reduction in cell viability. The number of
assay steps has been minimized as much as possible to expedite sample processing. The MTT
Reagent yields low background absorbance values in the absence of cells and vice versa. For
each cell type the linear relationship between cell number and signal produced is unique, thus
allowing an accurate quantification of changes in the rate of cell proliferation to that
particular cell line.
For our experiment, we used Cayman’s MTT proliferation Assay Kit which was a convenient
tool for studying the induction and inhibition of cell proliferation of the ATCC SH-SY5Y
cells in response to the treatment of 10 different compounds (ATCC, 2013).
3. Materials and methods
3.1. Initial screening: Percentage Inhibition of compounds at 3 µM
All 10 compounds were firstly dissolved in 100% DMSO (dimethyl sulfoxide) to make a
stock at 1 mM. Next, compounds were reconstituted to 10 µM using DMSO, and 30 µL of
the diluted compounds were then added into the wells of a black 96-well plate, in triplicates.

24
BACE1 enzyme from BACE1 (β-Secretase) FRET Assay kit, Red (InVitrogen) was diluted
100 times using BACE1 assay buffer that was provided by the kit. Following that, 30 µL of
the diluted BACE1 was added into the same triplicate wells for the compounds. The positive
control was prepared in the same ways as all other compounds.
The negative control wells were prepared by adding 30 µL of BACE1 assay buffer and 30 µL
of diluted BACE1 of the same concentration. The 96-well plate was then transferred to the
Infinite F200 (Multifunctional compact microplate reader [Infinite F200] by TECAN)
machine. Finally, 30 µL of the diluted substrates (Rh-EVNLDAEFK-Quencher, in 50 mM
ammonium bicarbonate) were added into all the filled wells using a multi-channel pipette.
The reaction was monitored for 45 minutes using the Infinite F200 microplate reader with an
excitation wavelength 545 nM and emission wavelength of 585 nM.
The Infinite F200 was set to a kinetics cycle analysis. The kinetics cycle lasted 15 minutes
each, and absorbance readings were generated every minute, which makes a total of 15
different readings for each well at different timings. The resulting data were interpreted in the
statistics software GraphPad Prism.
From the data obtained, the percentages of inhibition can be calculated by taking:
100 – (Compound / Negative control) x 100 % = X % inhibition
Figure 8: Layout of the 96-well plate of the initial screening. Compounds, negative control, and
positive control wells are coloured in red, blue and yellow respectively. Ten compounds and negative
control were analyzed in triplicates.
25
3.2. IC50 assay
8 different concentrations of compounds were prepared by serial dilutions in a 1 : 2 ratio from
a starting concentration of 10 µM till a final concentration of 0.075 µM. Each compound was
diluted to obtain a range of concentrations in order for a graph to be plotted and the point
where inhibition was decreasing would be seen. All dilutions were done using BACE1 assay
buffer.
These were the final concentrations required in each well after the addition of substrate and
enzyme. In order to obtain the desired concentrations, the stock solution of 1 mM was diluted
33 times to yield approximately 30 µM, and was called the 3x concentration.
After the initial dilution, serial dilution was performed in a 1 : 2 ratio to obtain the 8 different
concentrations required. All dilution was done using the assay buffer. The 8 concentrations
obtained were 10, 5, 2.5, 1.25, 0.625, 0.313, 0.15, 0.075 µM.
The compounds were done in triplicates and the wells were loaded with equal parts
compound, substrate and enzyme. For the negative control, the addition of the compound was
substituted with an equal volume of assay buffer to eliminate the inhibitory effects of the
compounds. The percentage inhibition for the data obtained can be calculated similarly to the
kinetic assay where 100 – (compound / negative control) x 100 % = X % inhibition at the
given concentration.
The 96-well plate was then transferred to Infinite F200 machine for the IC50 value analysis.
The machine was set to 15 cycles with each cycle being a minute long. The raw data was
plotted into GraphPad Prism and the results were presented as both the IC50 value in µM and
an S-curve to show the relationship between the percentage inhibition and the compounds
from 10 µM to 0.075 µM.
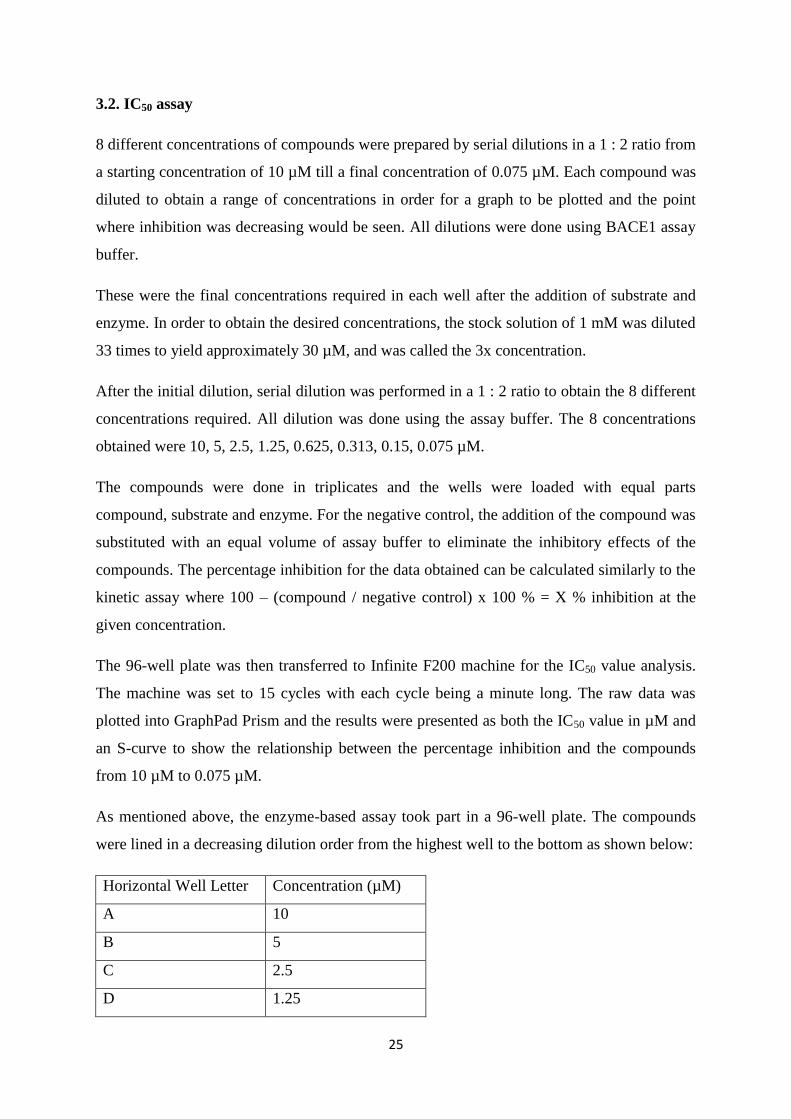
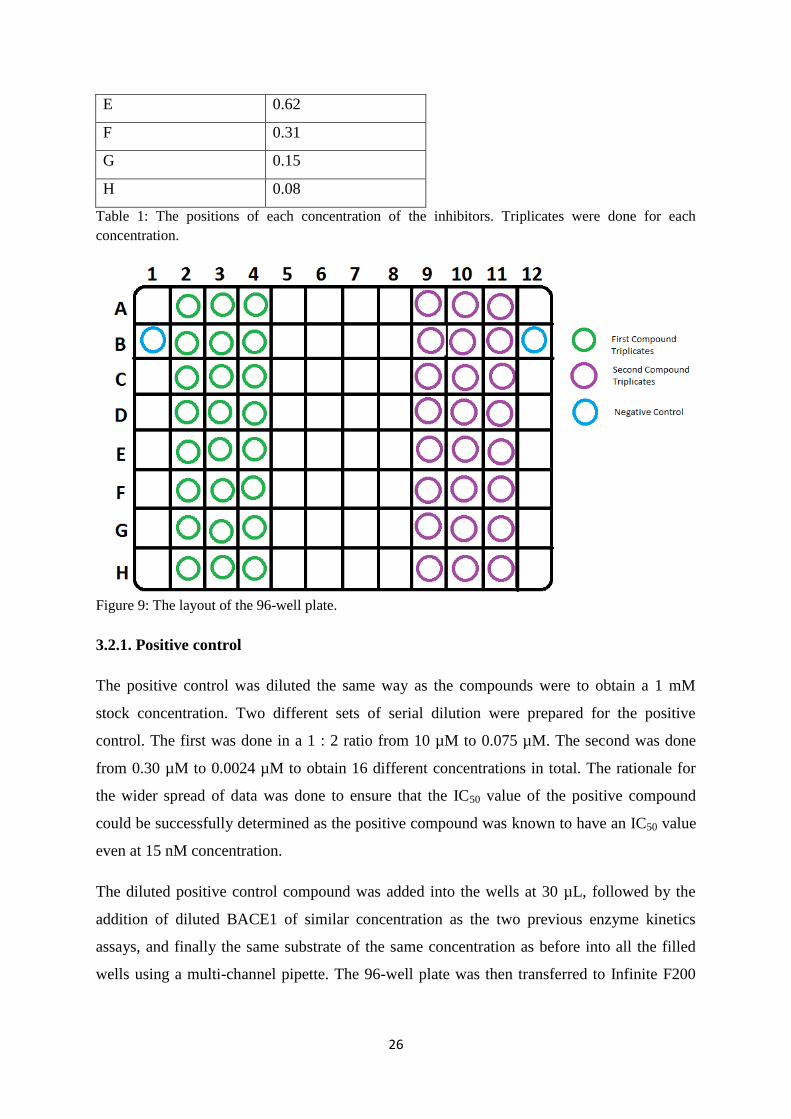
As mentioned above, the enzyme-based assay took part in a 96-well plate. The compounds
were lined in a decreasing dilution order from the highest well to the bottom as shown below:
Horizontal Well Letter Concentration (µM)
A 10
B 5
C 2.5
D 1.25
26
E 0.62
F 0.31
G 0.15
H 0.08
Table 1: The positions of each concentration of the inhibitors. Triplicates were done for each
concentration.
Figure 9: The layout of the 96-well plate.
3.2.1. Positive control
The positive control was diluted the same way as the compounds were to obtain a 1 mM
stock concentration. Two different sets of serial dilution were prepared for the positive
control. The first was done in a 1 : 2 ratio from 10 µM to 0.075 µM. The second was done
from 0.30 µM to 0.0024 µM to obtain 16 different concentrations in total. The rationale for
the wider spread of data was done to ensure that the IC50 value of the positive compound
could be successfully determined as the positive compound was known to have an IC50 value
even at 15 nM concentration.
The diluted positive control compound was added into the wells at 30 µL, followed by the
addition of diluted BACE1 of similar concentration as the two previous enzyme kinetics
assays, and finally the same substrate of the same concentration as before into all the filled
wells using a multi-channel pipette. The 96-well plate was then transferred to Infinite F200

27
machine for the IC50 value analysis. The machine was set to 15 cycles with each cycle being a
minute long.
The raw data was plotted into GraphPad Prism and the results were presented as both the IC50
value in µM and an S-curve to show the relationship between the percentage inhibition and
the compounds.
3.3. Toxicological Study
3.3.1. Cell Culture
Media preparation
The media which was used for the SH-SY5Y cell line was prepared with a 1:1 ratio of Ham’s
F-12 medium to Eagle’s minimum essential medium with 10% Foetal Bovine Serum (FBS).
FBS was stored in the freezer at -20oC. Thawing of the FBS was done in the water bath set at
37oC. The mixing of the media was done in a 1 L Schott Duran Bottle.
Storage of the culture media was in a fridge with the temperature at approximately 4oC after
being wiped with ethanol and sealed with parafilm to reduce the risks of contamination.
Thawing of SH-SY5Y from liquid nitrogen
The frozen cryovial of cells were taken out from liquid nitrogen (-210oC to -196
oC) and
allowed to thaw in a 37oC water bath partially. The remaining bits of frozen cells were
thawed by holding it or rubbing it with gloved hands, to ensure that the cells do not stay in
37oC for too long. This was because DMSO which was used as a cryoprotectant is more toxic
to cells at higher temperatures.
While the cells were almost completely thawed, it was transferred into the BSC after wiping
it with 70% ethanol. The cells were pipetted up and down gently a few times to mix the cells.
1 mL of cells was taken out and placed into 10 mL of culture medium inside a 15 mL
centrifuge tube. This was to dilute the DMSO.
Cells were mixed by pipetting in the 15 mL centrifuge tube to ensure that the DMSO was
completely diluted. The cells were then centrifuged at 1500 rpm for 5 minutes. The
supernatant was carefully discarded making sure that the pellet was not disturbed. 5 mL of
fresh culture media was then added to resuspend the pellet and pipetted up and down to
ensure an even distribution of cells throughout the entire tube. The 5 mL of culture media
28
with resuspended cells was transferred into a sterile T25 flask labelled SH-SY5Y BAS and
placed in a 5% CO2 incubator set at 37oC. The morphology of the cells were observed every
24 hours.
Washing and removal of unhealthy or dead cells
The materials required for washing and removal of dead cells were trypsin, phosphate buffer
saline (PBS) and culture media. Old culture media was first removed from the flask and 3 to
5 mL of PBS was added to the flask. PBS helps in removing the factors that inhibit trypsin
found in FBS like the Serum protease inhibitor alpha -1-antitrypsin and the mechanical
removal of dead cells that remained on the surface even after removal of the old culture
media.
1 mL of trypsin was added to the flask after removing all of the PBS in the flask and
incubated at 37oC for 4 minutes to dislodge the cells adhered to the substratum. 4 mL of fresh
culture media was then added to the flask to deactivate trypsin and have a total of 5 mL in
each flask.
Cell culture observation and subculturing of cells
Cell morphology was observed 24 hourly. When cells appeared to have a round morphology
or showed an abundance of floating cells, all culture medium were removed and 1 mL of
trypsin was added to trypsinize the cells. The cells was placed in a 37oC, 5% CO2 incubator
for 4 minutes to detach the cells from the flask. The flask was tapped to ensure that most cells
wound be detached. 4 mL of culture media was added to the trypsinized cells to deactivate
the trypsin.
Each flask was changed every 2 weeks to aid in cell growth. After diluting the trypsin, all the
media were then removed from the old flask and placed in a new T25 flask.
The flask would then be rocked in a north, south, and east to west motion to help get an even
distribution of the cells in the flask.
When culture media appeared to be orange, half of the current media was removed and
topped up with the same volume of fresh media. If the media turned yellow in colour, 4.5 mL
of old media was removed and the flask was topped up to 5 mL once again. The initial media
was not completely removed to reduce the likelihood of a sudden environmental change
which may shock the cells.

29
The floating cells in the flask during a media change can be thrown away or placed into a 15
mL centrifuge tube and centrifuged at 1500rpm for 5 minutes. The pellet kept while the
supernatant was discarded and resuspended with 1 mL of fresh culture media. The
resuspended pellet was then transferred to the original or new flask and topped up to 5 mL
with fresh culture media.
Microscopic observation of the cells was done on an Olympus IX51S8F Microscope.
Cell seeding and cell counting
Cell seeding was done in a 96 well plate and was required for the testing of compound
toxicity and cell viability by using the MTT assay. Prior to cell seeding, cell counting was
done using a haemocytometer to seed the desired number of cells per well.
The amount of cells seeded per well was at 5x10⁴ to 1x10
5. 5x10
4 cells was the preferred
amount per well for compound treatment and MTT assay.
A haemocytometer is a specialized microscope slide used for cell counting. It is thicker in
comparison to a standard microscope slide and it has a rectangular indentation which creates
the counting chambers. The centre portion of the slide has etched grids with precisely spaced
lines which aids in the counting process.
Preparation of the haemocytometer
The haemocytometer was first cleaned using 70% ethanol. The coverslip was placed onto the
haemocytometer with a tiny amount of water, ensuring that the coverslip was adhered to the
haemocytometer by looking for the Newton’s rings.
Preparation of the cell suspensions
For the preparation for the cell suspension to be used for cell seeding and counting, the BSC
was UV sterilised and wiped clean with 70% ethanol. All equipment and flasks were wiped
with 70% ethanol before entering the BSC. A T25 flask with a confluency above 70% was
removed from the incubator and placed into the BSC. A 10 mL serological pipette was used
to remove all existing media in the flask. All spent media were discarded into a waste beaker.
1 mL of trypsin was then introduced into the flask to detach cells adhered to the base of the
flask and was placed back into the incubator set at 37oC and 5% CO2 for 4 minutes.

30
After incubation, the flask was tapped gently to agitate and ensure that all cells has detached
itself from the flask and was transferred back into the BSC after wiping with 70% ethanol.
In the BSC, an appropriate amount of culture media added to the flask to deactivate the
trypsin. The flask was homogenised by pipetting up and down a couple of times before
removing 1 mL of the cells and placing it into a 15 mL centrifuge tube to be used for dilution.
Another 10 µL of the cells was removed and placed in an Eppendorf tube. An equal volume
of trypan blue was added to the Eppendorf tube and mixed thoroughly by pipetting up and
down gently a few times. This mixture was ready to be loaded into the haemocytometer.
Cell counting
Using a P20 pipette, 10 µL of trypan blue and the cell suspension was pipetted out and
carefully loaded into each chamber of the haemocytometer. This was done by carefully
resting the tip of the pipette on the edge of the coverslip. The chamber was filled by capillary
action. A constant loading rate was maintained to avoid under or over filling of the two
chambers.
The cells were then left to settle for about 5 minutes before viewing the cells under a
microscope using the 10x objective lens. If there were too many clumps seen under the
microscope, mix the suspension again and repeat the counting procedure.
The corner gird of each chamber which comprises of 16 squares each was focused under the
microscope and the number of cells in these squares was counted. The cells that were counted
were the cells that were not stained by trypan blue. Unstained cells were viable cells whereas
stained cells were dead cells. Cells that touch the boundary on the bottom or the right hand
side were not counted. This process was repeated for all 4 corners of the grid. The stained
cells were counted separately for a cell viability count. The average number of cells of the
corner grid was taken to be equal to the number of cells x 104 per mL.

31
Figure 10: A schematic of the proportions of the guide lines used to determine the cell count and
therefore the cell number per millilitre. The picture was adapted from PK Group (1999) Grid patterns
of improved Neubauer ruled haemocytometer.
3.3.2. 3-[4, 5-dimethylthiazol-2-yl]-2, 5-diphenyltetrazolium bromide (MTT) assay
3.3.2.1. Preparation of MTT assay reagent and assay buffer
The MTT assay buffer was prepared by dissolving the cell based assay buffer tablet in 100
mL of diluted water. The MTT assay buffer was used to reconstitute the MTT reagent. 5 mL
amount of water was first added to the container containing the tablet and mixed around
ensuring that everything was dissolved before transferring to a 100 mL flask and topping up
to 100 mL.
For the MTT reagent, 125 mg of MTT reagent in powder form was reconstituted first using 5
mL of MTT assay buffer. The reconstituted MTT reagent was then transferred to a 50 mL
tube wrapped in aluminium foil as the reagent was light sensitive. Another 20 mL of MTT
assay buffer was added to the tube to reach the final volume of 25 mL.

32
5 mL of the MTT reagent was aliquoted into a 15 mL centrifuge tube wrapped in aluminium
foil to prevent repeated freeze thawing of the master MTT assay reagent.
3.3.2.2. The determination of Cell Number required for MTT Assay
The ATCC cell line SH-SY5Y cells were resuspended using the steps mentioned previously
in Preparation of the cell suspensions (3.3.1.), counted and diluted to the respective starting
cell counts by the methods listed in Cell counting (3.3.1.). The MTT reagent was prepared
using the methods stated in 3.3.2.1. The resuspended cells were then loaded into a 96-well
plate in eight 90 µL replicates and left for 3 days under 37oC and 5% CO2.
After three days, the wells were drained of all the 90 µL cell media through micro-pipetting.
100 µL of crystal dissolving solution was added into the wells and left for an hour, before the
plate was read at 570 nm in the Spectramax 190 plate reader. The results were presented as a
mean value.
3.3.2.3. Toxicological Assay
In this experiment, the human neuroblastoma SH-SY5Y cell line used was subjected to 10
different types of compounds in 10, 5 and 2.5 µM.
The cells were first seeded into two 96 well plates with a density of 5 x 10⁵ cells per well in a
total of 90 µL of culture medium and incubated in a 5% CO2 incubator set at 37oC for 24
hours.
10 µL of the compounds were added to the 90 µL of cells on the 2nd
day to give a final
volume of 100 µL with the compound to cell ratio at 1 : 10. For the negative control wells 10
µL of fresh culture media was added to the wells instead. After the addition of compounds
and culture media, the plate was then incubated for another 24 hours.
On the 3rd
day after the total 48 hours of incubation, 10 µL MTT reagent was added to the
wells and left on the orbital shaker for 1 minute. The plate was then wrapped in aluminium
foil and left in the incubator for 4 hours because the MTT reagent was light sensitive. If there
were viable cells in the well after compound treatment, the cells would change the MTT
reagent into dark purple coloured formazan crystals found at the bottom of each well.
After the 4 hour incubation, the culture media was carefully aspirated to prevent the
disruption of the cell monolayer from each well. 100 µL of crystal dissolving solution was
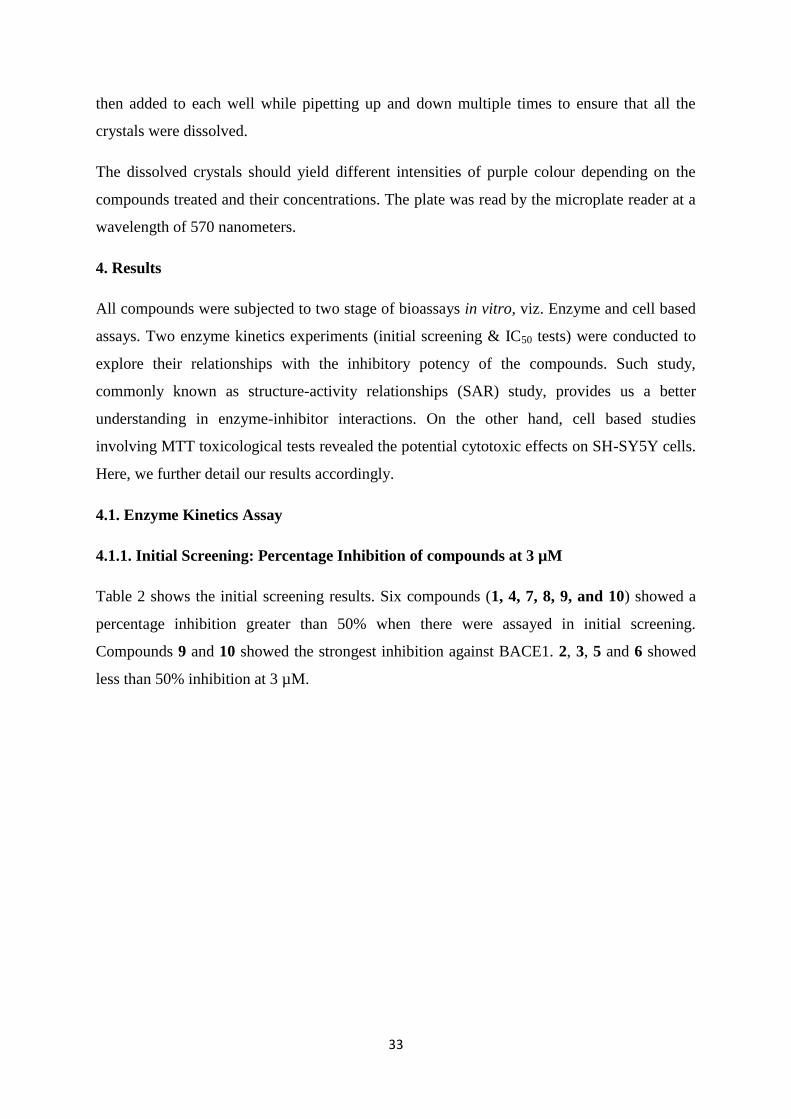
33
then added to each well while pipetting up and down multiple times to ensure that all the
crystals were dissolved.
The dissolved crystals should yield different intensities of purple colour depending on the
compounds treated and their concentrations. The plate was read by the microplate reader at a
wavelength of 570 nanometers.
4. Results
All compounds were subjected to two stage of bioassays in vitro, viz. Enzyme and cell based
assays. Two enzyme kinetics experiments (initial screening & IC50 tests) were conducted to
explore their relationships with the inhibitory potency of the compounds. Such study,
commonly known as structure-activity relationships (SAR) study, provides us a better
understanding in enzyme-inhibitor interactions. On the other hand, cell based studies
involving MTT toxicological tests revealed the potential cytotoxic effects on SH-SY5Y cells.
Here, we further detail our results accordingly.
4.1. Enzyme Kinetics Assay
4.1.1. Initial Screening: Percentage Inhibition of compounds at 3 µM
Table 2 shows the initial screening results. Six compounds (1, 4, 7, 8, 9, and 10) showed a
percentage inhibition greater than 50% when there were assayed in initial screening.
Compounds 9 and 10 showed the strongest inhibition against BACE1. 2, 3, 5 and 6 showed
less than 50% inhibition at 3 µM.

34
Compo
und
Molecula
r Weight
R X %
Inhibition at
3 µM
IC50 (µM)
1 509.54
60.63 ±
2.40
5.65
2 553.59
16.56 ±
3.66
N.A.
3 549.63
29.96 ±
0.94
N.A.
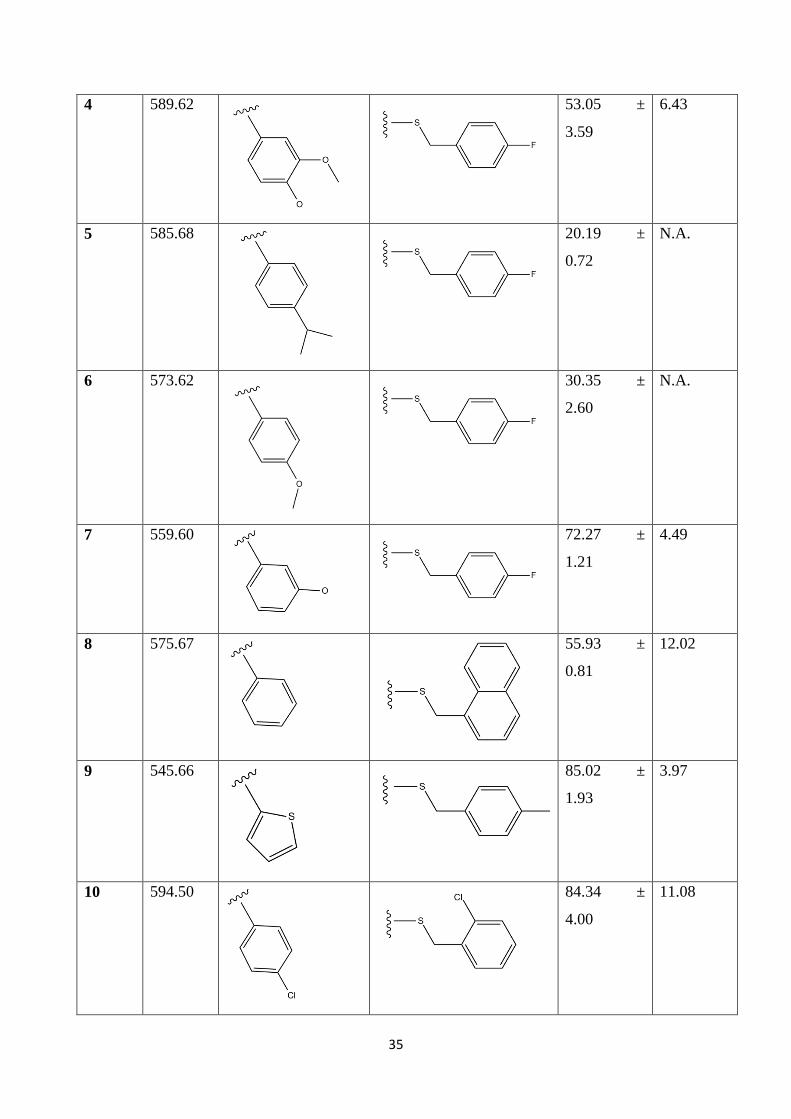
35
4 589.62
53.05 ±
3.59
6.43
5 585.68
20.19 ±
0.72
N.A.
6 573.62
30.35 ±
2.60
N.A.
7 559.60
72.27 ±
1.21
4.49
8 575.67
55.93 ±
0.81
12.02
9 545.66
85.02 ±
1.93
3.97
10 594.50
84.34 ±
4.00
11.08

36
Table 2: The SAR of substitution patterns of R and X. The data of % inhibition at 3µM were
presented as means ± SEM, n = 3. IC50 values are presented as µM concentration. Models were drawn
using CambridgeSoft ChemDraw. N.A.: Not determined.
Figure 11: BACE1 initial screening results of compounds at 3 µM. Results are presented as the mean
± SEM calculated from GraphPad Prism. Non-parametric, unpaired t-test at 99% confidence interval
was used for statistical analysis. *: compounds showing non-significant difference compared to
negative control (p>0.01). *** and ****: compounds showing significant difference compared to
negative control (p<0.01). Pos represents 100% inhibition and neg represents 0% inhibition.
4.1.2 IC50 assay
From initial screening, we then further investigated the IC50 values of 6 compounds (1, 4, 7,
8, 9, 10). Data from IC50 measurement is summarised in Table 3 and the results interpreted
into IC50 values and an S-curve in table 4. Among them, 9 exhibited the most potent IC50
value of 3.97 µM. The positive control was expected to have an IC50 of 0.015 µM
(Calbiochem®, 2013); the IC50 that was derived in this screening was 0.028 µM.
Concentration
(µM)
7 8 1 4 10 9
10 103.80 ± 77.16 ± 94.72 ± 95.98 ± 98.95 ± 99.75 ±

37
3.67 22.64 1.70 0.76 0.84 2.01
5 73.85 ±
1.98
69.05 ±
2.48
64.07 ±
5.57
81.81 ±
1.33
68.24 ±
3.00
84.22 ±
1.24
2.5 53.87 ±
4.01
31.18 ±
4.52
42.17 ±
3.11
47.72 ±
3.90
33.09 ±
4.80
54.12 ±
5.44
1.25 9.44 ±
6.01
2.12 ±
6.37
-10.96 ±
8.83
15.35 ±
5.49
4.33 ±
5.60
28.48 ±
6.29
0.62 -27.60 ±
8.64
6.90 ±
6.55
-25.15 ±
7.16
-1.25 ±
9.65
-7.12 ±
4.91
-9.58 ±
4.62
0.31 -20.26 ±
7.87
9.30 ±
6.97
-21.94 ±
5.85
2.43 ±
8.36
3.43 ±
12.14
-10.08 ±
5.48
0.15 -29.81 ±
7.99
7.73 ±
5.74
-12.97 ±
6.17
4.90 ±
9.10
-7.89 ±
3.19
'-5.27 ±
5.70
0.08 -10.44 ±
4.78
12.94 ±
5.24
-36.80 ±
14.00
5.93 ±
9.44
-8.78 ±
9.58
0.88 ±
7.53
Table 3: Percentage inhibition values from 10 to 0.08 µM of compounds 1, 4, 7, 8, 9 and 10 on
BACE1. Data presented as means ± SEM. Non-parametric, unpaired t-test was used for statistical
analysis in GraphPad Prism.
Compounds IC50 Value (µM) Dose-dependent S-curve of the compounds
Positive
Control
0.028
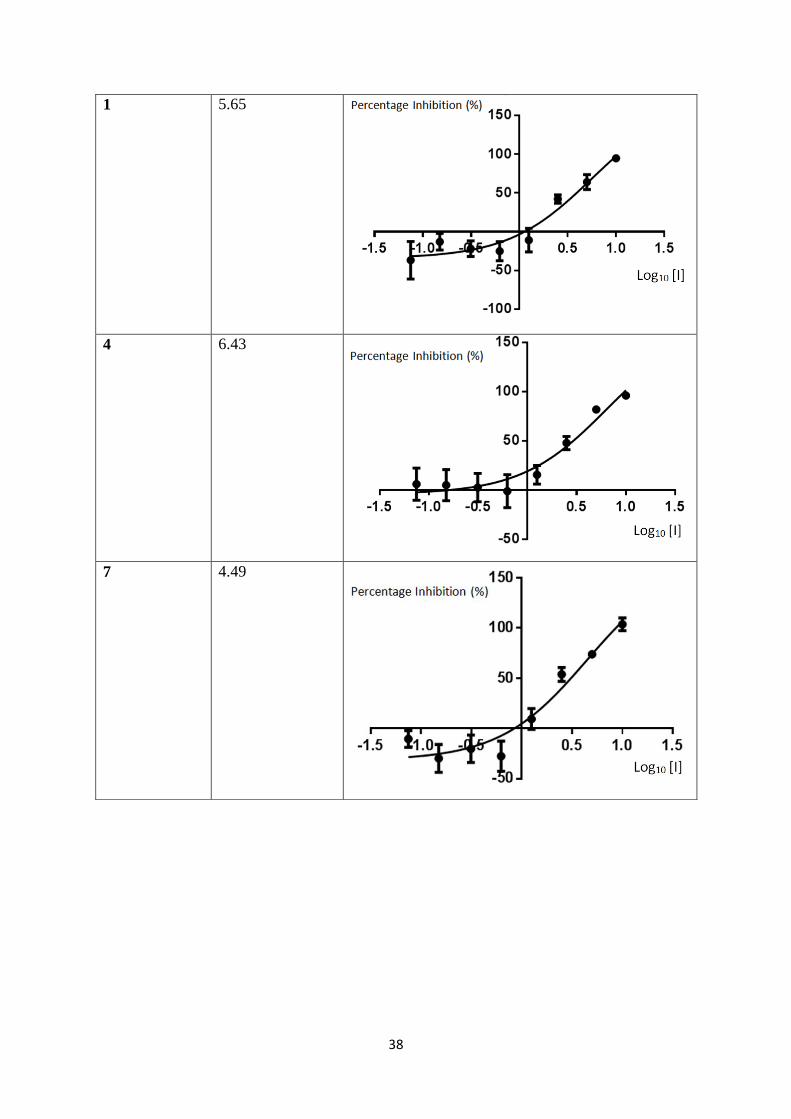
38
1 5.65
4 6.43
7 4.49
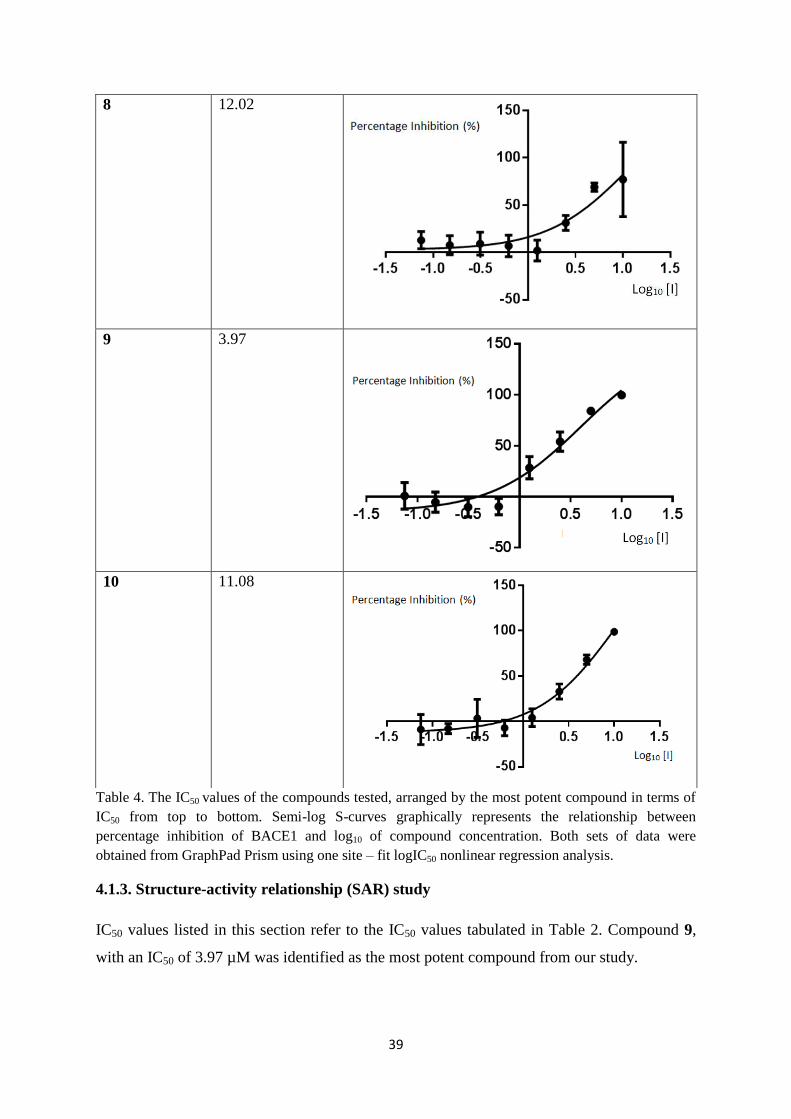
39
Table 4. The IC50 values of the compounds tested, arranged by the most potent compound in terms of
IC50 from top to bottom. Semi-log S-curves graphically represents the relationship between
percentage inhibition of BACE1 and log10 of compound concentration. Both sets of data were
obtained from GraphPad Prism using one site – fit logIC50 nonlinear regression analysis.
4.1.3. Structure-activity relationship (SAR) study
IC50 values listed in this section refer to the IC50 values tabulated in Table 2. Compound 9,
with an IC50 of 3.97 µM was identified as the most potent compound from our study.
8 12.02
9 3.97
10 11.08

40
Compounds 9 and 3 shared a thienyl at the R position, but differed in the X position. Their
initial screening results were also very different. Compounds 1 and 2 shared a methyl at the X
position but were not similar at R. Their initial screening results were also disparate; 1 at
60.63 ± 2.399%, 2 at 16.56 ± 3.657%.
Compounds 3, 4, 5, 6 and 7 shared the same group at X, but their initial screening and IC50
results were highly varied. Compound 7 exhibited the strongest potency amongst all of them
(IC50 = 4.49 µM, initial screening = 72.27 ± 1.217%).
4.2. Toxicological study
4.2.1. The determination of Cell Number required for MTT Assay
The results obtained showed that wells seeded with 5 x 10⁴ cells resulted in a slightly higher
absorbance at 570 nm (0.358) than the wells seeded with 1 x 10⁵ cells (0.338).
Undifferentiated cells were observed in culture while more will be elaborated in 5.2.1.
Replicates 5x10⁴ cells / mL, Initial Cell
Number
1x10⁵
cells / mL, Initial Cell
Number
1 0.414 0.441
2 0.415 0.35
3 0.449 0.29
4 0.387 0.377
5 0.307 0.355
6 0.389 0.296
7 0.249 0.34
8 0.254 0.256
Average 0.358 0.338
Table 5: Comparisons between the cell number after 3 days of the two experimental initial cell
number of 5 x 10⁴ cells and 10
5 cells. Absorbances were measured using a Spectramax 190 plate
reader.

41
4.2.2. MTT assay
Based on the results of the previous experiment, 5 x 10⁴ cells were seeded into the wells and
were treated. Compound 9 was expected to show low cell viability because it contains a toxic
toluene group at the X.
Taking the mean values of cell viability, SH-SY5Y cells treated with 10 µM and 5 µM of 7
retained the highest cell viability, while cells treated with 2.5 µM of 9 retained the highest
cell viability. This conflicts with our prediction. However, SH-SY5Y treated with 10 µM of
9, 5 µM of 1 and 2.5 µM of 10 showed the lowest percentage viability. Results were
presented as means ± SEM, and were calculated using negative control representing 100%
viability. Compound 7 did not show any cytotoxic effects on SH-SY5Y at all concentrations.
Compound 10 µM 5 µM 2.5 µM
1 48.50 ± 11.41 40.71 ± 3.432 70.36 ± 12.65
2 97.27 ± 40.74 75.82 ± 21.23 69.81 ± 12.66
3 66.53 ± 9.888 72.40 ± 12.84 87.70 ± 3.549
4 64.89 ± 17.36 64.62 ± 13.96 68.85 ± 15.40
5 59.56 ± 8.933 51.37 ± 7.104 71.04 ± 23.43
6 72.81 ± 14.87 95.36 ± 23.29 85.52 ± 20.01
7 111.2 ± 16.46 104.4 ± 31.66 113.4 ± 30.96
8 56.42 ± 5.646 68.85 ± 7.335 78.96 ± 12.67
9 30.46 ± 8.565 46.17 ± 1.744 157.4 ± 15.81
10 50.00 ± 17.53 61.75 ± 18.24 64.75 ± 2.257
Table 6. The relationship between the compounds at concentrations of 10, 5 and 2.5 µM and SH-
SY5Y percentage viability with an initial cell concentration of 5 x 10⁴ cells per well. Data is presented
as means ± SEM, n = 3. Non-parametric, unpaired t-test was used for statistical analysis in GraphPad
Prism.

42
Figure 12: The % viability of SH-SY5Y against compounds at 10, 5 and 2.5 µM. The error bar was
presented on top of all bars except for negative control, which represents 100% viability. Non-
parametric, unpaired t-test and column statistics were used for statistical analysis in GraphPad Prism.
5. Discussion
5.1. Enzyme-based assay
The purpose of the enzyme-based assay was to determine which of the ten compounds
exhibited more than 50% inhibition of BACE1 initial screening, so that an IC50 assay would
be conducted to measure their IC50 values, which was indicative of an inhibitor’s potency.
The compounds tested in this final year project varied only in the groups that interacted with
the S3’ and S4’ sub-sites of BACE1 enzyme (as shown in Table 2).
The enzyme-based assay was structured so that each compound was treated to BACE1 in
triplicates, enabling the results to be well presented statistically. The enzyme-based assays
consisted of an initial screening followed by an IC50 assay. The reason why the IC50 assay
was not conducted on all the compounds was because of the limited supply of BACE1 and
the enzyme’s substrate. Most importantly the objective of this report was to source out the
best molecular structures for a potent BACE1 inhibitor. The experiment was carried out in
three phases. During each phase, two compounds were tested.
The FRET assay was used as the method to measure the potencies of the compounds on
BACE1. Fluorescence generated by a substrate modelled after a Swedish mutant APP protein
was measured and compared with the negative control, which then produces the percentage

43
inhibition. The substrate was light-sensitive, so therefore it was added last into the wells of
the 96-well plate.
The inhibitor that attracted the most interest was 9, with the lowest IC50 value of 3.97 µM,
which also shows that it was the most potent. The initial screening also shows that it was
amongst the most potent inhibitors, inhibiting at 85.02%, showing the consistency of both
experiments. The difference of this compound from others was that it contains a 4-
sulfanyltoluene interacting with the S3’ sub-site and a thienyl interacting with the S4’ sub-
site.
Compounds 9 and 3 shared a thienyl at the R position, but differed to the X position. Their
initial screening results was also very different (3 = 29.96 ± 0.9394%), with 9 being more
potent. Their only difference was that 9 had a methyl residue as substitute for the fluorine
attached to the benzene at the X position. This is evidence that a methyl residue was more
effective at increasing the potency of the compounds than a fluorine as a residue attached to a
4-sulfanylbenzene at the area interacting with the S3’ sub-site.
Compounds 1 and 2 shared a methyl at the X position but were not similar at R. Their initial
screening results were also very different; 1 at 60.63 ± 2.399% and 2 at 16.56 ± 3.657%.
Compound 1 had a 3-phenoxyphenyl on the R position while 2 had a 4-(benzyloxy)-3-
methoxyphenyl instead, so the proposition was that since 1 possessed more potency in the
initial screening, the 3-phenoxyphenyl was more effective at inhibiting BACE1 at that
concentration than the bulky residue possessed by 2. Assuming that the inability of inhibitors
into the enzyme sub-sites correlates to lower potency, it may be said that the S4’ sub-site is of
limited size. This form of proposition was also used in another research report (Bäck, 2008).
Since 1 also has a much lower molecular weight (509.54) compared to 2 (553.59), it was
more likely to make it through the BBB (Clarke et al., 2008) and therefore be developed into
a drug lead. A PSA test (Swahn et al., 2012) and a MDR1 – MDCK assay (Lerchner et al.,
2010) could be done in a future research to measure the permeability of the compounds
across the BBB.
Compound 10 also has the highest molecular weight of all the compounds, which makes it
hardest to penetrate the BBB. Its IC50 was 11.08 µM, which shows that it was one of the least
potent inhibitors. The combination of both high molecular weight and low IC50 value is proof
that 10 is not an effective drug to be developed into a drug lead. Upon reviewing the residues

44
of 10 attached at the R (4-chlorophenyl) and X ([2-chlorobenzyl]sulfanyl), these residues
contains chlorine. Thus it may be hypothesised that the chlorine lowers BACE1 inhibitor
potency if both the s3’ and S4’ sub-sites contains it.
Compounds 3, 4, 5, 6 and 7 shared the same residue at X, but their initial screening and IC50
results were highly varied, with 7 exhibiting the strongest potency amongst all of them (IC50
= 4.49 µM, initial screening = 72.27 ± 1.217%), which was evidence that an 3-hydroxyphenyl
at the R position increases potency much better than a 4-methoxyphenyl (6), 4-
isopropylphenyl (5), 4-hydroxy-3-methoxyphenyl (4) and 2-theinyl (3). Amongst them,
compound 5 was measured to have the weakest potency in the initial screening (20.19 ±
0.7211%), so therefore a 4-isopropylphenyl residue at the R position was the least effective at
binding with the S3’ sub-site compared to other residues.
Compounds 3, 4, 5, 6 and 7 shared a similar residue at X. Only 7 showed more than 50%
potency in the initial screening, but the other compounds except for 4 was below 50%.
Compound 3 shared the same thienyl as 9, a compound which was measured to have a potent
IC50 value. This shows the single fluorine that was the difference between these compounds
was a significant impact on potency. This phenomenon was reported in literature (Lerchner et
al., 2010), but not against the S3’ sub-site. In that study, they concluded that fluorinated
alkyl groups interacting with the S2 sub-site led to a major reduction in potency on BACE1.
However, it improved permeability of the compounds across the BBB, which is an important
drug property for a brain-targeting drug.
Comparing the IC50 values of 4 and 7, which were similar at the X position as both contained
a fluorobenzene connected with the rest via a sulfanyl residue, 7 was more potent with an
IC50 value of 4.49 µM while 4 had an IC50 value of 6.43 µM. The initial screening also
determined that 7 could inhibit BACE1 more at 3 µM. The only structural difference between
them is an extra oxygen and methyl at the R position of 4 (R interacts with the S4’ sub-site of
BACE1). This suggests that the presence of a methyl decreased the potency of the inhibitor in
the S4’, contrary to the S3’ sub-site. However, the extra oxygen on the R position of 4 may
have been the contributor of the decreased potency of 4.
Compound 8 was unique for bearing only aromatic rings at both R and X. The IC50 of this
compound was found to be 12.02 µM. This ranks this compound as the least inhibiting
amongst all other compounds in terms of IC50. A limited conclusion may be made, which was
the absence of elements such as oxygen or halogens would limit the IC50 result of the

45
compound and therefore reduce its potency. However, this does not take into the account of
the orientation of the atoms in the residues, which may also affect potency.
Compound 1 has one of the highest potential amongst the compounds to be developed into a
drug lead using just inference from the enzyme-based assay. Although producing slightly
weaker results in the initial screening (60.63 ± 2.399%), and its IC50 value (5.65 µM) was
slightly lower than 9, it has the lowest molecular weight of all the compounds, which was a
highly-sought property for a non-peptidomimetic compound as a low molecular weight
makes the drug pass the BBB easier, and thus more can enter the brain, although non-
peptidomimetic compounds generally have a larger molecular weight than their
peptidomimetic counterparts.
SAR studies revealed that the low molecular weight of 1 was due to the light methyl group
that is attached to X, without the unnecessarily heavy residue at the R position of 2.
Compound 9, which has an even more potent IC50 value, also has a methyl at its X position.
This shows that there may be a correlation between the methyl group at the S3’ sub-site and
higher potencies of the compound, but referencing from the discussion between both 1 and 9,
the methyl group may also have contributed to the detrimental cytotoxic effects on SH-SY5Y
cells.
Compounds 8 and 10 have very bulky residues at X, and residues projecting from it
interacted with the S3’ sub-site of BACE1. These two compounds exhibited the lowest IC50
values amongst all other compounds, so it may be hypothesised that the S3’ sub-site was of
limited size (Bäck et al., 2008). Compound 2 also had a bulky sub-site, but at the R position
(S4’ interacting). It was measured to have the least potency in the initial screening, so it may
also be hypothesised that the size of the S4’ sub-site was also of limited size.
Notably, before the measurement of IC50 of the ten compounds, a positive control was run to
ensure that the BACE1 FRET Assay Kit’s reagents are working as intended. The positive
control was a compound with a known structure and IC50 value which can be used to
determine if our kit has is able to reproduce the results that were listed on the compound.
The positive control was done as a way to test the beta-secretase enzyme activity and rule out
other inhibiting factors such as enzyme degradation and contamination. The expected values
to be obtained from the positive control compound were approximately 15 nM, as reported in
the provider’s website (Calbiochem®, 2013). The positive control was measured in our

46
project to have an IC50 value of 28 nM, which was arguably a very close result as FRET
assays have less sensitivity at nano-molar concentrations (Pietrak et al., 2005).
However, the structure of the positive compound does not share the same main chains and
side chains of the 10 compounds we are testing. This tells us that the inhibitory properties of
our compounds will not be similar to that of the positive control due to the different
interactions of compounds to the sub domains of the active site; therefore a detailed SAR
study was not conducted.
Both the initial screening and the IC50 assay resulted in 9 being the most potent of the ten
nonpeptidomimetic compounds. As raised in the Introduction, problems with the potency
and PK properties are one of the main reasons why BACE1 inhibitors have not progressed
well. Looking at the results of the enzyme-based assays, 9 and 7 has the most potential to be
developed into a drug lead for AD treatment. Compounds 3, 4, 5, 6 and 7 shared a similar
residue at X, but all compounds except for 4 and 7 did not show more than 50% inhibition in
the initial screening. It may be hypothesised that the fluorine in the 4-sulfanylfluorobenzene
decreased the potency of the compounds.
Compounds 9 and 7 scored amongst the highest in both the initial screening and the IC50
assay, showing its ability to be a potent compound against BACE1. However, enzyme-based
tests are insufficient to provide evidence for the compounds as possessing good PK
properties. Absorption through the BBB could be determined through molecular weight could
be used to prove their ease to pass the BBB, however, a PSA test (Swahn et al., 2012) and a
MDR1 – MDCK assay (Lerchner et al., 2010) is more effective at measuring the efficiency of
the compounds to pass the BBB. For evidence of the cytotoxicity of the compounds on neural
cells, the cell-based toxicological assay was conducted immediately after the enzyme-based
assay.
5.2. Toxicological Assay
5.2.1. Cell Culture
This section of the project was included because of the need for a healthy neural cell line for
the toxicological assay, and it covers the difficulties faced during cell culture over a period of
1-63 days and the methods that could have been done or was done in order to solve the
difficulties. The cell line used was the ATCC SH-SY5Y neuroblastoma cell line. The reason
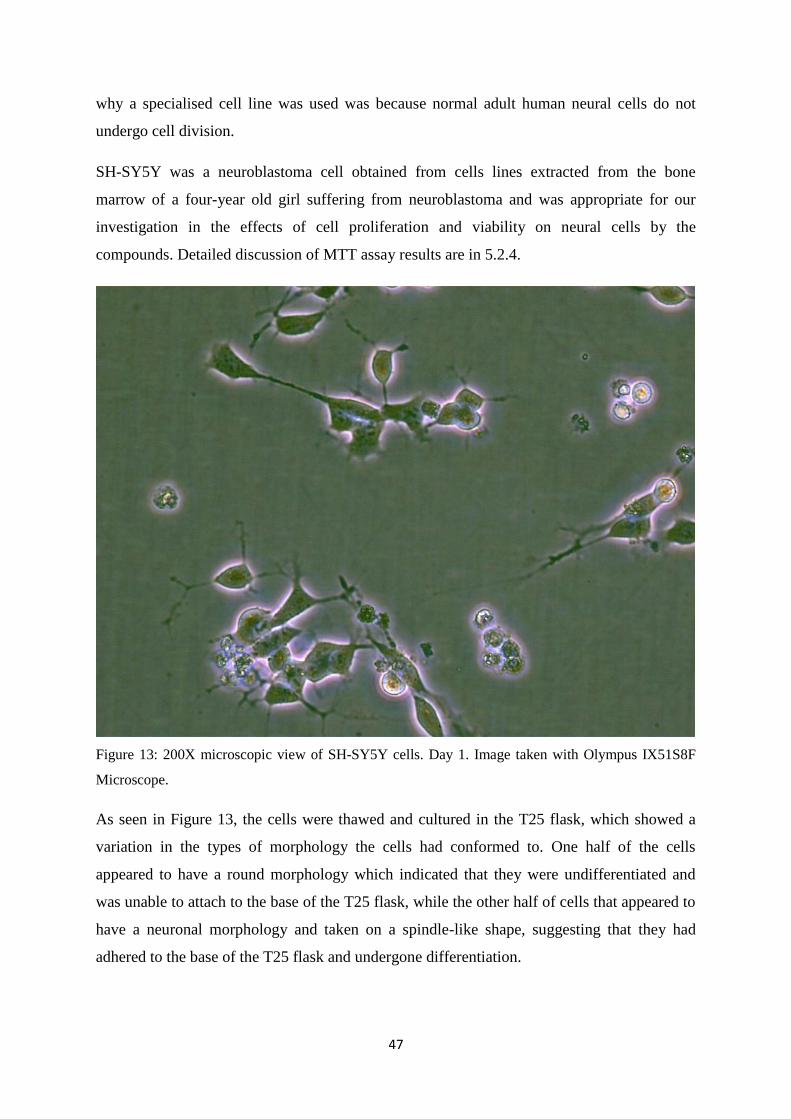
47
why a specialised cell line was used was because normal adult human neural cells do not
undergo cell division.
SH-SY5Y was a neuroblastoma cell obtained from cells lines extracted from the bone
marrow of a four-year old girl suffering from neuroblastoma and was appropriate for our
investigation in the effects of cell proliferation and viability on neural cells by the
compounds. Detailed discussion of MTT assay results are in 5.2.4.
Figure 13: 200X microscopic view of SH-SY5Y cells. Day 1. Image taken with Olympus IX51S8F
Microscope.
As seen in Figure 13, the cells were thawed and cultured in the T25 flask, which showed a
variation in the types of morphology the cells had conformed to. One half of the cells
appeared to have a round morphology which indicated that they were undifferentiated and
was unable to attach to the base of the T25 flask, while the other half of cells that appeared to
have a neuronal morphology and taken on a spindle-like shape, suggesting that they had
adhered to the base of the T25 flask and undergone differentiation.
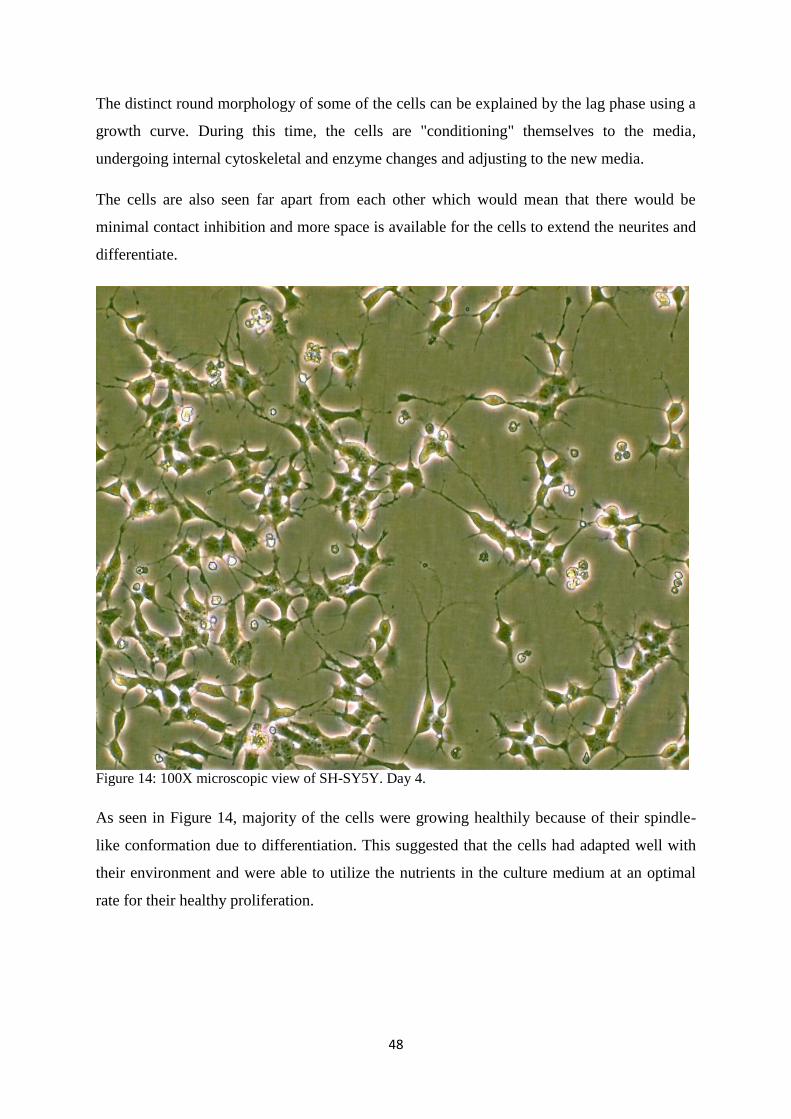
48
The distinct round morphology of some of the cells can be explained by the lag phase using a
growth curve. During this time, the cells are "conditioning" themselves to the media,
undergoing internal cytoskeletal and enzyme changes and adjusting to the new media.
The cells are also seen far apart from each other which would mean that there would be
minimal contact inhibition and more space is available for the cells to extend the neurites and
differentiate.
Figure 14: 100X microscopic view of SH-SY5Y. Day 4.
As seen in Figure 14, majority of the cells were growing healthily because of their spindle-
like conformation due to differentiation. This suggested that the cells had adapted well with
their environment and were able to utilize the nutrients in the culture medium at an optimal
rate for their healthy proliferation.

49
Figure 15: 100X microscopic view of SH-SY5Y. Day 38.
As seen in Figure 15, the cells showed an unhealthy morphology as the cells were clumping
together and were floating which showed cells were undergoing apoptosis. This abnormal
morphology could be attributed to the depletion of nutrients, growth factors and inability to
adapt to the culture environment. Another possible reason that could explain this
phenomenon was that repeated passaging of cells and the multiple usage of trypsin in the cell
detachment step of subculturing. Trypsin could have caused the substratum to become
smoother in the T25 flask and reduced the ability of the cells of attaching. This is because
adherent cells adhere to a rough substratum better than a smooth substratum.

50
Figure 16: 100X microscopic view of SH-SY5Y. Day 59.
As seen in Figure 16, the cells had regained their healthy looking morphology were able to
differentiate efficiently as compared to the cells in Figure 15 after changing to a new T25
flask. Cells in this new T25 flask were able to produce and receive sufficient growth and
adhesion factors to promote their proliferation. Furthermore, with the replenishment of
culture medium, it improved the nutrient content and diluted any accumulation of toxic
products, waste materials and metabolites that may inhibit cell growth. Hence, the cells were
able to reach a high confluency of 100% eventually as they were provided with an ideal
environment for healthy growth in the log phase as it can be observed in Figure 17.
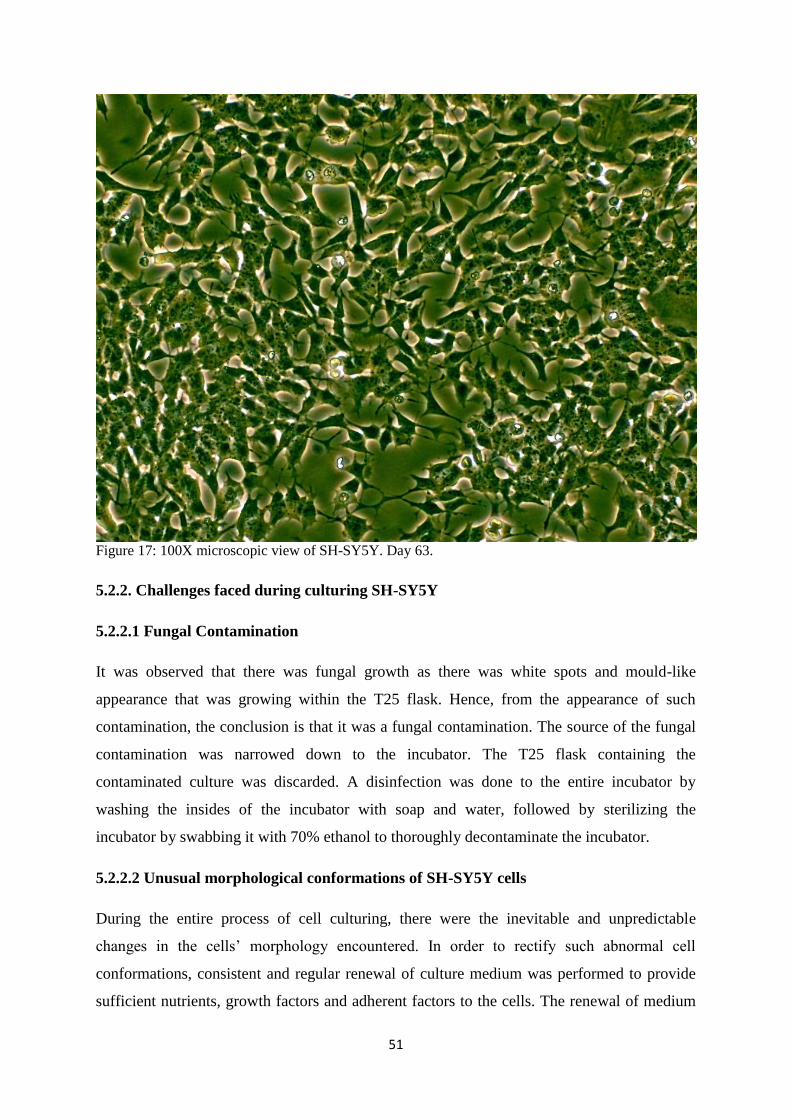
51
Figure 17: 100X microscopic view of SH-SY5Y. Day 63.
5.2.2. Challenges faced during culturing SH-SY5Y
5.2.2.1 Fungal Contamination
It was observed that there was fungal growth as there was white spots and mould-like
appearance that was growing within the T25 flask. Hence, from the appearance of such
contamination, the conclusion is that it was a fungal contamination. The source of the fungal
contamination was narrowed down to the incubator. The T25 flask containing the
contaminated culture was discarded. A disinfection was done to the entire incubator by
washing the insides of the incubator with soap and water, followed by sterilizing the
incubator by swabbing it with 70% ethanol to thoroughly decontaminate the incubator.
5.2.2.2 Unusual morphological conformations of SH-SY5Y cells
During the entire process of cell culturing, there were the inevitable and unpredictable
changes in the cells’ morphology encountered. In order to rectify such abnormal cell
conformations, consistent and regular renewal of culture medium was performed to provide
sufficient nutrients, growth factors and adherent factors to the cells. The renewal of medium

52
also allowed metabolites from accumulating alongside waste products that would be
inhibitory to healthy proliferation of the cells. Hence, it became apparent that an unhealthy
appearance and clumping of cells did not necessarily indicate the cells had undergone
apoptosis, but rather suggests renewal of medium was needed for healthy propagation of cells
instead.
5.2.2.3 High confluence
As cells divide and proliferate, they tend to utilize nutrients at a much faster rate for their
healthy growth and require more space to grow in the T25 flask. Thus, rapid depletion of
nutrients would curtail cell proliferation. At the same time, when there is not enough space
for the cells to grow, cells tend to crowd together, a phenomenon known as contact inhibition
may occur. Contact inhibition is a natural process of cell growth arrest when two or more
cells come into contact with one another. The arrest in the cell cycle would bring about
detrimental effects to the process culturing of healthy cells, and instead cause the cells to
undergo apoptosis ultimately. Hence, to overcome this problem, repeated sub culturing of the
cells were performed on flasks that reached confluence of 75% to 100%.
5.2.2.4 Enumeration of cells
During cell counting, it was observed at one point, in which the sample of cells being loaded
into the upper and lower hemocytometer chamber had a large variation. This may be due to
insufficient mixing of the sample of cells with trypan blue in the tube that resulted in a less
homogenized suspension. Hence, thorough mixing of cell suspension was performed before
loading the sample into the chambers to avoid future errors.
Other errors such as improper filling of chambers which could lead to inaccurate cell
counting were avoided by scrupulously cleaning the haemocytometer chamber and the cover
slip. The chamber and cover slip were cleaned first with distilled water, then by 70% ethanol
and wiped dry with a Kimwipe.
5.2.3. The determination of Cell Number required for MTT Assay
Since a higher MTT absorbance relates to higher cell viability, and higher viability relates to
more accurate results in subsequent MTT assays with BACE1 inhibitor compounds, an initial
cell seeding of 5x10⁵ cells was more suitable than 1 x 10
6 cells. However, undifferentiated
cells were observed in culture.

53
This could be due to a multitude of factors. Firstly, there could have been a problem with the
process from cell culture to cryopreservation. It was possible that the cells provided had
compromised proliferation, perhaps because unhealthy or senescent cells were chosen for
cryopreservation. Not freezing the cells at a rate of -1oC per minute and rough handling of
cells could have had been the problem.
The effects of the compromised proliferation may not be visible in culture inside the T-25
flasks, which has a larger surface area and more media volume, but may have been more
profound while growing inside the 96-well plate, which had a much smaller surface area to
grow and had less media volume. The increased stress may have exerted pressure on the
growth of the cells and may have led to lower cell proliferation.
Secondly, there could have been a problem with the process from cryopreservation to
thawing. The techniques that were used in the first thaw (Frozen vial A) was impeached by
repeating the thawing procedures for two more vials of cryopreserved cells (Vials B and C),
while following protocols given by Invitrogen (Invitrogen, 2012). The cells thawed from the
two vials were shown below.
Figures 18 and 19: The photo in the left shows the cells from the first vial (Vial B) of the two inside a
T-25 flask with 5 mL of media in 5% CO2 while the one on the right show the second vial (Vial C),
also in similar conditions. Both images were taken at approximately the similar time after thawing
before subculturing was done.
The images show very low confluence, suggesting sparse growth, and masses of
undifferentiated cells, which already suggests senescence of cells prior to cryopreservation
(HPA, 2012). Media was changed every two to three days and was the exact same media
composition as the cells thawed from vial A. Since the methods were kept consistent with the
sparse growth of the cells thawed from vials B and C, the chances of the low negative control

54
absorbance faced in the MTT assay being connected with the thawing procedures were
unlikely.
As for comparison, the image below shows cells from vial A, which were growing healthily
in the same incubator and media at an earlier date, before it began to cease in differentiating.
A probable reason to explain why vial A had better morphology in the earlier stages of its
growth was probably because vial A was of better quality during cryopreservation compared
to vials B and C.
Figure 20: The cells from vial A, taken approximately at the same time as vials B and C after thawing.
The presence of neuronal morphology, fine cell processes and clear media suggests healthy cell
growth.
5.2.4. MTT assay
The MTT assay is a cell proliferation and viability assay and was used for the following
toxicological testing. The rate of tetrazolium reduction was proportional to the rate of cell
proliferation, and tetrazolium reduction produces a violet hue which can be determined
through fluorescence analysis, at the absorbance of 570nm. Higher violet hue equals to more
cell proliferation and viability.

55
MTT assay was done on all ten compounds to check for toxic effects on ATCC SH-SY5Y
cell viability after compound treatment and incubation for 24 hours. This was done to
investigate the cytotoxic effect of the compounds on the SH-SY5Y neuroblastoma cell line. If
any compounds exhibits high cytotoxic effects, the MTT assay would be able to identify and
visually see a range of concentrations where the cell would experience the toxic effects.
The test used to analyse the cell proliferation was the MTT assay. The rate of tetrazolium
reduction was proportional to the number of viable cells and tetrazolium reduction produces a
violet hue which can be determined through fluorescence analysis, at the absorbance of 570
nm. Higher violet hue equals to more cell proliferation and viability. This toxicological assay
aims to discover compounds that still retain 100% cell viability at their respective IC50
values.
5 x 10⁴ cells were used as the initial SH-SY5Y cell number for the MTT assay, as the results
tabulated in 4.2.1. showed that the wells seeded with 5 x 10⁴ cells produced more absorbance
at 570 nm than the wells seeded with 1 x 10⁵ cells. This relates to more viable cells, and
therefore translates to more accurate results.
The inhibitor that had attracted the most interest in the enzyme-based assay was 9, with the
lowest IC50 value of 3.97 µM, which also shows that it was the most potent. SH-SY5Y seeded
as 5 x 10⁴ cells exposed to 2.5 µM of 9 exhibited 100% viability in the toxicological assay.
However, the cells exposed to 10 and 5 µM of 9 showed 30.46 ± 8.565% and 46.17 ± 1.744%
viability respectively, which were both below 50% viability. This shows that 9 had safety
issues at these concentrations, but the safety at 3.97 µM, which was the IC50 of 9, cannot be
determined by these results alone.
If 9 was used as an AD treatment, it should not be used at a concentration greater than 5 µM.
The sudden drop in cell viability from 10 to 5 µM also suggests that could be a threshold
concentration which needs to be crossed for 9 before would be considered toxic to cells. As
stated in Results, the methyl at the X position of 9 formed a toluene with a benzene ring,
which was a toxic group. This could provide an explanation to the high cytotoxicity of 9 on
SH-SY5Y at 2.5 and 5 µM.
Few comparisons can be made between 3 and 9, which has similar groups at R but differed at
X. Compound 3 appeared to exert less cytotoxic effects on the SH-SY5Y cells at 10 and 5
µM according to table 6, but did not reach 100% viability at all concentrations. This confirms

56
our prediction that a toluene attached to the inhibitor is toxic to SH-SY5Y. However,
compound 3 also did not achieve sufficient potency in the initial screening to have its IC50
value measured.
As mentioned in Results, 1 has a much lower molecular weight (509.54) compared to 2
(553.59), so it was more likely to make it through the BBB. However, the toxicological assay
revealed that 1 was reducing cell viability of SH-SY5Y cells to about 50% at 10, 5 and 2.5
µM. This shows that 1, although it proved to be a relatively potent inhibitor compared to the
other compounds tested (IC50 = 5.65) together with a low molecular weight, it had a low
compatibility with a neural cell line like SH-SY5Y. This compound has potential safety
issues even at 2.5 µM, the lowest concentration and also presumably the safest on the cells.
Since 2.5 µM is lower than its IC50, it can be inferred that 1 can never achieve more than 50%
inhibition of BACE1 while showing no cytotoxic effects on SH-SY5Y.
Compound 10 also has the highest molecular weight of all the compounds, which makes it
hardest to penetrate the BBB, and was shown to have a high IC50, which correlates to a
weaker inhibitor. This compound was also shown to be cytotoxic to SH-SY5Y as it reduced
their viability to 50.00 ± 17.53% at 10 µM, which was very near its IC50 value (11.08 µM).
Therefore, this compound requires rectification in terms of safety, molecular weight and
potency to raise its potential to be developed into a drug lead.
Amongst compounds 3, 4, 5, 6 and 7, compound 7 had the strongest potency amongst all of
them (IC50 = 4.49 µM, initial screening = 72.27 ± 1.217%). Cells treated with 7 retained
100% cell viability even at 10 µM, which was much higher than its IC50. This was contrary to
9, which could not have its concentration increased beyond its IC50 value because it would
have not achieved 0% cytotoxicity. However, it can be said that although 9 cannot increase
its dose further than 2.5 µM in order to retain 100% cell viability, it is possible to increase the
concentration of 7 in order to reach inhibition levels much higher than its IC50. Compound 7
inhibits BACE1 at 103.80 ± 3.67% at 10 µM according to Table 3. This shows that 7 is a safe
and potent inhibitor.
However, the molecular weight of 7 was relatively high compared to 1, and therefore may
have problems passing the BBB. To test its ability to pass the BBB, polar surface area (PSA)
testing may be performed in future research and a value of less than 60 angstroms would be
required (Swahn et al., 2012). Another method that may be used is the MDR1 – MDCK assay

57
(Lerchner et al., 2010). Lipinski’s Rule of Five (ROF) method may be used in future research
to predict drug-like properties of this compound.
Amongst 3, 4, 5, 6 and 7, compound 5 had the weakest potency at % inhibition of 20.19 ±
0.7211%, and its effect on SH-SY5Y cell viability at 10, 5 and 2.5 µM were all under 100%.
Since the IC50 of 5 was not determined, the effect of cell viability at 50% BACE1 inhibition
cannot be determined reliably. However the only information that may be obtained here is
that at 3 µM, there was about 20% inhibition of BACE1, so at that level of inhibition, the cell
viability was not 100%. Assuming that cell viability decreases as more concentrations of 5
were exposed to them, and more of 5 equals to higher inhibition values, this compound would
never reach the level of 100% in vitro SH-SY5Y cell viability at its IC50 value, so therefore
has amongst the lowest possibility of being developed into a lead compound.
Compound 8 was unique for not having any elements present on the residues other than
aromatic rings at both R and X. The IC50 of this compound was found to be 12.02 µM, which
was relatively high and therefore not potent compared to other tested compounds. Cells
treated with 10, 5 and 2.5 µM of 8 did not retain 100% cell viability. Since the IC50 value of 8
was not in the range measured in the toxicological assay, the percentage of cell viability at its
IC50 cannot be determined reliably. However, assuming that an increase of its concentration
equals to both higher BACE1 inhibition levels and lower cell viability, it may also be
assumed that 8 cannot attain 50% inhibition at 100% in vitro SH-SY5Y cell viability. This is
also evidence that having only aromatic rings at both R and X is detrimental to the potency of
inhibitors against BACE1.
In conclusion, it was found that compound 7 shows no apparent cytotoxicity in the MTT
method on SH-SY5Y while at its IC50, while an increase to 10 µM increases its inhibition on
BACE1 to 100% while still not producing any visible cytotoxicity. Compound 9 shows a low
and potent IC50 but could not attain 100% inhibition of BACE1 at higher concentrations
because of cytotoxic effects measured in the MTT assay. Based on the correlation of low
potencies of compounds 8, 10 and 2 against BACE1 with large S3’ and S4’ sub-site binding
residues, it was hypothesised that both these sub-sites were of limited size while increasing
the size of the residues further would be detrimental to the inhibitor’s potency.
Compound 1 was slightly behind in terms of IC50 but its low molecular weight could have
advantages such as passing the BBB more efficiently, which is an important feature for a
brain-targeting drug. Upon cross-examination of both 9 and 1, the methyl group present at the

58
X position may be the cause of the high potency and high cytotoxicity based on comparisons
between these two compounds alone. Future researchers may consider the addition of methyl
at the S3’ interacting residue on the compound for potency improvements. Based on the
relationship between the low potency of 8 with the presence of only aromatic residues
interacting with both the S3’ and S4’ sub-sites, it was also hypothesised that having aromatic
rings alone in an inhibitor of BACE1 was detrimental to its potency.
A possible way to improve the binding efficiency of the compounds with BACE1 is the usage
of molecular docking softwares to increase their potency into the nanomolar range. PSA and
drug-like properties may be predicted by the ROF method in the future. Enzyme-linked
immunoabsorbent assay (ELISA) could be used to monitor the cleavage of APP by BACE1
in SH-SY5Y cells transfected with mammalian expression vectors (eg. pcDNA3.1)
containing APP genes (eg. APPwt or APPswe genes) (Jämsä, 2011).
6. Conclusion
AD incidences are predicted to increase along with the rise in the amount of people reaching
above 65 years old. Accumulation of Aβ in plaques is one of the main pathological features
of AD and is produced by BACE1 through sequential cleavage of amyloid precursor protein
(APP). The prevention of the plaque formation is believed to slow the progression of AD, and
therefore BACE1 is an attractive target for AD drug development. However, BACE1
inhibitors normally lack the potency and PK properties and are amongst the reasons for the
absence of BACE1 inhibitors in the market.
BACE 1 was treated with ten potential non-peptidomimetic inhibitors using FRET method,
and their initial screening results was obtained, followed by an IC50 assay to determine their
IC50 values, while a positive control compound was also assayed for its IC50 value for
comparison. A toxicology assay using the MTT method was conducted on all compounds to
test their effects on cell viability on a neuroblastoma cell line SH-SY5Y. The SAR of the
compounds was also studied.
Compound 9 showed the most potent IC50 value of 3.97 µM and subsequent SAR analysis
revealed that thienyl and toluene groups in the S4’ and S3’ sub-sites respectively were
responsible for the high potency of 9 but could increase cytotoxicity. Compound 7 is both a
safe and potent inhibitor compared to other compounds tested, with the next potent IC50 value
of 4.49 µM and SH-SY5Y cells retained 100% viability after treatment at 10 µM. Compound

59
1 has low molecular weight has been linked to the light methyl group found at the S3’ sub-
site, and has also been correlated in this study with high potencies of the inhibitor against
BACE1. However, it may also have led to the detrimental cytotoxic effects on SH-SY5Y
cells that both compounds 1 and 9 exhibited in the MTT assay.
Based on SAR studies on individual compounds, it also was hypothesised that the sub-sites
S3’ and S4’ were of limited size and increasing the size of the residues further would be
detrimental to the inhibitor’s potency. The presence of only aromatic residues interacting
with both the S3’ and S4’ sub-sites was also hypothesised to reduce the potency of the
inhibitor.
Compound 7 was the likeliest to be a drug lead for AD treatment because of its high potency
and diminutive cytotoxicity. Further studies on the SAR of the compounds would further
elucidate its potential as a potent inhibitor with even higher potency. A possible approach is
to improve the binding efficiency of the residues with BACE1 by utilising molecular docking
softwares and thereby, lowering the IC50 from micromolar to nanomolar range. In order to
confirm the correlation of its enzyme-based assay results with Aβ reduction, ELISA could be
used to monitor the cleavage of APP that results in an increase in the production of
Alzheimer causing Aβ peptides.
7. References
Albert, G. Lawton and D. R. Witty, J. S., 2009. 4 Progress in the Development of β-secretase
Inhibitors for Alzheimer's Disease. Progress in Medicinal Chemistry, 48, pp. 133-161.
Arbel M, Yacoby I, Solomon B, 2005. Inhibition of amyloid precursor protein processing by
β-secretase through site-directed antibodies. Proc. Natl. Acad. Sci. USA, 102, pp. 7718-7723.
Armstrong, R. A., 2009. The molecular biology of senile plaques and neurofibrillary tangles
in Alzheimer's disease. Folia Neuropathol, 47(4), pp. 289-299.
Arumugam T. V., Chan S. L., Jo D. G. et al., 2006. Gamma secretase-mediated Notch
signaling worsens brain damage and functional outcome in ischemic stroke. Nature Med, 12,
pp. 621-623.
Bailey, J., et al., 2011. Functional activity of the novel Alzheimer's amyloid beta-peptide
interacting domain (AbetaID) in the APP and BACE1 promoter sequences and implications
in activating apoptotic genes and in amyloidogenesis. Gene, 488, pp. 13-22.

60
Brion J. P, 1998. Neurofibrillary tangles and Alzheimer's disease. Eur Neurol, 40(3), pp. 130-
140.
Brookmeyer, R., et al., 2007. Forecasting the global burden of Alzheimer's disease.
Alzheimers Dement, 3(3), pp. 186-191.
Cao, X. and T. Sudhof, 2004. Dissection of amyloid-beta precursor protein-dependent
transcriptional transactivation. J Biol Chem, 279(23), pp. 24601 - 24611.
Capell A, Steiner H, Willem M, Kaiser H, Meyer C, Walter J, Lammich S, Multhaup G,
Haass C J, 2000. Maturation and pro-peptide cleavage of beta-secretase. J Biol Chem,
275(40), pp. 30849-30854.
Chang, W.P., et al., 2004. In vivo inhibition of Abeta production by memapsin 2 (beta-
secretase) inhibitors. J Neurochem, 89, pp. 1409-1416.
Cherry, L. M., et al., 1992. Gender differences and the interpretation of genetic instability in
Alzheimer's disease. Mutation Research/DNAging, 275(2), pp. 57-67.
Chong, Li et al., 2005. Stress in the brain: novel cellular mechanisms of injury linked to
Alzheimer's disease. Brain Research Reviews, 49(1), pp. 1-21.
Clarke B, E Demont, C Dingwall, R Dunsdon, A Faller, J Hawkins, I Hussain, D
MacPherson, G Maile, R Matico, P Milner, J Mosley, A Naylor, A O’Brien, S Redshaw, D
Riddell, P Rowland, V Soleil, K J. Smith, S Stanway, G Stemp, S Sweitzer, P Theobald, D
Vesey, D S. Walter, J Ward and G Wayne, 2008. BACE-1 inhibitors part 2: Identification of
hydroxy ethylamines (HEAs) with reduced peptidic character. Bioorganic & Medicinal
Chemistry Letters, 18, pp. 1017-1021.
Cole and Vassar, 2007. The Alzheimer’s disease β-scretase enzyme, BACE-1. Molecular
Neurodegeneration, 2, pp. 22.
Di Carlo, M., 2010. Beta amyloid peptide: from different aggregation forms to the activation
of different biochemical pathways. Eur Biophys J, 39, pp. 877-888.
Durham TB, Shepherd TA, 2006. Progress toward the discovery and development of
efficacious BACE inhibitors. Curr Opin Drug Discov Dev, 9, pp. 776-791.

61
Francis, R., et al., 2002. aph-1 and pen-2 are required for Notch pathway signaling, gamma-
secretase cleavage of betaAPP, and presenilin protein accumulation. Dev Cell, 3(1), pp. 85-
97.
Fukumoto H, Takahashi H, Tarui N, Matsui J, Tomita T, Hirode M, Sagayama M, Maeda R,
Kawamoto M, Hirai K, Terauchi J, Sakura Y, Kakihana M, Kato K, Iwatsubo T, Miyamoto
M., 2010. A noncompetitive BACE1 inhibitor TAK-070 ameliorates Aβ pathology and
behavioral deficits in a mouse model of Alzheimer’s disease. J Neurosci, 30, pp. 11157-
11166.
Gorfe, A. A. and A. Caflisch, 2005. Functional plasticity in the substrate binding site of beta-
secretase. Structure, 13(10), pp. 1487-1498.
He, W., et al., 2004. Reticulon family members modulate BACE1 activity and amyloid-beta
peptide generation. Nat Med, 10(9), pp. 959-965.
Hebert LE, Scherr PA, Bienias JL, et al, 2003. Alzheimer disease in the US population:
prevalence estimates using the 2000 census. Arch Neurol, 60(8), pp. 1119–1122.
Hemming, M. L., et al., 2009. "Identification of beta-secretase (BACE1) substrates using
quantitative proteomics." PLoS One, 4(12), pp. e8477.
Hong, L. and J. Tang, 2004. Flap position of free memapsin 2 (beta-secretase), a model for
flap opening in aspartic protease catalysis. Biochemistry, 43(16), pp. 4689-4695.
Hong L, Turner RT, Koelsch G, Shin D, Ghosh AK, Tang J, 2002. Crystal structure of
memapsin 2 (β-secretase) in complex with an inhibitor OM00-3. Biochemistry, 41, pp.
10963-10967.
Hu X, Hicks CW, He W, Wong P, Macklin WB, Trapp BD, Yan R., 2006. Bace1 modulates
myelination in the central and peripheral nervous system. Nat Neurosci, 9, pp. 1520-1525.
Hu X, He W, Diaconu C, Tang X, Kidd GJ, Macklin WB, Trapp BD, Yan R., 2008. Genetic
deletion of BACE1 in mice af ects remyelination of sciatic nerves. FASEB J, 22, pp. 2970-
2980.
Huang WH, Sheng R, Hu Y.Z., 2009. Progress in the development of nonpeptidomimetic
BACE1 inhibitors for Alzheimer's disease. Curr Med Chem, 16(14), pp. 1806-1820.

62
Hunter, S. and C. Brayne, 2012. Relationships between the amyloid precursor protein and its
various proteolytic fragments and neuronal systems. Alzheimers Res Ther, 4, pp. 10.
Hussain, I., et al., 2007. Oral administration of a potent and selective non-peptidic BACE-1
inhibitor decreases beta-cleavage of amyloid precursor protein and amyloid-beta production
in vivo. J Neurochem, 100, pp. 802-809.
Jämsä et al., 2011. BACE-1 inhibition prevents γ-secretase inhibitor evoked Aβ rise in human
neuroblastoma SH-SY5Y cells. Journal of Biomedical Science, 18, pp. 76.
Kammesheidt, F.M. Boyce, A.F. Spanoyannis, B.J. Cummings, M. Ortegon, C. Cotman, J.L.
Vaught, R.L. Leve, 1992. Deposition of / A4 immunoreactivity and neuronal pathology in
transgenic mice expressing the carboxyl-terminal fragment of the Alzheimer amyloid
precursor in the brain. Proc. Natl. Acad. Sci. USA, 89, pp. 10857–10861.
Kawahara M, Kuroda Y, 2000. Molecular mechanism of neurodegeneration induced by
Alzheimer’s betaamyloid protein: channel formation and disruption of calcium homeostasis.
Brain Res Bull, 53, pp. 389-397.
Khan, S. and I. B. Davies, 2008. Hypoxia and Alzheimer disease. CMAJ, 178(13), pp. 1687-
1688.
Kim DY, Carey BW, Wang H, Ingano LA, Binshtok AM, Wertz MH, Pettingell WH, He P,
Lee VM, Woolf CJ, Kovacs DM, 2007. BACE1 regulates voltage-gated sodium channels and
neuronal activity. Nat Cell Biol, 9, pp. 755-764.
Kim DY, Ingano LA, Carey BW, Pettingell WH, Kovacs DM, 2005. Presenilin/γ-secretase-
mediated cleavage of the voltage-gated sodium channel β2-subunit regulates cell adhesion
and migration. J Biol Chem, 280, pp. 23251-23261.
Kitazume S, Tachida Y, Oka R, Shirotani K, Saido TC, Hashimoto Y, 2001. Alzheimer’s β-
secretase, β-site amyloid precursor protein-cleaving enzyme, is responsible for cleavage
secretion of a Golgi-resident sialyltransferase. Proc Natl Acad Sci USA, 98, pp. 13554-13559.
Kitazume S, Nakagawa K, Oka R, Tachida Y, Ogawa K, Luo Y, Citron M, Shitara H, Taya
C, Yonekawa H, Paulson JC, Miyoshi E, Tanguchi N, Hashimoto Y, 2005. In vivo cleavage
of alpha 2,6-sialyltransferase by Alzheimer β-secretase. J Biol Chem, 280, pp. 8589-8595.

63
Kuhn PH, Marjaux E, Imhof A, De Strooper B, Haass C, Lichtenthaler SF, 2007. Regulated
intramembrane proteolysis of the interleukin-1 receptor II by α-, β-, and γ-secretase. J Biol
Chem, 282, pp. 11982-11995.
Lerchner A, R Machauer, C Betschart, S Veenstra, H Rueeger, C McCarthy, M T-Blomley,
A-L Jaton, S Rabe, S Desrayaud, A Enz, M Staufenbiel, P Paganetti, J-Ml Rondeau, U
Neumann, 2010. Macrocyclic BACE-1 inhibitors acutely reduce Ab in brain after po
application. Bioorganic and Medicinal Chemistry letters, 20, pp. 603–607.
Lichtenthaler SF, Dominguez DI, Westmeyer GG, Reiss K, Haass C, Saftig P, De Strooper B,
Seed B, 2003. The cell adhesion protein P-selectin glycoprotein ligand-1 is a substrate for the
aspartyl protease BACE1. J Biol Chem, 278, pp. 48713-48719.
Lisa Fredman, Ph.D., Bryan D. James, Ph.D., Tricia J. Johnson, Ph.D., Ken P. Scholz, Ph.D.,
and Jennifer Weuve, M.P.H., Sc.D., 2012. Alzheimer’s Disease Facts and Figures.
Alzheimer’s Association, 8(2).
Lisa Fredman, Ph.D., Bryan D. James, Ph.D., Tricia J. Johnson, Ph.D., Ken P. Scholz, Ph.D.,
and Jennifer Weuve, M.P.H., Sc.D., 2009. Alzheimer’s Disease Facts and Figures.
Alzheimer’s Association, volume 5(3), pp. 234-270
Li Q, Sudhof TC, 2004. Cleavage of amyloid-β precursor protein and amyloid-β precursor-
like protein by BACE1. J Biol Chem, 279, pp. 10542-10550.
Luo, X. and R. Yan, 2010. Inhibition of BACE1 for therapeutic use in Alzheimer's disease.
Int J Clin Exp Pathol, 3, pp. 618-628.
Machauer, R., et al., 2009. Macrocyclic peptidomimetic beta-secretase (BACE-1) inhibitors
with activity in vivo. Bioorg Med Chem Lett, 19, pp. 1366-1370.
Mackenzie, I. R., 1994. Senile plaques do not progressively accumulate with normal aging.
Acta Neuropathol, 87, pp. 520-525
Malamas MS, Robichaud A, Erdei J, Quagliato D, Solvibile W, Zhou P, Morris K, Turner J,
Wagner E, Fan K, Olland A, Jacobsen S, Reinhart P, Riddell D, Pangalos M, 2010. Design
and synthesis of aminohydantoins as potent and selective human beta-secretase (BACE1)
inhibitors with enhanced brain permeability. Bioorg Med Chem Lett, 20, pp. 6597-6605.

64
Maloney, B. and D. Lahiri, 2011. The Alzheimer's amyloid beta-peptide (Abeta) binds a
specific DNA Abeta-interacting domain (AbetaID) in the APP, BACE1, and APOE
promoters in a sequence-specific manner: characterizing a new regulatory motif. Gene, 488,
pp. 1-12.
Marcinkeviciene J, Luo Y, Graciani NR, Combs AP, Copeland RA J., 2001. Mechanism of
Inhibition of beta-site amyloid precursor protein-cleaving enzyme (BACE) by a statine-based
peptide. J Biol Chem, 276(26), pp. 23790-23794.
Meredith, J., et al., 2008. P-glycoprotein efflux and other factors limit brain amyloid beta
reduction by beta-site amyloid precursor protein-cleaving enzyme 1 inhibitors in mice. J
Pharmacol Exp Ther, 326, pp. 502-513.
Michelle A. Christensen, Weihui Zhou, Hong Qing, Anna Lehman, Sjaak Philipsen, Weihong
Song, 2004. Mol Cell Biol, 24(2), pp. 865–874.
M Bäck, J Nyhlén, I Kvarnström, S Appelgren, N Borkakoti, K Jansson, J Lindberg, S
Nyström, A Hallberg, Å Rosenquist, B Samuelsson, 2008. Design, synthesis and SAR of
potent statine-based BACE-1 inhibitors: Exploration of P1 phenoxy and benzyloxy
residues. Bioorganic and Medicinal Chemistry letters, 16, pp. 9473-9475.
Mihailovich, M., et al., 2007. Complex translational regulation of BACE1 involves upstream
AUGs and stimulatory elements within the 5' untranslated region. Nucleic Acids Res, 35(9),
pp. 2975-2985.
Nishitomi, K., et al., 2006. BACE1 inhibition reduces endogenous Abeta and alters APP
processing in wild-type mice. J Neurochem, 99, pp. 1555-1563.
Pastorino L, Ikin AF, Lamprianou S, Vacaresse N, Revelli JP, Platt K, Paganetti P Mathews
PM, Harroch S, Buxbaum JD, 2004. BACE (β-secretase) modulates the processing of APLP2
in vivo. Mol Cell Neurosci, 25, pp. 642-649.
Pietrak B L., Crouthamel M-C, Tugusheva K, Lineberger J E., Xu M, DiMuzio J M., Steele
T, Espeseth A S., Stachel S J., Coburn C A.,. Graham S L, Vacca J P., Shi X-P., Simon A J.,
Hazuda D J., Lai M-T., 2005. Biochemical and cell-based assays for characterization of
BACE-1 inhibitors. Analytical Biochemistry, 342, pp. 144-151.

65
Plassman BL, Langa KM, Fisher GG, et al., 2007. Prevalence of dementia in the United
States: the aging, demographics, and memory study. Neuroepidemiology, 29(1–2), pp. 125-32
Rakover I, Arbel M, Solomon B: Immunotherapy against APP β-secretase cleavage site
improves cognitive function and reduces neuroinflammation in Tg2576 mice without a
significant effect on brain aβ levels. Neurodegener Dis, 4, pp. 392-402.
Reisberg, B., Borenstein, J., Salob, S. P., Ferris, S. H., Franssen, E., & Georgotas, A., 1987.
Behavioral symptoms in Alzheimer's disease: phenomenology and treatment. J Clin
Psychiatry, 48, pp. 9-15.
Richard, F. and P. Amouyel, 2001. Genetic susceptibility factors for Alzheimer's disease.
European Journal of Pharmacology, 412(1), pp. 1-12.
Rossner, S., et al., 2001. Neuronal and glial beta-secretase (BACE) protein expression in
transgenic Tg2576 mice with amyloid plaque pathology. J Neurosci Res, 64, pp. 437-446.
Sankaranarayanan S, Holahan MA, Colussi D, Crouthamel MC, Devanarayan V, Ellis J,
Espeseth A, Gates AT, Graham SL, Gregro AR, Hazuda D, Hochman JH, Holloway K, Jin L,
Kahana J, Lai MT, Lineberger J, McGaughey G, Moore KP, Nantermet P, Pietrak B, Price
EA, Rajapakse H, Stauffer S, Steinbeiser MA, Seabrook G, Selnick HG, Shi XP, Stanton
MG, Swestock J, et al., 2009. First demonstration of cerebrospinal fluid and plasma Aβ
lowering with oral administration of a β-site amyloid precursor protein-cleaving enzyme 1
inhibitor in nonhuman primates. J Pharmacol Exp Ther, 328, pp. 131-140.
Sankaranarayanan S, Price EA, Wu G, Crouthamel MC, Shi XP, Tugusheva K, Tyler KX,
Kahana J, Ellis J, Jin L, Steele T, Stachel S, Coburn C, Simon AJ, 2008. In vivo β-secretase 1
inhibition leads to brain Aβ lowering and increased α-secretase processing of amyloid
precursor protein without effect on neuregulin-1. J Pharmacol Exp Ther, 324, pp. 957-969.
Schenk D, Barbour R, Dunn W, Gordon G, Grajeda H, Guido T,Hu K, Huang J, Johnson
Wood K, Khan K, Kholodenko D, Lee M, Liao Z,Lieberburg I, Motter R, Mutter L, Soriano
F, Shopp G, Vasquez N,Vendevert C, Wogulis SM, Yednock T, Games D, Suebert P, 1999.
Immunization with amyloid-β attenuates Alzheimer-disease-like pathology in the PDAPP
mouse. Nature 400, pp. 173–177.
Schilling, S., et al., 2008. Glutaminyl cyclase inhibition attenuates pyroglutamate Abeta and
Alzheimer's disease-like pathology. Nat Med, 14, pp. 1106-1111.
66
Schroeter EH, Kisslinger JA, Kopan R, 1998. Notch-1 signalling requires ligand-induced
proteolytic release of intracellular domain. Nature, 393, pp. 382–386.
Selkoe, D., 2001. Alzheimer's disease: genes, proteins, and therapy. Physiol Rev 81(2), pp.
741-766.
Serrano-Pozo, A., et al., 2011. Neuropathological alterations in Alzheimer disease. Cold
Spring Harb Perspect Med, 1(1), pp. 6-189.
Sevalle, J., et al., 2009. Aminopeptidase A contributes to the N-terminal truncation of
amyloid beta-peptide. J Neurochem, 109, pp. 248-256.
Silvestri R, 2009. Boom in the development of non-peptidic beta-secretase (BACE1)
inhibitors for the treatment of Alzheimer’s disease. Med Res Rev, 29, pp. 295-338.
Sinha S, Anderson JP, Barbour R, Basi GS, Caccavello R, Davis D, Doan M, Dovey HF,
Frigon N, Hong J, Jacobson-Croak K, Jewett N, Keim P, Knops J, Lieberburg I, Power M,
Tan H, Tatsuno G, Tung J, Schenk D, Seubert P, Suomensaari SM, Wang S, Walker D, Zhao
J, McConlogue L, John V, 1999. Purification and cloning of amyloid precursor protein β-
secretase from human brain. Nature, 402, pp. 537-540.
Skovronsky, D., et al., 2000. Protein kinase C-dependent alpha-secretase competes with beta-
secretase for cleavage of amyloid-beta precursor protein in the trans-golgi network. J Biol
Chem, 275(4), pp. 2568-2575.
Sondecker, J., et al., 2005. Blood-brain barrier and Alzheimer's. Psychiatry 2(6), pp. 18-19.
Stefanova, E., et al., 2012. Vascular risk factors in Alzheimer's disease — Preliminary report.
Journal of the Neurological Sciences, 322(1–2), pp. 166-169.
St George-Hyslop, P., 2000. Molecular genetics of Alzheimer's disease. Biol Psychiatry, 47,
pp. 183-199.
Sun X., He G., Qing H., Zhou W., Dobie F., Cai F., Staufenbiel M., Huang L. E. and Song
W., 2006. Hypoxia facilitates Alzheimer’s disease pathogenesis by up-regulating BACE1
gene expression. Proc. Natl Acad. Sci. USA, 103, pp. 18727-18732.
Swahn B-M, J Holenz, J Kihlström, K Kolmodin, J Lindström, N Plobeck, D Rotticci, F
Sehgelmeble, M Sundström, S von Berg, J Fälting, B Georgievska, S Gustavsson, J

67
Neelissen, E Mageretta, L-L Olsson, S Berg, 2012. Aminoimidazoles as BACE-1 inhibitors:
The challenge to achieve in vivo brain efficacy. Bioorganic and Medicinal Chemistry
letters, 22, pp.1854-1859.
Takasugi, N., et al., 2003. The role of presenilin cofactors in the gamma-secretase complex.
Nature, 422(6930), pp. 438-441.
Tamagno E., Guglielmotto M., Aragno M. et al., 2008. Oxidative stress activates a positive
feedback between the gamma- and beta-secretase cleavages of the beta-amyloid precursor
protein. J. Neurochem, 104, pp. 683–695.
Truong AP, Toth G, Probst GD, Sealy JM, Bowers S, Wone DW, Dressen D, Hom RK,
Konradi AW, Sham HL, Wu J, Peterson BT, Ruslim L, Bova MP, Kholodenko D, Motter
RN, Bard F, Santiago P, Ni H, Chian D, Soriano F, Cole T, Brigham EF, Wong K, Zmolek
W, Goldbach E, Samant B, Chen L, Zhang H, Nakamura DF, et al., 2010. Design of an orally
efficacious hydroxyethylamine (HEA) BACE-1 inhibitor in a preclinical animal model.
Bioorg Med Chem Lett, 20, pp. 6231-6236.
Valerio, A., et al., 2006. NF-kappaB pathway: a target for preventing beta-amyloid (Abeta)-
induced neuronal damage and Abeta42 production. Eur J Neurosci, 23, pp. 1711-1720.
Vassar, R., et al., 1999. Beta-secretase cleavage of Alzheimer's amyloid precursor protein by
the transmembrane aspartic protease BACE. Science 286(5440), pp. 735-741.
Vassar and Kandalepas, 2011. The β-secretase enzyme BACE1 as a therapeutic target for
Alzheimer’s disease. Alzheimer’s Research & Therapy, 2011, 3(3), pp. 20
von Arnim CA, Kinoshita A, Peltan ID, Tangredi MM, Herl L, Lee BM, Spoelgen R, Hshieh
TT, Ranganathan S, Battey FD, Liu CX, Bacskai BJ, Sever S, Irizarry MC, Strickland DK,
Hyman BT, 2005. The low density lipoprotein receptor-related protein (LRP) is a novel β-
secretase (BACE1) substrate. J Biol Chem, 280, pp. 17777-17785.
Walsh, D., et al., 2002. Naturally secreted oligomers of amyloid beta protein potently inhibit
hippocampal long-term potentiation in vivo. Nature, 416, 535-539.
Wolfe, M., et al., 1999. Are presenilins intramembrane-cleaving proteases? Implications for
the molecular mechanism of Alzheimer's disease. Biochemistry 38(35), pp. 11223-11230.

68
Wolfe, M., et al., 1999. Two transmembrane aspartates in presenilin-1 required for presenilin
endoproteolysis and gamma-secretase activity. Nature, 398(6727), pp. 513-517.
Wong HK, Sakurai T, Oyama F, Kaneko K, Wada K, Miyazaki H, Kurosawa M, De Strooper
B, Saftig P, Nukina N, 2005. β Subunits of voltage-gated sodium channels are novel
substrates of β-site amyloid precursor protein-cleaving enzyme (BACE1) and γ-secretase. J
Biol Chem, 280, pp. 23009-23017.
Willem M, Garratt AN, Novak B, Citron M, Kaufmann S, Rittger A, DeStrooper B, Saftig P,
Birchmeier C, Haass C, 2006. Control of peripheral nerve myelination by the β-secretase
BACE1. Science, 314, pp. 664-666.
Yu, G., et al., 2000. Nicastrin modulates presenilin-mediated notch/glp-1 signal transduction
and bAPP processing. Nature 407(6800), pp. 48-54.
Zhang X., Zhou K., Wang R., Cui J., Lipton S. A., Liao F. F., Xu H. and Zhang Y. W.,
2007. Hypoxia inducible factor 1alpha (HIF-1alpha)-mediated hypoxia increases BACE1
expression and beta-amyloid generation. J. Biol. Chem, 282, pp. 10873-10880.
Zhou L, Chavez-Gutierrez L, Bockstael K, Sannerud R, Annaert W, May PC, Karran E, De
Strooper B, 2011. Inhibition of β-secretase in vivo via antibody binding to unique loops (D
and F) of BACE1. J Biol Chem, 286, pp. 8677-8687.
7.1 Websites
ATCC, 2013. MTT Cell Proliferation Assay [Online]. Available from:
http://www.atcc.org/Portals/1/Pdf/30-1010k.pdf [Accessed 16 January 2013].
Calbiochem®, 2013, β-Secretase Inhibitor IV [Online], Avaliable from:
http://www.emdmillipore.com/life-science-research/beta-secretase-inhibitor-iv/EMD_BIO-
565788/p_lyeb.s1LUxgAAAEWxWEfVhTm?WFSimpleSearch_NameOrID=565788&Back
ButtonText=search+results [Accessed 16 January 2013]
HBO, 2013. The stages of Alzheimer's Disease [Online]. Available
from: http://www.hbo.com/alzheimers/science-the-stages-of-alzheimers-disease.html
[Accessed 10 January 2013].
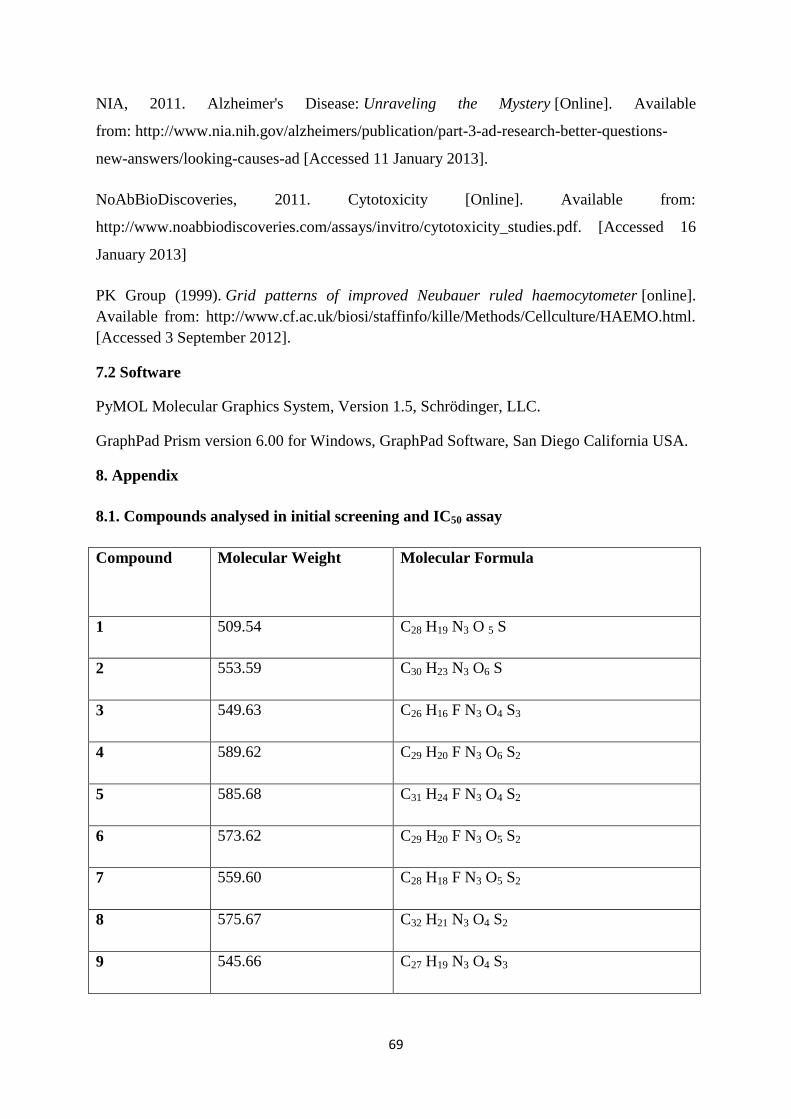
69
NIA, 2011. Alzheimer's Disease: Unraveling the Mystery [Online]. Available
from: http://www.nia.nih.gov/alzheimers/publication/part-3-ad-research-better-questions-
new-answers/looking-causes-ad [Accessed 11 January 2013].
NoAbBioDiscoveries, 2011. Cytotoxicity [Online]. Available from:
http://www.noabbiodiscoveries.com/assays/invitro/cytotoxicity_studies.pdf. [Accessed 16
January 2013]
PK Group (1999). Grid patterns of improved Neubauer ruled haemocytometer [online].
Available from: http://www.cf.ac.uk/biosi/staffinfo/kille/Methods/Cellculture/HAEMO.html.
[Accessed 3 September 2012].
7.2 Software
PyMOL Molecular Graphics System, Version 1.5, Schrödinger, LLC.
GraphPad Prism version 6.00 for Windows, GraphPad Software, San Diego California USA.
8. Appendix
8.1. Compounds analysed in initial screening and IC50 assay
Compound Molecular Weight Molecular Formula
1 509.54 C28 H19 N3 O 5 S
2 553.59 C30 H23 N3 O6 S
3 549.63 C26 H16 F N3 O4 S3
4 589.62 C29 H20 F N3 O6 S2
5 585.68 C31 H24 F N3 O4 S2
6 573.62 C29 H20 F N3 O5 S2
7 559.60 C28 H18 F N3 O5 S2
8 575.67 C32 H21 N3 O4 S2
9 545.66 C27 H19 N3 O4 S3

70
10 594.50 C28 H17 Cl2 N3 O4 S2
Table 7: The experimental numerical designations of the individual compounds tested in this
experiment.


![RESEARCHARTICLE OpAccess Transformer-C: nif A terpretation · 2020. 3. 18. · BCF Bioconcentrationfactor[47] 378 BACE Human-secretase1(BACE-1)inhibitors[46] 1513 FreeSolv Freesolvationenergy[46]](https://img.dokumen.tips/doc/110x75/6148dbf92918e2056c22f67d/researcharticle-opaccess-transformer-c-nif-a-terpretation-2020-3-18-bcf-bioconcentrationfactor47.jpg)