Embed Size (px)
Citation preview

This article was downloaded by: [University of Auckland Library]On: 16 October 2014, At: 17:03Publisher: Taylor & FrancisInforma Ltd Registered in England and Wales Registered Number:1072954 Registered office: Mortimer House, 37-41 Mortimer Street,London W1T 3JH, UK
International Journal ofMathematical Education inScience and TechnologyPublication details, including instructions forauthors and subscription information:http://www.tandfonline.com/loi/tmes20
Aspects of undergraduateengineering students'understanding ofmathematicsPETER GILLPublished online: 11 Nov 2010.
To cite this article: PETER GILL (1999) Aspects of undergraduate engineeringstudents' understanding of mathematics, International Journal ofMathematical Education in Science and Technology, 30:4, 557-563, DOI:10.1080/002073999287824
To link to this article: http://dx.doi.org/10.1080/002073999287824
PLEASE SCROLL DOWN FOR ARTICLE
Taylor & Francis makes every effort to ensure the accuracy of allthe information (the “Content”) contained in the publications on ourplatform. However, Taylor & Francis, our agents, and our licensorsmake no representations or warranties whatsoever as to the accuracy,completeness, or suitability for any purpose of the Content. Anyopinions and views expressed in this publication are the opinions andviews of the authors, and are not the views of or endorsed by Taylor& Francis. The accuracy of the Content should not be relied upon andshould be independently verified with primary sources of information.Taylor and Francis shall not be liable for any losses, actions, claims,proceedings, demands, costs, expenses, damages, and other liabilitieswhatsoever or howsoever caused arising directly or indirectly inconnection with, in relation to or arising out of the use of the Content.

This article may be used for research, teaching, and private studypurposes. Any substantial or systematic reproduction, redistribution,reselling, loan, sub-licensing, systematic supply, or distribution in anyform to anyone is expressly forbidden. Terms & Conditions of accessand use can be found at http://www.tandfonline.com/page/terms-and-conditions
Dow
nloa
ded
by [
Uni
vers
ity o
f A
uckl
and
Lib
rary
] at
17:
03 1
6 O
ctob
er 2
014

Asp e c ts o f u n d e rgrad u a te e n g in e e r i n g s tu d e n ts ’
u n d e rs ta n d in g of m ath e m a tic s
PETER GILLSchool of Education, King’s College London, Cornwall House, Waterloo Road, London
SE1 8WA, England. E-mail: [email protected]
(Received 7 April 1998; Revised 9 September 1998)
During the academic year 1995± 1996 a series of Mathematics Supporttutorials were held at King’s College London for ® rst-year undergraduates inengineering and science. The students were chosen as a result of theirperformance on a mathematics pre-test held during their ® rst week atuniversity. The test had been designed and used more than a decade agofor use with pre-university students. A comparison between the 1980s and1990s performance on the test is carried out and reasons for changessuggested. A further comparison is made between the engineering undergraduates’ performance on the pre-test and their scores on their later end-of-semester mathematics examination. This reveals a pattern indicating that an allround understanding of graphs on the pre-test predicted success on the latermathematics examination, despite an almost total lack of graph questions onthat examination. Reasons for this pattern are suggested and discussed.
1. In tro d u c ti on
During the last few years in the UK there have been a growing numberof worries about the mathematical di� culties experienced by students starting® rst degree courses in science and engineering [1± 4]. This is certainly not anew problem, nearly a quarter of a century ago mathematics lecturers atKing’s College London wrote `Many students of science subjects arrive atuniversity with little facility and less interest in mathematics’ when explainingtheir reasons for setting up extra mathematics tutorials [5] (see also [6, 7]).However, the nature and scale of the problem has almost certainly changed. Thereasons for this are complex but the most signi® cant ones include the huge increasein student numbers and the changing nature of the school curriculum. Themathematics department at King’s College London, working with the School ofEducation obtained funding to investigate the problem within King’s.
At the start of the academic year, a sample of students starting courses inengineering sat a test of mathematical competence. The results of this test werecompared with the results of other groups who had sat the test in the past and alsowith the sample students’ later performance in the university mathematicsexaminations. This paper describes and discusses those investigations.
International Journal of Mathematical Education in Science and TechnologyISSN 0020± 739X print/ISSN 1464± 5211 online Ñ 1999 Taylor & Francis Ltd
http: //www.tandf.co.uk/JNLS/mes.htmhttp: //www.taylorandfrancis.com/JNLS/mes.htm
int. j. math. educ. sci. technol., 1999, vol. 30, no. 4, 557± 563D
ownl
oade
d by
[U
nive
rsity
of
Auc
klan
d L
ibra
ry]
at 1
7:03
16
Oct
ober
201
4

2. Th e p re -te s t
The test had originally been developed by the author for use with students atthe pre-university stage [8]. It was multiple choice in format and contained itemswhich covered the ® elds of number work (e.g. fractions, indices, etc.), algebra (e.g.solving equations in one or two unknowns), word problems involving nonlinearproportionality, and graphical understanding including both the recognition ofgraph shapes and the handling of the equation of a straight line. Many of the itemscame from previously published work. In particular a set of problems developed inthe 1970s for use with technician trainees [9, 10] and other problems developed atthe same time for a national survey [11]. The nonlinear proportionality problemswere devised by the author and have been discussed in this journal in the past [12].Most of the graphical questions were also developed by the author based on a styleof curve recognition standard in science examinations at the time. Thus it can beclaimed that the test had a high validity within the limits set by the multiple choiceformat.
3. Th e m a th e m atic s c o u r s e a n d e xam in a tion
The ® rst-semester mathematics course for engineers is mainly centred oncalculus techniques but also covers topics such as inequalities and complexnumbers. The end-of-semester examination is typical of university mathematicsexaminations in that it has a wide choice of questions and a low pass mark.Signi® cant for this study is the overall look of the examinationÐ it was almostentirely algebraic with no apparent use of numbers other than as powers of 2 or 3.The only graph question involved sketching the graph of a function after obtainingits turning points by successive di� erentiation. Thus at the face value it seemed tobe testing very di� erent skills to the pre-test.
4. Th e Stu d e n ts
The recent increase in the number of students entering higher education in theUK has meant the recruitment of students with quali® cations that di� er from thetraditional academic. In the case of engineering this has meant vocational quali-® cations and it was the experience of King’s College that these students were themost likely to require extra help with their mathematics studies. Accordingly thepre-test was set to 45 ® rst-year undergraduates in the engineering department whowere entering the course with vocational (or other non-traditional) quali® cations inmathematics.
5. Th e an a ly s is
For all items on the pretest calculations were made of:
� Facility (percentage of students answering correctly).� Discrimination (correlation of the performance of an item with the whole
test) with respect to the pretest and with respect to the scores on the end ofsemester mathematics exam.
Reliability (as measured by the Kuder Richardson 20 formula [13]). A principalcomponents analysis was carried out on a subset of items and students.
558 P. Gill
Dow
nloa
ded
by [
Uni
vers
ity o
f A
uckl
and
Lib
rary
] at
17:
03 1
6 O
ctob
er 2
014

The mean scores of the students on the pre-test were compared with those ofother groups of students who had sat the test.
6. Re su l ts a n d d is c u s s io n
6.1. Comparisons of groups on the pre-testIn addition to the experimental group, results were available from the admin-
istration of the pre-test to the following groups:
(i) undergraduate chemists entering university at the same time as theexperimental group but without mathematics quali® cations beyond theage of sixteen and who would be considered to be mathematically twoyears behind the usual entrants to science and engineering courses(n = 29);
(ii) a group of students commencing undergraduate studies for a degree inprinting and packaging technology at a further education college in 1983.These students had an assortment of previous mathematical quali® cations,mostly vocational, and could be considered to be similar to the experi-mental group (n = 15);
(iii) a group of students studying science subjects in the ® rst year of GCEAdvanced level1 at a college of further education in 1983 (n = 44).
The mean scores of the groups are given in table 1.In a t-test of the di� erences of means at p < 0.05 there was no signi® cant
di� erence between the two 1995 groups (the experimental group of engineers, andthe chemists). However, these two groups di� ered signi® cantly from each of the1983 groups. In addition the di� erence of means between the two 1983 groups wasalso signi® cant.
The di� erences in scores over time were almost certainly a� ected by thefollowing factors:
� The test was designed in 1983 based on the then current school syllabusesand what could reasonably be expected from students who had followedthose courses. There have been many changes in UK school mathematicssyllabuses since then.
Engineering students’ understanding of mathematics 559
Pretest result (%)
Test group Mean S.D.
Engineering undergraduates 1995 (n = 45) 42 16Chemistry undergraduates 1995 (n = 29) 44 11Technology undergraduates 1983 (n = 15) 66 16A-level science students 1983 (n = 44) 54 14
Table 1
1 Before the recent increase in recruitment tohigher education in the UK the usual routeto university was by studying three subjects for two years after the compulsory schoolleaving age of sixteen years. The examinations in these subjects are called Advanced Level,generally referred to as A-levels and their original (although not sole) purpose was to act asuniversity entrance examinations.
Dow
nloa
ded
by [
Uni
vers
ity o
f A
uckl
and
Lib
rary
] at
17:
03 1
6 O
ctob
er 2
014
� The test was in multiple choice format which was not generally used in theUK at this time.
� Since the early 1980s the cohort from which new university entrants is drawnhas decreased in size by approximately 30%at a time when the recruitment tohigher education has doubled (for amore detailed analysis of these ® gures see[14]). In the light of these factors it can be seen that the decline in scoressince 1983 should have been expected.
The lack of signi® cant di� erence between the means of the two 1995 groups isprobably of more concern in that it casts doubts on the validity of the mathematicscontent of some vocational courses. The concern is wider because both thesyllabuses and examinations of these courses have high face validityÐ lookingvery similar to those of more academic courses. This ® nding is backed up at apragmatic level when considering a recent computer package designed speci® callyto reveal mathematics weaknesses of engineering undergraduates [15]. Thispackage sets questions to the students at a level of di� culty according to theirprevious quali® cations and it brackets together the UK 16+ examination (theGeneral Certi® cate of Secondary EducationÐ GCSE) and the supposedly highervocational quali® cations at the same level. How to cope with the changing math-ematical competences of incoming undergraduates is a major challenge for uni-versities but is beyond the scope of this paper.
6.2. Comparing the pre-test results with the later mathematics examinationSeveral of the students arrived late for the sitting of the pre-test and thus failed
to ® nish. The paper was designed as a power test rather than a speed test so theirresults were discarded from the analysis giving a sample size of n = 39.
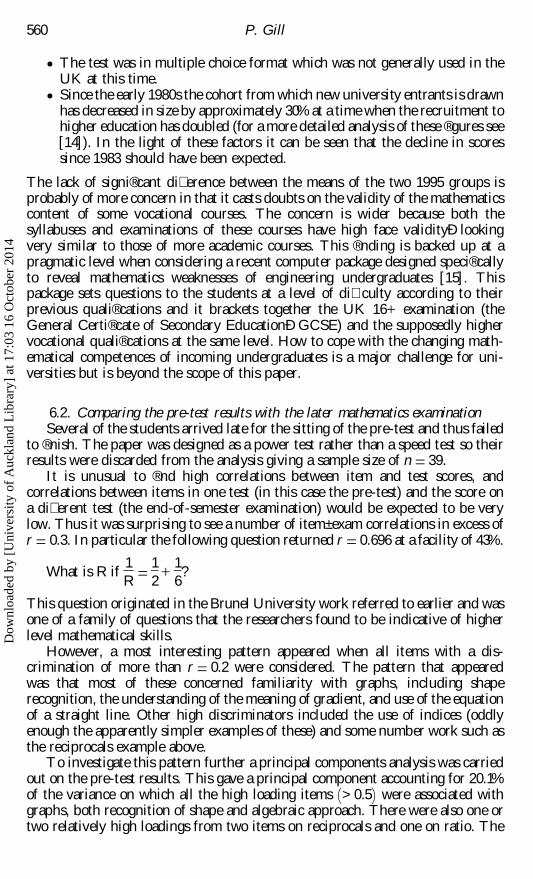
It is unusual to ® nd high correlations between item and test scores, andcorrelations between items in one test (in this case the pre-test) and the score ona di� erent test (the end-of-semester examination) would be expected to be verylow. Thus it was surprising to see a number of item± exam correlations in excess ofr = 0.3. In particular the following question returned r = 0.696 at a facility of 43%.
What is R if1R =
12
+16?
This question originated in the Brunel University work referred to earlier and wasone of a family of questions that the researchers found to be indicative of higherlevel mathematical skills.
However, a most interesting pattern appeared when all items with a dis-crimination of more than r = 0.2 were considered. The pattern that appearedwas that most of these concerned familiarity with graphs, including shaperecognition, the understanding of the meaning of gradient, and use of the equationof a straight line. Other high discriminators included the use of indices (oddlyenough the apparently simpler examples of these) and some number work such asthe reciprocals example above.
To investigate this pattern further a principal components analysis was carriedout on the pre-test results. This gave a principal component accounting for 20.1%of the variance on which all the high loading items (> 0.5) were associated withgraphs, both recognition of shape and algebraic approach. There were also one ortwo relatively high loadings from two items on reciprocals and one on ratio. The
560 P. Gill
Dow
nloa
ded
by [
Uni
vers
ity o
f A
uckl
and
Lib
rary
] at
17:
03 1
6 O
ctob
er 2
014

second component (8.9%variance) was bipolar (as is usual in this sort of analysis)with arithmetic/number at one end and wordy questions at the other. The thirdfactor (6.9%variance) seemed to be associated with the remembrance of standardrules and algorithms. The rest of the factors had no immediately obviousstructures.
Now it is never safe to rely solely on factor analyses but both the PrincipalComponents analysis and the investigation of the discriminatory power of thepretest questions for the end-of-semester examination indicated a similar pattern,i.e. the importance and coherence of the understanding of di� erent graphicalproblems. This is remarkable for at least two reasons:
(i) The skills of graph recognition on the one hand, and of the use of therelated algebra on the other would generally be considered to be verydi� erent. To ® nd them together as part of an apparently single construct ismost unusual.
(ii) As pointed out above, the pre-test and end of semester examination werevery di� erent yet the pre-test, and in particular the graph questions had ahigh predictive validity.
Perhaps there is a clue in the presence of ratio and reciprocal questions on the ® rstfactor. Clearly the understanding of the concept of gradient is a ratio skill, and itcan be argued that this extends to its role in interpreting the shapes of sketchgraphs. There have been a number of theories of mathematical understandingwhich place the understanding of ratio and proportion at the highest level. Thebest known of these is probably Piaget’s Formal Operations [16]. Other morerecent work includes the Mathematical Inference Factor discovered at BrunelUniversity as a result of the work with technician trainees and others referred toabove, although it has been argued elsewhere that the Inference Factor and FormalOperations are both re¯ ections of the same construct [8]. A similar result can beseen in the SOLO (Structure of Observed Learning Outcomes) taxonomyalthough both this and the work of Bruner [17] would ® nd di� culty with theclose association with the visual aspects of graph interpretation with the algebraicaspects. However, this may be answered by work in the ® eld of cognitive style.Riding [18] shows that there is a robust dimension which he names verbal-imagery. The scale separates thinkers who prefer a verbal representation of aproblem from these who prefer pictorial. However, when he investigated therelationship between sixteen-year-old students’ position on this (and another) scaleand their performance on national examinations in mathematics, English andFrench. It was seen that the most successful students were in the centre of theverbal-imagery scale [19], probably indicating an ability to employ either style atwill. This suggests that the principal component discovered in the study underdiscussion is due to an interaction between a cognitive element related to FormalOperations and a cognitive style element related to the verbal-imagery scale. Thishypothesis is currently under investigation.
There is a further complication in that there were a few students who had verylow scores on the pre-tests yet were successful at the end-of-semester examination.It is tempting to attribute this to the successful support teaching o� ered to allthose students who scored lowly on the pre-test. However, interviews held shortlybefore the end of semester revealed the continuing existence of severe misunder-standing at a basic level. For instance confusion between raising a number to a
Engineering students’ understanding of mathematics 561D
ownl
oade
d by
[U
nive
rsity
of
Auc
klan
d L
ibra
ry]
at 1
7:03
16
Oct
ober
201
4

power and multiplying it by a constant (e.g. x2 = 2x). The interviews alsorevealed that all the students were working at what has been called the surfacelevel [20]. In other words they were making no attempt to understand themathematics but were interested only in passing the examination. This castsdoubt on the validity of traditional university mathematics examinations(and indeed on all traditional mathematics examinations) but is hardly new orcon® ned to mathematics, for instance physics undergraduates’ lack ofunderstanding of the concept of force has been well documented and a televisedseries of interviews with Harvard science students on their graduation dayrevealed many of them to have no understanding of where plant material comesfrom [21].
7. Co n c lu s io n s
There is a construct of mathematical understanding related to theunderstanding of graphs and their slopes which may underly the ability tounderstand a number of higher order concepts. This research does not make itclear whether an integrated understanding of graphs is a result of a deeperunderstanding of mathematics or is a pre-requisite for the deeper understanding.However, it does o� er an opportunity for teachers to investigate their students’potential for success at their next stage of mathematical study. Teachers of pre-college mathematics would help their students by spending more time ensuringthat these underlying aspects are well understood.
Re fe r e n c e s[1] Barnard, A., and Saunders, P., 1994, The Guardian, Dec. 28.[2] Morgan, A. T., 1990, Int. J. Math. Educ. Sci. Technol. , 21, 975± 988.[3] O’Leary, J., 1995, The Times, March 3.[4] Sutherland, R., and Pozzi, S., 1995. The changing mathematical background of
undergraduate engineers: A review of the issues, 1995 (London: The EngineeringCouncil.)
[5] Baker, J., Crampin, M., and Nuttall, J., 1973, Int. J. Math. Educ. Sci. Technol., 4,
335± 339.[6] Elton, L. R. B., 1980, Eur. J. Sci. Educ., 2(1), 25± 44.[7] Gonzalez-Leon, E., 1980, Int. J. Math. Educ. Sci. Technol., 11(1), 88± 89.[8] Gill, P. N. G., 1985, Unpublished dissertation, Brunel University.[9] Furneaux, W. D., and Rees, R., 1976, The Dimensions of Mathematical Di� culties
(London: Brunel University Department of Education)[10] Furneaux, W. D., and Rees, R., 1978, Brit. J. Psychol. , 69, 507± 512.[11] Hart, K. (ed.), 1981, Childrens’ Understanding of Mathematics 11± 16 (London: John
Murray).[12] Gill, P. N. G., 1993, Int. J. Math. Educ. Sci. Technol., 24 , 365± 371.[13] Guilford, J. P., and Fruchter, B., 1981, Fundamental Statistics in Psychology and
Education (McGraw-Hill).[14] DfE, Science and MathsÐ A consultation paper on the supply and demand of newly
quali® ed young people, 1994 (London: DfE).[15] Teaching and Learning Technology Programme, Diagnosys, 1995.[16] Inhelder, B., and Piaget, J., 1958, The Growth of L ogical Thinking from Childhood to
Adolescence (London: Routledge &Kegan Paul.)[17] Bruner, J. S., 1966, Towards a Theory of Instruction (Cambridge, MA: Harvard
University Press).[18] Riding, R., and Cheema, I., 1991, Educ. Psychol., 11, 193± 215.
562 P. Gill
Dow
nloa
ded
by [
Uni
vers
ity o
f A
uckl
and
Lib
rary
] at
17:
03 1
6 O
ctob
er 2
014

[19] Riding, R., and Caine, T., 1993, Educ. Psychol., 13, 59± 67.[20] Entwistle, N., 1987, in Student L earningÐ Research in Education and Cognitive
Psychology, J. T. E. Richardson, M. W. Eysenk, and D. Warren Piper (eds) (MiltonKeynes, Society for Research in Higher Education, The Open University).
[21] Dickson, S., 1994, Simple Minds (London: BBC Videos for Education and Training).
Engineering students’ understanding of mathematics 563D
ownl
oade
d by
[U
nive
rsity
of
Auc
klan
d L
ibra
ry]
at 1
7:03
16
Oct
ober
201
4