Embed Size (px)
Citation preview

May 2008
NASA/TP-2008-215130
Aspects of Synthetic Vision Display Systems and the Best Practices of the NASA’s SVS Project Russell V. Parrish Genex Systems, LLC, Hampton, Virginia
Randall E. Bailey, Lynda J. Kramer, Denise R. Jones, Steven D. Young, Jarvis J. Arthur III, Lawrence J. Prinzel III, Louis J. Glaab, and Steven D. Harrah Langley Research Center, Hampton, Virginia
https://ntrs.nasa.gov/search.jsp?R=20080018605 2020-03-03T15:57:51+00:00Z

The NASA STI Program Office . . . in Profile
Since its founding, NASA has been dedicated to the advancement of aeronautics and space science. The NASA Scientific and Technical Information (STI) Program Office plays a key part in helping NASA maintain this important role.
The NASA STI Program Office is operated by Langley Research Center, the lead center for NASA’s scientific and technical information. The NASA STI Program Office provides access to the NASA STI Database, the largest collection of aeronautical and space science STI in the world. The Program Office is also NASA’s institutional mechanism for disseminating the results of its research and development activities. These results are published by NASA in the NASA STI Report Series, which includes the following report types:
• TECHNICAL PUBLICATION. Reports of
completed research or a major significant phase of research that present the results of NASA programs and include extensive data or theoretical analysis. Includes compilations of significant scientific and technical data and information deemed to be of continuing reference value. NASA counterpart of peer-reviewed formal professional papers, but having less stringent limitations on manuscript length and extent of graphic presentations.
• TECHNICAL MEMORANDUM. Scientific
and technical findings that are preliminary or of specialized interest, e.g., quick release reports, working papers, and bibliographies that contain minimal annotation. Does not contain extensive analysis.
• CONTRACTOR REPORT. Scientific and
technical findings by NASA-sponsored contractors and grantees.
• CONFERENCE PUBLICATION. Collected
papers from scientific and technical conferences, symposia, seminars, or other meetings sponsored or co-sponsored by NASA.
• SPECIAL PUBLICATION. Scientific,
technical, or historical information from NASA programs, projects, and missions, often concerned with subjects having substantial public interest.
• TECHNICAL TRANSLATION. English-
language translations of foreign scientific and technical material pertinent to NASA’s mission.
Specialized services that complement the STI Program Office’s diverse offerings include creating custom thesauri, building customized databases, organizing and publishing research results ... even providing videos. For more information about the NASA STI Program Office, see the following: • Access the NASA STI Program Home Page at
http://www.sti.nasa.gov • E-mail your question via the Internet to
[email protected] • Fax your question to the NASA STI Help Desk
at (301) 621-0134 • Phone the NASA STI Help Desk at
(301) 621-0390 • Write to:
NASA STI Help Desk NASA Center for AeroSpace Information 7115 Standard Drive Hanover, MD 21076-1320

National Aeronautics and Space Administration Langley Research Center Hampton, Virginia 23681-2199
May 2008
NASA/TP-2008-215130
Aspects of Synthetic Vision Display Systems and the Best Practices of the NASA’s SVS Project Russell V. Parrish Genex Systems, LLC, Hampton, Virginia
Randall E. Bailey, Lynda J. Kramer, Denise R. Jones, Steven D. Young, Jarvis J. Arthur III, Lawrence J. Prinzel III, Louis J. Glaab, and Steven D. Harrah Langley Research Center, Hampton, Virginia

Available from: NASA Center for AeroSpace Information (CASI) National Technical Information Service (NTIS) 7115 Standard Drive 5285 Port Royal Road Hanover, MD 21076-1320 Springfield, VA 22161-2171 (301) 621-0390 (703) 605-6000
Trade names and trademarks are used in this report for identification only. Their usage does not constitute an official endorsement, either expressed or implied, by the National Aeronautics and Space Administration.

iii
Abstract NASA’s Synthetic Vision Systems (SVS) Project conducted research aimed at
eliminating visibility-induced errors and low visibility conditions as causal factors in civil aircraft accidents while enabling the operational benefits of clear day flight operations regardless of actual outside visibility. SVS takes advantage of many enabling technologies to achieve this capability including, for example, the Global Positioning System (GPS), data links, radar, imaging sensors, geospatial databases, advanced display media and three dimensional video graphics processors. Integration of these technologies to achieve the SVS concept provides pilots with high-integrity information that improves situational awareness with respect to terrain, obstacles, traffic, and flight path. This paper attempts to emphasize the system aspects of SVS - true systems, rather than just terrain on a flight display - and to document from an historical viewpoint many of the best practices that evolved during the SVS Project from the perspective of some of the NASA researchers most heavily involved in its execution. The Integrated SVS Concepts are envisagements of what production-grade Synthetic Vision systems might, or perhaps should be in order to provide the desired functional capabilities that eliminate low visibility as a causal factor to accidents and enable clear-day operational benefits regardless of visibility conditions.

iv
Abbreviations and Acronyms ADAHRS Air Data Attitude Heading Reference System ADF Automatic Direction Finder ADS-B Automatic Dependent Surveillance Broadcast AESS Aerospace & Electronic Systems Society AGARD Advisory Group for Aerospace Research and Development AGL Above Ground Level AIAA American Institute of Aeronautics and Astronautics AMASS Airport Movement Area Safety System AOPA Aircraft Owners and Pilots Association ARC Ames Research Center ARIES Airborne Research Integrated Experiment System ARP Aerospace Recommended Practice ASDE Airport Surface Detection Equipment ATC Air Traffic Control ATIDS Airport surface Target IDentification System AVL Airport designator for Asheville, NC AvSP Aviation Safety Program CA Collision Avoidance CAB Commercial transports And Business jets CAMI Civil Aeronautical Medical Institute CAT Category CCFN Constant Color Fish-Net cd/m2 Candela / square meter CDI Course Deviation Indicator CDTI Cockpit Display of Traffic Information CEP Circular Error Probability CFIT Controlled Flight Into Terrain CGI Computer Generated Image ConITS Consolidated Information Technology Services CPDLC Controller-Pilot Data Link Communications CRA Cooperative Research Agreement CRT Cathode Ray Tube DEM Digital Elevation Model DFW Airport designator for Dallas/Fort Worth International Airport, TX DGPS Differential Global Positioning System DIME Database Integrity Monitoring Equipment DLRA Downward-Looking Radar Altimeter DME Distance Measuring Equipment DTED Digital Terrain Elevation Data EADI Electronic Attitude-Direction Indicator EBG Elevation-Based Generic EBGFN Elevation-Based Generic Fish-Net EFB Electronic Flight Bag EFIS Electronic Flight Information System EFVS Enhanced Flight Vision System
v
EGE Airport Designation for Eagle County Airport, CO EMM Electronic Moving Map ERP Eye Reference Point EVS Enhanced Vision System FAA Federal Aviation Administration FAR Federal Aviation Regulation FLAIM Forward-Looking Autonomous Integrity Monitoring FLIR Forward-Looking Infra-Red FMD Flight Management Displays FMS Flight Management System FOV Field Of View FTE Flight Technical Error ftL foot Lamberts GA General Aviation GC Ground Collision GHz Giga Hertz GLS Global Navigation Satellite System Landing System GNSS Global Navigation Satellite System GPS Global Positioning System GPSBR GPS Bi-static Radar H Horizontal Field of View HDD Head-Down Display HMI Hazardously Misleading Information HMTI Hazardous Misleading Terrain Information HSI Horizontal Situation Indicator HSCT High Speed Civil Transport HSR High-Speed Research HUD Head-Up Display Hz Hertz ICAO International Civil Aviation Organization IEEE Institute of Electrical and Electronics Engineers IIFDT Integrated Intelligent Flight Deck Technologies ILS Instrument Landing System IMC Instrument Meteorological Conditions in. Inches INS Inertial Navigation System IRS Inertial Reference System IRU Inertial Reference Unit IS&T Society for Imaging Science and Technology LaRC Langley Research Center LAAS Local Area Augmentation System LCD Liquid Crystal Display LEP Linear Error Probability LiDAR Light Detection And Ranging LORAN LOng RAnge Navigation LV AU Low-Visibility induced Aircraft Upset

vi
LVLASO Low Visibility Landing and Surface Operations LVLOC Low Visibility Loss Of Control MASPS Minimum Aviation System Performance Standards MF Minification Factor MMWR MilliMeter Wave Radar MOPS Minimum Operational Performance Standards MSL Mean Sea Level NAS National Airspace System NASA National Aeronautics and Space Administration NATO North Atlantic Treaty Organization Nav Navigation ND Navigation Display NDB Non-Directional Beacon nm Nautical Miles NOTAM NOtice To AirMen NTSB National Transportation Safety Board OTW Out The Window PC Personal Computer PF Pilot Flying PFD Primary Flight Display PFR Primary Flight Reference PHF Airport Designation for Newport News/Williamsburg International
Airport, VA PNF Pilot Not Flying RAIM Receiver Autonomous Integrity Monitor RCA Runway Conflict Alert RIAAS Runway Incursion Advisory and Alerting System (now known as
PathProx™) RIPS Runway Incursion Prevention System RMS Root Mean Square RNAV Area Navigation RNO Airport designator for Reno/Tahoe International Airport, NV RNP Required Navigation Performance ROA Airport designator for Roanoke Regional Airport, VA ROTO RollOut / Turn-Off RSM Runway Safety Monitor RTA Runway Traffic Alert RTCA Radio Technical Commission for Aeronautics RTO Rejected Take-Off SA Situation Awareness SAE Society of Automotive Engineers SBIR Small Business Innovation Research SHADE SHadow Detection and Extraction SOREV Surface Operations Research and Evaluation Vehicle SPIE International Society for Optical Engineering SPSE Society of Photographic Scientists and Engineers
vii
SRTM Space Shuttle Radar Topography Mission SV Synthetic Vision SV-AD Synthetic Vision Auxiliary Display SVDC Synthetic Vision Display Concepts SVS Synthetic Vision System TAWS Terrain Awareness and Warning System TCAS Traffic alert and Collision Avoidance System TIS-B Traffic Information Services - Broadcast T-NASA Taxiway Navigation And Situation Awareness system TOGA Take-Off / Go-Around USAF United States Air Force UTM Universal Transverse Mercator V Vertical Field of View VFR Visual Flight Rules VHF Very High Frequency VMC Visual Meteorological Conditions VOR VHF Omnidirectional Range navigation system VSD Vertical Situation Display WAAS Wide Area Augmentation System WAL Airport designator for Wallops Flight Facility, VA WGS84 World Geodetic System 1984 WOW Weight-On-Wheels Wx Weather WxR Weather Radar XVS eXternal Visibility System

viii
Table of Contents Abstract .............................................................................................................................iii Abbreviations and Acronyms ............................................................................................ iv List of Tables .......................................................................................................................x List of Figures .................................................................................................................... xi Executive Summary ............................................................................................................ 1 1. Introduction.......................................................................................................... 2 2. Background.......................................................................................................... 8 3. Synthetic Vision Systems .................................................................................. 12
3.1 System Aspects for Commercial Transports / Business Jets ............................ 12 3.1.1 Operational Uses in IMC .......................................................................... 13 3.1.2 HUD / Enhanced Vision Imaging Sensor Considerations ........................ 15 3.1.3 The Integrated SVS Concept .................................................................... 18
3.2 System Aspects for General Aviation Aircraft ................................................. 32 3.2.1 GA Operations (Off-Nominal VMC, Nominal IMC, Off-Nominal IMC, Enhanced) ................................................................................................................. 34 3.2.2 The Integrated GA SVS Concept.............................................................. 36
4. SVS Benefits...................................................................................................... 40 4.1 Commercial Transports / Business Jets ............................................................ 41
4.1.1 Safety Benefits .......................................................................................... 42 4.1.2 Operational Benefits ................................................................................. 43
4.2 General Aviation............................................................................................... 45 4.2.1 Safety Benefits .......................................................................................... 45 4.2.2 Operational Benefits ................................................................................. 47
5. Applications & Intended Function by Phases of Flight ..................................... 47 5.1 Commercial Transports / Business Jets ............................................................ 47
5.1.1 Take-off..................................................................................................... 48 5.1.2 Departure................................................................................................... 48 5.1.3 En route..................................................................................................... 49 5.1.4 Approach................................................................................................... 49 5.1.5 Landing / Flare / Touchdown.................................................................... 49 5.1.6 Go-Around ................................................................................................ 50 5.1.7 Rollout / Turn-off...................................................................................... 50 5.1.8 Surface Operations.................................................................................... 51
5.2 General Aviation............................................................................................... 51 5.2.1 Take-off..................................................................................................... 52 5.2.2 Cruise ........................................................................................................ 52 5.2.3 Landing ..................................................................................................... 53 5.2.4 Go-Around ................................................................................................ 54 5.2.5 Surface Operations.................................................................................... 54
6. SVS Best Practices............................................................................................. 54 6.1 Commercial Transports / Business Jets ............................................................ 55
6.1.1 Database.................................................................................................... 55 6.1.2 Flight Operations Displays ....................................................................... 64 6.1.3 Surface Operations Displays..................................................................... 92 6.1.4 Runway Incursion Prevention System...................................................... 99

ix
6.1.5 EVS Imagery........................................................................................... 101 6.1.6 Database Integrity Monitoring................................................................ 104 6.1.7 Hazard Detection Sensors ....................................................................... 110 6.1.8 The Integrated SVS Concept .................................................................. 113
6.2 General Aviation............................................................................................. 113 6.2.1 Display Considerations ........................................................................... 113 6.2.2 Database Depiction ................................................................................. 113 6.2.3 Flight Operations Considerations ........................................................... 115 6.2.4 Surface Operations Considerations......................................................... 122 6.2.5 Runway Incursion Prevention System.................................................... 122 6.2.6 Database Integrity Monitoring................................................................ 126
7. Concluding Remarks........................................................................................ 126 8. References........................................................................................................ 128

x
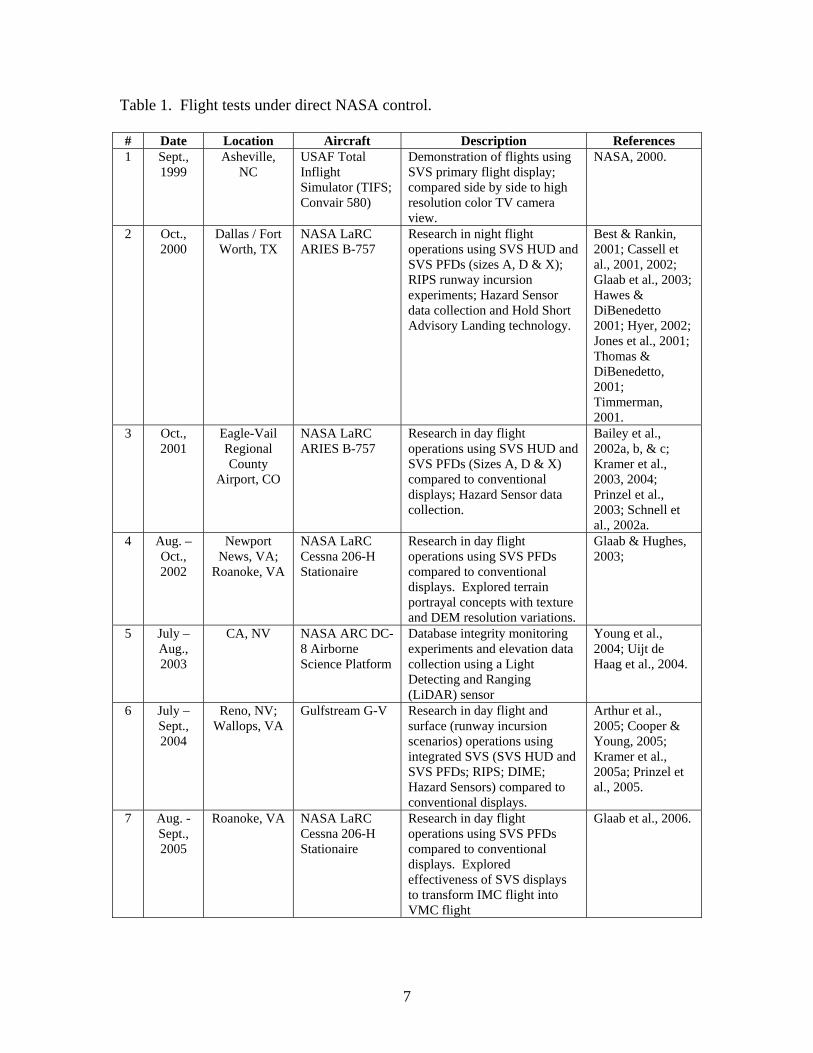
List of Tables Table 1. Flight tests under direct NASA control. .............................................................. 7 Table 2. Functions and technologies involved in the Integrated SVS System ................ 20 Table 3. Display size and available fields of view and Minification Factors (MFs) for
evaluation........................................................................................................... 82

xi
List of Figures Figure 1. Synthetic Vision System..................................................................................... 2 Figure 2. Example of SVS primary flight display and navigation display. ....................... 5 Figure 3. Early raster graphic presentation of an airport scene on a large screen
panoramic display............................................................................................. 10 Figure 4. Percentage of world jet transport aircraft cockpit display equipage. ............... 16 Figure 5. The Synthetic Vision HUD Concept. ............................................................... 16 Figure 6. Block diagram of Integrated SVS Concept for CAB aircraft with glass
cockpits............................................................................................................. 19 Figure 7. Image of Size-A display for 30 º FOV with photo-textured terrain, illustrating a
dial format. ....................................................................................................... 22 Figure 8. Image of Size-D display for 30 º FOV with photo-textured terrain, illustrating a
tape format........................................................................................................ 22 Figure 9. Conventional exocentric coplanar navigation display with TAWS. ................ 23 Figure 10. SVS coplanar navigation display with TAWS overlays. ............................... 23 Figure 11. Selectable 2-D coplanar and 3-D “situation awareness” (perspective view)
modes of SVS navigation display. .................................................................. 24 Figure 12. Rehearsal tool mode using SVS ND “situation awareness” format. .............. 25 Figure 13. SVS primary flight display and coplanar navigation display with
neighborhood traffic and ground obstacles..................................................... 26 Figure 14. Illustration of RIPS HUD landing/rollout deceleration guidance format (all
HUD symbology is monochrome green). ....................................................... 27 Figure 15. Illustration of RIPS HUD turn guidance format using non-conformal taxi
director symbology (all HUD symbology is monochrome green).................. 27 Figure 16. RIPS Electronic Moving Map (EMM). .......................................................... 28 Figure 17. RIPS runway conflict alert on SVS HUD, PFD, and EMM displays............. 29 Figure 18. Database Integrity Monitoring Equipment. .................................................... 30 Figure 19. The wire-frame display element of the SVS PFD. ......................................... 33 Figure 20. Block diagram of Basic SVS Concept for GA aircraft................................... 36 Figure 21. Block diagram of Enhanced SVS Concept for GA aircraft............................ 37 Figure 22. The GA Basic SVS PFD................................................................................. 39 Figure 23. The GA Basic SVS ND on approach to ROA................................................ 39 Figure 24. Round off effect of lower terrain resolution................................................... 57 Figure 25. RTCA-276 terrain and obstacle database requirements overview. ................ 57 Figure 26. Elevation-based color-coding with generic texturing (EBG) and photo-
realistic texturing of a Juno, AK DEM. .......................................................... 58 Figure 27. EGE flight activities aboard the NASA ARIES. ............................................ 60 Figure 28. The hybrid texturing method applied to the RNO database. .......................... 61 Figure 29. Fish-net grids embedded within into generic-textured and photo-realistic
textured databases of ROA. ............................................................................ 62 Figure 30. Views of the EGE airport property before and after bull-dozing and inserting
polygon models of the runway and airport buildings. .................................... 63 Figure 31. HUD tunnel used at RNO and WAL flight trials. .......................................... 67 Figure 32. The HDD minimal tunnel concept used at the EGE flight trials. ................... 67 Figure 33. The dynamic tunnel concept with some error. ............................................... 68 Figure 34. Outside the dynamic tunnel concept............................................................... 69
xii
Figure 35. Four tunnel color choices; Magenta, Green, White, Black. ........................... 70 Figure 36. Seven tunnel and halo thickness choices........................................................ 71 Figure 37. EGE RMS lateral and vertical path error over the entire approach path........ 72 Figure 38. Guidance symbols: Integrated cue “Ball” (left), “Tadpole” (center) and Ghost
aircraft (two perspectives, at right). ................................................................ 73 Figure 39. An SVS PFD showing neighborhood traffic. ................................................. 75 Figure 40. GA PFD with horizon line gapped about the velocity vector symbol............ 76 Figure 41. The coplanar view of the SVS ND during RNP procedures. ......................... 77 Figure 42. An example of a periphery symbology set for EVS imagery presentation on
the SV-AD, by CRA partner CMC Electronics, Inc. ...................................... 79 Figure 43. Definition of a conformal display’s horizontal and vertical FOVs, along with
the aspect ratio. ............................................................................................... 79 Figure 44. Image of ARINC Size-D display for 30º FOV, approximately 1.5 nm from a
DFW runway................................................................................................... 80 Figure 45. Image of ARINC Size-D display for 60º FOV for identical aircraft position,
approximately 1.5 nm from a DFW runway................................................... 80 Figure 46. DFW change of runway task. ......................................................................... 82 Figure 47. MF used in DFW change of runway transition task as function of the SVS
HDD size......................................................................................................... 83 Figure 48. MF used in DFW landing task as function of the SVS HDD size. ................ 83 Figure 49. Ease in determining aircraft position with respect to terrain with SVS
concepts compared to baseline EADI with TAWS display configuration. .... 84 Figure 50. Effect of changing the attitude angle of the light source from 45º to 67º in the
database image renderer.................................................................................. 88 Figure 51. SA-SWORD results from EGE flight test comparing statistically
discriminable SVS display concepts against baseline EADI with TAWS display configuration. ..................................................................................... 89
Figure 52. The dynamic “situation awareness” mode of the SVS ND. ........................... 90 Figure 53. Illustration of RIPS HUD symbology set for landing (all HUD symbology is
monochrome green). ....................................................................................... 93 Figure 54. Illustration of RIPS HUD symbology set for rollout (all HUD symbology is
monochrome green). ....................................................................................... 94 Figure 55. RIPS HUD taxi operations format, including non-conformal taxi director
symbology....................................................................................................... 95 Figure 56. Illustration of RIPS HUD symbology set for take-off (all HUD symbology is
monochrome green). ....................................................................................... 95 Figure 57. Runway closed symbology............................................................................. 96 Figure 58. RIPS overhead view of airport surface........................................................... 97 Figure 59. RIPS system overview.................................................................................. 100 Figure 60. RNO and WAL flight activities aboard the Gulfstream G-V....................... 103 Figure 61. The SHADE algorithm. ................................................................................ 106 Figure 62. Weather radar shadow diagram. ................................................................... 107 Figure 63. Segment of sample radial measurement and shadow edge features from
weather radar data. ........................................................................................ 107 Figure 64. SHADE results for three sample scans from DC-8 testing (a) WxR-derived
thread, (b) DEM-derived thread.................................................................... 109

xiii
Figure 65. The GPS Bi-static Radar (GPSBR) receiver utilizes GPS signals reflected from terrain. .................................................................................................. 110
Figure 66. NASA LaRC’s Cessna 206-H Stationaire.................................................... 114 Figure 67. GA conventional baseline round dial (BRD) display concept. .................... 115 Figure 68. GA constant color ground with a fish-net (CCFN) display concept. ........... 116 Figure 69. GA elevation based generic (EBG) SVS display concept............................ 116 Figure 70. GA elevation based generic with a fish-net (EBGFN) SVS display concept.......................................................................................................................................... 117 Figure 71. GA photo-realistic SVS display concept. ..................................................... 117 Figure 72. GA photo-realistic with a fish-net SVS display concept.............................. 118 Figure 73. GA pitch / roll dual cue (needles) flight director display concept. .............. 119 Figure 74. GA RMS lateral and vertical tracking error results...................................... 119 Figure 75. GA pitch / roll single cue flight director display concept. ........................... 120 Figure 76. GA Unconnected Box Tunnel display concept. ........................................... 120 Figure 77. GA Connected Box Tunnel with Sliding Box Guidance Cue display
concept. ......................................................................................................... 121 Figure 78. GA Crow’s Foot Tunnel with Ghost Aircraft display concept..................... 121 Figure 79. GA ND with TAWS implemented on an Mx-20 (on approach to ROA)..... 123 Figure 80. GA version on approach to RNO adapted from the CAB ND with
neighborhood traffic and TAWS overlays (not shown)................................ 123 Figure 81. Runway Incursion Rates from FAA Runway Safety Report, August, 2004.124 Figure 82. Runway Incursion by Severity Category from FAA Runway Safety Report,
July, 2003...................................................................................................... 125 Figure 83. GA RIPS overhead view of airport surface.................................................. 125

1
Executive Summary Within the National Aeronautics and Space Administration (NASA) Aviation Safety
Program (AvSP), the Synthetic Vision Systems Project has developed aircraft cockpit display system concepts to improve pilot awareness of the external environment by providing a perspective computer-generated view of the outside world. This synthetic view of the external environment is created by the use of on-board geospatial databases and precise aircraft attitude and positioning information computed by a Global Positioning System-based navigation system. This work was aimed at eliminating visibility-induced errors and low visibility conditions as causal factors in civil aircraft accidents while enabling the operational benefits of clear day flight operations regardless of the actual outside visibility condition. To meet all of these goals, Synthetic Vision (SV) must provide more than just a display of terrain information. In that regard, a Synthetic Vision System (SVS) takes advantage of many enabling technologies that, together, create an operational avionics system, including the display of the external environment, with independent, redundant information sources to enable substantially improved performance and enhanced operational capabilities. The independent informational elements form the basis for monitoring the dynamic flight environment and thereby supplement the synthetic world with real-time, direct measurement of the surrounding terrain, air / ground traffic and structures / obstacles / objects that are not within the databases. Integration of these enabling technologies into the SVS concept (a true system, rather than just terrain depiction on a Primary Flight Display) provides pilots with high-integrity real-time geo-referenced information that improves situational awareness with respect to terrain, obstacles, traffic, and flight path, both in the air and on the ground.
Numerous research and development activities have been conducted to evaluate, investigate, and assess technologies that can lead to operational and certified SV systems. From these works and through the cooperative efforts of industry, academia and the FAA, certified SVS display concepts could be operational in the very near future (some are already operational in the general aviation arena), providing quantifiable operational and safety benefits. This paper attempts to emphasize the system aspects of SVS - the fact that an SVS must be a true system, rather than just terrain on a flight display, in order to enable the full suite of potential safety and operational benefits envisioned. An additional emphasis is placed on the operational context for the utilization of SVS systems, and particularly on the specific intended functions of the SVS systems for individual flight applications. The primary thrust of the paper, however, is to document from an historical viewpoint many of the best practices, lessons-learned, and considerations that evolved during the SVS Project from the perspective of some of the NASA researchers most heavily involved in its execution. It does not purport to reflect the views of either industry or university participants, nor even those of all NASA researchers. In most instances, “best practices” is meant to be synonymous with “Recommended Practices” in the context of the vernacular of the Society of Automotive Engineers Aerospace Recommended Practice and International Civil Aviation Organization documents. However, there are a few exceptions, all of which are indicated as such, in which the Project selected an option or made a decision based on programmatic reasons rather than solely on research results. Many of the symbologies
2
used in the NASA SVS Project were never really evaluated for better alternatives, at least by the Project. For example, the flight path marker symbol varied from straight winged to gull winged rather routinely. Unless things obviously needed improvement, the Project invested its resources in other issues. The NASA Integrated Synthetic Vision System Concepts to be discussed in relation to those best practices do not exist as other than concepts. They illustrate what production-grade synthetic vision systems might, or perhaps should, be in order to achieve their potential to provide the safety of flight and operational efficiency of clear daylight operations, regardless of visibility conditions.
1. Introduction According to the definition advanced by the FAA in AC 120-29A, a Synthetic
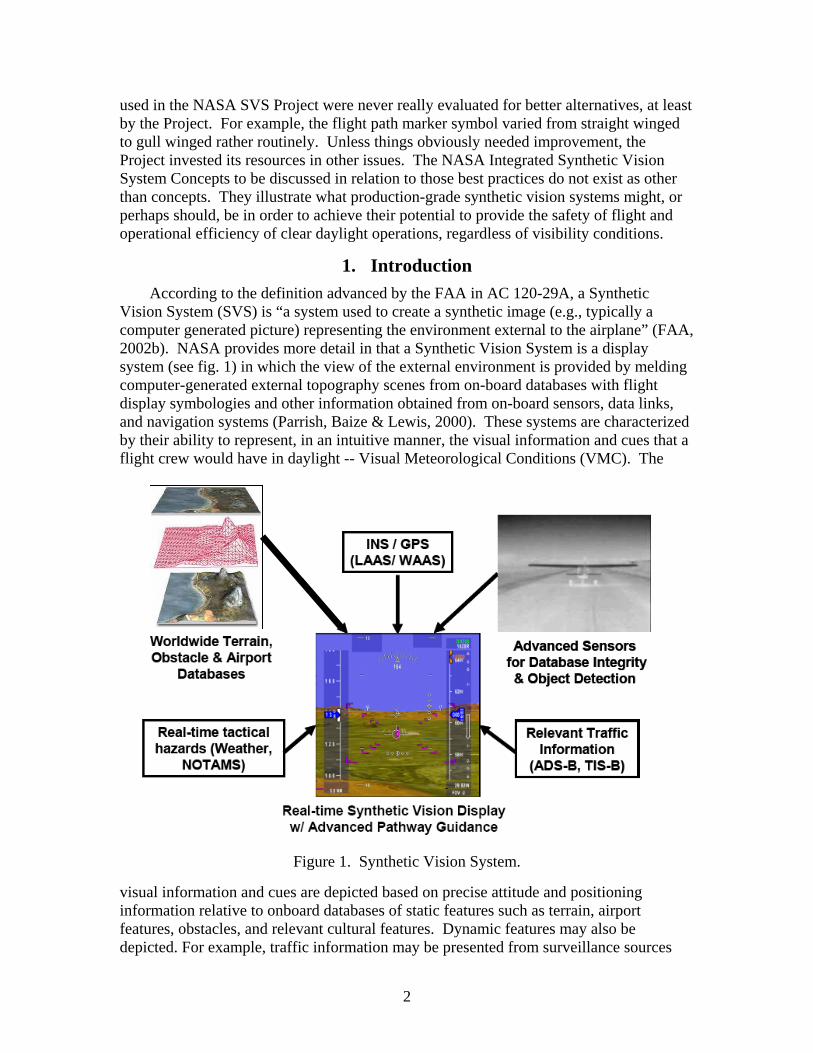
Vision System (SVS) is “a system used to create a synthetic image (e.g., typically a computer generated picture) representing the environment external to the airplane” (FAA, 2002b). NASA provides more detail in that a Synthetic Vision System is a display system (see fig. 1) in which the view of the external environment is provided by melding computer-generated external topography scenes from on-board databases with flight display symbologies and other information obtained from on-board sensors, data links, and navigation systems (Parrish, Baize & Lewis, 2000). These systems are characterized by their ability to represent, in an intuitive manner, the visual information and cues that a flight crew would have in daylight -- Visual Meteorological Conditions (VMC). The
Figure 1. Synthetic Vision System.
visual information and cues are depicted based on precise attitude and positioning information relative to onboard databases of static features such as terrain, airport features, obstacles, and relevant cultural features. Dynamic features may also be depicted. For example, traffic information may be presented from surveillance sources
3
such as Traffic Alerting and Collision Avoidance System (TCAS), Airport Surface Detection Equipment (ASDE), Automatic Dependent Surveillance – Broadcast (ADS-B), Traffic Information Services - Broadcast (TIS-B), and / or an Airport surface Target Identification System (ATIDS). Information derived from a weather-penetrating sensor by runway edge detection or object detection algorithms or with actual imagery from such a sensor, and other hazard information (such as wind shear) may be presented as well.
The SVS Project (1999-2005) was chartered to develop and support the implementation of SV systems for commercial transport, business jet, rotorcraft, and general aviation aircraft that would greatly improve aviation safety and efficiency of operations. The Project was to emphasize the cost-effective use of synthetic vision display concepts (both tactical and strategic), worldwide navigation, terrain, obstacle and airport feature databases, integrity monitoring and forward looking sensors as required, and Global Positioning System-derived navigation to eliminate visibility-induced accident precursors. To ensure wide-spread incorporation of SV technologies into the National Airspace System (NAS) fleet in order to achieve the envisioned safety benefits, operational credits for SVS equipage were to also be accentuated by developing and demonstrating enhanced operations.
A large majority of avionics systems introduced since the early days of flight (attitude indicators, radio navigation, instrument landing systems, etc.) have sought to overcome the issues resulting from limited visibility. Limited visibility is the single most critical factor affecting both the safety and capacity of aviation operations. In commercial aviation, over 30-percent of all fatal accidents worldwide are categorized as Controlled Flight Into Terrain (CFIT) - accidents in which a functioning aircraft impacts terrain or obstacles that the flight crew could not see (Boeing, 1998). In general aviation, the largest fatal accident category is also CFIT (FAA, 1997), although a further analysis of retractable gear single engine aircraft accident data by Lowell Foster of the FAA’s Small Aircraft Directorate (Foster, 1998) concluded that ‘loss of horizon for any reason – night, IMC, haze or low visibility’ was the top cause for accidents. Such a category would include ‘Continued Flight into Instrument Meteorological Conditions (IMC)’, in which low experience pilots continue to fly into deteriorating weather and visibility conditions and either collide with unexpected terrain or lose control of the vehicle because of the lack of familiar external cues. Of significant concern in Part 91, 135, and 121 operations is the problem of runway incursion incidents, which usually involve the same causal factors of restricted visibility and compromised situation awareness. In the U.S., runway incursions (a runway incursion is defined as any time a plane, vehicle, person or object on the ground creates a collision hazard with an airplane that is taking off or landing at an airport under the supervision of air traffic controllers) have increased substantially over the last decade. Although the number of reported occurrences, at an all-time high in Fiscal Year (FY) 2001 of 407 occurrences, have decreased (339 in FY 2002, 324 in FY 2003, 327 in FY 2004, and 324 in FY 2005), runway incursions are still a significant threat to aviation safety and operational efficiency (FAA, 2003; FAA, 2004; FAA, 2005a).
Finally, the single largest factor causing airport flight delays is the limited runway capacity, increased air traffic separation distances, and degraded airport surface operations efficiencies resulting when visibility conditions fall below those allowed for

4
visual flight rule (VFR) operations. SVS technology may provide a mitigation to this visibility problem with a visibility solution, providing the benefits of day-VMC operations during flights in IMC and / or night.
Initial attempts to solve the visibility problem with a visibility solution have utilized imaging sensors to enhance the pilot’s view of the outside world. Such a system is termed an “Enhanced Vision System (EVS)”, which, according to FAA (2002b), is “an electronic means to provide the flight crew with a sensor derived or enhanced image of the external scene (e.g., Millimeter wave radar, FLIR)”. EVS typically uses advanced sensors to penetrate weather phenomena such as darkness, fog, haze, rain, and / or snow, and the resulting enhanced scene is presented on a head-up display (HUD), through which the features of the external environment may become visible or at least more distinguishable by the pilot (Larimer et al., 1992). The sensor technologies involved include either active or passive radar or infrared systems of varying wavelengths. These systems have been the subject of experimentation for over three decades, and the military has successfully deployed various implementations. However, few sensor-based applications have seen commercial transport aircraft success for a variety of reasons, including cost, complexity, and technical performance in all-weather conditions. Although technology advances are making radar and infrared sensors more affordable, they still suffer from deficiencies for commercial applications, particularly when combined with the pragmatic difficulties of obtaining operational credit for equipage. High frequency radars (e.g., 94 GHz) and infrared sensors have degraded range performance in heavy rain and certain fog types. Low frequency (e.g., 9.6 GHz) and mid-frequency (e.g., 35 GHz) radars have improved range, but poor resolution. Active radar sensors also suffer from mutual interference issues with multiple users in close proximity. All such sensors also yield only monochromic information with potentially misleading visual artifacts in certain temperature or radar reflective environments.
By definition, SVS displays (see fig. 2) are unlimited in range, are unaffected by atmospheric conditions, and can provide a level of service constrained only by the accuracy of the on-board database, ownship positioning and attitude information, the fidelity of the display media, and the capabilities of the computer memory and processing resources. The rapid emergence of reliable Global Positioning System (GPS) position information and precise digital terrain models, including data from the Feb., 2000 Space Shuttle Radar Topography Mission (SRTM; Rabus et al., 2003), make this approach potentially capable of true all-weather performance as well as extremely low cost, low maintenance operations, although SVS too faces significant difficulties in obtaining operational credit for equipage. Applied to its fullest potential, SVS technologies should provide a revolutionary improvement in aviation safety and utility.
The SVS Project was to develop technologies with practical applications. Specifically, SVS research was intended to demonstrate substantially increased pilot situational awareness through the reduction of accident precursors associated with the loss of vertical and lateral spatial awareness, loss of terrain and traffic awareness on approach, unclear escape or go-around path, loss of attitude awareness, loss of situation awareness relating to the runway environment, and unclear path guidance on the surface that may otherwise lead to a runway incursion. In addition, SVS research was to show

5
Figure 2. Example of SVS primary flight display and navigation display.
how an increase in the efficiency of the NAS could be realized by allowing precision IMC operations to many more runways than the current ground infrastructure permits.
The SVS Project (Baize & Allen, 2001) began officially on October 1, 1999 (although initial activities such as planning workshops and preliminary technology assessment studies began in 1997), and concluded on September 30, 2005. Participation by a multitude of government, industry, and university researchers was broad, either under Cooperative Research Agreements (CRA) involving partner investments, or under other contractual and grant mechanisms. There were originally eight CRA teams, which included, with the team lead in bold:
BAE Systems Inc. (formerly Marconi Aerospace Systems, Inc.), CMC Electronics, Inc. (formerly Canadian Marconi Company) BAE Systems Astronics (formerly Marconi Astronics Corporation), and Nav3D Corporation;
Rockwell Collins, Inc., Jeppesen Sanderson, Inc, The Boeing Company, American Airlines, Delft University of Technology, Embry-Riddle Aeronautical University, Flight Dynamics, Inc., and University of Iowa;
AvroTec, Inc., Avidyne Corporation, Lancair International, Inc., Massachusetts Institute of Technology, Raytheon Aircraft Company, Seagull Technologies, Inc., and FAA Civil Aeronautical Medical Institute (CAMI);
Research Triangle Institute, Archangel Systems, Inc., Flight International, Inc., Seagull Technologies, Inc., Dubbs & Severino, Inc. Crew Systems, Inc., and FLIR Systems, Inc;
Jeppesen Sanderson, Inc., Marconi ADR, Darmstadt University of Technology, Allied Pilots Association, American Airlines, Alaska Airlines, Lufthansa German Airlines, and Marinvent Corporation;
Avionics Engineering Center of Ohio University;
6
Rannoch Corporation;
Seagull Technologies, Inc., LambCon, Rockwell Collins, Inc., Stanford University, and Raytheon Aircraft Company.
Prominent contractors working under other contractual mechanisms included The Boeing Company, Boeing Phantom Works, Cambridge Research Associates, ConITS Team (Raytheon Company; NCI Information Systems, Inc.; Analytical Services & Materials, Inc.; Aerospace Computing, Inc.; & Genex Systems, LLC.), Gulfstream Aerospace Corporation, Lockheed Martin Corporation, Logistics Management, Inc., Max-Viz, Inc., Research Triangle Institute, and Rockwell Collins, Inc.
Along with a multitude of analytical studies and flight simulation experiments (see reference list), the Project also conducted numerous flight tests, some of which were under the direction of either industry or university partners. Notable among those flight tests for the purposes of this paper were those conducted under direct NASA control (see Table 1). Those flights included the Project Kickoff Demonstration and Test of SVS Technology at Asheville, NC (AVL) aboard the Air Force Research Laboratory’s (operated by Calspan Corporation, formerly the Veridian Corporation) Total In-Flight Simulator (a modified Convair 580 designated as a NC-131H) in 1999; the Dallas-Fort Worth, TX experiment (DFW) aboard the NASA LaRC Airborne Research Integrated Experiment System (ARIES) B-757-200 in 2000; the Eagle, CO (EGE) experiment aboard the NASA LaRC ARIES B-757 in 2001; the Newport News, VA (PHF) and Roanoke, VA (ROA) experiment aboard the NASA LaRC Cessna 206-H Stationaire in 2002; the CA and NV sensor experiment aboard the NASA ARC DC-8 Airborne Science Platform in 2003; the Reno, NV (RNO) and Wallops, VA (WAL) experiment aboard the Gulfstream G-V in 2004; and the Roanoke, VA experiment aboard the NASA LaRC Cessna 206 in 2005.
This paper attempts to emphasize the system aspects of SVS - the fact that an SVS must be a true system, rather than just terrain on a flight display, in order to enable the full suite of potential safety and operational benefits envisioned. An additional emphasis is placed on the operational context for the utilization of SVS systems, and particularly on the specific intended functions of the SVS systems for individual flight applications. The primary thrust of the paper, however, is to document from an historical viewpoint many of the best practices, lessons-learned, and considerations that evolved during the project from the perspective of some of the NASA researchers most heavily involved in its execution. It does not purport to reflect the views of either industry or university participants, nor even those of all NASA researchers. In most instances, “best practices” is meant to be synonymous with “Recommended Practices” in the context of the vernacular of the Society of Automotive Engineers (SAE) Aerospace Recommended Practice (ARP) and International Civil Aviation Organization (ICAO) documents. The NASA Integrated Synthetic Vision System Concepts to be discussed in relation to those best practices do not exist as other than concepts. They illustrate what production-grade SV systems might, or perhaps should be in order to provide the safety of flight and operational efficiency equivalent to day-VMC, regardless of visibility conditions. For organizational convenience, much of the ensuing discussion is parsed by two aircraft groupings: commercial transports and business jets (CAB), and General Aviation (GA). Within the SVS Project, and for the
7
Table 1. Flight tests under direct NASA control. # Date Location Aircraft Description References 1 Sept.,
1999 Asheville,
NC USAF Total Inflight Simulator (TIFS; Convair 580)
Demonstration of flights using SVS primary flight display; compared side by side to high resolution color TV camera view.
NASA, 2000.
2 Oct., 2000
Dallas / Fort Worth, TX
NASA LaRC ARIES B-757
Research in night flight operations using SVS HUD and SVS PFDs (sizes A, D & X); RIPS runway incursion experiments; Hazard Sensor data collection and Hold Short Advisory Landing technology.
Best & Rankin, 2001; Cassell et al., 2001, 2002; Glaab et al., 2003; Hawes & DiBenedetto 2001; Hyer, 2002; Jones et al., 2001; Thomas & DiBenedetto, 2001; Timmerman, 2001.
3 Oct., 2001
Eagle-Vail Regional County
Airport, CO
NASA LaRC ARIES B-757
Research in day flight operations using SVS HUD and SVS PFDs (Sizes A, D & X) compared to conventional displays; Hazard Sensor data collection.
Bailey et al., 2002a, b, & c; Kramer et al., 2003, 2004; Prinzel et al., 2003; Schnell et al., 2002a.
4 Aug. – Oct., 2002
Newport News, VA;
Roanoke, VA
NASA LaRC Cessna 206-H Stationaire
Research in day flight operations using SVS PFDs compared to conventional displays. Explored terrain portrayal concepts with texture and DEM resolution variations.
Glaab & Hughes, 2003;
5 July – Aug., 2003
CA, NV NASA ARC DC-8 Airborne Science Platform
Database integrity monitoring experiments and elevation data collection using a Light Detecting and Ranging (LiDAR) sensor
Young et al., 2004; Uijt de Haag et al., 2004.
6 July – Sept., 2004
Reno, NV; Wallops, VA
Gulfstream G-V Research in day flight and surface (runway incursion scenarios) operations using integrated SVS (SVS HUD and SVS PFDs; RIPS; DIME; Hazard Sensors) compared to conventional displays.
Arthur et al., 2005; Cooper & Young, 2005; Kramer et al., 2005a; Prinzel et al., 2005.
7 Aug. - Sept., 2005
Roanoke, VA NASA LaRC Cessna 206-H Stationaire
Research in day flight operations using SVS PFDs compared to conventional displays. Explored effectiveness of SVS displays to transform IMC flight into VMC flight
Glaab et al., 2006.
8
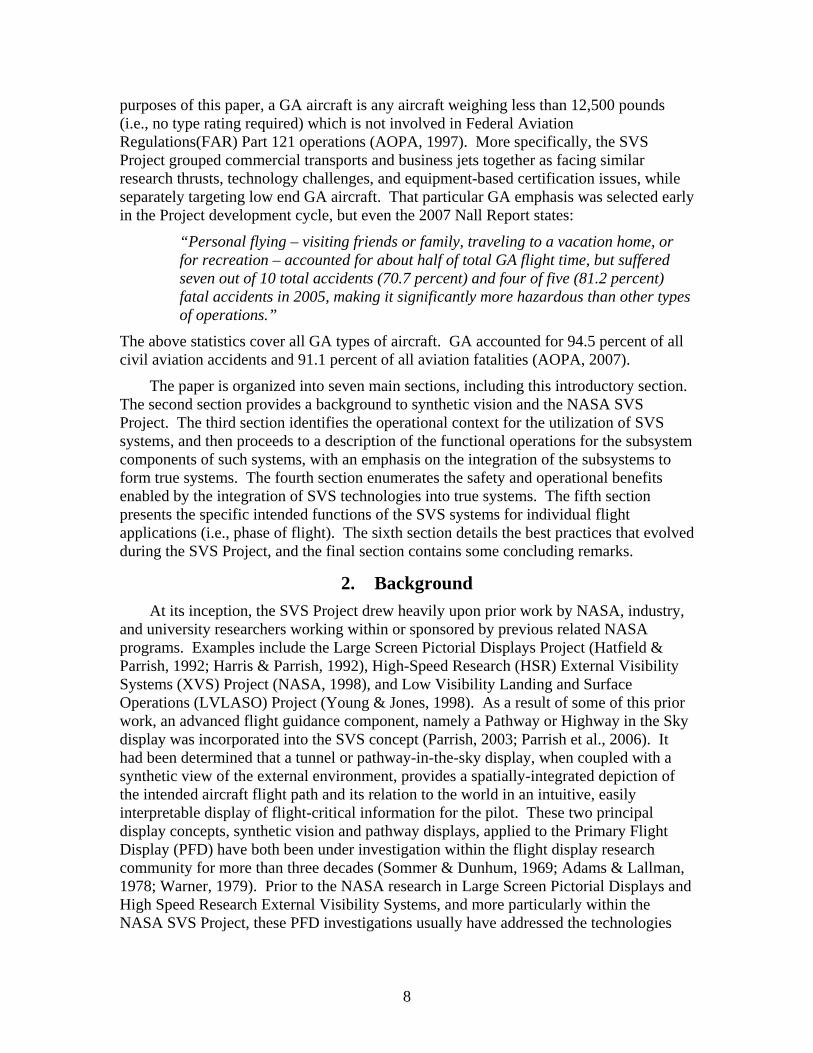
purposes of this paper, a GA aircraft is any aircraft weighing less than 12,500 pounds (i.e., no type rating required) which is not involved in Federal Aviation Regulations(FAR) Part 121 operations (AOPA, 1997). More specifically, the SVS Project grouped commercial transports and business jets together as facing similar research thrusts, technology challenges, and equipment-based certification issues, while separately targeting low end GA aircraft. That particular GA emphasis was selected early in the Project development cycle, but even the 2007 Nall Report states:
“Personal flying – visiting friends or family, traveling to a vacation home, or for recreation – accounted for about half of total GA flight time, but suffered seven out of 10 total accidents (70.7 percent) and four of five (81.2 percent) fatal accidents in 2005, making it significantly more hazardous than other types of operations.”
The above statistics cover all GA types of aircraft. GA accounted for 94.5 percent of all civil aviation accidents and 91.1 percent of all aviation fatalities (AOPA, 2007).
The paper is organized into seven main sections, including this introductory section. The second section provides a background to synthetic vision and the NASA SVS Project. The third section identifies the operational context for the utilization of SVS systems, and then proceeds to a description of the functional operations for the subsystem components of such systems, with an emphasis on the integration of the subsystems to form true systems. The fourth section enumerates the safety and operational benefits enabled by the integration of SVS technologies into true systems. The fifth section presents the specific intended functions of the SVS systems for individual flight applications (i.e., phase of flight). The sixth section details the best practices that evolved during the SVS Project, and the final section contains some concluding remarks.
2. Background At its inception, the SVS Project drew heavily upon prior work by NASA, industry,
and university researchers working within or sponsored by previous related NASA programs. Examples include the Large Screen Pictorial Displays Project (Hatfield & Parrish, 1992; Harris & Parrish, 1992), High-Speed Research (HSR) External Visibility Systems (XVS) Project (NASA, 1998), and Low Visibility Landing and Surface Operations (LVLASO) Project (Young & Jones, 1998). As a result of some of this prior work, an advanced flight guidance component, namely a Pathway or Highway in the Sky display was incorporated into the SVS concept (Parrish, 2003; Parrish et al., 2006). It had been determined that a tunnel or pathway-in-the-sky display, when coupled with a synthetic view of the external environment, provides a spatially-integrated depiction of the intended aircraft flight path and its relation to the world in an intuitive, easily interpretable display of flight-critical information for the pilot. These two principal display concepts, synthetic vision and pathway displays, applied to the Primary Flight Display (PFD) have both been under investigation within the flight display research community for more than three decades (Sommer & Dunhum, 1969; Adams & Lallman, 1978; Warner, 1979). Prior to the NASA research in Large Screen Pictorial Displays and High Speed Research External Visibility Systems, and more particularly within the NASA SVS Project, these PFD investigations usually have addressed the technologies

9
separately. With the advent of more contemporary SVS concepts, SVS and Pathway or Highway in the Sky displays have become more closely coupled, as will be discussed.
The earliest flight display work in both technologies (synthetic vision and pathway displays) was limited graphically to connected straight line segments by the rendering capabilities available then as the state of the art (i.e., stroke generators). Because Pathway Displays attempted to represent the intended flight path of the airplane connecting geospatial waypoints, and because of the two dimensional nature of Instrument Landing Systems (ILS), which generated rectangular boundaries (while the localizer and glideslope of an ILS are angular relative to the centerline of the intended path, the intersecting boundaries form a rectangle about that centerline at fixed distances from the runway threshold), the earliest Pathway Displays were quite amenable to stroke presentations. The natural inclination to include a runway representation at the end of the final approach segment of the Pathway Display led to its initial coupling with SV. In addition to a runway representation, attempts were also made to represent first the ground plane, and eventually terrain. These initial attempts were somewhat primitive, using only limited numbers of unfilled polygons. As computer graphics technology has matured, pathway (and terrain) presentations have improved dramatically, although the basic concept of presenting the desired vertical and lateral path ahead of the airplane, viewed from the pilot’s position, in a three dimensional perspective scene has clearly been maintained. Within the flight display research community, while terminology may vary between Pathway, Highway, or even Tunnel Displays, and some concepts may employ different flight guidance strategies (including the total lack of flight-director-like guidance) and different pathway elements, common confusion over the various terminologies for this type of flight display has rarely arisen.
However, even within the flight display research community, the term Synthetic Vision has had different interpretations through the years, which can lead to some confusion. For instance, “synthetic vision” was often a term used for what we now call “enhanced vision.” In particular, the FAA flew a flight test program in 1992 (Burgess, 1994) referred by the name of “Synthetic Vision Technology Demonstration” although the test specifically evaluated millimeter wave and infrared sensors for all-weather operations. Computer-generated imagery – what we know now as Synthetic Vision - was not a part of this endeavor. Initially, rudimentary displays of the airport environment, containing only a perspective runway outline and a horizon line and augmented perhaps with alphanumeric flight information when character generators became available, were termed contact analog, rather than Synthetic Vision, displays (Sommer & Dunhum, 1969). With the advent of raster graphics engines, filled polygons allowed for the presentation of more realistic, although somewhat cartoonish, airport scenes and surrounding terrain (see fig. 3). These were commonly termed pictorial displays (Parrish et al., 1994). The community viewpoint has finally converged to an acceptance of the interpretation of Synthetic Vision as a rendition of the external environment viewed from the pilot’s perspective which is rendered by a graphics computer accessing a geospatial database, or model, that contains geo-referenced locations of terrain, obstacles, and perhaps cultural features. Imaging sensor information displays are now known as Enhanced Vision.

10
Figure 3. Early raster graphic presentation of an airport scene on a large screen
panoramic display.
The terminology for Synthetic Vision, and its distinction from Enhanced Vision, evolved concurrently with the emergence of graphics rendering and texturing capabilities, which allowed raster graphics engines to apply textures to fill polygons thus producing more highly realistic scenes. In some concepts, aerial and / or satellite photography are used to provide “photo-realistic” qualities. Synthetic Vision Displays provide a real-time, unobscured synthetic view of the world for the pilot. The display, as illustrated in Figure 1, is generated by visually rendering an on-board terrain database (with additional airport and obstacle database information as necessary) using precise position and navigation (Nav) data obtained through GPS data, possibly with augmentation from differential correction sources such as Local Area Augmentation Systems (LAAS) or Wide Area Augmentation Systems (WAAS), as well as blending from on-board Inertial Navigation System (INS) / Inertial Reference System (IRS) information.
The definition of Synthetic Vision does not, by itself, dictate or specify the accuracy or integrity of the external environment depiction to the flight crew. However, a pre-cursor SVS program study highlighted that without an underlying accuracy and integrity requirement, the SVS program goals could not be achieved. The SVS project performed significant efforts to establish accuracy requirements and database requirements for SVS as will be shown in the following. In addition, the results from this precursor study performed in 1994 (Parrish et al., 2003), conclusively showed that “SVS concepts should not be implemented without incorporating image processing decision aiding.” The pilot, flying an approach and landing using synthetic vision or synthetic vision and enhanced vision imagery, could not reliably or accurately identify navigation system errors, database errors, or runway incursions without such decision aiding.
One critical decision aid was the development of automatic methods by which the accuracy and integrity of the synthetic vision display can be ensured by onboard sensors and systems, independent of pilot/crew action (Uijt de Haag et al., 2001b). In addition to the need to assure database integrity and accuracy with respect to position, another decision aid was required for potential hazard identification. Although the display representation to the pilot is synthetically derived, traffic, obstacles, and other flight

11
hazards not stored in the on-board databases are to be provided by appropriate on-board sensors and / or data link sources, and rendered on the synthetic display to augment the stored database with dynamic information. Those sources include active imaging sensors, real-time hazard information (e.g., weather and wake vortices) sources, and traffic surveillance sources (such as TCAS, ASDE, ADS-B and TIS-B), as well as non-cooperative traffic (e.g., non-functioning Mode S transponder) and unmapped obstacles (e.g., towers) that may be detected by, for example, a multi-mode weather (Wx) radar.
Similarly, and as will be discussed, Synthetic Vision Displays are applicable to all phases of flight and not just airborne operations (the SVS Project attempted to address all of the phases, with the exception of the high altitude en route phase, where terrain, obstacle, and airport features are of lesser priority). Still a third decision aid was provided with the development of the Runway Incursion Prevention System (RIPS). The RIPS component of SVS evolved from the results of prior research (Young & Jones, 1998; Hueschen et al., 1998; Beskenis et al., 1998; Johnson & Hyer, 1999) within the NASA LVLASO Program which provide the principal basis for the SVS surface operations display concepts. Specifically, display formats from the Taxiway Navigation and Situation Awareness (T-NASA) System research (McCann, 1996; McCann et al., 1998; Foyle et al., 1998) were evolved into a RIPS design. Further, these surface operations display designs evolved to also include two algorithms for detecting possible runway incursions and alerting the flight crew, the Runway Incursion Advisory and Alerting System (RIAAS, developed for NASA by Rannoch Corporation, and now known as PathProx™) and the Runway Safety Monitor (RSM). Although tested separately early in the SVS Project (Cassell et al., 2001, 2002; Hyer, 2002; Jones et al., 2001; Thomas & DiBenedetto, 2001; Timmerman, 2001), RIPS later became an integral part of the SVS concept while the aircraft was operating on or near the airport surface.
Synthetic Vision Displays encompass both tactical, strategic, and auxiliary display concepts to eliminate visibility-induced accidents. Tactical SV concepts were generally designed to complement the primary flight reference (PFR) requirements for this kind of display and thus, left many aspects of this display untouched (i.e., alerting, autoflight moding, and required PFR information (altitude, airspeed, heading)). Tactical SV concepts (implemented on the PFD and HUD) generally also included guidance information, as synthetic terrain and path guidance are intuitive information pairs. Concepts for tunnel or pathway in the sky guidance were researched accordingly. Strategic concepts (e.g., flight path management or moving map displays implemented on a Navigation Display, ND) are more concerned with incident prevention and avoidance to foster effective, proactive decision making. SVS research was conducted to evaluate if synthetic terrain information could appropriately complement or improve existing and emerging ND concepts. Electronic flight bag (or Auxiliary Display) SV concepts have been developed to allow mission-rehearsal and FMS-independent flight plan checking to, again, foster effective, proactive decision making.
To develop SVS display requirements approaching a Technology Readiness Level of 6 (system/subsystem model or prototype demonstrated in a relevant environment), the SVS Project set-up a research, test and evaluation program to define requirements for display configurations and associated human performance criteria, and to resolve human performance and technology issues relating to the development of synthetic vision

12
concepts. Analysis and pilot-in-the-loop experiments were conducted to assess the safety and operational benefits that these concepts might provide. Verification and validation methods and tools for the necessary enabling avionics technologies and any supporting infrastructure were also required to address postulated certification issues. These issues arose when considering whether SVS could become a flight-critical system under certain operational conditions. Aggressive, active participation by synthetic vision advocates with appropriate standards and regulatory groups was also pursued in an attempt to lower the certification risks and accelerate the introduction of the SVS technologies into the NAS fleet as required to achieve the Aviation Safety Program goal of reducing the fatal accident rate.
The vast majority of the SVS Project efforts sought to achieve the potential safety and operational benefits of SVS along the path of equipment-based certification and within the existing NAS infrastructure. As the future infrastructure evolves to an anticipated "performance-based" environment, the authors have few doubts that SVS technologies will be in the forefront as an enabler of that evolution.
3. Synthetic Vision Systems Synthetic vision concepts can be operationally defined in many ways, ranging from
simple presentations of terrain information to more sophisticated, integrated systems that also include airborne and surface pathway guidance information, surveillance information (traffic, obstacles), terrain integrity monitoring functionality, and Wx-penetrating imaging and hazard detection sensors. The latter concepts take advantage of many enabling technologies that, together, provide more than just a display of terrain information but instead offer operational capabilities and enhancements from independent, redundant information sources with substantially improved performance over those with only terrain depiction alone. The independent informational elements are used to both verify the accuracy of the information contained in the on-board databases and, also, to locate hazards (e.g., structures, obstacles, objects) that are not contained within the databases.
This section separately identifies the operational context for the utilization of SVS systems aboard CAB and GA aircraft, and then describes the functional operations for the subsystem components for each system, with an emphasis on the integration of the subsystems to form true systems.
3.1 System Aspects for Commercial Transports / Business Jets While the use of differential GPS (DGPS) and on-board databases can provide the
primary framework for an operational SVS for commercial transports and business jets, many in the civil aviation community believe that independent integrity monitors for both surveillance (e.g., Harrah et al., 2002) and navigational (e.g., Young, 2001; Young et al., 2002, 2003) functions will be required to meet certification and safety requirements. This belief stems from the anticipated certification basis (i.e., “intended function”) of an operational SVS. Without independent integrity monitors, SVS will likely only be certified as a supplemental system, providing only terrain, procedure, and / or path awareness benefits that augment existing systems. No operational “credit” for installation of SVS equipment (i.e., reduced approach minima or increased operational

13
approval) would be gained. For maximal fleet deployment, an “operational credit” for SVS installation should be provided which allows new or additional operations because of its installation and use. This “operational credit” would likely only be possible if the SVS includes independent integrity monitors that can verify and validate the information on the SVS, to the level of integrity necessary to mitigate the risk of the operation.
Optimally, this real-time integrity monitoring functionality utilizes existing on-board sensor information (e.g., Wx radars, high quality radar altimeters), but with new computational architectures and algorithms, to provide both surveillance monitoring and geospatial cross-checks against SVS databases and / or positioning information without additional or unique sensor requirements. Specifically, on-board integrity sensors (Harrison et al., 2003) can provide independent air-to-air, air-to-ground, ground-to-ground, and ground-to-air traffic and object surveillance, a runway incursion monitor and a confirmation of database integrity (the monitor becomes, in effect, a real-time validation of the geo-spatial models ) and registration (navigational position confirmation via terrain feature extraction).
Additionally, the possibility of augmenting SVS concepts with the independent capabilities of enhanced vision imaging sensors can allow pilots to act as additional independent monitors during low visibility landing and surface operations conditions. This cross-checking capability can improve the overall level of safety by the complementary nature of EVS and SVS technologies, whereby, from Craig et al. (2002), “the strengths of enhanced system can compensate for the deficiencies in the synthetic system and that the strengths of synthetic system can compensate for the deficiencies in the enhanced vision system.” EVS can complement SVS by providing a real-time enhanced view of the external scene to verify the position of the aircraft and to visually identify flight hazards or objects. Conversely, SVS can complement EVS by providing a real-time synthetic view of the external scene to aid the pilot’s recognition and understanding of the EVS image, and showing terrain and path information when the EVS is obscured or unable to produce an external scene image.”
These integrity monitoring technologies form the basis for real-time assessment of the dynamic flight environment and thereby supplement the synthetic world with real-time, direct measurement of the surrounding terrain and air / ground traffic. Integration of these enabling technologies into the SVS concept (a true system, rather than just terrain on a PFD) provides pilots with high-integrity real-time geo-referenced information that improves situational awareness with respect to terrain, obstacles, traffic, and flight path, both in the air and on the ground.
This subsection identifies the operational context for the utilization of SVS systems in CAB aircraft (Section 3.1.1), introduces the overall rationale for the inclusion of a HUD and enhanced vision imaging sensors as an integral part of the CAB SVS concept (Section 3.1.2), and then proceeds to a description of the functional operations for the subsystem components of such a concept (Section 3.1.3), with an emphasis on the integration of the subsystems to form a true system.
3.1.1 Operational Uses in IMC Three classes of operations (Young et al., 2002) can be considered in IMC
operations (note that operations in VMC are of less concern as the pilot will have visual

14
references, although night-VMC and marginal VMC operations are more problematical and are addressed under GA operations, Section 3.2.1): (1) nominal operations; (2) off-nominal operations; and (3) enhanced operations.
During nominal operations in IMC, the aircraft is following a pre-defined and well-established course or procedure, including appropriate coordination with Air Traffic Control (ATC). During nominal operations, the pilot is either (1) monitoring or engaging autopilot modes, or (2) actively controlling the aircraft using flight-director type guidance derived from a navigation database or an approach and landing aid such as an ILS. Examples include: coupled ILS, GPS, or RNAV(GPS) approaches, and missed approaches that follow a defined missed approach procedure. During nominal operations, SVS provides guidance to the published (and presumably correct) path using navigation data provided by conventional systems in the form of a tunnel in combination with flight-director guidance. Supplemental to this guidance symbology will be a depiction of terrain to improve SA. Even though stored terrain data may not be used to locate the tunnel on the display or to compute flight-director guidance, it has been suggested that the compelling nature of the SVS display may introduce Hazardously Misleading Information (HMI) during nominal operations if the terrain data has insufficient integrity. For this reason, active integrity monitoring is an integral part of the SVS system. Hazard detection sensors are also active to provide information concerning obstacles not contained within the on-board database, and to augment other traffic surveillance sources. Nominal SVS surface operations are conducted in an analogous manner, although integrity monitoring of the airport surface database is not provided in real time. However, VMC operations and corrective database feedback procedures serve to continuously verify each updated airport surface database version.
Off-nominal operations in IMC would include unavoidable, inadvertent, and / or intentional deviations from the existing operational situations described above. These deviations may be unavoidable due to lack of aircraft performance, weather conditions, or on-board emergencies. Inadvertent deviations may also be due to pilot error (e.g., distracted by various other concerns) or induced by ATC requests (e.g., “Gulfstream 23Alpha, clearance to land 34 Right is cancelled, sidestep to runway 34 Left; cleared to land 34 Left.”). Finally, these deviations may be intentional if pilots deviate to save time and / or fuel, for example. For these off-nominal operational modes, if the aircraft is operating near terrain in IMC and has deviated from the tunnel or flight-director, the SVS terrain depiction could then be used as a primary navigational aid (analogous to flying under VFR). Once again, SVS provides active integrity monitoring as an integral part of the SVS system. Hazard detection sensors are also active to provide information concerning obstacles not contained within the on-board database, and to augment other traffic surveillance sources. When performing off-nominal operations such as the ones described, it is anticipated that the acceptable requirements for integrity are more likely to be less than for the nominal operations (i.e., “any Nav-aid is better than no Nav-aid”).
Enhanced operations in IMC include new operational capabilities that become feasible with the high-integrity SVS-equipped aircraft. For example, it has been suggested that aircraft equipped with SVS may be able to fly with reduced minimums to designated runways. Other examples include: curved approaches; approaches to runways with little or no ground infrastructure (e.g., no ILS); and enabling functions such as
15
dynamically generated path creation and advanced guidance (including, potentially, 4-D pathways with required runway arrival times). All of these new operational capabilities (approaching VMC-like capabilities) can conceivably be accommodated by the SVS system.
3.1.2 HUD / Enhanced Vision Imaging Sensor Considerations Until the latter part of the SVS Project, HUD equipage was not considered as a
necessary part of a CAB SVS Concept. However, the Project conducted extensive research on that display element for two primary reasons. First, HUDs offered a retrofit approach for the introduction of SVS displays into non-glass cockpits, as detailed in Section 3.1.2.1 below. Secondly, HUDs offer the more easily acceptable presentation method, as opposed to head-down displays, for surface operations during low visibility conditions, as discussed in Section 3.1.2.2. Near the end of the SVS Project, it was realized that the use of EVS imagery during low visibility surface operations appeared desirable, at least initially, to extend operational capabilities and ease certification concerns (in particular, concerns for surface objects and hazards not present in the airport database). This viewpoint has been reinforced by the recent action by the FAA in granting operational credit (through lower approach minimums) to aircraft equipped with EVS (FAA, 2004a). A discussion of the rationale for the inclusion of a HUD and an enhanced vision imaging sensor as integral parts of an SVS concept is presented in Section 3.1.2.3.
3.1.2.1 Retrofit Considerations Significant effort was placed in the SVS Project on the "retrofit" issues associated
with this advanced display technology (i.e., SVS) since to measurably impact safety and operations, a majority of the fleet has to be affected. Transport Category airplanes without glass cockpit displays represent a small portion of the today’s existing fleet, although their presence is expected to continue well into the future. As indicated by the data in Figure 4 (Both et al., 1998; Airline Monitor, 2001), the actual and projected world-wide fleet of jet aircraft shows that the majority of jet transports are now and will remain those equipped with CRTs / LCDs (i.e., "glass" cockpits). While these data might at first be encouraging, retrofit is still a formidable challenge. Although "glass" displays may be installed, the display drivers, graphics drivers, and drawing capability necessary to host a SV display system are not necessarily available (Boucek, 2001). Thus the retrofit effort focused upon the compatibility of these existing cockpits and cockpit displays to host synthetic vision upgrades.
Non-glass aircraft have significant display design limitations that will severely affect SVS implementation. Although exact marketing statistics are not presented here, an obvious commercial airline market trend is the tremendous growth in the installation of HUDs, thanks to the operational benefits granted by an installed Head-Up Guidance (HGS) system (McKenna, 1999). With this trend, a cost-effective retrofit path for SVS in HUD-equipped aircraft is made possible. Analyses and research studies performed over the course of the SVS Project have shown the recommended SVS retrofit option for non-glass cockpits to be the use of the SVS HUD, while continuing to utilize the existing electro-mechanical head-down PFD. The HSI, however, would be replaced by an SVS ND (described below in Section 3.1.3.1.3).

16
Figure 4. Percentage of world jet transport aircraft cockpit display equipage.
Although HUDs have proven operational benefits, the synthetic vision HUD will not merely substitute for the traditional head-up displays. Instead, the approach is to generate a synthetic vision image as the raster input source to a stroke-on-raster HUD. This concept for a SVS-HUD is similar to EVS concepts, which typically use forward-looking imaging sensors with the resulting image presented on a HUD, through which the outside scene may be visible. The FAA has recently certified an infrared-based EVS for use on a business aircraft (FAA, 2001), and even more recently granted some operational credit (FAA, 2004a). In the SVS-HUD concept (see fig. 5), the terrain database scene is displayed in either grid form or fully textured instead of the sensor-based EVS image. The EVS image replaces the SVS terrain at a declutter height set somewhat above the traditional decision height for non-SVS equipped aircraft (see Section 3.1.3.1.2).
For existing aircraft with glass cockpits (cockpits already equipped with raster-capable displays), SVS retrofit strategy employs HUD equipage and existing head-down
Figure 5. The Synthetic Vision HUD Concept.
0%10%20%
30%40%
50%60%70%
80%90%
100%
19951996
1997
1998
1999
2000
2001
2002
2003
2004
2005
2006
2007
2008
2009
2010
2011
20122013
2014
2015
2016
2017
2018
2019
2020
Year
Size D "Glass"Size A/B "Glass"Electro-M echanical
Symbology
Synthetic Terrain Image Raster
Stroke Synthetic Vision HUDSymbology
Synthetic Terrain Image Raster
Stroke Synthetic Vision HUD

17
display (HDD) capabilities driven by new graphics processors. Several issues should be considered in cases where both the HUD and PFD are used to provide SVS capabilities. These issues include, for example, differences in minification (the HUD has no minification – i.e., the minification factor is unity, although there are instances of non-conformal, minified symbology being employed on HUDs), FOV, color, and the brightness control and raster washout issues associated with HUDs. These issues are examined in Section 6.
3.1.2.2 Surface Operations Considerations The RIPS was developed to function optimally for aircraft equipped with a HUD,
although aircraft without a HUD can still benefit from the surface situational awareness information cues, and the alerts of runway conflicts and route deviations. Without a HUD, the functionalities lost are the head-up surface guidance capabilities and the head-up conflict position cues during alerts. The remaining functionalities are presented effectively on the RIPS head-down moving map display of the airport surface (RIPS details are presented below in Section 3.1.3.2).
One of the more interesting issues, specifically the presentation of surface guidance symbology, has involved both the HUD, which is used for that purpose in RIPS, and the ND in an exocentric viewing mode. Research on the latter utilization was conducted within the NASA HSR XVS program for the High Speed Civil Transport (HSCT). The proposed HSCT vehicle had no side windows and the forward visibility through the front windows was of little use in turns because of the extreme forward position of the crew station relative to the nose wheel of the vehicle. Very successful surface operations were conducted aboard the Surface Operations Research and Evaluation Vehicle (SOREV; Kaiser, 1998), a full scale ground vehicle representative of the HSCT geometry, enabled by surface guidance presented head-down on an exocentric taxi coplanar map on the ND during taxi operations. However, the SVS Project researchers, and particularly those researchers involved directly in RIPS development, felt strongly that the pilot conducting taxi operations should be heads–up with full attention directed to the outside environment, even in low visibility conditions. Concerns for potential surface objects and hazards not present in the airport database led to that opinion. The minimal research conducted within the SVS Project that involved surface operations in low visibility conditions on aircraft without HUD equipage is discussed in Section 6.1.3.1.1.
3.1.2.3 HUD / Enhanced Vision Imaging Sensor Inclusion Rationale
The original SVS Project rationale for HUD equipage, motivated solely by its advantages for low visibility surface operations, was augmented by changes in the regulatory environment. Near the end of the SVS Project, the FAA changed the aircraft operating rules under Part 91 to provide operating credit for EVS by revising the decision height flight visibility requirements for conducting operations to civil airports. Operators conducting straight-in instrument approach procedures may now operate below the published approach minimums (Decision Altitude, Minimum Descent Altitude) when using an approved Enhanced Flight Vision System (EFVS) that shows the required visual references on the pilot’s Head-Up Display (e.g., the image shows the FAA-approved elements of the runway environment such as approach and runway lighting). As a result, the use of EFVS in civil aircraft is now projected to increase rapidly. While the FAA
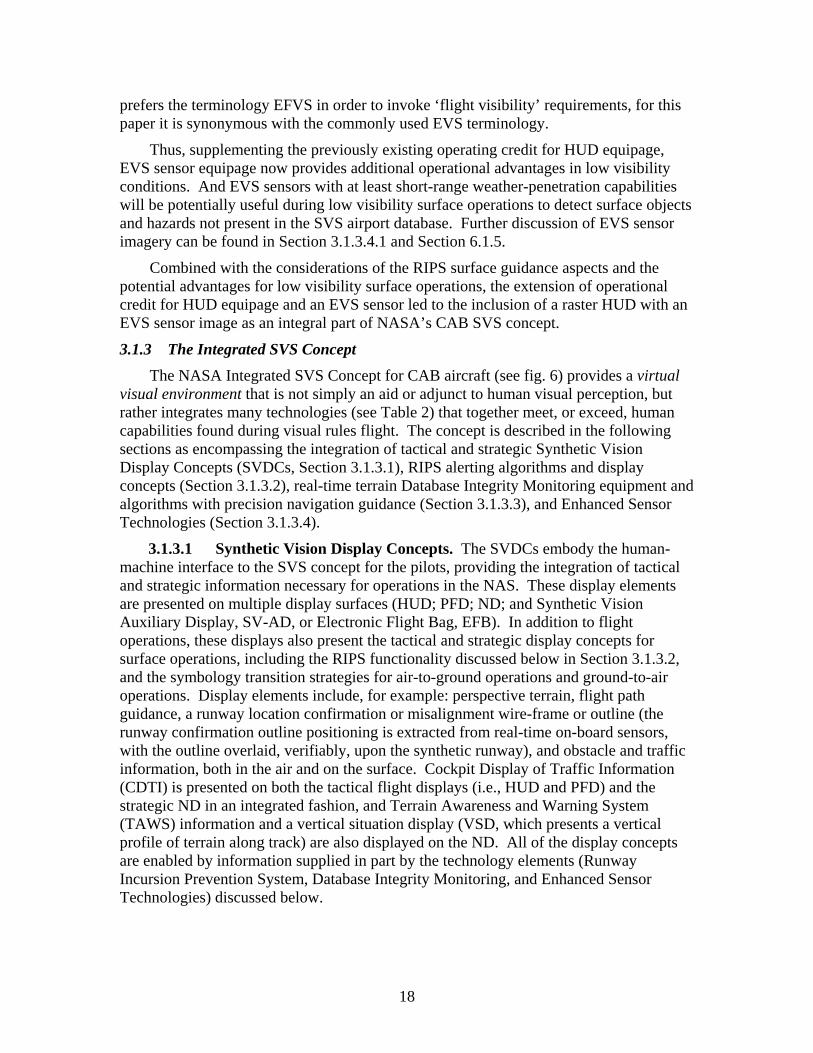
18
prefers the terminology EFVS in order to invoke ‘flight visibility’ requirements, for this paper it is synonymous with the commonly used EVS terminology.
Thus, supplementing the previously existing operating credit for HUD equipage, EVS sensor equipage now provides additional operational advantages in low visibility conditions. And EVS sensors with at least short-range weather-penetration capabilities will be potentially useful during low visibility surface operations to detect surface objects and hazards not present in the SVS airport database. Further discussion of EVS sensor imagery can be found in Section 3.1.3.4.1 and Section 6.1.5.
Combined with the considerations of the RIPS surface guidance aspects and the potential advantages for low visibility surface operations, the extension of operational credit for HUD equipage and an EVS sensor led to the inclusion of a raster HUD with an EVS sensor image as an integral part of NASA’s CAB SVS concept.
3.1.3 The Integrated SVS Concept The NASA Integrated SVS Concept for CAB aircraft (see fig. 6) provides a virtual
visual environment that is not simply an aid or adjunct to human visual perception, but rather integrates many technologies (see Table 2) that together meet, or exceed, human capabilities found during visual rules flight. The concept is described in the following sections as encompassing the integration of tactical and strategic Synthetic Vision Display Concepts (SVDCs, Section 3.1.3.1), RIPS alerting algorithms and display concepts (Section 3.1.3.2), real-time terrain Database Integrity Monitoring equipment and algorithms with precision navigation guidance (Section 3.1.3.3), and Enhanced Sensor Technologies (Section 3.1.3.4).
3.1.3.1 Synthetic Vision Display Concepts. The SVDCs embody the human-machine interface to the SVS concept for the pilots, providing the integration of tactical and strategic information necessary for operations in the NAS. These display elements are presented on multiple display surfaces (HUD; PFD; ND; and Synthetic Vision Auxiliary Display, SV-AD, or Electronic Flight Bag, EFB). In addition to flight operations, these displays also present the tactical and strategic display concepts for surface operations, including the RIPS functionality discussed below in Section 3.1.3.2, and the symbology transition strategies for air-to-ground operations and ground-to-air operations. Display elements include, for example: perspective terrain, flight path guidance, a runway location confirmation or misalignment wire-frame or outline (the runway confirmation outline positioning is extracted from real-time on-board sensors, with the outline overlaid, verifiably, upon the synthetic runway), and obstacle and traffic information, both in the air and on the surface. Cockpit Display of Traffic Information (CDTI) is presented on both the tactical flight displays (i.e., HUD and PFD) and the strategic ND in an integrated fashion, and Terrain Awareness and Warning System (TAWS) information and a vertical situation display (VSD, which presents a vertical profile of terrain along track) are also displayed on the ND. All of the display concepts are enabled by information supplied in part by the technology elements (Runway Incursion Prevention System, Database Integrity Monitoring, and Enhanced Sensor Technologies) discussed below.

19
Figure 6. Block diagram of Integrated SVS Concept for CAB aircraft with glass cockpits.
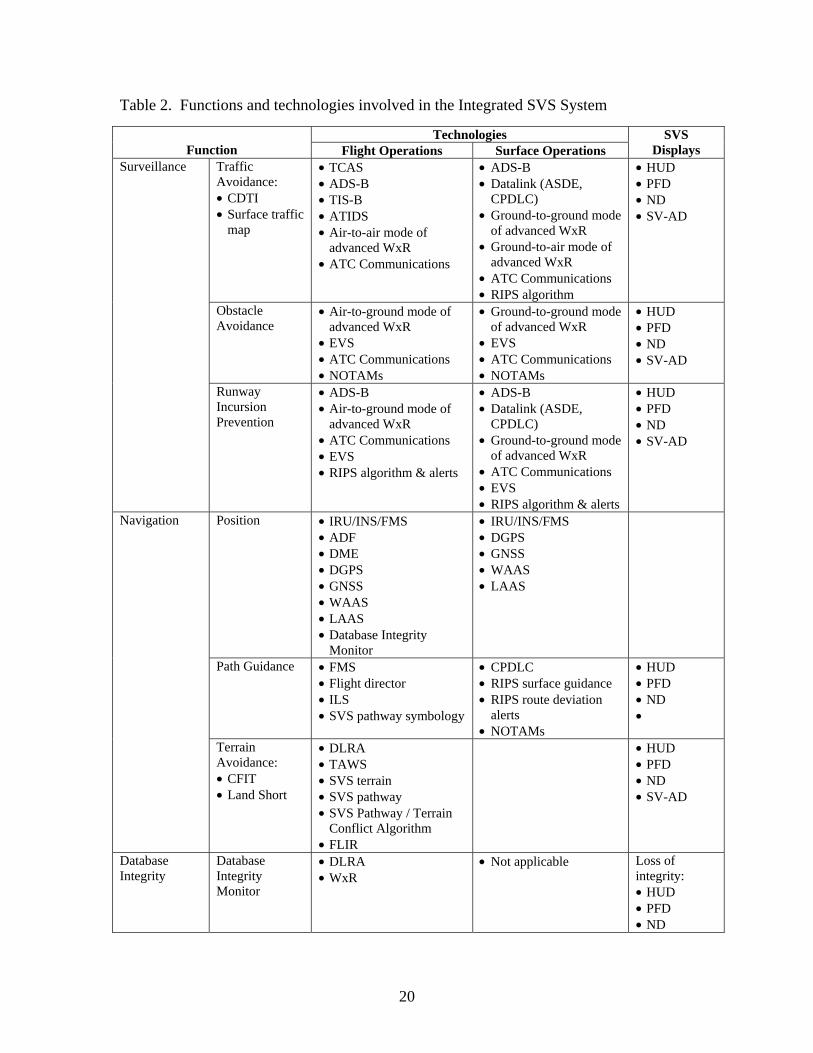
20
Table 2. Functions and technologies involved in the Integrated SVS System
Technologies Function Flight Operations Surface Operations
SVS Displays
Traffic Avoidance: • CDTI • Surface traffic
map
• TCAS • ADS-B • TIS-B • ATIDS • Air-to-air mode of
advanced WxR • ATC Communications
• ADS-B • Datalink (ASDE,
CPDLC) • Ground-to-ground mode
of advanced WxR • Ground-to-air mode of
advanced WxR • ATC Communications • RIPS algorithm
• HUD • PFD • ND • SV-AD
Obstacle Avoidance
• Air-to-ground mode of advanced WxR
• EVS • ATC Communications • NOTAMs
• Ground-to-ground mode of advanced WxR
• EVS • ATC Communications • NOTAMs
• HUD • PFD • ND • SV-AD
Surveillance
Runway Incursion Prevention
• ADS-B • Air-to-ground mode of
advanced WxR • ATC Communications • EVS • RIPS algorithm & alerts
• ADS-B • Datalink (ASDE,
CPDLC) • Ground-to-ground mode
of advanced WxR • ATC Communications • EVS • RIPS algorithm & alerts
• HUD • PFD • ND • SV-AD
Position • IRU/INS/FMS • ADF • DME • DGPS • GNSS • WAAS • LAAS • Database Integrity
Monitor
• IRU/INS/FMS • DGPS • GNSS • WAAS • LAAS
Path Guidance • FMS • Flight director • ILS • SVS pathway symbology
• CPDLC • RIPS surface guidance • RIPS route deviation
alerts • NOTAMs
• HUD • PFD • ND •
Navigation
Terrain Avoidance: • CFIT • Land Short
• DLRA • TAWS • SVS terrain • SVS pathway • SVS Pathway / Terrain
Conflict Algorithm • FLIR
• HUD • PFD • ND • SV-AD
Database Integrity
Database Integrity Monitor
• DLRA • WxR
• Not applicable Loss of integrity: • HUD • PFD • ND
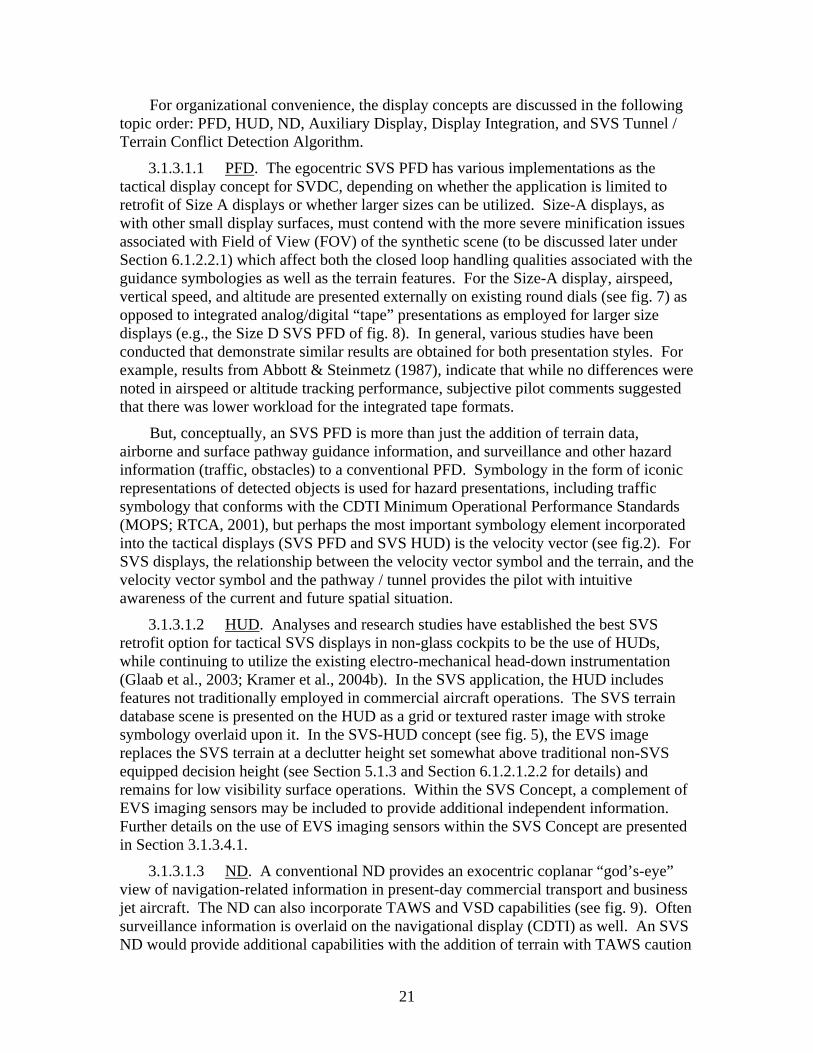
21
For organizational convenience, the display concepts are discussed in the following topic order: PFD, HUD, ND, Auxiliary Display, Display Integration, and SVS Tunnel / Terrain Conflict Detection Algorithm.
3.1.3.1.1 PFD. The egocentric SVS PFD has various implementations as the tactical display concept for SVDC, depending on whether the application is limited to retrofit of Size A displays or whether larger sizes can be utilized. Size-A displays, as with other small display surfaces, must contend with the more severe minification issues associated with Field of View (FOV) of the synthetic scene (to be discussed later under Section 6.1.2.2.1) which affect both the closed loop handling qualities associated with the guidance symbologies as well as the terrain features. For the Size-A display, airspeed, vertical speed, and altitude are presented externally on existing round dials (see fig. 7) as opposed to integrated analog/digital “tape” presentations as employed for larger size displays (e.g., the Size D SVS PFD of fig. 8). In general, various studies have been conducted that demonstrate similar results are obtained for both presentation styles. For example, results from Abbott & Steinmetz (1987), indicate that while no differences were noted in airspeed or altitude tracking performance, subjective pilot comments suggested that there was lower workload for the integrated tape formats.
But, conceptually, an SVS PFD is more than just the addition of terrain data, airborne and surface pathway guidance information, and surveillance and other hazard information (traffic, obstacles) to a conventional PFD. Symbology in the form of iconic representations of detected objects is used for hazard presentations, including traffic symbology that conforms with the CDTI Minimum Operational Performance Standards (MOPS; RTCA, 2001), but perhaps the most important symbology element incorporated into the tactical displays (SVS PFD and SVS HUD) is the velocity vector (see fig.2). For SVS displays, the relationship between the velocity vector symbol and the terrain, and the velocity vector symbol and the pathway / tunnel provides the pilot with intuitive awareness of the current and future spatial situation.
3.1.3.1.2 HUD. Analyses and research studies have established the best SVS retrofit option for tactical SVS displays in non-glass cockpits to be the use of HUDs, while continuing to utilize the existing electro-mechanical head-down instrumentation (Glaab et al., 2003; Kramer et al., 2004b). In the SVS application, the HUD includes features not traditionally employed in commercial aircraft operations. The SVS terrain database scene is presented on the HUD as a grid or textured raster image with stroke symbology overlaid upon it. In the SVS-HUD concept (see fig. 5), the EVS image replaces the SVS terrain at a declutter height set somewhat above traditional non-SVS equipped decision height (see Section 5.1.3 and Section 6.1.2.1.2.2 for details) and remains for low visibility surface operations. Within the SVS Concept, a complement of EVS imaging sensors may be included to provide additional independent information. Further details on the use of EVS imaging sensors within the SVS Concept are presented in Section 3.1.3.4.1.
3.1.3.1.3 ND. A conventional ND provides an exocentric coplanar “god’s-eye” view of navigation-related information in present-day commercial transport and business jet aircraft. The ND can also incorporate TAWS and VSD capabilities (see fig. 9). Often surveillance information is overlaid on the navigational display (CDTI) as well. An SVS ND would provide additional capabilities with the addition of terrain with TAWS caution

22
and warning overlays (FAA, 2002a) to help a pilot’s cognitive understanding of ownship position and track relative to traffic, terrain, and obstacle hazards (see fig. 10). The terrain display is presented from an absolute altitude perspective.
Figure 7. Image of Size-A display for 30 º FOV with photo-textured terrain, illustrating a dial format.
Figure 8. Image of Size-D display for 30 º FOV with photo-textured terrain, illustrating a
tape format.

23
Figure 9. Conventional exocentric coplanar navigation display with TAWS.
Figure 10. SVS coplanar navigation display with TAWS overlays.
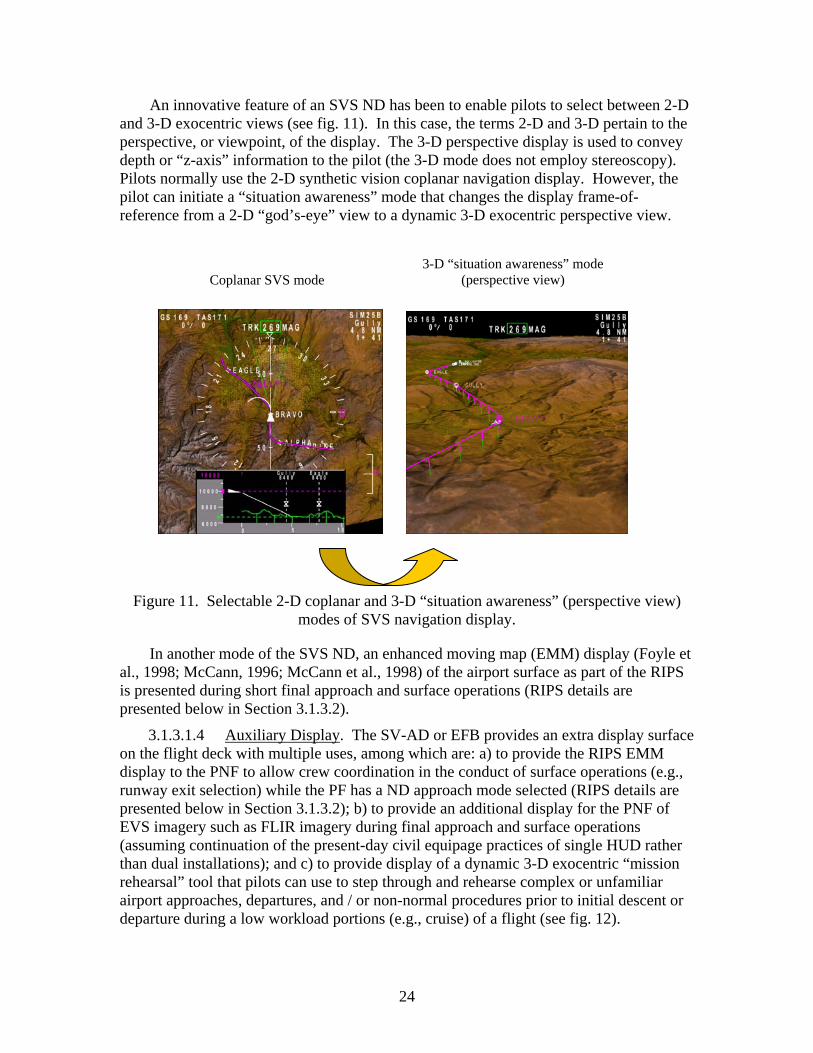
24
An innovative feature of an SVS ND has been to enable pilots to select between 2-D and 3-D exocentric views (see fig. 11). In this case, the terms 2-D and 3-D pertain to the perspective, or viewpoint, of the display. The 3-D perspective display is used to convey depth or “z-axis” information to the pilot (the 3-D mode does not employ stereoscopy). Pilots normally use the 2-D synthetic vision coplanar navigation display. However, the pilot can initiate a “situation awareness” mode that changes the display frame-of-reference from a 2-D “god’s-eye” view to a dynamic 3-D exocentric perspective view.
Figure 11. Selectable 2-D coplanar and 3-D “situation awareness” (perspective view)
modes of SVS navigation display.
In another mode of the SVS ND, an enhanced moving map (EMM) display (Foyle et al., 1998; McCann, 1996; McCann et al., 1998) of the airport surface as part of the RIPS is presented during short final approach and surface operations (RIPS details are presented below in Section 3.1.3.2).
3.1.3.1.4 Auxiliary Display. The SV-AD or EFB provides an extra display surface on the flight deck with multiple uses, among which are: a) to provide the RIPS EMM display to the PNF to allow crew coordination in the conduct of surface operations (e.g., runway exit selection) while the PF has a ND approach mode selected (RIPS details are presented below in Section 3.1.3.2); b) to provide an additional display for the PNF of EVS imagery such as FLIR imagery during final approach and surface operations (assuming continuation of the present-day civil equipage practices of single HUD rather than dual installations); and c) to provide display of a dynamic 3-D exocentric “mission rehearsal” tool that pilots can use to step through and rehearse complex or unfamiliar airport approaches, departures, and / or non-normal procedures prior to initial descent or departure during a low workload portions (e.g., cruise) of a flight (see fig. 12).
3-D “situation awareness” mode (perspective view) Coplanar SVS mode

25
Figure 12. Rehearsal tool mode using SVS ND “situation awareness” format.
3.1.3.1.5 Display Integration. Aside from the numerous occasions that arise to apply human factors display integration principles to conventional tactical (PFD, HUD) and strategic (ND) displays, the incorporation of terrain, traffic, and iconic representations of detected obstacles or hazards on both displays presents additional opportunities. For example, among other integration features of SVDC is the incorporation of CDTI symbology on both displays. One of the most effective techniques employs FOV lines that are drawn to enclose the forward area on the ND encompassed by the view presented on the SVS PFD. It becomes an easy and intuitive task to correlate features such as individual traffic or a ground-based hazard such as a radio tower on each display (see fig. 13).
3.1.3.1.6 SVS Tunnel / Terrain Conflict Detection Algorithm. TAWS has undoubtedly addressed the problem of CFIT accidents in a positive manner and forms an integral part of SVDC. However, TAWS follows the “warn-act” model and therefore requires the flight crew to be reactive rather than proactive. The technology provides a warning when theoretically the flight crew has already lost spatial and situation awareness and must then perform an escape maneuver. In addition, TAWS sometimes generates false alerts during operations in mountainous areas due to the method of flight path projection (i.e., TAWS has no integration with the planned flight path). Since processors within an SVS possess sufficient information to graphically present both terrain and the planned flight path, an algorithm to detect tunnel / terrain conflicts well before the conflict point is approached has been envisioned as part of SVS (such an algorithm, although easily realized, was never implemented within the program) as another independent check and balance feature.
3.1.3.2 Runway Incursion Prevention System. NASA has developed a RIPS as an integrated subsystem of the SVS concept to improve airport safety by providing

26
supplemental surface situational awareness information and guidance cues, and alerts of runway conflicts and route deviations directly to the flight crew (the alerts can also be provided to air traffic control). RIPS integrates airborne and ground-based technologies, which include advanced flight deck displays, incursion detection and alerting algorithms, onboard positioning systems, airport surveillance systems, and Controller-Pilot Data Link Communications (CPDLC), with a highly accurate airport geographic database.
Figure 13. SVS primary flight display and coplanar navigation display with
neighborhood traffic and ground obstacles.
The RIPS makes use of these advanced displays, data links, and DGPS to enable equipped aircraft to operate at airports independent of visibility while ensuring safety from traffic collisions. This is done by providing pilots with supplemental situational awareness and guidance cues, a real-time display of airport traffic, and alerts of runway incursions and route deviations on both a HUD and an EMM of the airport on the ND (or on the SV-AD).
The HUD is used to provide improved position awareness and guidance during final approach, landing, rollout, turn-off, and taxi. Symbology presented during landing transitions to surface guidance at touchdown. During landing rollout, deceleration
Traffic
Obstacles
Obstacles
Traffic
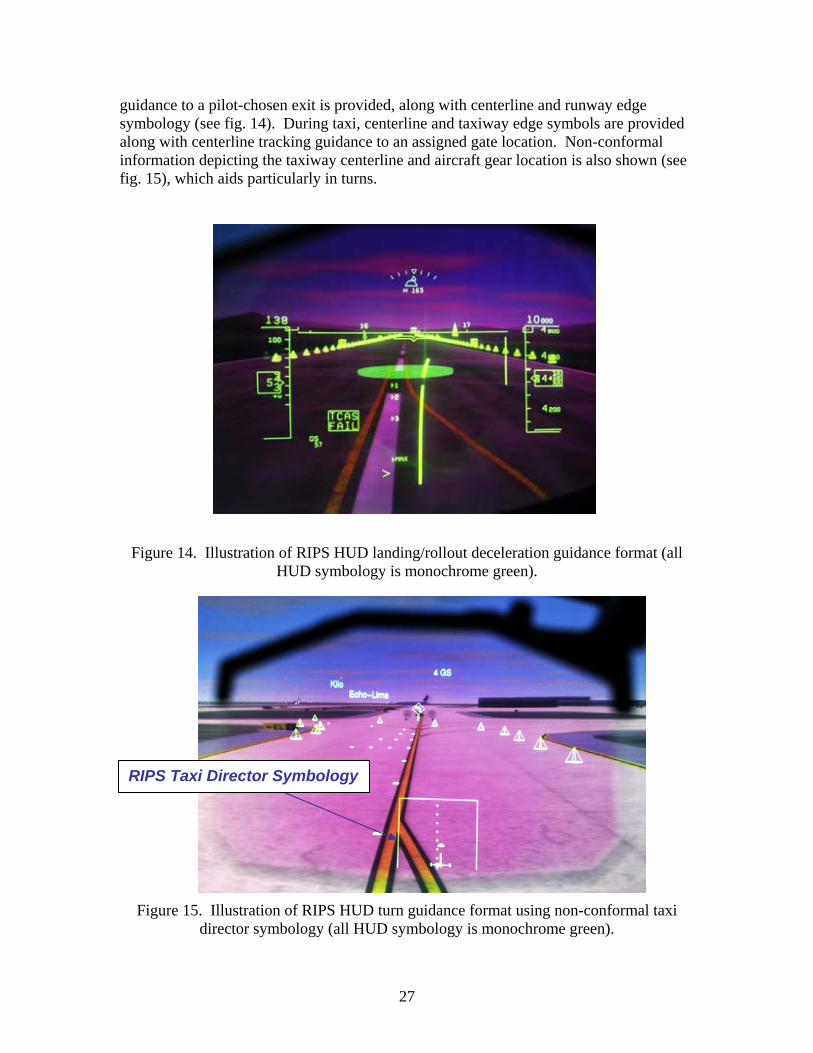
27
guidance to a pilot-chosen exit is provided, along with centerline and runway edge symbology (see fig. 14). During taxi, centerline and taxiway edge symbols are provided along with centerline tracking guidance to an assigned gate location. Non-conformal information depicting the taxiway centerline and aircraft gear location is also shown (see fig. 15), which aids particularly in turns.
Figure 14. Illustration of RIPS HUD landing/rollout deceleration guidance format (all
HUD symbology is monochrome green).
Figure 15. Illustration of RIPS HUD turn guidance format using non-conformal taxi
director symbology (all HUD symbology is monochrome green).
RIPS Taxi Director Symbology

28
The EMM (see fig. 16) shows graphically a perspective track-up view of the airport layout, current ownship and traffic locations, and ATC instructions (including the approved taxi route and hold short locations). Runway incursion alerts are also generated and displayed to the flight crew, while runway incursion, route deviation, and crossing hold alerts are presented aurally. Upon landing and during taxi, the EMM is displayed in place of the ND (a pilot may also elect to display the EMM during final approach).
Figure 16. RIPS Electronic Moving Map (EMM).
Two algorithms for monitoring traffic and generating alerts for potential runway incursions, PathProx™ and RSM, were developed and evaluated under the SVS Project. RSM (Green, 2006) uses a generic approach for detecting and generating incursion alerts and is not designed to detect only specific incursion scenarios. The RSM monitors traffic that enters a three-dimensional virtual protection zone around the runway that is being used by the ownship. Incursion detection is based on the operational state of the ownship and traffic, as well as other criteria (separation and closure rate), to avoid false alerts. Identification, position, and altitude data is used to track the traffic in the protection zone. Traffic data projections are calculated within RSM since, from flight test experience, reliable position updates are not received at consistent intervals. RSM generates a Warning alert, which occurs when a runway incursion is detected and evasive action is required to avoid a potential collision. Information provided with each alert includes identification of the incurring traffic and separation distance to potential conflict. RSM was developed for NASA by Lockheed Martin.
The PathProx™ detection algorithm (Cassell et al., 2003) works on the same general premise as the RSM, utilizing runway zones and tracking of traffic within that zone. However, PathProx™ is specifically designed to handle over 40 specific runway incursion scenarios. Alerts are issued based on the states of the ownship and traffic and on conditions including position, speed, and track angle. PathProx™ generates two types of alerts analogous to the TCAS approach. A Caution alert (Runway Traffic) informs the

29
flight crew of a potential incursion or an incursion where the conflict does not yet require evasive action. The crew can take evasive action, however, at their discretion. PathProx™ also generates Warning alerts (Runway Conflict) when immediate evasive action is required. Information provided with each alert includes identification of the incurring traffic, the associated runway, and separation distance between the traffic and ownship. PathProx™ was developed by Rannoch Corporation.
The alerts are presented to the flight crew both visually on the displays and audibly. An audible enunciation is made in the flight deck (“Runway Traffic, Runway Traffic” for a RTA and “Runway Conflict, Runway Conflict” for a RCA). The textual forms of these alerts are presented on the HUD, PFD and ND / EMM (see fig. 17). On the ND and EMM, the traffic symbol representing the incurring vehicle is enlarged, changes color (yellow for RTA and red for RCA) and is highlighted by a target designator box. The identification tag is also highlighted. A target designator box also highlights the incurring traffic on the HUD and PFD. In the event the incurring traffic symbol is not shown because of the display scale or field-of-view, a symbol is pegged on the edge of the display in the direction of the traffic. The distance to the conflict is also shown on all the displays. Audible route deviation and crossing hold alerts are also generated by RIPS. Route deviation alerts are generated if the ownship leaves its assigned path during taxi. Crossing hold alerts are generated if the ownship crosses a hold line when not cleared to do so by ATC.
Figure 17. RIPS runway conflict alert on SVS HUD, PFD, and EMM displays.
3.1.3.3 Database Integrity Monitoring. The NASA CAB Integrated SVS Concept provides for real-time validation of the terrain Digital Elevation Models (DEMs)
SVS HUD
SVS PFD SVS EMM

30
and obstacle databases. During the Project this functional capability was instantiated for multiple experiments and referred to as Database Integrity Monitoring Equipment (DIME). DIME functionality allows the SVS designer to bound the integrity of the relative position of the DEMs with respect to the aircraft’s estimated position and attitude. DIME can make use of various ranging sensors including, for example: radar altimeters, forward-looking X-band Wx Radar (WxR), or omni-directional GPS Bi-Static Radar (GPSBR) technology. Integrity bounds are established for any sensor by using detection theory tenets and assuming a direct relationship between integrity potential and the probability of missed detection for a given DIME architecture. In general, DIME functions by comparing measurements (made by sensors) to expected values that are computed using estimates for position and attitude and the DEM.
Because its measurements are primarily in the vertical dimension (i.e. from nadir), radar altimeter measurements are most useful in detecting vertical errors, while the forward-looking sensors are more sensitive to lateral or angular errors (as well as obstacle hazards). A forward-looking capability also provides for increased time-to-alarm. Detecting problems along and in front of the flight path (see fig. 18) allows the pilot to maneuver the aircraft to avoid areas of uncertainty with respect to the DEM.
3.1.3.4 Enhanced Sensor Technologies. Enhanced Sensor Technologies for the NASA CAB Integrated SVS Concept include EVS imaging sensors (e.g., Forward-Looking Infra-Red, FLIR; Millimeter Wave Radar, MMWR), which are discussed first, and Advanced Hazard Detection Sensors (e.g., advanced WxR), which are discussed last, for hazard, object, and runway confirmation or misalignment detection, as well as terrain feature extraction to support Database Integrity Monitoring requirements.
Figure 18. Database Integrity Monitoring Equipment.
3.1.3.4.1 Enhanced Vision Systems Imaging Sensors. It appears quite possible that a complement of EVS imaging sensors may be included in the initial implementations of SVS in commercial transports equipped with HUDs to extend
GPSWAAS
Radar Altitude
Wx Radar
GPSWAAS
Radar Altitude
Wx Radar

31
operational capabilities and ease certification concerns, particularly for low visibility surface operations. EVS imaging sensors consist of active or passive sensors that are used to penetrate weather phenomena such as darkness, fog, haze, rain, and snow. Enhanced vision systems have been installed on military aircraft but have been infrequently found on commercial transport aircraft due to cost, complexity, and technical performance. However, with the recent action by the FAA in granting operational credit to aircraft equipped with EFVS, installation in commercial transport aircraft is expected to increase. Enhanced vision sensor imagery depends upon the external environment and the sensor characteristics. For example, high-frequency radars (e.g., 94 GHz) and infrared sensors may exhibit degraded range performance in heavy precipitation and certain fog types. On the other hand, low-frequency (e.g., 9.6 GHz) and mid-frequency (e.g., 35 GHz) radars have improved range, but often have poor display resolution. Active radar sensors can suffer from mutual interference when multiple users are in close proximity. Finally, present enhanced vision sensors do not extract color attributes which may potentially create misleading visual artifacts under certain temperature (such as daily thermal inversion) or radar reflectivity conditions. But in the use of FLIR imagery, for example, for low visibility surface operations, range performance degradation is less of an issue, and a grey-scale presentation of an obstruction on a runway or taxiway is better than no presentation at all.
The EVS image outputs are available, not only for traditional EVS image applications such as display as a raster image on a HUD or a SV-AD, but also for further image processing with both object and edge detection techniques for detection of obstacle conflicts and runway alignment errors. From this processing, system advisories to the pilot of detected alignment errors and obstacle conflicts, as well as iconic representations within the outside scene of detected objects are enabled. Such iconic presentations eliminate the need to train pilots in the use of sensor imagery to overcome the inherent visual artifacts present in weather-penetrating sensor imagery. Sensor imagery is also available for potential insertion/fusion in SVS scenes.
3.1.3.4.2 Hazard Detection Sensors. In addition to the utilization of EVS sensor image processing for hazard detection (obstacles, runway misalignment), the NASA CAB Integrated SVS Concept also employs an advanced X-band Multi-mode WxR, not only for the traditional provisions of Wx and wind shear detection information, but with new modes for advanced hazard detection. These new modes have both improved range and angular resolution to sufficiently detect and locate objects (preliminary results show that this technique can provide 1-3 meter range resolution and less than 1º of angular resolution, with 1/3º being a reasonable goal).
In today’s commercial transport fleet, by far the most common forward-looking sensor is the weather radar. Specifically, X-band pulse Doppler radars are used primarily to provide flight crews with a display of weather information and to provide forward-looking wind-shear detection capability. A secondary purpose, as described in ARINC (1999), is “ground-mapping to facilitate navigation by display of significant land contours”. Cramer, M.R. (1996) describes use of the radar ground-mapping mode in the narrow Gastineau Channel for Juneau, Alaska operations “to ‘paint’ the terrain in the channel. This provided an exceptional aid to crew situational awareness, adding to the integrity of the navigation, so the weather radar was added to the minimum equipment

32
list for using these procedures”. Although using the WxR display to aid navigation was historically a pilot-specific talent derived from extensive use of the device, recent work has shown that integration with DEMs can be used to supplement on-board navigation systems and to detect potential ground-based hazards (man-made objects such as towers or terrain of significant height) (Dieffenbach, 1995 Ammar, 1999; Morici 2001). Utilization of this mode of the WxR enables the integrity monitor to use feature extraction techniques along with a statistical assessment of similarity measures between the sensed and stored DEM features that are detected to surmount the shortcomings of forward-looking sensors alone. Thus the advanced modes of the WxR can provide information enabling the database integrity monitor to provide both a confirmation of database integrity and a registration function (navigational position confirmation via terrain feature extraction). The integrity monitor would warn the pilot whenever the SVS is operating in a degraded mode and that continued flight along the same trajectory may be hazardous.
In an air-to-air application mode, the advanced WxR can be used to detect airborne traffic that have at least 1 square meter radar cross section within approximately 6NM and angularly within the field-of-view of the radar to supplement, in blended fashion, surveillance information from TCAS, ADS-B and TIS-B sources as well as to protect against non-cooperative (non-transmitting) traffic.
In an air-to-ground application mode, the advanced WxR can be used to detect unmapped ground towers, to provide runway location to position the runway confirmation or misalignment wire-frame display element on the SVS PFD (see fig. 19; verifiably, the wire-frame overlays the synthetic runway), to detect runway obstacles, and to provide terrain features for the DIME functionality. The advanced WxR has “ground mapping” capabilities to generate a map of the terrain in front of the aircraft to enable detection of mapped / unmapped ground towers and other terrain features with significant height (e.g., those that impinge upon flight altitudes or upon required obstacle clearance boundaries) and to provide terrain features for the integrity monitor. A different form of Terrain Feature Extraction is used to locate the runway using a nominal ownship location and an airport database. Once the radar has confirmed the location of the runway, it switches to verifying that the runway is clear of any large objects, including other aircraft, airport vehicles, or major debris.
In a ground-to-ground application mode, the radar uses an ultra-short range configuration and continues to locate ground traffic / obstacles during runway / taxi operations. This information is blended with other available surface surveillance information (e.g., ASDE, TIS-B). And finally, in a ground-to-air mode, the radar searches the airspace in front of the departing ownship to detect neighboring airborne traffic.
3.2 System Aspects for General Aviation Aircraft Unlike transport and business jet aircraft, low-end GA aircraft with installed
electronic displays such as HUDs and Flight Management Displays (FMD) are very rare. Although today many useful GPS-based pilot aiding devices are available to the GA pilot on the commercial market, no operational credit is offered by such portable devices. Separate aircraft attitude information and vacuum systems are only standard in high-end GA aircraft. Such severe restrictions are imposed because display space, equipment
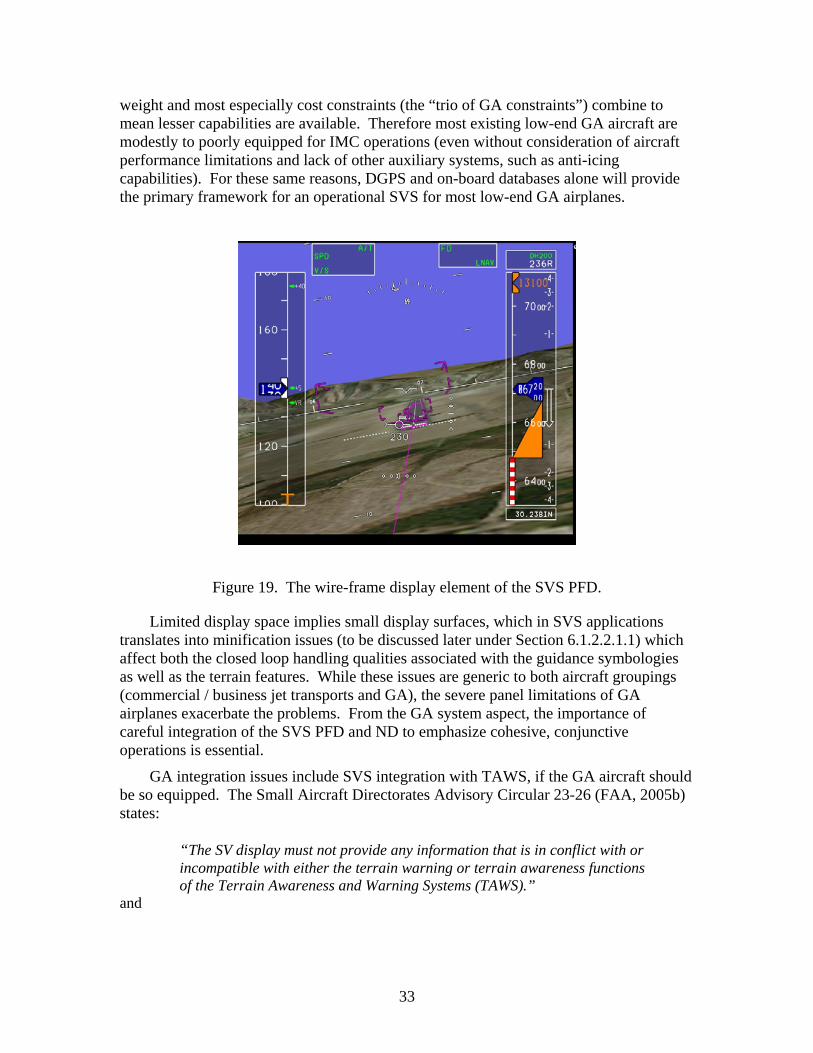
33
weight and most especially cost constraints (the “trio of GA constraints”) combine to mean lesser capabilities are available. Therefore most existing low-end GA aircraft are modestly to poorly equipped for IMC operations (even without consideration of aircraft performance limitations and lack of other auxiliary systems, such as anti-icing capabilities). For these same reasons, DGPS and on-board databases alone will provide the primary framework for an operational SVS for most low-end GA airplanes.
Figure 19. The wire-frame display element of the SVS PFD.
Limited display space implies small display surfaces, which in SVS applications
translates into minification issues (to be discussed later under Section 6.1.2.2.1.1) which affect both the closed loop handling qualities associated with the guidance symbologies as well as the terrain features. While these issues are generic to both aircraft groupings (commercial / business jet transports and GA), the severe panel limitations of GA airplanes exacerbate the problems. From the GA system aspect, the importance of careful integration of the SVS PFD and ND to emphasize cohesive, conjunctive operations is essential.
GA integration issues include SVS integration with TAWS, if the GA aircraft should be so equipped. The Small Aircraft Directorates Advisory Circular 23-26 (FAA, 2005b) states:
“The SV display must not provide any information that is in conflict with or incompatible with either the terrain warning or terrain awareness functions of the Terrain Awareness and Warning Systems (TAWS).”
and
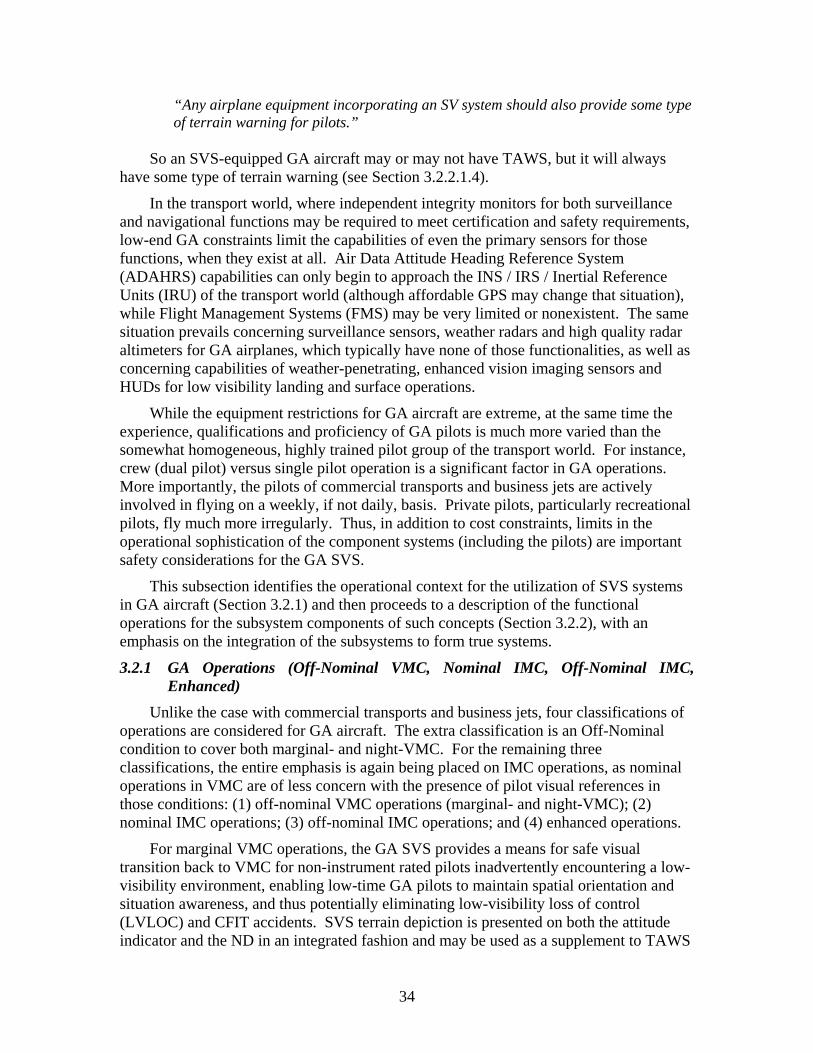
34
“Any airplane equipment incorporating an SV system should also provide some type of terrain warning for pilots.”
So an SVS-equipped GA aircraft may or may not have TAWS, but it will always
have some type of terrain warning (see Section 3.2.2.1.4).
In the transport world, where independent integrity monitors for both surveillance and navigational functions may be required to meet certification and safety requirements, low-end GA constraints limit the capabilities of even the primary sensors for those functions, when they exist at all. Air Data Attitude Heading Reference System (ADAHRS) capabilities can only begin to approach the INS / IRS / Inertial Reference Units (IRU) of the transport world (although affordable GPS may change that situation), while Flight Management Systems (FMS) may be very limited or nonexistent. The same situation prevails concerning surveillance sensors, weather radars and high quality radar altimeters for GA airplanes, which typically have none of those functionalities, as well as concerning capabilities of weather-penetrating, enhanced vision imaging sensors and HUDs for low visibility landing and surface operations.
While the equipment restrictions for GA aircraft are extreme, at the same time the experience, qualifications and proficiency of GA pilots is much more varied than the somewhat homogeneous, highly trained pilot group of the transport world. For instance, crew (dual pilot) versus single pilot operation is a significant factor in GA operations. More importantly, the pilots of commercial transports and business jets are actively involved in flying on a weekly, if not daily, basis. Private pilots, particularly recreational pilots, fly much more irregularly. Thus, in addition to cost constraints, limits in the operational sophistication of the component systems (including the pilots) are important safety considerations for the GA SVS.
This subsection identifies the operational context for the utilization of SVS systems in GA aircraft (Section 3.2.1) and then proceeds to a description of the functional operations for the subsystem components of such concepts (Section 3.2.2), with an emphasis on the integration of the subsystems to form true systems.
3.2.1 GA Operations (Off-Nominal VMC, Nominal IMC, Off-Nominal IMC, Enhanced)
Unlike the case with commercial transports and business jets, four classifications of operations are considered for GA aircraft. The extra classification is an Off-Nominal condition to cover both marginal- and night-VMC. For the remaining three classifications, the entire emphasis is again being placed on IMC operations, as nominal operations in VMC are of less concern with the presence of pilot visual references in those conditions: (1) off-nominal VMC operations (marginal- and night-VMC); (2) nominal IMC operations; (3) off-nominal IMC operations; and (4) enhanced operations.
For marginal VMC operations, the GA SVS provides a means for safe visual transition back to VMC for non-instrument rated pilots inadvertently encountering a low-visibility environment, enabling low-time GA pilots to maintain spatial orientation and situation awareness, and thus potentially eliminating low-visibility loss of control (LVLOC) and CFIT accidents. SVS terrain depiction is presented on both the attitude indicator and the ND in an integrated fashion and may be used as a supplement to TAWS
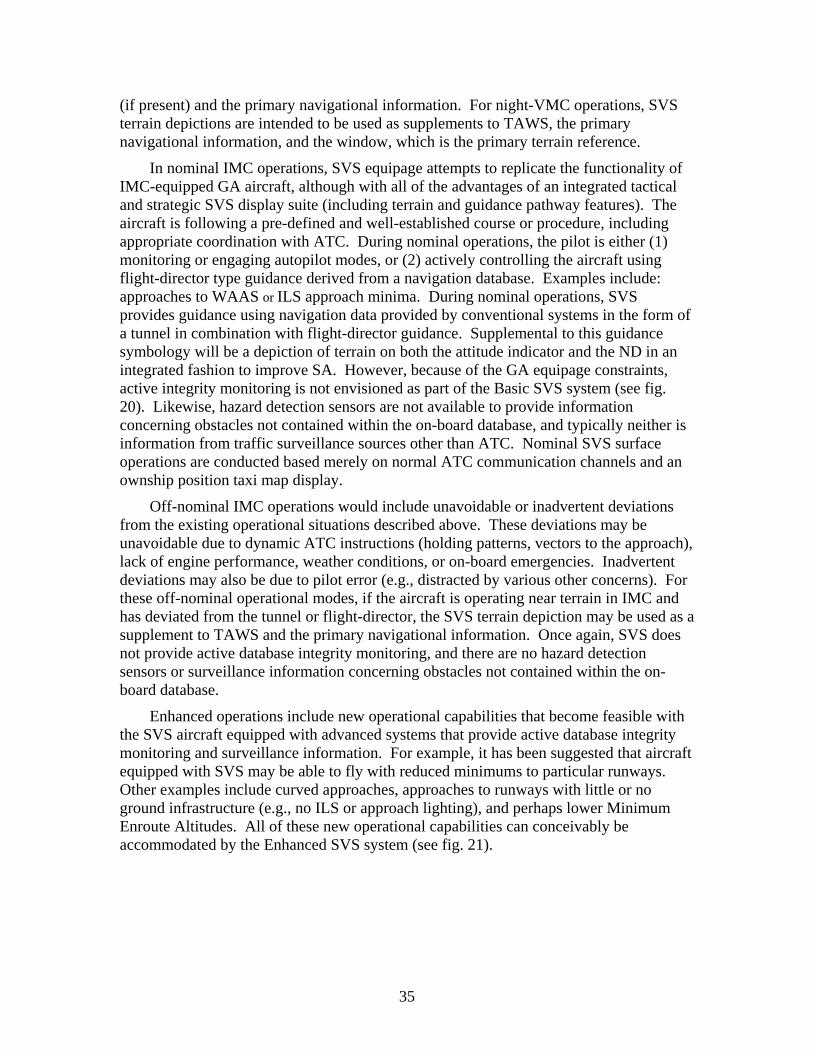
35
(if present) and the primary navigational information. For night-VMC operations, SVS terrain depictions are intended to be used as supplements to TAWS, the primary navigational information, and the window, which is the primary terrain reference.
In nominal IMC operations, SVS equipage attempts to replicate the functionality of IMC-equipped GA aircraft, although with all of the advantages of an integrated tactical and strategic SVS display suite (including terrain and guidance pathway features). The aircraft is following a pre-defined and well-established course or procedure, including appropriate coordination with ATC. During nominal operations, the pilot is either (1) monitoring or engaging autopilot modes, or (2) actively controlling the aircraft using flight-director type guidance derived from a navigation database. Examples include: approaches to WAAS or ILS approach minima. During nominal operations, SVS provides guidance using navigation data provided by conventional systems in the form of a tunnel in combination with flight-director guidance. Supplemental to this guidance symbology will be a depiction of terrain on both the attitude indicator and the ND in an integrated fashion to improve SA. However, because of the GA equipage constraints, active integrity monitoring is not envisioned as part of the Basic SVS system (see fig. 20). Likewise, hazard detection sensors are not available to provide information concerning obstacles not contained within the on-board database, and typically neither is information from traffic surveillance sources other than ATC. Nominal SVS surface operations are conducted based merely on normal ATC communication channels and an ownship position taxi map display.
Off-nominal IMC operations would include unavoidable or inadvertent deviations from the existing operational situations described above. These deviations may be unavoidable due to dynamic ATC instructions (holding patterns, vectors to the approach), lack of engine performance, weather conditions, or on-board emergencies. Inadvertent deviations may also be due to pilot error (e.g., distracted by various other concerns). For these off-nominal operational modes, if the aircraft is operating near terrain in IMC and has deviated from the tunnel or flight-director, the SVS terrain depiction may be used as a supplement to TAWS and the primary navigational information. Once again, SVS does not provide active database integrity monitoring, and there are no hazard detection sensors or surveillance information concerning obstacles not contained within the on-board database.
Enhanced operations include new operational capabilities that become feasible with the SVS aircraft equipped with advanced systems that provide active database integrity monitoring and surveillance information. For example, it has been suggested that aircraft equipped with SVS may be able to fly with reduced minimums to particular runways. Other examples include curved approaches, approaches to runways with little or no ground infrastructure (e.g., no ILS or approach lighting), and perhaps lower Minimum Enroute Altitudes. All of these new operational capabilities can conceivably be accommodated by the Enhanced SVS system (see fig. 21).

36
Figure 20. Block diagram of Basic SVS Concept for GA aircraft.
3.2.2 The Integrated GA SVS Concept The Basic SVS for GA aircraft does not modify current operational principals and
procedures, either VMC or IMC, as conventionally determined by aircraft equipage and pilot qualification. The second category, the Integrated GA SVS Concept, is a GA Enhanced SVS system with more capable SVS equipment that is envisioned to obtain operational credit in terms of advanced operational capabilities. In terms of display
Aircraft State Data • ADAHRS • INS’s , IRU’s (?) • Radar altimeters (?) • etc.
Aircraft Nav Data
• DGPS/WAAS • FMS (?) • etc.
Databases • Terrain • Obstacles • Airports • Cultural
Caution & Warning Systems • TAWS • etc.
SVS Display Concepts • Terrain • Pathway • Obstacles
SVS PFD or Attitude Indicator
SVS Nav D or Taxi-map
Runway Incursion Prevention System• Surface map with ownship position
Legend for Subsystems
Normal Aircraft SVS Subsystems

37
Figure 21. Block diagram of Enhanced SVS Concept for GA aircraft.
elements, however, the differences between the Basic system and the Enhanced system are in whether or not there is a large enough display for an integrated PFD, an accounting for the real time elements (i.e., traffic) not present in the on-board databases, and whether or not there is active database integrity monitoring. A Basic SVS system, because of a small display, may not have integrated airspeed and altitude data on the attitude indicator, relying instead on mechanical gauges for airspeed and altitude in a manner similar to a CAB Size-A display (see fig. 7). For the purposes of this paper, it will be assumed that a large enough display will exist to present an integrated PFD. More significantly, the Basic SVS system provides no surveillance information and no active database integrity monitoring. Only the integration of tactical and strategic SVDCs is provided. The
Aircraft State Data • ADAHRS • INS’s , IRU’s (?) • Radar altimeters • etc.
Aircraft Nav Data • DGPS/WAAS • FMS (?) • etc.
Aircraft Surveillance Data • TCAS (?) • ADS-B • TIS-B (?) • ASDE (?) • TIDS (?) • etc.
Caution & Warning Systems • TAWS • etc.
Enabling Sensors • GPSBR • etc.
Hazard Detection System • Traffic • Terrain
Database Integrity Monitor System • Database integrity confirmation • Integrity Loss Alerts
SVS Display Concepts • Terrain • Pathway • Obstacles • Traffic
SVS PFD
Runway Incursion Prevention System • Surface map with ownship, route, traffic • Incursion & route deviation alerts
Legend for Subsystems Normal Aircraft SVS Subsystems
Databases • Terrain • Obstacles • Airports • Cultural
SVS Nav D or EMM

38
Enhanced SVS system encompasses the integration of tactical and strategic SVDCs with surveillance information (available, for example, from ADS-B, TIS-B, ASDE, etc.), RIPS alerting algorithms and head-down display concepts, and real-time terrain DIME functionality. However, because of the “trio of GA constraints”, hazard detection sensors are assumed to be not available to provide information concerning obstacles not contained within the on-board database for either system.
For organizational convenience, the system concepts are discussed in the following topic order: SVS Display Concepts, Runway Incursion Prevention System, and Database Integrity Monitoring.
3.2.2.1 SVS Display Concepts. The SVDCs embody the human-machine interface to the SVS concept for the pilots, providing the integration of tactical and strategic information necessary for operations in the NAS. These display elements are presented on the PFD and ND displays. In addition to flight operations, the ND also presents the strategic display concept for surface operations (including, for the Enhanced SVS system, the RIPS functionality discussed below in Section 3.2.2.2) and employs symbology transition strategies for air-to-ground operations and ground-to-air operations. Display elements, including terrain and flight path, are presented on both the primary flight display and the ND in an integrated fashion (and CDTI is also presented on both displays for the Enhanced SVS).
For organizational convenience, the display concepts are discussed in the following topic order: PFD, ND, Display Integration, and SVS Tunnel / Terrain Conflict Detection Algorithm.
3.2.2.1.1 PFD. The GA SVS PFD is an adaptation of the egocentric SVS PFD for CAB with the integrated analog / digital “tape” presentations for airspeed, vertical speed, and altitude. The GA Basic SVS PFD (see fig. 22) incorporates only the terrain presentation with airborne pathway guidance information, as surveillance information and surface guidance are not available because of the “trio of GA constraints”. The GA Enhanced SVS PFD includes the requisite sensor and / or receiver technologies to provide CDTI. Neither the GA Basic nor the Enhanced SVS PFD has a surface operations mode, as only strategic information is provided for surface operations. Again, the most important symbology element incorporated into the tactical display is probably the velocity vector. And since tactical displays have some strategic elements, just as strategic displays have some tactical elements, a careful integration of the SVS PFD and ND to emphasize cohesive, conjunctive operations is essential.
3.2.2.1.2 ND. The GA Basic SVS ND is an exocentric coplanar “gods’-eye view” navigation display that incorporates terrain (see fig. 23) with TAWS caution and warning overlays. The Enhanced SVS ND provides available surveillance information conformal to the CDTI MOPS.
3.2.2.1.3 Display Integration. Similar opportunities to those that arose to apply human factors display integration principles to the CAB tactical and strategic SVS displays occur with GA SVS displays. For example, FOV lines are drawn to enclose the forward area on the ND encompassed by the view presented on the SVS PFD (see fig. 23). The GA Basic SVS does not employ CDTI traffic symbology as the enabling sensors and / or TIS-B receivers for supplying such information elements are not present
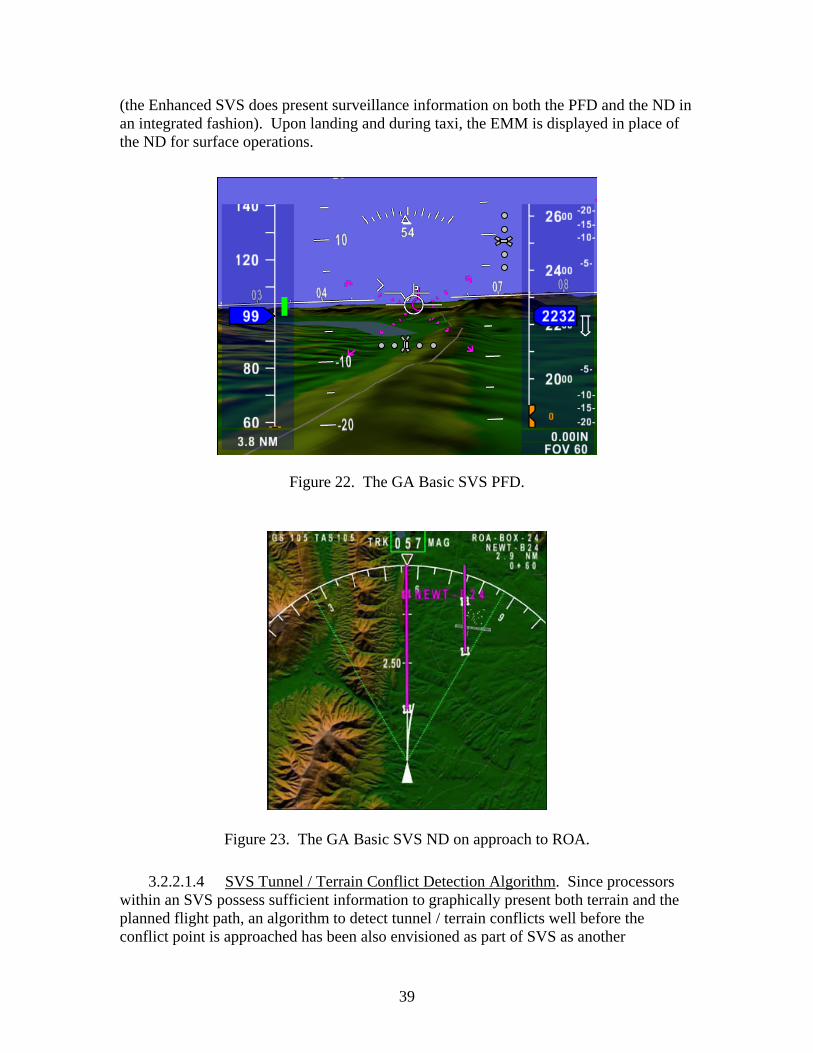
39
(the Enhanced SVS does present surveillance information on both the PFD and the ND in an integrated fashion). Upon landing and during taxi, the EMM is displayed in place of the ND for surface operations.
Figure 22. The GA Basic SVS PFD.
Figure 23. The GA Basic SVS ND on approach to ROA.
3.2.2.1.4 SVS Tunnel / Terrain Conflict Detection Algorithm. Since processors within an SVS possess sufficient information to graphically present both terrain and the planned flight path, an algorithm to detect tunnel / terrain conflicts well before the conflict point is approached has been also envisioned as part of SVS as another
40
independent check and balance feature. Unlike TAWS, which follows the “warn-act” model and therefore requires the flight crew to be reactive, the SVS technology is proactive and provides a warning before the flight crew has encountered a flight path / terrain problem.
3.2.2.2 Runway Incursion Prevention System. NASA has developed a version of RIPS for the GA Enhanced SVS to improve airport safety by providing supplemental surface situational awareness information, and alerts of runway conflicts and route deviations directly to the pilot. This version of RIPS, which includes a perspective track-up view of the airport layout, current position of the ownship, current positions of other traffic, and ATC instructions (provided that Controller-Pilot Data Link Communication (CPDLC) exists), is essentially the same as that developed for commercial operations, with a few exceptions. Although RIPS was developed to function optimally for aircraft equipped with a HUD, aircraft without a HUD (i.e., most GA aircraft) can still benefit from the surface situational awareness information cues, and the alerts of runway conflicts and route deviations. Jones (2002) demonstrated conclusively that RIPS can be effective with only the EMM. Also, since many GA aircraft operate at small, non-towered, minimally equipped airports, traffic surveillance is achieved through ADS-B or TIS-B technology and, therefore, is not reliant on airport surface surveillance systems (although other traffic surveillance sources can be utilized, if available).
The GA Basic SVS is not equipped to receive or display traffic information or data linked ATC instructions and therefore is only able to utilize the EMM as a taxi map for position awareness. No RIPS alerts are possible.
3.2.2.3 Database Integrity Monitoring. It was recognized within the Project that the GA Enhanced SVS would require DIME functionality to provide database integrity monitoring in order to achieve the emulation of day-VMC operations in low visibility conditions. However it is unlikely that a monitor based on a forward-looking X-band WxR would be affordable for most GA operators. The GA Enhanced SVS is therefore envisioned as equipped, aside from conventional IMC navigational systems (DGPS, INS, IRUs), with a downward-looking radar altimeter (DLRA) as a component part of a DIME approach to provide database integrity monitoring for detecting vertical DEM errors only. The operating range of a typical DLRA is zero to 2500 feet AGL, but the operational concept suggests DEM integrity is only needed at lower altitudes. Should technology maturation of a GPSBR occur as a component of a Forward Looking Autonomous Integrity Monitor (FLAIM), both lateral and vertical monitoring would be possible (see Section 6.1.6.3). The DIME functionality would warn the pilot should integrity be lost that the SVS is operating in a degraded mode and that continued flight along the same trajectory may be hazardous.
4. SVS Benefits Synthetic Vision systems are intended to reduce accidents by improving a pilot’s
situation and spatial awareness during low- visibility conditions, including night and IMC. Synthetic vision technologies are most likely to help reduce the types of accidents which can be attributed to be visibility-induced crew error, where better pilot vision would have been a substantial mitigating factor (e.g., CFIT, Low Visibility Loss of Control, and Runway Incursion accidents). Better pilot vision is provided by synthetic
41
vision display systems. These technologies will serve as a substantial mitigating factor for aircraft accidents of other types as well.
The potential benefits to be discussed within this section assume the integration of SVS technologies into a true system that provides more than just a display of terrain information. In that regard, a Synthetic Vision System takes advantage of many enabling technologies that, together, create an operational avionics system, including the display of the external environment, with independent, redundant information sources to enable substantially improved performance and enhanced operational capabilities. Numerous analytical, simulator and flight test studies comparing SVS to conventional displays have documented the potential of SVS displays for providing improved aviation safety, enhanced pilot vehicle performance, and increased NAS capacity. Improved aviation safety is conjectured through demonstrated increases in situation awareness with respect to terrain, traffic, flight path and other external hazards. Such conjectures have been validated though simulation studies where pilots were intentionally led into a CFIT situation or into other hazardous scenarios that were successfully avoided though the use of the synthetic vision system (e.g., Arthur et al., 2004a). Intuitive display and presentation methods off-load the pilots from basic spatial awareness tasking (e.g., to avoid terrain, traffic, and obstacles) and increase their speed of situation recognition. These gains have been demonstrated particularly during approaches and departures at terrain-challenged airports (e.g., Bailey et al., 2002b) and in surface operations at operationally-complex air terminals (e.g., Jones et al., 2001). Study results have consistently shown that SVS display concepts have provided enhanced pilot vehicle performance in terms of more precise hand-flown path control and significantly improved spatial awareness, as evidenced by reduced flight technical error (FTE) and quickened hazard detection and avoidance response times (e.g., Arthur et al., 2004a). These gains in performance were accompanied by equivalent or, in most cases, reduced pilot workload. Further, it has been hypothesized that NAS capacity could increase due to the potential for increased visual-like operations (e.g., 3 nm in-trail separations) gate-to-gate even under restricted weather conditions (e.g., as low as Category IIIb minimums). However, this particular hypothesis has yet to be tested.
Most of the benefits that have been attributed to SVS are generic in their applications to both commercial transport / business jet and general aviation aircraft groupings, while a few are specific to a particular aircraft group. However, as any assessment of benefits may be enhanced by an understanding of the specific issues being addressed, and for organizational convenience, much of the ensuing discussion is parsed by two aircraft groupings: Commercial Transports/Business Jets and General Aviation aircraft.
4.1 Commercial Transports / Business Jets Commercial aviation is among the safest modes of transportation. However, the
growing demand to fly regardless of the weather has led to an accident rate that is far from ideal. Aircraft accidents serve as powerful reminders of the risks involved and how much safer flying can and should be. As previously discussed, SVS systems offer the potential to eliminate low-visibility conditions as casual factors in civil aircraft flight accidents. The SVS Project targeted specific accident categories for CAB aircraft, including runway incursions, approach and landing accidents and incidents, and CFIT accidents.

42
Technology has advanced that allows for the emergence of synthetic vision systems that can fundamentally change how aircraft are operated in IMC. By creating virtual VMC, synthetic vision has the potential to eliminate a common precursor to many accidents and incidents (i.e., limited visibility) and substantially improve the safety and operational efficiency of aviation. However, to achieve its fullest potential, the SVS system must have performance, reliability, integrity, and safety functionally equivalent to today’s CAT IIIb systems. For organizational convenience, the safety benefits are discussed first, followed by the operational benefits.
4.1.1 Safety Benefits Synthetic Vision Systems are characterized by the ability to represent visual
information and cues of the environment external to the aircraft that are intuitive and resemble visual flight conditions with unlimited ceiling and visibility. As an illustration of the safety benefits of SVS, consider the rare event scenario results of Arthur et al. (2004a). As part of a larger simulation study, each pilot flew twenty-two approach – departure maneuvers in IMC to the terrain challenged EGE in Colorado. For the final run, flight guidance cues were altered such that the departure path for each evaluation pilot went into terrain. All pilots with an SVS PFD (twelve of sixteen pilots) noticed and avoided the potential CFIT situation. The four pilots who flew the anomaly with the conventional baseline PFD configuration, which included a TAWS and a VSD on an enhanced ND, had a CFIT event. Additionally, data metrics from the entire experiment revealed that all of the SVS display concepts enhanced the pilots’ situational awareness, decreased workload and improved FTE compared to the baseline display configuration, during the numerous nominal and the single anomalous operations.
In terms of safety benefits (Williams et al., 2001; Hasan et al., 2002b; Hasan et al., 2002a; Prinzel et al., 2004e), synthetic vision may help to reduce many accident precursors, including:
• Loss of vertical and lateral path awareness (spatial awareness) • Loss of terrain and traffic awareness • Loss of altitude awareness • Unclear escape or go-around path even after recognition of problem • Transition from instruments to visual flight • Loss of situation awareness relating to the runway environment • Non-compliance with ATC clearances • Loss of situation awareness relating to the airport surface environment • Loss of traffic awareness on the surface • Unclear path guidance on the surface • Unusual attitude • Spatial disorientation
SVS is postulated to emulate day-VMC in limited visibility conditions, including
night and poor weather. Using SVS, the overall incident / accident rate is expected to approach that of day-VMC. Some of the expected safety benefits are:
• Reduction in CFIT accidents, including landing short of the runway accidents
43
• Reduction in runway incursion incidents and accidents • Improved situation awareness • Improvement in unusual-attitude / upset recovery • Improved non-normal situation management • Improved emergency operations (such as one-engine-out operations) • Improved compliance with ATC clearances
These safety benefits should be particularly evident during non-normal and
emergency situations. In these non-normal events, mental workload and tasking / attentional demands placed on the pilot are high (Prinzel et al., 2005c). SVS provides for improved pilot detection, identification, geometry awareness, prioritization, action decision and assessment, and overall situation awareness not afforded by today’s avionics. These improvements allow the pilot to be proactive in avoiding hazardous conditions instead of reactive to alert cautions and warnings with traditional cockpit displays.
4.1.2 Operational Benefits Despite the safety benefits provided by SVS, operational and economic benefits
must be considered for Part 121 and 135 operations because of the costs associated with implementation of these systems and the very small profit margins associated with commercial flights. Conventional technologies enable aircrews to conduct en route operations in all-visibility conditions as well as low visibility approaches and landings to appropriately equipped runways. Analyses have shown that SVS could serve to increase NAS capacity by providing the potential for increased visual-like operations gate-to-gate even under extreme visibility restricted weather conditions (e.g., Category IIIb minimums). For example, a NASA-sponsored cost-benefit analysis of 10 major US airports calculated the average cost savings to airlines for the years 2006 to 2015 to be $2.25 Billion (Hemm et al., 2001). While these savings are predicated on several technology developments and successful implementation / certification, this analysis indicates the potential order of magnitude savings and operational efficiencies offered by these technologies.
SVS features (e.g., surface guidance, taxi maps, tunnels / pathways / highways-in-the-sky, velocity vectors, command guidance cues) allow pilots to rapidly and accurately correlate ownship position to relevant terrain, desired flight paths / plans, cultural features, and obstacles. These elements enable the pilot to monitor navigation precision in order to comply with complex approach and departure procedures, such as Required Navigation Performance (RNP), Area Navigation (RNAV), Global Navigation Satellite System Landing System (GLS), curved, step-down, or noise abatement procedures, without the need for ground-based navigation aids (e.g., ILS; Very high frequency Omnidirectional Range navigation system, VOR; Distance Measuring Equipment, DME; Automatic Direction Finder, ADF; Non-Directional Beacon, NDB; LOng RAnge Navigation, LORAN) that are expensive to install and maintain.
As an example of the enhanced operations provided by SVS, consider the results of two NASA studies that have addressed RNP operations (Kramer et al., 2004b; Arthur et al., 2005). Those two studies found that SVS would enable manual RNP operations that

44
are significantly smaller for lateral RNP (5 and 2.5 times smaller, respectively) and within required vertical performance accuracy values than similar operations with conventional instruments. The outcome would be an increase in the number of RNP operations to runways that otherwise would not meet current Minimum Aviation System Performance Standards (MASPS; RTCA, 2000), resulting in a significant economic advantage to airlines employing SVS technology (Hemm, 2000; Hemm et al.., 2001).
Operational benefits of synthetic vision systems (Williams et al., 2001), characterized as clear day flight operations, regardless of the actual outside visibility condition, may include:
• Provision for more approach and departure options • Reduced departure and arrival minimums • Reduced converging and circling approach visibility minimums • More flexible low visibility approach operations (e.g., RNAV and RNP
procedures) to Type I and non-ILS runways • Better allowance for converging and circling approaches, especially for dual and
triple runway configurations • Potential transference of in-trail and lateral spacing from ATC to the aircrew
(self-spacing and station keeping capability) regardless of visibility • Reduced inter-arrival separations • Provision for independent operations on closely-spaced parallel runways • Provision for precise noise abatement operations in all weather conditions • Better RNP adherence • Provision of 4D navigation capability • Oceanic route optimization, spacing, and ownship reporting • Enhanced path guidance, compliance monitoring, and alerting • Intuitive depiction of terminal, restricted and special use airspace • Intuitive depiction of traffic and weather hazards and resolutions • Enhanced mission planning / rehearsal capability • Intuitive depiction of ATC cleared flight paths and taxi clearances • Enhanced surface operations (e.g., rollout, turn off and hold short, taxi) • Reduced runway occupancy time in low visibility • Increased operational efficiency with faster taxi times in IMC • Potentially reduced training requirements due to intuitive nature of information
presentation • Piloting aid support (e.g., flare guidance, runway remaining, navigation guidance) • Enhanced flight management
In addition to supporting nominal, off-nominal, and enhanced operations, SVS will
provide intuitive visual support to pilots in emergency situations. In periods of loss of control or other non-normal scenarios during which crew attention is diverted, SVS provides improved situation awareness (e.g., ownship position relative to terrain and obstacles). The likelihood of human errors with auxiliary systems and / or navigational tasks because of the high workload conditions will be reduced. SVS assets for these types of scenarios could include:
45
• Intuitive cues for upset recognition / recovery, and loss of control recovery • Improved situation awareness (terrain, traffic, Wx) during emergency descent
(e.g., engine out drift down, smoke / fire, depressurization) • Intuitive depiction of missed approach path and guidance • Intuitive depiction of emergency approach terrain and obstacles • Enhanced support and guidance for emergency procedures • Alternate airport and runway diversion planning
4.2 General Aviation Within a report of the 1999 NTSB accident database (AOPA, 2000), GA accounted
for 85 percent of all aviation accidents and 65 percent of all aviation fatalities. The leading cause of GA fatal accidents is loss of the horizon for any reason. This could be due to darkness, IMC, haze, or low visibility. The majority of low end GA pilots do not have the vast experience of commercial jet pilots, and are therefore more easily disoriented in low visibility conditions with often-tragic results. The combination of darkness and IMC increased the proportion of fatal to total accidents to 64.3 percent, making it the most deadly GA flight environment.
Within the fatal accident category, CFIT and LVLOC accidents outnumber all other types. Spatial disorientation induced by inadvertent flight into IMC continues to be a leading cause of the fatal accidents. In fact, AOPA (2002) states that accidents that resulted from attempted VFR flight into IMC by non-IFR rated pilots were fatal 84% of the time. At present, an immediate exit from IMC is the only recourse a VFR pilot has to avoid the perils that accompany the loss of out-the-window (OTW) visibility.
While the FAA’s official definition for runway incursion does not include events at uncontrolled airports (since the Controller determines whether there is an incursion and then reports that occurrence to the FAA), the reported incursion rate for GA at controlled airports is higher than for commercial transports. Further, the number of incursions where both aircraft involved are GA is the highest category (FAA, 2003).
Synthetic Vision systems for GA aircraft are intended to reduce these accidents, all of which were targeted by the SVS Project, by improving a pilot’s situation and spatial awareness during low- visibility conditions, including night and IMC, while providing the benefits of day-VMC operations. Because of the tremendous variation in GA aircraft capabilities and equipages, and pilot experience, proficiency, and currency, two categories of GA SVS systems were considered during the SVS Project. The first category, the “Basic SVS” for GA aircraft, is envisioned to just replicate current operations, while the second category, the GA “Enhanced SVS” is envisioned to obtain operational credit in terms of advanced operational capabilities.
For organizational convenience, the safety benefits are discussed first for both system categories, followed by the operational benefits of the enhanced system.
4.2.1 Safety Benefits SVS for GA aircraft is expected to significantly reduce the occurrence of CFIT and
LVLOC by providing virtual clear-VMC during low visibility day time (marginal) VMC,

46
at night or during IMC. This capability can provide a means for safe visual transition back to VMC for non-instrument rated pilots who inadvertently encounter a low visibility environment, and enhanced operational safety for instrument rated pilots. When non-instrument rated pilots encounter a low visibility environment and must rely on the aircraft instruments for attitude information, they often become spatially disoriented and experience Low-Visibility induced Aircraft Upset (LV AU). LV AU without recovery might lead to a LVLOC accident. The presence of computer-generated terrain on the primary flight display should enable low-time GA pilots to maintain spatial orientation and situation awareness, and thus eliminate LVLOC and CFIT accidents. In addition, the concept of being “IFR-rated” could also conceivably change in the presence of SVS displays. Results from many NASA studies have indicated that low-time VFR pilots perform as well, and report similar situation awareness and workload during IMC, as pilots with thousands of hours and substantially greater pilot training. It is possible that pilots with SVS displays could be “IFR-rated/SVS-Only”.
As an illustration of the safety benefits of SVS, consider the rare event scenario results of Prinzel et al. (2003). As part of a larger GA simulation study, each pilot flew 35 low altitude en route and approach maneuvers in IMC to ROA. The rare event CFIT scenario consisted of a situation in which, supposedly, the pilot incorrectly set the barometric altimeter to read 1500 feet higher than actual altitude. Such an error would affect both the altimeter and the other conventional display readings (i.e., the MX-20, which was used as a multifunction map display), but not the SVS display because that system was assumed to receive its altitude input from the GPS receiver. The CFIT scenario resembled 11 of the previous 34 trials that began straight-and-level at 6500 ft MSL (4000 ft AGL) with instructions to make a left-bank turn and descend after two minutes to 5000 ft MSL (1000 ft AGL) over rising terrain. The scenario began in VMC with visibility deteriorating to IMC within one-minute elapsed time. The CFIT scenario started at 5000 ft MSL, but the altimeter showed 6500 ft MSL. Therefore, the instruction to reduce altitude by 1500 ft in effect descended the aircraft to 500 ft below a series of mountain peaks directly in front of the aircraft. The inadvertent entry into IMC scenario was designed to show that an otherwise unavoidable CFIT situation (unavoidable with conventional displays) could be prevented with synthetic vision technology. None (0/13) of the IFR pilots and only 15% (2/14) of the VFR pilots experienced a CFIT. One of these two VFR pilots had significant difficulty flying the aircraft throughout the entire experimental session and analyses showed performance to be well outside practical pilot standards; therefore, that data may be viewed suspect. The other pilot, however, did experience a CFIT event and, during the subsequent semi-structured interview, reported awareness that something was wrong but felt captured by the incorrect map display (i.e., MX-20) reading and failed to crosscheck the instruments.
For surface operations in both simple and complex airport environments, SVS technology provides an electronic taxi map capability to assist the pilot in locating ownship position relative to taxiways and runways. Such assistance can be invaluable, especially at night or during periods of low visibility (especially at unfamiliar airports), in preventing Ground Collision (GC) Runway Incursion incidents and accidents, particularly if accurate navigation (such as GPS WAAS) and surveillance aids (ASDE, TIS-B) are available. The Basic SVS for GA aircraft is not envisioned to be equipped with surveillance sensors, while the GA Enhanced SVS system is envisioned with more

47
capable SVS equipment to obtain operational credit in terms of advanced operational capabilities.
SVS is projected to reduce the overall accident / incident / loss rate to day-VMC levels. In addition to most of the safety benefits enumerated above for CAB aircraft, the expected safety benefits pertinent to GA aircraft include reductions in LV AU incidents and LVLOC accidents.
4.2.2 Operational Benefits A GA Enhanced SVS takes advantage of low-cost technologies to accurately and
reliably emulate day-VMC operations in low visibility conditions. This statement was recently verified in the flight test at ROA in 2005 (Glaab et al., 2006) in which pilots flying in simulated IMC with SVS displays consistently produced equivalent or superior performance to that produced flying in VMC with conventional displays. Such operational performance would open up thousands of small airports to the GA transportation system during marginal VMC and IMC. This in turn would reduce air traffic congestion problems. While GA aircraft do not frequently utilize high-density airports, synthetic vision systems will provide many of the benefits listed above for CAB aircraft when operating to and from congested terminal areas. In addition, and perhaps more profoundly, SVS displays could enable CAT-I-equivalent approaches to hundreds of remote, non-equipped airports. In addition, SVS technology might lead to the creation of a separate classification of instrument rated pilots with lower training and currency requirements than currently mandated for traditionally equipped aircraft.
5. Applications & Intended Function by Phases of Flight Many of the best practices that evolved during the SVS Project are generic in their
applications to both commercial transport / business jet and general aviation aircraft groupings, while others are quite specific to a particular phase of flight or task for each aircraft group. In either case, however, the intended function of SVS is usually different for a particular phase of flight for a specific aircraft group. For these reasons, as well as the fact that the SVS technologies employed for the two aircraft groupings (i.e., the synthetic vision system) are different, this section on SVS applications and intended function is sequenced first by aircraft group and then by phase of flight.
5.1 Commercial Transports / Business Jets SVS is designed for applications and intended functions ranging from purely
advisory to flight-critical. But to eliminate visibility-induced accident precursors for all aircraft classes and achieve daylight VMC-like operations regardless of outside visibility conditions, certification for flight critical applications will be required. Naturally there is a high economic risk for an airplane manufacturer or an avionics manufacturer to pursue such a certification process, particularly for commercial transports. A steady progression in certification from advisory only to flight critical is one likely fleet implementation strategy. For example, the initial TAWS system was certified as an advisory only system that provided alerts for vertical maneuvering (“terrain; pull-up”) alone. The flight crew was expected to perform the pull up maneuver before referring to the terrain display to access the situation. A more recently certified TAWS system now calls for lateral maneuvering in response to some terrain alerts (“avoid terrain”), rather than just vertical

48
maneuvering. In such a situation, it is left to the flight crew to decide in which direction to turn. As even more practical experience is gained with terrain databases, increased reliance on those databases may result, making the certification path for terrain displays such as SVS less challenging.
The application of SVS technologies for the commercial transport/ business jet aircraft group is anticipated for all phases of flight and the discussion is parsed by those phases as Take-off, Departure, En route, Approach, Landing / Flare / Touchdown, Go-Around, Rollout / Turn-off, and Surface Operations,.
5.1.1 Take-off The SVS technologies provide a system with independent and redundant threads
whose intended functions are terrain avoidance, traffic and obstacle avoidance, pathway guidance and situation awareness (position, traffic, obstacles, terrain, route) during the take-off. Pathway boundaries are set to conform to the maximum lateral size limits used during the early phases of landing approach. Those limits are a 600 foot (+/- 300 ft) maximum width, with corresponding deflections of ±½ dot of the lateral CDI in the manner of ILS course indicators (the angular deviations are computed as if ILS range was constant, based on the boundary limit of 300 ft). There are no vertical boundaries for take-off (for a description of the departure tunnel concept, see Appendix A of Parrish et al., 2006), and the flight director commands speed on pitch. Terrain, cultural features, the airport environment, obstacles, the runway, the flight director, the guidance pathway, and airborne traffic symbologies are presented appropriately on the PFD and the HUD (SVS terrain replaces any EVS image upon TOGA selection.). The ND transitions from an exocentric perspective view (the RIPS EMM) to an exocentric overhead view (the SVS ND) upon runway entry, while continuously providing the airport environment, obstacles, the runway, the guidance pathway, and airborne and surface traffic symbologies. The SV-AD may be used as desired. Independent monitoring of database integrity and registration, neighboring traffic and obstacles, and runway incursion prevention is provided.
5.1.2 Departure
The SVS technologies provide a system with independent and redundant threads whose intended functions are terrain avoidance, pathway guidance, traffic and obstacle avoidance and situation awareness (position, traffic, terrain, route) during departure. Pathway boundaries are set to conform to the maximum lateral size limits used during the early phases of landing approach (again, the pathway boundaries represent only suggested constraints on aircraft excursions from the intended flight path), and are 1 dot wide, limited to a maximum width of 600 ft (+/- 300 ft). There are no vertical boundaries for departure (for a description of the departure tunnel concept, see Appendix A of Parrish et al., 2006), and the flight director commands speed on pitch. Terrain, cultural features, obstacles, the flight director, the departure pathway, and airborne traffic symbologies are presented appropriately on the PFD, HUD, and the ND. The SV-AD may be used as desired (e.g., to provide display of a dynamic 3-D exocentric “rehearsal” tool that pilots can use to step through and rehearse complex or unfamiliar airport approaches, departures and / or non-normal procedures). Independent monitoring of database integrity and registration, and neighboring traffic and obstacles is provided.

49
5.1.3 En route The SVS technologies provide a system with independent and redundant threads
whose intended functions are en route terrain avoidance, pathway guidance, traffic avoidance and situation awareness (position, traffic, terrain, route) during en route operations. Although pathway boundaries could be set to conform to the maximum size limits used during the early phases of landing approach, it is anticipated that most flight crews would not desire a pathway display during en route operations. Pathway boundaries could also be set appropriately for RNP-type constraints. Terrain, cultural features, the airport environment, obstacles, the flight director, the guidance pathway (if desired), and airborne traffic symbologies are presented appropriately on the PFD, the HUD and the ND (the SVS ND, an exocentric view in which the flight director is not displayed). The SV-AD may be used to provide display of a dynamic 3-D exocentric “rehearsal” tool that pilots can use to step through and rehearse complex or unfamiliar airport approaches, departures, and / or non-normal procedures. Independent monitoring of database integrity and registration is not active at high altitude, although neighboring traffic is provided.
5.1.4 Approach The SVS technologies provide a system with independent and redundant threads
whose intended functions are terrain avoidance, pathway guidance, traffic and obstacle avoidance and situation awareness (position, traffic, terrain, route, runway) during non-precision and precision approaches to landing. Pathway boundaries are set to conform to the navigation performance of a standard ILS. Unlike CDIs, the pathway boundaries represent only suggested constraints on aircraft excursions from the intended flight path, and excursions beyond the boundaries are acceptable, with no requirements for unusual maneuvering to remain within the visual guidance representation. The horizontal tunnel size was scaled to be approximately equivalent to ±½ angular dot localizer deviation centered around the localizer course (where 1 dot angular deviation equals 175 ft of lateral displacement at the runway threshold) with a 600 foot (+/- 300 ft) maximum width. The vertical tunnel size was scaled to be approximately equivalent to ±1 angular dot glideslope deviation (where 1 dot equals 0.35º angular deviation) centered along the glideslope path with a 350 foot (+/- 175 ft) maximum height and a 50 foot (+/- 25 ft) minimum height. Thus, the tunnel narrows both vertically and laterally as it approaches the runway threshold. Terrain, cultural features, the airport environment, obstacles, the runway, the flight director, the guidance pathway, and airborne and surface traffic symbologies are presented appropriately on the PFD, the HUD, and the ND. The SV-AD may be used to display the RIPS EMM or, if desired, an EVS image with appropriate symbology. If SV-AD is in use for another purpose, either pilot may choose to select a transition from the SVS ND to the RIPS EMM in order to further reveal any incurring traffic that might appear on or near the runway. Independent monitoring of database integrity and registration, runway position, neighboring traffic and obstacles, runway clearance of obstacles, and runway incursion prevention is provided.
5.1.5 Landing / Flare / Touchdown The SVS technologies provide a system with independent and redundant threads
whose intended functions are terrain avoidance, pathway guidance, traffic and obstacle

50
avoidance and situation awareness (position, traffic, runway, etc.) during landing, flare and touchdown. The Pilot Flying (PF) is head-up during the landing / flare / touchdown phase of the approach, using the HUD, initially with an SVS image. Terrain and pathway symbologies are removed from the HUD at a declutter height set somewhat above decision height, although the flight director, the runway confirmation outline, and airborne and surface traffic symbologies, as well as standard HUD flight variables (airspeed, radar altimeter, etc.) remain. The EVS image replaces the SVS terrain image on the HUD. The intended function of the remaining SVS technologies (providing the runway confirmation outline and traffic symbologies) is supplemental to the window / HUD, providing independent and redundant threads for monitoring of neighboring traffic and obstacles, assurance of a runway clear of obstacles, and runway incursion prevention.
The Pilot Not Flying (PNF) views an egocentric SVS PFD (assuming only one HUD is available) with only the pathway symbology removed (at declutter height). Terrain, the flight director, the runway confirmation outline, and airborne and surface traffic symbologies remain. If an EVS image is desired, it may be displayed on a SV-AD with appropriate symbology.
The NDs of both the PF and the PNF transition (at nose wheel touchdown and 80 knots) from an exocentric overhead view (SVS ND) to an exocentric perspective view (the RIPS EMM) while continuously providing the airport environment, obstacles, the runway, the guidance pathway, and airborne and surface traffic symbologies.
5.1.6 Go-Around The SVS technologies provide a system with independent and redundant threads
whose intended functions are terrain avoidance, pathway guidance, traffic and obstacle avoidance, and situation awareness (position, traffic, terrain, route) during the go-around. Pathway boundaries are set to conform to the maximum lateral size limits used during the early phases of landing approach (again, the pathway boundaries represent only suggested constraints on aircraft excursions from the intended flight path), and are 1 dot wide, limited to a maximum width of 600 ft (+/- 300 ft). There are no vertical boundaries for go-around (a go-around pathway would use the departure tunnel concept), and the flight director commands speed on pitch. Terrain, cultural features, the airport environment, obstacles, the runway, the flight director, the guidance pathway, and airborne and surface traffic symbologies are presented appropriately on the PFD and the HUD. When Takeoff Go-Around (TOGA) is selected, the SVS terrain image replaces the EVS image on the HUD. The ND transitions, if necessary, from an exocentric perspective view (the RIPS EMM) to an exocentric overhead view (the SVS ND) upon TOGA selection, while continuously providing the airport environment, obstacles, the runway, the guidance pathway, and airborne and surface traffic symbologies. Independent monitoring of database integrity and registration, runway position, and neighboring traffic and obstacles is provided.
5.1.7 Rollout / Turn-off The SVS technologies provide a system with independent and redundant threads
whose intended functions are surface guidance, traffic and obstacle avoidance, and situation awareness (position, traffic, runway, turn-off exit) during rollout and turn-off. The PF is head-up during rollout and turn-off, using the HUD. After main gear weight on

51
wheels (WOW), only symbologies for obstacles, the runway, and the surface guidance (including deceleration guidance to a pilot-chosen exit) and surface traffic remain on the HUD (and, if desired, an EVS image), as well as standard HUD ground variables (groundspeed, heading / track, etc.). The intended function of the remaining SVS technologies (providing the runway outline and obstacle and surface traffic symbologies) is supplemental to the window / HUD, providing independent and redundant threads for monitoring of neighboring traffic and obstacles, and assurance of a runway clear of obstacles.
The PNF views an egocentric SVS PFD with the airport scene, the surface guidance, and obstacle and surface traffic symbologies. If an EVS image is desired, it may be displayed on the SV-AD with appropriate symbology.
At nosewheel touchdown and 80 knots, the NDs of both the PF and the PNF display an exocentric perspective view (the RIPS EMM) while continuously providing the airport environment, obstacles, the runway, and the surface guidance (if active) and surface traffic symbologies.
5.1.8 Surface Operations The PF is head-up during taxi operations, using the HUD. The HUD displays the
taxi flight director, the taxiway outlines, and ground traffic and obstacle symbologies (and, if desired, an EVS image). The SVS technologies, while supplemental to the window / HUD, provide a system with independent and redundant threads whose intended functions are traffic and obstacle avoidance, surface guidance, taxi route compliance, runway incursion prevention, and situation awareness (position, ground traffic, route) during taxi operations.
The PNF views an egocentric SVS PFD with the airport scene, the taxi flight director, and ground traffic and obstacle symbologies. The ND is an exocentric perspective view that provides the airport environment, obstacles, the taxiways, the taxi route, and ground traffic symbologies. If an EVS image is desired, it may be displayed on the SV-AD with appropriate symbology.
5.2 General Aviation The applications for the Basic SVS for GA aircraft are to replicate current
operations, in both VMC and IMC, as conventionally determined by aircraft equipage and pilot qualification. The applications for the GA Enhanced SVS are to obtain operational credit in terms of advanced operational capabilities that emulate day-VMC operations in low visibility conditions, such as reduced arrival and departure minima and direct routing in IMC. In terms of display elements, however, the differences between the Basic System and the Enhanced System are in whether or not there is an accounting for the real time elements (i.e., traffic) not present in the on-board databases, and whether or not there is active database integrity monitoring. The Basic SVS system provides no surveillance information and no active database integrity monitoring. Only the integration of tactical and strategic SVDCs is provided. The Enhanced SVS system encompasses the integration of tactical and strategic SVDCs with surveillance information, RIPS alerting algorithms (i.e., runway conflicts and route deviations) and the EMM display concept, and real-time terrain DIME functionality. However, hazard

52
detection sensors (e.g., WxR) are not available to provide information concerning obstacles not contained within the on-board database, even for the Enhanced SVS. The application of SVS technologies is anticipated for all phases of flight (the terminology used is take-off rather than departure, cruise rather than en route, landing rather than approach, go-around, and surface operations) for GA (the section is parsed by those phases of flight).
5.2.1 Take-off The SVS technologies for the Basic System for GA provide a system whose
intended functions are terrain avoidance, pathway guidance and situation awareness (position, terrain, route) during the take-off. Pathway boundaries are set to conform to the maximum lateral size limits used during the early phases of landing approach (again, the pathway boundaries represent only suggested constraints on aircraft excursions from the intended flight path). Those limits are a 600 foot (+/- 300 ft) maximum width, with corresponding deflections of ±½ dot of the lateral CDI in the manner of ILS course indicators (the angular deviations are computed as if ILS range was constant, based on the boundary limit of 300 ft). There are no vertical boundaries for take-off (for a description of the departure tunnel concept, see Wong et al., 2004; Appendix A of Parrish et al., 2006), and the flight director commands speed on pitch. Terrain, cultural features, the airport environment, mapped obstacles, the runway, the flight director, and the guidance pathway are presented appropriately on the PFD. The pilot selects the flight mode of the ND to display an exocentric overhead view (the SVS ND) of the airport environment, mapped obstacles, the runway, and the guidance pathway. There are no provisions for independent monitoring of database integrity and registration, and neighboring traffic.
The SVS technologies for the Enhanced System for GA provide a system whose intended functions are terrain avoidance, traffic avoidance, pathway guidance and situation awareness (position, traffic, mapped obstacles, terrain, route) during the take-off. Pathway boundaries are the same as those of the Basic System for GA. Terrain, cultural features, the airport environment, mapped obstacles, the runway, the flight director, the guidance pathway, and airborne traffic symbologies are presented appropriately on the PFD. The ND transitions from an exocentric perspective view (the RIPS EMM) to an exocentric overhead view (the SVS ND) upon runway entry, while continuously providing the airport environment, mapped obstacles, the runway, the guidance pathway, and airborne and surface traffic symbologies. Independent monitoring of database integrity, neighboring traffic and runway incursions is provided.
5.2.2 Cruise The SVS technologies for the Basic System for GA provide a system whose
intended functions are terrain avoidance, pathway guidance and situation awareness (position, terrain, route) during cruise. Pathway boundaries are set to conform to the maximum size limits used during the early phases of landing approach. Those limits are a 600 foot (+/- 300 ft) maximum width and a 350 foot (+/- 175 ft) maximum height, with corresponding deflections of ±½ dot of the lateral and ±1 dot vertical CDIs in the manner of ILS course indicators (the angular deviations are computed as if ILS range was constant based on the boundary limits). Unlike CDIs, the pathway boundaries represent
53
only suggested constraints on aircraft excursions from the intended flight path, and excursions beyond the boundaries are acceptable, with no requirements for unusual maneuvering to remain within the visual guidance representation. Terrain, cultural features, the airport environment and runways, mapped obstacles, the flight director, and the guidance pathway are presented appropriately on the PFD and the ND (the SVS ND, an exocentric overhead view in which the flight director is not displayed). There are no provisions for independent monitoring of database integrity and registration and neighboring traffic.
The SVS technologies for the Enhanced System for GA provide a system whose intended functions are terrain avoidance, pathway guidance, traffic avoidance and situation awareness (position, traffic, terrain, route) during cruise. Pathway boundaries are the same as those of the Basic System for GA. Terrain, cultural features, the airport environment and runways, mapped obstacles, the flight director, the guidance pathway, and airborne traffic symbologies are presented appropriately on the PFD and the ND (the SVS ND, an exocentric overhead view in which the flight director is not displayed). Independent monitoring of database integrity and neighboring traffic is provided.
5.2.3 Landing The SVS technologies for the Basic System for GA provide a system whose
intended functions are terrain avoidance, pathway guidance and situation awareness (position, terrain, route, runway) during the landing. Pathway boundaries are set to conform to the navigation performance of a standard ILS (again, the pathway boundaries represent only suggested constraints on aircraft excursions from the intended flight path). The horizontal tunnel size was scaled to be approximately equivalent to ±½ angular dot localizer deviation centered around the localizer course (where 1 dot angular deviation equals 175 ft of lateral displacement at the runway threshold) with 600 foot (+/- 300 ft) maximum width. The vertical tunnel size was scaled to be approximately equivalent to ±1 angular dot glideslope deviation (where 1 dot equals 0.35º angular deviation) centered along the glideslope path with a 350 foot (+/- 175 ft) maximum height and a 50 foot (+/- 25 ft) minimum height. Thus, the tunnel narrows both vertically and laterally as it approaches the runway threshold. Terrain, cultural features, the airport environment, the runway, mapped obstacles, the flight director, and the guidance pathway are presented appropriately on the PFD and the ND. The ND does not transition automatically from the exocentric overhead view until the pilot selects the taxi mode of the ND to display the EMM after touchdown and rollout. There are no provisions for independent monitoring of database integrity and registration, runway position, and neighboring traffic.
The SVS technologies for the Enhanced System for GA provide a system whose intended functions are terrain avoidance, pathway guidance, traffic avoidance and situation awareness (position, traffic, terrain, route, runway) during the landing. Pathway boundaries are the same as those of the Basic System for GA. Terrain, cultural features, the airport environment, mapped obstacles, the runway, the flight director, the guidance pathway, and airborne and surface traffic symbologies are presented appropriately on the PFD and the ND. Independent monitoring of database integrity, neighboring traffic and runway incursion prevention is provided. The ND transitions automatically from an exocentric overhead view (SVS ND) to an exocentric perspective view (the RIPS EMM)

54
at touchdown while continuously providing the airport environment, mapped obstacles, the runway, the guidance pathway, and airborne and surface traffic symbologies.
5.2.4 Go-Around The SVS technologies for the Basic System for GA provide a system whose
intended functions are terrain avoidance, pathway guidance and situation awareness (position, terrain, route) during the go-around. Pathway boundaries are set to conform to the maximum lateral size limits used during the early phases of landing approach (again, the pathway boundaries represent only suggested constraints on aircraft excursions from the intended flight path). Those limits are a 600 foot (+/- 300 ft) maximum width, with corresponding deflections of ±½ dot of the lateral CDI in the manner of ILS course indicators (the angular deviations are computed as if ILS range was constant, based on the boundary limit of 300 ft). There are no vertical boundaries for go-around (a go-around pathway would use the departure tunnel concept), and the flight director commands speed on pitch. Terrain, cultural features, the airport environment, the runway, mapped obstacles, the flight director, and the guidance pathway are presented appropriately on the PFD. The ND continues to provide an exocentric overhead view (the SVS ND) of the airport environment, mapped obstacles, the runway, and the guidance pathway. There are no provisions for independent monitoring of database integrity and registration, and neighboring traffic.
The SVS technologies for the Enhanced System for GA provide a system whose intended functions are terrain avoidance, pathway guidance, traffic avoidance and situation awareness (position, traffic, terrain, route) during the go-around. Pathway boundaries are the same as those of the Basic System for GA. Terrain, cultural features, the airport environment, mapped obstacles, the runway, the flight director, the guidance pathway, and airborne and surface traffic symbologies are presented appropriately on the PFD. The ND continues to provide an exocentric overhead view (SVS ND) of the airport environment, mapped obstacles, the runway, the guidance pathway, and airborne and surface traffic symbologies. Independent monitoring of database integrity and neighboring traffic is provided.
5.2.5 Surface Operations The intended function of the SVS technologies for the Basic System for GA is
supplemental to the window, providing situation awareness during taxi operations on the Nav D, which is an exocentric perspective view (the RIPS EMM) that provides ownship position in the airport environment. The pilot selects the taxi mode of the ND to display the EMM after touchdown and rollout. The SVS technologies for the Enhanced System for GA provide situation awareness (position, ground traffic, route) on the ND (the RIPS EMM) supplemental to the window and an independent monitoring system whose intended functions are traffic avoidance, taxi route compliance, and runway incursion prevention during taxi operations.
6. SVS Best Practices In this section, many of the best practices that evolved during the NASA Synthetic
Vision Systems Project are documented from the perspective of some of the NASA researchers most heavily involved in its execution. It does not purport to reflect the
55
views of either industry or university participants, nor necessarily even those of all NASA researchers. As mentioned in the Introduction, for most instances “best practices” is meant to be synonymous with “Recommended Practices” in the context of the vernacular of the SAE ARP and ICAO documents. However, there are a few exceptions, all of which are indicated as such, in which the Project selected an option or made a decision based on programmatic reasons rather than solely on research results. Many of the symbologies used in the NASA SVS Project were never really evaluated for better alternatives, at least by the Project. For example, the flight path marker symbol varied from straight winged to gull winged rather routinely. Unless things obviously needed improvement, the Project invested its resources in other issues. The NASA Integrated Synthetic Vision System Concepts to be discussed in relation to those best practices do not exist as other than concepts but they embody what production-grade synthetic vision systems might, or perhaps should, be in order to achieve the potential safety of flight and operational efficiency of clear daylight operations, regardless of visibility conditions. Many of the best practices that evolved during the SVS Project are generic in their applications to both commercial transport / business jet and general aviation aircraft groupings, while others are quite specific to a particular phase of flight or task for each aircraft group. For organizational convenience, much of the ensuing discussion is parsed by two aircraft groupings: CAB, and GA.
6.1 Commercial Transports / Business Jets Because of the more demanding operational requirements and the more stringent
certification and operational approval processes for CAB aircraft, the CAB SVS system is more complex than the GA SVS systems, and therefore, the generic best practices as well as those specific to CAB are discussed in this section. For organizational convenience, the best practices are presented by the following topic order: Database, Flight Operations Displays, Surface Operations Displays, Runway Incursion Prevention System, Enhanced Vision System Imagery, Database Integrity Monitoring, Hazard Detection Sensors, and the Integrated SVS Concept.
6.1.1 Database Real-time rendering and database storage are two key issues facing avionics
manufacturers to successfully implement synthetic vision; thus, the SVS design characteristics which affect these factors have been the subject of several studies. Database best practices within the SVS Project are presented first for these two topics (Rendering and Storage), followed by Resolution, Texture / Color / Shading, Other Graphics Issues, and Integrity.
6.1.1.1 Rendering. The NASA SVDC used in flight at EGE (Bailey et al., 2002c) were generated by a dual 866 MHz processor personal computer (PC) with 1+ Gigabytes of Random Access Memory running Windows NT™ and a Wildcat™ 4210 graphics card to provide 1280 by 1024 anti-aliased video rendering at real-time (>30 Hz) update rates. This PC implementation proved that it is no longer a technical challenge to render these displays; unfortunately, the problem is rendering these displays using avionics-grade hardware. 3-D chip sets and computer architectures to support the graphics demands of SVS are being contemplated and built, but the industry is rapidly approaching the point, if it is not already there, that the pilot's cell phone has more

56
computing power and graphics capabilities than the on-board aircraft avionics. This scenario cannot be an attractive aircraft marketing perspective. Best practice within the SVS Project (programmatic decision) has been to assume that avionics manufacturers will soon meet this recognized need, and cost-shared research with industry partners was sponsored by the SVS project to help expedite the avionics-grade graphics-processing hardware availability.
6.1.1.2 Storage. Graphics rendering is not the only computational hurdle. Database storage issues have been historical concerns. For a 1º by 1º cell of database containing DEM only, (approximately 60 square miles at the equator), the space required to store Digital Terrain Elevation Data (DTED) Level 1 data (3 arc-seconds, approximately 100 meter post spacing) is only 5 Megabytes; DTED Level 2 data (1 arc-second, approximately 30 meter post spacing) requires 54 Megabytes; but DTED Level 4 (1 arc-second, approximately 3 meter post spacing) requires 6.3 Gigabytes. With the dramatic advances currently evident in digital storage capabilities, best practice within the SVS Project (programmatic decision) has been to assume that avionics quality storage devices will become readily available for SVS database applications.
6.1.1.3 Resolution. The DEM resolution is one factor that determines how well the SVS terrain depiction will match the actual terrain environment. NASA experiments have shown that a terrain resolution of 30 arc-seconds “rounds off” the vertical features of the terrain (Hughes & Glaab, 2006), making it appear less hazardous than it may be and potentially reducing some safety benefit (see fig. 24). Nonetheless, this same experiment showed that the 30 arc-second (approximately 1000 meter post spacing) SVS terrain display is still “safer” than the conventional round dial instrument panel. From the FAA’s advisory circular on SVS, resolution requirements must meet the intended function of the terrain display. If, for example, the terrain is intended for awareness only and not navigation or terrain avoidance, the resolution should be no worse than that of a TAWS (Appendix 1, paragraph 6.3 of FAA (2002a) recommends a resolution of 15 arc-seconds for TAWS). User Requirements for Terrain and Obstacle Data (RTCA, 2005) have been prepared which define flight phase-dependent database resolution requirements (e.g., a resolution of 1 arc-second in terminal areas and 3 arc-seconds in the en-route environment) and should help to mitigate database storage concerns while yet meeting the database accuracy required for precise navigation where needed (see fig. 25). Per RTCA DO-276, several metadata elements are required, including post-spacing (i.e., resolution). Elevation reference is closely related to DEM resolution. Elevation reference indicates how elevation values are assigned for the cells in the DEM. A single elevation value in a 15 arc-second DEM represents an area approximately 0.25 x 0.25 nm (2.2 million square feet, or 54 acres). Elevation reference describes how the single elevation value is chosen. Common elevation references are average elevation, maximum elevation, and sometimes, the elevation of the geometric center of the area. As post-spacing increases, the difference between the DEM value and the actual elevation of a point within a cell may differ by several hundred meters.
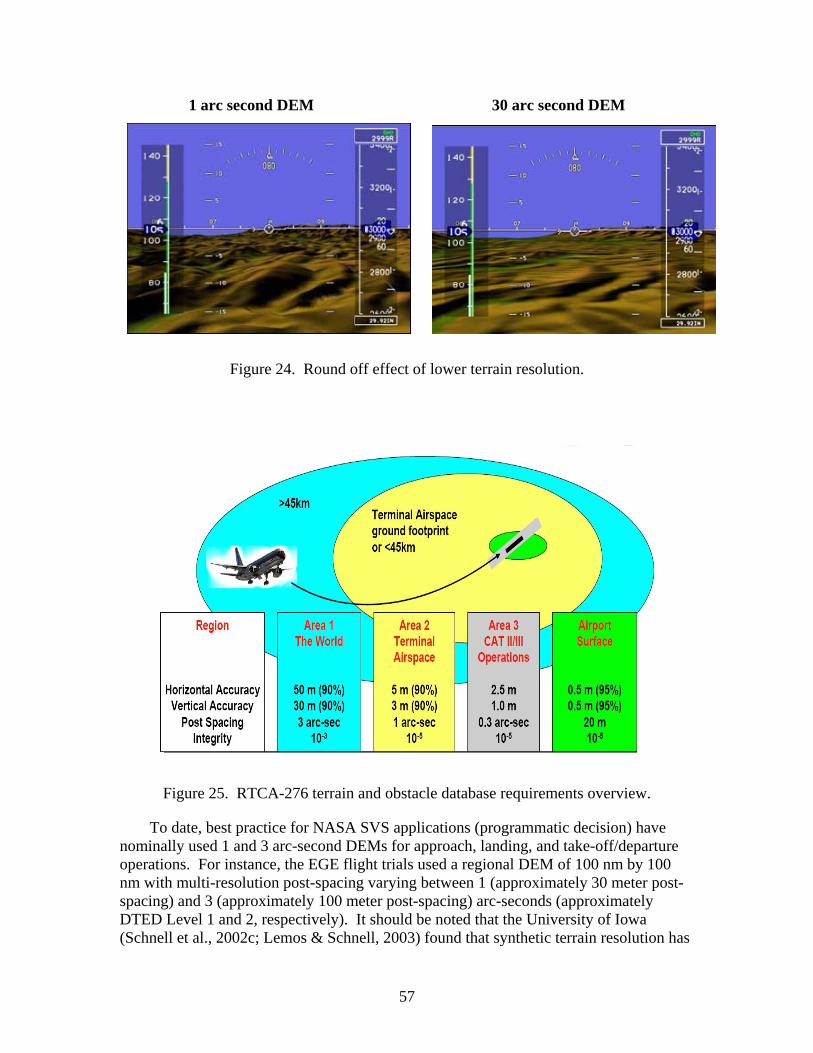
57
1 arc second DEM 30 arc second DEM
Figure 24. Round off effect of lower terrain resolution.
Figure 25. RTCA-276 terrain and obstacle database requirements overview.
To date, best practice for NASA SVS applications (programmatic decision) have
nominally used 1 and 3 arc-second DEMs for approach, landing, and take-off/departure operations. For instance, the EGE flight trials used a regional DEM of 100 nm by 100 nm with multi-resolution post-spacing varying between 1 (approximately 30 meter post-spacing) and 3 (approximately 100 meter post-spacing) arc-seconds (approximately DTED Level 1 and 2, respectively). It should be noted that the University of Iowa (Schnell et al., 2002c; Lemos & Schnell, 2003) found that synthetic terrain resolution has
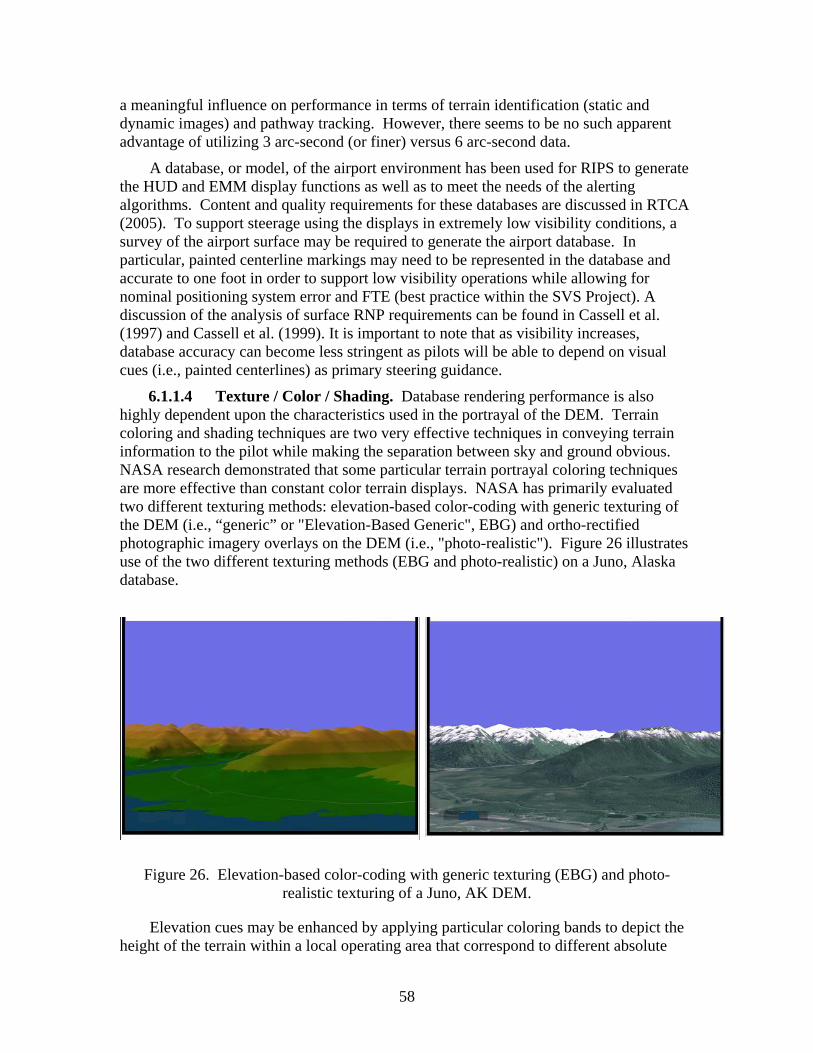
58
a meaningful influence on performance in terms of terrain identification (static and dynamic images) and pathway tracking. However, there seems to be no such apparent advantage of utilizing 3 arc-second (or finer) versus 6 arc-second data.
A database, or model, of the airport environment has been used for RIPS to generate the HUD and EMM display functions as well as to meet the needs of the alerting algorithms. Content and quality requirements for these databases are discussed in RTCA (2005). To support steerage using the displays in extremely low visibility conditions, a survey of the airport surface may be required to generate the airport database. In particular, painted centerline markings may need to be represented in the database and accurate to one foot in order to support low visibility operations while allowing for nominal positioning system error and FTE (best practice within the SVS Project). A discussion of the analysis of surface RNP requirements can be found in Cassell et al. (1997) and Cassell et al. (1999). It is important to note that as visibility increases, database accuracy can become less stringent as pilots will be able to depend on visual cues (i.e., painted centerlines) as primary steering guidance.
6.1.1.4 Texture / Color / Shading. Database rendering performance is also highly dependent upon the characteristics used in the portrayal of the DEM. Terrain coloring and shading techniques are two very effective techniques in conveying terrain information to the pilot while making the separation between sky and ground obvious. NASA research demonstrated that some particular terrain portrayal coloring techniques are more effective than constant color terrain displays. NASA has primarily evaluated two different texturing methods: elevation-based color-coding with generic texturing of the DEM (i.e., “generic” or "Elevation-Based Generic", EBG) and ortho-rectified photographic imagery overlays on the DEM (i.e., "photo-realistic"). Figure 26 illustrates use of the two different texturing methods (EBG and photo-realistic) on a Juno, Alaska database.
Figure 26. Elevation-based color-coding with generic texturing (EBG) and photo-
realistic texturing of a Juno, AK DEM.
Elevation cues may be enhanced by applying particular coloring bands to depict the height of the terrain within a local operating area that correspond to different absolute

59
terrain elevation levels. NASA’s experience has also shown that color bands are highly effective if they range from greens representing the lower elevations bands, to browns, to light tans, to off-white representing the highest elevation band using an area local to the airport of interest. Twelve or more bands are typically used, segmented into appropriate elevation ranges, with each band representing perhaps at least a 100 foot change in elevation (real-time encoding of the DEM based on relative terrain altitude, such as used in some TAWS, was not used.). Although never tested, the NASA concepts would dictate a transition, perhaps between operating areas of rapidly changing elevations, or before initiating an operation at a specific airport (such as transitioning to approach from en route or taxi to take-off), where the color banding assignment parameters would be instantaneously reset, with pilot concurrence. Shading and texturing techniques have also proven effective in realistic terrain portrayal, as have shadowing techniques. However, in the latter case, light source (sun angle) positioning must be carefully controlled to avoid the obscuration of important terrain features by shadows (e.g., see Section 6.1.2.2.2.3).
To create the SV photo-realistic terrain database for the DFW and EGE flight trials, multi-resolution imagery (ranging from 1 to 32 meters/pixel) was obtained and overlaid on the DEM. An important aspect of the photo-realistic database development has been color-balancing of the various tiles in the photo imagery. Consideration must also be made to the time of the year. For instance, aerial photography from fall or spring might be optimal for mountainous regions where snow will emphasize the mountain tops, yet not blanket the entire region. Similarly, color touch-up of bodies of water, particularly in tidal areas, is important since the boundaries of the water have been found to be important piloting cues, but color distinction in the actual photography may not be sharp enough.
No statistically-significant differences in the pilot's ability to fly the aircraft with the synthetic vision display concepts have been found between the generic and photo-realistic terrain depictions. An important consideration in this comparison is that the guidance/pathway information was provided and was unchanged between the concepts. For instance, in the EGE flight trials (see fig. 27), the last CAB flight test that compared the two techniques (Bailey et al., 2002; Kramer et al., 2004b), subjective ratings of terrain awareness, given immediately after each data run, also showed essentially no differences between the generic and photo-realistic texturing. Experiments at the University of Iowa (Schnell et al., 2002c; Lemos & Schnell, 2003) did find differences between terrain depiction concepts (checkerboard, EBG, and photo-realistic texturing concepts) for a static image identification task (the photo-realistic concept was less effective, with increased response time), but all differences disappeared for the dynamic image identification task and for all piloting performance measures.
However, a general subjective pilot preference for photo-realistic was been found in all CAB simulator experiments and flight trials. The photo-realistic terrain texturing provides a subjective improvement in awareness of terrain, better awareness of cultural features (towns, roads, etc), and subjectively better depth perception cues.

60
Figure 27. EGE flight activities aboard the NASA ARIES.
A key component of the NASA generically-textured portrayal of the DEM has been
the addition of cultural feature data. Pilot opinions strongly suggest that the demarcation of road and water, for instance, to the generic texturing greatly enhances the situation awareness attributes of the SVS terrain image. If cultural features were not an inherent feature, the quantitative "tie" between photo-realistic and generic-texturing may not necessarily be maintained. Best practice within the SVS Project has been to include cultural feature data.
Because each texturing method has strengths (e.g., generic texturing can dramatically enhance elevation cuing) and weaknesses (e.g., photo-realistic texturing requires careful color balancing across photo-tiles, when color images can be obtained), for its final integrated flight test NASA (Kramer et al., 2005a) developed a hybrid textured format, created by false-color coding monochromatic imagery (aerial photographs) of the flight test areas of interest (i.e., RNO and WAL) using an elevation-based color-coded digital elevation models (see fig. 28). The process produces a coloration of the aerial photographs based on altitude above field elevation, thus combining the best benefits of a photo-realistic database (e.g., cultural feature details) with those of a generic-texture database (e.g., emphasized terrain elevation).
The elevation-based color-coding used a green color for the field elevation of the airport changing toward shades of brown for higher elevations. For these databases, dark brown represented altitudes closer to field elevation while light browns represented higher elevations. At RNO, the shading scheme consisted of 14 elevation color bands that began at 250 meters elevation and each band was 300 meters in size. At Wallops, the shading scheme consisted of 14 elevation color bands that began at sea level (green at

61
field elevation) with each band representing 10 meters in altitude. The aerial imagery was nesting such that high-resolution imagery (1 meter per pixel) was used in close proximity to the airfield with the majority of the imagery, away from the airport area, at lower resolution (4 meters per pixel).
Figure 28. The hybrid texturing method applied to the RNO database.
While the hybrid texturing method has never undergone any comparative testing
against the other techniques, the collective acceptance by experienced pilots and researchers seems overwhelmingly in its favor. This blended database also obviates the problems associated with color-balancing photographic imagery and "seasonal" effects that can detract from the quality of a photo-realistic database. It may also help to ameliorate some of the terrain depiction illusions encountered with monochrome renditions of a photo-realistic database for HUD usage (see Section 6.1.2.2.2.3). Thus the final accepted best practice within the SVS Project (programmatic decision) was the hybrid texturing method. However, given the inclusion of cultural feature data, the quantitative "tie" between photo-realistic and generic-texturing discussed earlier engenders acceptance by Project personnel that economic forces will ultimately determine the texturing method chosen by the avionics community.
Several design characteristics have been found in the numerous studies which, taken collectively, provide additional design guidance and requirements for terrain depiction:
Available HUD luminance (and resultant contrast ratios) will dictate the imagery content characteristics for SVS HUD applications, where shades of gray for raster displays such as monochrome SVS terrain are a legibility concern. The issue is examined under Section 6.1.2.2.22 below.
Although fish-net or grid patterns of terrain have been shown to add flow, perspective, and splay (which promote pilot perception of speed, aim-point, and
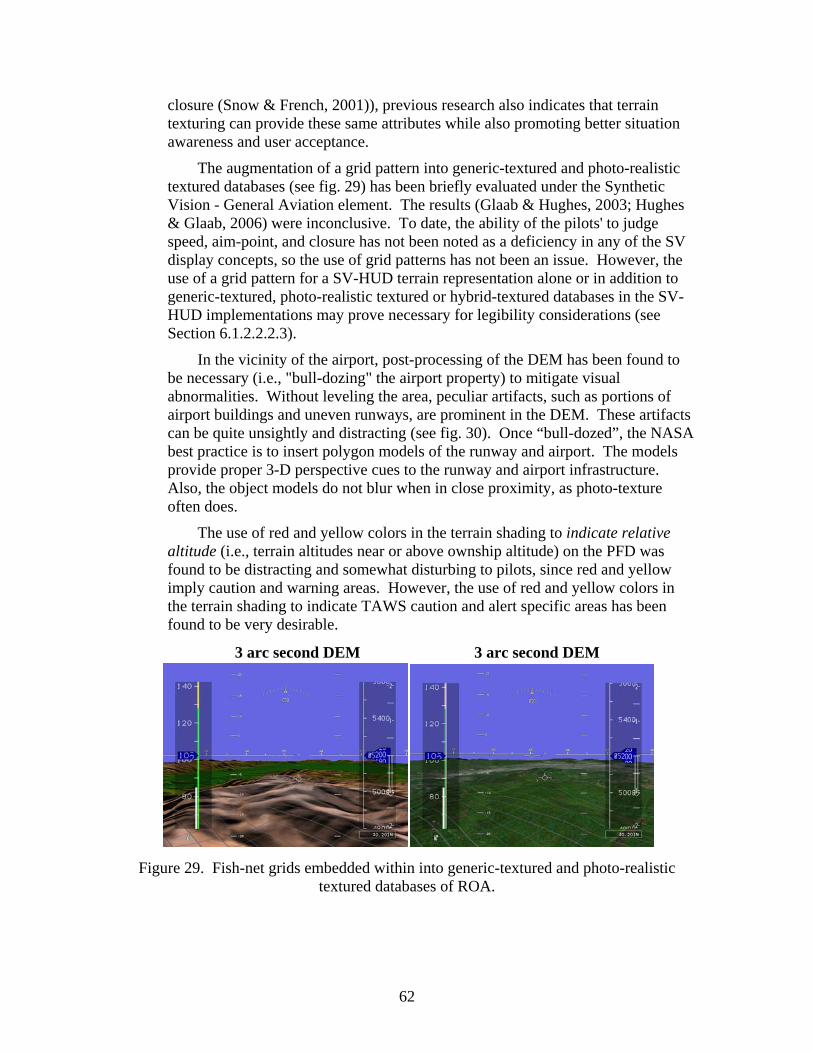
62
closure (Snow & French, 2001)), previous research also indicates that terrain texturing can provide these same attributes while also promoting better situation awareness and user acceptance.
The augmentation of a grid pattern into generic-textured and photo-realistic textured databases (see fig. 29) has been briefly evaluated under the Synthetic Vision - General Aviation element. The results (Glaab & Hughes, 2003; Hughes & Glaab, 2006) were inconclusive. To date, the ability of the pilots' to judge speed, aim-point, and closure has not been noted as a deficiency in any of the SV display concepts, so the use of grid patterns has not been an issue. However, the use of a grid pattern for a SV-HUD terrain representation alone or in addition to generic-textured, photo-realistic textured or hybrid-textured databases in the SV-HUD implementations may prove necessary for legibility considerations (see Section 6.1.2.2.2.3).
In the vicinity of the airport, post-processing of the DEM has been found to be necessary (i.e., "bull-dozing" the airport property) to mitigate visual abnormalities. Without leveling the area, peculiar artifacts, such as portions of airport buildings and uneven runways, are prominent in the DEM. These artifacts can be quite unsightly and distracting (see fig. 30). Once “bull-dozed”, the NASA best practice is to insert polygon models of the runway and airport. The models provide proper 3-D perspective cues to the runway and airport infrastructure. Also, the object models do not blur when in close proximity, as photo-texture often does.
The use of red and yellow colors in the terrain shading to indicate relative altitude (i.e., terrain altitudes near or above ownship altitude) on the PFD was found to be distracting and somewhat disturbing to pilots, since red and yellow imply caution and warning areas. However, the use of red and yellow colors in the terrain shading to indicate TAWS caution and alert specific areas has been found to be very desirable.
Figure 29. Fish-net grids embedded within into generic-textured and photo-realistic
textured databases of ROA.
3 arc second DEM 3 arc second DEM

63
Figure 30. Views of the EGE airport property before and after “bull-dozing” and
inserting polygon models of the runway and airport buildings.
6.1.1.5 Other Graphics Issues. Experience within the Project on other graphics issues has suggested several promising approaches to overcome the shortcomings of adapting flight simulation software for flight applications rather than using software designed specifically for flight.
“Terrain popping”, which occurs as the viewer is approaching a distant object in a graphics scene when the object first becomes visible and the object suddenly “pops” into view, is the result of rounding errors. NASA has awarded a Small Business Innovation Research (SBIR) contract to Terrametrics to, along with other objectives, eliminate “terrain popping” by directly using a compressed version of the DEM data. The DEM is converted to a terrain model (by triangulating the data) so that by using the DEM directly, there is no “rounding” error.
Another promising approach to eliminating annoying rendering issues involves storing databases by latitude and longitude position coordinates, rather than in other traditional coordinate systems, to eliminate coordinate transformation problems (e.g., WGS84 to UTM conversions).
Database renderers have traditionally used “flat-earth” approximations to display terrain because of their computational efficiency. A flat-earth rendition, particularly for an SV-HUD application, will not provide a faithful terrain depiction – the flat earth projection will always show the SV terrain higher in apparent altitude than the real-terrain. This “error” is fortunately in the conservative direction. Also, rendering differences being “flat-earth” and “spherical-earth” vanish the closer to the terrain the viewer becomes. Nonetheless, Terrametrics (and others) are working on computationally efficient methods to provide “spherical-earth” renderers to avoid this approximation.
6.1.1.6 Integrity. The NASA Integrated SVS Concept for CAB aircraft provides real-time DIME functionality to bound the integrity of the Geo-spatial terrain databases or DEMs. The term integrity is used frequently in the aviation community as a quality

64
metric. Unfortunately, several segments of the community interpret integrity differently. There are three definitions of integrity that are relevant to SVS: system integrity, data integrity, and data processing integrity (Young et al., 2002). With respect to the DEMs used by SVS, required data integrity will depend on the intended use of the data by the pilot and the architecture of the system in which the data resides. DEM integrity is related to system integrity, in that system integrity can be compromised if errors exist in the DEM that may lead to HMI being presented to pilots, and these errors are not detected by pilots or the operational system.
To ensure that data is not corrupted during processing and / or distribution, the guidelines have been established for data processing integrity (ICAO, 1999; RTCA, 1998). These guidelines define data processing integrity as the degree of assurance that aeronautical data and its value have not been altered since the data origination or an authorized amendment. These guidelines also provide data processing procedures that are intended to help ensure that the resulting data is no worse than the source data.
It is expected that the majority of terrain data that is stored on aircraft as part of an SVS or TAWS will not have a stated integrity with respect to the source data itself. The integrity specified with these data will only refer to data processing integrity. This is primarily due to the fact that the amount of validation required to establish an integrity value for such large data sets is viewed as cost prohibitive.
A variety of sources from both the public and private sectors provide DEMs, and these DEMs are characterized by a number of parameters. These parameters include the spatial extent or coverage, post-spacing or spatial resolution of elevation measurements, the horizontal and vertical references or datums, and the circular and linear error probabilities. A Circular Error Probability (CEP) is most commonly used for the horizontal accuracy specification, whereas a Linear Error Probability (LEP) is used to specify the accuracy in the vertical dimension. If one assumes that errors are random and normally distributed with zero-mean, the standard deviations in the horizontal and vertical dimensions can be derived from the CEP and LEP specifications.
When utilizing DEMs as part of a flight-critical function, it is imperative to avoid the display of hazardous misleading terrain information (HMTI). HMTI can be the result of insufficient DEM spatial resolution, inappropriate tessellation or rendering, or excessive post elevation errors. The severity of the hazard will depend on the specific flight operation being conducted and the use of the terrain depiction by pilots during this operation.
To mitigate potential risk of HMTI, active database integrity monitoring using a form of DIME is therefore viewed as a vital part of flight-critical SVS designs. In the NASA Integrated SVS Concept, if significant inconsistencies are determined to exist, an integrity alert to the pilot is generated. The best practices (recommended practices, lessons-learned, and considerations) that have evolved over the term of the Project with respect to DIME are detailed in Section 6.1.6.
6.1.2 Flight Operations Displays The best practices that evolved in the area of flight operations displays are discussed
first as related to symbology lessons for the various specific displays (Flight Operations

65
Symbology), and then as lessons concerning the specific display applications themselves (Flight Operations Display Considerations).
6.1.2.1 Flight Operations Symbology. The best practices that evolved in the area of flight operations symbology are discussed as lessons concerning first, Haloed Symbology, followed by the specific display applications themselves (HUD / PFD Symbology, ND Symbology, and Auxiliary Display Symbology). Symbology issues such as drawing priorities (terrain is typically drawn first with symbology overlaying the terrain) and scaling / pegging / caging issues are not discussed unless they are unique issues for SVS.
6.1.2.1.1 Haloed Symbology. Two of the principal symbology concerns with including terrain on any tactical or strategic flight display (PFD, HUD, ND) have been excess clutter and readability / legibility of vital information. Haloed symbology addresses the latter concern for head-down displays (and potentially for new digital HUDs as well). Haloing is a technique used to provide a high-contrast (black) background so that the primary color can be more easily distinguished. For example, the centerline, threshold and runway number markings are painted in white with a thin black border on the runway object. This black border, known as haloing, provides color contrast so that the markings can be easily seen on the runway. Symbology “thickness” is measured as total pixels in width. For example, for thin display elements like the sides of a pathway or tunnel, with a tunnel thickness of 2 pixels and a halo thickness of 4 pixels, 2 pixels of the tunnel overlay the halo and only one pixel (each side) of halo (black pixels) around the tunnel will be visible. That is, if the halo thickness is the same size as the symbology, a halo will not be visible. The software used by NASA to render the haloed display elements was written in OpenGL, which allows developers to specify line widths as floating point numbers; thus non-integer line thicknesses are possible (Woo et al., 1997). Antialiasing was enabled via graphics hardware techniques. Best practice within the Project has been to utilize both non-integer line thicknesses and antialiasing, and to halo most flight symbology elements. For raster text symbology that directly overlays the terrain image (e.g., heading under the roll scale and pitch ladder text), antialiasing and haloing provided the most readable text. Text within the transparent tapes (e.g., speed and altitude) need not be haloed as the shaded transparency or background opaqueness of the tapes provides sufficient contrast.
For a stroke-on-raster HUD, symbology haloing is neither possible nor necessary. The high contrast stroke symbology, drawn in the fly-back, clearly stands-out from the background raster. However, new digital HUDs are all-raster; stroke cursive functions are not available. In this case, symbology haloing is a necessary and vital function for symbology readability against the SV terrain background.
6.1.2.1.2 HUD / PFD Symbology. Because the symbologies appearing on HUDs and PFDs are quite similar, the best practices that evolved in the area of HUD / PFD symbologies are presented in terms of the symbology elements themselves, although there are significant differences in symbology considerations for these very different display media. Obscuration of the view of the outside world and, conversely, the visibility of monochrome symbology elements under varying brightness and contrast conditions are major concerns with HUD displays, as are differences in raster and stroke symbology presentations. Other differences include, for the HUD, unity magnification /

66
minification (conformal with the real world), the larger FOV at unity magnification, collimation, and location, compared to the HDDs. When best practices for a symbology element differ according to the display media, both approaches are discussed.
Best practice within the Project was to base the symbology set used during flight operations on symbols that were familiar to most experienced CAB pilots, including airspeed/altitude tapes; textual readouts of Mach number and ground speed; a waterline symbol; an horizon line (actually the zero pitch line) with heading scale and roll indicator; a pitch ladder; a wind vector; a -3° pitch reference line (variable parameter); a flight path marker with acceleration / deceleration caret; glideslope and localizer CDIs; a flight director guidance symbol; approach or departure or go-around pathway or tunnel; airborne and surface traffic; and a runway outline symbol. Details concerning most of the symbology set can be found in Parrish (2003). For organizational convenience, the best practices are presented by the following topic order: Flight Path Marker, Pathway / Tunnel, Flight Director Guidance, Tunnel / Terrain Conflict Detection, Obstacles, Traffic, Runway Outline, Pitch Ladder, and Clutter.
6.1.2.1.2.1 Flight Path Marker. The flight path marker or velocity vector has been mentioned previously as perhaps the most important symbology element incorporated into the tactical SVS display (e.g., see fig. 29, 31, 32) because its use is so intuitive and the information conveyed is so tactically significant. The position of the velocity vector symbol relative to the terrain, the pathway / tunnel, and the flight guidance command symbol provides the pilot with the intuitive awareness of the spatial situation required to maneuver the aircraft with significantly less workload and at least as precisely (if not more so) than/as conventional symbologies, as determined in the numerous studies conducted within the project (Arthur et al., 2003, 2004, 2005, 2006; Bailey et al., 2002, 2003, 2004, 2005, 2006; etc.). The flight path marker or velocity vector represents the trajectory of the aircraft such that when the symbol is located above, below, right, or left of some other element in the display, then unless something changes, that is where the aircraft will pass (above, below, right, or left) relative to that element. For example, if the flight path marker is consistently above a terrain ridge line, then the aircraft will clear that ridge line.
Best practice within the SVS Project has been to use a quickened velocity vector (in both pitch and roll as in SAE (2005)) tuned to the handling characteristics of the aircraft. It was never found necessary to vary the quickening based on the selected FOV of the PFD (changes which would not, in any case, be implemented for the velocity vector of the fixed FOV HUD). An acceleration / deceleration caret symbol is included as best practice, centered just off the left wing tip of the velocity vector, to assist in thrust management. A speed error bar on the velocity vector wing is also included. The bar pegs and changes color (amber) to denote off-scale values.
6.1.2.1.2.2 Pathway / Tunnel. As mentioned previously, the inclusion of both a velocity vector-based flight director and a pathway or tunnel were legacy contributions from HSR research, and CAB researchers rarely evaluated SVS display concepts without the presence of both. While the pathway-based guidance provided by the velocity vector-based flight director allowed precise tracking response, the tunnel provided look-ahead (i.e., “preview”) capability to anticipate upcoming changes in the path and an expectation
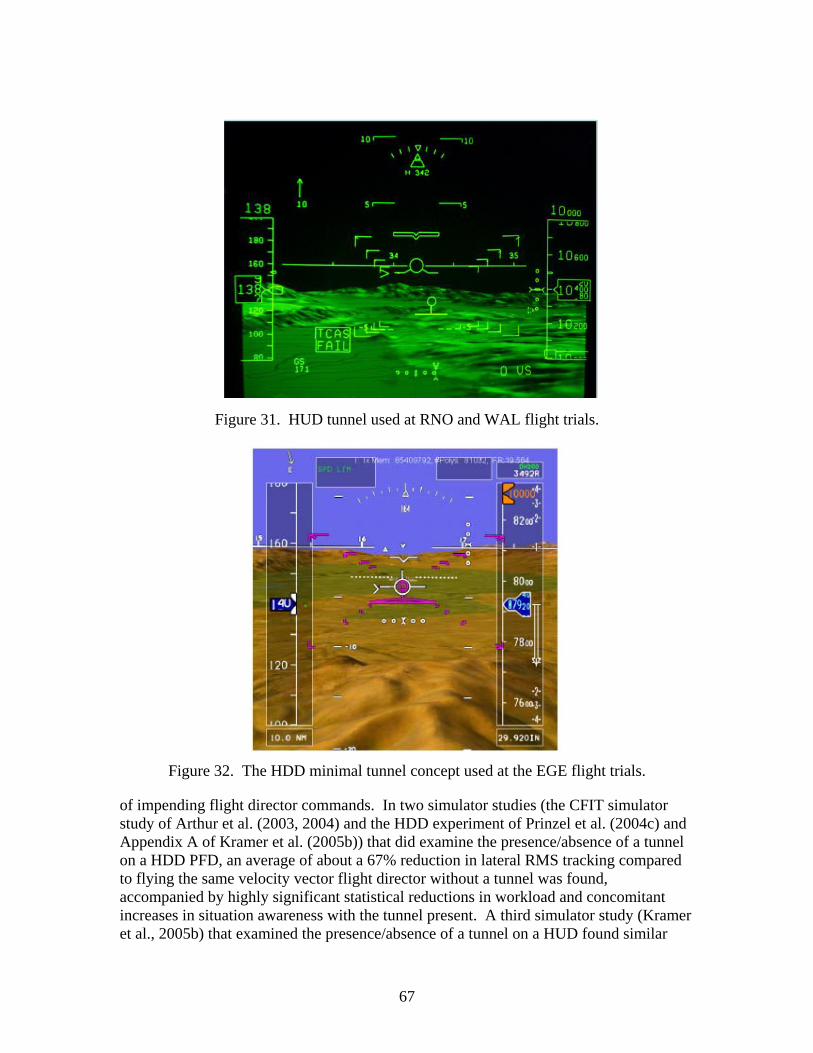
67
Figure 31. HUD tunnel used at RNO and WAL flight trials.
Figure 32. The HDD minimal tunnel concept used at the EGE flight trials.
of impending flight director commands. In two simulator studies (the CFIT simulator study of Arthur et al. (2003, 2004) and the HDD experiment of Prinzel et al. (2004c) and Appendix A of Kramer et al. (2005b)) that did examine the presence/absence of a tunnel on a HDD PFD, an average of about a 67% reduction in lateral RMS tracking compared to flying the same velocity vector flight director without a tunnel was found, accompanied by highly significant statistical reductions in workload and concomitant increases in situation awareness with the tunnel present. A third simulator study (Kramer et al., 2005b) that examined the presence/absence of a tunnel on a HUD found similar

68
results, although the reduction in lateral RMS tracking with the tunnel present was only 28% and was not statistically significant. The lesser effect for the anticipatory cueing advantages of the HUD tunnel can perhaps be attributed to the fact that, in consideration of HUD clutter issues and drawing capacity limitations of the HUD stroke generator, only four tunnel segments were presented ahead of ownship, extending to 0.8 nm (see fig. 31), while the HDD version (see fig. 33) of the tunnel extends to about 3.0 nm (see fading feature below).
The great majority of pathway research effort within CAB focused rather on minimizing the clutter associated with pathway displays. Two tunnel concepts were found to be most effective, both of which are based on the NASA Langley ‘Crow’s Foot’ Tunnel (Parrish et al., 2006). The minimal tunnel concept consisted of a series of "crow’s feet" presented in each corner of a tunnel segment (essentially a truncated box). The tunnel was drawn with 5 tunnel segments per nm, with a total length of 3 nm, and faded gradually to invisibility over the last nm (when approaching a path glideslope or track change, the start point of the fading feature can be extended beyond 3 nm to allow the upcoming change to be visible). This minimal tunnel concept (see fig. 32) was suggested as perhaps preferable for HUD use, as it presents the ‘minimal’ tunnel to minimize clutter (Bailey et al., 2006; Prinzel et al., 2004a). The other concept, the dynamic "crow’s foot", allowed the "crow’s feet" to grow as a function of path error. Therefore, the pilots are given feedback as to where they are in the tunnel and if they are close to flying out of the tunnel. The idea of the dynamic tunnel was that if the pilot is flying in the center of the tunnel, there should be the smallest amount of clutter. However, if there exists appreciable path error, the appropriate tunnel wall would "grow" to help the pilot gauge where the boundaries of the tunnel are (see fig. 33). This helps to overcome a frequent criticism of "low clutter" tunnels. Should the aircraft leave the tunnel, the tunnel would change to a “trough” and resemble a box tunnel with the exception that the tunnel would
Figure 33. The dynamic tunnel concept with some error.
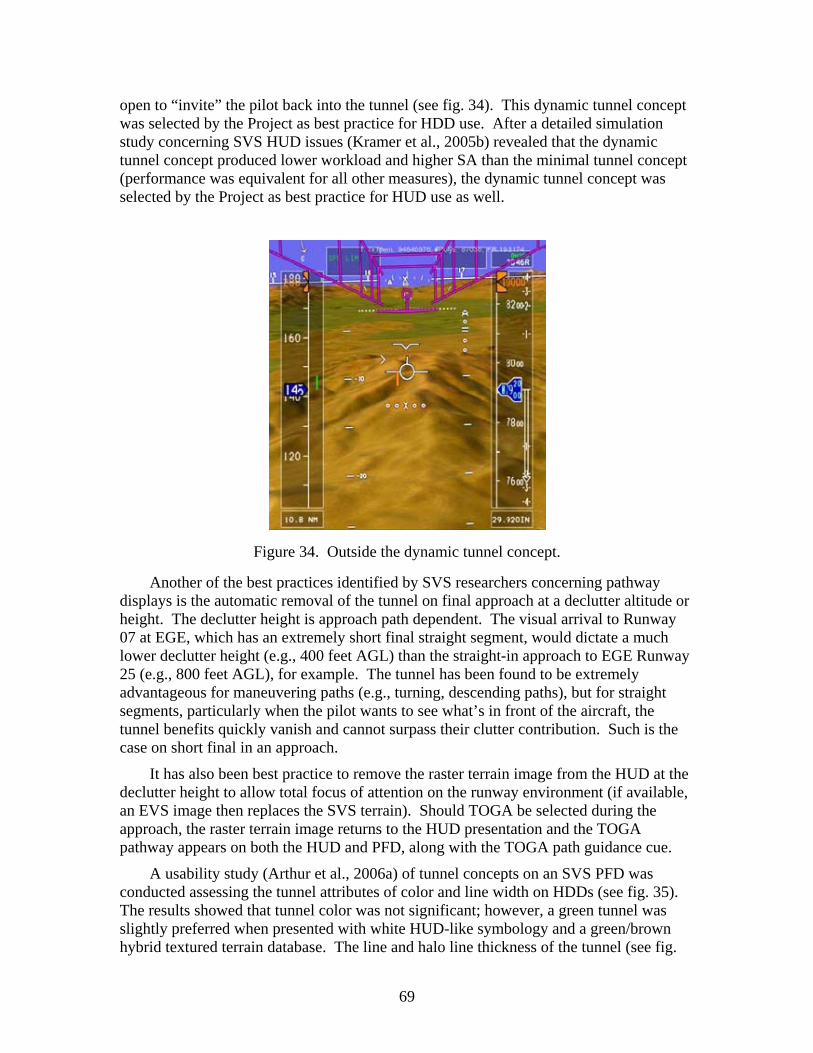
69
open to “invite” the pilot back into the tunnel (see fig. 34). This dynamic tunnel concept was selected by the Project as best practice for HDD use. After a detailed simulation study concerning SVS HUD issues (Kramer et al., 2005b) revealed that the dynamic tunnel concept produced lower workload and higher SA than the minimal tunnel concept (performance was equivalent for all other measures), the dynamic tunnel concept was selected by the Project as best practice for HUD use as well.
Figure 34. Outside the dynamic tunnel concept.
Another of the best practices identified by SVS researchers concerning pathway
displays is the automatic removal of the tunnel on final approach at a declutter altitude or height. The declutter height is approach path dependent. The visual arrival to Runway 07 at EGE, which has an extremely short final straight segment, would dictate a much lower declutter height (e.g., 400 feet AGL) than the straight-in approach to EGE Runway 25 (e.g., 800 feet AGL), for example. The tunnel has been found to be extremely advantageous for maneuvering paths (e.g., turning, descending paths), but for straight segments, particularly when the pilot wants to see what’s in front of the aircraft, the tunnel benefits quickly vanish and cannot surpass their clutter contribution. Such is the case on short final in an approach.
It has also been best practice to remove the raster terrain image from the HUD at the declutter height to allow total focus of attention on the runway environment (if available, an EVS image then replaces the SVS terrain). Should TOGA be selected during the approach, the raster terrain image returns to the HUD presentation and the TOGA pathway appears on both the HUD and PFD, along with the TOGA path guidance cue.
A usability study (Arthur et al., 2006a) of tunnel concepts on an SVS PFD was conducted assessing the tunnel attributes of color and line width on HDDs (see fig. 35). The results showed that tunnel color was not significant; however, a green tunnel was slightly preferred when presented with white HUD-like symbology and a green/brown hybrid textured terrain database. The line and halo line thickness of the tunnel (see fig.
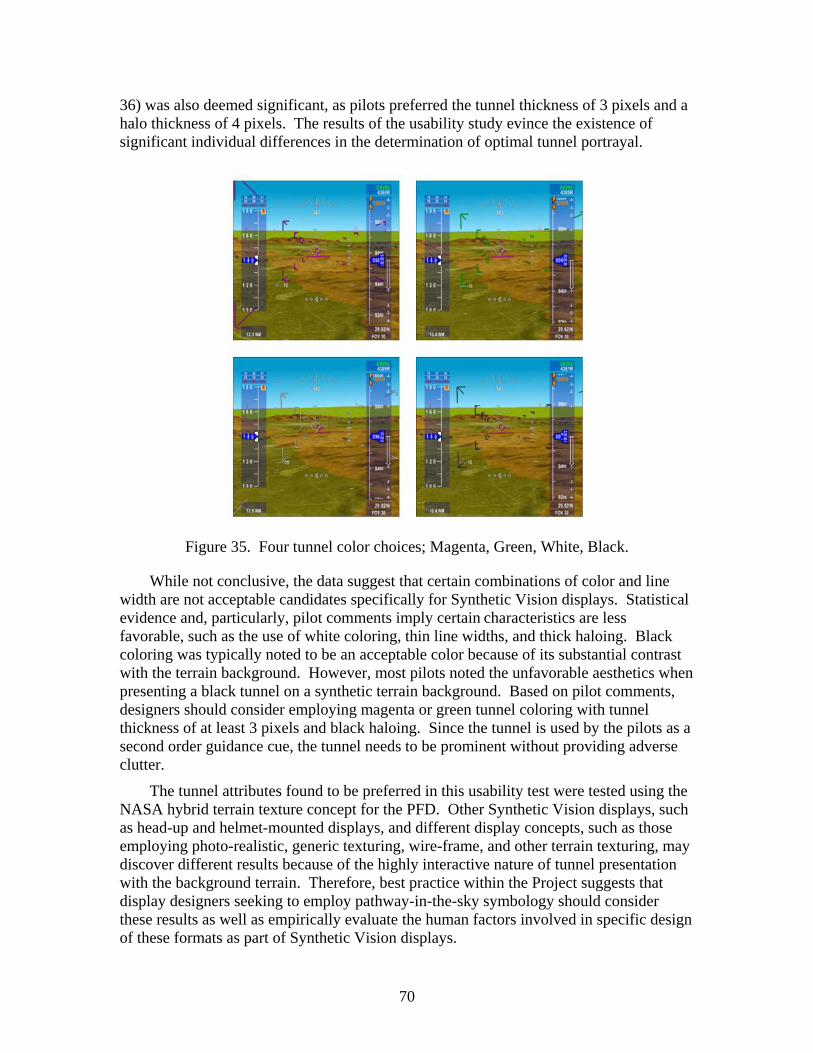
70
36) was also deemed significant, as pilots preferred the tunnel thickness of 3 pixels and a halo thickness of 4 pixels. The results of the usability study evince the existence of significant individual differences in the determination of optimal tunnel portrayal.
Figure 35. Four tunnel color choices; Magenta, Green, White, Black.
While not conclusive, the data suggest that certain combinations of color and line
width are not acceptable candidates specifically for Synthetic Vision displays. Statistical evidence and, particularly, pilot comments imply certain characteristics are less favorable, such as the use of white coloring, thin line widths, and thick haloing. Black coloring was typically noted to be an acceptable color because of its substantial contrast with the terrain background. However, most pilots noted the unfavorable aesthetics when presenting a black tunnel on a synthetic terrain background. Based on pilot comments, designers should consider employing magenta or green tunnel coloring with tunnel thickness of at least 3 pixels and black haloing. Since the tunnel is used by the pilots as a second order guidance cue, the tunnel needs to be prominent without providing adverse clutter.
The tunnel attributes found to be preferred in this usability test were tested using the NASA hybrid terrain texture concept for the PFD. Other Synthetic Vision displays, such as head-up and helmet-mounted displays, and different display concepts, such as those employing photo-realistic, generic texturing, wire-frame, and other terrain texturing, may discover different results because of the highly interactive nature of tunnel presentation with the background terrain. Therefore, best practice within the Project suggests that display designers seeking to employ pathway-in-the-sky symbology should consider these results as well as empirically evaluate the human factors involved in specific design of these formats as part of Synthetic Vision displays.
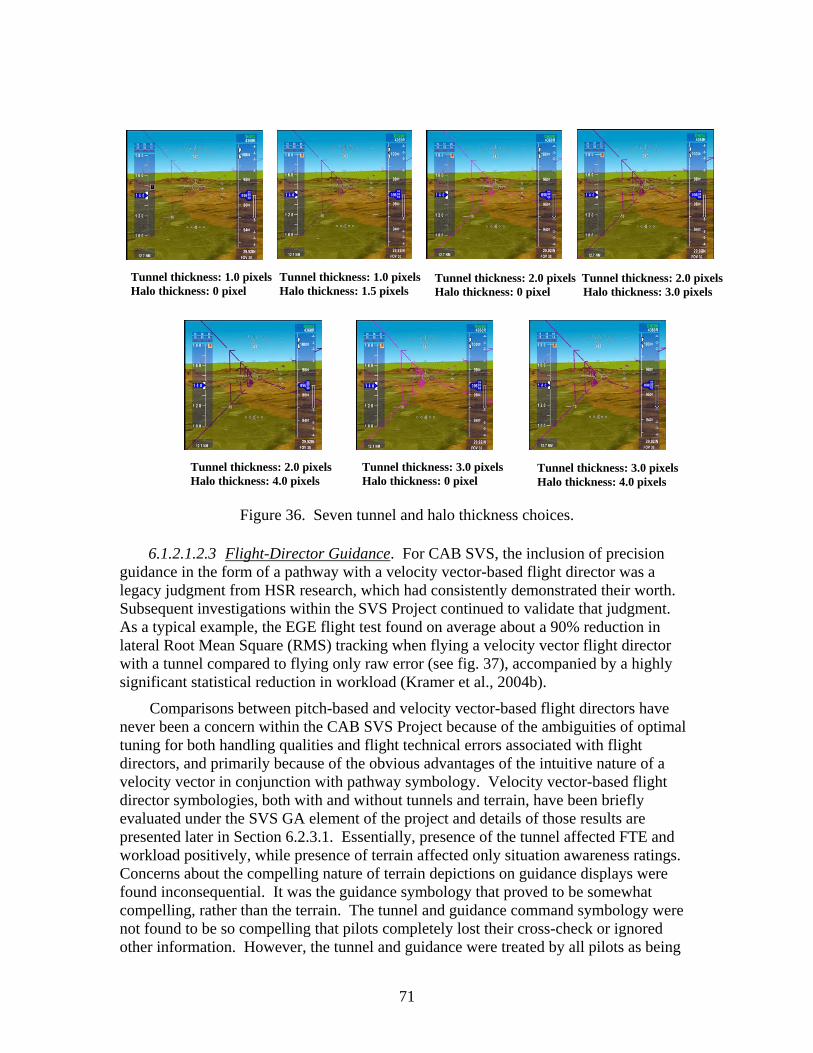
71
Figure 36. Seven tunnel and halo thickness choices.
6.1.2.1.2.3 Flight-Director Guidance. For CAB SVS, the inclusion of precision guidance in the form of a pathway with a velocity vector-based flight director was a legacy judgment from HSR research, which had consistently demonstrated their worth. Subsequent investigations within the SVS Project continued to validate that judgment. As a typical example, the EGE flight test found on average about a 90% reduction in lateral Root Mean Square (RMS) tracking when flying a velocity vector flight director with a tunnel compared to flying only raw error (see fig. 37), accompanied by a highly significant statistical reduction in workload (Kramer et al., 2004b).
Comparisons between pitch-based and velocity vector-based flight directors have never been a concern within the CAB SVS Project because of the ambiguities of optimal tuning for both handling qualities and flight technical errors associated with flight directors, and primarily because of the obvious advantages of the intuitive nature of a velocity vector in conjunction with pathway symbology. Velocity vector-based flight director symbologies, both with and without tunnels and terrain, have been briefly evaluated under the SVS GA element of the project and details of those results are presented later in Section 6.2.3.1. Essentially, presence of the tunnel affected FTE and workload positively, while presence of terrain affected only situation awareness ratings. Concerns about the compelling nature of terrain depictions on guidance displays were found inconsequential. It was the guidance symbology that proved to be somewhat compelling, rather than the terrain. The tunnel and guidance command symbology were not found to be so compelling that pilots completely lost their cross-check or ignored other information. However, the tunnel and guidance were treated by all pilots as being
Tunnel thickness: 1.0 pixels Halo thickness: 0 pixel
Tunnel thickness: 1.0 pixels Halo thickness: 1.5 pixels
Tunnel thickness: 2.0 pixels Tunnel thickness: 2.0 pixels Halo thickness: 0 pixel Halo thickness: 3.0 pixels
Tunnel thickness: 2.0 pixels Halo thickness: 4.0 pixels
Tunnel thickness: 3.0 pixels Halo thickness: 0 pixel
Tunnel thickness: 3.0 pixels Halo thickness: 4.0 pixels

72
Figure 37. EGE RMS lateral and vertical path error over the entire approach path.
of extremely high integrity (similar to ILS path data) to the extent that they “trusted” this information until over-riding evidence of an error was found. The symbology is no more compelling than current flight director and raw data displays – albeit a pilot’s scan pattern was focused (and improved) more so on the tunnel and guidance symbols because of the integrating nature of the SV symbology. For instance, the pilots were not “required” to go to the ND to obtain lateral path information. These data are now displayed directly on the PFD. The ND became part of the “cross-check” in a secondary rather than essential fashion. Consequently, best practice within the SVS Project has been to address the “high-trust” aspect of the guidance tracking task and the modification of the pilot scan: first, by stipulating the inclusion of the SVS Tunnel / Terrain Conflict Detection Algorithm alluded to earlier and discussed below in Section 6.1.2.1.2.4; and secondly, by promoting a good scan using visual “alerting” such as the traffic surveillance symbology update rate implementation, to be discussed later under the update rate section (Section 6.1.2.2.6).
CAB researchers also investigated three guidance cue symbologies. The guidance concepts were either an integrated cue circle (“ball”) used in several HUDs, a “follow-me” aircraft concept (“ghost”), or a “tadpole” guidance symbol (see fig. 38). The integrated cue circle symbol was the tail-light portion of the ghost symbol, which is positioned for transport aircraft 30-seconds ahead of ownship on the centerline of the tunnel. The positioning was determined by a modified form of pursuit guidance, documented in Merrick & Jeske (1995), to keep the aircraft trajectory tracking the tunnel. Yaw, pitch, and roll attitude of the ghost reflected the track and flight path angles of the

73
path at that lead position. The tadpole provided similar information to the integrated cue with added track change information provided by the tail on the ball. The tadpole symbology is used in some military aircraft HUDs (e.g., F-16). No quantitative differences were statistically detectable, but subjective opinions favored the tadpole and the ghost airplane presentations over the ball, and the ghost airplane over the tadpole, because of the anticipatory information provided by the specific symbol.
Figure 38. Guidance symbols: Integrated cue “Ball” (left), “Tadpole” (center) and Ghost
aircraft (two perspectives, at right).
Best practice within the SVS Project has been to use any of the three guidance cue symbologies (ghost airplane, tadpole, or ball) as the flight director symbol, transitioning to the integrated cue circle (ball) at declutter height (in situations in which clutter is a high concern, the ball is used exclusively). Conventional flare cue symbology as used on HUDs with velocity vectors appears appropriately on both the HUD and PFD. The integrated cue ball is used exclusively during departure and TOGA operations.
6.1.2.1.2.4 Tunnel / Terrain Conflict Detection. The SVS Tunnel / Terrain Conflict Detection Algorithm was envisioned as part of the Integrated SVS Concept to detect tunnel / terrain conflicts well before the conflict point is approached as another independent check and balance feature. If the programmed flight plan or immediate flight path has a terrain conflict, the system should provide the pilot with a visual alert and the conflict should be made obvious by a “Break-X” to provide clear and unambiguous visual evidence to the pilot that there exists a convergence of the pathway and the SV terrain. In conjunction with this algorithm, another best practice heuristic arises. Pathway depictions in a SVS PFD should address drawing order issues, as potentially HMI could result from a misapplication of drawing order priorities. It is possible that in certain circumstances the pathway or tunnel may pass behind or through terrain, and if the pathway is drawn last (as is typically the practice), the pathway will not be occluded by the terrain. The pathway should not continue through terrain or be visible if behind terrain. The pathway should never continue through terrain. For example, the “Break-X” would obscure the pathway “under” the terrain.
6.1.2.1.2.5 Obstacles. Obstacles (ground-based, man-made objects such as towers) are represented iconically on both the PFD / HUD and ND in the NASA Integrated SVS Concept. The representation typically used has been a white rectangular barber-pole (red stripes) corresponding in height and location for known obstacles. Orange stripes were
74
used for unknown obstacles to differentiate real time detections. Best practice has been to halo the icon. Information is obtained from an on-board obstacle database, from datalink or another update mechanism for newly mapped obstacles, and in real time from hazard sensors during flight or surface operations.
6.1.2.1.2.6 Traffic. While the strategic SVS ND is the principal display for surveillance information (Kramer & Norman, 2000), tactical traffic information within the FOV of the PFD / HUD from surveillance sources (TCAS, ADS-B, TIS-B, ASDE, or real time object detection algorithms) is also presented iconically on those displays (see fig. 39) as best practice in the NASA Integrated SVS Concept. These icons conform to the CDTI MOPS (RTCA, 2001) in distinguishing between airborne and surface vehicles (an inverted triangle with point side down is used for surface traffic) and wire-frame shapes to reduce obscuration of the terrain. The shapes and colors conform to TCAS conventions (blue diamonds for proximity traffic, yellow circles for 45 second caution alerts, red squares for 30 second warning alerts; altitude indications; ascent / descent arrows). Best practices within the NASA Project include a range filter for the PFD / HUD traffic symbology nominally set at 7 nm to restrict displayed traffic to the neighborhood (particularly useful in the airport environment). Unlike the TCAS range filter, the SVS Project never found it necessary to employ altitude boundaries (TCAS uses +/- 1200 ft), as most NASA testing occurred in the terminal area. It was intended, based on HSR research (Kramer & Norman, 2000), that traffic symbols vary in size with range as the traffic enters a 5 nmi boundary with the ownship, but that functionality was never implemented. Alphanumeric text size remains constant size. Careful attention is given to PFD integration with the ND and TCAS.
6.1.2.1.2.7 Runway Outline. The NASA Integrated SVS Concept includes an independent runway monitor display element within the PFD / HUD as a part of monitoring the integrity of the database / navigational position solution. In an air-to-ground application mode, the advanced multi-mode WxR is used to provide runway location in order to position the runway confirmation or misalignment wire-frame display element (hopefully overlaying the synthetic runway). The runway outline offers assurance to the pilot in low visibility conditions that the synthetic scene is aligned properly and that the real runway is actually present in the outside world. Best practice has been to initially fix the wire-frame outline (see fig. 19) to coincide with the synthetic runway position until WxR range conditions are satisfied, and to filter the position information provided by the WxR to prevent jitter. Should the integrity of the WxR position information be in doubt, the wire-frame is removed from the display. Best practice has also been to replace the runway outline at the declutter height with similar RIPS runway symbology (the edge cones and centerline described below), and to remove it completely if TOGA is selected. During the SVS Project, an extended centerline (see fig. 19) was included as part of the wire-frame outline to assist in runway alignment. However, a usability study conducted as part of a simulator study (Bailey et al., 2006) under the new Integrated Intelligent Flight Deck Technologies (IIFDT) Project under NASA’s AvSP found it to be unnecessary clutter, particularly with the presence of tunnel symbology.

75
Figure 39. An SVS PFD showing neighborhood traffic.
6.1.2.1.2.8 Pitch Ladder. The pitch ladder selected as a best practice for the NASA Integrated SVS Concept to satisfy obscuration concerns about the region of the aim-point (the flight path marker) is a split ladder with a gapped horizon line (actually the zero pitch line) adopted from HUD symbology implementations (see fig. 39). The entire ladder, including the horizon line, is haloed. Originally the gap in the horizon line was placed about the pitch reference symbol (see figs. 7 & 8), but best practice was soon recognized as gapped about the velocity vector position (see fig. 40).
6.1.2.1.2.9 Clutter. Best practice within the SVS Project has been to aggressively pursue all opportunities to declutter the PFD / HUD to minimize synthetic terrain and, for the HUD, outside obscuration while optimizing the legibility of essential information. Examples of the application of this philosophy are the dynamic tunnel, the declutter height provision for pathway removal (and terrain removal from the HUD), the surveillance range filter for traffic, and the numerous symbology elements that are haloed. Independent HUD declutter switches for both the raster channel and stroke symbology are other examples.
6.1.2.1.3 ND Symbology. Repeated mention has been made of the NASA SVS efforts to emphasize the careful integration of the SVS PFD and ND. The principle was adopted as a best practice philosophy. Although those efforts certainly include use of the same terrain portrayal techniques, most of the efforts have been concentrated on symbology integration to ensure cohesive, conjunctive operations.
The SVS ND is a direct enhancement of a conventional ND with the addition of terrain. In its exocentric coplanar “gods’-eye view” navigation mode, the display incorporates TAWS caution and warning overlays and a VSD (see fig. 10), as well as CDTI to help a pilot’s cognitive understanding of map and ownship positioning and that of traffic, terrain, route, and obstacle hazards. However, a usability study preceding a simulator experiment (Prinzel et al., 2005a) determined that most pilots preferred to

76
access a TAWS peaks mode display that employs a relative altitude presentation during low altitude maneuvering rather than the absolute altitude presentation employed by the SVS ND with TAWS overlays. Therefore the synthetic terrain presentation would be a pilot-selectable page or option, allowing the pilot to declutter this information when not required or desired.
Figure 40. GA PFD with horizon line gapped about the velocity vector symbol.
The pilot would also have a selectable “situation awareness” mode in which the ND
changes the display frame-of-reference (see fig. 11) from a 2-D “god’s-eye view” to a dynamic 3-D exocentric perspective view of ownship position with respect to traffic, terrain, route, and obstacles (Prinzel et al., 2005a). The VSD is no longer presented. Best practices within the SVS Project for both the 2-D coplanar mode and the 3-D “situation awareness” mode of the SVS ND follow. For organizational convenience, the best practices are presented by the following topic order: PFD FOV Lines, Terrain / Pathway, Obstacles, and Traffic.
6.1.2.1.3.1 PFD FOV Lines. One of the most effective techniques for integration of the SVS PFD and 2-D coplanar mode of the ND employs FOV lines that are drawn to enclose the forward area on the ND encompassed by the view presented on the SVS PFD / HUD (the PFD FOV “wedge”). The FOV lines (see fig. 13) promote visual momentum between the ND and PFD so it becomes an easy task to correlate features on each display (e.g., they can be particularly useful during TCAS alerts or ATC callouts to locate individual traffic). Best practice has been to use haloed dotted green lines to denote the PFD FOV wedge.
6.1.2.1.3.2 Terrain / Pathway. The exocentric coplanar view of the NASA SVS ND includes terrain, pathway, obstacles and CDTI. The pathway is represented by a magenta line, and if RNP procedures are underway, the RNP boundaries are represented, only when off path, by a dotted aqua-colored corridor (see fig. 41). When on path, the terrain profile in the VSD is the terrain along the magenta path, even if the path is a curved
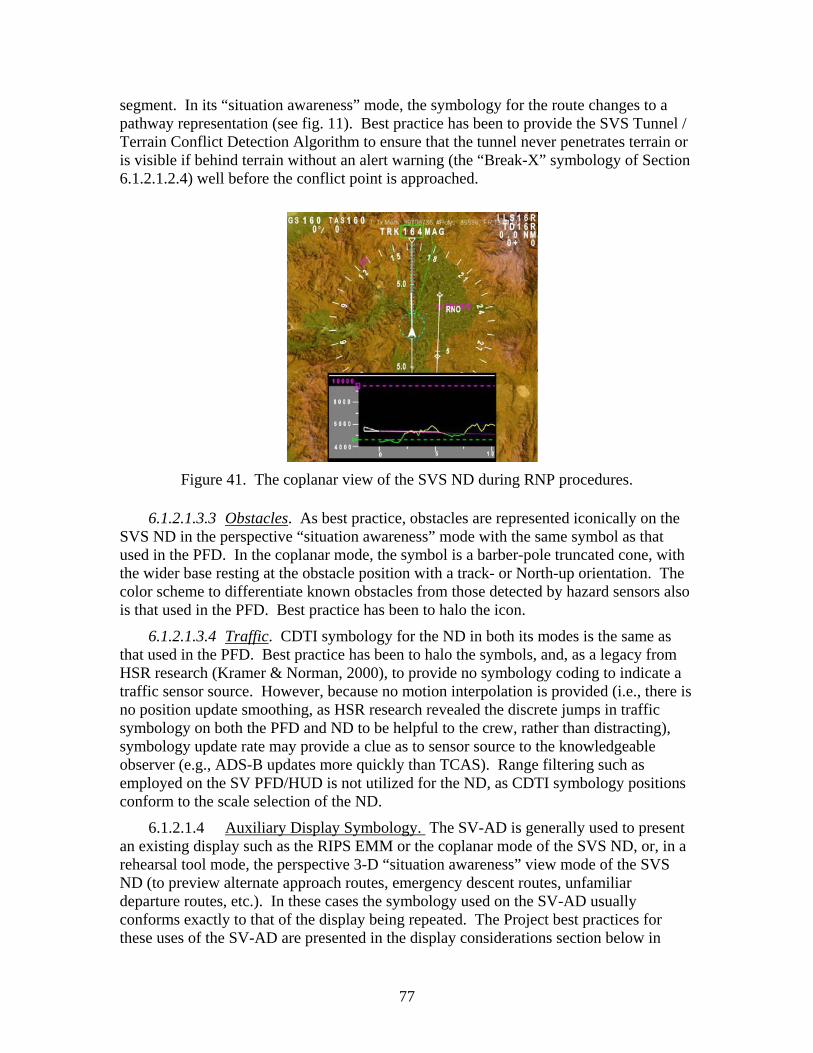
77
segment. In its “situation awareness” mode, the symbology for the route changes to a pathway representation (see fig. 11). Best practice has been to provide the SVS Tunnel / Terrain Conflict Detection Algorithm to ensure that the tunnel never penetrates terrain or is visible if behind terrain without an alert warning (the “Break-X” symbology of Section 6.1.2.1.2.4) well before the conflict point is approached.
Figure 41. The coplanar view of the SVS ND during RNP procedures.
6.1.2.1.3.3 Obstacles. As best practice, obstacles are represented iconically on the SVS ND in the perspective “situation awareness” mode with the same symbol as that used in the PFD. In the coplanar mode, the symbol is a barber-pole truncated cone, with the wider base resting at the obstacle position with a track- or North-up orientation. The color scheme to differentiate known obstacles from those detected by hazard sensors also is that used in the PFD. Best practice has been to halo the icon.
6.1.2.1.3.4 Traffic. CDTI symbology for the ND in both its modes is the same as that used in the PFD. Best practice has been to halo the symbols, and, as a legacy from HSR research (Kramer & Norman, 2000), to provide no symbology coding to indicate a traffic sensor source. However, because no motion interpolation is provided (i.e., there is no position update smoothing, as HSR research revealed the discrete jumps in traffic symbology on both the PFD and ND to be helpful to the crew, rather than distracting), symbology update rate may provide a clue as to sensor source to the knowledgeable observer (e.g., ADS-B updates more quickly than TCAS). Range filtering such as employed on the SV PFD/HUD is not utilized for the ND, as CDTI symbology positions conform to the scale selection of the ND.
6.1.2.1.4 Auxiliary Display Symbology. The SV-AD is generally used to present an existing display such as the RIPS EMM or the coplanar mode of the SVS ND, or, in a rehearsal tool mode, the perspective 3-D “situation awareness” view mode of the SVS ND (to preview alternate approach routes, emergency descent routes, unfamiliar departure routes, etc.). In these cases the symbology used on the SV-AD usually conforms exactly to that of the display being repeated. The Project best practices for these uses of the SV-AD are presented in the display considerations section below in
78
Section 6.1.2.2.5. The symbology exception to be presented here is for an SVS implementation that includes a single HUD and the presence of an EVS imaging sensor. When the PF is using the HUD with an EVS image for flight or surface operations, the PNF may choose to display the EVS image on the SV-AD. That raster image presentation does not include the HUD stroke symbology. The HUD symbology set is replicated on the SV-AD, and an independent declutter switch is provided to allow the PNF to easily verify the aim-point and the guidance, and to scan for traffic and obstacles by removing the SV-AD symbology set to allow full presentation of the EVS image in the critical area in which obstacles might appear. The use of a periphery symbology set for a head-down display of an EVS image, rather than the display-centered HUD-like set, was considered from the original work of CMC Electronics, a CRA partner (McKay et al., 2002), for use with FLIR and millimeter wave radar sensors (see fig. 42). However, a usability study conducted as part of a simulator study (Bailey et al., 2006) found pilots preferred the ‘declutterable’ HUD-like symbology set, and it has been adopted as best practice by NASA SVS.
6.1.2.2 Flight Operations Display Considerations. The best practices that evolved in the area of specific flight displays are discussed in terms of the issues that arose for consideration for that specific display device in flight operations (PFD, HUD, ND, and Auxiliary Display), concluding with lessons concerning Update Rate.
6.1.2.2.1 PFD. For an SVS image to be conformal, objects in the displayed image need to subtend the same angles they do in the real world. Conformal SVS displays provide the size, shape, and location of the terrain to the pilot exactly as it would appear if the SVS display were a window. The conformal FOV of a display device is based on the size of the display device and the distance from the display device to the pilot’s eye reference point (ERP). See Figure 43 for a graphical illustration of these parameters along with the equations for conformal horizontal and vertical FOV.
Because of retrofit considerations, the SVS Project initially invested a large portion of the CAB element resources into research centered on the effects of display surface size and the associated issues of minification and FOV that become primary in the presentation of an outside perspective scene at other than unity scaling (a conformal image). FOV is a design parameter that has specific importance for SVS displays. Larger FOVs permit pilots to view larger areas but require the display image to become less conformal. Larger FOVs, while being useful during turns or in turbulence, make objects appear further away (objects are minified). Variations in FOV affect the pilot’s ability to judge distances. Lower FOVs provide an image that becomes more conformal (objects are less minified) and enhance depth perception. Objects that are narrow, like runways, become more visible with lower FOVs.

79
Figure 42. An example of a periphery symbology set for EVS imagery presentation on
the SV-AD, by CRA partner CMC Electronics, Inc.
Figure 43. Definition of a conformal display’s horizontal and vertical FOVs, along with
the aspect ratio.
SVS imagery can be generated for almost any FOV and displayed to the pilot. The degree to which the SVS imagery deviates from the conformal FOV is referred to as the Minification Factor (MF). The MF is defined as the FOV of the imagery being displayed to the pilot divided by the conformal FOV of the display device. The MF is also the
Speed
Speed Trend
Command Speed
Altitude
Altitude Trend
Command Altitude
Course, GlideslopeDeviation
Flight Director
Flight Path Vector
Command Heading Heading
Pitch Attitude
Radar Altitude
1414
19
10
30
- -

80
inverse of the magnification factor. Conformal FOV is also referred to as unity magnification/minification.
Figures 44 and 45 present images for the SVS-PFD portion of an ARINC Size-D display for 30º and 60º FOVs for identical aircraft positions, approximately 1.5 nm from a DFW runway. A MF of 2.1 resulted for the 30º FOV while the 60º FOV produced a
Figure 44. Image of ARINC Size-D display for 30º FOV, approximately 1.5 nm from a
DFW runway.
Figure 45. Image of ARINC Size-D display for 60º FOV for identical aircraft position,
approximately 1.5 nm from a DFW runway.
MF of 4.1 for this size display. From these two images, the effect of variations of the MF can be seen. Increased MFs create the illusion that objects (like the runway) are further away, and, although counter-intuitively, an appearance that the altitude has decreased
81
(because of an increased downward view of previously un-displayed foreground scenery; see fig. 44 and 45). Another effect of variations of the MF is that lateral and vertical displayed distance between the velocity vector and the runway has been reduced for increased MF. These changes can lead to variations in the pilot’s ability to use the combination of the runway and the velocity vector as a guidance aid to manage flight path due to symbology clutter. A change in MF also affects apparent handling qualities in pursuit guidance tasks such as following flight director commands, as control stick / flight path marker sensitivities change (the same unit of stick movement creates differing display units of movement for the flight path marker). For organizational convenience, the best practices are presented by the following topic order: FOV / Minification, Size, and Guidance Symbology Minification.
6.1.2.2.1.1 FOV / Minification. In order to address the related issues of size, FOV and minification, the idea evolved early in the CAB effort to investigate a pilot-selectable FOV control. Pilot opinion was extremely favorable for the idea, as a higher FOV was useful for the en route, initial approach and departure phases of flight, and a smaller FOV was useful for final approach and take-off. After experience was gained in several studies, the best practice values for FOV evolved as 90°, 60°, and 30°, regardless of the display size. A FOV of greater than 90° appeared distorted as if viewed through a fish-eye lens, while a FOV equivalent to unity minification gave the impression of viewing a scene through a straw.
The most complete examination of the related issues of display size, MF and FOV within the SVS Project occurred during the DFW flight test (Glaab et al., 2003). Table 3 summarizes a sample of the FOVs tested. In the Table 3, unity FOV implies the FOV that would be provided by the display based on size of the display area combined with a 25 inch ERP distance (unity FOV was actually unity minification factor). At the DFW flight trials, which involved a runway change task at 5 nm from touchdown (see fig. 46), a consistent pattern was developed by the evaluation pilots for SVS FOV control during the horseshoe approach course. During maneuvering from one extended runway centerline to another (e.g., the "transition" phase of a runway change task), larger field-of-view settings were generally used, with a gradual reduction in the field-of-view selection as the pilots neared the landing runway (e.g., the "tracking" phase of a runway change task). This behavior is interpreted as a function of display minification in Figure 47, which shows the mean (and standard deviation) of the display MF used in the DFW runway change task (the "transition" phase) plotted as a function of the SVS HDD size. The pilots tended to use a less minified display for the larger display sizes (conversely, these results also indicate that pilots incurred larger MFs for the smaller displays to achieve the desired FOVs, while demonstrating the ability to maintain a degraded but similar level of performance), but the minification factor always approached unity as the pilots neared landing (i.e., the "tracking” phase) for all display sizes (see fig.48).
6.1.2.2.1.2 Size. At the DFW flight trials, particular attention was given to whether Synthetic Vision concepts could effectively be implemented on common display sizes, from ARINC Size A to Size D up to a conceptual Size X (10” x 8”). Research throughout the SVS Project has shown that display size is not a critical issue, given that field-of-view (i.e., field-of-regard) control is provided to the pilot (Kramer et al., 2004b; Kramer et al., 2003). As a further example, at EGE (Bailey et al., 2002), statistically-

82
Table 3. Display size and available fields of view and Minification Factors (MFs) for evaluation.
Physical display
dimensions
Unity FOV
MF
Size Width,
in. Height,
in.
H, deg
V, deg
30°
60°
90°
120° A 5.25 5 12.0 11.4 2.5 5.0 7.5 10.0 D 6.4 6.4 14.6 14.6 2.1 4.1 6.2 8.2 X 10 8 22.6 18.2 1.3 2.7 4.0 5.3
Figure 46. DFW change of runway task.
significant benefits for the SVS HDDs were found over a baseline display suite consisting of an EFIS with TAWS display configuration. The subjective rating comparison is shown in Figure 49 for the SVS Size A/B concept and for the SVS Size X concept compared to the baseline display configuration. The data clearly show a trend that the evaluation pilots “Strongly Agreed” that it was easy to determine the aircraft position with respect to terrain with a SVS HDD concept, particularly when implemented using the largest display media (Size X). The Size A photo-realistic and Size X generic and photo-realistic SVS display concepts provided highly statistically-significant terrain awareness improvement over the baseline display (Electronic Attitude Direction Indicator (EADI), and TAWS ND).
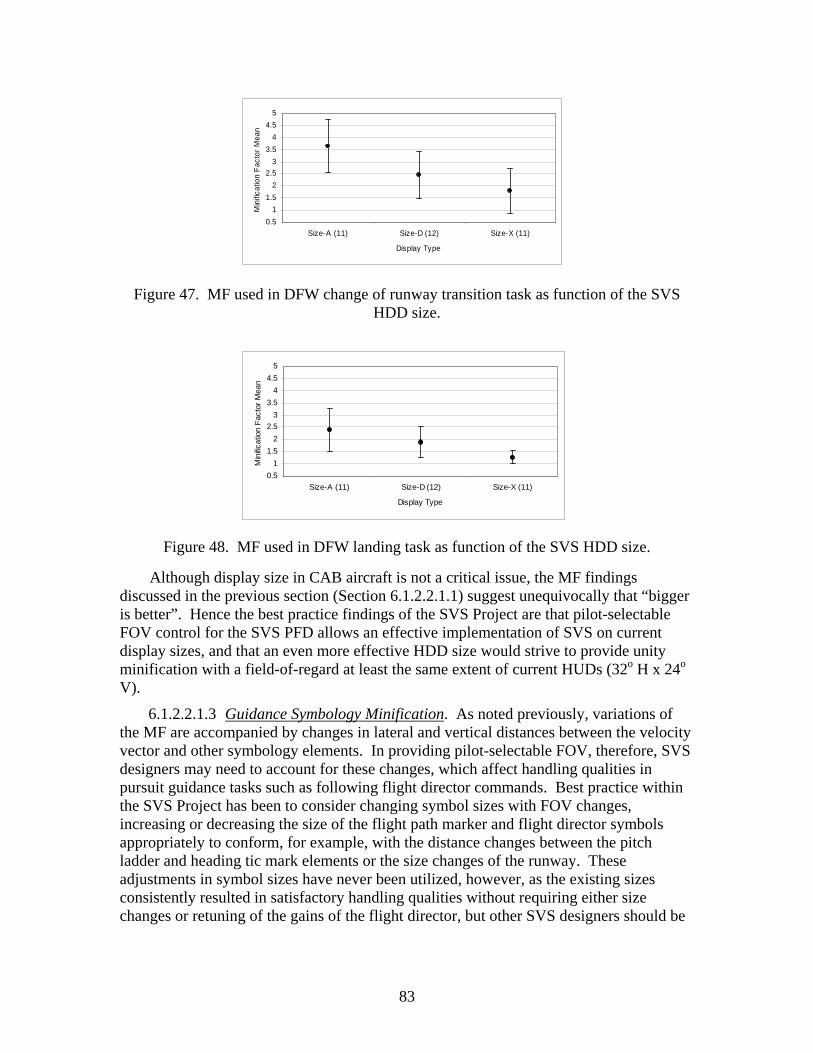
83
Figure 47. MF used in DFW change of runway transition task as function of the SVS
HDD size.
Figure 48. MF used in DFW landing task as function of the SVS HDD size.
Although display size in CAB aircraft is not a critical issue, the MF findings
discussed in the previous section (Section 6.1.2.2.1.1) suggest unequivocally that “bigger is better”. Hence the best practice findings of the SVS Project are that pilot-selectable FOV control for the SVS PFD allows an effective implementation of SVS on current display sizes, and that an even more effective HDD size would strive to provide unity minification with a field-of-regard at least the same extent of current HUDs (32o H x 24o V).
6.1.2.2.1.3 Guidance Symbology Minification. As noted previously, variations of the MF are accompanied by changes in lateral and vertical distances between the velocity vector and other symbology elements. In providing pilot-selectable FOV, therefore, SVS designers may need to account for these changes, which affect handling qualities in pursuit guidance tasks such as following flight director commands. Best practice within the SVS Project has been to consider changing symbol sizes with FOV changes, increasing or decreasing the size of the flight path marker and flight director symbols appropriately to conform, for example, with the distance changes between the pitch ladder and heading tic mark elements or the size changes of the runway. These adjustments in symbol sizes have never been utilized, however, as the existing sizes consistently resulted in satisfactory handling qualities without requiring either size changes or retuning of the gains of the flight director, but other SVS designers should be
0.51
1.52
2.53
3.54
4.55
Size-A (11) Size-D (12) Size-X (11)
Display Type
Min
ificat
ion
Fact
or M
ean
0.51
1.52
2.53
3.54
4.55
Size-A (11) Size-D (12) Size-X (11)
Display TypeM
inific
atio
n Fa
ctor
Mea
n

84
aware of the potential problem, as well as the potential solution offered by adjustments in symbol sizes.
Figure 49. Ease in determining aircraft position with respect to terrain with SVS
concepts compared to baseline EADI with TAWS display configuration.
6.1.2.2.1.4 Variable FOV Implementation. A pilot-selectable field-of-view control was found to be optimal; however, this control, as noted above, influences the pilot’s perception of spatial distance, depth and range cuing, and handling qualities. In NASA testing, a separate, additional control was provided to the pilots for this FOV-selection function. Avionics manufacturers are concerned that such perceptual issues might become certification show-stoppers. NASA has found during its research that pilot training quickly alleviates any such issues, although a dedicated training-effects experiment was never conducted on these issues.
NASA considered, but never implemented nor tested, variable, but automatic FOV control, whereby the FOV was pre-set based upon aircraft configuration. For instance, the nominal FOV would be 60o, but if the aircraft flaps were deployed, the FOV would be 45o, and, if gear were then deployed, the FOV would be unity. This type of scheduling could provide a FOV control approaching that used during NASA flight tests with a pilot-selectable FOV.
Alternatively, the FOV selection in the SVS-PFD may be tied to the ND range selection. Range control of the ND is “standard operating procedure” and it directly reflects the pilot’s area of interest. Thus, FOV settings on the SVS-PFD could be tied to the range settings on the ND: higher ranges corresponding to larger SVS FOVs and lower ranges approaching unity FOV. The use of embedded range rings in the SVS terrain on the PFD also provides visual momentum between the ND and PFD to: a) help mitigate
Q.1: It Was Easy To Determine Aircraft Position wrt Terrain
0%
25%
50%
75%
100%
Strong
ly Disa
gree
Moderat
ely Disa
gree
Slightl
y Disa
gree
Slightl
y Agre
e
Moderat
ely Agre
e
Strong
ly Agre
e
Perc
enta
ge o
f Occ
uren
ces
EADI-Baseline SV HDD - Size A
Q.1: It Was Easy To Determine Aircraft Position wrt Terrain
0%
25%
50%
75%
100%
Strong
ly Disa
gree
Moderat
ely Disa
gree
Slight l
y Disa
gree
Slight l
y Agre
e
Moderat
ely Agre
e
Strong
ly Agre
e
Perc
enta
ge o
f Occ
uren
ces
EADI-Baseline SV HDD - Size X
Q.1: It Was Easy To Determine Aircraft Position wrt Terrain
0%
25%
50%
75%
100%
Strong
ly Disa
gree
Moderat
ely Disa
gree
Slightl
y Disa
gree
Slightl
y Agre
e
Moderat
ely Agre
e
Strong
ly Agre
e
Perc
enta
ge o
f Occ
uren
ces
EADI-Baseline SV-HUD

85
the depth/range perception with a minified display; and, b) provide additional cueing to the FOV selection. These concepts are being evaluated and embedded range rings may become part of Honeywell’s SVS product (He et al., 2007).
Lastly, another issue in the use of a variable FOV selection concerns upset or unusual attitude recovery. The SVS-PFD must serve as a primary flight reference, and one of the required functions of the PFR is to provide the pilot with instantaneous and unmistakable cues for correct recognition of an aircraft attitude and energy condition and support positive and prompt recovery from any upset or unusual flight condition. A variable FOV control would alter the range of pitch attitude being shown on the PFD and this might potentially impede attitude recognition and recovery. It has been the contention that the SVS-PFD design would follow HUD experience that shows that the overwhelming components for successful unusual attitude recognition and recovery are the symbology design of the PFR. The SVS-PFD could be designed, like a commercial HUD, to contain an “unusual attitude” mode, whereby the SVS-PFD or SVS-HUD symbology is changed automatically to facilitate unusual attitude recognition and recovery when the aircraft exceeds pre-set attitude parameters.
6.1.2.2.2 HUD. The SVS HUD concept is analogous in many respects to the EVS certified on the Gulfstream G-V, except that the raster image is synthetically-derived rather than being a direct imaging sensor output. Unlike EVS displays, the SVS HUD concept uses a clear sky rather than a sensor image of the sky, so there is no obstruction of that area of the display. Below the horizon, the raster image may obstruct the view of the outside real world (as with an EVS image), particularly if the raster brightness is not controlled appropriately by the pilot. Obstruction of the outside real world scene by such a display is a recognized certification issue.
The viability of the SVS HUD was initially tested and "proven" in the DFW flight trials (Glaab et al., 2003). Flying night VFR operations, the colliminated HUD imagery provided immersive qualities which were very well-received by the evaluation pilots. Pilot comments noted positive situation awareness benefits without significant liabilities. Separate HUD controls for the stroke and raster brightness and a button on the control yoke for symbology and SVS raster imagery declutter were essential. During the EGE flight trials (Kramer et al., 2004b), which, unlike the DFW evaluations, were conducted in daylight conditions, the SVS HUD concept was, again, proven to be an enhancement over present-day cockpit display technology for terrain awareness.
In the EGE flight test, comparisons were made against a baseline display suite with no HUD consisting of a Size A EADI and a Size B ND, including TAWS capability. As shown in Figure 49, a majority of evaluation pilots subjectively rated their awareness of the terrain as being better when flying the SVS HUD than when flying the baseline display suite.
In both flight trials, the SVS HUD concept was, for all intents, a monochromatic green representation of the full-color, head-down display SVS concept, using an RS-343 video format. No effort was expended to examine graphical light source or other terrain shading issues tailored to the HUD.
In contrast to the subjectively-reported success, however, the data of Figure 49 also show that the situation awareness enhancement was not universal. Some negative ratings
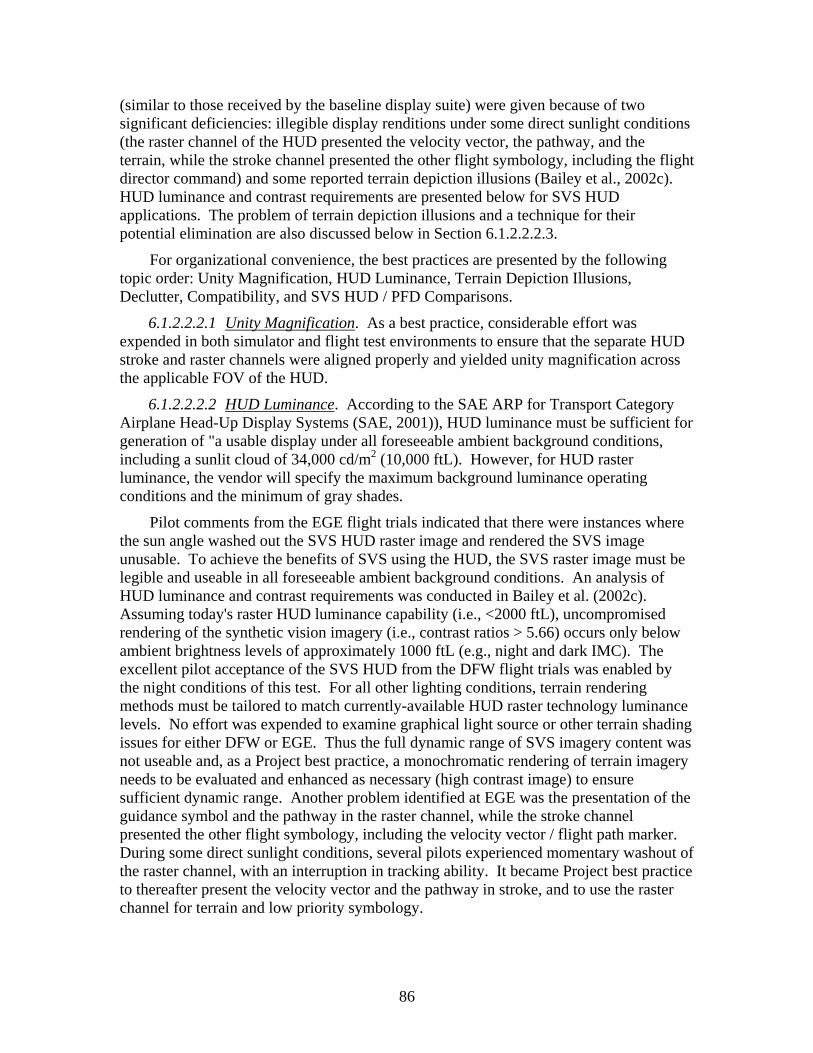
86
(similar to those received by the baseline display suite) were given because of two significant deficiencies: illegible display renditions under some direct sunlight conditions (the raster channel of the HUD presented the velocity vector, the pathway, and the terrain, while the stroke channel presented the other flight symbology, including the flight director command) and some reported terrain depiction illusions (Bailey et al., 2002c). HUD luminance and contrast requirements are presented below for SVS HUD applications. The problem of terrain depiction illusions and a technique for their potential elimination are also discussed below in Section 6.1.2.2.2.3.
For organizational convenience, the best practices are presented by the following topic order: Unity Magnification, HUD Luminance, Terrain Depiction Illusions, Declutter, Compatibility, and SVS HUD / PFD Comparisons.
6.1.2.2.2.1 Unity Magnification. As a best practice, considerable effort was expended in both simulator and flight test environments to ensure that the separate HUD stroke and raster channels were aligned properly and yielded unity magnification across the applicable FOV of the HUD.
6.1.2.2.2.2 HUD Luminance. According to the SAE ARP for Transport Category Airplane Head-Up Display Systems (SAE, 2001)), HUD luminance must be sufficient for generation of "a usable display under all foreseeable ambient background conditions, including a sunlit cloud of 34,000 cd/m2 (10,000 ftL). However, for HUD raster luminance, the vendor will specify the maximum background luminance operating conditions and the minimum of gray shades.
Pilot comments from the EGE flight trials indicated that there were instances where the sun angle washed out the SVS HUD raster image and rendered the SVS image unusable. To achieve the benefits of SVS using the HUD, the SVS raster image must be legible and useable in all foreseeable ambient background conditions. An analysis of HUD luminance and contrast requirements was conducted in Bailey et al. (2002c). Assuming today's raster HUD luminance capability (i.e., <2000 ftL), uncompromised rendering of the synthetic vision imagery (i.e., contrast ratios > 5.66) occurs only below ambient brightness levels of approximately 1000 ftL (e.g., night and dark IMC). The excellent pilot acceptance of the SVS HUD from the DFW flight trials was enabled by the night conditions of this test. For all other lighting conditions, terrain rendering methods must be tailored to match currently-available HUD raster technology luminance levels. No effort was expended to examine graphical light source or other terrain shading issues for either DFW or EGE. Thus the full dynamic range of SVS imagery content was not useable and, as a Project best practice, a monochromatic rendering of terrain imagery needs to be evaluated and enhanced as necessary (high contrast image) to ensure sufficient dynamic range. Another problem identified at EGE was the presentation of the guidance symbol and the pathway in the raster channel, while the stroke channel presented the other flight symbology, including the velocity vector / flight path marker. During some direct sunlight conditions, several pilots experienced momentary washout of the raster channel, with an interruption in tracking ability. It became Project best practice to thereafter present the velocity vector and the pathway in stroke, and to use the raster channel for terrain and low priority symbology.
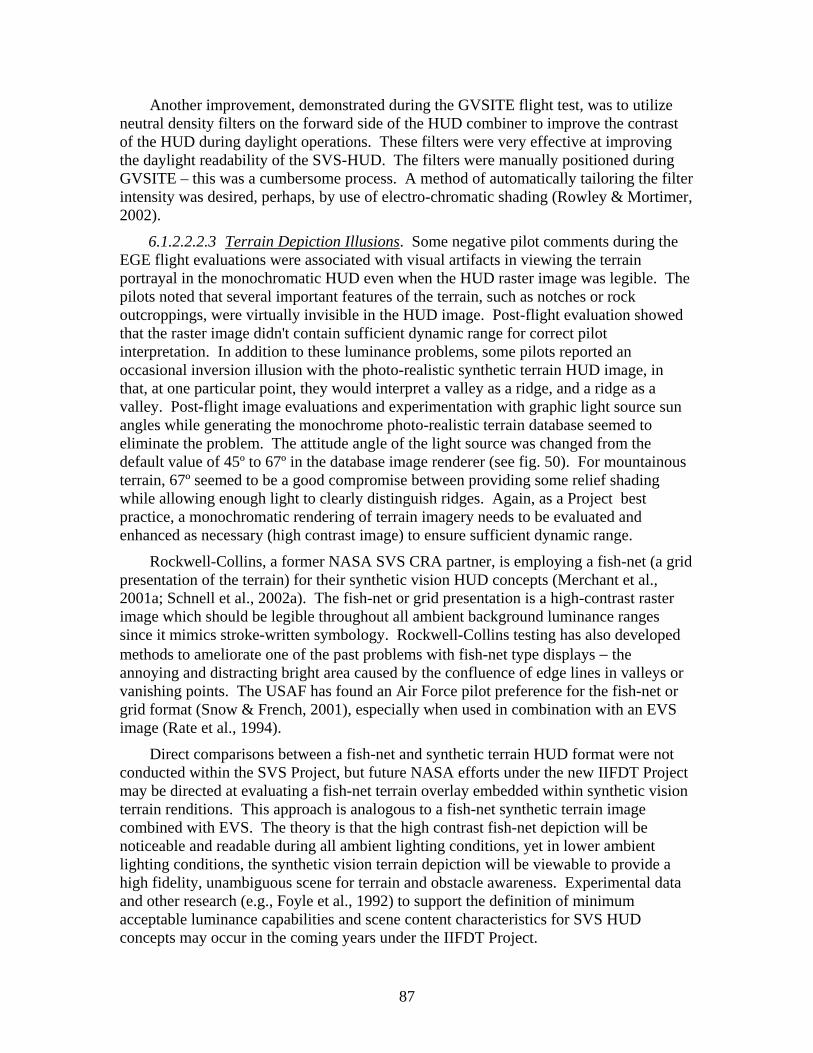
87
Another improvement, demonstrated during the GVSITE flight test, was to utilize neutral density filters on the forward side of the HUD combiner to improve the contrast of the HUD during daylight operations. These filters were very effective at improving the daylight readability of the SVS-HUD. The filters were manually positioned during GVSITE – this was a cumbersome process. A method of automatically tailoring the filter intensity was desired, perhaps, by use of electro-chromatic shading (Rowley & Mortimer, 2002).
6.1.2.2.2.3 Terrain Depiction Illusions. Some negative pilot comments during the EGE flight evaluations were associated with visual artifacts in viewing the terrain portrayal in the monochromatic HUD even when the HUD raster image was legible. The pilots noted that several important features of the terrain, such as notches or rock outcroppings, were virtually invisible in the HUD image. Post-flight evaluation showed that the raster image didn't contain sufficient dynamic range for correct pilot interpretation. In addition to these luminance problems, some pilots reported an occasional inversion illusion with the photo-realistic synthetic terrain HUD image, in that, at one particular point, they would interpret a valley as a ridge, and a ridge as a valley. Post-flight image evaluations and experimentation with graphic light source sun angles while generating the monochrome photo-realistic terrain database seemed to eliminate the problem. The attitude angle of the light source was changed from the default value of 45º to 67º in the database image renderer (see fig. 50). For mountainous terrain, 67º seemed to be a good compromise between providing some relief shading while allowing enough light to clearly distinguish ridges. Again, as a Project best practice, a monochromatic rendering of terrain imagery needs to be evaluated and enhanced as necessary (high contrast image) to ensure sufficient dynamic range.
Rockwell-Collins, a former NASA SVS CRA partner, is employing a fish-net (a grid presentation of the terrain) for their synthetic vision HUD concepts (Merchant et al., 2001a; Schnell et al., 2002a). The fish-net or grid presentation is a high-contrast raster image which should be legible throughout all ambient background luminance ranges since it mimics stroke-written symbology. Rockwell-Collins testing has also developed methods to ameliorate one of the past problems with fish-net type displays − the annoying and distracting bright area caused by the confluence of edge lines in valleys or vanishing points. The USAF has found an Air Force pilot preference for the fish-net or grid format (Snow & French, 2001), especially when used in combination with an EVS image (Rate et al., 1994).
Direct comparisons between a fish-net and synthetic terrain HUD format were not conducted within the SVS Project, but future NASA efforts under the new IIFDT Project may be directed at evaluating a fish-net terrain overlay embedded within synthetic vision terrain renditions. This approach is analogous to a fish-net synthetic terrain image combined with EVS. The theory is that the high contrast fish-net depiction will be noticeable and readable during all ambient lighting conditions, yet in lower ambient lighting conditions, the synthetic vision terrain depiction will be viewable to provide a high fidelity, unambiguous scene for terrain and obstacle awareness. Experimental data and other research (e.g., Foyle et al., 1992) to support the definition of minimum acceptable luminance capabilities and scene content characteristics for SVS HUD concepts may occur in the coming years under the IIFDT Project.

88
Figure 50. Effect of changing the attitude angle of the light source from 45º to 67º in the
database image renderer.
6.1.2.2.2.4 Declutter. Because of the concern for obscuring any potential viewing of the real world by the SVS synthetic scene being presented in the raster channel of the SVS HUD, it was best practice to provide a declutter switch on the yoke to toggle the raster channel on / off. During the course of the Project, it also became best practice to provide another similar switch for the stroke symbology channel.
6.1.2.2.2.5 Compatibility. In keeping with the best practice philosophy of aggressive pursuit of display integration opportunities, SVS HUD and HDD symbologies were made as compatible as possible within Project constraints of time and funding. However, these are very different display media. Major concerns with HUD displays are fixed field of regard; a monochrome image, which eliminates color coding usage for cautions and warnings, for example, and provides an easily cluttered environment; and the potential for display obscuration of the real world out-the-window view.
6.1.2.2.2.6 SVS HUD / PFD Comparisons. Many of the Project experiments, both simulator and flight, produced data that allowed direct comparison of SVS HUD and HDD concepts in flight operations. Almost universally in the comparisons of objective data, the HUD and HDD performance were equivalent statistically, if not operationally. In the case of subjective data comparisons, the few metrics that were statistically separable favored the HUD concept, with one notable exception, which occurred at EGE. At EGE, the Situation Awareness- Subjective Workload Dominance (SA-SWORD) rating was found to be significantly higher with the Size X HDD than with the HUD (see fig. 51). However, the EGE flight test was conducted in daylight conditions with simulated low visibility conditions and the HUD luminance and terrain depiction issues encountered there have been previously discussed. The lower SA-SWORD ratings are probably attributable to those issues. While few subjective metrics were statistically separable, when asked directly for a preferred display configuration, the SVS HUD concept was overwhelmingly selected. Head up position for out-the-window viewing and unity magnification were always cited as the major rationales for that selection.
45º 67º
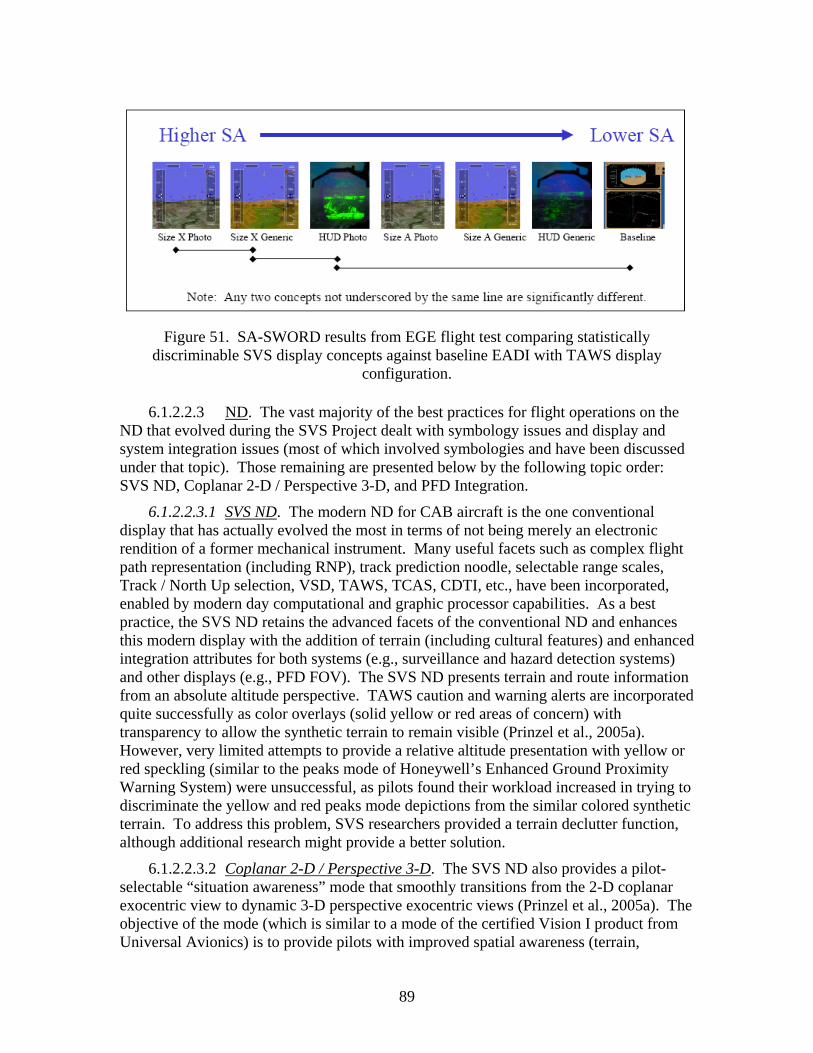
89
Figure 51. SA-SWORD results from EGE flight test comparing statistically
discriminable SVS display concepts against baseline EADI with TAWS display configuration.
6.1.2.2.3 ND. The vast majority of the best practices for flight operations on the ND that evolved during the SVS Project dealt with symbology issues and display and system integration issues (most of which involved symbologies and have been discussed under that topic). Those remaining are presented below by the following topic order: SVS ND, Coplanar 2-D / Perspective 3-D, and PFD Integration.
6.1.2.2.3.1 SVS ND. The modern ND for CAB aircraft is the one conventional display that has actually evolved the most in terms of not being merely an electronic rendition of a former mechanical instrument. Many useful facets such as complex flight path representation (including RNP), track prediction noodle, selectable range scales, Track / North Up selection, VSD, TAWS, TCAS, CDTI, etc., have been incorporated, enabled by modern day computational and graphic processor capabilities. As a best practice, the SVS ND retains the advanced facets of the conventional ND and enhances this modern display with the addition of terrain (including cultural features) and enhanced integration attributes for both systems (e.g., surveillance and hazard detection systems) and other displays (e.g., PFD FOV). The SVS ND presents terrain and route information from an absolute altitude perspective. TAWS caution and warning alerts are incorporated quite successfully as color overlays (solid yellow or red areas of concern) with transparency to allow the synthetic terrain to remain visible (Prinzel et al., 2005a). However, very limited attempts to provide a relative altitude presentation with yellow or red speckling (similar to the peaks mode of Honeywell’s Enhanced Ground Proximity Warning System) were unsuccessful, as pilots found their workload increased in trying to discriminate the yellow and red peaks mode depictions from the similar colored synthetic terrain. To address this problem, SVS researchers provided a terrain declutter function, although additional research might provide a better solution.
6.1.2.2.3.2 Coplanar 2-D / Perspective 3-D. The SVS ND also provides a pilot-selectable “situation awareness” mode that smoothly transitions from the 2-D coplanar exocentric view to dynamic 3-D perspective exocentric views (Prinzel et al., 2005a). The objective of the mode (which is similar to a mode of the certified Vision I product from Universal Avionics) is to provide pilots with improved spatial awareness (terrain,

90
pathway, traffic, obstacles). The pilot-selectable dynamic “situation awareness” mode of the SVS ND is illustrated in Figure 52. When the pilot initiates this mode, the view smoothly transitions from the 2-D SVS coplanar view to a (a) 20º right offset view at 10,000 feet (which is maintained for 5 seconds) and then pans to a (b) 20º left offset view at 10,000 feet (which is maintained for 5 seconds) and then smoothly transitions back again to 2-D SVS coplanar view. These 3-D views “time out” after the 10 seconds back to the 2-D overhead view to preclude the possibility that a pilot might leave the navigation display in the 3-D mode and attempt to use it for primary navigation.
Figure 52. The dynamic “situation awareness” mode of the SVS ND.
6.1.2.2.3.3 PFD Integration. As best practices of the SVS Project, the SVS ND utilizes the same terrain depiction techniques and the same symbology icons (traffic, obstacles) as the SVS PFD. Spatial integration is provided by the PFD FOV wedge (or PFD FOV lines) that appears on the ND. The wedge changes shape appropriately with PFD FOV selections and ND range selections.
6.1.2.2.4 Auxiliary Display. NASA actually has had limited experience with the SV-AD (Arthur et al., 2005; Kramer et al., 2005a; Jones, 2005; Jones & Prinzel, 2006), and the best practices that have evolved are mostly conceptual ideas that have not been thoroughly evaluated. Nonetheless, those practices are recorded here as ideas that, at least, appear to work reasonably well by the following topic order: RIPS Operations, EVS Applications, Rehearsal / Briefing Tool, and Electronic Flight Bag.
Standard 2-D mode of SVS ND.
First View Second View
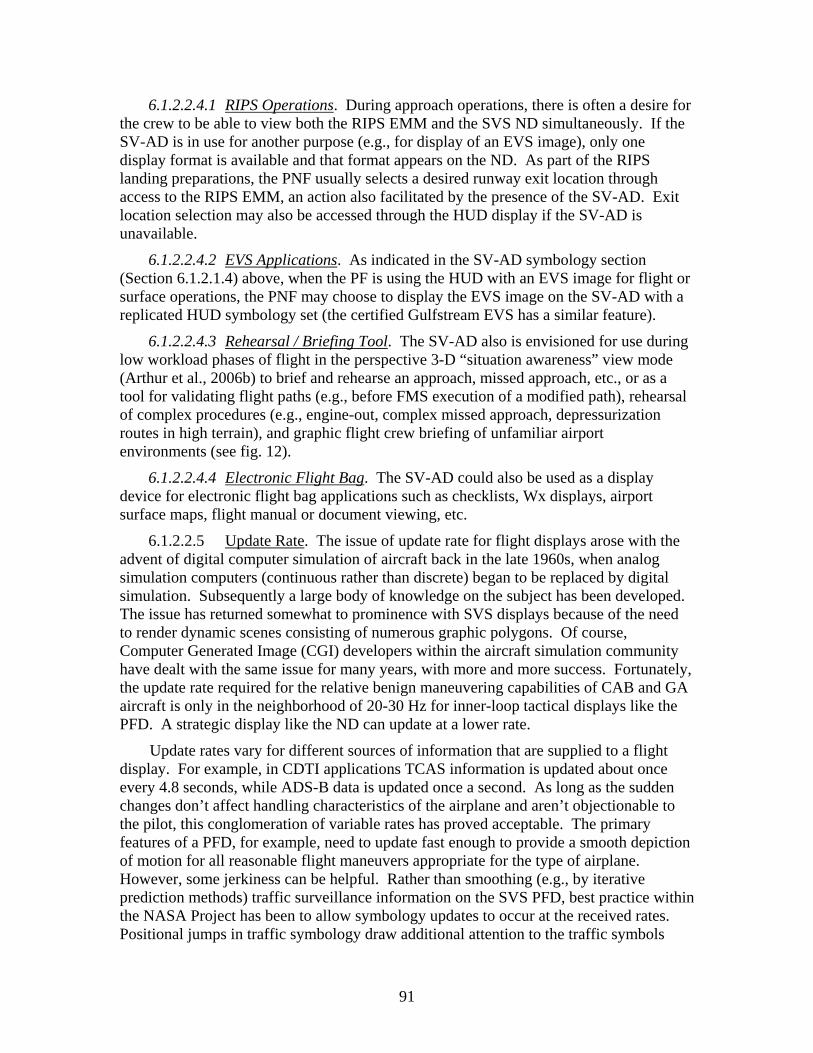
91
6.1.2.2.4.1 RIPS Operations. During approach operations, there is often a desire for the crew to be able to view both the RIPS EMM and the SVS ND simultaneously. If the SV-AD is in use for another purpose (e.g., for display of an EVS image), only one display format is available and that format appears on the ND. As part of the RIPS landing preparations, the PNF usually selects a desired runway exit location through access to the RIPS EMM, an action also facilitated by the presence of the SV-AD. Exit location selection may also be accessed through the HUD display if the SV-AD is unavailable.
6.1.2.2.4.2 EVS Applications. As indicated in the SV-AD symbology section (Section 6.1.2.1.4) above, when the PF is using the HUD with an EVS image for flight or surface operations, the PNF may choose to display the EVS image on the SV-AD with a replicated HUD symbology set (the certified Gulfstream EVS has a similar feature).
6.1.2.2.4.3 Rehearsal / Briefing Tool. The SV-AD also is envisioned for use during low workload phases of flight in the perspective 3-D “situation awareness” view mode (Arthur et al., 2006b) to brief and rehearse an approach, missed approach, etc., or as a tool for validating flight paths (e.g., before FMS execution of a modified path), rehearsal of complex procedures (e.g., engine-out, complex missed approach, depressurization routes in high terrain), and graphic flight crew briefing of unfamiliar airport environments (see fig. 12).
6.1.2.2.4.4 Electronic Flight Bag. The SV-AD could also be used as a display device for electronic flight bag applications such as checklists, Wx displays, airport surface maps, flight manual or document viewing, etc.
6.1.2.2.5 Update Rate. The issue of update rate for flight displays arose with the advent of digital computer simulation of aircraft back in the late 1960s, when analog simulation computers (continuous rather than discrete) began to be replaced by digital simulation. Subsequently a large body of knowledge on the subject has been developed. The issue has returned somewhat to prominence with SVS displays because of the need to render dynamic scenes consisting of numerous graphic polygons. Of course, Computer Generated Image (CGI) developers within the aircraft simulation community have dealt with the same issue for many years, with more and more success. Fortunately, the update rate required for the relative benign maneuvering capabilities of CAB and GA aircraft is only in the neighborhood of 20-30 Hz for inner-loop tactical displays like the PFD. A strategic display like the ND can update at a lower rate.
Update rates vary for different sources of information that are supplied to a flight display. For example, in CDTI applications TCAS information is updated about once every 4.8 seconds, while ADS-B data is updated once a second. As long as the sudden changes don’t affect handling characteristics of the airplane and aren’t objectionable to the pilot, this conglomeration of variable rates has proved acceptable. The primary features of a PFD, for example, need to update fast enough to provide a smooth depiction of motion for all reasonable flight maneuvers appropriate for the type of airplane. However, some jerkiness can be helpful. Rather than smoothing (e.g., by iterative prediction methods) traffic surveillance information on the SVS PFD, best practice within the NASA Project has been to allow symbology updates to occur at the received rates. Positional jumps in traffic symbology draw additional attention to the traffic symbols

92
during the pilot’s scanning of the PFD, overcoming some of the potential attentional focus issues devoted to the pathway and guidance symbology, for example.
6.1.3 Surface Operations Displays The NASA Integrated SVS Concept for CAB aircraft incorporates the RIPS to
enhance operations at airports independent of visibility while improving safety. RIPS provides pilots with situational awareness and guidance cues, a real-time display of airport traffic, and alerts of runway incursions and route deviations on both a HUD and an EMM of the airport on the ND (and / or on the SV-AD). The best practices that evolved during the development and evaluation of RIPS are presented in two sections of this paper. This section (6.1.3) describes surface operations symbology and specific display (HUD, PFD, ND, SV-AD) considerations. In most instances, the best practices of the SVS Project are the symbology set itself and how it is used within the various displays. The second section (6.1.4), which describes the system issues of RIPS and the incursion detection algorithms, follows.
6.1.3.1 Surface Operations Symbology. The best practices that evolved in the area of surface operations symbology are discussed as lessons learned concerning the specific display applications themselves (HUD / PFD, ND, and Auxiliary Display).
6.1.3.1.1 HUD / PFD Symbology. The SVS Project conducted very few research studies that involved surface operations in low visibility conditions on any aircraft without HUD equipage (the exceptions were Jones (2002); Jones & Prinzel (2006); and Arthur et al. (2006b)), as the best practice philosophy within the Project has been to include a HUD as a vital part of the CAB Integrated SVS Concept. And the Project envisions that, in addition to a HUD, EVS sensors with at least short-range weather-penetration capabilities will be necessary to extend operational capabilities and ease certification concerns. Consequently there has been little investment of resources in the investigation of potential HDD PFD symbologies for surface operations without a HUD. However, in such a case, researchers within the Project did expect to use the same symbology set for the PFD that is utilized on the SVS HUD, overlaid on a synthetic scene of the surface environment to emulate a minified HUD view of the real world or an EVS image. In its final integrated flight test (Jones, 2005; Kramer et al., 2005a), NASA conducted limited evaluations of such a configuration. Unlike the HUD application, where SVS terrain is removed at declutter height in preparation for surface operations, concerns for obscuration of hazards by terrain presentation on the PFD were not an issue. Full color was also utilized on the HDD PFD.
The SVS HUD symbology for surface operations is an integral part of the RIPS (Jones, 2002). Display formats from the T-NASA System (McCann, 1996; McCann et al., 1998; Foyle et al., 1998) were adapted to be compatible with the RIPS operating principles (Johnson & Hyer, 1999; Hyer & Otero, 2007). Discussion of the best practice symbology set for the HUD / PFD is presented in time sequence from landing / rollout, and taxi, to departure. The best practices concerning the traffic and obstacle symbologies employed, along with the incursion and route deviation prevention features of RIPS, which are active during all surface operation sequences, are discussed last (Sections 4.1.3.1.1.4 and 4.1.3.1.1.5, respectively).

93
6.1.3.1.1.1 Landing / Rollout. On approach, a “ROTO” box containing textual rollout / turn-off variables (airport designator, runway designator, desired exit designation, desired exit speed, remaining runway length) appears at runway capture (aligned with runway and below 1200 ft AGL). The PNF selects a desired runway exit, which appears as two rows of edge markings (cones) at the appropriate place on the RIPS runway outline, which itself also becomes viewable at declutter height (the RIPS runway outline replaces the runway confirmation wire-frame) on the HUD. The runway outline is composed of traffic cone symbols (hollow triangles) lining the runway edges (see fig. 53), which become individually visible as range decreases.
Figure 53. Illustration of RIPS HUD symbology set for landing (all HUD symbology is monochrome green).
At WOW, the flight operations symbology set is replaced by the surface operations
symbology set. The number of symbology elements on the SVS HUD / PFD is very limited, and yet they provide powerful and effective elements of the RIPS. The set is dominated visually by the runway centerline, which is actually made up of individual rectangles resembling centerline lights appearing every 50 feet along the runway, and the individual cones marking the runway edges at 50 foot intervals (runway remaining signs also appear at appropriate points along the runway edges). The same symbology elements are used for subsequent taxiway presentations.
Deceleration guidance during rollout to the pilot selected exit is provided at WOW by a ground speed control thermometer symbol with predictor, along with a predicted speed-obtained position ‘football’ symbol (Johnson & Hyer ,1999; Hyer & Otero, 2007), to assist in the deceleration to the proper exit speed (see fig. 54). Should the exit position be missed, the ‘football’ symbol becomes a predicted zero speed-obtained position symbol. Ground speed is provided as a textual part of the thermometer element. In
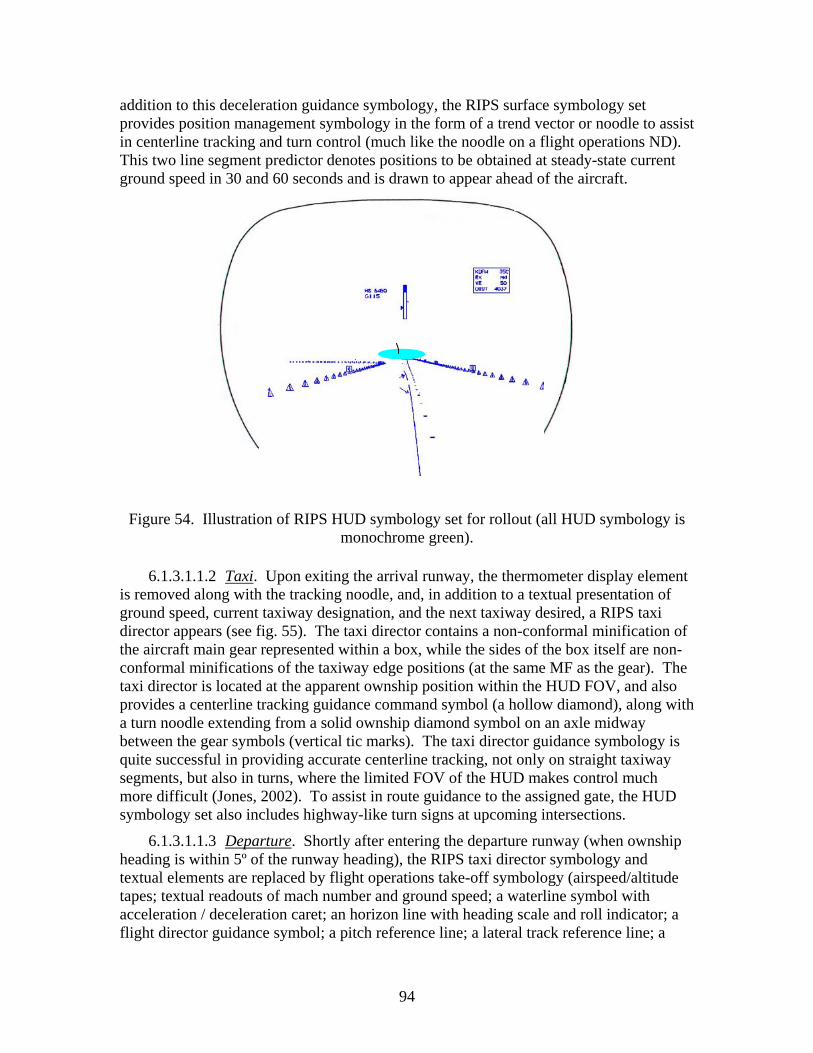
94
addition to this deceleration guidance symbology, the RIPS surface symbology set provides position management symbology in the form of a trend vector or noodle to assist in centerline tracking and turn control (much like the noodle on a flight operations ND). This two line segment predictor denotes positions to be obtained at steady-state current ground speed in 30 and 60 seconds and is drawn to appear ahead of the aircraft.
Figure 54. Illustration of RIPS HUD symbology set for rollout (all HUD symbology is
monochrome green).
6.1.3.1.1.2 Taxi. Upon exiting the arrival runway, the thermometer display element is removed along with the tracking noodle, and, in addition to a textual presentation of ground speed, current taxiway designation, and the next taxiway desired, a RIPS taxi director appears (see fig. 55). The taxi director contains a non-conformal minification of the aircraft main gear represented within a box, while the sides of the box itself are non-conformal minifications of the taxiway edge positions (at the same MF as the gear). The taxi director is located at the apparent ownship position within the HUD FOV, and also provides a centerline tracking guidance command symbol (a hollow diamond), along with a turn noodle extending from a solid ownship diamond symbol on an axle midway between the gear symbols (vertical tic marks). The taxi director guidance symbology is quite successful in providing accurate centerline tracking, not only on straight taxiway segments, but also in turns, where the limited FOV of the HUD makes control much more difficult (Jones, 2002). To assist in route guidance to the assigned gate, the HUD symbology set also includes highway-like turn signs at upcoming intersections.
6.1.3.1.1.3 Departure. Shortly after entering the departure runway (when ownship heading is within 5º of the runway heading), the RIPS taxi director symbology and textual elements are replaced by flight operations take-off symbology (airspeed/altitude tapes; textual readouts of mach number and ground speed; a waterline symbol with acceleration / deceleration caret; an horizon line with heading scale and roll indicator; a flight director guidance symbol; a pitch reference line; a lateral track reference line; a

95
departure pathway; terrain; and airborne and surface traffic) which operates in conjunction with the RIPS edge cones and position predictor noodle (as in the rollout symbology set) for take-off (see fig. 56). The flight path marker with acceleration / deceleration caret, pitch ladder, wind vector, and localizer CDI symbology elements are not present until after rotation, when the pitch and track reference lines are removed, along with the waterline acceleration / deceleration caret.
Figure 55. RIPS HUD taxi operations format, including non-conformal taxi director
symbology.
Figure 56. Illustration of RIPS HUD symbology set for take-off (all HUD symbology is
monochrome green).
6.1.3.1.1.4 RIPS Traffic / Obstacles. Tactical symbology for ground traffic and obstacles are merely hollow squares drawn at the appropriate locations within the HUD FOV. The symbol is referred to as the target designator box during incursion cautions or warnings, as it locates the offending traffic (the target designator box is caged on the

96
appropriate border when the offending traffic is outside of the HUD FOV). Piloted evaluations found the target designator box to be a very effective method of highlighting the incurring traffic on the HUD (Jones, 2002).
6.1.3.1.1.5 Alerts. RIPS provides textual alerts on the HUD for incursion cautions or warnings. The distance to the incursion conflict is also shown. While some pilots were either unaware of the display of the distance to incursion variable or didn’t use it, best practice has been to include the variable on all display surfaces for those pilots who did find it useful (Jones, 2002). Textual alerts are also provided for any attempted entry of closed runway (see fig. 57) or taxiways (notification of the closures is based on NOTAMs), and for any runway or taxiway hazards detected by onboard sensors. Route deviations and crossing hold alerts are audible only.
PFD View HUD View
Figure 57. Runway closed symbology.

97
6.1.3.1.2 ND Symbology. The strategic display for RIPS surface operations (Jones, 2002) is the EMM (see fig. 16). Upon landing, the ND transitions automatically at nosewheel touchdown and 80 knots to the EMM for taxi operations in place of the SVS ND. The EMM is removed for take-off upon entry of the departure runway. The EMM shows a perspective track-up view of the airport layout, current ownship and traffic locations, ATC instructions (including the approved taxi route and hold short locations), and RIPS alerts. A pilot-selectable top down overview of the airport layout is also available (see fig. 58). While both viewing modes have proven effective, most evaluation pilots have preferred the perspective view, particularly when operating on the surface. Other traffic is indicated by dark blue chevrons when on the ground (to contrast with the shades of brown used on the airport layout) and cyan chevrons when airborne. During incursion cautions or warnings, the symbol for the offending traffic is enlarged, changes color (yellow for RTA and red for RCA) and is highlighted by a target designator box. The identification tag is also highlighted. In the event the incurring traffic symbol is not shown because of the display scale or field-of-view, a symbol is pegged on the edge of the display in the direction of the traffic. The distance to the conflict is also shown. Piloted evaluations found the target designator box to be a very effective method of highlighting the incurring traffic on the EMM (Jones, 2002).
Figure 58. RIPS overhead view of airport surface.
Several zoom/scale levels are available to the pilot. ATC instructions are portrayed graphically and textually. Text messages are shown on a pop-up window that the pilot can remove if desired (ATC datalink messages and NOTAMs). Graphic depictions of ATC instructions include the approved route and hold-short locations. Route deviation and crossing hold alerts are also generated by RIPS and displayed to the pilot audibly. Route deviation alerts are generated if ownship leaves its assigned path during taxi. Crossing hold alerts are generated if ownship crosses a hold line when not cleared to do so by ATC.
98
6.1.3.1.3 Auxiliary Display Symbology. The usage envisioned by the Project for the SV-AD during surface operations involves an SVS implementation that includes a single HUD and the presence of an EVS imaging sensor. When the PF is using the HUD with an EVS image for surface operations, the PNF may choose to display the EVS image on the SV-AD. That raster image presentation includes a replicate of the RIPS HUD symbology, with independent declutter control.
6.1.3.2 Surface Operations Display Considerations. The best practices that evolved in the area of specific flight displays are discussed in terms of the issues that arose for consideration for that display device (PFD, HUD, ND, and Auxiliary Display,) in surface operations.

99
6.1.3.2.1 PFD. The SVS Project gave very little attention to a CAB Integrated SVS Concept that did not include a HUD, which was considered particularly vital to receive any operational credit for SVS equipage in terms of enhanced surface operations during low visibility conditions. Having the PF predominantly head-up during taxi operations with symbology and an EVS image at unity magnification seems overwhelmingly reasonable, particularly until real-time surface hazard detection technologies have matured to a high level of integrity. Consequently, few resources were devoted to a panel-mounted SVS PFD for surface operations other than to emulate the HUD formats in color with a terrain background. However, in spite of this view, it was recognized within the Project that the HUD has weaknesses for surface operations applications compared to a panel-mounted SVS PFD with pilot-selectable FOV and a high integrity surface hazard detection system. These weaknesses include a fixed field of regard that makes turning difficult, particularly for aircraft with cockpits located ahead of the nose gear (oversteer); a monochrome image, which eliminates color coding usage for cautions and warnings, for example, and provides an easily cluttered environment; limited visibility that is dependent on atmospheric conditions; and the potential for display obscuration of the real world out-the-window view.
6.1.3.2.2 HUD. The display specific considerations for the HUD for surface operations duplicate most of those for flight operations. Particular emphasis for surface operations is again placed on the best practice philosophy of aggressive pursuit of display integration opportunities for the SVS HUD and the ND symbologies. The limited and fixed field-of-regard of the HUD makes that integration essential.
6.1.3.2.3 ND. The vast majority of the best practices for surface operations on the ND that evolved during the SVS Project have dealt with symbology issues and display and system integration issues (most of which involved symbologies and have been discussed under that topic). Worthy of further mention, however, are the uses of both exocentric coplanar and perspective (EMM) viewpoints for the ND in flight / surface transitions. Best practice within the Project for the PF was to use the overhead coplanar viewpoint during approach and take-off operations and the perspective view (EMM) during taxi. The SV-AD was available to provide the alternative view via pilot selection.
6.1.3.2.4 Auxiliary Display. As best practice during taxi operations, the CAB Integrated SVS Concept envisions the SV-AD for display of an EVS image with replicated HUD symbology set as indicated above in the SV-AD symbology section (Section 6.1.2.2.5).
6.1.4 Runway Incursion Prevention System The best practices that evolved in the area of RIPS are discussed as related to the
RIPS system itself and to its alerting algorithms, as lessons concerning the specific display applications themselves have already been presented.
6.1.4.1 System Principles. RIPS is predicated on four main principles (see fig. 59): (1) “Knowing where you are”, which involves information that is supplied to the flight crew by means of highly accurate ownship positioning on the EMM presentation of the airport database. Best practice within the SVS Project has been to use a LAAS to obtain differential GPS corrections. The LAAS position data was then blended with INS data and used for ownship position determination with accuracies of less than 2 m. (2)
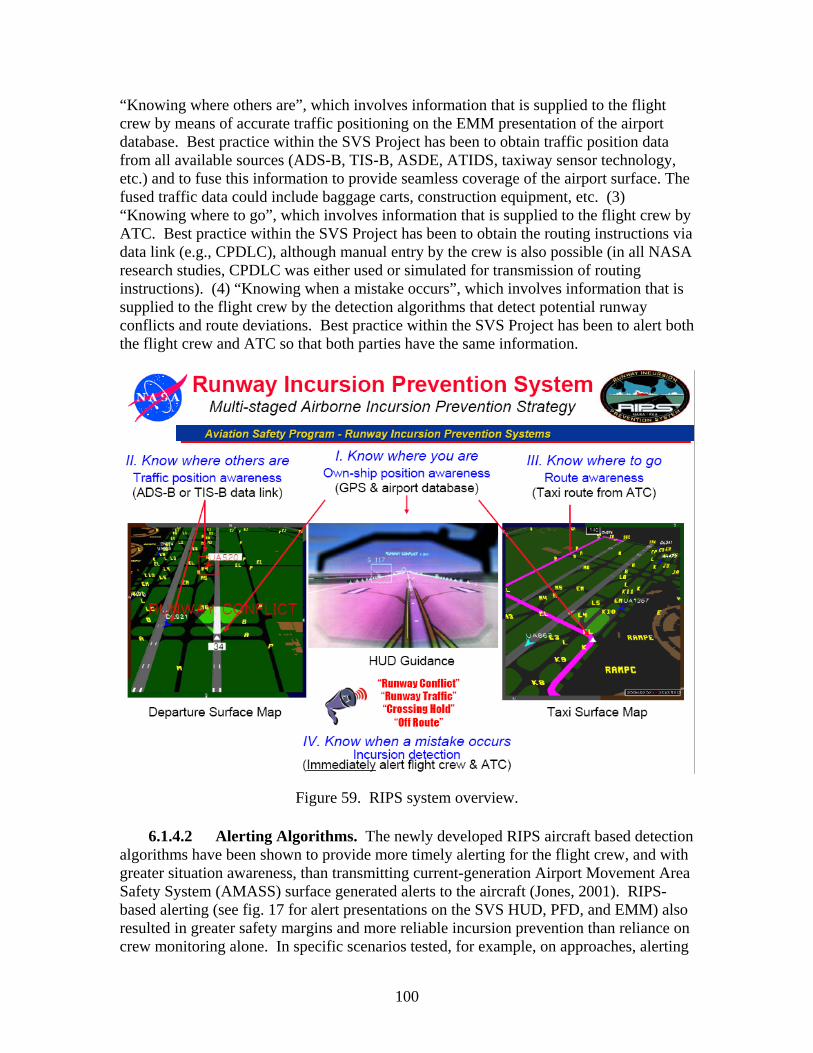
100
“Knowing where others are”, which involves information that is supplied to the flight crew by means of accurate traffic positioning on the EMM presentation of the airport database. Best practice within the SVS Project has been to obtain traffic position data from all available sources (ADS-B, TIS-B, ASDE, ATIDS, taxiway sensor technology, etc.) and to fuse this information to provide seamless coverage of the airport surface. The fused traffic data could include baggage carts, construction equipment, etc. (3) “Knowing where to go”, which involves information that is supplied to the flight crew by ATC. Best practice within the SVS Project has been to obtain the routing instructions via data link (e.g., CPDLC), although manual entry by the crew is also possible (in all NASA research studies, CPDLC was either used or simulated for transmission of routing instructions). (4) “Knowing when a mistake occurs”, which involves information that is supplied to the flight crew by the detection algorithms that detect potential runway conflicts and route deviations. Best practice within the SVS Project has been to alert both the flight crew and ATC so that both parties have the same information.
Figure 59. RIPS system overview.
6.1.4.2 Alerting Algorithms. The newly developed RIPS aircraft based detection algorithms have been shown to provide more timely alerting for the flight crew, and with greater situation awareness, than transmitting current-generation Airport Movement Area Safety System (AMASS) surface generated alerts to the aircraft (Jones, 2001). RIPS-based alerting (see fig. 17 for alert presentations on the SVS HUD, PFD, and EMM) also resulted in greater safety margins and more reliable incursion prevention than reliance on crew monitoring alone. In specific scenarios tested, for example, on approaches, alerting

101
provided greater safety margins over a surface map alone in low visibility, and on departure, RTOs were conducted sooner with alerting, particularly in low visibility (Jones, 2002). However, determining when to alert pilots to a potential incursion situation is very critical. Chances of unnecessary maneuvers (go-arounds or rejected take-offs, RTOs) increase if alerts are provided too early. Conversely, chances of collisions increase if alerts are provided too late. Best practice within the Project has been to test that incursion alerting is provided in a timely manner, allowing sufficient time to react to potential conflicts, for all of the scenarios for which the algorithm has been designed. Specifically, for commercial operations, best practice has been to alert when 1nm from the threshold on approach scenarios and as soon as possible during departure (as soon as departure state can be determined, which typically is when the TOGA button, if available, is pressed).
Section 3.1.3.2 describes PathProx™ as generating two types of alerts (RTA, RCA) analogous to the TCAS approach. In an extensive simulator study (Jones, 2002), seventy-five percent of the evaluation pilots thought that it would be beneficial to have a two-stage alerting system like PathProx™ where the first alert (RTA) received was cautionary in nature and corrective action was not required (a strong desire for temporal separation between the two alerts was also expressed). This alert allows crew members to become aware of potential conflicts early and gives more time to evaluate the situation and strategize solutions. However, RSM (which generates only warning alerts) has consistently proven extremely effective in simulator and flight evaluations (Jones et al., 2001, 2002, 2005, 2006). Two-stage alerting has therefore not been adopted as an SVS Project best practice for CAB applications.
Audible enunciation of incursion alerts, in addition to textual and symbology cuing methodologies on all available display surfaces, has been adopted as an SVS Project best practice. Early research results (Jones, 2002) suggested that RIPS without audible alerting would still be effective in detecting potential runway incursions. This finding was perhaps a testament to the effectiveness of the textual and symbology cuing alert strategies and an objection to still another audible alert in the cockpit. In Jones (2005) the audible enunciation was found to be the most powerful indication of the incursion alert.
6.1.5 EVS Imagery NASA researchers within the SVS Project have had somewhat limited experience
with the presentation of EVS images to CAB flight crews (Tiana et al., 2000; Nguyen et al., 2002; Hines et al., 2005), having adopted the approach of leaving EVS investigations mostly to CRA partners like BAE (MMWR), CMC Electronics (MMWR, FLIR), and Rockwell Collins (FLIR). The NASA best practice philosophy had initially been to use the information extracted from such weather-penetrating sensor images, rather than the images themselves, in order to avoid the associated visual artifacts and expensive training / currency issues involved (Parrish et al., 2003; Harrah et al., 2002). A well-presented synthetic scene with hazard icons (symbologies based on automated decision aiding functions for object detection and database alignment / navigation error detection) avoids many of the human perception issues that intrude in EVS applications, while offering improved performance and pilot workload (Parrish et al., 2003; McKay et al., 2002). However, the Project has made some investment in the development of applications of
102
the NASA Retinex Image Processing technology (Hines et al., 2004, 2005, 2006; Jobson et al., 2001, 2002, 2003, 2004, 2006; Rahman et al., 2002, 2004, 2005, 2006) to EVS images. Retinex utilizes advanced image enhancement techniques to increase the brightness, scene contrast, detail and overall sharpness of images, and to improve image fusion algorithms. Also, the Project envisions that, in addition to a HUD, EVS sensors with at least short-range weather-penetration capabilities will be necessary. This viewpoint has been reinforced by the recent action by the FAA in granting operational credit (through lower approach minimums) to aircraft equipped with EFVS.
The EVS images have been considered for presentation either in combination with the SVS scene or independently, and the findings for each approach, as well as the integrated SVS / EVS approach selected as best practice for the CAB Integrated SVS Concept, are presented below.
6.1.5.1 EVS Image Insertion or Fusion with SVS. NASA researchers within the SVS Project have considered the potential use of EVS imagery as an image inset within a larger FOV synthetic scene (Parrish et al., 2003) on a PFD (HDD or HUD), as well as image fusion possibilities. Neither consideration was endorsed by the Project, but neither were they entirely dismissed. In either case, the combined image would be presented on the PFD (HUD or HDD) of both the PF and PNF, with the original EVS image perhaps presented independently with replicated HUD symbology on the SV-AD.
6.1.5.2 Independent EVS Imagery Displays. The final flight test activities of the SVS Project included evaluations of independent EVS images, although all flight activities took place in VMC. IMC was simulated by obscuring the evaluation pilot’s forward visibility, but the EVS sensor images were unaffected. The RNO and WAL flight activities aboard the Gulfstream G-V in the summer of 2004 (see fig. 60) allowed comparisons of a HUD SVS, a HDD-only SVS and a HUD FLIR EVS concept (Arthur et al., 2005; Kramer et al., 2005a), while the WAL flight activities aboard the NASA ARIES 757-200 in the fall of 2005 (Jobson et al., 2006) explored HUD MMWR independently and / or fused with FLIR. In the later flight test, which was conducted in VMC only, the FLIR image was always far superior in VMC to the MMWR image, and so fusion only served to degrade the FLIR image. Consequently, no effective evaluation of fusion was possible.
The Gulfstream flight test did provide effective comparisons of independent uses of SVS and FLIR images. SVS, by being weather-independent and providing fuller field-of-regard with pilot-selectable FOV, holds many advantages over forward looking sensor systems for terrain, path, and obstacle awareness in many flight phases (particularly during the approach). The approach data from RNO and WAL suggested a clear preference for the SVS concepts (even the no HUD, HDD SVS PFD concept) compared to the FLIR EVS concept. FLIR had its own unique set of problems (e.g., clouds and precipitation obscuring terrain or distorting the impression of the surrounding terrain, missed runway incursions during simulated IMC).
On the other hand, SVS as a stand alone system is entirely dependent on appropriate on-board sensors and / or data link sources for traffic, obstacles, and other flight hazards not represented in the on-board databases to augment the stored database with flight-critical real-time information. However, a high integrity hazard / object detection system
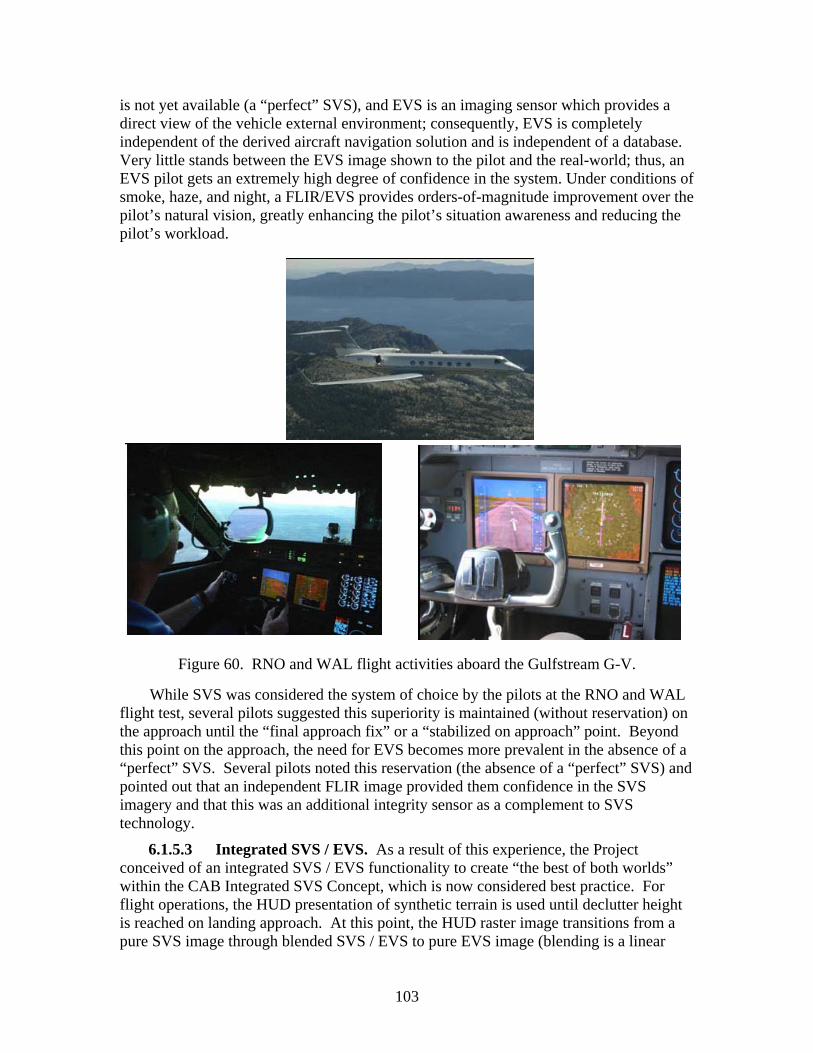
103
is not yet available (a “perfect” SVS), and EVS is an imaging sensor which provides a direct view of the vehicle external environment; consequently, EVS is completely independent of the derived aircraft navigation solution and is independent of a database. Very little stands between the EVS image shown to the pilot and the real-world; thus, an EVS pilot gets an extremely high degree of confidence in the system. Under conditions of smoke, haze, and night, a FLIR/EVS provides orders-of-magnitude improvement over the pilot’s natural vision, greatly enhancing the pilot’s situation awareness and reducing the pilot’s workload.
Figure 60. RNO and WAL flight activities aboard the Gulfstream G-V.
While SVS was considered the system of choice by the pilots at the RNO and WAL
flight test, several pilots suggested this superiority is maintained (without reservation) on the approach until the “final approach fix” or a “stabilized on approach” point. Beyond this point on the approach, the need for EVS becomes more prevalent in the absence of a “perfect” SVS. Several pilots noted this reservation (the absence of a “perfect” SVS) and pointed out that an independent FLIR image provided them confidence in the SVS imagery and that this was an additional integrity sensor as a complement to SVS technology.
6.1.5.3 Integrated SVS / EVS. As a result of this experience, the Project conceived of an integrated SVS / EVS functionality to create “the best of both worlds” within the CAB Integrated SVS Concept, which is now considered best practice. For flight operations, the HUD presentation of synthetic terrain is used until declutter height is reached on landing approach. At this point, the HUD raster image transitions from a pure SVS image through blended SVS / EVS to pure EVS image (blending is a linear

104
modulation with altitude occurring over 100 feet from 100% SVS / 0% EVS ending at 0% SVS / 100% EVS). The EVS image remains available to the PF on the HUD upon exiting the arrival runway for taxi operations and it is removed just before gate arrival. Similarly, the EVS image on the HUD is available to the PF during departure taxi operations and is removed upon entry of the departure runway. The pure EVS image may be selected by either pilot for presentation on the SV-AD at any time. Bailey et al. (2006), a simulator study conducted under the new IIFDT Project, documents the initial evaluation of the integrated SVS / EVS functionality during landing approaches.
6.1.6 Database Integrity Monitoring As comprehensive validation of a geo-spatial terrain database is impractical, these
databases typically have no quantifiable level of integrity. This lack of a quantifiable integrity level is one of the constraints that has limited certification and operational approval of TAWS / SVS to “advisory-only” systems for civil aviation. The SVS Project has pursued active database integrity monitoring using a form of DIME to bound database integrity to address this lack of certifiable database integrity level. The monitor uses radar altimeters and the advanced modes of the WxR to provide information that enables the monitor to provide both a confirmation of database integrity and a registration function (navigational position confirmation via terrain feature extraction). The monitor would warn the pilot whenever the SVS is operating in a degraded mode and that continued flight along the same trajectory may be hazardous. The best practices (recommended practices, lessons-learned, and considerations) that have evolved over the term of the Project with respect to DIME are presented below, beginning with the DIME Functional Construct. The second section presents the details of the approach using the WxR, while the third section documents experience within the Project on a promising lower cost approach using a GPSBR receiver. The final section discusses loss-of-integrity alerting.
6.1.6.1 DIME Functional Construct. Historically, various monitoring methods have been used to provide navigation system integrity. In order to avoid a web of ground-based integrity monitors, it is recommended that a form of autonomous integrity monitoring be applied analogous to the Receiver Autonomous Integrity Monitor (RAIM) approach used by GPS. The RAIM concept is based on a consistency check among multiple measurements that are assumed to be independent and uncorrelated (AIAA, 1996).) In the case of the proposed method, in-flight sensor measurements of geo-spatial locations or features are compared with expected values that are derived from the DEMs and estimates of aircraft position and attitude.
Three sensor types were investigated: downward-looking sensors, forward-looking sensors, and omni-directional sensors. Specifically, the DLRA approach was found to be most useful in detecting vertical DEM errors, but had limited observability with respect to other error classes (Young et al., 2003). Because radar altimeters make measurements nominally from nadir, horizontal DEM errors are difficult to detect unless there is significant terrain undulation under the flight path. Further, unless the detected error is a bias or ramp-type error that persists over a spatial region within the DEM, the detection may not be operationally useful as the aircraft has already flown over the region where the error was observed by the altimeter-based function. Both of these shortcomings led to the need to consider forward-looking sensors. However, for cases where a forward-

105
looking sensor may not be available, or is cost-prohibitive, consider that the DLRA does provide an improved level of integrity on its own. In addition, DLRA measurements can be logged and used post-flight as part of model validation and update/maintenance procedures.
The FLAIM approach (Young et al., 2002) adapted the concepts tested with the radar altimeter. FLAIM was tested during the Project using an X-band Weather Radar (WxR) but conceptually can be applied using any ranging sensor (e.g. Laser/LiDAR). The third approach that was tested considered an omni-directional passive sensing concept. This approach was tested using GPS technology configured to function as a Bi-static Radar measuring specular reflections of satellite-based transmissions (Esterhuizen et al., 2005; Ganoe & Young, 2005; Junered et al., 2006; Masters et al., 2001, 2005; Sturtevant et al., 2003; Vinande et al., 2005).
It is important to recognize that the flight crew can, and will, act as another independent integrity monitor of geographic feature data quality. For example, in clear-weather conditions, pilots may be able to observe gross errors in the databases by comparing SVS depictions with what they see out the window. In a similar manner, EVS sensors can allow pilots to monitor integrity within the field-of-view limits of the sensor. However, the performance of a human monitor will be driven by weather conditions, workload, pilot experience, and other factors such as the quality of available sensor information. As it is difficult to quantify this type of human performance, it is not recommended as a sole means of integrity assurance for stored geographic feature data, particularly when visibility is limited. On the other hand, the FLAIM approach can provide additional information to the crew so that they can assess the quality of the stored data on-the-fly. For example, instead of generating terrain alerts (see Section 6.1.6.4), smoothed mismatches could be displayed as a figure-of-merit. Based on this, the crew could decide how much they should trust the SVS while flying over specific geographic regions in specific visibility conditions.
6.1.6.2 FLAIM Using WxR. A secondary purpose of commercial WxR systems is ground-mapping of significant land contours, a mode which can be integrated with DEMs to supplement on-board navigation systems and to detect potential ground-based hazards. Based on research during the SVS Project, it is recommended that this ground-mapping mode of the WxR be employed, along with the DLRA, to provide improved integrity. This use can help to overcome some of the shortcomings of the DLRA monitor function. Because the WxR includes a scanning aperture, information from scans over spatial regions is available. Even a single radial measurement consists of several range measurements (one at each range bin location). As a result, feature extraction and feature-based disparity-checking can be performed. In other words, disparities between features that are sensed and features that are extracted from the stored DEM can be compared in a statistical manner similar to the one described for the DLRA approach (Gray, 1999). Operationally, as with the DLRA, if significant inconsistencies are detected, a loss-of-integrity alert is generated.
Unlike the radar altimeter, the WxR terrain measurements cannot be mapped to the terrain database entries directly. Two parallel threads must translate available information into a common reference domain. Figure 61 illustrates the algorithm employed to enable a one-to-one feature-based comparison (Young et al., 2004).

106
For organizational convenience, the comparison methods are presented by the following topic order: Radial-Based Feature Detection and Classification and Image-Based Feature Detection and Classification.
Figure 61. The SHADE algorithm.
6.1.6.2.1 Radial-Based Feature Detection And Classification. Because of the prevalence and stability of terrain shadowing as observed by airborne radars, WxR-based FLAIM was tested using shadow edge locations as the features of interest. As shown in Figure 61, each parallel thread consists of a function that extracts terrain-related shadow features from the independent sources and translates them into a common reference domain. Shadow edges are often the most significant feature discernable in WxR measurements and occur when reflectivity values transition to/from 0 dB indicating no detectable reflectivity (see fig. 62). WxR shadowing occurs most frequently in areas of moderate to severe terrain undulations when the aircraft is at a relatively low altitude or the antenna depression angle (i.e., tilt) is large. Figure 63 depicts a segment of a sample WxR radial measurement and the edge features that would be detected and classified as either front or back edges of a shadowed region (Young et al., 2004). The gradient at each edge can also be computed and used as a weighting factor to down-sample features prior to disparity checking.
To improve confidence in shadow detection, a feature is only classified as a shadow feature if both a front and back edge is detected, or if a shadow extends to the range setting of the radar. Other considerations related to shadow feature detection and classification include (Young et al., 2004):
a) Whenever multiple shadows are seen along a radial, longer shadows should have priority when computing the disparity test statistic. Longer shadows are more

107
likely to be seen by both threads and when detected, are more likely to represent the same spatial region. In addition, longer shadows reduce the potential for spatial correlation between the front and back shadow edges. Lastly, for longer
Figure 62. Weather radar shadow diagram.
Figure 63. Segment of sample radial measurement and shadow edge features from
weather radar data.
shadows, the variability of disparity will be smaller, thereby leading to a smaller minimum detectable bias. These observations also hold for shadow width (i.e., using wider shadows will lead to better performance). The negative effect of constraining shadow size will be reducing availability. Larger shadows may not occur in some operational environments and therefore the disparity checking function would not produce results (i.e., higher integrity).
b) Due to angular resolution, closer shadows should have priority when computing the disparity test statistic. Specifically, shadow edges seen by the radar at long range will be less accurate than edges seen at close range. This is due to the fact that the spatial volume represented by a single range bin will grow with range. As with the shadow size constraint, the negative effect of constraining range will be

108
reduced availability in some operational environments. Short-range shadows may not always been seen.
c) If the aircraft is equipped with a radar altimeter, it may be beneficial to use this sensor to trigger operation. The operational concept suggests DEM integrity is only needed at lower altitudes. Typical operating range for commercial radar altimeters is zero to 2500 feet AGL. In addition, the AGL height of the radar could be used to determine range constraints for the disparity checking function (i.e., to determine the starting range bin for shadow searches).
d) At low altitude, radar-reported range bin values that are below the noise floor are not always attributable to terrain shadowing. The most common examples are bodies of water such as lakes. Small water-body features should not corrupt performance. However, in regions of large water bodies, a feature database containing water body boundaries may be required.
One behavior that is common when using small shadow sizes is a detection by one
thread and not by the other. Disparity checking in this case will result in a large difference that may lead to a false alert. To mitigate this behavior, repeated scans can be accumulated to see if the feature persists in one thread and not the other. If it does, this indicates an actual error that should be detected. Using multiple scans to track features in this way will improve integrity but must be traded against the increase in time-to-alarm that results from waiting for additional scan measurements. The other benefit of using small shadows is that as shadow size gets smaller, the likelihood of observing shadows will increase. This increases the availability of the integrity monitor.
Feature detection and classification in the DEM-derived thread is similar to that of the WxR thread; however, the challenge for this thread is to generate synthesized radial measurements. The algorithm uses aircraft position from GPS, aircraft attitude from an IRU, antenna pointing direction from the WxR, a beam model, and a DEM to generate the synthesized measurements. This algorithm is described in detail in Young et al. (2005). Figure 64 illustrates sample results from both Shadow Detection and Extraction (SHADE) threads from data obtained during the NASA DC-8 flight test (Young et al., 2004).
6.1.6.2.2 Image-Based Feature Detection and Classification. The radial measurements produced by the two threads of SHADE can be accumulated into images over the course of the radar scans. An alternate disparity checking function was developed that uses these images and traditional machine vision and pattern recognition techniques (Cooper & Young, 2005). This capability allows for two levels of integrity checking. An inner loop of this function compares the radial features as described previously, while, simultaneously, an outer loop function extracts and tracks features seen within the scan-based images accumulated over repeated scans. This approach exploits the fact that, for reasonably fast update rates, extracted features are traceable across image sequences and consistent with the aircraft’s position as derived from onboard navigation systems. Using this approach, inner loop integrity monitoring can occur at the SHADE frame rate (i.e., the radar measurement rate), while longer term registration can be confirmed in a parallel task executing at a relatively slower frame rate for the outer loop (i.e., over several scans). By providing continuous inner loop integrity monitoring,

109
the parallel task can be scheduled according to the slower scan rate of the WxR radar, or at a rate that provides acceptable outer loop comparison.
6.1.6.3 FLAIM Using GPSBR. Most of the research effort concerning the FLAIM approach using GPSBR has been concentrated on the development of the
(a) (b)
Figure 64. SHADE results for three sample scans from DC-8 testing (a) WxR-derived
thread, (b) DEM-derived thread.
GPSBR receiver (Ganoe & Young, 2005), as the same FLAIM that was developed under other parts of the SVS Project could be adapted readily given a satisfactory GPSBR altitude estimate. The GPSBR is able to track and measure signals directly from multiple GPS satellites, as well as the multiple signals that are reflected from the surface of the Earth (see fig. 65). These measurements are than used to generate an altitude estimate that can be used by the FLAIM to provide a bounded level of integrity for the terrain DEM (both lateral and vertical monitoring) so that safe operational constraints can be specified. The SVS Project was not able to mature this concept fully, although it is considered a promising approach in need of more research to determine its limitations and capabilities.
6.1.6.4 Database Loss-Of-Integrity Alerts. Conceptually, the DIME acts as an intermediary between the terrain model and the SVS display(s). This “watch-dog” type function checks (or validates) the model against an independent sources of information (i.e., the downward- and / or forward-looking sensors). When a statistically significant difference is detected, the pilot is informed that the integrity of the displayed information

110
is in question. When differences are within expected bounds, the pilot can be assured that the display is operating at its specified performance level with a probability consistent with the level of integrity required for the current operation. Establishing appropriate detection thresholds is based on expected behavior of the information sources and requirements for missed detection rates and false alarm rates. This process is described in Young (2005) and Gray (1999).
Figure 65. The GPS Bi-static Radar (GPSBR) receiver utilizes GPS signals reflected
from terrain.
Early considerations of database integrity alert strategies for SVS terrain included removal of the terrain from the display(s) following a lack of integrity detection. This removal strategy for SVS terrain was also contemplated following a TAWS alert to prevent the flight crew from maneuvering with respect to possibly unreliable terrain information. However, based on results of Project experiments, it is recommended that the crew be notified of the degraded integrity condition and given discretion to decide how, or whether, to continue use of the terrain display. This approach is consistent with the procedure now used with TAWS alerts that call for lateral maneuvering.
6.1.7 Hazard Detection Sensors As discussed in Section 6.1.5.3, the final NASA CAB Integrated SVS Concept
utilizes an EVS image on the HUD on final approach after the declutter height and for taxi operations. The best practice philosophy of the SVS Project had initially been to use the information extracted from hazard detection sensors (weather-penetrating sensors) and sensor images, rather than the images themselves (Harrah et al., 2002). Thus the Project conducted research on sensor technologies which include EVS sensors (e.g., FLIR) and Advanced Hazard Detection Sensors (e.g., multi-mode WxR) for hazard and object detection, as well as terrain feature extraction from the WxR to support database integrity monitoring requirements. The best practices that evolved in these areas are
111
provided below in the following topic order: EVS Sensor Detected Hazards and Multi-mode Weather Radar Detected Hazards.
6.1.7.1 EVS Sensor Detected Hazards. The SVS Project, operating in a resource constrained environment, adopted as a best practice philosophy (programmatic decision) a dependence on both prior research conducted under the HSR Program (Tang et al., 1994, 1996; Yang et al., 2000) and more recent state-of-the-art advances in image processing to meet Project needs in the area of further image processing with both object and edge detection techniques for detection of obstacle conflicts and runway alignment errors. Only limited research (Gandhi et al., 2000; Kasturi et al., 2000, 2002; Yang et al., 2002) was performed and no field evaluations were ever conducted on image object detection directly within the Project.
6.1.7.2 Multi-mode Weather Radar Detected Hazards. In addition to provisions for the utilization of EVS sensor image processing for hazard detection (obstacles, runway misalignment), the NASA CAB Integrated SVS Concept also employs an advanced X-band Multi-mode WxR, not only for the traditional provisions of Wx and wind shear detection information, but with new modes for advanced hazard detection. These new modes have both improved range and angular resolution to sufficiently detect and locate objects (preliminary results show that these techniques can provide 1-3 meter range resolution and less than 1º of angular resolution, with 1/3º being a reasonable goal). The best practices that evolved in these areas are provided below.
6.1.7.2.1 Air-To-Air Sensor-Detected Objects. In an air-to-air application mode, the advanced WxR is used to detect airborne traffic within approximately 6NM and angularly within the field-of-view of the radar to supplement in blended fashion surveillance information from TCAS, ADS-B and TIS-B sources, as well as to protect against non-cooperative (non-transmitting) traffic. This capability was developed under the NASA HSR Program and further enhanced under the SVS Project. The best practice enhancements developed under the SVS Project were to continue to estimate target velocity based on the Doppler radar measurement of velocity augmented by a range-rate velocity approximation, and to require a target ‘hit’ on at least three sequential radar scans to firmly establish a track (“persistence”) before attempting a blend with other surveillance sources or otherwise identifying an independent, non-cooperative object. While the airborne traffic detection mode of the advanced WxR was tested extensively in the HSR Program, it was never included as a surveillance source in the 2004 integrated SVS flight tests at RNO and WAL.
6.1.7.2.2 Air-To-Ground Sensor-Detected Objects and Terrain Features. In an air-to-ground application mode, the advanced WxR is used to detect mapped and, more importantly, unmapped ground towers, to provide runway location to position the runway confirmation or misalignment wire-frame display element, to detect runway obstacles, and to provide terrain features for the integrity monitor. Best practices concerning feature detection for the integrity monitor have previously been presented, while those concerning obstacle and runway detection are presented below:
a) The advanced WxR has “ground mapping” capabilities to generate a map of the terrain in front of the aircraft to enable discrimination of mapped / unmapped ground towers and other terrain features with significant height (those that impinge

112
upon flight altitudes). The best practice that evolved within the Project was to define an ‘object detection wedge’ that extended ± 30° about the track and up to 3 nm in front of the aircraft (effective only at flight altitudes below 2,500 feet AGL). The wedge was ± 500 feet deep, starting at ownship altitude and extending 500 feet toward the ground and 500 feet above the aircraft. Thus objects that were more than 500 feet below or 500 feet above flight altitude were not discriminated. Use of this ‘object detection wedge’ allowed necessary and sufficient control of the false alarm rate, while still providing a high probability of successful discrimination.
b) A different form of Terrain Feature Extraction is used to locate the runway using a nominal ownship location and an airport database. With provision of this information, the WxR scans the relevant areas to detect the metal support structure for the approach lights at each end of the runway (if an approach light system is not installed at the runway ends, inexpensive radar reflectors were located near the four runway corners). The best practices that evolved within the Project for this feature were to begin the processing at 5 nm from the runway threshold, and to continue to update and refine the positions until about 0.25 nm from the threshold. At this point the process employed a coasting algorithm using ownship GPS/INS/Altitude information to track the radar-extracted corner positions and a low pass filter to remove distracting jitter from the wire-frame element. Two scans were required to confirm the runway position (both ends) once the processing began. It also became best practice to set the runway position to “unknown” if the radar altimeter exceeded 100 feet after having dropped below 50 feet OR if range to runway end exceeded 1 nm after having been less than 0.25 nm OR if the difference between ownship and runway heading exceeded 30º.
c) Once the radar has confirmed the location of the runway, it switches to verifying that the runway is clear of any large objects, including other aircraft, airport vehicles, or major debris. The best practice that evolved within the Project for this feature was to define a radar cross-sectional area of at least 1 square meter to allow necessary and sufficient control of the false alarm rate, while still providing a high probability of successful detection. Although successful implementation of the WxR runway confirmation feature was not achieved in the 2004 integrated flight tests at RNO and WAL, stand-alone tests of the WxR functionality were successful.
6.1.7.2.3 Ground-To-Ground Sensor-Detected Objects. In a ground-to-ground application mode, the radar has provisions for an ultra-short range configuration and would continue to locate ground traffic / obstacles during runway / taxi operations. This information would be blended with other available surface surveillance information (e.g., ASDE, TIS-B) and supplied to the RIPS. However, this mode was never exercised due to funding and time constraints within the Project.
6.1.7.2.4 Ground-To-Air Sensor-Detected Objects. And finally, in a ground-to-air mode, the radar searches the airspace in front of the departing ownship to detect neighboring airborne traffic. This mode is almost identical to the air-to-air application mode; in fact, the detection task is simpler because of the reduced ownship motions and the lack of ground clutter. However, this mode was never formally exercised due to funding and time constraints within the Project and the high level of confidence in its successful performance.

113
6.1.8 The Integrated SVS Concept The RNO and WAL flight activities aboard the Gulfstream G-V in the summer of
2004 (Arthur et al., 2005 ; Kramer et al., 2005a; Jones, 2005) marked the first time NASA’s SVS technologies have been integrated as a complete system for both flight and surface operations, incorporating synthetic terrain primary flight and navigation displays, enhanced vision sensors, advanced multi-mode weather radar object detection, synthetic vision database integrity monitoring, refined dynamic tunnel and guidance concepts, surface map displays, and the Runway Incursion Prevention System. The results effectively showed the efficacy of the NASA CAB Integrated SVS Concept to significantly enhance pilot situation awareness (without increasing mental workload) for runway traffic and terrain, and substantially better pilot acceptability and trust due to integrated integrity monitors and enhanced vision sensors.
6.2 General Aviation Because of the “trio of GA constraints” (display space, equipment weight and cost),
the operational requirements, and certification and operational approval processes for GA are quite different in most instances than for CAB. Therefore the best practices for GA aircraft that are specifically different from CAB and from the generic best practices applicable to both are discussed in this section. Recently, the FAA has released FAA AC 23-26 (FAA, 2005b) that deals specifically with SVS displays. While AC 23-26 was generated with substantial contributions from NASA SVS researchers, the best practices from the SVS Project are presented in greater detail herein. For organizational convenience, the best practices are presented by the following topic order: Display Considerations, Database Depiction, Flight Operations Considerations, Surface Operations Considerations, Runway Incursion Prevention System, and Database Integrity Monitoring.
6.2.1 Display Considerations The limited display space available in GA aircraft implies small display surfaces,
which in SVS applications translates into minification issues which affect both the closed looped handling qualities associated with the guidance symbologies as well as the terrain features employed on SVS displays. The focus within the GA element of the SVS Project has, therefore, been to attempt to determine the most effective presentation techniques for terrain depictions and for guidance symbologies. Thus extensive efforts in terrain portrayal evaluations (see Section 6.2.2) and head-down symbology development (see Section 6.2.3) have been conducted throughout the element’s activities. The success of these efforts was dramatically illustrated in the flight test at Roanoke, Virginia (ROA) in 2005 (see fig. 66) in which pilots flying in simulated IMC with SVS displays consistently produced equivalent or superior performance in FTE, workload ratings and SA ratings to that produced flying in VMC with conventional displays (Glaab et al., 2006).
6.2.2 Database Depiction The best practices that evolved in the area of database depiction or terrain portrayal
are discussed as lessons learned specific to texturing and fish-net usages in GA display applications.
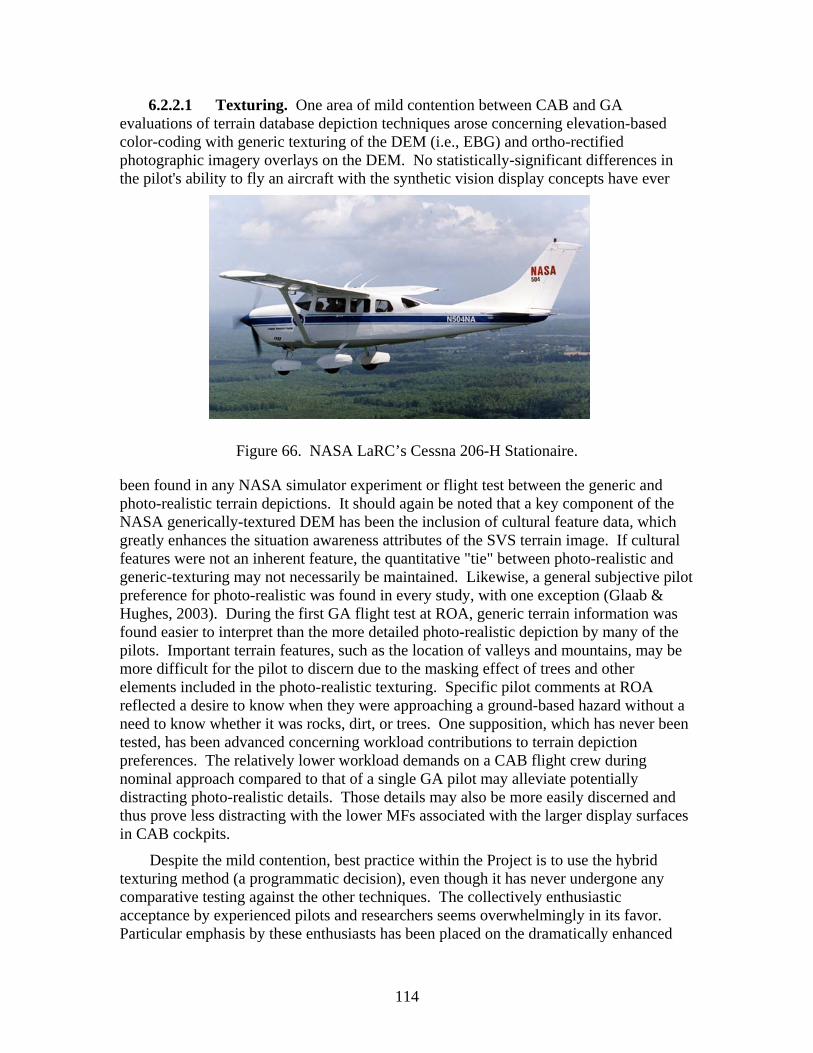
114
6.2.2.1 Texturing. One area of mild contention between CAB and GA evaluations of terrain database depiction techniques arose concerning elevation-based color-coding with generic texturing of the DEM (i.e., EBG) and ortho-rectified photographic imagery overlays on the DEM. No statistically-significant differences in the pilot's ability to fly an aircraft with the synthetic vision display concepts have ever
Figure 66. NASA LaRC’s Cessna 206-H Stationaire.
been found in any NASA simulator experiment or flight test between the generic and photo-realistic terrain depictions. It should again be noted that a key component of the NASA generically-textured DEM has been the inclusion of cultural feature data, which greatly enhances the situation awareness attributes of the SVS terrain image. If cultural features were not an inherent feature, the quantitative "tie" between photo-realistic and generic-texturing may not necessarily be maintained. Likewise, a general subjective pilot preference for photo-realistic was found in every study, with one exception (Glaab & Hughes, 2003). During the first GA flight test at ROA, generic terrain information was found easier to interpret than the more detailed photo-realistic depiction by many of the pilots. Important terrain features, such as the location of valleys and mountains, may be more difficult for the pilot to discern due to the masking effect of trees and other elements included in the photo-realistic texturing. Specific pilot comments at ROA reflected a desire to know when they were approaching a ground-based hazard without a need to know whether it was rocks, dirt, or trees. One supposition, which has never been tested, has been advanced concerning workload contributions to terrain depiction preferences. The relatively lower workload demands on a CAB flight crew during nominal approach compared to that of a single GA pilot may alleviate potentially distracting photo-realistic details. Those details may also be more easily discerned and thus prove less distracting with the lower MFs associated with the larger display surfaces in CAB cockpits.
Despite the mild contention, best practice within the Project is to use the hybrid texturing method (a programmatic decision), even though it has never undergone any comparative testing against the other techniques. The collectively enthusiastic acceptance by experienced pilots and researchers seems overwhelmingly in its favor. Particular emphasis by these enthusiasts has been placed on the dramatically enhanced
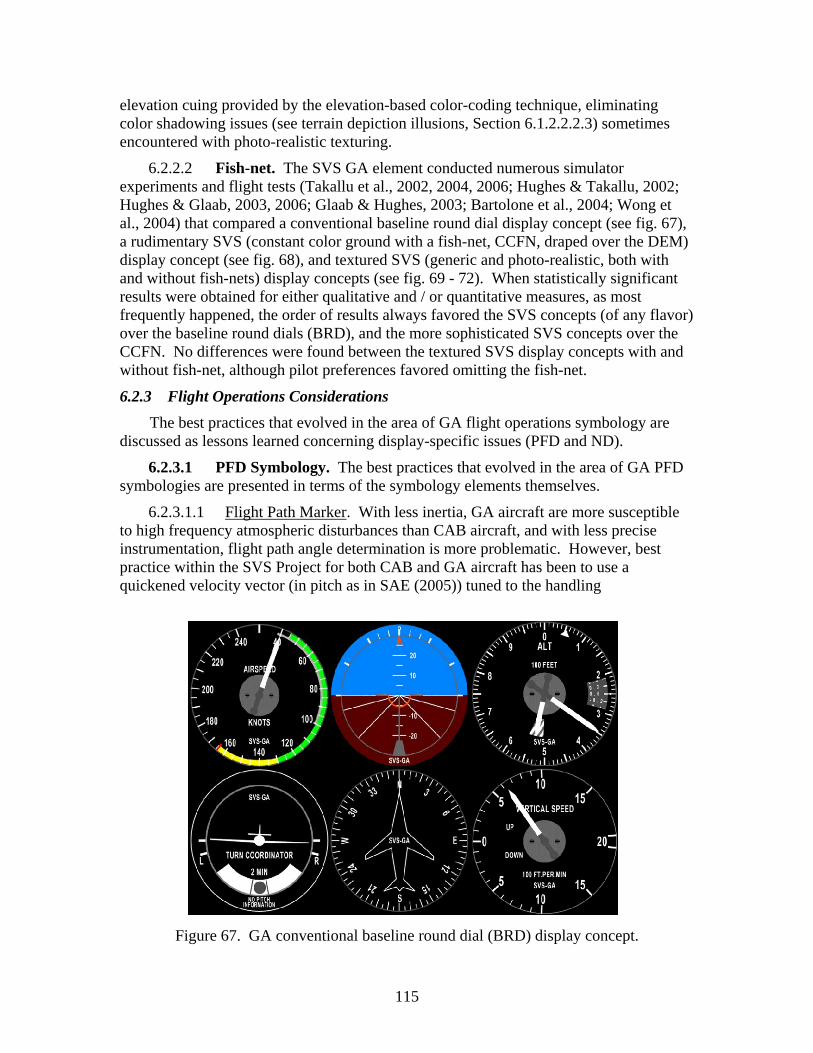
115
elevation cuing provided by the elevation-based color-coding technique, eliminating color shadowing issues (see terrain depiction illusions, Section 6.1.2.2.2.3) sometimes encountered with photo-realistic texturing.
6.2.2.2 Fish-net. The SVS GA element conducted numerous simulator experiments and flight tests (Takallu et al., 2002, 2004, 2006; Hughes & Takallu, 2002; Hughes & Glaab, 2003, 2006; Glaab & Hughes, 2003; Bartolone et al., 2004; Wong et al., 2004) that compared a conventional baseline round dial display concept (see fig. 67), a rudimentary SVS (constant color ground with a fish-net, CCFN, draped over the DEM) display concept (see fig. 68), and textured SVS (generic and photo-realistic, both with and without fish-nets) display concepts (see fig. 69 - 72). When statistically significant results were obtained for either qualitative and / or quantitative measures, as most frequently happened, the order of results always favored the SVS concepts (of any flavor) over the baseline round dials (BRD), and the more sophisticated SVS concepts over the CCFN. No differences were found between the textured SVS display concepts with and without fish-net, although pilot preferences favored omitting the fish-net.
6.2.3 Flight Operations Considerations The best practices that evolved in the area of GA flight operations symbology are
discussed as lessons learned concerning display-specific issues (PFD and ND).
6.2.3.1 PFD Symbology. The best practices that evolved in the area of GA PFD symbologies are presented in terms of the symbology elements themselves.
6.2.3.1.1 Flight Path Marker. With less inertia, GA aircraft are more susceptible to high frequency atmospheric disturbances than CAB aircraft, and with less precise instrumentation, flight path angle determination is more problematic. However, best practice within the SVS Project for both CAB and GA aircraft has been to use a quickened velocity vector (in pitch as in SAE (2005)) tuned to the handling
Figure 67. GA conventional baseline round dial (BRD) display concept.

116
Figure 68. GA constant color ground with a fish-net (CCFN) display concept.
Figure 69. GA elevation based generic (EBG) SVS display concept.
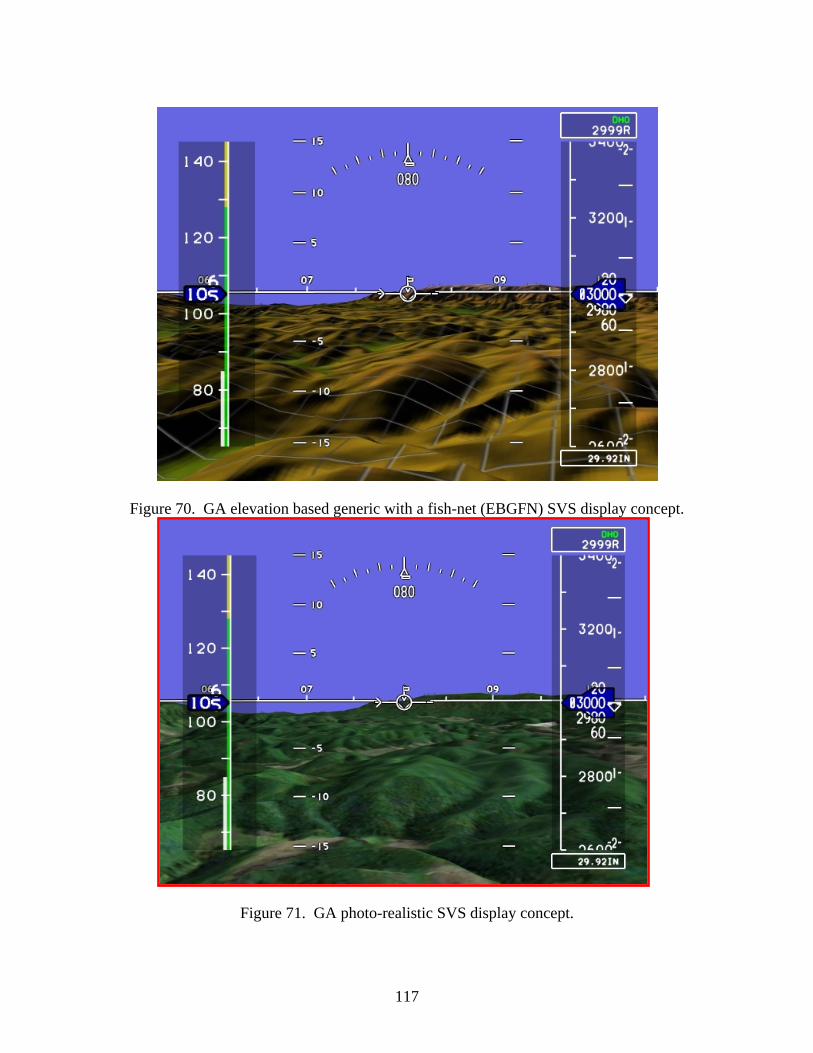
117
Figure 70. GA elevation based generic with a fish-net (EBGFN) SVS display concept.
Figure 71. GA photo-realistic SVS display concept.
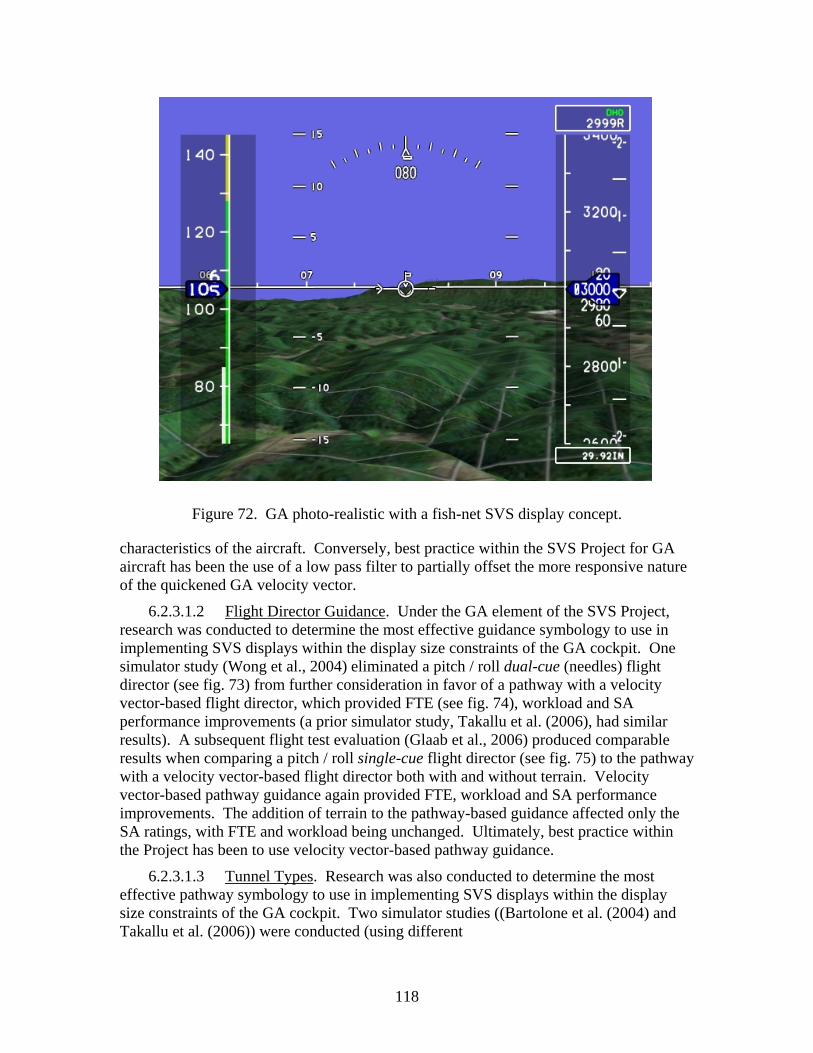
118
Figure 72. GA photo-realistic with a fish-net SVS display concept.
characteristics of the aircraft. Conversely, best practice within the SVS Project for GA aircraft has been the use of a low pass filter to partially offset the more responsive nature of the quickened GA velocity vector.
6.2.3.1.2 Flight Director Guidance. Under the GA element of the SVS Project, research was conducted to determine the most effective guidance symbology to use in implementing SVS displays within the display size constraints of the GA cockpit. One simulator study (Wong et al., 2004) eliminated a pitch / roll dual-cue (needles) flight director (see fig. 73) from further consideration in favor of a pathway with a velocity vector-based flight director, which provided FTE (see fig. 74), workload and SA performance improvements (a prior simulator study, Takallu et al. (2006), had similar results). A subsequent flight test evaluation (Glaab et al., 2006) produced comparable results when comparing a pitch / roll single-cue flight director (see fig. 75) to the pathway with a velocity vector-based flight director both with and without terrain. Velocity vector-based pathway guidance again provided FTE, workload and SA performance improvements. The addition of terrain to the pathway-based guidance affected only the SA ratings, with FTE and workload being unchanged. Ultimately, best practice within the Project has been to use velocity vector-based pathway guidance.
6.2.3.1.3 Tunnel Types. Research was also conducted to determine the most effective pathway symbology to use in implementing SVS displays within the display size constraints of the GA cockpit. Two simulator studies ((Bartolone et al. (2004) and Takallu et al. (2006)) were conducted (using different

119
Figure 73. GA pitch / roll dual cue (needles) flight director display concept.
Figure 74. GA RMS lateral and vertical tracking error results.

120
Figure 75. GA pitch / roll single cue flight director display concept.
maneuvers and geographic sites) that compared tunnel concepts adopted from various research organizations and industry applications. The selected concepts were an Unconnected Box Tunnel (see fig. 76), a Connected Box Tunnel with Sliding Box Guidance Cue (see fig. 77) and Crow’s Foot Tunnel with Ghost Aircraft (see fig. 78). Both studies found FTE, workload, readability (clutter), and SA performance advantages with the Crow’s Foot Tunnel with Ghost Aircraft presentation. Thus, best practice within the Project has been to use the Crow’s Foot Tunnel with ghost airplane symbol for pathway presentation.
Figure 76. GA Unconnected Box Tunnel display concept.
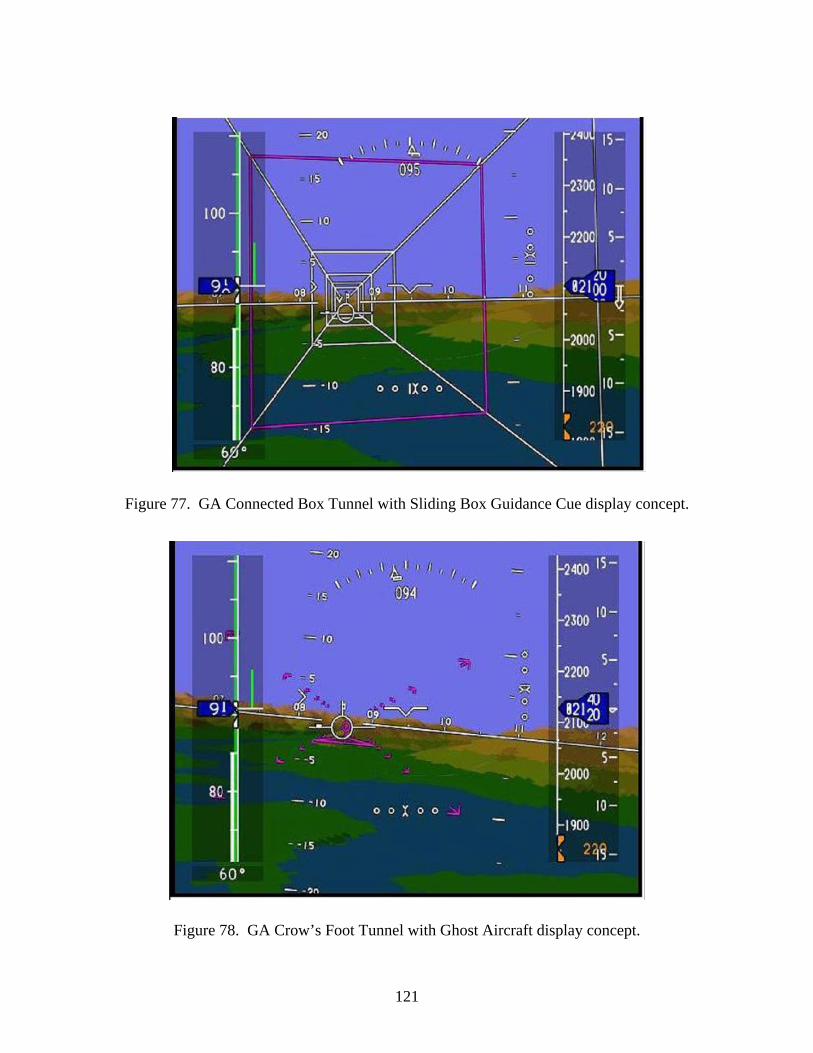
121
Figure 77. GA Connected Box Tunnel with Sliding Box Guidance Cue display concept.
Figure 78. GA Crow’s Foot Tunnel with Ghost Aircraft display concept.

122
6.2.3.1.4 Field-of-View. One objective of the flight test effort reported in Glaab & Hughes (2003) was to establish recommended FOV use for SVS GA applications. One factor affecting FOV use was the need to keep the velocity vector on the display. Significant crab angles were observed for both en route and approach maneuvers primarily due to the airspeeds employed (i.e. 100 and 90 knots). Cross wind conditions encountered were considered mild. In addition, turbulence effects, combined with the natural flight dynamics of the aircraft, produced substantial motion of velocity vector position. Occasionally, pilots were able to employ lower FOVs (30°), to enhance their view of the runway during the latter stages of the final approach. However, due to the dynamics of the aircraft, combined with the operating speeds, resulting measured FOVs typically ranged near 60°. In post-block questionnaires, all pilots selected 60° FOV as the most preferred for the approach maneuver. Therefore, the best practice for SVS GA applications has become fixing the FOV at 60° as a reasonable value, since that FOV would provide the most utility because of the substantial movements of the velocity vector typical in GA flight operations. Removal of pilot-selectable FOV control should not impose substantial restrictions on the utility of these displays due to characteristics inherent to GA aircraft. This recommendation is counter to Glaab et al. (2003) and Kramer et al. (2004b), studies which involved testing with large transport aircraft and helped establish pilot-selectable FOV as the best practice of CAB. However, lower FOVs, such as 30°, could still be useful for calm operating conditions for GA aircraft, and should be considered to provide increased utility during latter stages of final approach.
6.2.3.2 ND Symbology. Best practice within the GA element of the SVS Project has been to replace the typical GA ND with TAWS implemented on an Mx-20 (see fig. 79) for the earlier studies of the element (Hughes & Takallu, 2002; Glaab & Hughes, 2003) with a GA version (see fig. 80) adapted from the CAB SVS ND with TAWS caution and warning overlays. While no comparative testing between the two ND concepts was conducted by the GA element, the enthusiastic acceptance of the SVS ND by experienced GA pilots and researchers has been overwhelmingly in its favor.
6.2.4 Surface Operations Considerations The best practices that evolved in the area of surface operations symbology as GA-
specific issues are practically non-existent, as, aside from providing a taxi map for ownship position awareness, the Basic SVS system is not intended for low visibility surface operations. The Enhanced SVS system does include surveillance information and RIPS incursion detection algorithms and display concepts, and as such is better equipped for low visibility surface operations. However, only one simulation study within the Project addressed GA surface operations, and the best practices that evolved in that effort are discussed below under RIPS.
6.2.5 Runway Incursion Prevention System
The two algorithms developed under the RIPS efforts, PathProx™ (Cassel et al., 2000, 2001, 2002, 2003)and RSM (Green, 2002, 2006), were originally designed to address runway incursion incidents involving only commercial aircraft (as shown in fig. 81, such incidents occurred in 2003 at a rate of about one every 2.6 days). However, the

123
Figure 79. GA ND with TAWS implemented on an Mx-20 (on approach to ROA).
Figure 80. GA version on approach to RNO adapted from the CAB ND with neighborhood traffic and TAWS overlays (not shown).

124
Figure 81. Runway Incursion Rates from FAA Runway Safety Report, August, 2004.
number of GA / GA type incursions is much higher (reported incidents occurred in 2003 at a rate of about one every 1.7 days), especially considering that incidents at uncontrolled airports are not reported, since there is no ATC at uncontrolled airports and, by definition, a controller determines whether there is an incursion and then reports to FAA. In the final stages of the SVS Project, extension of both algorithms to alert during GA / GA type incursions was successful. Further extension to alert during Commercial / GA type incursions, another serious concern (see fig. 82), may be pursued under another NASA Project (IIFDT).
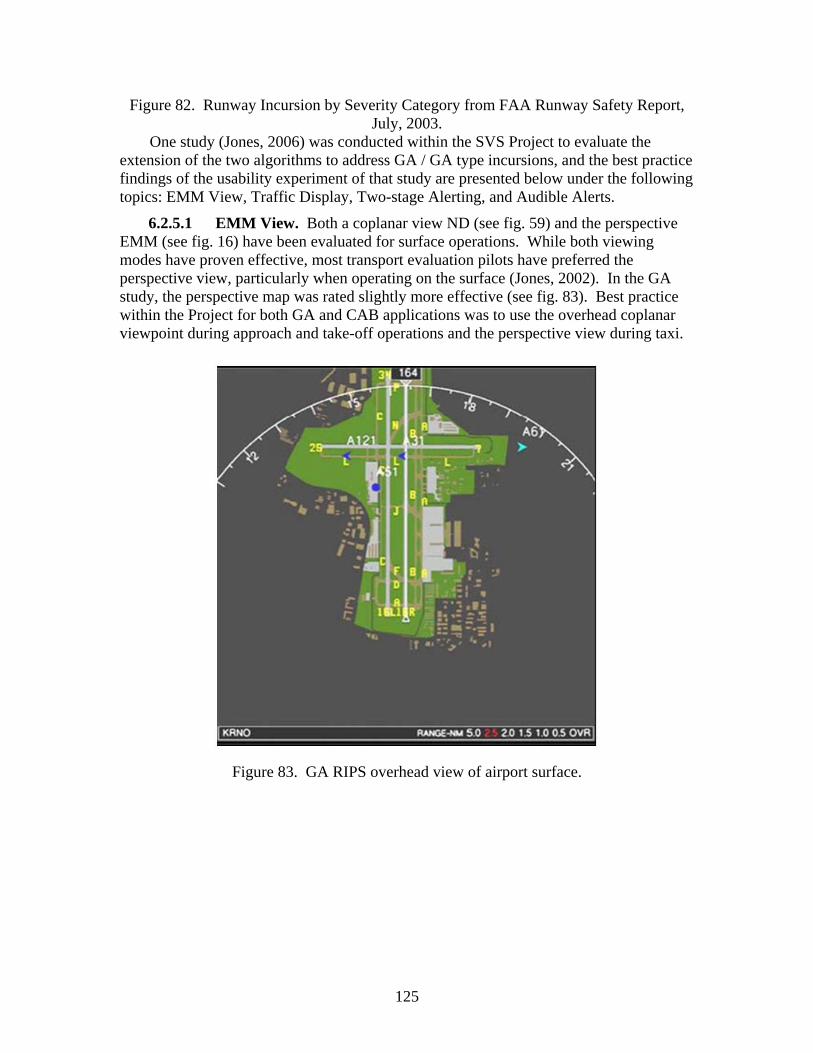
125
Figure 82. Runway Incursion by Severity Category from FAA Runway Safety Report, July, 2003.
One study (Jones, 2006) was conducted within the SVS Project to evaluate the extension of the two algorithms to address GA / GA type incursions, and the best practice findings of the usability experiment of that study are presented below under the following topics: EMM View, Traffic Display, Two-stage Alerting, and Audible Alerts.
6.2.5.1 EMM View. Both a coplanar view ND (see fig. 59) and the perspective EMM (see fig. 16) have been evaluated for surface operations. While both viewing modes have proven effective, most transport evaluation pilots have preferred the perspective view, particularly when operating on the surface (Jones, 2002). In the GA study, the perspective map was rated slightly more effective (see fig. 83). Best practice within the Project for both GA and CAB applications was to use the overhead coplanar viewpoint during approach and take-off operations and the perspective view during taxi.
Figure 83. GA RIPS overhead view of airport surface.
126
6.2.5.2 Traffic Display. In the GA study, a surface map with ownship (without other traffic) was rated as being significantly inferior to a surface map with traffic and / or incursion alerting for perceived safety value added. Most evaluation pilots (14 of 16) considered traffic presentation necessary to prevent runway incursions. However, according to analysis of the objective measures, the addition of traffic was marginally beneficial when presented on a moving map display and was only effective when alerting was provided. A possible cause may be that pilots had to transition to out-the-window and were not focused on the head-down display.
6.2.5.3 Two-stage Alerting. Eleven of 16 evaluation pilots liked the idea of having a caution alert in conjunction with a warning to provide more evaluation and reaction time (i.e., a greater comfort level). For the scenarios evaluated, the pilots generally felt that providing caution and warning alerts on approach was most effective, while a warning alert alone was sufficient when on the airport surface (during departure and taxi). Also, results from the RIPS GA study indicated that more of the subjects preferred two-stage alerting for single pilot operations. The consensus was that two-stage alerting was desired on approach but single-stage was desired during take-off and taxi (where there is less time to evaluate the situation and more immediate actions may be necessary).
6.2.5.4 Audible Alerts. In the GA study, a greater safety margin resulted when audible alerts were provided. With such alerting, the pilot is provided a cue to direct focus and attention to the head-down display to locate the incurring traffic. In fact, pilots rated having audible alerts with no surface map and having such alerts with a map with ownship but no traffic almost the same for runway incursion prevention on almost all dependent variables measured. For the experimental scenarios tested, the moving map display revealed its utility only when traffic AND alerting were available. Overall, a surface map with ownship and traffic along with audible alerts was considered an optimal incursion prevention system, while an audible alert alone was considered a minimally effective system. It should be noted that more descriptive terms for the alerts, such as “Warning, traffic departing 25”, or “Caution, traffic approaching 34R” were used in the study. Most of the subjects felt the terms were very effective; however, a few of the pilots thought the terms should be even more descriptive. More research needs to be conducted to determine the best terms to use, and to examine the use of more descriptive terminology in CAB applications.
6.2.6 Database Integrity Monitoring The GA Enhanced SVS is equipped with a DIME approach to database integrity
monitoring. DIME can make use of various ranging sensors, such as DLRA or, if available, a mature omni-directional GPS Bi-Static Radar (GPSBR) receiver. The best practices within the Project that have evolved for the monitoring methodology were presented in Section 6.1.6.
7. Concluding Remarks The National Aeronautics and Space Administration (NASA), under its Aviation
Safety Program (AvSP), chartered the Synthetic Vision Systems (SVS) Project to develop and support the implementation of a synthetic vision system(s) that would greatly
127
improve aviation safety and efficiency of operations for commercial transport, business jet, and general aviation aircraft. The Project has developed display system concepts to improve pilot terrain/situation awareness by providing a perspective synthetic view of the outside world through an on-board database driven by precise aircraft positioning information updating via Global Positioning System-based data. This work was aimed at eliminating visibility-induced errors and low visibility conditions as a causal factor to civil aircraft accidents, as well as replicating the operational benefits of clear day flight operations regardless of the actual outside visibility condition. Limited visibility is the single most critical factor affecting both the safety and capacity of worldwide aviation operations. Synthetic vision technology will allow this visibility problem to be solved with a visibility solution, making every flight the equivalent of a clear daylight operation.
A Synthetic Vision System takes advantage of many enabling technologies that, together, provide more than just a display of terrain information, but instead represent operational display systems with independent, redundant information sources and substantially improved performance over those displays with only terrain depiction alone. The independent informational elements form the basis for monitoring the dynamic flight environment and thereby supplement the synthetic world with real-time, direct measurement of the surrounding terrain, air / ground traffic and structures / obstacles / objects that are not within the databases. Integration of these enabling technologies into the SVS concept (a true system, rather than just terrain on a PFD) provides pilots with high-integrity real-time geo-referenced information that improves situational awareness with respect to terrain, obstacles, traffic, and flight path, both in the air and on the ground.
Numerous research and development activities have been conducted to evaluate, investigate, and assess the technology which can lead to operational and certified SVS. From these works and through the cooperative efforts of industry, academia and the FAA, certified SVS display concepts could be operational in the very near future, providing quantifiable operational and safety benefits. This work was possible only through the collective efforts of many, many individuals. The authors gratefully acknowledge the contributions of all those involved in Government, Industry, and Academia.

128
8. References References appearing in bolded text were produced outside of the auspices of the
SVS Project. Otherwise the references were produced within the Project (or at least with significant contributions from within the Project) and are intended to represent the entire body of work (not just the references cited in the text), although, with the present authors’ apologies, a few papers are undoubtedly missing.
1. Abbott, T. S., & Steinmetz, G. G. (1987). Integration of Altitude and
Airspeed Information into a Primary Flight Displays. NASA TM-89064, April 1987.
2. Adams, J. J., & Lallman, F. J. (1978). Description and preliminary studies of a computer drawn instrument landing approach display. NASA-TM-78771, November, 1978.
3. AIAA (1996). Global Positioning System: Theory and Applications (Volumes I & II). Bradford W. Parkinson and James J. Spilker Jr. (Editors). American Institute of Aeronautics and Astronautics, 1996.
4. Airline Monitor (2001). Forecast of the Commercial Jet Transport Market from 2001 to 2020. Airline Monitor, Vol. 14, No. 2, July 2001.
5. Alexander, A. L., & Wickens, C. D. (2005). Synthetic Vision Systems: Flightpath Tracking, Situation Awareness, and Visual Scanning in an Integrated Hazard Display. 13th International Symposium on Aviation Psychology, 2005.
6. Ammar, D. (1999). Radar Based Terrain and Obstacle Alerting System. U. S. Patent Number 5,945,926, U. S. Patent Office, August 31, 1999.
7. AOPA (1997). 1997 Nall Report - Accident Trends and Factors for 1996, Aircraft Owners and Pilots Association, Fredrick, MD.
8. AOPA (2000). 2000 Nall Report- General Aviation Accident Trends and Factors for 1999, Aircraft Owners and Pilots Association, Fredrick, MD.
9. AOPA (2002). 2002 Nall Report- General Aviation Accident Trends and Factors for 2001, Aircraft Owners and Pilots Association, Fredrick, MD.
10. ARINC (1999). Airborne Weather Radar with Forward Looking Windshear Detection Capability. ARINC Characteristic 708A-3, ARINC, November 15, 1999.
11. Arthur III, J.J., Prinzel III, L.J., Kramer, L.J., Bailey, R.E., & Parrish, R.V. (2003). CFIT Prevention using Synthetic Vision. Proceedings of SPIE, Enhanced and Synthetic Vision 2003, Volume 5081, 146-157.
12. Arthur III, J. J., Prinzel III, L. J, Kramer, L. J., Parrish, R. V., & Bailey, R. E. (2004a). Flight Simulator Evaluation of Synthetic Vision Display Concepts to Prevent Controlled Flight into Terrain (CFIT). NASA TP-2004-213008, April 2004.

129
13. Arthur III, J.J., Williams, S. P., Prinzel III, L.J., Kramer, L.J., & Bailey, R.E. (2004b). Flight Simulator Evaluation of Display Media Devices for Synthetic Vision Concepts. Proceedings of SPIE, Enhanced and Synthetic Vision 2004, Editor: Jacques G. Verly, Volume 5424 paper 12, 2004.
14. Arthur III, J.J., Kramer, L.J., & Bailey, R.E. (2005). Flight Test Comparison between Enhanced Vision (FLIR) and Synthetic Vision Systems. Proceedings of SPIE, Enhanced and Synthetic Vision 2005, Editor: Jacques G. Verly, Volume 5802-03, 2005.
15. Arthur III, J. J., Prinzel III, L. J., Kramer, L. J., & Bailey, R. E. (2006a). Dynamic Tunnel Usability Study: Format Recommendations for Synthetic Vision System Primary Flight Displays. NASA-2006-TM214272, 2006.
16. Arthur III, J. J., Prinzel III, L. J., Williams, S. P., & Kramer, L. J. (2006b). Synthetic Vision Enhanced Surface Operations and Flight Procedures Rehearsal Tool. SPIE Defense & Security Symposium 2006, April 2006.
17. Arthur, J. J., III; Prinzel, L.e J., III; Shelton, K. J.; Kramer, L. J.; Williams, S. P.; Bailey, R. E.; Norman, R. M. (2007). Design and Testing of an Unlimited Field-of-regard Synthetic Vision Head-worn Display for Commercial Aircraft Surface Operations. Proceedings of SPIE Enhanced and Synthetic Vision, Volume 6559, April 2007.
18. Bailey, R. E., Parrish, R. V., Arthur J. J., Glaab, L. J., & Kramer, L. J. (2002a). Flight Test Evaluations (DFW & EGE) of Tactical Synthetic Vision Display Concepts. SAE Guidance and Control Meeting, March, 2002.
19. Bailey, R. E., Parrish, R. V., Arthur III, J. J., & Norman, R. M. (2002b). Flight Test Evaluation of Tactical Synthetic Vision Display Concepts in a Terrain-Challenged Operating Environment. SPIE 16th Annual International Symposium on Aerospace/Defense Sensing, Simulation, and Controls - AeroSense, April 2002.
20. Bailey, R.E., Parrish, R.V., Kramer, L.J., Harrah S.D., & Arthur III, J.J. (2002c). Technical Challenges in the Development of a NASA Synthetic Vision System Concept. Proceedings of the North Atlantic Treaty Organization (NATO) Symposium on Enhanced and Synthetic Vision Systems, Sept. 2002.
21. Bailey, R. E., Arthur III, J. J., & Williams, S. P. (2004). Latency Requirements for Head-Worn E/SVS Applications. Proceedings of SPIE, Enhanced and Synthetic Vision 2004, Editor: Jacques G. Verly, Volume 5424, April 2004.
22. Bailey, R. E., Arthur III, J.J., Williams, S. P., & Kramer, L. J. (2005). Latency in Visionic Systems: Test Methods and Requirements. Proceedings of the North Atlantic Treaty Organization (NATO) HF-125 Workshop on Toward Recommended Methods for Testing and Evaluation of EV and E/SV Based Visionic Devices, April 26-27, 2005.
23. Bailey, R.E., Kramer, L.J., & Prinzel III, L.J (2006). Crew and Display Concepts Evaluation for Synthetic / Enhanced Vision Systems. SPIE Defense & Security Symposium 2006, April 2006.
130
24. Bailey, R. E.; Arthur, J. J., III; Prinzel, L. J., III; Kramer, L. J. (2007). Evaluation of Head-Worn Display Concepts for Commercial Aircraft Taxi Operations. Proceedings of SPIE Enhanced and Synthetic Vision, Volume 6559, April 2007.
25. Bailey, R. E.; Kramer, L. J.; & Prinzel, L. J., III (2007). Fusion of Synthetic and Enhanced Vision for All-Weather Commercial Aviation Operations (NATO RTO-HFM-141). NATO Human Factors and Medicine Symposium on Human Factors and Medical Aspects of Day/Night All Weather Operations: Current Issues and Future Challenges, 11-1 through 11-18.
26. Baize, D.G., & Allen, C.L. (2001). Synthetic Vision Systems Project Plan, Version IIId. NASA Langley Research Center, Nov. 2001.
27. Bartolone, A. P., Hughes, M. F., Wong, D. T., & Takallu, M. A. (2004). Symbology Development for General Aviation Synthetic Vision Primary Flight Displays for the Approach and Missed-Approach Modes of Flight. Human Factors and Ergonomics Society 48th Annual Meeting, Sept. 2004.
28. Bartolone, A. P., Glaab, L. J., Hughes, M. F., & Parrish, R. V. (2005). Initial Development of a Metric to Describe the Level of Safety Associated with Piloting an Aircraft with Synthetic Vision Systems (SVS) Displays. Proceedings of SPIE Defense and Security Symposium, Enhanced and Synthetic Vision, Editor: Jacques G. Verly, Volume 5802-19, 2005.
29. Beskenis, S. O., Green, D. F., Hyer, P. V., & Johnson Jr., E. J. (1998). Integrated Display System for Low Visibility Landing and Surface Operations. NASA/CR-1998-208446, July, 1998.
30. Best, E. A., & Rankin, J. M. (2001). Controller - Pilot Data Link Results from NASA and FAA Dallas-Fort Worth 2000 Test and Demonstration. Proceedings of the 20th Digital Avionics Systems Conference, Oct. 2001.
31. Boeing (1998). Statistical summary of commercial jet aircraft accidents, Worldwide Operations, 1959-1997. Seattle, WA: Airplane Safety Engineering, Boeing Commercial Airplane Group.
32. Both, A., Klein, J., Koczo, S., & Lamb, T. (1998). Preliminary System Requirements for Synthetic Vision. Rockwell Collins NCA1-125.11.10.4, Dec. 1998.
33. Boucek, G.P. Jr. (2001). Candidate Concept Descriptions for SVS/EVS Retrofit in Airplanes with CRT Type Primary Flight Instrumentation. Research Triangle Institute Report No. RTI/7473/034-01S, Sept. 2001.
34. Boucek Jr., G.P. (2002). Surface Accident and Incident Taxonomy and Mitigation Strategies. Research Triangle Institute, Aug. 2001.
35. Burgess, M. A. (1994). Synthetic vision for low-visibility aircraft operations: what we know and what we do not know. Proc. SPIE Vol. 2220, p. 206-217, Sensing, Imaging, and Vision for Control and Guidance of Aerospace Vehicles, J. G. Verly, S. S. Welch; Eds. July 1994.

131
36. Campbell, J. L., & Uijt de Haag, M. (2001). Assessment of Radar Altimeter Performance When Used for Integrity Monitoring in a Synthetic Vision System. Proceedings of the 20th Digital Avionics Systems Conference, June 2001.
37. Campbell, J., Uijt de Haag, M., van Graas, F., & Young, S. (2003). Light Detection and Ranging-based Terrain Navigation: A Concept Exploration. Institute of Navigation GPS/GNSS Conference, Sept. 2003.
38. Campbell, J., Vadlamani, A., Uijt de Haag, M., & Young, S. (2003). The Application of LiDAR to Synthetic Vision System Integrity. AIAA/IEEE 22nd Digital Avionics Systems Conference, Oct. 2003.
39. Cassell, R., Bradfield, S., & Smith, A. (1997). Airport Surface RNP (Required Navigation Performance) - Implications for GNSS. Proceedings of the Institute of Navigation GPS/GNSS Conference, January 1997.
40. Cassell, R, Smith, A., & Hicok, D. (1999). Development of Aerodrome Surface Required Navigation Performance (RNP), NASA CR-1999- 209109.
41. Cassell, R., Evers, C., & Yang, E. (2000). PathProx™ - A Runway Incursion Alerting System. Proceedings of the 19th Digital Avionics Systems Conference, Oct. 2000.
42. Cassell, R., Evers, C., Sleep, B., & Esche, J. (2001). Initial Test Results of PathProx™ - A Runway Incursion Alerting System. Proceedings of the 20th Digital Avionics Systems Conference, Oct. 2001.
43. Cassell, R., Evers, C., Esche, J., & Sleep, B. (2002). NASA Runway Incursion Prevention System (RIPS) Dallas-Fort Worth Demonstration Performance Analysis. NASA CR-2002-211677, June 2002.
44. Cassell, R., Evers, C., & Esche, J. (2003). Safety Benefits of PathProx™ – A Runway Incursion Alerting System. Proceedings of the AIAA/IEEE 22
nd Digital
Avionics Systems Conference, Oct. 2003.
45. Comstock Jr., J. R., Glaab, L. J., Prinzel, L. J., & Elliott, D. M. (2001). Can Effective Synthetic Vision System Displays Be Implemented on Limited Size Display Spaces? Proceedings of the 11th International Symposium on Aviation Psychology, Mar. 2001.
46. Comstock Jr., J. R., Jones, L, C., & Pope, A. T. (2003). The Effectiveness of Various Attitude Indicator Display Sizes and Extended Horizon Lines on Attitude Maintenance in a Part-Task Simulation. Human Factors & Ergonomics Society 2003 Meeting, Oct. 2003.
47. Cooper, E., & Young, S. (2005). Database Integrity Monitoring for Synthetic Vision Systems Using Machine Vision and SHADE. SPIE Defense and Security Symposium, Enhanced and Synthetic Vision Conference, March 28-April 1, 2005.
48. Craig, G., Jennings, S., Link, N., & Kruk, R. (2002). Flight Test of a Helmet-Mounted, Enhanced and Synthetic Vision System for Rotorcraft Operations. American Helicopter Society 58th Annual Forum, Jun., 2002.
132
49. Cramer, M.R. (1996). Operational Considerations in Improving Access to Juneau, Alaska. IEEE Position Location and Navigation Symposium, Apr 1996.
50. Dieffenbach, O. (1995). Autonomous Precision Approach and Landing System. Proceedings of SPIE Air Traffic Control Technologies, Vol. 2464, p. 158-164, Apr. 1995.
51. Esterhuizen, S., Masters, Akos, D., & Vinande, E. (2005). Experimental Characterization of Land-Reflected GPS Signals. Proceedings of the Institute of Navigation GPS/GNSS Conference, 2005.
52. Etherington, T.J., Vogl, T.L., Lapis, M.B., & Razo, J.G. (2000). Synthetic Vision Information System. Proceedings of the 19th Digital Avionics Systems Conference, Oct. 2000.
53. FAA (2001). FAA NPRM Docket No. NM185, Notice 25-01-02-SC, Special Conditions: Enhanced Vision System (EVS) for Gulfstream Model G-V Airplane. June 2001.
54. FAA (2002a). Technical Standard Order (TSO) TSO-C151b, Terrain Awareness and Warning System. Department of Transportation, Federal Aviation Administration, Dec. 17, 2002.
55. FAA (2002b). Advisory Circular 120-29A: Criteria for Approval of Category I and Category II Weather Minima for Approach. Department of Transportation, Federal Aviation Administration, Aug. 12, 2002.
56. FAA (2003). FAA Runway Safety Report. FAA Office of Runway Safety, July 2003.
57. FAA (2004a). Enhanced Flight Vision Systems; Final Rule. 14 CFR Parts 1, 91, et al. Department of Transportation, Federal Aviation Administration, January 2004.
58. FAA (2004b). FAA Runway Safety Report. FAA Office of Runway Safety, August 2004.
59. FAA (2005a). FAA Runway Safety Report. FAA Office of Runway Safety, August 2005.
60. FAA (2005b). Synthetic Vision and Pathway Depictions on the Primary Flight Display. Department of Transportation, Federal Aviation Administration, AC 23-26, December 2005.
61. Foster, Lowell (1998). FAA Safer Skies Update, Joint NASA/FAA Aviation Safety Meeting, February, 1998.
62. Foyle, D.C., Ahumada, A.J., Larimer, J., & Townsend-Sweet, B., (1992). Enhanced/Synthetic Vision Systems: Human Factors Research and Implications for Future Systems. SAE Aerotech '92, Anaheim, CA, Oct. 1992.
63. Foyle, D. C., Andre, A., Hooey, B., & McCann, R. (1998). T-NASA Taxi Test at Atlanta Airport. NASA-TM-112240, Sept., 1998.

133
64. French, G., & Schnell, T. (2003). Terrain Awareness & Pathway Guidance for Head-Up Displays (TAPGUIDE); A Simulator Study of Pilot Performance. 22nd Digital Avionics Systems Conference, Oct. 2003.
65. Gandhi, T., Devadiga, S., Kasturi, R., & Camps, O. (2000). Detection of Obstacles on Runways Using Ego-Motion Compensation and Tracking of Significant Features. Image and Vision Computing Journal, Special Issue on Applications of Computer Vision, 18:805-815, 2000.
66. Ganoe, G., & Young, S. (2005). Utilization of GPS Surface Reflected Signals to Provide Aircraft Altitude Verification for SVS. SPIE Defense and Security Symposium, Enhanced and Synthetic Vision Conference, March 28-April 1, 2005.
67. Glaab, L. J., & Takallu, M. A. (2002). Preliminary Effect of Synthetic Vision Systems Displays to Reduce Low-Visibility Loss of Control and Controlled Flight Into Terrain Accidents. 2002 SAE General Aviation Technology Conference and Exhibition, Apr. 2002.
68. Glaab, L. J., & Hughes, M. F. (2003). Terrain Portrayal for Head-Down Displays Flight Test. Proceeding of the 22nd Digital Avionics Systems Conference, Oct. 2003.
69. Glaab, L. J., Kramer, L. J., Arthur III, J. J., & Parrish, R. V. (2003). Flight Test Comparison of Synthetic Vision Display Concepts at Dallas/Fort-Worth Airport. NASA TP-2003-212177, March. 2003.
70. Glaab, L. J., Parrish, R. V., Hughes, M. F., & Takallu, M. A. (2006). Transforming IMC Flight into VMC Flight: An SVS Case Study. 25th Digital Avionics Systems Conference, Oct. 2006.
71. Gray, R. A. (1999). In-flight Detection of Errors for Enhanced Aircraft Flight Safety and Vertical Accuracy Improvement Using Digital Terrain Elevation Data with an Inertial Navigation System, Global Positioning System and Radar Altimeter. Ph.D. Dissertation, Ohio University, Athens, Ohio, June 1999.
72. Green Jr., D. F. (2002). Runway Safety Monitor Algorithm for Runway Incursion Detection and Alerting. NASA CR-2002-211416, Jan. 2002.
73. Green Jr., D. F. (2006). Runway Safety Monitor Algorithm for Single and Crossing Runway Incursion Detection and Alerting. NASA CR-2006-214275, Feb. 2006.
74. Gunawardena, S., & Rankin, J. M. (2001). Controller - Pilot Communications Using a VDL Mode 2 Datalink for the NASA Runway Incursion Prevention System. Proceedings of the 20th Digital Avionics Systems Conference, Oct. 2001.
75. Harrah, S.D., Jones, W.R., Erickson, C.W., & White, J.H. (2002). The NASA Approach to Realize a Sensor Enhanced-Synthetic Vision System (SE-SVS). Proceeding of the 21st Digital Avionics Systems Conference, Oct. 2002.

134
76. Harris, R.L., & Parrish, R.V., (1992). Piloted Studies of Enhanced or Synthetic Vision Display Parameters. SAE Aerotech '92, Aneheim, CA, Oct. 1992.
77. Harrison, S. V., Kramer, L. J., Bailey, R. E., Jones, D. R., Young, S. D., Harrah, S. D., Arthur III, J. J., & Parrish, R. V. (2003). Initial SVS Integrated Technology Evaluation Flight Test Requirements and Hardware Architecture. NASA/TM-2003-212644, Sept. 2003.
78. Hasan, S., Hemm, R., & Houser, S. (2002a). Preliminary Results of an Integrated Safety Analysis of NASA Aviation Safety Program Technologies: Synthetic Vision and Weather Accident Prevention. Proceedings of the 20th Digital Avionics Systems Conference, Mar. 2002.
79. Hasan, S., Hemm, R., & Houser, S. (2002b). Analysis of Safety Benefits of NASA Aviation Safety Program Technologies. LMI NS112S2, Dec. 2002.
80. Hatfield, J. J., & Parrish, R. V. (1990). Advanced Cockpit Technology for Future Civil Transport Aircraft. 11th IEEE \ AESS Dayton Chapter Symposium, November, 1990.
81. Hawes, C. C., & DiBenedetto, M. F. (2001). The Local Area Augmentation System: An Airport Surveillance Application Supporting the FAA Runway Incursion Reduction Program Demonstration at the Dallas/Fort Worth International Airport. Proceedings of the 20th Digital Avionics Systems Conference, Oct. 2001.
82. He, G.; Feyereisen, T.; Conner, K.; Wyatt, S.; Engels, J.; Gannon, A.; Wilson, B. (2007). EGPWS on Synthetic Vision Primary Flight Display. Proceedings of SPIE Enhanced and Synthetic Vision, Volume 6559, Apr. 2007.
83. Hemm Jr., R. B., (2000). Benefit Estimates of Synthetic Vision Technology. Logistics Management Institute NS002S1, June, 2000.
84. Hemm, R., & Houser, S. (2000). A Synthetic Vision Preliminary Integrated Safety Analysis. NASA/CR-2001-211285, LMI NS009S1, Dec. 2000.
85. Hemm, R., Lee, D., Stouffer, V., & Gardner, A. (2001). Additional Benefits of Synthetic Vision Technology. Logistics Management Institute NS014S1, June, 2001.
86. Hines, G. D., Rahman, Z., Jobson, D. J., & Woodell, G. A. (2004a). DSP Implementation of the Multiscale Retinex Image Enhancement Algorithm. Proceedings of SPIE Visual Information Processing XIII, 5438. April, 2004.
87. Hines, G. D., Rahman, Z., Jobson, D. J., & Woodell, G. A. (2004b). Single-Scale Retinex Using Digital Signal Processors. Global Signal Processing Expo (GSPx), 2004.
88. Hines, G. D., Rahman, Z., Jobson, D. J., Woodell, G. A., & Harrah, S. D. (2005). Real-time Enhanced Vision System. SPIE Defense and Security Symposium 2005, Mar. 2005.

135
89. Hines, G. D., Rahman, Z., Jobson, D. J., & Woodell, G. A. (2006). A Real-Time Enhancement, Registration, and Fusion for a Multi-Sensor Enhanced Vision System. SPIE Defense & Security Symposium, Apr. 2006.
90. Hueschen, R. M., Hankins, W., & Barker, L. K (1998). Description and Flight Test of a Rollout and Turnoff Head-Up Display Guidance System, Proceedings of the AIAA/IEEE/SAE 17th Digital Avionics System Conference. Seattle WA, Oct. 1998.
91. Hughes, M. F., & Takallu, M. A (2002). Terrain Portrayal for Head-Down Displays Experiment. International Advanced Aviation Conference, Aug. 2002.
92. Hughes, M. F., & Glaab, L. J. (2003). Terrain Portrayal for Head-Down Displays Simulation Results. Proceeding of the 22nd Digital Avionics Systems Conference, Oct. 2003.
93. Hughes, M. F., & Glaab, L. J. (2007). Terrain Portrayal for Synthetic Vision Systems Head-Down Displays Evaluation Results. NASA/TP-2007-214864, April 2007.
94. Hyer, P. V. (2002). Demonstration of Land and Hold Short Technology at the Dallas-Fort Worth International Airport. NASA/CR-2002-211642, Apr. 2002.
95. Hyer, P. V., & Otero, S. (2007): Cockpit Displays for Enhancing Terminal-Area Situational Awareness and Runway Safety. NASA/CR-2007-214545-, February 2007.
96. ICAO (1999). International Standards and Recommended Practices – Aerodromes. ICAO Annex 14, International Civil Aviation Organization, July 1999.
97. Jobson, D. J., Rahman, Z., & Woodell, G. A. (2001). The Spatial Aspect of Color and Scientific Implications of Retinex Image Processing. Proceedings of the SPIE International Symposium on AeroSense, Conference on Visual Information Processing X, April, 2001.
98. Jobson, D. J., Rahman, Z., & Woodell, G. A. (2002). The Statistics of Visual Representation. Proceedings of SPIE Visual Information Processing XI, 4736. April, 2002.
99. Jobson, D. J., Rahman, Z., & Woodell, G. A. (2003). Feature Visibility Limits in the Non-Linear Enhancement of Turbid Images. Proceedings of SPIE Visual Information Processing XII, 5108. April, 2003.
100. Jobson, D. J., Rahman, Z., Woodell, G. A., & Hines, G. D. (2004). The Automatic Assessment and Reduction of Noise Using Edge Pattern Analysis in Non-Linear Image Enhancement. SPIE Defense and Security Symposium, Apr. 2004.
101. Jobson, D. J., Rahman, Z., Woodell, G. A., & Hines, G. D. (2006). A Comparison of Visual Statistics for the Image Enhancement of FORESITE Aerial Images with Those of Major Image Classes. SPIE Defense & Security Symposium, Apr. 2006.
102. Johnson, E. J., & Hyer, P. V. (1999). Roll-Out and Turn-Off Display Software for Integrated Display System. NASA/CR-1999-209731, Nov. 1999.

136
103. Jones, D. R., Quach, C. C., & Young, S. D. (2001). Runway Incursion Prevention System (RIPS) Demonstration and Testing at the Dallas/Fort Worth International Airport. Proceedings of the 20th Digital Avionics Systems Conference, Oct. 2001.
104. Jones, D. R. (2002). Runway Incursion Prevention System Simulation Evaluation. Proceeding of the 21st Digital Avionics Systems Conference, Oct. 2002.
105. Jones, D. R., & Rankin, J. M. (2002). A System for Preventing Runway Incursions. Journal of Air Traffic Control, July 2002.
106. Jones, D. R. (2005). Runway Incursion Prevention System Testing at the Wallops Flight Facility. SPIE Defense & Security Symposium, 2005, March 28-April 1, 2005.
107. Jones, D. R., & Prinzel III, L. J. (2006). Runway Incursion Prevention for General Aviation Operations. Proceeding of the 25th Digital Avionics Systems Conference, Oct. 2006.
108. Junered, M. , Esterhuizen, S., Akos, D. & Axelrad, P. (2006). A Modular GPS Remote Sensing Software Receiver for Small Platforms. Proceedings of the Institute of Navigation GPS/GNSS Conference, 2006.
109. Kaiser, M. K. (1998). The Surface Operations Research and Evaluation Vehicle (SOREV) - A testbed for HSCT taxi issues. AIAA-1998-5558, 1998 World Aviation Conference, Anaheim, CA, Sept., 1998.
110. Kasturi, R., Camps, O., & Coraor, L. (2000). Performance Characterization of Obstacle Detection Algorithms for Aircraft Navigation. TR-CSE-00-002, Jan. 2000.
111. Kasturi, R., Camps, O. I., Huang, Y., Narasimhamurthy, A., & Pande, N. (2002). Wire Detection Algorithms for Navigation. NAG2-1487, Jan. 2002.
112. Keller, M., Schnell, T., Glaab, L. J., & Parrish, R. V. (2003). Pilot Performance as a Function of Display Resolution and Field of View in a Simulated Terrain Following Flight Task Using a Synthetic Vision System. Proceeding of the 22nd Digital Avionics Systems Conference, Oct. 2003.
113. Kramer, L. J., editor (1999). Synthetic Vision Workshop 2. NASA/CP-1999-209112, Mar. 1999.
114. Kramer, L. J., & Norman, R. Michael (2000). High-Speed Research Surveillance Symbology Assessment Experiment. ASA/TM-2000-210107, April, 2000.
115. Kramer, L. J., Prinzel III, L. J., Bailey, R. E., & Arthur III, J. J. (2003). Synthetic Vision Enhances Situation Awareness and RNP Capabilities for Terrain-Challenged Approaches. AIAA's 3rd Annual Aviation Technology, Integration, and Operations (ATIO) Technical Forum, AIAA 2003-6814, Nov. 2003.
116. Kramer, L.J., Prinzel, L.J., Arthur, J.J., & Bailey, R.E. (2004a). Pathway Design Effects on Synthetic Vision Head-Up Displays. Proceedings of SPIE, Enhanced and Synthetic Vision 2004, Editor: Jacques G. Verly, Volume 5424 paper 12 Apr. 2004.

137
117. Kramer, L. J., Prinzel III, L. J., Bailey, R. E., Arthur III, J. J., & Parrish, R.V. (2004b). Flight Test Evaluation of Synthetic Vision Concepts at a Terrain Challenged Airport. NASA TP-2004-212997, Feb. 2004.
118. Kramer, L.J., Arthur III, J.J., Bailey, R.E., & Prinzel III, L.J. (2005a). Flight Testing an Integrated Synthetic Vision System. Proceedings of SPIE Defense and Security Symposium, Enhanced and Synthetic Vision, Editor: Jacques G. Verly, Volume 5802-01, 2005.
119. Kramer, L. J., Prinzel III, L. J., , Arthur III, J. J., & Bailey, R E. (2005b). Advanced Pathway Guidance Evaluations on a Synthetic Vision Head-Up Display. NASA/TP-2005-213782, July 2005.
120. Kramer, L. J.; Williams, S. P.; Bailey, R. E.; & Glaab, L. J. (2007). Synthetic Vision Systems - Operational Considerations Simulation Experiment. Proceedings of SPIE Enhanced and Synthetic Vision, Volume 6559, April 2007.
121. Larimer, J., Pavel, M., Ahumada, A. J., & Sweet, B. T. (1992). Engineering a Visual System for Seeing Through Fog. 22ND International Conference on Environmental Systems. Seattle, WA, SAE SP-1130, July 1992.
122. Lechner, A., Mattson, P., & Ecker, K. (2001). Voice Recognition - Software Solutions in Real Time ATC Workstations. Proceedings of the 20th Digital Avionics Systems Conference, Oct. 2001.
123. Lemos, K., Schnell, T., Etherington, T., & Gordon, D. (2002). 'Bye-Bye Steam Gages, Welcome Glass'; A Review of New Display Technology for General Aviation Aircraft. Proceedings of 21st Digital Avionics Systems Conference, October 2002.
124. Lemos, K., & Schnell, T. (2003). Synthetic Vision Systems: Human Performance Assessment of the Influence of Terrain Density and Texture. Proceedings of 22nd Digital Avionics Systems Conference, October 2003.
125. Masters, D., Axelrad, P., Zavorotny, V., Katzberg, S. J. & Lalezari, F. (2001). A Passive GPS Bistatic Radar Altimeter for Aircraft Navigation. Proceedings of the Institute of Navigation GPS/GNSS Conference, 2001.
126. Masters, D., Akos, D., Esterhuizen, S. & Vinande, E. (2005). Integration of GNSS Bistatic Radar Ranging into an Aircraft Terrain Awareness and Warning System. Proceedings of the Institute of Navigation GPS/GNSS Conference, 2005.
127. Mattikalli, N. M. (1999). Synthetic Vision Systems. Cambridge Research Associates Report, January 1999.
128. McCann, R. S. (1996). Building the Traffic, Navigation, and Situation Awareness System (T-NASA) for Surface Operations. NASA-CR-203032, Oct., 1996.
129. McCann, R. S., Hooey, B. L., Parke, B., Foyle, D. C., Andre, A. D., & Kanki, B. (1998). An evaluation of the Taxiway Navigation and Situation Awareness (T-NASA) system in high-fidelity simulation. SAE Transactions: Journal of Aerospace, 107, 1612-1625.

138
130. McKay, D., Guirguis, M., Zhang, R., & Newman, R.L. (2002). Evaluation of EVS for Approach Hazard Detection. NATO RTO SET Workshop on Enhanced and Synthetic Vision System. NATO RTO-MP-107, Ottawa, Canada, September 2002.
131. McKenna, J.T., (1999). Carriers Seek Greater HUD Availability. Aviation Week and Space Technology Magazine, Oct. 1999.
132. Merchant, S., Kwon, Y., Schnell, T., Etherington, T., & Vogl, T (2001a). Evaluation of Synthetic Vision Information System (SVIS) Displays Based on Pilot Performance. Proceedings of the 20th Digital Avionics Systems Conference, October 2001.
133. Merchant, S., Schnell, T., & Kwon, Y. (2001b). Assessing Pilot Performance in Flightdecks Equipped with Synthetic Vision Information System. Proceedings of the 11th International Symposium on Aviation Psychology, March 2001.
134. Merrick, V.K., & Jeske, J.A., (1995). Flightpath Synthesis and HUD Scaling for V/STOL Terminal Area Operations. NASA Technical Memorandum 110348, April 1995
135. Morici, M. (2001). Aircraft Position Validation using Radar and Digital Terrain Elevation Database. U. S. Patent Number 6,233,522, U. S. Patent Office, May 15, 2001.
136. Mueller, R., Belamqaddam, K., Pendergast, S., & Krauss, K. (2001). Runway Incursion Prevention System Concept Verification: Ground Systems and STIS-B Link Analysis. Proceedings of the 20th Digital Avionics Systems Conference, Oct. 2001.
137. NASA (1998). NASA’s High Speed Research Program – The eXternal Visibility System. NASA Facts FS-1998-09-34, LaRC, Hampton VA.
138. NASA (2000). 1.12 Synthetic Vision, NASA & the FAA – A Technology Partnership for the New Millennium. NASA Code R, 2000.
139. Newman, R. L. (2000). HUDs, and SDO: A Problem or a Bad Reputation. Recent Trends in Spatial Disorientation Conference, Nov. 2000.
140. Nguyen, D. P. Chi, Harrah, S.D., & Jones, W.R. (2002). Flight Test of IR Sensors on NASA 757 at Newport News/Williamsburg International Airport (PHF). Proceeding of the 21st Digital Avionics Systems Conference, Oct. 2002.
141. Norman, R.M. (2001). Synthetic Vision Systems (SVS) Description of Candidate Concepts Document. NASA Contract Report for NAS1-20342. Long Beach, CA: Boeing Company.
142. NTSB (2000). Safety Recommendation. A-00-66, National Transportation Safety Board, July 2000, www.ntsb.gov/recs/mostwanted/index.htm.
143. NTSB (2005). Most Wanted Transportation Safety Improvements 2006. National Transportation Safety Board, November 2005, www.ntsb.gov/recs/mostwanted/index.htm.

139
144. Ohio University (2001). SUMMARY OF RESEARCH: Modifying and Testing ATC Controller Interface (CI) for Data Link Clearances. Avionics Engineering Center, School of Electrical Engineering and Computer Science, Ohio University, TECHNICAL MEMORANDUM OU/AEC, 01-06TM-NAG1-2036, Sept. 2001.
145. Parrish, R.V., Busquets, A.M., Williams, S.P., & Nold, D.E. (1994). Spatial Awareness Comparisons between Large-Screen, Integrated Pictorial Displays and Conventional EFIS Displays during Simulated Landing Approaches. NASA TP 3467, Oct., 1994.
146. Parrish, R. V., Baize, D. G., & Lewis, M. S. (2000). “Synthetic Vision”. The Avionics Handbook, (Editor: Spitzer, C. R.), pp. 16-1 –16-8. CRC Press: Boca Raton, June 2000.
147. Parrish, R.V (2003). Avionic Pictorial Tunnel-/Pathway-/Highway-In-The-Sky Workshops. NASA CP2-2003-212164, Jan. 2003.
148. Parrish, R.V., Busquets, A.M., Williams, S.P., & Nold, D.E. (2003). Evaluation of Alternate Concepts for Synthetic Vision Flight Displays with Weather-Penetrating Sensor Image Inserts During Simulated Landing Approaches. NASA/TP-2003-212643, Oct. 2003.
149. Parrish, R. V., Williams, S. P., Bailey, R. E., Arthur III, J. J., Kramer, L. J., & Prinzel III, L. J. (2006). A Description of the “Crow's Foot" Tunnel Concept. NASA-2006-TM214311, June 2006
150. Prinzel, L. J., Bailey, R. E., Comstock Jr., J. R., Kramer, L. J., Hughes, M. F., & Parrish, R. V. (2002). NASA Synthetic Vision EGE Flight Test. Human Factors & Ergonomics Society 2002 Meeting, Jan. 2002.
151. Prinzel III, L. J., Hughes, M. F, Arthur III, J. J., Kramer, L. J., Glaab, L. J., Bailey, R. E., Parrish, R. V., & Uenking, M. D. (2003). Synthetic Vision CFIT Experiments for GA and Commercial Aircraft: “A Picture Is Worth A Thousand Lives”. Human Factors & Ergonomics Society 2003 Meeting, Oct. 2003.
152. Prinzel III, L.J., Arthur III, J.J., Kramer, L.J., & Bailey, R.E. (2004a). Pathway Concepts Experiment for Head-Down Synthetic Vision Displays. Proceedings of SPIE, Enhanced and Synthetic Vision 2004, Editor: Jacques G. Verly, Volume 5424 paper 12 April 2004
153. Prinzel III, L. J., Comstock Jr., J. R., Glaab, L. J., Kramer, L. J., Arthur III, J. J., & Barry J. S. (2004b). The Efficacy of Head-Down and Head-Up Synthetic Vision Display Concepts for Retro- and Forward-Fit of Commercial Aircraft. International Journal of Aviation Psychology, Feb. 2004.
154. Prinzel III, L. J., Comstock Jr., R. J., Glaab, L. J., Kramer, L. J., Arthur III, J. J., & Barry, J. S. (2004c). Comparison of Head-Up and Head-Down "Highway-In-The-Sky" Tunnel and Guidance Concepts for Synthetic Vision Displays. Proceedings of the Human Factors & Ergonomics Society, 48, 212-217, 004.
155. Prinzel, L.J., Comstock, J.R., Wickens, C.E., Endsley, M.R., French, G., Etherington, T., Snow, M., & Corker, K. (2004d). Human Factors Issues in Synthetic Vision Displays: Government, Academic, Military, and Industry

140
Perspectives. Proceedings of the Human Factors & Ergonomics Society, 48, 35-40.
156. Prinzel, L., Hughes, M, Kramer, L, & Arthur, J (2004e). Aviation Safety Benefits of NASA Synthetic Vision: Low Visibility Loss-of-Control Incursion Detection, and CFIT Experiments. Proceedings of the Human Performance, Situation Awareness, and Automation Technology Conference, Embry-Riddle, Daytona Beach, FL, March 2004.
157. Prinzel III, L. J., Kramer, L. J., Arthur III, J. J., & Bailey, R. E. (2004f). Evaluation of Tunnel Concepts for Advanced Aviation Displays. Human Performance, Situation Awareness, and Automation Technology Conference, Mar. 2004.
158. Prinzel III, L. J., & Risser, M. (2004). Head-Up Displays and Attention Capture. NASA/TM-2004-213000, Feb. 2004.
159. Prinzel III, L. J., Kramer, L. J., Arthur III, J. J., Bailey, R.E., & Sweeters , J. L. (2005a). Development and Evaluation of 2-D and 3-D Exocentric Synthetic Vision Navigation Display Concepts for Commercial Aircraft. Proceedings of SPIE Defense and Security Symposium, Enhanced and Synthetic Vision, Editor: Jacques G. Verly, Volume 5802-19, 2005.
160. Prinzel III, L. J., Kramer, L. J., Arthur III, J. J., Bailey, R. E., & Comstock Jr., J. R. (2005b): Flight Test Evaluation of Situation Awareness Benefits of Integrated Synthetic Vision System Technology for Commercial Aircraft. International Symposium on Aviation Psychology, April 18-21, 2005.
161. Prinzel III, L. J., Kramer, L. J., Bailey, R. E., Arthur III, J. J., Williams, S. P., & McNabb, J. (2005c). Augmentation of Cognition and Perception through Advanced Synthetic Vision Technology. 1st International Conference on Augmented Cognition, July 22-27, 2005.
162. Prinzel, L. J., & Kramer, L. J. (2006). “Synthetic Vision Systems”. Chapter in International Encyclopedia of Ergonomics and Human Factors (2nd Edition). Taylor & Francis Publishers. 2006.
163. Prinzel, L. J., III & Jones, D. R. (2007). Cockpit Technology for Prevention of General Aviation Runway Incursions. Proceedings of the 2007 International Symposium on Aviation Psychology, Dayton , OH , April 23-26, 2007.
164. Prinzel, L. J., III; Kramer, L. J.; Bailey, R E. (2007). Going Below Minimums The Efficacy of Display Enhanced Synthetic Vision Fusion for Go-Around Decisions during Non-Normal Operations. Proceedings of the 14th International Symposium on Aviation Psychology, Dayton, OH, April 2007.
165. Rahman, Z., Jobson, D. J., & Woodell, G. A. (2002a). Retinex Processing for Automatic Image Enhancement. Proceedings of SPIE Human Vision and Electronic Imaging VII, Symposium on Electronic Imaging, 4662. April, 2002.
166. Rahman, Z., Jobson, D. J., Woodell, G. A., & Hines, G. D. (2002b). Multi-Sensor Fusion and Enhancement Using the Retinex Image Enhancement Algorithm. Proceedings of SPIE Visual Information Processing XI, 4736. April, 2002.

141
167. Rahman, Z., Jobson, D. J., & Woodell, G. A. (2004a). Retinex Processing for Automatic Image Enhancement. Journal of Electronic Imaging. January, 2004.
168. Rahman, Z., Jobson, D. J., Woodell, G. A., & Hines, G. D. (2004b). Impact of Multi-scale Retinex Computation on Performance of Segmentation Algorithms. SPIE Defense and Security Symposium, April 2004.
169. Rahman, Z., Jobson, D. J., Woodell, G. A., & Hines, G. D. (2005). Image Enhancement, Image Quality, and Noise. Proceedings of SPIE Photonic Devices and Algorithms for Computing VII, 5907, April 2005.
170. Rahman, Z., Jobson, D. J., Woodell, G. A., & Hines, G. D. (2006). Automated, On-Board Terrain Analysis for Precision Landings. Proceedings of SPIE Visual Information Processing XIV, 6246. April 2006.
171. Rabus, B., Eineder, M., Roth, A, & Balmer, R. (2003). The Shuttle Radar Topography Mission –a New Class of Digital Elevation Models Acquired by Spaceborne Radar. Journal of Photogrammetry and Remote Sensing, 57: 241-262.
172. Rate, C. R., Probert, A., Wright, D., Corwin, W. H., & Royer, R. (1994). Subjective Results of a Simulator Evaluation Using Synthetic Terrain Imagery Presented on a Helmet-Mounted Display. SPIE Proceedings Helmet- and Head-Mounted Display and Symbology Design Requirements, Editors: Lewandowski, R.J., Stephens, W., and Haworth, L.A., Vol. 2218. April 1994, pp. 306-315
173. Rowley, N. M., & Mortimer, R. J. (2002). New Electrochromic Materials. Science Progress, September, 2002.
174. RTCA (1998). Standards for Processing Aeronautical Data. DO-200A, RTCA, September 1998.
175. RTCA (2000). Minimum Aviation System Performance Standards: Required Navigation Performance for Area Navigation. DO-236A, RTCA, September 2000.
176. RTCA (2001).Minimum Operational Performance Standards for Cockpit Display of Traffic Information. RTCA SC-186, WG-1. June 2001.
177. RTCA (2005). User Requirements for Aerodrome Mapping Data. Document DO-272A/ED-99A, RTCA/EUROCAE, July, 2005
178. RTCA (2005). User Requirements for Terrain and Obstacle Data. Document DO-276A/ED-98A, RTCA/EUROCAE, July, 2005.
179. SAE (2001). Society of Automotive Engineers (SAE) Aerospace Recommended Practice (ARP) for Transport Category Airplane Head-Up Display (HUD) Systems. ARP 5288. May 2001.
180. SAE (2005). Society for Automotive Engineers (SAE) Aerospace Recommended Practice (ARP) of Human Engineering Considerations for Design and Implementation of Perspective Flight Guidance Displays. ARP 5589. Jan., 2005.

142
181. Schiefele, J., Damjanovic, D., & Kubbat W. (2000). Certifiable Database Generation for SVS. SPIE Enhanced and Synthetic Vision 2000, April 2000.
182. Schiefele. J., Howland, D., Maris, J., & Wipplinger, P. (2003). Human Factors Flight Trial Analysis for 2D Situation Awareness and 3D Synthetic Vision Displays. Human Factors & Ergonomics Society Meeting, Oct. 2003.
183. Schnell, T., & Etherington, T. (2002a). Evaluation of Synthetic Vision Information Systems in the Simulator and in a Flight Test. AIAA Journal of Guidance, Control, and Dynamics, 2002.
184. Schnell, T., & Etherington, T. (2002b). Simulation and Field Testing of a Synthetic Vision Information System for Commercial Flight Decks. Proceedings of the 16th Biennial Symposium on Visibility and Simulation, June 2002.
185. Schnell T., Etherington, T., Vogl, T., & Postnikov, A. (2002a).Field Evaluation of a Synthetic Vision Information System onboard the NASA Aries 757 at Eagle County Regional Airport. Proceedings of 21st Digital Avionics Systems Conference, October 2002.
186. Schnell T., Kwon, Y., Merchant, S., Etherington, T., & Vogl, T. (2002b). Reduced Workload and Improved Situation Awareness in Flight Decks Equipped with Synthetic Vision Information System Displays. International Journal of Aviation Psychology, 2002.
187. Schnell, T., Lemos, K., & Etherington, T. (2002c). Terrain Sampling Density, Texture, and Shading Requirements for SVIS. Final Report to the Iowa Space Grant Consortium. December 2002.
188. Schnell, T., Lemos, K., Keller, M., Yang, S., & Gutierrez, F. (2003). Synthetic Vision Displays: Optimal Display Characteristics. University of Iowa Final Report, Sept. 2003.
189. Schnell, T., Kown, Y., Merchant, S., & Etherington, T. (2004). Improved Flight Technical Performance in Flight Decks Equipped with Synthetic Vision Information System Displays. International Journal of Aviation Psychology, 14, 79-102.
190. Sommer, R. W., & Dunhum Jr., R. E. (1969). Evaluation of a Contact-Analog Display in Landing Approaches with A Helicopter. NASA TND-5241, June, 1969.
191. Snow, M. P., & French, G. A., (2001). Human Factors In Head-Up Synthetic Vision Displays. Proceedings of the SAE 2001 World Aviation Safety Conference, pp. 2641-2652
192. Stark, J. M., Comstock, J. R., Prinzel, L. J., Burdette, D. W., & Scerbo, M. W. (2001). A Preliminary Examination of Pilot Performance and Situation Awareness within a Synthetic Vision. Human Factors & Ergonomics Society 2001 Meeting, Oct. 2001.
193. Stark, J. (2003). Investigating Display Integration in Candidate Synthetic Vision System Displays: Creating Endless VMC Conditions to Reduce Limited Visibility

143
Incidents in Commercial Aviation. Human Factors & Ergonomics Society 2003 Meeting, Oct. 2003.
194. Sturtevant, P., Masters, D., Axelrad, P., & Katzberg, S. (2003). GPS Based Bistatic Radar for Terrain Awareness - Methods and Preliminary Results. Institute of Navigation GPS/GNSS Conference, Sept. 2003.
195. Takallu, M. A., Wong, D. T, & Uenking M. D. (2002). Synthetic Vision Systems in GA Cockpit-Evaluation of Basic Maneuvers Performed by Low Time GA Pilots During Transition from VMC to IMC. International Advanced Aviation Conference, Aug. 2002.
196. Takallu, M. A., Wong, D. T., Bartolone, A. P., Hughes, M. F., & Glaab, L. J. (2004). Interaction between Various Terrain Portrayals and Guidance/Tunnel Symbology Concepts for General Aviation Synthetic Vision Displays during a Low En-Route Scenario. Proceeding of the 2004 Digital Avionics Systems Conference, Oct. 2004.
197. Tang, Y.L., & Kasturi, R. (1994). Accurate Estimation of Object Location in an Image Sequence Using Helicopter Flight Data. Robotics and Computer Integrated Manufacturing Journal, 11(2)65-72, 1994.
198. Tang, Y. L., & Kasturi, R. (1996). Tracking Moving Objects During Low Altitude Flight. Machine Vision and Applications Journal, 9(1):20-31, 1996.
199. Theunissen, E., Roefs, F. D., Rademaker, R. M., & Etherington, T. J. (2003). Integration of Information in Synthetic Vision Displays: Why, To What Extent and How? Human Factors & Ergonomics Society 2003 Meeting, Oct. 2003.
200. Thomas, R. J., & DiBenedetto, M. F. (2001). The Local Area Augmentation System: An Airport Surface Guidance Application Supporting the NASA Runway Incursion Prevention System Demonstration at the Dallas/Fort Worth International Airport. Proceedings of the 20th Digital Avionics Systems Conference, Oct. 2001.
201. Tiana, C. L. M., Kerr, J. R., & Harrah, S. D.(2001). Multispectral Uncooled Infrared Enhanced-Vision for Flight Test, Proceedings of SPIE Enhanced and Synthetic Vision 2001, Editor: Jacques G. Verly, Volume 4363, p. 231-236, Aug. 2001.
202. Timmerman, J. (2001). Runway Incursion Prevention System - ADS-B and DGPS Data Link Analysis, Dallas-Fort Worth International Airport. NASA CR-2001-211242, Nov. 2001.
203. Uenking, M. D., & Hughes, M. F (2002). The Efficacy of Using Synthetic Vision Terrain-Textured Images to Improve Pilot Situation Awareness. SAE World Aviation Congress and Display, Oct. 2002.
204. Uijt de Haag, M., Campbell, J., & Gray, R. (2000). A Terrain Database Integrity Monitor for Synthetic Vision Systems. Proceedings of the 19th Digital Avionics Systems Conference, Oct. 2000.

144
205. Uijt de Haag, M., Young, S., & Gray, R. (2000). DTED Integrity Monitoring Using Differential GPS and Radar Altimeter. International Association of Institutes of Navigation (IAIN) World Congress in Association with the U.S. Institute of Navigation (ION) Annual Meeting, June 2000.
206. Uijt de Haag, M., Sayre, J., Campbell, J., Young, S., & Gray, R. (2001a). Flight Test Results of a Synthetic Vision Elevation Database Integrity Monitor. SPIE 15th Annual International Symposium on Aerospace/Defense Sensing, Simulation, and Controls - AeroSense, April. 2001.
207. Uijt de Haag, M., Sayre, J., Campbell, J., Young, S., & Gray, R. (2001b). Terrain Database Integrity Monitoring for Synthetic Vision Systems. IEEE Transactions on Aerospace and Electronic Systems, Dec. 2001.
208. Uijt de Haag, M., Young, S., & Gray, R. (2001c). A Performance Evaluation of Elevation Database Integrity Monitors for Synthetic Vision Systems. 8th International Conference of Integrated Navigation Systems, May 2001.
209. Uijt de Haag, M., Thomas, R., & Rankin, J. (2002). Initial Flight Test Results of Ohio University's 3-Dimensional Cockpit Display of Traffic Information. 2002 IEEE Position Location and Navigation Symposium, April 2002.
210. Uijt de Haag, M., Young, S., Sayre, J., Campbell, J., & Vadlamani, A. (2002). DEM Integrity Monitor Experiment (DIME) Flight Test Results. Proceedings of SPIE Enhanced and Synthetic Vision 2002, edited by Jacques G. Verly, Vol. 4713, pp. 72-83, 2002.
211. Uijt de Haag, M., Young, S., & Campbell, J. (2004). An X-Band Radar Terrain Feature Detection Method for Low-Altitude SVS Operations and Calibration Using LiDAR. SPIE Defense and Security Symposium, April 12-16, 2004.
212. Uijt de Haag, M., Sayre, J., Campbell, J., Young, S., & Gray, R. (2005). Terrain Database Integrity Monitoring for Synthetic Vision Systems. IEEE Transactions on Aerospace and Electronic Systems, March, 2005.
213. Vadlamani, A., & Uijt de Haag, M. (2003). Improving the Detection Capability of Spatial Failure Modes Using Downward-Looking Sensors in Terrain Database Integrity Monitors. Proceedings of the 22nd Digital Avionics Systems Conference, Oct. 2003.
214. Vinande, E., Akos, D., Masters, D., Axelrad, P., & Esterhuizen, S. (2005). GPS Bistatic Radar Measurements of Aircraft Altitude and Ground Objects with a Software Receiver. Proceedings of the Institute of Navigation GPS/GNSS Conference, 2005.
215. Warner, D.A. (1979). Flight Path Displays. AFFDL-TR-79-3075, Wright Patterson AFB, OH.
216. Williams, D., Waller, M., Koelling, J., Burdette, D. W., Doyle, T., Capron, W., Barry, J., & Gifford, R. (2001). Concept of Operations for Commercial and Business Aircraft Synthetic Vision Systems, Version 1.0. NASA/TM-2001-211058, Dec. 2001.
145
217. Wong, D. T., Takallu, M. A., Hughes, M. F., Bartolone, A. P, & Glaab, L. J. (2004). Simulation Experiment for Developing the Symbology for the Approach and Missed Approach Phases of Flight of Head-Down Synthetic Vision Systems Displays. AIAA Modeling and Simulation Technologies Conference, Aug. 2004.
218. Woo, M., Neider, J., & Davis, T. (1997). OpenGL Programming Guide, Second Edition. Addison Wesley Developers Press.
219. Woodell, G. A., Jobson, D. J., Rahman, Z., & Hines, G. D. (2005). Enhancement of Imagery in Poor Visibility Conditions. Proceedings of SPIE Sensors, and Command, Control, Communications, and Intelligence (C3I) Technologies for Homeland Security and Homeland Defense IV, 5778. April 2005.
220. Woodell, G. A., Jobson, D. J., Rahman, Z., & Hines, G. D. (2006). Advanced Image Processing of Aerial Imagery. Proceedings of SPIE Visual Information Processing XIV, 6246. April 2006.
221. Yang, M.T., Gandhi, T., Kasturi, R., Coraor, L., Camps, O., & McCandless, J. (2000). Real-time Obstacle Detection System for High Speed Civil Transport Supersonic Aircraft. IEEE National Aerospace and Electronics Conference, Oct., 2000.
222. Yang, M.T.,; Gandhi, T., Kasturi, R., Coraor, L., Camps, O., & McCandless, J. (2002). Real-Time Implementation of Obstacle Detection Algorithms on a Datacube MaxPCI Architecture. Real Time Imaging Journal, 8(2), pages 157-172, Jan. 2002.
223. Yang, S., Schnell, T., & Lemos, K. (2003). Spatial Image Content Bandwidth Requirements for Synthetic Vision Displays. Proceedings of the 22th Digital Avionics Systems Conference, Oct. 2003.
224. Young, S. D., & Jones, D. R. (1998). Flight Testing of an Airport Surface Guidance, Navigation and Control System. Navigation 2000 Conference, Long Beach California, 21 Jan. 1998.
225. Young, S. D., & Jones, D. R. (1998). Flight Demonstration of Integrated Airport Surface Movement Technologies. NASA TM-1998-206283.
226. Young, S., & Jones, D. (2000). Runway Incursion Prevention Using an Advanced Surface Movement Guidance and Control System (A-SMGCS). Proceedings of the 19th Digital Avionics Systems Conference, Oct. 2000.
227. Young, S. (2001). On the Feasibility of In-Flight Autonomous Integrity Monitoring of Stored Geospatial Data using Forward-Looking Remote Sensing Technology. PhD Proposal, Ohio University, Oct. 2001.
228. Young, S., & Jones, D. (2001). Runway Incursion Prevention: A Technology Solution. International Air Safety Seminar, Nov.2001.
229. Young, S., Harrah, S., & Uijt de Haag, M. (2002). Real-time Integrity Monitoring of Stored Geo-spatial Data using Forward-looking Remote Sensing Technology. Proceeding of the 21st Digital Avionics Systems Conference, Oct. 2002.

146
230. Young, S., Uijt de Haag, M., & Sayre, J. (2003). Using X-band Weather Radar Measurements to Monitor the Integrity of Digital Elevation Models for Synthetic Vision Systems. Proceedings of SPIE 2003 AeroSense Conference, Enhanced and Synthetic Vision, Vol. 5081, edited by Jacques G. Verly, pp. 66-76.
231. Young, S., Uijt de Haag, M., & Campbell, J. (2004). An X-band Radar Terrain Feature Detection Method for Low-Altitude SVS Operations and Calibration Using LiDAR. SPIE Defense and Security Symposium, April 2004.
232. Young, S. (2005). On the Development of In-flight Autonomous Integrity Monitoring of Stored Geo-Spatial Data Using Forward-Looking Remote Sensing Technology. Ph.D. dissertation, Ohio University, March, 2005.
233. Young, S., Kakarlapudi, S., & Uijt de Haag, M. (2005). A Shadow Detection and Extraction Algorithm Using Digital Elevation Models and X-Band Weather Radar Measurements. International Journal of Remote Sensing, Vol. 26, No. 8, pp. 1531-1549, April 20, 2005.
234. Young, S., & Uijt de Haag, M. (2005). Detection of Digital Elevation Model Errors Using X-band Weather Radar. AIAA Journal of Aerospace Computing, Information, and Communication, July, 2005.

REPORT DOCUMENTATION PAGE Form ApprovedOMB No. 0704-0188
2. REPORT TYPE Technical Publication
4. TITLE AND SUBTITLEAspects of Synthetic Vision Display Systems and the Best Practices of the NASA’s SVS Project
5a. CONTRACT NUMBER
6. AUTHOR(S)
Parrish, Russell V.; Bailey, Randall E.; Kramer, Lynda J.; Jones, Denise R.; Young, Steven D.; Arthur, Jarvis J., III; Prinzel, Lawrence J., III; Harrah, Steven D.; and Glaab, Louis J.
7. PERFORMING ORGANIZATION NAME(S) AND ADDRESS(ES)NASA Langley Research Center Hampton, VA 23681-2199
9. SPONSORING/MONITORING AGENCY NAME(S) AND ADDRESS(ES)National Aeronautics and Space AdministrationWashington, DC 20546-0001
8. PERFORMING ORGANIZATION REPORT NUMBER
L-19422
10. SPONSOR/MONITOR'S ACRONYM(S)
NASA
13. SUPPLEMENTARY NOTESAn electronic version can be found at http://ntrs.nasa.gov
12. DISTRIBUTION/AVAILABILITY STATEMENTUnclassified - UnlimitedSubject Category 03Availability: NASA CASI (301) 621-0390
19a. NAME OF RESPONSIBLE PERSON
STI Help Desk (email: [email protected])
14. ABSTRACTNASA’s Synthetic Vision Systems (SVS) Project conducted research aimed at eliminating visibility-induced errors and low visibility conditions as causal factors in civil aircraft accidents while enabling the operational benefits of clear day flight operations regardless of actual outside visibility. SVS takes advantage of many enabling technologies to achieve this capability including, for example, the Global Positioning System (GPS), data links, radar, imaging sensors, geospatial databases, advanced display media and three dimensional video graphics processors. Integration of these technologies to achieve the SVS concept provides pilots with high-integrity information that improves situational awareness with respect to terrain, obstacles, traffic, and flight path. This paper attempts to emphasize the system aspects of SVS - true systems, rather than just terrain on a flight display - and to document from an historical viewpoint many of the best practices that evolved during the SVS Project from the perspective of some of the NASA researchers most heavily involved in its execution. The Integrated SVS Concepts are envisagements of what production-grade Synthetic Vision systems might, or perhaps should, be in order to provide the desired functional capabilities that eliminate low visibility as a causal factor to accidents and enable clear-day operational benefits regardless of visibility conditions.
15. SUBJECT TERMSAviation Safety; Controlled Flight Into Terrain; Database Integrity Monitoring; Head-up Display; Pathway; Runway Incursion Prevention; Synthetic Vision System; Terrain Awareness
18. NUMBER OF PAGES
16219b. TELEPHONE NUMBER (Include area code)
(301) 621-0390
a. REPORT
U
c. THIS PAGE
U
b. ABSTRACT
U
17. LIMITATION OF ABSTRACT
UU
Prescribed by ANSI Std. Z39.18Standard Form 298 (Rev. 8-98)
3. DATES COVERED (From - To)
5b. GRANT NUMBER
5c. PROGRAM ELEMENT NUMBER
5d. PROJECT NUMBER
5e. TASK NUMBER
5f. WORK UNIT NUMBER
609866.02.07.07.02
11. SPONSOR/MONITOR'S REPORT NUMBER(S)
NASA/TP-2008-215130
16. SECURITY CLASSIFICATION OF:
The public reporting burden for this collection of information is estimated to average 1 hour per response, including the time for reviewing instructions, searching existing data sources, gathering and maintaining the data needed, and completing and reviewing the collection of information. Send comments regarding this burden estimate or any other aspect of this collection of information, including suggestions for reducing this burden, to Department of Defense, Washington Headquarters Services, Directorate for Information Operations and Reports (0704-0188), 1215 Jefferson Davis Highway, Suite 1204, Arlington, VA 22202-4302. Respondents should be aware that notwithstanding any other provision of law, no person shall be subject to any penalty for failing to comply with a collection of information if it does not display a currently valid OMB control number.PLEASE DO NOT RETURN YOUR FORM TO THE ABOVE ADDRESS.
1. REPORT DATE (DD-MM-YYYY)05 - 200801-