Embed Size (px)
Citation preview

1
2016
Aspects of Plasminogen Activator Inhibitor 1 in
Metabolic Syndrome
Karin Mossberg

2
Aspects of Plasminogen Activator Inhibitor 1 in Metabolic Syndrome
ISBN 978-91-628-9766-6 (Print)ISBN 978-91-628-9767-3 (PDF)http://hdl.handle.net/2077/42346
© 2016 Karin [email protected]
Printed by Kompendiet, Gothenburg, Sweden 2016

3
“Phantasie ist wich ger als Wissen denn das Wissen begrenzt ist” Albert Einstein
To my family

4
5
ABSTRACT
Plasminogen activator inhibitor 1 (PAI-1) is the main inhibitor of the fi brinolytic system and binds irreversibly to tissue-type plasminogen activator (t-PA), and thereby inhibits the protective action of t-PA against thrombus formation. Elevated levels of plasma PAI-1 is observed in subjects with type 2 diabetes (T2D) and the metabolic syndrome (MetS), which is a combination of metabolic features including obesity. PAI-1 has become recog-nized as a central molecule linking the MetS and thrombotic vascular events. However, the origin of plasma PAI-1 is not fully established in these conditions. The aim of this thesis was to investigate the role of platelet PAI-1 and source of plasma PAI-1 in T2D, obesity and healthy subjects.
Our group has previously shown that platelets can de novo synthesize PAI-1 and the amount synthesized in vitro in 24 hours is 35-fold higher than required to maintain nor-mal plasma levels. Therefore we wanted to investigate if platelets are the cellular origin of plasma PAI-1. Tissue-specifi c glycosylation patterns on PAI-1 from different tissues were determined. The results indicate that platelets are the source of plasma PAI-1, since no glycans were detected on PAI-1 isolated from plasma or platelets from healthy lean subjects. PAI-1 isolated from the other tissues expressed heterogeneous glycosylation patterns.
In obese subjects plasma PAI-1 had a glycan composition similar to that of adipose tissue suggesting that obese subjects, with elevated PAI-1 levels, may have an additional con-tribution from adipose tissue. Since glycosylated PAI-1, in comparison to unglycosylated forms, exhibit a lower inactivation rate and a stronger inhibitory effect, we also studied the level of glycosylated plasma PAI-1 in obesity. This was increased in obese subjects by 54% compared to lean subjects and a weak but signifi cant correlation between the level of glycosylation and BMI was observed. These results suggest that an elevated level of glycosylated plasma PAI-1 is an important contributor to the increased risk of cardiovas-cular events associated with increased plasma PAI-1 levels in obese subjects.
Diabetic platelets are known to be hyper-reactive and larger in size; however, whether these features affect their contribution to the elevated levels of plasma PAI-1 in T2D is unknown. To elucidate the role of platelet PAI-1 in T2D, we characterized the PAI-1 antigen content and the mRNA expression in platelets from T2D subjects compared to both obese and lean control subjects. In order to analyze the mRNA content in platelets, reference genes to normalize for qPCR were identifi ed and YWHAE was the most stable transcript in platelets. Furthermore, there was no signifi cant difference in PAI-1 mRNA expression or PAI-1 antigen in platelets comparing the three groups, but an elevated level of plasma PAI-1 was seen in both T2D and obese control subject, indicating an un-effected role of platelets.
In conclusion, in balanced physiological conditions, platelets may be the major source of plasma PAI-1, however, the platelet contribution seems less important for the increased plasma levels and hence the risk of cardiovascular events in MetS and T2D.
Keywords: PAI-1, metabolic syndrome, obesity, type 2 diabetes, cardiovascular disease, fi brinolysis, thrombi, plasma, platelets, adipose tissue, mRNA, qPCR, reference gene
ISBN 978-91-628-9766-6 (Print) http://hdl.handle.net/2077/42346ISBN 978-91-628-9767-3 (PDF)

6
LIST OF ORIGINAL PAPERS
This thesis is based on the following papers, which will be referred to in the text by their roman numerals:
I Brogren H, Sihlbom C, Wallmark* K, Lönn M, Deinum J, Karlsson L, Jern S. Heterogeneous glycosylation patterns of human PAI 1 may reveal its cellular origin.
Thromb Res. 2008;122:271-281.
II Mossberg KE, Nilsson J, Sihlbom C, Larson G, Jern S, Brogren H. Increased glycosylation of plasma Plasminogen Activator Inhibitor 1 in obesity.
In manuscript.
III Mossberg KE, Svensson PA, Gidlöf O, Erlinge D, Jern S, Brogren H. Normal-ization of qPCR in platelets – YWHAE a potential generic reference gene.
Platelets. 2016. DOI: 10.1080/09537104.2016.1180349. In Press
IV Mossberg KE, Olausson J, Fryk E, Jern S, Jansson PA, Brogren H. The Role of the Platelet Pool of Plasminogen Activator Inhibitor 1 in type 2 diabetes.
In manuscript.
*Paper published under the previous family name Wallmark
7
LIST OF RELATED PAPERS
Additional peer-reviwed papers, not included in the thesis:
- Mossberg KE, Pournaras DJ, Welbourn R, le Roux CW, Brogren H. Differen-tial response of plasma Plasminogen Activator Inhibitor-1 after Weight Loss Surgery in patients with or without Type 2 Diabetes.
SOARD. 2016. dx.doi.org/10.1016/j.soard.2016.03.007 In press.
- Brogren H, Wallmark* K, Deinum J, Karlsson L, Jern S. Platelets retain high levels of active plasminogen activator inhibitor 1.
PLoS One. 2011;6(11):e26762.
- Brogren H, Wallmark* K, Jern S, Karlsson L. Plasminogen activator inhibitor 1 expression in platelets is not infl uenced by the 4G/5G promoter polymor-phism.
Thromb Res. 2008;121(6):793-7.
*Papers published under the previous family name Wallmark

8
POPULÄRVETENSKAPLIG SAMMANFATTNING
Hjärtkärlsjukdomar är idag den vanligaste dödsorsaken i västvärlden. Detta är ett re-sultat av bl a ett utbrett stillasittande och ett kraftigt ökat kaloriintag. En annan effekt av denna livsstil är en lavinartad ökning av det metabola syndromet, vilket är ett tillstånd som innefattar ökad bukfetma, högt blodtryck, förhöjd insulinkänslighet och höga blodfetter. Alla dessa egenskaper ökar risken för hjärtkärlsjukdomar och kan i värsta fall leda till döden. Exempelvis är risken att drabbas av en hjärtinfarkt tre till fem gånger större hos individer med metabolt syndrom och typ 2 diabetes, jämfört med en frisk individ. Med tanke på de stora konsekvenserna, är det av stor vikt att förstå och kartlägga orsakerna till den ökade risken för hjärtkärlsjukdomar i det me-tabola syndromet.
Blodet i kroppen strävar efter att vara i balans. Om det är för tjockt kommer blodprop-par att uppstå, men om det och andra sidan är för tunt uppkommer blödningar. Om en kärlskada sker, fäster blodplättar eller trombocyter som det också heter, i kärlväggen och till varandra. Kroppens koagulationskaskad aktiveras samtidigt och formar ett nätverk av fi brin, där trombocyterna också kan fästa. På detta sätt bildas en blodpropp. Kroppens eget proppupplösningssystem, fi brinolysen, kommer att lösa upp proppen när kärlskadan har läkt. Vid åderförkalkning i blodkärlen, vilket är vanligt vid ex-empelvis högt blodtryck, höga blodfetter och hög ålder, kommer infl ammationscel-ler och fett lagras i kärlväggarna. Om det innersta lagret av kärlväggen spricker och inlagrat fett exponeras för blodet, fäster trombocyter och det bildas en blodpropp. En hjärtinfarkt uppstår om hjärtats blodkärl drabbas av en propp som är så stor att blod-fl ödet hindras helt. Omkringliggande vävnad, i detta fall hjärtmuskeln, får syrebrist och vävnaden kan dö om syrebristen varar för länge. Plasminogen activator inhibitor 1 (PAI-1) är ett protein i blodet som hindrar fi brinolysen från att lösa upp blodprop-par. Vid metabolt syndrom och typ 2 diabetes har man observerat ökade nivåer av PAI-1 i blodet eller plasma, vilket alltså förhindrar kroppen från att spontant lösa upp blodproppar som uppkommer i kärlen och därmed ökar risken för hjärtkärlsjukdomar. Man vet också att trombocyterna innehåller mycket PAI-1 och kan frisätta detta i blo-det. Syftet med denna avhandling var att undersöka var PAI-1 i plasma kommer ifrån hos friska individer, samt hos individer med fetma och typ 2 diabetes.
Först undersöktes vilket som är källan till PAI-1 i blodet hos friska individer. Det är generellt svårt att ta reda på var plasmaproteiner kommer ifrån, men ett sätt är att analysera glykosylering, vilket innebär att studera sockermolekyler som fi nns på pro-teinet. Därför undersöktes om PAI-1 har olika mönster av glykosylering, som skulle kunna fungera som ett ”fi ngeravtryck” för att avslöja källan. PAI-1 från lever, fettväv, blodkärl, vita blodkroppar och trombocyter, som alla är möjliga källor, undersöktes och jämfördes med PAI-1 från plasma. PAI-1 från trombocyter och plasma var inte glykosylerat, medan PAI-1 från alla de andra vävnaderna uppvisade ett olikartat sock-ermönster. Detta fynd talar för att trombocyterna skulle kunna vara källan till plasma PAI-1 hos friska, normalviktiga individer.
Eftersom nivåerna av PAI-1 i plasma är förhöjda hos individer med fetma, har det spekulerats i om PAI-1 hos dessa individer kommer från fettväven. Följaktligen ob-serverades sockermönstret på PAI-1 från fettväv och detta jämfördes med PAI-1 i

9
plasma från individer med fetma. Det visade sig att de sockermolekyler som hittades på plasma PAI-1 från individer med fetma, även återfanns i stor utsträckning på PAI-1 från fettväv. Tidigare studier har visat att proteiner som har sockermolekyler på sig kan ha ändrade egenskaper och vidare har man konstaterat att glykosylerat PAI-1 har en starkare effekt i att förhindra blodproppar från att lösa upp sig i blodet. Därför undersöktes också i vilken utsträckning PAI-1 i plasma från individer med fetma var glykosylerat. Intressant nog observerades en dubbel ökning av graden av glykosyle-ring av plasma PAI-1 hos kraftigt överviktiga individer jämfört med normalviktiga. Dessa fynd visar att fettväven kan vara källan till de ökade nivåerna av plasma PAI-1 i fetma, men också att den ökade graden av glykosylering kan bidra ytterligare till att PAI-1 motverkar kroppens förmåga att lösa upp blodproppar vid hjärtkärlhändelser.
Tidigare studier har visat att trombocyter hos individer med typ 2 diabetes är mer reaktiva och större i storlek, jämfört med friska individer. Innehållet av PAI-1 i trom-bocyterna undersöktes från individer med fetma och typ 2 diabetes och jämfördes med normalviktiga och kraftigt överviktiga kontrollindivider. För att kunna göra detta vidareutvecklades först en metod för att observera innehållet av PAI-1 på genetisk nivå i trombocyterna. Resultaten visade att det inte fanns någon skillnad i innehåll av PAI-1, varken på protein- eller genetisk nivå, i trombocyterna från de tre grupperna. Men som väntat var plasma PAI-1 förhöjt i typ 2 diabetes och fetma jämfört med de normalviktiga individerna. Dessa fynd talar för att det är en annan källa än trombocy-terna som bidrar till de höga nivåerna av plasma PAI-1 i typ 2 diabetes.
Sammantaget visar resultaten i denna avhandling att hos friska individer är det troligt att källan till plasma PAI-1 är trombocyterna. Att ha förhöjda nivåer av PAI-1 i blo-det, så som vid det metabola syndromet och typ 2 diabetes, ökar risken att drabbas av hjärtkärlsjukdomar. Hos dessa individer verkar de ökade nivåerna av PAI-1 i blodet komma från en annan vävnad, där fettväv är en trolig källa.

10
CONTENTS
ABSTRACT 5
LIST OF ORIGINAL PAPERS 6
LIST OF RELATED PAPERS 7
POPULÄRVETENSKAPLIG SAMMANFATTNING 8
ABBREVIATIONS 12
INTRODUCTION 15 Thrombosis 15 Clot dissolution 15 PAI-1 16 PAI-1 and thrombosis 17 PAI-1 and platelets 17 PAI-1 and MetS 18
AIMS 20
MATERIALS AND METHODS 21 Subjects 21 Preparation of cells and lysates 21 Preparation of platelets, plasma and serum 21 Preparation and incubation of adipose tissue 22 Preparation and culturing of human umbilical vein endothelial cells 23 Preparation and culturing of monocytes/macrophages 23 Preparation and incubation of hepatocytes 23 Preparation of megakaryocytes 23 Chemical analysis 24 Preparation of RNA 24 Analyzing techniques - principle and method 24 Mass spectrometry 24 Glycoprotein specifi c staining 26 Enzyme-linked immunosorbent assay (ELISA) 28 Microarray hybridization - transcription profi ling 28 Quantitative reverse transcriptase real-time PCR (qPCR) 28 Multiplate analysis 29 Statistical methods 30
RESULTS AND COMMENTS ON METHODOLOGY 31 Study I and II - Patterns and levels of PAI-1 glycosylation 31 Detection of PAI-1 by mass spectrometry 31 Glycosylation patterns on PAI-1 from different sources 31 Glycosylation of plasma PAI-1 in obese subjects 34

11
Study III and IV - The role of platelet PAI-1 in T2D 37 Identifi cation of stable genes in platelets 37 Confi rmation of the candidate genes by qPCR 38 Confi rmation of the candidate genes by miRNA experiments 39 Characterization of the platelet pool of PAI-1 in T2D 41
PATHOPHYSIOLOGICAL DISCUSSION AND CONCLUSION 45 The source of plasma PAI-1 in healthy individuals 45 The source of plasma PAI-1 in obesity 45 The source of plasma PAI-1 in T2D 46
ACKNOWLEDGEMENTS 48
REFERENCES 50
PAPER I-IV

12
ABBREVIATIONS
ACD acid citrate dextrose ADP adenosine diphosphateASA acetylsalicylic acidASPI arachidonic acidB2M beta-2-microglobulinBMI body mass indexcDNA complementary DNACID collision induced dissociationCHO chinese hamster ovaryCT threshold cycleCVD cardiovascular diseaseELISA enzyme-linked immunosorbent assayGAPDH glyceraldehyde 3-phosphate dehydrogenaseGM-CSF granulocyte monocyte colony stimulating factorGLP-1 glucagon-like protein-1H3F3A H3 histone, family 3AHCD high-energy collision dissociationHUVEC human umbilical vein endothelial cellsICR ion cyclotron resonanceITM2B integral membrane protein 2BkDa kilo daltonMetS metabolic syndromemiRNA micro RNAmRNA messenger RNAMPV mean platelet volumeMS mass spectrometryMW molecular weightNSAIDs non-steroid anti-infl ammatory drugsNYHA II New York association functional classifi cation IIPAI-1 plasminogen activator inhibitor 1PBMCs peripheral blood mononuclear cells PF4V1 platelet factor 4, variant 1PGE1 prostaglandin E1 PIPES 1,4-piperazinediethanesulfonic acidPPIA peptidylprolyl isomerase A

13
PRP platelet-rich plasmaqPCR quantitative polymerase chain reactionRN18S1 18S ribosomal 1SDS sodium dodecyl sulphateSERPIN serine protease inhibitorSFLLRN PAR receptor agonistsFSH serum follicle stimulating hormonesiRNA short interfering RNAT2D type 2 diabetes TGF-ß transforming growth factor betat-PA tissue-type plasminogen activatorTRAP-6 thrombin receptor activating peptide 6YWHAE tyrosine 3-monooxygenase/tryptophan 5-monooxygenase activation protein

14

15
INTRODUCTION
T he major cause of morbidity and mortality in the Western world is cardiovascular disease (CVD) [1]. Our modern western lifestyle has caused this harmful evo-
lution. The metabolic syndrome (MetS), as a result of the newly adopted lifestyle, is a combination of metabolic and clinical features that includes abdominal obesity, insulin resistance and impaired glucose tolerance, hypertension, and atherogenic dys-lipidemia [2]. The defi nition of MetS has been widely debated and revisions have been made throughout the years. Despite variations in defi nition, however, an alarm-ing increase in prevalence has been observed according to international and Swedish reports [3-8]. The features of MetS are strongly associated with CVD and mortality [7, 9-11]. For instance the risk of suffering a myocardial infarction is three to fi ve-folds higher in MetS including type 2 diabetes (T2D), compared to healthy subjects [12, 13]. Cardiovascular events in the MetS and T2D are indeed becoming a health concern worldwide [14-17]. Given this massive impact on global health, it is of major importance to elucidate the underlying mechanisms of the increased risk of thrombo-sis in MetS, in order to fi nd means to reduce cardiovascular events.
Thrombosis
Thrombi are formed on atherosclerotic plaques under conditions of high blood fl ow and are mainly composed of aggregated platelets [18]. Thrombosis over plaques oc-curs either when the subendothelial connective tissue is exposed or if the plaque is disrupted causing an exposed lipid core. Both events trigger an enhanced infl amma-tory process within the plaque. The formation of the clots activates the coagulation cascade that stabilizes the clot by creating a fi brin network [19]. If not restricted, the clot will grow to occlude the lumen of the vessel and obstruct normal circulation that eventually causes hypoxia in the supplied tissue. This may result in reduced function or even death of the tissue.
Clot dissolution
When a blood clot is formed, either as a response to traumatic vascular injury or in relation to an atherosclerotic plaque, the fi brinolytic system is immediately activated to prevent intraluminal clot growth and vessel occlusion. The fi brinolytic system is ultimately responsible for lysis of blood clots and restriction of thrombus propagation beyond the site of injury [20]. Thereby fi brinolysis acts as a counteracting system to coagulation. The effi cacy to the fi brinolytic system is illustrated by the fact that spontaneous reperfusion occurs in about 30% of patients suffering from myocardial infarction [21, 22]. The key factor of the fi brinolytic process is the local release of tissue-type plasminogen activator (t-PA) from the endothelial cells that facilitates the conversion of the inactive precursor plasminogen into plasmin, which in turns de-grades the blood clot by cleaving the fi brin network (Figure 1) [23-25]. The fi brino-lytic system is regulated at several levels to prevent premature and/or excessive deg-radation, most importantly by specifi c serine protease inhibitors (serpins). The main inhibitor of t-PA is plasminogen activator inhibitor 1 (PAI-1) which is the subject of this thesis [26-28].

16
PAI-1
The role of PAI-1 is to inhibit the dissolution of blood clots by inhibiting the en-zymatic activity of t-PA. At an intravascular level, PAI-1 is present in blood at low concentrations, approximately 10-20 ng/ml [20, 29]. It is widely distributed in tissues and synthesized in a variety of cells in vitro [30, 31]. However, the source of plasma PAI-1 has been enigmatic, but endothelial cells, adipose tissue, liver, macrophages and platelets have been considered the most likely sources [32].
The PAI-1 gene consists of eight introns and nine exons and is encoded on chro-mosome 7, distributed over approximately 12.3 kb DNA [33]. The regulation of the translation of the PAI-1 gene is not fully understood. The promotor has been investi-gated and its expression is controlled by a variety of signals, cytokines, mechanical and physical stresses [34]. For instance, metabolic factors such as increased levels of plasma glucose and hypertriglyceridemia activate the PAI-1 gene [35-38]. In addi-tion, the promotor contains a common polymorphism consisting of a single base pair insertion/deletion (4G or 5G), but it has been debated whether it is of importance for PAI-1 synthesis or not [39-42]. It appears to be of less signifi cance, however, since the average PAI-1 mRNA levels in platelets from healthy young men were similar among the two genotypes [43].
PAI-1 is a single chain protein and has a molecular weight of ~45 kDa. The mature protein consists of 379 amino acids. PAI-1 belongs to the serpine superfamily; which all share the common feature of a reactive center that mimics the natural substrate [44]. t-PA and PAI-1 form a ~110 kDa stoichiometric 1:1 stable complex and the
t PA PAI 1
Plasminogen Plasmin
FibrinFibrindegradationproducts
Endothelium
Figure 1. Schematic presentation of the intravascular fi brinolytic system. When a clot is formed, factors from the clotting process stimulate a rapid secretion of tPA from the endothelial cells. tPA cleaves the pro-enzyme plasminogen to plasmin, which in turn degrades the fi brin mesh of the clot and resolves the clot. The main inhibitor of the fi brinolytic system, PAI-1, irrevers-ibly binds to t-PA, and thereby inhibits the protective action of tPA against thrombus formation.

17
inactivation of t-PA by PAI-1 is remarkably rapid [45-51]. PAI-1 occurs both in an active and a latent form in vivo, but it is always synthesized in the active from that has the ability to bind and inhibit t-PA [52-54]. The active PAI-1 molecule is spontane-ously inactivated with a half-life of ~1-2 hours in plasma at physiological temperature (37˚C) and pH (7.4), although in lower temperature and pH the half-life is prolonged [55-57]. In plasma, PAI-1 binds to vitronectin, which stabilizes the active form of PAI-1 and extends its half-life [58-60].
The biological properties of a protein may change upon glycosylation and glycosyl-ated PAI-1 has a 2.3-fold stronger inhibitory effect on t-PA and a lower inactivation rate than non-glycosylated [61, 62]. PAI-1 has three potential glycosylation sites for N-linked glycosylation; N232, N288 and N353 [63]. Heterogeneous glycosylation patterns have been observed on two of these three sites (N232 and N288) on human PAI-1 expressed naturally or recombinantly by human cell lines [61].
PAI-1 and thrombosis
It has been known for decades that a decreased fi brinolytic activity is related to throm-botic events. The important function of PAI-1 in the fi brinolytic cascade was observed in the 1990s, ten years after its discovery [64-66]. The signifi cance of PAI-1 in throm-bosis has been demonstrated in several studies. Defi ciency or absence of PAI-1 causes bleeding and accelerated fi brinolysis in both humans and PAI-1 knock-out mice [64, 67]. Conversely, transgenic mice that over-express active PAI-1 have an increased risk of spontaneous thrombi and the rate of progression of thrombus formation fol-lowing vascular injury is prolonged [68-70]. In addition, arterial thrombi contain 2-3 fold more PAI-1 than venous thrombi [71, 72]. Several epidemiological studies have shown an association of raised plasma PAI-1 levels with an increased risk of cardio-vascular events [73-75].
The exact mechanism of PAI-1 in atherosclerotic disease is not completely under-stood. It may play an important role by promoting vascular atherosclerosis and throm-bosis [76, 77]. Increased PAI-1 expression in atherosclerotic lesions strongly suggests a primary role of PAI-1 in the atherogenic process [78-80]. However, experimental studies have shown diverging results, both promotive and preventive properties of PAI-1 on atherosclerosis [81, 82]. The complex vascular function of PAI-1 may de-pend on the presence of fi brin. For instance, PAI-1 may stabilize fi brin in case of a vascular injury and fi brin formation [83]. Conversely, in absence of fi brin, PAI-1 may inhibit cell migration within the vascular wall and thereby inhibit formation of intimal hyperplasia that promotes atherosclerotic plaque rupture [84].
PAI-1 and platelets
Platelets are anucleate cytoplasts primarily formed in the bone marrow by fragmen-tation of the cytoplasm of megakaryocytes [85]. They circulate in the blood stream in a concentration of 150-400 x 109/L for approximately 10 days [86]. There are dif-ferent types of granules in the platelets cytoplasm of which α-granules are the most abundant. They contain a vast number of biologically active molecules crucial for platelet function; including growth factors, cytokine-like proteins, adhesion proteins
18
and components of coagulation and fi brinolysis [87]. Upon activation, platelets se-crete the contents of the granules. Furthermore, it is now evident that platelets are able to synthesize proteins, despite the fact that they lack nuclei. As early as in 1967, megakaryocytic-derived translationally active mRNAs were observed in platelets, and later the machinery to translate it into proteins (i.e. rough endoplasmic reticulum and polyribosomes) was discovered in platelets [88-92]. In 1998, regulated synthesis of a specifi c protein (Blc-3) was discovered in platelets [93]. The nature of the platelet transcriptome has been widely studied during the last decade and platelets express some 2,300 transcripts [94-97]. However, the regulation of translation of proteins in platelets is not completely understood. The levels of mRNA transcripts in platelets are mainly determined by the amount of mRNA derived from the megakaryocytes when the platelets are formed, as platelets are anucleated and the pool of mRNA transcripts degrades over time [98]. There is even some evidence of active sorting of transcripts into platelets by megakaryocytes [99]. Moreover, platelets are uniquely able to splice pre-mRNA into mature mRNA by a functional spliceosome located in the cytoplasm and thereby increase the level of mature mRNA [100]. Furthermore, human platelets contain an abundant and diverse array of microRNAs (miRNA), which are a class ~22 nucleotide RNAs that regulate protein-coding genes primarily by repressing gene expression either by mRNA degradation or translational repression [101-107]. In ad-dition to functional miRNA transcripts, platelets also contain the machinery to process pre-miRNA into mature miRNA [108, 109].
The physiological signifi cance of platelet PAI-1 has been widely debated. Most stud-ies have shown that the vast majority of platelet PAI-1 is inactive and unable to inhibit fi brinolysis [20, 29, 110, 111]. However, platelets harbor approximately 90% of the circulating PAI-1 in blood and there is a strong correlation between the relative PAI-1 content in platelets and the resistance to thrombolysis [58, 110, 112-114]. Recently, is has been demonstrated that platelets contain PAI-1 mRNA and that they synthesize large amounts of active PAI-1 [115]. Preparatory procedures may have led to under-estimation of platelet PAI-1 activity in most previously reported studies [116]. This information may be of importance in order to be able to elucidate the source of plasma PAI-1 in healthy subjects.
PAI-1 and MetS
Emerging evidence has suggested PAI-1 as a key link between the MetS and cardio-vascular events [12, 117]. The most well-known hemostatic disturbance in individuals with MetS is fi brinolytic impairment defi ned by dramatically elevated plasma PAI-1 levels, which mediates the risk of vascular thrombotic events [118-120]. PAI-1 is even a strong predictor of myocardial infarction; however, the predictive ability of PAI-1 in epidemiological studies is reduced after adjusting for markers of the MetS [121-124]. Taken together, PAI-1 is a true component of the MetS and indeed an attractive target for future intervention strategies [125, 126].
Obesity is associated to elevated levels of PAI-1 in clinical studies [127], and plasma PAI-1 levels are reduced by removal of adipose tissue either by dieting, surgically resected or bariatric surgery [128-132]. Although the association of PAI-1 and obesity

19
is well established, the mechanisms of elevated plasma PAI-1 levels are complex and it is uncertain whether observed associations are correlative or causative [125]. PAI-1 has also been implicated in adipose tissue development but its exact role here is con-troversial [127]. However, it has been suggested that PAI-1 controls the recruitment of infl ammatory cells in adipose tissue, infl uences the insulin signaling and affects adipose differentiation [121]. Adipose tissue is an active organ with capacity to syn-thesize and secrete proinfl ammatory adipokines, including PAI-1 [133, 134]. Elevated infl ammatory cytokines in obesity may induce PAI-1 overexpression, subsequently associated with an impaired fi brinolysis [127, 135, 136]. Reduced fi brinolytic activity observed in thrombi formation in obese mice supports an association between obesity and a pro-thrombotic state [137].
Epidemiological studies have demonstrated that T2D is related to PAI-1 independent-ly of established diabetes risk factors [138]. Results from a cohort of healthy non-di-abetic subjects revealed that raised plasma PAI-1 levels at baseline were signifi cantly predictive of incident diabetes over 5 years of follow-up and increasing levels over time were associated with progression of incident T2D [139, 140]. Thus, circulating levels of PAI-1 predict development of T2D in healthy individuals regardless of com-mon diabetes risk factors [141]. Although the specifi c link between PAI-1 and T2D has not been completely clarifi ed, it is known that elevated levels of PAI-1 in T2D correlate with diabetic vascular complications [76]. Clinical studies have reported that reducing blood glucose by an insulin-sensitizing strategy reduces circulation PAI-1 and lowers progression of T2D development [142].

20
AIMS
The overall objective of this thesis was to study the physiological signifi cance and source of PAI-1 in the MetS and the specifi c aims were:
- to investigate if tissue-specifi c glycosylation patterns can reveal the origin of plasma PAI-1
- to investigate if the level of glycosylation differs in obese subjects compared to lean subjects
- to identify stable reference genes for normalization of qPCR in platelets
- to investigate the role of PAI-1 in T2D by characterization of platelet PAI-1 an-tigen and PAI-1 mRNA expression

21
MATERIALS AND METHODS
Subjects
Blood samples for isolation of plasma and platelets were collected from subjects with platelet counts of 150-350 x 109/L. Both males and females were recruited; lean or with obesity (BMI˃30) and/or T2D. Due to diurnal variation of plasma PAI-1, sam-ples were collected between 08:30 and 10:00 a.m. [143]. All participants had been advised not to take acetylsalicylic acid (ASA) or non-steroid anti-infl ammatory drugs (NSAIDs) 10 days prior to blood sampling. In addition, they were asked to avoid exercise and alcoholic drinks 48h prior to the visit, eat a light meal the day before the visit and stay fasting after mid-night.
In study IV blood samples were collected only from postmenopausal women, de-fi ned as serum follicle stimulating hormone (s-FSH) >26 mU/L, as there are varia-tions of plasma PAI-1 levels during the menstrual cycle [144, 145]. Exclusion criteria were signifi cant cardiovascular disease (ischemic heart disease or heart failure equal to NYHA II) not including hypertension with mono therapy; smoking; signifi cant complications from T2D; treatment with glucagon-like protein-1 (GLP-1) agonists, insulin, beta blockers, glitazones, or dipeptidyl peptidase-4 inhibitors; hematologi-cal diseases or bleeding disorders; and other concomitant disease or complications of signifi cance as determined by medical history, physical examinations or screening laboratory evaluations. Medical treatment was withdrawn 10 days prior to the visits and the subjects were attending an extra visit three to four days prior to the visit to register fasting plasma glucose and blood pressure.
According to the Helsinki declaration, all participants signed a written informed con-sent prior to participation. The protocols were approved by the Ethical Committee at the University of Gothenburg.
Preparation of cells and lysates
Preparation of platelets, plasma and serum Blood was drawn using no stasis through butterfl y needles into syringes containing acid citrate dextrose (ACD) and prostaglandin E1 (PGE1), to minimize platelet activa-tion during sampling. Platelet-rich plasma (PRP) was prepared by centrifugation at 150 x g for 20 min. After re-centrifugation at 150 x g for 10 min the PRP was pelleted at 800 x g for 15 min. Plasma was removed and the platelet pellet was re-suspended in Pipes/saline/glucose buffer containing PGE1. Finally, platelets were pelleted (800 x g, 15 min), the supernatant was discarded and pelleted platelets were immediately used for subsequent preparations and analysis. In addition, for studies of reference genes in platelets, large amounts of mRNA had to be obtained. Therefore platelets were collected from blood donors at the Blood Center, Sahlgrenska University Hospital, Gothenburg, Sweden. Platelet-rich buffy coat was produced from whole blood from four healthy donors by component manufacture, where after four buffy coats were pooled in platelet medium (NaCitrate, NaCl, NaAc, pH 7.2). Platelet concentration was 515-905 x 109/L. Pooled platelets were either activated or inhibited. Activated

22
platelets were initially pelleted at 800 x g for 15 min and re-suspended in Pipes/saline/glucose buffer containing PGE1. Finally, platelets were pelleted (800 x g, 15 min), the supernatant was discarded and pelleted platelets were immediately incubated in M199 without phenol red (Sigma) for 0, 24 and 48 hours in three different activation conditions; initially inhibited by 100 nM PGE1 and activated after 6 hours, activated by 25 μM PAR receptor agonist SFLLRN (Bachem) or in M199 without phenol red only. Inhibited platelets were kept inhibited in medium (NaCitrate, NaCl, NaAc, pH 7.2) from the Blood Center for 0, 24, and 48 hours. After incubation, platelets were pelleted (800 x g, 15 min), the supernatant was discarded and pelleted platelets were immediately used for subsequent preparations and analysis.
Plasma, which was removed after pelleting the platelets, was re-centrifuged at 2000 x g for 20 min to remove residual platelets. For analysis of plasma PAI-1, in which no platelets were collected, blood was drawn in 0.129 M citrate and centrifuged at 2000 x g for 20 min, plasma was collected and stored at -80˚C until analysis. For preparation of serum, blood was drawn in SST™-tubes, centrifuged at 2000 x g for 20 min at 4˚C. Serum was collected and stored at -80˚C until analysis.
Platelets were lysed to enable analysis of PAI-1 content. PRP was centrifuged at 2000 x g for 20 min and subsequently re-suspended in lysis buffer (0.1% Triton® X-100 (Roche Diagnostics GmbH), 1% bovine serum albumin (BSA) (Sigma-Aldrich) in phosphate buffered saline (PBS) (Lonza) at pH 7.4). After lysis for 30 minutes on ice the platelet lysate was centrifuged at 10 000 x g for 10 min at 4˚C to remove cell debris. The supernatant of platelet lysate was diluted 1:10 in 1% BSA in PBS prior to protein analysis.
Methodological considerations: In studies analyzing platelet mRNA it is of impor-tance to evaluate the leukocyte contamination, as the relatively high amount of RNA in leukocytes potentially could interfere with the outcomes. To ensure that the analy-sis of mRNA represents platelet mRNA, the number of leukocytes has to be kept at minimum. It has previously been presented that less than three-fi ve leukocytes per 105 platelets may be considered to be below interfering leukocyte RNA levels [95]. The preparation methods of platelets used in these studies have carefully been evaluated and have resulted in minimal leucocyte contamination [115]. Leukocytes were elimi-nated by fi ltration in platelets collected at the blood center and the contamination rate was 1 leukocyte per 25 million platelets at the most.
Preparation and incubation of adipose tissueFor studies of adipose tissue PAI-1 glycosylation, omental adipose tissue was obtained from three obese women (20, 25, and 46 years old) undergoing laparoscopic gastric by-pass. Their BMIs were 31.7, 41.5, and 34.9 kg/m2 respectively. Blood vessels and connective tissue were removed and 500 mg tissue was incubated in Medium 199 with Hank´s salts (Gibco), supplemented with 30 mM NaHCO3, 1% human serum albumin (Immuno AG), 150 mM adenosine, 7175 pM insulin (Novo Nordisk), and 0.1 mg/mL cephalothin (Lilly France), during 1-3 days and the medium was changed daily [146]. In total, 150-300 ml conditioned medium from each of the three incuba-tions were collected.

23
Preparation and culturing of human umbilical vein endothelial cellsFresh umbilical cords were obtained from the maternity ward, Sahlgrenska University Hospital/Östra. According to the method of Jaffe et al human umbilical vein endo-thelial cells (HUVEC) were isolated by collagenase digestion [147]. In brief, under sterile conditions the umbilical vein was catheterized and the blood was removed by infusion of PBS at pH 7.4, 37˚C. By incubation with 0.1% collagenase, endothelial cells were explanted following gentle manipulation of the umbilical cord. Isolated cells were maintained in EGM-2 complete culture medium (Cambrex/Clonetics) at 37˚C in humidifi ed 5% CO2 incubator and medium was collected after two days.
Preparation and culturing of monocytes/macrophagesBlood was obtained from three healthy blood donors and buffy coat was prepared from 500 ml whole blood at the Blood Center. By using Ficoll-PaqueTM PLUS (GE Health-care) peripheral blood mononuclear cells (PBMCs) were prepared. The PBMCs were resuspended in RPMI 1640 (Invitrogen) containing PEST (penicillin 100 U/ml and streptomycin 100 μg/ml), 2 mM non-essential amino acids, 20 mM sodium pyruvate, and 2 mM glutamine, after separation and washing. The cells were allowed to adhere for 1 h at 37˚C in a humidifi ed 5% CO2 incubator, and after removal of the non-adherent cells, macrophage-specifi c medium (Invitrogen) containing 5 μg/ml human GM-CSF (R&D Systems) and PEST was added. After washing, macrophage-specifi c medium without GM-CSF was added every three days. Macrophages were stimulated with 10 ng/ml TGF-ß (Sigma-Aldrich), and medium was collected after 3 days for PAI-1 isolation. In one of the three preparations, macrophages were stimulated in both 10 ng/ml TGF-ß and 400 ng/ml dexamethasone (Sigma-Aldrich).
Preparation and incubation of hepatocytesHepatocytes were cultured in suspension (Williams E+, supplemented with 2 mM L-glutamine and 25mM HEPES) for 4 hours, subsequently cells were pelleted by centrifugation, medium was collected and hepatocytes were lysed in lysis buffer as described above. Human primary hepatocytes and conditioned media were a kind gift from Annika Janefeldt and Sara Leandersson at AstraZeneca R&D Mölndal.
Preparation of megakaryocytesThe megakaryocyte cell line MEG-01 (kind gift from Prof. Anders Bengtsson, Lund University) was maintained in RPMI 1640 supplemented with 10% fetal boval serum (FBS) and 1% penicillin/streptomycin. To investigate if miRNAs affect the stability of the reference genes in platelets, the MEG-01 was transfected with 30 nM of DICER1 short interfering RNA (siRNA) or scrambled negative control siRNA using nucleofec-tion (Lonza) according to manufacturer’s protocol. Seventy two hours after transfec-tion, cells were harvested and immediately used for subsequent extraction of RNA.
Methodological considerations: To study the function of single miRNAs in vitro, miRNAs of interest are knocked down and effects on target mRNA expression is ob-served. However, to investigate whether possible reference genes were under miRNA infl uence in platelets, specifi cally, a novel technique was developed. Since platelets lack nuclei, observations were conducted on megakaryocytes, from which platelets

24
derive. By silencing DICER1 with siRNA, normal miRNA biogenesis is inhibited and genes regulated by miRNAs will be derepressed. DICER1 is a ribonuclease that cleaves immature pre-miRNA to mature and functional miRNA. Reference genes un-affected by dicer knock down were considered as stable mRNA transcripts.
Chemical analysisIn study IV, all chemical analysis of venous blood was conducted at the Laboratory for Clinical Chemistry at Sahlgrenska University Hospital (Gothenburg, Sweden). Mean platelet volume (MPV) was analyzed by Celldyn Sapphire (Abbott).
Preparation of RNAFor microarray hybridization, total RNA was extracted at time 0 h and 24 h using Chomszynski/Sacci method [148], prepared with MaXtract High Density Tubes 50ml (Qiagen GmbH). To improve the quality and purity of RNA, RNeasy MinElute Clean-up kit was used according to manufacturer’s instruction (Qiagen). RNA quality was analyzed on 1% agarose gel and RNA quantity was analyzed using a spectrophotom-eter (A260/A280) respectively.
For qPCR in platelets, total RNA was extracted using Trizol according to manufactur-er’s instructions (Ambion by Life Technologies). Concentrations of total RNA were determined on Qubit 2.0 Fluorometer using Qubit RNA HS Assay Kit according to manufacturer’s instructions (Life Technologies). mRNA was converted to cDNA by reverse transcription 1x RNA-to-cDNA master mix and High-capacity RNA-to-cD-NA master mix (Applied Biosystems).
Methodological considerations: To extract RNA from platelets is challenging. Since platelets are anucleated, they merely contain small amounts of mRNA transcripts in their cytoplasm. A RNA extraction method, which results in suffi cient amounts of RNA to perform qPCR and simultaneously minimizes contamination of mRNA, must to be conducted. Since 2008, we have carefully evaluated and optimized different methods; Chomszynski/Sacci method, Trizol and other commercial kits available. In conclusion, extraction by Trizol results in purifi ed and suffi cient mRNA to perform qPCR.
For qPCR in MEG01, RNA was prepared using miRNeasy mini kit (Qiagen). mRNA was converted to cDNA by RevertAid H- First Strand cDNA synthesis kit (Thermo Fisher Scientifi c).
Analyzing techniques – principle and method
Mass spectrometry
Principle in briefMass spectrometry (MS) identifi es molecules of interest present in a sample, by deter-mining the specifi c masses. The molecules are vaporized and ionized, separated in an electric fi eld, and detected according to their mass-to-charge (m/z) ratio. Ion cyclotron resonance (ICR) and Orbitrap detection offers high mass accuracy and high mass

25
resolving power. To characterize an exact modifi cation, accurate mass determination is required, and to distinguish between related forms of the peptide or protein with different degrees of modifi cation, high mass resolving power is necessary. MethodIsolated and purifi ed PAI-1 samples were separated by polyacrylamide gel electropho-resis and the gel was subsequently stained with SYPRO® Ruby or Coomassie blue. Gel bands corresponding to the MW of PAI-1 were cut and in-gel trypsin digestion of protein was performed as previously described [149]. The digestion was stopped, peptides/glycopeptides extracted, liquid evaporated and fi nally the samples were re-constituted for LC-MS/MS analysis. Peptides/glycopeptides were separated by C18-fused silica column using an acteonitrile gradient in low concentration formic acid and electrosprayed in positive mode into the mass spectrometer.
In study I and II, samples were analyzed using a hybrid linear ion trap-Fourier Trans-form Ion Cyclotron mass spectrometer (FT-ICR MS)(LTQ-FT, Thermo Electron), equipped with a 7 T magnet. The mass spectrometer was operated in the data-depen-dent mode to automatically switch between MS and MS/MS acquisition. Survey MS spectra (from m/z 400-1600) were acquired in the FT-ICR and the three most abundant doubly, triply or quadruply protonated ions in each FT-scan were selected for MS/MS using CID (collision induced dissociation) in the linear ion trap. The typical mass ac-curacy is ˂ 2 ppm in MS mode and 300-400 ppm in MS/MS mode. In addition in study II, the glycopeptides were analyzed on an Orbitrap Fusion Tribrid mass spectrometer. MS scans were performed at 120 000 resolution, m/z range 380-1800, MS/MS analy-sis was performed in a data-dependent mode, with top speed cycle of 3s for doubly or multiply charged precursor ions. Ions in each MS scan were selected for fragmenta-tion (MS2) by high-energy collision dissociation (HCD) at 30% and detection in the Orbitrap at 30000 resolution. Precursors were isolated in the quadrupole with a 2.5 m/z window and dynamic exclusion within 20 ppm during 20 seconds was used for m/z-values already selected for fragmentation. Similarly, samples were also analyzed on an LTQ-Orbitrap XL (Thermo Fisher Scientifi c). The settings were: 1 microscan for MS1 scans at 60 000 resolutions (m/z 400), full MS mass range m/z 400-2000. The LTQ-Orbitrap XL was operated in a data-dependent mode with one MS1 FTMS scan of precursor ions followed by six CID (collision induced dissociation) MS2 scans at 30% energy. Dynamic exclusion of an already selected precursor was set to 10s.
Measured peptide masses and their CID or HCD spectra were submitted for database matching using probability-based scoring. The proteins were identifi ed in the Swiss-Prot database against the mammalian sequences by 5 ppm precursor-ion mass toler-ance window, 0.5 Da fragment-ion mass tolerance window and one allowed missed tryptic cleavage. Mass values for peptides that could not be matched to the identifi ed protein sequence by the search-engine Mascot, were examined for the presence of glycosylation by use of the GlycoMod tool, (http://web.expasy.org/glycomod/). The SwissProt accession number corresponding to the protein identity and unmatched mo-noisotopic masses were entered, and a mass deviation of 5 ppm was tolerated. Pre-dicted glycopeptides were checked for the m/z 366 and/or m/z 657 oxonium ions of the oligosaccharides HexHexNAc and HexHexNAcNeuAc in the corresponding MS/MS

26
spectrum, and thus confi rming the presence of glycosylation. In study II, data-base matches also included modifi cation of Neu5AcGalGalNAc and (Neu5Ac)2GalGalNAc (656.2276 and 947.3230 amu) of Ser/Thr and Tyr residues, to more directly examine the presence of glycosylation. In addition, the neutral loss of the same masses was included in the data-matching to account for the deglycosylation of b- and y-ions in-cluding the glycosylation site. Extracted ion chromatograms of glycopeptide specifi c oxonium ions at m/z 138.06 and m/z 274.09 in the HCD spectra were plotted using the Xcalibur software (Thermo Scientifi c). Potential hits were manually evaluated and matched against possible glycan masses using Glycomod. A mass tolerance of 10 ppm was used. The proposed compositions were manually evaluated against the observed fragmentation patterns.
Methodological considerations: We used a mass spectrometry-based method without release of the glycans before analysis. Important information about which glycans are linked to the protein at a specifi c glycosylation site can be preserved, when analyz-ing intact glycopeptides. If the protein or peptide is deglycosylated prior to analysis, information can be obtained about the range of glycan structures, but specifi c struc-tures may not be assigned to their original glycosylation sites [150, 151]. MS with a mass accuracy of 5-10 ppm together with tandem MS fragment information and database interrogations were used to obtain information both on glycan attachment sites and composition. Because the number of possible compositions, with similar masses, decreases with increasing mass accuracy, high mass accuracy is vital for the characterization of different glycoforms of glycopeptides. In the tandem MS analysis of a glycopeptide, the glycosidic bonds are more susceptible to CID fragmentation than the peptide bonds, resulting in a sequential loss of monosaccharide units from the terminal end of the glycan, leaving the peptide part intact. The MS/MS spectra of a glycopeptide (Figure 2) are therefore more straightforward to annotate compared to the MS/MS spectra of released glycans. Due to the low order of glycopeptides in the tryptic digests of a gel band and the typical mircoheterogeneity of glycosylation, very sensitive MS instruments with the capability of high molecular mass detection are needed, as for example Orbitrap or FT-ICR mass spectrometers. Glycopeptide analy-sis depends on the ionization and the nano-LC separation directly coupled to the MS instruments, the sensitivity of the described nanoLC-MS/MS is in the range of a few femtomoles loaded onto the column.
Glycoprotein specifi c staining
Principle in briefGlycoprotein specifi c staining is used to verify absence, presence or level of glyco-sylation of a protein. Glycoproteins are separated by electrical charge on a gel and subsequently stained with a substance that reacts with carbohydrate groups, creating a bright green-fl ourescent signal. The signal is detected by a camera and visualized for analysis.
MethodPAI-1 isolated from platelets and plasma from obese and lean subjects was separated by 10% SDS-PAGE and the gels were stained by ProQ Emerald 300 glycoprotein gel stain kit (Molecular Probes) according to the manufacturer´s instruction. After

27
400 600 800 1000 1200 1400 1600 1800 2000m/z
P
P
4+
4+
366 1+ 3+657 1+
3+3+
3+
3+
P3+
P
1291 1293
1291.339 4+
10 min 40 minnanoLC-MS base peak chromatogram
MS spectrum at 33.7 minglycopeptide 1291.339 4+
MS/MS spectra of 1291.339 4+
NMTRGKWHSILQASLINTLASLPVE
m/z 400-2000
P
PP
P
Figure 2. NanoLC-LTQ-FT-ICR MS analysis of plasma PAI-1 from an individual with BMI>35. The same molecular mass eluting at 33.7 min (MH+ 5162.323) corresponding to the glycopeptide with the attached glycan (Hex)3 HexNAc)2(NeuAc)2(Man)3(GlcNAc)2 was also found in adipose tissue. The quadruply protonated ion m/z 1291.339 (MH+ 5162.323) is analyzed with high resolution and a mass accuracy of about 2 ppm in the ICR cell. The bot-tom spectra shows the fragmentation (MS/MS) pattern of the saccharides attached to the pep-tide (P) and the diagnostic glycan ions at m/z 366 (HexHexNAc) and 657 (HexHexNAcNeuAc).
scanning (Fluor-S MultiImager® and Chemidoc® Bio-Rad Laboratories), the gels was stained for total protein by SYPRO® Ruby stain. The detection limit of the ProQ Emerald stain was investigated by SDS-PAGE of serial dilutions of recombinant hu-man glycosylated PAI-1 expressed in Chinese hamster ovary cells (CHO), stained by SYPRO® Ruby for total protein. PAI-1 from adipose tissue and 50 ng CHO PAI-1 were used as positive controls. The method was used to confi rm mass spectrometry data and to evaluate differences in level of glycosylation between obese and lean subjects by investigating optical density of the glyco specifi c staining and the total protein staining by densitometry (ImageJ, nih, Maryland, USA, http://imagej.nih.gov/ij/, 1997-2015). The ratio of glycosylated/total protein was compared between obese subjects and their matched controls.
28
Enzyme-linked immunosorbent assay (ELISA)
Principle in briefELISA is used to quantify proteins. Samples containing a specifi c protein and stan-dard are added to wells coated with antibodies, which specifi cally bind the protein in question. After binding and subsequent washing, a second specifi c enzyme-labeled antibody is added. Wells are fi nally washed to remove unbound antibodies, subse-quently a peroxidase substrate is added that converts the substrate to a spectrophoto-metrically measured colored product, which is directly proportional to the amount of protein present in the sample.
MethodLevels of PAI-1 antigen in platelets, plasma, and serum were determined with a com-mercially available ELISA (Technozyme® PAI-1, Technoclone GmbH). All samples were assayed in duplicate according to manufacturer´s protocol.
Microarray hybridization – transcription profi ling
Principle in briefMicroarray hybridization aims to study the effects of global gene expression in sam-ples. Thousands of DNA probes are attached to a solid surface in an ordered fashion. RNA from the samples is converted to cDNA that is fragmented, biotin labeled, and hybridized to the array. After washing, binding of biotinylated cDNA to the probes is detected by the addition of streptavidin coupled to a fl uorescent dye. After strep-tavidin binding and washing, the intensity of the fl uorescent signal for each probe is detected and is proportional to the relative expression level of the corresponding gene.
MethodGene expression in platelets incubated before and after 24h incubation from eight donors was analyzed using Human Genome U133 Plus 2.0 chip (Affymetrix) in dupli-cates. Target preparation and hybridization of the microarray was performed accord-ing to procedures developed by the manufacturer. Raw data were visually inspected for hybridization artifacts and then analyzed using the MAS5 software (Affymetrix). Selection of stable genes was based on the MAS5 detection call algorithm.
Quantitative reverse transcriptase real-time PCR (qPCR)
Principle in briefqPCR is used to quantify levels of specifi c mRNA transcripts in a sample. The mRNA transcript pool in a cell is purifi ed and reverse transcribed to cDNA. The specifi c tran-script of interest is amplifi ed in a PCR reaction containing a dual-labeled probe. When this fl uorescently labeled probe is hybridized to its target sequence during qPCR, the Taq polymerase cleaves the reporter dye from the non-extendable probe. The reporter dye is released into solution where the increase in dye emission is monitored in real-time and the threshold cycle analyzed. The threshold cycle (CT) is defi ned as the cycle number at which the reporter fl uorescence reaches a fi xed threshold level. There is a linear relationship between CT and the log of initial target copy number [121]. The rel-ative expression levels of the target gene is analyzed using the relative standard curve

29
method or the comparative CT method, where the difference in threshold cycles for a target and a reference gene in a treated sample, and comparing it to that of a control sample [153] . Endogenous reference genes work as internal controls to correct for po-tential variation in RNA loading, cDNA synthesis, or effi ciency of PCR amplifi cation.
MethodRelative quantifi cation was performed on 7500 Fast Real-Time PCR System (Applied Biosystems) and StepOnePlus instrument (Thermo Fisher Scientifi c). Oligonucleotide primers and Taqman probes for quantifi cation of PAI-1 and GAPDH were designed from the GenBank database using Primer Express version 1.0 software (Applied Bio-systems). Each primer pair was selected so that the amplicon spanned an exon junc-tion to preclude amplifi cation of genomic DNA. All probes designed in-house were dual-labeled with 5’-reporter dye FAM (6-carboxy-fl ouorescein) and 3’-quencher dye TAMRA (6-carboxy-tetramethyl-rhodamine). The effi ciency of the in-house-designed primer and probes were validated by using a dilution curve. PPIA, RN18S1, YWHAE, B2M, ITM2B, H3F3A, and PF4V1 were quantifi ed with TaqMan® pre-designed gene expression assays™ (Applied Biosystems). All primers and probes are summarized in Table 1. For amplifi cation of the genes, 0.24 μl cDNA was added to the PCR mixture consisting of TaqMan Universal PCR Master Mix Fast, 0.4 μM of each primer, 0.2 μM probe, in a fi nal volume of 15 μl (Applied Biosystems). All samples were assayed in duplicates.
Gene Symbol Sequence Position Gene Expression Assay
YWHAE Hs00356749_g1 B2M Hs00187842_m1 ITM2B Hs00222753_m1 H3F3A Hs02598544_g1 PF4V1 Hs0060249_g1 RN18S1 Hs99999901_s1 PPIA Hs04194521_s1 GAPDH forward primer 5'-cca cat cgc tca gac acc at -'3 2171-2190 reverse primer 5'-cca ggc gcc caa tac g-3' 2195-2217,
3850-3854 probe 5'-(FAM)aag gtg aag gtc gga gtc aac gga (TAMRA)-3' 3857-3872 PAI-1 forward primer 5'-ggc tga ctt cac gag tct ttc a-3' 11616-11637 reverse primer 5'-ttc act ttc tgc agc gcc t-3' 11758-11780 probe 5'-(FAM)acc aag agc ctc tcc acg tcg cg TAMRA)-3' 11782-11800
Table 1. Oligonucleotide primers and probes used for qPCR
Multiplate analysis
Principle in briefMultiplate analyzes the platelets ability to aggregate. TRAP-test consists of TRAP-6 (thrombin receptor activating peptide -6) that stimulates the PAR-1 receptor and induces platelet aggregation. ASPI-test consists of arachidonic acid that inhibits COX-1 activation that results in a decreased platelet aggregation. ADP-test consists of adenosindiphosphate that stimulats ADP-receptors on platelets and induces aggre-

30
gation. The Multiplate records adhesion and aggregation by multiple electrode ag-gregometry, which is expressed as the area under the curve in arbitrary units.
MethodAggregation ability was measured by Multiplate® analyzer (Roche Diagnostics) in platelets from T2D subjects compared to obese and lean controls.
Statistical methods
Standard statistical methods were used. Results were analyzed using SPSS statistical software (SPSS Inc, Chicago, IL). Data are presented as mean and standard error of the mean, unless otherwise stated. The student’s t test was used for parametric de-mographic data, PAI-1 antigen levels, miRNA results, and for densitometry analysis. Variance analysis ANOVA with post hoc Bonferroni was used to analyze differences of means between T2D subjects and obese and lean control groups. Non-parametric McNemar’s test related samples was used when applicable. Pearson correlation coef-fi cients were calculated to determine associations. In order to stabilize variances and to get symmetrical distributions for the residuals all statistical analyses of PAI-1 were performed on log transformed data. Results were considered signifi cant if P˂0.05.

31
RESULTS AND COMMENTS ON METHODOLOGY
Study I and II – Patterns and levels of PAI-1 glycosylation
Detection of PAI-1 by mass spectrometryTo reveal the possible source of plasma PAI-1, the specifi c glycosylation patterns of PAI-1 from plasma, platelets, endothelial cells, adipose tissue, macrophages and hepatocytes were studied. Gel bands corresponding to the MW of PAI-1 were ana-lyzed and identifi ed as the best protein hit using several signifi cant MS/MS spectra of unmodifi ed PAI-1 peptides in all samples from both studies. Table 2 summarizes glycopeptides and predicted glycan compositions at the two N-linked glycosylation sites found in the nanoLS-MS and MS/MS analysis of PAI-1 from the specifi c sources in study I. For some of the glycopeptide masses, there are two different explanations of glycan moieties with different compositions.
Examples of the glycan compositions of PAI-1 in study II are demonstrated in Figure 3. Up to 83% sequence coverage of plasma PAI-1 was accounted for in this proteomic analysis (Figure 3A). N-glycosylated peptides were subsequently searched for by tracing the presence of the glycopeptide specifi c oxonium ions m/z 138.055 and m/z 274.09 in the HCD-MS2 spectra (Figure 3B-3D).
Glycosylation patterns on PAI-1 from different sourcesIn study I, protein bands were identifi ed as PAI-1 in the platelet as well as in plasma preparations, and despite this, no glycopeptides were detected. The majority of gly-cans found were from adipose tissue and 11 suggested glycans were identifi ed. How-ever, two of the detected masses had two alternative glycan compositions. In the three different preparations there were different numbers of glycans identifi ed at N288, with the highest amount of glycans in the preparation where the highest amount of PAI-1 was obtained. The limited amount of PAI-1 obtained from macrophages made precise identifi cation of the composition of the glycans diffi cult. The possibility of no gly-cosylation was excluded, since diagnostic glycan ions were detected. Glycans were detected on N232 at peptide position FNYTE in endothelial cells only. Two different compositions were detected at this position, but the other site was not utilized. We were not able to detect PAI-1 with MS/MS in hepatocytes. In Figure 4, a summary of the glycosylation pattern of PAI-1 from the different sources is shown.
Comments:PAI-1 from endothelial cells, macrophages and adipose tissue was glycosylated with heterogeneous glycosylation patterns, in contrast to platelets and plasma from lean subjects, where no glycans were found. Previous studies have shown that the endothe-lium produces large amounts of PAI-1 in vitro, although this may be a cell-culturing artefact [154, 155]. Furthermore, PAI-1 in the endothelium is released basolaterally to the extracellular matrix and endothelial PAI-1 may therefore not be involved in the intra-vascular fi brinolysis [156]. These data support our fi nding that PAI-1 from the endothelium is glycosylated with two different glycans on N232 and is therefore not likely to be a major source of plasma PAI-1 in healthy individuals.

32
Glycostructures at position N288 at peptide position GNMTRAdipose tissue
MH+Glycan ppm
Missed cleavage Mox
2929.107 (Hex)2 (HexNAc)2 (Deoxyhexose)1 (NeuAc)2 + (Man)3(GlcNAc)2 1.92784.075, 5001.303 (Hex)2 (HexNAc)2 (Deoxyhexose)2 (NeuAc)1 + (Man)3(GlcNAc)2 3.8, 4.6 1 Y5162.323 (Hex)3 (HexNAc)2 (NeuAc)2 + (Man)3(GlcNAc)2 2.1 Y5001.303 (Hex)3 (HexNAc)2 (Deoxyhexose)1 (NeuAc)1 + (Man)3(GlcNAc)2 4.6 1 Y2962.131 (Hex)3 (HexNAc)2 (Deoxyhexose)2 (NeuAc)1 + (Man)3(GlcNAc)2 6.3 Y5017.303, 5033.286 (Hex)4 (HexNAc)2 (NeuAc)1 + (Man)3(GlcNAc)2 5.5, 3.2 1, 1 ,2962.131 (Hex)4 (HexNAc)2 (Deoxyhexose)1 (NeuAc)1 + (Man)3(GlcNAc)2 6.33365.253 (Hex)2 (HexNAc)2 (NeuAc)4 + (Man)3(GlcNAc)2 5.5
2638.013, 2654,016 (Hex)2 (HexNAc)2 (Deoxyhexose)1 (NeuAc)1 + (Man)3(GlcNAc)2 2.5, 5.5 Y
2566.000 (Hex)2 (HexNAc)3 (Deoxyhexose)1 + (Man)3(GlcNAc)2 5.7 Y
2841.080 (Hex)2 (HexNAc)3 (Deoxyhexose)1 (NeuAc)1 + (Man)3(GlcNAc)2 1.9, 5.5 Y
2654.016 (Hex)3 (HexNAc)2 (NeuAc)1 + (Man)3(GlcNAc)2 5.5 Y
2566.000 (Hex)3 (HexNAc)3 + (Man)3(GlcNAc)2 5.7
5074.311 (Hex)3 (HexNAc)3 (NeuAc)1 + (Man)3(GlcNAc)2 2.9 1 Y
Plasma BMI >35
MH+Glycan ppm
Missed cleavage Mox
2929.103, 5146.327, 5130.318 (Hex)2 (HexNAc)2 (Deoxyhexose)1 (NeuAc)2 + (Man)3(GlcNAc)2 0.5, 1.9, 0.8 1,1,1 Y,2800.062 (Hex)2 (HexNAc)2 (Deoxyhexose)2 (NeuAc)1 + (Man)3(GlcNAc)2 1.0 Y5146.327 , 5162.334 (Hex)3 (HexNAc)2 (NeuAc)2 + (Man)3(GlcNAc)2 1.9, 4.2 1, 1 Y2800.062 (Hex)3 (HexNAc)2 (Deoxyhexose)1 (NeuAc)1 + (Man)3(GlcNAc)2 1.03312.363 (Hex)3 (HexNAc)2 (Deoxyhexose)2 (NeuAc)1 + (Man)3(GlcNAc)2 2.3 13182.310, 5017.258 (Hex)4 (HexNAc)2 (NeuAc)1 + (Man)3(GlcNAc)2 5.5, 3.4 1 Y5179.306 (Hex)4 (HexNAc)2 (Deoxyhexose)1 (NeuAc)1 + (Man)3(GlcNAc)2 4.3 1 Y4984.262 (Hex)1 (HexNAc)2 (Deoxyhexose)1 (NeuAc)2 + (Man)3(GlcNAc)2 0.5 1
2783.046, 3165.290, 4984.262 , 5000.262 (Hex)2 (HexNAc)2 (NeuAc)2 + (Man)3(GlcNAc)2
0.9, 4.2, 0.5, 0.6 1,1 Y
Macrophage
MH+Glycan ppm
Missed cleavage Mox
2872.046 (Hex)2 (HexNAc)1 (Deoxyhexose)2 (NeuAc)2 + (Man)3(GlcNAc)2 12 Y
Glycostructures at position N232 at peptide position FNYTEHUVEC
MH+Glycan ppm
Missed cleavage Mox
5637.45 (Hex)3 + (Man)3(GlcNAc)2 2.0
5799.49 (Hex)4+ (Man)3(GlcNAc)2 0.2
Table 2. Summary of the masses and possible compositions of glycans found at the two sites on PAI-1 (N232 and N288) from the different sources. Glycans found in more than one tissue are in-dicated in bold type and masses with two possible glycan compositions are indicated in italic. The mass accuracy is specifi ed in ppm, number of missed proteolytic cleavage is presented as well as presence of oxidised methionine (Y=yes).

33
Figure 3. Proteomic and glycoproteomic identifi cation of plasma PAI-1. A. The sequence of PAI-1. Red residues designate identifi ed peptides in the proteomic analysis. Underlined Asn resi-dues are potential N-glycosylation sites. The squared sequence is the signal peptide. The N-ter-minal of the extracellular protein is Val-24. B. HCD-MS2 spectrum of disialylated (Neu5Ac*2) and biantennary N-glycan substituted GNMTRLPR (boxed structure); C. monosialylated biantennary N-glycan; and D. biantennary N-glycan. Ion charges are shown when z>1. Monosaccharides are displayed according to the Consortium for Functional Glycomics. Neu5Ac=5-N-acetylneuraminic acid (sialic acid), Gal=galactose, GlcNAc=N-acetylglucosamine, Man=mannose, Fuc=fucose, amu=atomic mass units.
1 MQMSPALTCL VLGLALVFGE GSAVHHPPSY VAHLASDFGV R VFQQVAQAS 51 KDRNVVFSPY GVASVLAMLQ LTTGGETQQQ IQAAMGFKID DKGMAPALRH 101 LYKELMGPWN KDEISTTDAI FVQRDLKLVQ GFMPHFFRLF RSTVKQVDFS 151 EVERARFIIN DWVKTHTKGM ISNLLGKGAV DQLTRLVLVN ALYFNGQWKT 201 PFPDSSTHRR LFHKSDGSTV SVPMMAQTNK FNYTEFTTPD GHYYDILELP
251 YHGDTLSMFI AAPYEKEVPL SALTNILSAQ LISHWKGNMT RLPRLLVLPK 301 FSLETEVDLR KPLENLGMTD MFRQFQADFT SLSDQEPLHV AQALQKVKIE 351 VNESGTVASS STAVIVSARM APEEIIMDRP FLFVVRHNPT GTVLFMGQVM 401 EP
Signal SequenceA B
200 400 600 800 1000 1200 1400m/z
010
20
30
40
50
60
70
80
90
100
Rel
ativ
e Ab
unda
nce
138.05
274.09
204.09
1109.98
366.14 927.42845.89 1028.95
582.301292.55683.84
-H20
2+2+
2+
2+ 2+
2+
2+
MS2 @ 792.32 (4+) 4+
2+ 2+
200 400 600 800 1000 1200 1400m/z
0
10
20
30
40
50
60
70
80
90
100
Rel
ativ
e Ab
unda
nce
1109.98
138.05
204.09
274.09
366.14 1028.45 1292.55
845.89
2+
MS2 @ 958.73 (3+) 3+
2+
-H20
C D
2+
2+
2+
200 400 600 800 1000 1200 1400m/z
0
10
20
30
40
50
60
70
80
90
100
Rel
ativ
e Ab
unda
nce
204.09274.09
1109.98
1183.01
366.14
1028.951292.55
846.391367.07
MS2 @ 1105.12 (3+)
-H20
2+2+
2+
3+
2+
Neu5Ac (291 amu)Gal (162 amu)GlcNAc (203 amu)Man (162 amu)Fuc (146 amu)peptide (GNMTRLPR)
PAI-1 has been detected in cells of monocyte/macrophage lineage and peripheral blood monocytes as well as macrophages in the wall of atherosclerotic vessels syn-thesize PAI-1 [30, 157, 158]. However, it is not likely that blood monocytes contribute signifi cantly to the plasma levels since the in vitro synthesized levels are close to un-detectable [159, 160]. Since diagnostic ions were present and one glycan was identi-fi ed on macrophage PAI-1, it is less likely that these cells are signifi cant contributors to plasma levels in healthy individuals.
Moreover, we failed to isolate and detect PAI-1 from primary human hepatocytes. Previous studies of PAI-1 protein and mRNA levels in the liver have shown diverg-ing results and since PAI-1 has been shown to be an acute phase protein and the ex-pression of PAI-1 can be dramatically up-regulated in hepatocytes when stimulating with infl ammatory mediators, an infl ammatory stress state may be required to obtain signifi cant amounts [31, 158, 161]. The liver might be an important source of plasma PAI-1 in infl ammatory disease, sepsis, and stress. However, this results clearly sug-gests that unstimulated hepatocytes synthesize very low amounts of PAI-1 and further studies with larger samples will have to be performed to enable evaluation of the glycosylation pattern.

34
N-acetyl-glucosamine
Mannose Hexose N-acetylneuraminicacid
Deoxyhexose N-acetylhexose-amine
N-acetyl-glucosamine
-Deoxyhexose - -
MacrophageHUVEC
NH2MQM-----N232-----N288-----N352-----COOHNH2MQM-----N232-----N288-----N352-----COOH
NH2MQM-----N232-----N288-----N352-----COOHNH2MQM-----N232-----N288-----N352-----COOH
PlateletsPlasma normal
Plasma BMI >35
Adipose tissue
NH2MQM-----N232-----N288-----N352-----COOHNH2MQM-----N232-----N288-----N352-----COOH
NH2MQM-----N232-----N288-----N352-----COOH
NH2MQM-----N232-----N288-----N352-----COOHNH2MQM-----N232-----N288-----N352-----
Figure 4. Schematic illustrating the suggested glycan compositions at the two sites on PAI-1 from the analyzed sources. Because of the heterogeneity of the glycan compositions on PAI-1 from adipose tissue and from plasma from obese subjects, three structures had to be made to sum-marize the suggested compositions. The dashed lines indicate the different glycan combinations at that site.
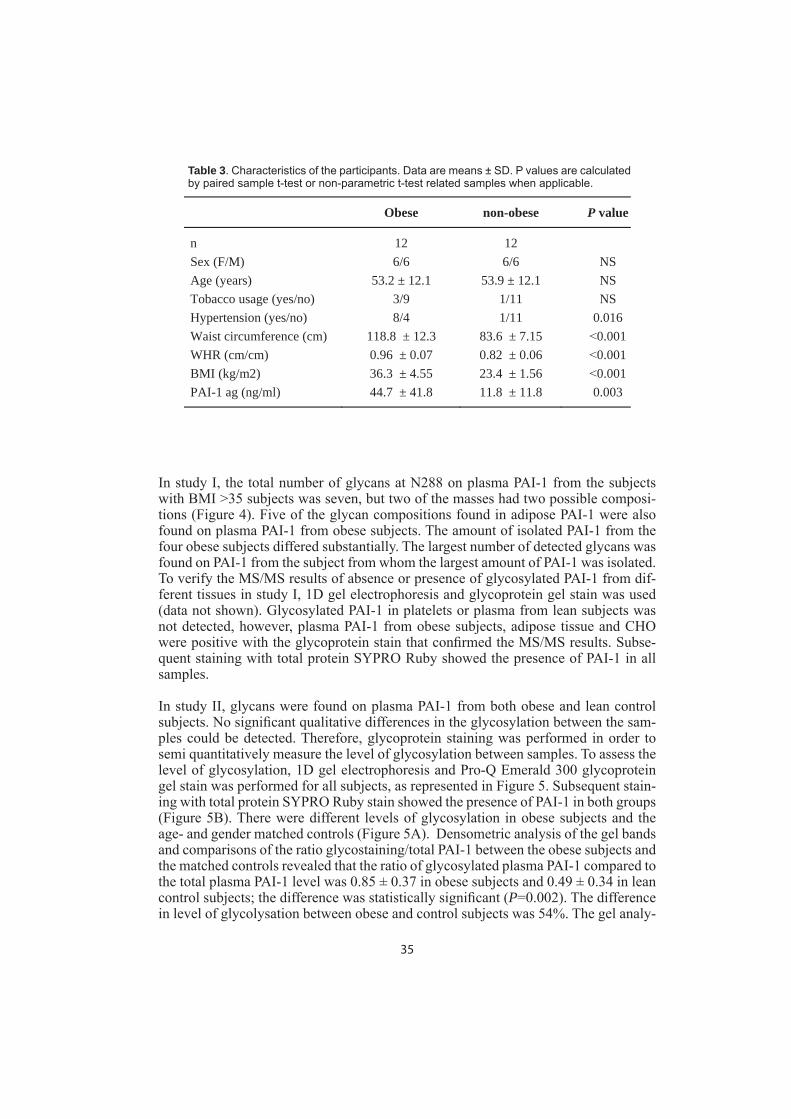
Glycosylation of plasma PAI-1 in obese subjectsIn the second step, we investigated the glycosylation patterns on PAI-1 from plasma in obese subjects. In study I four obese subjects were included. The BMI ranged from 36.6 to 40.7, three males and one female, 47-74 years, and PAI-1 ˃50 ng/ml. The demographic characteristics of the 12 obese subjects and the 12 ages- and gender matched non-obese subjects in study II are listed in Table 3. Waist circumference, Waist-hip-ratio (WHR) and BMI were signifi cantly increased in the obese subjects. Plasma PAI-1 levels were signifi cantly elevated in obese subjects compared to non-obese subjects (44.7 ± 41.8 ng/mL vs. 11.8 ± 11.8 ng/mL; P=0.003). WHR, BMI and waist circumference correlated signifi cantly to plasma PAI-1 (r=0.515, P=0.010; r=0.486, P=0.016; r=0.523, P=0.009 respectively).
35
Table 3. Characteristics of the participants. Data are means ± SD. P values are calculated by paired sample t-test or non-parametric t-test related samples when applicable.
Obese non-obese P value
n 12 12 Sex (F/M) 6/6 6/6 NS Age (years) 53.2 ± 12.1 53.9 ± 12.1 NS Tobacco usage (yes/no) 3/9 1/11 NS Hypertension (yes/no) 8/4 1/11 0.016 Waist circumference (cm) 118.8 ± 12.3 83.6 ± 7.15 0.001 WHR (cm/cm) 0.96 ± 0.07 0.82 ± 0.06 0.001 BMI (kg/m2) 36.3 ± 4.55 23.4 ± 1.56 0.001 PAI-1 ag (ng/ml) 44.7 ± 41.8 11.8 ± 11.8 0.003
In study I, the total number of glycans at N288 on plasma PAI-1 from the subjects with BMI ˃35 subjects was seven, but two of the masses had two possible composi-tions (Figure 4). Five of the glycan compositions found in adipose PAI-1 were also found on plasma PAI-1 from obese subjects. The amount of isolated PAI-1 from the four obese subjects differed substantially. The largest number of detected glycans was found on PAI-1 from the subject from whom the largest amount of PAI-1 was isolated. To verify the MS/MS results of absence or presence of glycosylated PAI-1 from dif-ferent tissues in study I, 1D gel electrophoresis and glycoprotein gel stain was used (data not shown). Glycosylated PAI-1 in platelets or plasma from lean subjects was not detected, however, plasma PAI-1 from obese subjects, adipose tissue and CHO were positive with the glycoprotein stain that confi rmed the MS/MS results. Subse-quent staining with total protein SYPRO Ruby showed the presence of PAI-1 in all samples.
In study II, glycans were found on plasma PAI-1 from both obese and lean control subjects. No signifi cant qualitative differences in the glycosylation between the sam-ples could be detected. Therefore, glycoprotein staining was performed in order to semi quantitatively measure the level of glycosylation between samples. To assess the level of glycosylation, 1D gel electrophoresis and Pro-Q Emerald 300 glycoprotein gel stain was performed for all subjects, as represented in Figure 5. Subsequent stain-ing with total protein SYPRO Ruby stain showed the presence of PAI-1 in both groups (Figure 5B). There were different levels of glycosylation in obese subjects and the age- and gender matched controls (Figure 5A). Densometric analysis of the gel bands and comparisons of the ratio glycostaining/total PAI-1 between the obese subjects and the matched controls revealed that the ratio of glycosylated plasma PAI-1 compared to the total plasma PAI-1 level was 0.85 ± 0.37 in obese subjects and 0.49 ± 0.34 in lean control subjects; the difference was statistically signifi cant (P=0.002). The difference in level of glycolysation between obese and control subjects was 54%. The gel analy-

36
Figure 5. Glycosylation on plasma PAI-1. Gel image showing the results of glyco-specifi c staining with A: Pro-Q Emerald and B: same gel subsequently stained with SYPRO Ruby. PAI-1 from CHO cells were used as positive controls. Samples with PAI-1 are in the following order; lane 1: 50 ng CHO PAI-1, lane 2, 4 and 7: plasma PAI-1 from subjects with BMI˃30, lane 3, 5 and 7: plasma PAI-1 from matched control subjects with BMI˂25.
sis was repeated two times with separate gel runs and the densometric measurements generated the same result. Additionally, there was a weak but signifi cant correlation between the level of glycosylation and BMI (r=0.406, P=0.049).
1 2 3 4 5 6 7A
B
Comments:No glycans were found on plasma PAI-1 from lean subjects in study I, but a variety of glycans were found on plasma PAI-1 from lean control subjects in study II. This dis-crepancy is unlikely to be caused by methodological differences. Although the more sensitive and much faster LC-MS/MS experiments of high resolution Orbitrap spec-trometers used in study II increase the possibility to detect lower amounts of glycans, the vast amounts of PAI-1 analyzed in study I should have revealed glycans even with FT-ICR (LTQ-FT, Thermo Electron) masspectrometer.
The high performance mass spectrometry method used in study II, without isotopi-cally labeled standards, cannot be regarded as quantitative. Therefore, mass spectrom-etry was only used to verify the strong presence of immunopurifi ed PAI-1 in the gel bands, and to verify the presence of PAI-1 glycosylation at the glycopeptide level. Glycospecifi c and total protein staining followed by densometric measurements are indeed a semi-quantitative method, but by repeating the gel runs and staining proto-cols similar results were observed. The known correlation between PAI-1 and BMI was highly signifi cant in the cohort in study II, verifying the representativeness of the study subjects. Plasma PAI-1 antigen levels were signifi cantly increased in obese subjects, results that confi rm previous fi ndings [141].
37
Study III and IV – The role of platelet PAI-1 in T2D
To investigate the role of platelets on the raised plasma PAI-1 levels in T2D, mRNA expression of PAI-1 in platelets was characterized in T2D subjects. In order to study mRNA expression in platelets, a normalization strategy for qPCR was conducted. qPCR is a robust method to quantify gene expression [162], however, potential errors can occur at various stages [163]. The use of reference genes is the most effective method to correct for these errors, but the reference genes have to be validated [164-166]. It has been shown that commonly used reference genes are not necessarily the most stable ones [167] and more importantly, using the wrong reference gene may produce erroneous results [168].
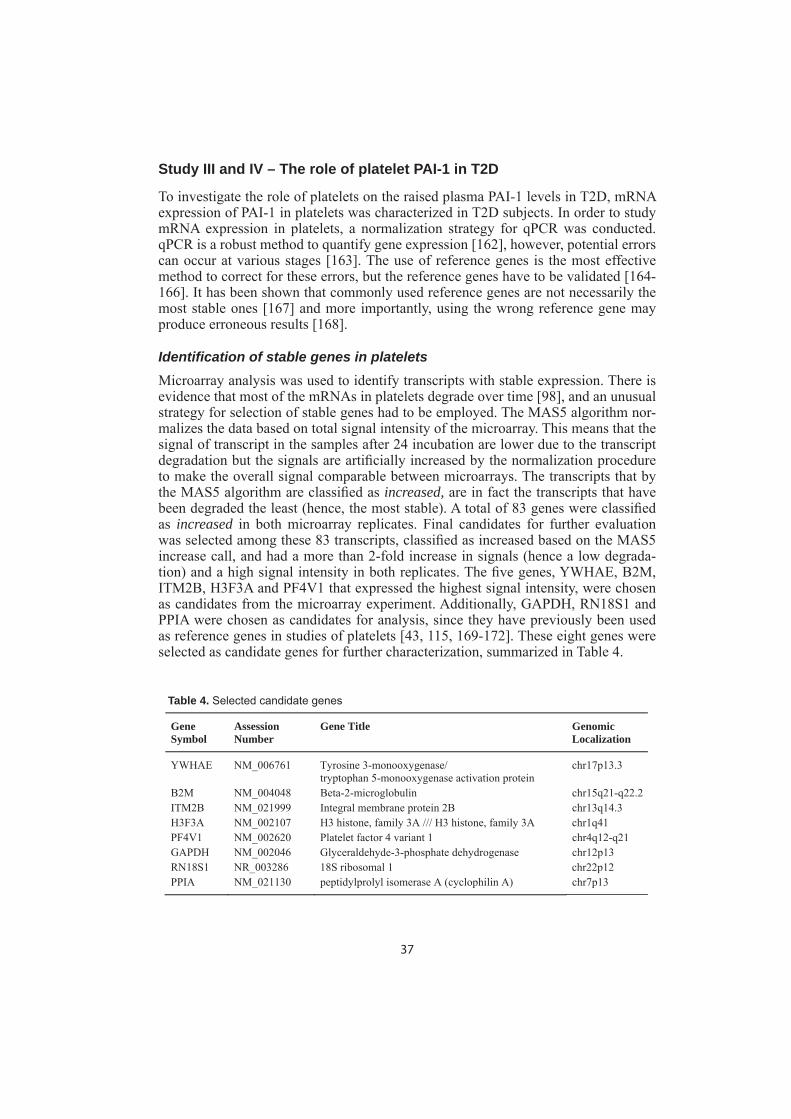
Identifi cation of stable genes in plateletsMicroarray analysis was used to identify transcripts with stable expression. There is evidence that most of the mRNAs in platelets degrade over time [98], and an unusual strategy for selection of stable genes had to be employed. The MAS5 algorithm nor-malizes the data based on total signal intensity of the microarray. This means that the signal of transcript in the samples after 24 incubation are lower due to the transcript degradation but the signals are artifi cially increased by the normalization procedure to make the overall signal comparable between microarrays. The transcripts that by the MAS5 algorithm are classifi ed as increased, are in fact the transcripts that have been degraded the least (hence, the most stable). A total of 83 genes were classifi ed as increased in both microarray replicates. Final candidates for further evaluation was selected among these 83 transcripts, classifi ed as increased based on the MAS5 increase call, and had a more than 2-fold increase in signals (hence a low degrada-tion) and a high signal intensity in both replicates. The fi ve genes, YWHAE, B2M, ITM2B, H3F3A and PF4V1 that expressed the highest signal intensity, were chosen as candidates from the microarray experiment. Additionally, GAPDH, RN18S1 and PPIA were chosen as candidates for analysis, since they have previously been used as reference genes in studies of platelets [43, 115, 169-172]. These eight genes were selected as candidate genes for further characterization, summarized in Table 4.
Table 4. Selected candidate genes
GeneSymbol
Assession Number
Gene Title Genomic Localization
YWHAE NM_006761 Tyrosine 3-monooxygenase/ tryptophan 5-monooxygenase activation protein
chr17p13.3
B2M NM_004048 Beta-2-microglobulin chr15q21-q22.2 ITM2B NM_021999 Integral membrane protein 2B chr13q14.3 H3F3A NM_002107 H3 histone, family 3A /// H3 histone, family 3A chr1q41 PF4V1 NM_002620 Platelet factor 4 variant 1 chr4q12-q21 GAPDH NM_002046 Glyceraldehyde-3-phosphate dehydrogenase chr12p13 RN18S1 NR_003286 18S ribosomal 1 chr22p12 PPIA NM_021130 peptidylprolyl isomerase A (cyclophilin A) chr7p13

38
Comments:Traditional reference genes were reported as early as the 1970s to be differently ex-pressed in tissues and despite these observations they have been used extensively, without proper validation, in many studies [173, 174]. In order to perform an unbiased search for genes that are stable over time, a microarray experiment was performed. In this experiment, YWHAE, B2M, ITM2B, H3F3A, PF4V1 were the fi ve most stable genes in platelets over time, even though none of them has previously been suggested as a suitable reference gene in platelets. However, there are potential pitfalls in using microarray in this experimental setting. Firstly, platelets used for the microarray were inhibited until RNA isolation, and hence does not include the whole experimental conditions used for the qPCR evaluation of the reference genes. Secondly, one could also argue that no gene from the microarray experiment is an excellent reference gene, since no gene was completely stable over time as the signal from all genes decreased over time. The most likely explanation is that the mRNA content in platelets, derived from the megakaryocytes, is degraded over time despite inhibition of the platelets. Even with these potential pitfalls, the unbiased approach using microarray for selec-tion of candidates for validation is preferable to choosing candidate reference genes from the literature since it opens up for discovery of genes not previously considered as reference genes. The validity of this approach is indicated in the results showing that the stability of the genes chosen from the microarray experiment in general was higher that the genes selected from literature.
Confi rmation of the candidate genes by qPCRAll candidate genes had raw CT values ranging from 15 to 33. Stability, identifi ed as geometric means by RefFinder, of the candidate reference genes in platelets are shown in Table 5. At least three genes should be used as reference genes for a cor-rect normalization according to previous fi ndings [166]. YWHAE, PF4V1 and B2M were most stably expressed in the total material, combining all experimental data. In activated platelets YWHAE, PF4V1 and B2M were the most stably expressed genes, as seen in the total material. There was no difference in stability between the three various conditions, in which the platelets were activated (data not shown). Inhibited platelets showed a different result, where ITM2B was most stably expressed followed by PF4V1, B2M and YWHAE.
Platelets were incubated for 0, 24 and 48 hours. Initially, ITM2B was most stably expressed, followed by YWHAE, B2M and PF4V1. However, after 24 and 48 hours PF4V1, YWHAE and B2M were the most stably expressed genes. YWHAE, PF4V1 and B2M are most stably expressed genes in platelets from healthy donors. In inhib-ited non-incubated platelets ITM2B was most stably expressed. However, this candi-date gene was not stable over time and across different types of incubations. GAPDH was consistently never ranked as the most stable gene, and never the least stable gene. PPIA and RN18S1 were the least stable genes.
In order to elucidate if there are inter-individual differences; fi ve subjects with type 2 diabetes (T2D) and fi ve gender- and age matched controls were studied (Table 6). In both groups YWHAE was the most stable gene followed by H3F3A and ITM2B.
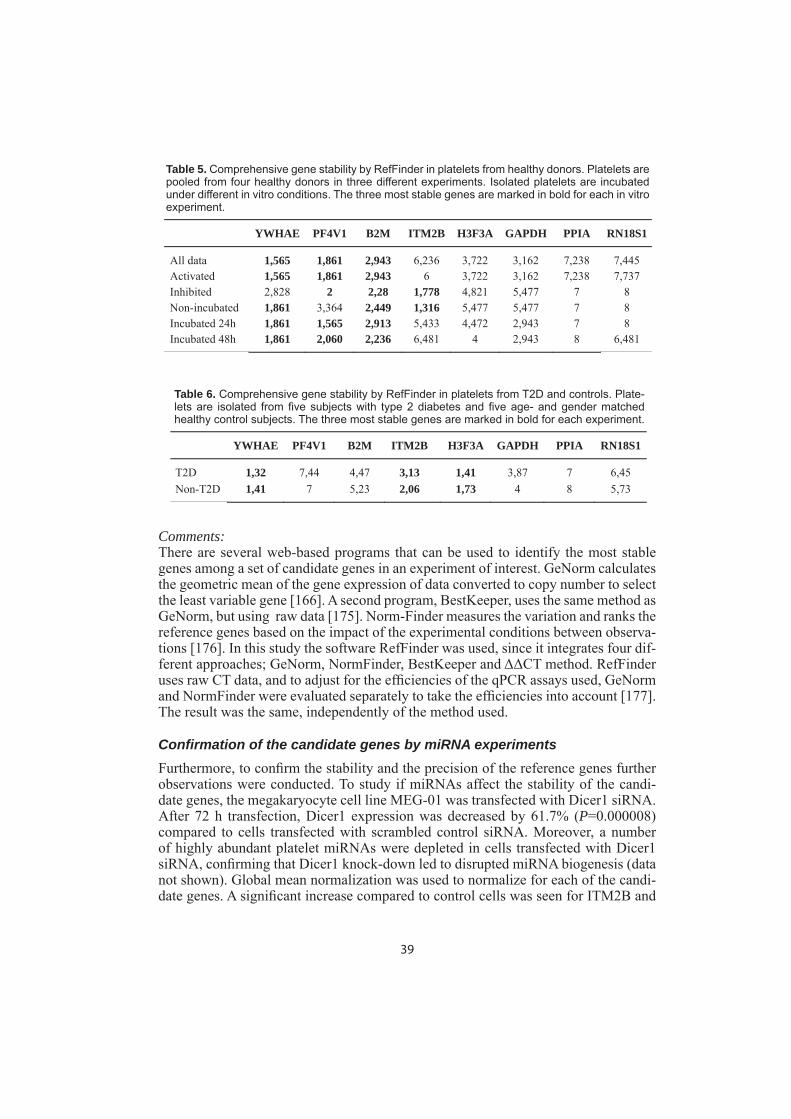
39
Table 5. Comprehensive gene stability by RefFinder in platelets from healthy donors. Platelets are pooled from four healthy donors in three different experiments. Isolated platelets are incubated under different in vitro conditions. The three most stable genes are marked in bold for each in vitro experiment.
YWHAE PF4V1 B2M ITM2B H3F3A GAPDH PPIA RN18S1
All data 1,565 1,861 2,943 6,236 3,722 3,162 7,238 7,445 Activated 1,565 1,861 2,943 6 3,722 3,162 7,238 7,737 Inhibited 2,828 2 2,28 1,778 4,821 5,477 7 8 Non-incubated 1,861 3,364 2,449 1,316 5,477 5,477 7 8 Incubated 24h 1,861 1,565 2,913 5,433 4,472 2,943 7 8 Incubated 48h 1,861 2,060 2,236 6,481 4 2,943 8 6,481
YWHAE PF4V1 B2M ITM2B H3F3A GAPDH PPIA RN18S1
T2D 1,32 7,44 4,47 3,13 1,41 3,87 7 6,45 Non-T2D 1,41 7 5,23 2,06 1,73 4 8 5,73
Table 6. Comprehensive gene stability by RefFinder in platelets from T2D and controls. Plate-lets are isolated from fi ve subjects with type 2 diabetes and fi ve age- and gender matched healthy control subjects. The three most stable genes are marked in bold for each experiment.
Comments:There are several web-based programs that can be used to identify the most stable genes among a set of candidate genes in an experiment of interest. GeNorm calculates the geometric mean of the gene expression of data converted to copy number to select the least variable gene [166]. A second program, BestKeeper, uses the same method as GeNorm, but using raw data [175]. Norm-Finder measures the variation and ranks the reference genes based on the impact of the experimental conditions between observa-tions [176]. In this study the software RefFinder was used, since it integrates four dif-ferent approaches; GeNorm, NormFinder, BestKeeper and ΔΔCT method. RefFinder uses raw CT data, and to adjust for the effi ciencies of the qPCR assays used, GeNorm and NormFinder were evaluated separately to take the effi ciencies into account [177]. The result was the same, independently of the method used.
Confi rmation of the candidate genes by miRNA experimentsFurthermore, to confi rm the stability and the precision of the reference genes further observations were conducted. To study if miRNAs affect the stability of the candi-date genes, the megakaryocyte cell line MEG-01 was transfected with Dicer1 siRNA. After 72 h transfection, Dicer1 expression was decreased by 61.7% (P=0.000008) compared to cells transfected with scrambled control siRNA. Moreover, a number of highly abundant platelet miRNAs were depleted in cells transfected with Dicer1 siRNA, confi rming that Dicer1 knock-down led to disrupted miRNA biogenesis (data not shown). Global mean normalization was used to normalize for each of the candi-date genes. A signifi cant increase compared to control cells was seen for ITM2B and

40
PPIA, by 26.0% (P=0.009) and 25.3% (P=0.019), respectively (Figure 6). RN18S1 was increased by 24.5%, but this was non-signifi cant (P=0.064). YWHAE, H3F3A, B2M, and GAPDH remained unchanged whereas PF4V1 was not detectable at all.
Figure 6. Effect of miRNA on candidate genes. Megakaryocytic cell line MEG01 transfected in three experiments with three replicates in each group. *P=0.019, ** P=0.009, ***P=0.000008.
Comments:In order to evaluate the possible effect of miRNA on the stability of the selected refer-ence genes, we performed a thorough review of the literature but could not fi nd any evidence that any of the candidate genes are targeted by miRNAs. Dicer1 is required for miRNA biogenesis by cleaving double stranded pre-miRNA [178]. In this study, YWHAE, B2M, H3F3A and GAPDH were not infl uenced by Dicer1 knock down and are therefore not expected to be regulated by miRNAs, a result in agreement with the result from RefFinder analysis. ITM2B, and PPIA increased in MEG01 cells after Dicer1 knock-down, which may indicate depression of gene expression as a result of decreased miRNA levels.
There was some variation in the stability of the candidate genes, but YWHAE was the most stable ones throughout all experimental conditions and it was not infl uenced by miRNA. B2M, GAPDH, and H3F3A varied in stability; however, they were not under miRNA regulation and may well be used as candidates when validating refer-ence genes in platelets. On the other hand, ITM2B, PPIA and RN18S1 were unstable and potentially regulated by miRNA and are therefore not robust candidates. GAPDH was not among the most stable genes, nevertheless it appeared not to be infl uenced by miRNA and since it is widely used as a reference gene in platelets it may be consid-ered for further research if it is desired to compare results with previous studies. To our knowledge, there is only one previous study investing reference genes in platelets, and in this study platelets from healthy donors and subjects with a history of myocar-dial infarction were used [179]. GAPDH was the most stable gene in healthy donors

41
(geometric mean 2.34), although, except for GAPDH, a comparison of results is not applicable, since different candidate genes were used. In conclusion, YWHAE is a stable reference gene across different experimental conditions and intra-individual variations in platelets and is a potiential generic reference gene for qPCR in platelets.
Characterization of the platelet pool of PAI-1 in T2DIn order to investigate the role of platelet PAI-1 in T2D, the levels of PAI-1 mRNA expression and antigen were characterized. Eight subjects with T2D were included, as well as seven obese and eight lean control subjects. The characteristics of the three subject groups are shown in Table 7. The three groups were well defi ned regarding obesity, and T2D subjects were distinctly differentiated from the two control groups concerning factors associated with T2D.
Table 7. Characteristics of the participants. Data presented as mean±SD. One-way ANOVA was used for statistical analyses, with Post Hoc test Bonferroni; *signifi cant difference between control and T2D, #signifi cant difference between control and obese, and Ψsignifi cant difference between obese and T2D.
T2D Obese Lean p-value
Sex (M/F) 4/4 2/5 3/5 NS Diabetes duration 3.2±1.2 Age (years) 59.5±5.6 60.4±5.6 60.1±5.8 NS BMI (kg/m2) 34.2±2.7* 32.4±1.9# 23.2±2.1 0.001 Waist (cm) 112.8±7.0* 110.4±5.5# 83.7±10.7 0.001 WHR 0.97±0.08* 0.94±0.07 0.84±0.09 0.008 SBP (mmHg) 154.5±14.2* 135.3±18.1 117.1±12.4 0.001 DBP (mmHg) 94.1±6.8* 86.4±10.6# 74.1±9.30 0.001 fP-Glucose (mmol/L) 9.3±2.50*, 5.6±0.55 5.0±0.77 0.001 B-HbA1c (mmol/mol) 54.3±8.6*, 35.6±3.4 32.6±1.8 0.001 S-Cholesterol (mmol/L) 5.2±1.0 5.2±1.2 5.5±1.2 NS S-Triglycerides (mmol/L) 1.6±0.51* 0.38±0.14# 0.18±0.06 0.001 S-HDL-c (mmol/L) 1.3±0.28* 1.2±0.27# 1.9±0.42 0.001 S-LDL-c (mmol/L) 3.6±1.00 3.7±0.99 3.6±0.97 NS S-Creatinine (μmol/L) 70.5±7.1 88.3±7.9 78.8±13.1 0.008 S-ALAT (μkat/l) 0.77±0.33*, 0.47±0.12 0.33±0.06 0.001
Table 8 summarizes the characteristics of the diabetic platelets compared to obese and lean control subjects. There was no difference in platelet count between the groups and no signifi cant correlations between MPV and BMI, plasma glucose or HbA1c. Platelet aggregation ability, measured by multiplate analyzer, was within reference values in all groups. There was no difference between the groups, with the exception for ASPI-test where obese subjects had increased aggregation ability in response to arachidonic acid compared to lean subjects.
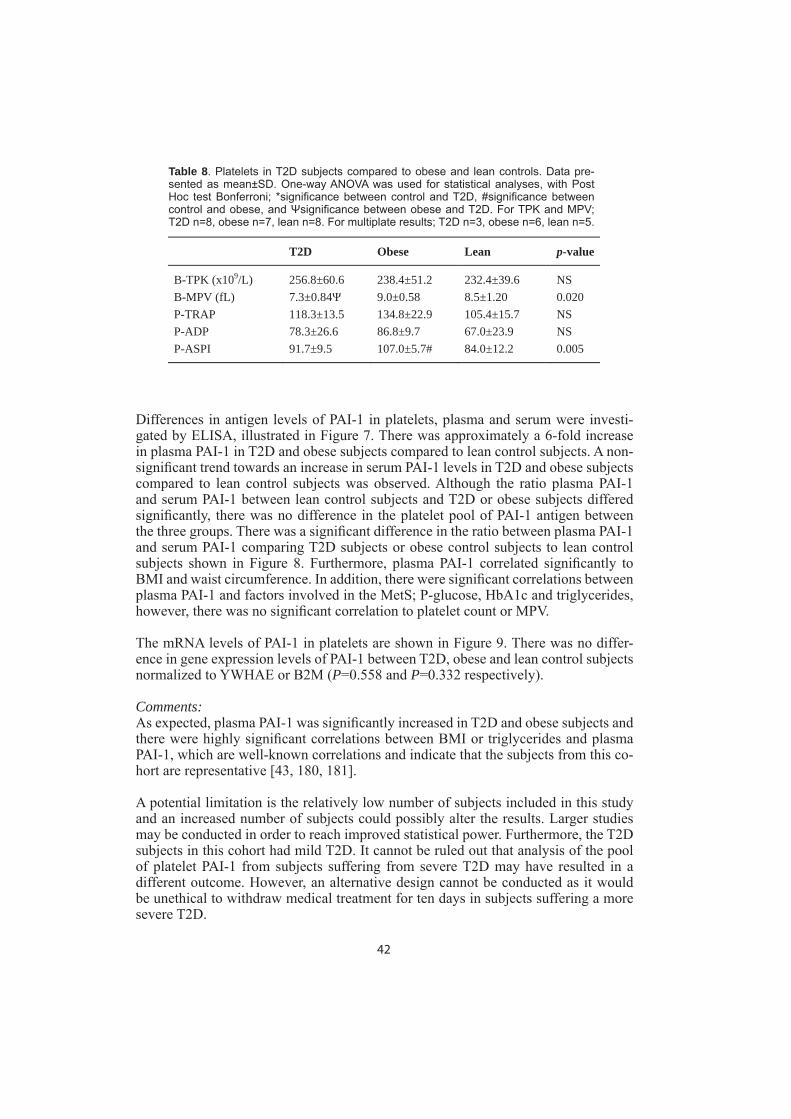
42
T2D Obese Lean p-value
B-TPK (x109/L) 256.8±60.6 238.4±51.2 232.4±39.6 NS B-MPV (fL) 7.3±0.84 9.0±0.58 8.5±1.20 0.020 P-TRAP 118.3±13.5 134.8±22.9 105.4±15.7 NS P-ADP 78.3±26.6 86.8±9.7 67.0±23.9 NS P-ASPI 91.7±9.5 107.0±5.7# 84.0±12.2 0.005
Table 8. Platelets in T2D subjects compared to obese and lean controls. Data pre-sented as mean±SD. One-way ANOVA was used for statistical analyses, with Post Hoc test Bonferroni; *signifi cance between control and T2D, #signifi cance between control and obese, and Ψsignifi cance between obese and T2D. For TPK and MPV; T2D n=8, obese n=7, lean n=8. For multiplate results; T2D n=3, obese n=6, lean n=5.
Differences in antigen levels of PAI-1 in platelets, plasma and serum were investi-gated by ELISA, illustrated in Figure 7. There was approximately a 6-fold increase in plasma PAI-1 in T2D and obese subjects compared to lean control subjects. A non-signifi cant trend towards an increase in serum PAI-1 levels in T2D and obese subjects compared to lean control subjects was observed. Although the ratio plasma PAI-1 and serum PAI-1 between lean control subjects and T2D or obese subjects differed signifi cantly, there was no difference in the platelet pool of PAI-1 antigen between the three groups. There was a signifi cant difference in the ratio between plasma PAI-1 and serum PAI-1 comparing T2D subjects or obese control subjects to lean control subjects shown in Figure 8. Furthermore, plasma PAI-1 correlated signifi cantly to BMI and waist circumference. In addition, there were signifi cant correlations between plasma PAI-1 and factors involved in the MetS; P-glucose, HbA1c and triglycerides, however, there was no signifi cant correlation to platelet count or MPV.
The mRNA levels of PAI-1 in platelets are shown in Figure 9. There was no differ-ence in gene expression levels of PAI-1 between T2D, obese and lean control subjects normalized to YWHAE or B2M (P=0.558 and P=0.332 respectively).
Comments:As expected, plasma PAI-1 was signifi cantly increased in T2D and obese subjects and there were highly signifi cant correlations between BMI or triglycerides and plasma PAI-1, which are well-known correlations and indicate that the subjects from this co-hort are representative [43, 180, 181].
A potential limitation is the relatively low number of subjects included in this study and an increased number of subjects could possibly alter the results. Larger studies may be conducted in order to reach improved statistical power. Furthermore, the T2D subjects in this cohort had mild T2D. It cannot be ruled out that analysis of the pool of platelet PAI-1 from subjects suffering from severe T2D may have resulted in a different outcome. However, an alternative design cannot be conducted as it would be unethical to withdraw medical treatment for ten days in subjects suffering a more severe T2D.
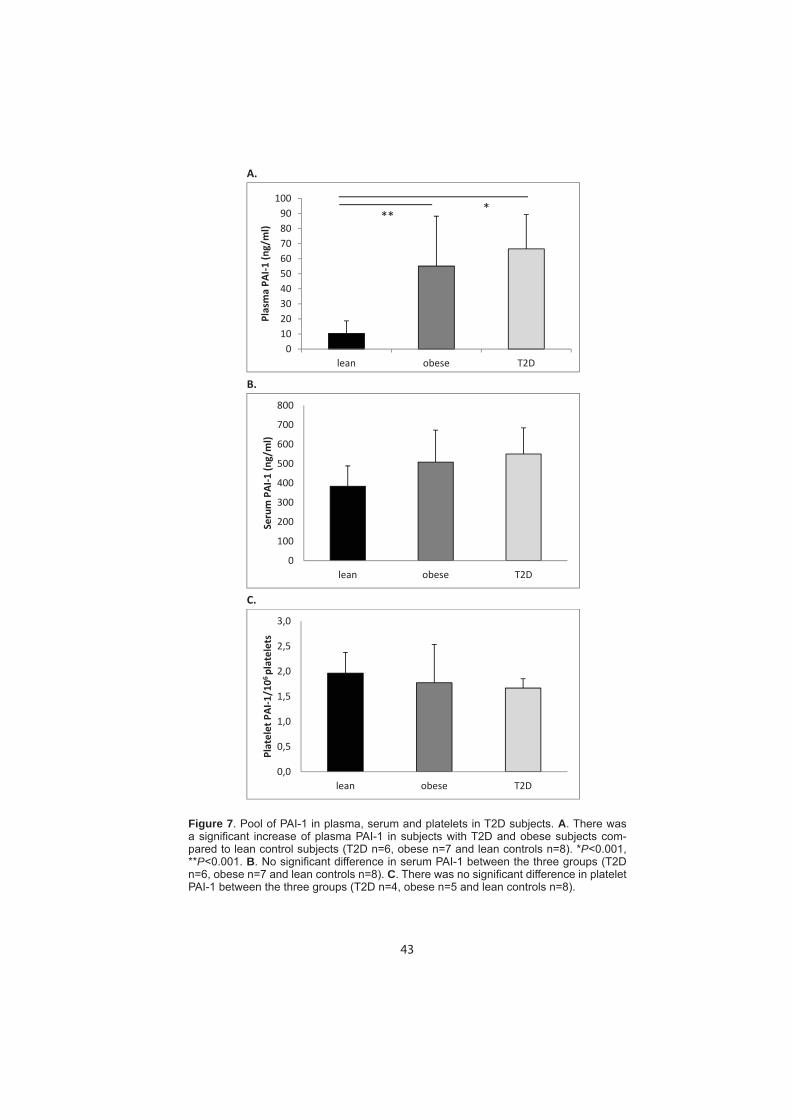
43
Figure 7. Pool of PAI-1 in plasma, serum and platelets in T2D subjects. A. There was a signifi cant increase of plasma PAI-1 in subjects with T2D and obese subjects com-pared to lean control subjects (T2D n=6, obese n=7 and lean controls n=8). *P˂0.001, **P˂0.001. B. No signifi cant difference in serum PAI-1 between the three groups (T2D n=6, obese n=7 and lean controls n=8). C. There was no signifi cant difference in platelet PAI-1 between the three groups (T2D n=4, obese n=5 and lean controls n=8).
A.
B.
C.
0102030405060708090
100
lean obese T2D
PlasmaPA
I1(ng/ml)
***
0
100
200
300
400
500
600
700
800
lean obese T2D
Serum
PAI1
(ng/ml)
0,0
0,5
1,0
1,5
2,0
2,5
3,0
lean obese T2D
Platelet
PAI1
/106platelets

44
Figure 8. Ratio of plasma PAI1/serum PAI1 in T2D. There was a signifi cant difference in ratio between lean control subjects and T2D or obese subjects (T2D n=6, obese n=7 and lean controls n=8). *P˂0.001, **P=0.003.
0,000
0,020
0,040
0,060
0,080
0,100
0,120
0,140
0,160
0,180
0,200
lean obese T2D
Ratio
PlasmaPA
I1/Serum
PAI1
* **
Figure 9. Gene expression levels of PAI-1 compared to reference genes. There were no signifi cant differences in gene expression levels of PAI-1 in platelets between subjects with T2D, obese and lean controls. T2D n=6, obese n=7 and lean controls n=7.
0
0,5
1
1,5
2
2,5
3
3,5
Lean Obese T2M
FoldCh
ange

45
PATHOPHYSIOLOGICAL DISCUSSION AND CONCLUSION
The source of plasma PAI-1 has previously been considered an unsolved question. Since plasma PAI-1 is a cardiovascular risk factor and may theoretically refl ect the output of several different tissues, increased knowledge of the specifi c source of plas-ma PAI-1 in MetS with increased levels might facilitate targeted risk prevention and potential future therapies. The results of the four studies included in this thesis indicate that the platelet pool of PAI-1 is the important contributor to normal plasma PAI-1 in lean individuals. However, the increased levels of plasma PAI-1 in MetS including T2D may derive from another source where adipose tissue is a likely candidate.
The source of plasma PAI-1 in healthy individuals
Several studies of both humans and rodents have been performed to identify the source of plasma PAI-1, and both PAI-1 mRNA and protein are found in many tissues. The main pool of PAI-1 in the body is found in platelets [110, 182]. However, because of the lack of an association between the platelet PAI-1 content and the plasma concen-tration, platelets have not been considered to contribute to plasma PAI-1 [110, 183]. On the other hand, it has been shown that platelet count correlates with plasma PAI-1, a fi nding which is compatible with the view that a constant release of PAI-1 from platelets could contribute to the plasma level [43, 184-186]. There is a considerable constitutive de novo synthesis of PAI-1 in platelets and a release of as little as 3% of newly synthesized PAI-1 would be suffi cient to maintain normal plasma levels [115].Taken together with the results that plasma and platelet PAI-1 share the characteris-tic of not being glycosylated, our fi ndings suggest platelets to be the main source of PAI-1 in plasma in healthy lean subjects.
The source of plasma PAI-1 in obesity
Previous studies have revealed that plasma PAI-1 levels correlate with BMI, and in obese mice and humans PAI-1 mRNA is up-regulated in adipose tissues [31, 187, 188]. In addition, elevated plasma levels of PAI-1 in obese subjects can be normal-ized by removal of adipose tissue both by surgery, dieting, or gastric bypass [128, 129, 132], suggesting that adipose tissue could be a source of plasma PAI-1 in obese subjects. Other studies have reported that visceral and subcutaneous adipose tissue explants produce PAI-1 in amounts correlated to its levels in blood [189]. Conversely, studies of arteriovenous differences across subcutaneous tissue from obese and vis-ceral fat from non-obese subjects have not been able to demonstrate a signifi cant release of PAI-1 [190, 191].
Interestingly, we were able to show differences in glycosylation patterns of plasma PAI-1 from lean and obese subjects. Moreover, seven glycans were identifi ed on N288 in PAI-1 from plasma from obese subjects with a typical composition similar to that found on PAI-1 isolated from visceral adipose tissue, but none of those glycans were found in the other tissues studied. The higher levels of plasma PAI-1 observed in obesity seem to depend on a contribution from adipose tissue, which suggests that pathophysiological conditions may shift the relative contribution from different cel-

46
lular sources. Furthermore, not only the increased levels of plasma PAI-1 in obesity seem to increase the risk of thrombosis, but also its level of glycosylation. We found a higher level of glycosylation of plasma PAI-1 in obese subjects and there was a correlation between BMI and level of glycosylation indicating a relative relationship between fat deposits and level of glycosylated plasma PAI-1. Since the biochemical properties of a protein may change upon glycosylation and glycosylated PAI-1 has a 2.3-fold stronger inhibitory effect on t-PA than non-glycosylated and a lower inacti-vation rate [61, 62], our results suggest that it may not only be the increased absolute level of plasma PAI-1 that increases the risk for thrombotic events in obese subjects but also the increased proportion of glycosylated plasma PAI-1.
In study II, glycans were found on plasma PAI-1 from both obese and lean control subjects, which initially may appear inconsistent with study I, in which no glycans were found on plasma PAI-1 from lean subjects. However, the discrepancy between the two studies is likely to be caused by differences in metabolic phenotypes of the control groups. In study II, the lean control subjects were physically inactive com-pared to the physically active and fi t subjects in study I. There were differences in plasma PAI-1 levels of the healthy subjects with an average of 12 ng/ml in study II compared to study I, in which none of the subjects had a plasma level above 10 ng/ml. Furthermore, there was a difference in age by 25 years between the lean subjects in the two studies and as described by Serrano et al, the contribution of plasma PAI-1 from adipose tissue may increase during aging [62]. Taken together, these differences indicate that there was a less advantageous metabolic phenotype of the lean control subjects in the second study, and this may explain the fi nding of some glycans on plasma PAI-1 from individuals in the latter study.
The source of plasma PAI-1 in T2D
Platelet hyper-reactivity plays a critical role in the pathogenesis of atherothrombosis in patients with obesity and T2D and these conditions are also associated with an in-creased MPV [192-195]. This would suggest that the platelet mRNA expression and the synthesis of PAI-1 could be altered in obesity and T2D. However, no signifi cant difference in PAI-1 mRNA expressions in platelets between the groups was observed. Moreover, no difference was seen in platelet PAI-1 antigen between the groups, that is in contrast to previous results, in which a reduction in platelet PAI-1 was observed in T2D subjects [183]. Comparable PAI-1 mRNA expression levels and PAI-1 antigen levels in platelets between the groups may indicate an unaffected role of platelets or megakaryocytes for the plasma levels, thus indicating that a different source is contributing to the elevated levels in T2D and obesity. This is in agreement with the glycosylation results; the increase in plasma PAI-1 observed in obese subjects may be derived from adipose tissue. The signifi cant difference in the ratio between plasma PAI-1 and serum PAI-1 between lean control subjects and T2D or obese subjects is also in line with this hypothesis.
Our group has shown that plasma PAI-1 levels are decreased in the immediate postop-erative period after gastric bypass, prior to any weight-loss [132]. This may indicate that an additional mechanism, not directly related to the fat mass, regulates the PAI-1 levels. Bariatric surgery has been shown not only to be an effective treatment for obe-

47
sity, but is also associated with improved type 2 diabetes outcomes. This is observed before any signifi cant weight loss has occurred and the main hypothesis is that this is related to an increased release of gut hormones and bile acids [196]. It may be specu-lated that hormonal factors such as insulin infl uence the decrease in plasma PAI-1. A strong correlation between PAI-1 and insulin has been reported [197].
Even though the similar platelet PAI-1 content in T2D, obese and lean subjects indi-cate an unaffected role of platelets, a higher synthesis rate and turn-over of PAI-1 in platelets from T2D compared to obese and lean control subjects could not completely be ruled out. Platelets in T2D could initially contain more PAI-1 mRNA transcripts that are translated into protein at an increased rate and the PAI-1 is directly released into the blood stream.
Several studies have previously shown that platelets from T2D exhibit an abnormal functional profi le, although most of these studies revealed a high glycemic burden or signifi cant diabetic complications among the subjects included [194, 198, 199]. Conversely, Schlomai et al have demonstrated normal platelet size and function in subjects with well-controlled T2D without prior ischemic events [200]. In addition, there is evidence that MPV values decrease in patients who achieve improved diabetic control [201]. Our results demonstrated no substantial difference in platelet count, size or aggregation ability between T2D subjects compared to obese and lean control subjects. This may be explained by the features of the T2D subjects in our cohort; they had no ischemic events or diabetic complications such as microvasculopathy, no multi-pharmacy and the duration of T2D was less than fi ve years. In contrast to above-mentioned studies, in our study population all medical treatment was withdrawn ten days prior to venous sampling, to assure that drug treatment was not infl uencing the platelets. For instance, oral hypoglycemic agents and statins are known to affect plate-let function [202, 203].
From a pathophysiological perspective, this thesis presents three main fi ndings:
1. Glycosylation patterns on PAI-1 indicate that platelets are the source of plasma PAI-1 in healthy subjects
2. Adipose tissue may be an additional source of plasma PAI-1 and there is an in-creased ratio of glycosylated PAI-1 in obesity
3. The unaffected pool of platelet PAI-1 in T2D indicates that the elevated plasma levels derive from another source
In conclusion, these studies have put focus on the origin of PAI-1 in plasma. In physi-ologically balanced conditions, platelets may be the major source of plasma PAI-1. However, the platelet contribution seems less important for the increased plasma lev-els and hence the risk of cardiovascular events in obesity and T2D, in which adipose tissue is a more likely source. The western lifestyle, mainly responsible for the fea-tures of the MetS, is causing a shift to a procoagulant and antifi brinolytic phenotype with an increased risk of CVD, in which a pathological increase in plasma PAI-1 from adipose tissue may be a key event.

48
ACKNOWLEDGEMENTS
The road to fi nalize this thesis has been winding and many people have contributed in various ways. I would like to thank all of you from the bottom of my heart. Without you I would not have made it through. Special appreciations to...
Helén Brogren, my main supervisor and dear friend, who invited me to the project with open arms and showed me the world of molecular biology. Your scientifi c com-petence and teaching skills are extraordinary and I hope you will always be supervis-ing others in one way or the other. You and I have been a strong team for 10 years now. Who knows what research miracles we will discover in the future!
Sverker Jern, my co-supervisor for accepting me as a PhD-student and sharing your enormous knowledge in the research area.
Lena Karlsson, for your infi nite inspiration and endless support.
To my co-authors who contributed to the papers, Johanna Deinum for you vast knowledge of PAI-1, Malin Lönn for contribution of fat tissue, Per-Arne Svensson for you excellent skills in microarrays, Olof Gidlöf and David Erlinge for a valuable teamwork and your guidance in the miRNA fi eld, Carina Sihlbom, Jonas Nilsson and Göran Larson for brilliant knowledge in masspectrometry analysis, Per-Anders Jansson, Josefi n Olausson, Emanuel Fryk for an outstanding collaboration and not the least Lena Strindberg for never-ending support and assistance.
Carel le Roux and Dimitri Pournaras for a warm welcoming in the bariatric surgery fi eld, for your vast knowledge and for believing in me and my work.
Eva Thydén for support, knowledge about practical issues regarding PhD studies and the composition of this thesis.
Mia Magnusson, my next-door room-mate and friend, for sharing hard times and good times on our path to fi nish our PhDs. Emma Lu, for your outstanding knowledge in molecular biology methods and for your brilliant assistance. Present and former col-leagues, Erik Ulfhammer and Pia Larsson for sharing your skills at the lab, Niklas Bergh, Thórdís Hrafnkelsdottir, Ott Saluveer, Hannele Korhonen, Anna Wolf and all other people working in the group during longer and shorter periods.
Thanks to Jan Borén and Fredrik Bäckhed for professional leadership at the Wallen-berg laboratory. Magnus, Merja and Christina for hard work at the laboratory and to Svenne and Björn for appreciated IT-support. Christina for handling economic issues and all members of the SOS-group for laughter in the fi ka room.
I would like to express my deepest thanks to all study participants and blood donors, without you this thesis would not exist. Thanks to Pia at the Blodcentralen Sahlgren-ska for your positive attitude and all donated platelets (when not needed in clinical practice) and to Linda for excellent multiplate analysis.

49
My clinical supervisor Kerstin Holmberg, and all wonderful colleagues at Närhälsan Herrestad Vårdcentral for supporting me in my work, encouraging me to keep go-ing and showing vast interest in my research fi eld. Ann-Marie Svensson for valuable administration skills. All former clinical colleagues, especially Jenny Larsson-Fridén and Åke Johansson, for your support.
To all of my wonderful friends, far and near, for making sure there is more to life than science. Especially thanks to Sara for being my dearest friend for as long as I can remember. Thank you for always being there. Ingrid, Erik, Mimi, and Estelle for good times. And to Minna, Jenny and Karin for listening to my research dilemmas (over a glass of wine).
To my mother Inger for support and giving me endless love. To my father Björn for support, being a role model and sharing my interest in medical research. My brother Erik and his family Sofi a, Ida and Elsa for being who you are and being there. To morfar Curt for your great interest in understanding what my research is all about. Mormor, farmor and farfar for devotion. My family-in-law, Susanne and her family, Monica and Kjell for support and hours of baby-sitting. To Elise my “older-sister” and all my cousins, aunts, uncles and friends of the family.
To my wonderful children, I love you indefi nitely. Anton, for showing me that love has nothing to do with ties of blood and I am so thankful that you, curious and thoughtful, stormed into my life. Klara for being my sunshine and reminding me about the most important things in life.
And to Christian, my husband, love of my life and best-friend. For your wise thoughts, support, and encouragement. I could not have done this without you. I will be your babe forever, even when we are old and grumpy!
This thesis was supported by grants from the Swedish Research Counsil, the Swedish Heart-Lung Foundation, LUA/ALF in Västra Götalandsregionen, Emelle Foundation and O.E. and Edla Johansson Research Foundation.
50
REFERENCES
1. WHO, World Health Organization Fact sheet No 310: The top 10 causes of death. 2014.
2. Eckel, R.H., S.M. Grundy, and P.Z. Zimmet, The metabolic syndrome. Lancet, 2005. 365(9468): p. 1415-28.
3. Alexander, C.M., et al., NCEP-defi ned metabolic syndrome, diabetes, and prevalence of coronary heart disease among NHANES III participants age 50 years and older. Diabe-tes, 2003. 52(5): p. 1210-4.
4. Gami, A.S., et al., Metabolic syndrome and risk of incident cardiovascular events and death: a systematic review and meta-analysis of longitudinal studies. J Am Coll Cardiol, 2007. 49(4): p. 403-14.
5. Grundy, S.M., et al., Defi nition of metabolic syndrome: Report of the National Heart, Lung, and Blood Institute/American Heart Association conference on scientifi c issues related to defi nition. Circulation, 2004. 109(3): p. 433-8.
6. Halldin, M., et al., The metabolic syndrome: prevalence and association to leisure-time and work-related physical activity in 60-year-old men and women. Nutr Metab Cardio-vasc Dis, 2007. 17(5): p. 349-57.
7. Hu, G., et al., Prevalence of the metabolic syndrome and its relation to all-cause and cardiovascular mortality in nondiabetic European men and women. Arch Intern Med, 2004. 164(10): p. 1066-76.
8. Muntner, P., et al., Prevalence of non-traditional cardiovascular disease risk factors among persons with impaired fasting glucose, impaired glucose tolerance, diabetes, and the metabolic syndrome: analysis of the Third National Health and Nutrition Examina-tion Survey (NHANES III). Ann Epidemiol, 2004. 14(9): p. 686-95.
9. Eschwege, E., The dysmetabolic syndrome, insulin resistance and increased cardiovas-cular (CV) morbidity and mortality in type 2 diabetes: aetiological factors in the devel-opment of CV complications. Diabetes Metab, 2003. 29(4 Pt 2): p. 6S19-27.
10. Ford, E.S., The metabolic syndrome and mortality from cardiovascular disease and all-causes: fi ndings from the National Health and Nutrition Examination Survey II Mortality Study. Atherosclerosis, 2004. 173(2): p. 309-14.
11. Galassi, A., K. Reynolds, and J. He, Metabolic syndrome and risk of cardiovascular disease: a meta-analysis. Am J Med, 2006. 119(10): p. 812-9.
12. Grant, P.J., Diabetes mellitus as a prothrombotic condition. J Intern Med, 2007. 262(2): p. 157-72.
13. Hubert, H.B., et al., Obesity as an independent risk factor for cardiovascular disease: a 26-year follow-up of participants in the Framingham Heart Study. Circulation, 1983. 67(5): p. 968-77.
14. Unwin, N., D. Gan, and D. Whiting, The IDF Diabetes Atlas: providing evidence, raising awareness and promoting action. Diabetes Res Clin Pract, 2010. 87(1): p. 2-3.
15. Diabetes--a global threat. Lancet, 2009. 373(9677): p. 1735.
16. Ginter, E. and V. Simko, Adult obesity at the beginning of the 21st century: epidemiology, pathophysiology and health risk. Bratisl Lek Listy, 2008. 109(5): p. 224-30.

51
17. Ginter, E. and V. Simko, Diabetes type 2 pandemic in 21st century. Bratisl Lek Listy, 2010. 111(3): p. 134-7.
18. Lippi, G., M. Franchini, and G. Targher, Arterial thrombus formation in cardiovascular disease. Nat Rev Cardiol, 2011. 8(9): p. 502-12.
19. Davies, M.J., The pathophysiology of acute coronary syndromes. Heart, 2000. 83(3): p. 361-6.
20. Booth, N.A., Fibrinolysis and thrombosis. Baillieres Best Pract Res Clin Haematol, 1999. 12(3): p. 423-33.
21. DeWood, M.A., et al., Coronary arteriographic fi ndings in acute transmural myocardial infarction. Circulation, 1983. 68(2 Pt 2): p. I39-49.
22. Rentrop, K.P., et al., Serial angiographic assessment of coronary artery obstruction and collateral fl ow in acute myocardial infarction. Report from the second Mount Sinai-New York University Reperfusion Trial. Circulation, 1989. 80(5): p. 1166-75.
23. Emeis, J.J., Local fi brinolysis. J Thromb Haemost, 2005. 3(9): p. 1945-6.
24. Collen, D., On the regulation and control of fi brinolysis. Edward Kowalski Memorial Lecture. Thromb Haemost, 1980. 43(2): p. 77-89.
25. Lijnen, H.R. and D. Collen, Endothelium in hemostasis and thrombosis. Prog Cardiovasc Dis, 1997. 39(4): p. 343-50.
26. Hrafnkelsdottir, T., et al., Regulation of local availability of active tissue-type plasmino-gen activator in vivo in man. J Thromb Haemost, 2004. 2(11): p. 1960-8.
27. Kruithof, E.K., et al., Demonstration of a fast-acting inhibitor of plasminogen activators in human plasma. Blood, 1984. 64(4): p. 907-13.
28. Verheijen, J.H., G.T. Chang, and C. Kluft, Evidence for the occurrence of a fast-acting inhibitor for tissue-type plasminogen activator in human plasma. Thromb Haemost, 1984. 51(3): p. 392-5.
29. Declerck, P.J., et al., Measurement of plasminogen activator inhibitor 1 in biologic fl uids with a murine monoclonal antibody-based enzyme-linked immunosorbent assay. Blood, 1988. 71(1): p. 220-5.
30. Simpson, A.J., et al., Distribution of plasminogen activator inhibitor (PAI-1) in tissues. J Clin Pathol, 1991. 44(2): p. 139-43.
31. Sawdey, M.S. and D.J. Loskutoff, Regulation of murine type 1 plasminogen activator inhibitor gene expression in vivo. Tissue specifi city and induction by lipopolysaccharide, tumor necrosis factor-alpha, and transforming growth factor-beta. J Clin Invest, 1991. 88(4): p. 1346-53.
32. Dellas, C. and D.J. Loskutoff, Historical analysis of PAI-1 from its discovery to its poten-tial role in cell motility and disease. Thromb Haemost, 2005. 93(4): p. 631-40.
33. Strandberg, L., D. Lawrence, and T. Ny, The organization of the human-plasminogen-activator-inhibitor-1 gene. Implications on the evolution of the serine-protease inhibitor family. Eur J Biochem, 1988. 176(3): p. 609-16.
34. Nagamine, Y., Transcriptional regulation of the plasminogen activator inhibitor type 1--with an emphasis on negative regulation. Thromb Haemost, 2008. 100(6): p. 1007-13.

52
35. Eriksson, P., et al., Very-low-density lipoprotein response element in the promoter region of the human plasminogen activator inhibitor-1 gene implicated in the impaired fi brino-lysis of hypertriglyceridemia. Arterioscler Thromb Vasc Biol, 1998. 18(1): p. 20-6.
36. Hou, B., et al., Tumor necrosis factor alpha activates the human plasminogen activa-tor inhibitor-1 gene through a distal nuclear factor kappaB site. J Biol Chem, 2004. 279(18): p. 18127-36.
37. Du, X.L., et al., Hyperglycemia-induced mitochondrial superoxide overproduction acti-vates the hexosamine pathway and induces plasminogen activator inhibitor-1 expression by increasing Sp1 glycosylation. Proc Natl Acad Sci U S A, 2000. 97(22): p. 12222-6.
38. Chen, Y.Q., et al., Sp1 sites mediate activation of the plasminogen activator inhibitor-1 promoter by glucose in vascular smooth muscle cells. J Biol Chem, 1998. 273(14): p. 8225-31.
39. Eriksson, P., et al., Allele-specifi c increase in basal transcription of the plasminogen-activator inhibitor 1 gene is associated with myocardial infarction. Proc Natl Acad Sci U S A, 1995. 92(6): p. 1851-5.
40. de Lange, M., et al., The genetics of haemostasis: a twin study. Lancet, 2001. 357(9250): p. 101-5.
41. Doggen, C.J., et al., The 4G/5G polymorphism in the plasminogen activator inhibitor-1 gene is not associated with myocardial infarction. Thromb Haemost, 1999. 82(1): p. 115-20.
42. Jeng, J.R., Association of PAI-1 gene promoter 4g/5g polymorphism with plasma PAI-1 activity in Chinese patients with and without hypertension. Am J Hypertens, 2003. 16(4): p. 290-6.
43. Brogren, H., et al., Plasminogen activator inhibitor 1 expression in platelets is not infl u-enced by the 4G/5G promoter polymorphism. Thromb Res, 2008. 121(6): p. 793-7.
44. Rau, J.C., et al., Serpins in thrombosis, hemostasis and fi brinolysis. J Thromb Haemost, 2007. 5 Suppl 1: p. 102-15.
45. Chmielewska, J., M. Ranby, and B. Wiman, Kinetics of the inhibition of plasminogen ac-tivators by the plasminogen-activator inhibitor. Evidence for ‘second-site’ interactions. Biochem J, 1988. 251(2): p. 327-32.
46. Thorsen, S., et al., Kinetics of inhibition of tissue-type and urokinase-type plasminogen activator by plasminogen-activator inhibitor type 1 and type 2. Eur J Biochem, 1988. 175(1): p. 33-9.
47. Bjorquist, P., et al., Plasminogen activator inhibitor type-1 interacts exclusively with the proteinase domain of tissue plasminogen activator. Biochim Biophys Acta, 1994. 1209(2): p. 191-202.
48. Gaussem, P., P. Grailhe, and E. Angles-Cano, Sodium dodecyl sulfate-induced dissocia-tion of complexes between human tissue plasminogen activator and its specifi c inhibitor. J Biol Chem, 1993. 268(16): p. 12150-5.
49. Lindahl, T.L., P.I. Ohlsson, and B. Wiman, The mechanism of the reaction between hu-man plasminogen-activator inhibitor 1 and tissue plasminogen activator. Biochem J, 1990. 265(1): p. 109-13.

53
50. Stromqvist, M., et al., Characterisation of the complex of plasminogen activator inhibi-tor type 1 with tissue-type plasminogen activator by mass spectrometry and size-exclu-sion chromatography. Biochim Biophys Acta, 1996. 1295(1): p. 103-9.
51. Gong, L., et al., Structural basis of specifi c inhibition of tissue-type plasminogen activa-tor by plasminogen activators inhibitor-1. Data Brief, 2016. 6: p. 550-5.
52. Sancho, E., et al., Conformational studies on plasminogen activator inhibitor (PAI-1) in active, latent, substrate, and cleaved forms. Biochemistry, 1995. 34(3): p. 1064-9.
53. Kooistra, T., E.D. Sprengers, and V.W. van Hinsbergh, Rapid inactivation of the plasmin-ogen-activator inhibitor upon secretion from cultured human endothelial cells. Biochem J, 1986. 239(3): p. 497-503.
54. Levin, E.G., Quantitation and properties of the active and latent plasminogen activator inhibitors in cultures of human endothelial cells. Blood, 1986. 67(5): p. 1309-13.
55. Levin, E.G. and L. Santell, Conversion of the active to latent plasminogen activator inhibitor from human endothelial cells. Blood, 1987. 70(4): p. 1090-8.
56. Lindahl, T.L., O. Sigurdardottir, and B. Wiman, Stability of plasminogen activator in-hibitor 1 (PAI-1). Thromb Haemost, 1989. 62(2): p. 748-51.
57. Loskutoff, D.J., M. Sawdey, and J. Mimuro, Type 1 plasminogen activator inhibitor. Prog Hemost Thromb, 1989. 9: p. 87-115.
58. Declerck, P.J., et al., Purifi cation and characterization of a plasminogen activator in-hibitor 1 binding protein from human plasma. Identifi cation as a multimeric form of S protein (vitronectin). J Biol Chem, 1988. 263(30): p. 15454-61.
59. Mimuro, J. and D.J. Loskutoff, Purifi cation of a protein from bovine plasma that binds to type 1 plasminogen activator inhibitor and prevents its interaction with extracellular matrix. Evidence that the protein is vitronectin. J Biol Chem, 1989. 264(2): p. 936-9.
60. Wiman, B., et al., Plasminogen activator inhibitor 1 (PAI) is bound to vitronectin in plasma. FEBS Lett, 1988. 242(1): p. 125-8.
61. Gils, A., et al., Biochemical importance of glycosylation of plasminogen activator inhibi-tor-1. Thromb Haemost, 2003. 90(2): p. 206-17.
62. Serrano, R., et al., Tissue-specifi c PAI-1 gene expression and glycosylation pattern in insulin-resistant old rats. Am J Physiol Regul Integr Comp Physiol, 2009. 297(5): p. R1563-9.
63. Xue, Y., et al., Interfering with the inhibitory mechanism of serpins: crystal structure of a complex formed between cleaved plasminogen activator inhibitor type 1 and a reactive-centre loop peptide. Structure, 1998. 6(5): p. 627-36.
64. Dieval, J., et al., A lifelong bleeding disorder associated with a defi ciency of plasminogen activator inhibitor type 1. Blood, 1991. 77(3): p. 528-32.
65. Fay, W.P., et al., Brief report: complete defi ciency of plasminogen-activator inhibitor type 1 due to a frame-shift mutation. N Engl J Med, 1992. 327(24): p. 1729-33.
66. Carmeliet, P., et al., Plasminogen activator inhibitor-1 gene-defi cient mice. II. Effects on hemostasis, thrombosis, and thrombolysis. J Clin Invest, 1993. 92(6): p. 2756-60.
54
67. Fay, W.P., et al., Human plasminogen activator inhibitor-1 (PAI-1) defi ciency: character-ization of a large kindred with a null mutation in the PAI-1 gene. Blood, 1997. 90(1): p. 204-8.
68. Erickson, L.A., et al., Development of venous occlusions in mice transgenic for the plas-minogen activator inhibitor-1 gene. Nature, 1990. 346(6279): p. 74-6.
69. Eren, M., et al., Age-dependent spontaneous coronary arterial thrombosis in transgenic mice that express a stable form of human plasminogen activator inhibitor-1. Circulation, 2002. 106(4): p. 491-6.
70. Konstantinides, S., et al., Plasminogen activator inhibitor-1 and its cofactor vitronectin stabilize arterial thrombi after vascular injury in mice. Circulation, 2001. 103(4): p. 576-83.
71. Booth, N.A., et al., Lysis of platelet-rich thrombi: the role of PAI-1. Ann N Y Acad Sci, 1992. 667: p. 70-80.
72. Robbie, L.A., et al., Proteins of the fi brinolytic system in human thrombi. Thromb Hae-most, 1996. 75(1): p. 127-33.
73. Collet, J.P., et al., Acute release of plasminogen activator inhibitor-1 in ST-segment el-evation myocardial infarction predicts mortality. Circulation, 2003. 108(4): p. 391-4.
74. Hoekstra, T., et al., Plasminogen activator inhibitor-type 1: its plasma determinants and relation with cardiovascular risk. Thromb Haemost, 2004. 91(5): p. 861-72.
75. Tofl er, G.H., et al., Plasminogen activator inhibitor and the risk of cardiovascular dis-ease: The Framingham Heart Study. Thromb Res, 2016. 140: p. 30-5.
76. Dunn, E.J. and P.J. Grant, Type 2 diabetes: an atherothrombotic syndrome. Curr Mol Med, 2005. 5(3): p. 323-32.
77. Dunn, E.J., R.A. Ariens, and P.J. Grant, The infl uence of type 2 diabetes on fi brin struc-ture and function. Diabetologia, 2005. 48(6): p. 1198-206.
78. Schneiderman, J., et al., Increased type 1 plasminogen activator inhibitor gene expres-sion in atherosclerotic human arteries. Proc Natl Acad Sci U S A, 1992. 89(15): p. 6998-7002.
79. Sobel, B.E., et al., Increased plasminogen activator inhibitor type 1 in coronary artery atherectomy specimens from type 2 diabetic compared with nondiabetic patients: a po-tential factor predisposing to thrombosis and its persistence. Circulation, 1998. 97(22): p. 2213-21.
80. Sobel, B.E., D.J. Taatjes, and D.J. Schneider, Intramural plasminogen activator inhibi-tor type-1 and coronary atherosclerosis. Arterioscler Thromb Vasc Biol, 2003. 23(11): p. 1979-89.
81. Diebold, I., et al., The ‘PAI-1 paradox’ in vascular remodeling. Thromb Haemost, 2008. 100(6): p. 984-91.
82. Sobel, B.E., Increased plasminogen activator inhibitor-1 and vasculopathy. A reconcil-able paradox. Circulation, 1999. 99(19): p. 2496-8.
83. Fay, W.P., N. Garg, and M. Sunkar, Vascular functions of the plasminogen activation system. Arterioscler Thromb Vasc Biol, 2007. 27(6): p. 1231-7.

55
84. Schneider, D.J., et al., Attenuation of neointimal vascular smooth muscle cellularity in atheroma by plasminogen activator inhibitor type 1 (PAI-1). J Histochem Cytochem, 2004. 52(8): p. 1091-9.
85. Chang, Y., et al., From hematopoietic stem cells to platelets. J Thromb Haemost, 2007. 5 Suppl 1: p. 318-27.
86. Dale, G.L., Platelet kinetics. Curr Opin Hematol, 1997. 4(5): p. 330-4.
87. Rendu, F. and B. Brohard-Bohn, The platelet release reaction: granules’ constituents, secretion and functions. Platelets, 2001. 12(5): p. 261-73.
88. Booyse, F. and M.E. Rafelson, Jr., In vitro incorporation of amino-acids into the contrac-tile protein of human blood platelets. Nature, 1967. 215(5098): p. 283-4.
89. Booyse, F.M. and M.E. Rafelson, Jr., Stable messenger RNA in the synthesis of contrac-tile protein in human platelets. Biochim Biophys Acta, 1967. 145(1): p. 188-90.
90. Ts’ao, C.H., Rough endoplasmic reticulum and ribosomes in blood platelets. Scand J Haematol, 1971. 8(2): p. 134-40.
91. Kieffer, N., et al., Biosynthesis of major platelet proteins in human blood platelets. Eur J Biochem, 1987. 164(1): p. 189-95.
92. Newman, P.J., et al., Enzymatic amplifi cation of platelet-specifi c messenger RNA using the polymerase chain reaction. J Clin Invest, 1988. 82(2): p. 739-43.
93. Weyrich, A.S., et al., Signal-dependent translation of a regulatory protein, Bcl-3, in ac-tivated human platelets. Proc Natl Acad Sci U S A, 1998. 95(10): p. 5556-61.
94. Bugert, P., et al., Messenger RNA profi ling of human platelets by microarray hybridiza-tion. Thromb Haemost, 2003. 90(4): p. 738-48.
95. Gnatenko, D.V., et al., Transcript profi ling of human platelets using microarray and se-rial analysis of gene expression. Blood, 2003. 101(6): p. 2285-93.
96. Dittrich, M., et al., Analysis of SAGE data in human platelets: features of the transcrip-tome in an anucleate cell. Thromb Haemost, 2006. 95(4): p. 643-51.
97. McRedmond, J.P., et al., Integration of proteomics and genomics in platelets: a profi le of platelet proteins and platelet-specifi c genes. Mol Cell Proteomics, 2004. 3(2): p. 133-44.
98. Alhasan, A.A., et al., Circular RNA enrichment in platelets is a signature of transcrip-tome degradation. Blood, 2016. 127(9): e1-e11.
99. Cecchetti, L., et al., Megakaryocytes differentially sort mRNAs for matrix metallopro-teinases and their inhibitors into platelets: a mechanism for regulating synthetic events. Blood, 2011. 118(7): p. 1903-11.
100. Denis, M.M., et al., Escaping the nuclear confi nes: signal-dependent pre-mRNA splicing in anucleate platelets. Cell, 2005. 122(3): p. 379-91.
101. Lee, R.C., R.L. Feinbaum, and V. Ambros, The C. elegans heterochronic gene lin-4 en-codes small RNAs with antisense complementarity to lin-14. Cell, 1993. 75(5): p. 843-54.
102. Reinhart, B.J., et al., The 21-nucleotide let-7 RNA regulates developmental timing in Caenorhabditis elegans. Nature, 2000. 403(6772): p. 901-6.

56
103. Bartel, D.P., MicroRNAs: genomics, biogenesis, mechanism, and function. Cell, 2004. 116(2): p. 281-97.
104. Friedman, R.C., et al., Most mammalian mRNAs are conserved targets of microRNAs. Genome Res, 2009. 19(1): p. 92-105.
105. Osman, A. and K. Falker, Characterization of human platelet microRNA by quantitative PCR coupled with an annotation network for predicted target genes. Platelets, 2011. 22(6): p. 433-41.
106. Gidlof, O., et al., Platelets activated during myocardial infarction release functional miRNA, which can be taken up by endothelial cells and regulate ICAM1 expression. Blood, 2013. 121(19): p. 3908-17, S1-26.
107. Ple, H., et al., The repertoire and features of human platelet microRNAs. PLoS One, 2012. 7(12): p. e50746.
108. Nagalla, S., et al., Platelet microRNA-mRNA coexpression profi les correlate with platelet reactivity. Blood, 2011. 117(19): p. 5189-97.
109. Landry, P., et al., Existence of a microRNA pathway in anucleate platelets. Nat Struct Mol Biol, 2009. 16(9): p. 961-6.
110. Booth, N.A., et al., Plasminogen activator inhibitor (PAI-1) in plasma and platelets. Br J Haematol, 1988. 70(3): p. 327-33.
111. Lang, I.M. and R.R. Schleef, Calcium-dependent stabilization of type I plasminogen ac-tivator inhibitor within platelet alpha-granules. J Biol Chem, 1996. 271(5): p. 2754-61.
112. Kruithof, E.K., G. Nicolosa, and F. Bachmann, Plasminogen activator inhibitor 1: de-velopment of a radioimmunoassay and observations on its plasma concentration during venous occlusion and after platelet aggregation. Blood, 1987. 70(5): p. 1645-53.
113. Urden, G., et al., Immunological relationship between plasminogen activator inhibitors from different sources. Thromb Haemost, 1987. 57(1): p. 29-34.
114. Potter van Loon, B.J., et al., The amount of plasminogen, tissue-type plasminogen acti-vator and plasminogen activator inhibitor type 1 in human thrombi and the relation to ex-vivo lysibility. Thromb Haemost, 1992. 67(1): p. 101-5.
115. Brogren, H., et al., Platelets synthesize large amounts of active plasminogen activator inhibitor 1. Blood, 2004. 104(13): p. 3943-8.
116. Brogren, H., et al., Platelets retain high levels of active plasminogen activator inhibitor 1. PLoS One, 2011. 6(11): p. e26762.
117. Trost, S., R. Pratley, and B. Sobel, Impaired fi brinolysis and risk for cardiovascular dis-ease in the metabolic syndrome and type 2 diabetes. Curr Diab Rep, 2006. 6(1): p. 47-54.
118. Franchini, M., et al., The metabolic syndrome and the risk of arterial and venous throm-bosis. Thromb Res, 2008. 122(6): p. 727-35.
119. Alessi, M.C., et al., Adipose tissue and atherothrombosis. Pathophysiol Haemost Thromb, 2003. 33(5-6): p. 290-7.
120. Vague, P., et al., Correlation between blood fi brinolytic activity, plasminogen activator inhibitor level, plasma insulin level, and relative body weight in normal and obese sub-jects. Metabolism, 1986. 35(3): p. 250-3.

57
121. Alessi, M.C., M. Poggi, and I. Juhan-Vague, Plasminogen activator inhibitor-1, adipose tissue and insulin resistance. Curr Opin Lipidol, 2007. 18(3): p. 240-5.
122. Aso, Y., Plasminogen activator inhibitor (PAI)-1 in vascular infl ammation and thrombo-sis. Front Biosci, 2007. 12: p. 2957-66.
123. Hamsten, A., et al., Plasminogen activator inhibitor in plasma: risk factor for recurrent myocardial infarction. Lancet, 1987. 2(8549): p. 3-9.
124. Alessi, M.C. and I. Juhan-Vague, Contribution of PAI-1 in cardiovascular pathology. Arch Mal Coeur Vaiss, 2004. 97(6): p. 673-8.
125. Alessi, M.C. and I. Juhan-Vague, PAI-1 and the metabolic syndrome: links, causes, and consequences. Arterioscler Thromb Vasc Biol, 2006. 26(10): p. 2200-7.
126. Mertens, I., et al., Among infl ammation and coagulation markers, PAI-1 is a true compo-nent of the metabolic syndrome. Int J Obes (Lond), 2006. 30(8): p. 1308-14.
127. Lijnen, H.R., Role of fi brinolysis in obesity and thrombosis. Thromb Res, 2009. 123 Suppl 4: p. S46-9.
128. Primrose, J.N., et al., Reduction in factor VII, fi brinogen and plasminogen activator in-hibitor-1 activity after surgical treatment of morbid obesity. Thromb Haemost, 1992. 68(4): p. 396-9.
129. Mavri, A., et al., Subcutaneous abdominal, but not femoral fat expression of plasminogen activator inhibitor-1 (PAI-1) is related to plasma PAI-1 levels and insulin resistance and decreases after weight loss. Diabetologia, 2001. 44(11): p. 2025-31.
130. Ay, L., et al., Thrombin generation in morbid obesity: signifi cant reduction after weight loss. J Thromb Haemost, 2010. 8(4): p. 759-65.
131. van Dielen, F.M., et al., Macrophage inhibitory factor, plasminogen activator inhibi-tor-1, other acute phase proteins, and infl ammatory mediators normalize as a result of weight loss in morbidly obese subjects treated with gastric restrictive surgery. J Clin Endocrinol Metab, 2004. 89(8): p. 4062-8.
132. Mossberg KE, P.D., Welbourn R, le Roux CW, Brogren H, Differential response of plasma Plasminogen Activator Inhibitor-1 after Weight Loss Surgery in patients with or without Type 2 Diabetes. Surgery for Obesity and Related Diseases. In press., 2016.
133. Govindarajan, G., M.A. Alpert, and L. Tejwani, Endocrine and metabolic effects of fat: cardiovascular implications. Am J Med, 2008. 121(5): p. 366-70.
134. Alessi, M.C., et al., Production of plasminogen activator inhibitor 1 by human adipose tissue: possible link between visceral fat accumulation and vascular disease. Diabetes, 1997. 46(5): p. 860-7.
135. Juhan-Vague, I., et al., Plasminogen activator inhibitor-1, infl ammation, obesity, insulin resistance and vascular risk. J Thromb Haemost, 2003. 1(7): p. 1575-9.
136. Shimomura, I., et al., Enhanced expression of PAI-1 in visceral fat: possible contributor to vascular disease in obesity. Nat Med, 1996. 2(7): p. 800-3.
137. Skurk, T. and H. Hauner, Obesity and impaired fi brinolysis: role of adipose production of plasminogen activator inhibitor-1. Int J Obes Relat Metab Disord, 2004. 28(11): p. 1357-64.

58
138. Yarmolinsky, J., et al., Plasminogen activator inhibitor-1 and type 2 diabetes: a system-atic review and meta-analysis of observational studies. Sci Rep, 2016. 6: p. 17714.
139. Festa, A., et al., Elevated levels of acute-phase proteins and plasminogen activator inhib-itor-1 predict the development of type 2 diabetes: the insulin resistance atherosclerosis study. Diabetes, 2002. 51(4): p. 1131-7.
140. Festa, A., et al., Progression of plasminogen activator inhibitor-1 and fi brinogen levels in relation to incident type 2 diabetes. Circulation, 2006. 113(14): p. 1753-9.
141. Jankun, J., A. Al-Senaidy, and E. Skrzypczak-Jankun, Can inactivators of plasminogen activator inhibitor alleviate the burden of obesity and diabetes? (Review). Int J Mol Med, 2012. 29(1): p. 3-11.
142. Sobel, B.E., et al., Profi brinolytic, antithrombotic, and antiinfl ammatory effects of an insulin-sensitizing strategy in patients in the Bypass Angioplasty Revascularization In-vestigation 2 Diabetes (BARI 2D) trial. Circulation, 2011. 124(6): p. 695-703.
143. van der Bom, J.G., et al., The 4G5G polymorphism in the gene for PAI-1 and the circa-dian oscillation of plasma PAI-1. Blood, 2003. 101(5): p. 1841-4.
144. Chung, H.C., et al., Physiological and pathological changes of plasma urokinase-type plasminogen activator, plasminogen activator inhibitor-1, and urokinase-type plasmino-gen activator receptor levels in healthy females and breast cancer patients. Breast Can-cer Res Treat, 1998. 49(1): p. 41-50.
145. Giardina, E.G., et al., Dynamic variability of hemostatic and fi brinolytic factors in young women. J Clin Endocrinol Metab, 2004. 89(12): p. 6179-84.
146. Ottosson, M., et al., The effects of cortisol on the regulation of lipoprotein lipase activity in human adipose tissue. J Clin Endocrinol Metab, 1994. 79(3): p. 820-5.
147. Jaffe, E.A., et al., Culture of human endothelial cells derived from umbilical veins. Iden-tifi cation by morphologic and immunologic criteria. J Clin Invest, 1973. 52(11): p. 2745-56.
148. Chomczynski, P. and N. Sacchi, Single-step method of RNA isolation by acid guanidini-um thiocyanate-phenol-chloroform extraction. Anal Biochem, 1987. 162(1): p. 156-9.
149. Shevchenko, A., M. Wilm, and M. Mann, Peptide sequencing by mass spectrometry for homology searches and cloning of genes. J Protein Chem, 1997. 16(5): p. 481-90.
150. Hakansson, K., et al., Structural analysis of 2D-gel-separated glycoproteins from human cerebrospinal fl uid by tandem high-resolution mass spectrometry. J Proteome Res, 2003. 2(6): p. 581-8.
151. Haslam, S.M., S.J. North, and A. Dell, Mass spectrometric analysis of N- and O-glyco-sylation of tissues and cells. Curr Opin Struct Biol, 2006. 16(5): p. 584-91.
152. Higuchi, R., et al., Kinetic PCR analysis: real-time monitoring of DNA amplifi cation reactions. Biotechnology (N Y), 1993. 11(9): p. 1026-30.
153. User Bulletin #2. 2001, Applied Biosystems.
154. Fearns, C. and D.J. Loskutoff, Induction of plasminogen activator inhibitor 1 gene ex-pression in murine liver by lipopolysaccharide. Cellular localization and role of endog-enous tumor necrosis factor-alpha. Am J Pathol, 1997. 150(2): p. 579-90.

59
155. MacGregor, I.R. and N.A. Booth, An enzyme-linked immunosorbent assay (ELISA) used to study the cellular secretion of endothelial plasminogen activator inhibitor (PAI-1). Thromb Haemost, 1988. 59(1): p. 68-72.
156. Schleef, R.R., et al., The majority of type 1 plasminogen activator inhibitor associated with cultured human endothelial cells is located under the cells and is accessible to solution-phase tissue-type plasminogen activator. J Cell Biol, 1990. 110(1): p. 155-63.
157. Bastelica, D., et al., Stromal cells are the main plasminogen activator inhibitor-1-pro-ducing cells in human fat: evidence of differences between visceral and subcutaneous deposits. Arterioscler Thromb Vasc Biol, 2002. 22(1): p. 173-8.
158. Quax, P.H., et al., Endotoxin induction of plasminogen activator and plasminogen acti-vator inhibitor type 1 mRNA in rat tissues in vivo. J Biol Chem, 1990. 265(26): p. 15560-3.
159. Hamilton, J.A., et al., Macrophage colony-stimulating factor and granulocyte-macro-phage colony-stimulating factor stimulate the synthesis of plasminogen-activator inhibi-tors by human monocytes. Blood, 1993. 82(12): p. 3616-21.
160. Tipping, P.G., et al., Atheromatous plaque macrophages produce plasminogen activator inhibitor type-1 and stimulate its production by endothelial cells and vascular smooth muscle cells. Am J Pathol, 1993. 143(3): p. 875-85.
161. Kruithof, E.K., A. Gudinchet, and F. Bachmann, Plasminogen activator inhibitor 1 and plasminogen activator inhibitor 2 in various disease states. Thromb Haemost, 1988. 59(1): p. 7-12.
162. Heid, C.A., et al., Real time quantitative PCR. Genome Res, 1996. 6(10): p. 986-94.
163. Bustin, S.A., et al., The MIQE guidelines: minimum information for publication of quan-titative real-time PCR experiments. Clin Chem, 2009. 55(4): p. 611-22.
164. Stahlberg, A., M. Kubista, and M. Pfaffl , Comparison of reverse transcriptases in gene expression analysis. Clin Chem, 2004. 50(9): p. 1678-80.
165. Huggett, J., et al., Real-time RT-PCR normalisation; strategies and considerations. Genes Immun, 2005. 6(4): p. 279-84.
166. Vandesompele, J., et al., Accurate normalization of real-time quantitative RT-PCR data by geometric averaging of multiple internal control genes. Genome Biol, 2002. 3(7): p. RESEARCH0034.
167. de Jonge, H.J., et al., Evidence based selection of housekeeping genes. PLoS One, 2007. 2(9): p. e898.
168. Bas, A., et al., Utility of the housekeeping genes 18S rRNA, beta-actin and glyceral-dehyde-3-phosphate-dehydrogenase for normalization in real-time quantitative reverse transcriptase-polymerase chain reaction analysis of gene expression in human T lym-phocytes. Scand J Immunol, 2004. 59(6): p. 566-73.
169. Medinger, M., et al., Increased Dkk3 protein expression in platelets and megakaryocytes of patients with myeloproliferative neoplasms. Thromb Haemost, 2011. 105(1): p. 72-80.
170. Navarro-Nunez, L., et al., Rare homozygous status of P43 beta1-tubulin polymorphism causes alterations in platelet ultrastructure. Thromb Haemost, 2011. 105(5): p. 855-63.

60
171. Colombo, G., et al., Gene expression profi ling reveals multiple differences in platelets from patients with stable angina or non-ST elevation acute coronary syndrome. Thromb Res, 2011. 128(2): p. 161-8.
172. Lood, C., et al., Platelet transcriptional profi le and protein expression in patients with systemic lupus erythematosus: up-regulation of the type I interferon system is strongly associated with vascular disease. Blood, 2010. 116(11): p. 1951-7.
173. Tanaka, S., T. Furukawa, and S.A. Plotkin, Human cytomegalovirus stimulates host cell RNA synthesis. J Virol, 1975. 15(2): p. 297-304.
174. Piechaczyk, M., et al., Post-transcriptional regulation of glyceraldehyde-3-phosphate-dehydrogenase gene expression in rat tissues. Nucleic Acids Res, 1984. 12(18): p. 6951-63.
175. Pfaffl , M.W., et al., Determination of stable housekeeping genes, differentially regulated target genes and sample integrity: BestKeeper--Excel-based tool using pair-wise cor-relations. Biotechnol Lett, 2004. 26(6): p. 509-15.
176. Andersen, C.L., J.L. Jensen, and T.F. Orntoft, Normalization of real-time quantitative reverse transcription-PCR data: a model-based variance estimation approach to identify genes suited for normalization, applied to bladder and colon cancer data sets. Cancer Res, 2004. 64(15): p. 5245-50.
177. De Spiegelaere, W., et al., Reference Gene Validation for RT-qPCR, a Note on Different Available Software Packages. PLoS One, 2015. 10(3): p. e0122515.
178. Carthew, R.W. and E.J. Sontheimer, Origins and Mechanisms of miRNAs and siRNAs. Cell, 2009. 136(4): p. 642-55.
179. Zsori, K.S., et al., Validation of reference genes for the determination of platelet tran-script level in healthy individuals and in patients with the history of myocardial infarc-tion. Int J Mol Sci, 2013. 14(2): p. 3456-66.
180. Hong, Y., et al., Moderate genetic infl uences on plasma levels of plasminogen activator inhibitor-1 and evidence of genetic and environmental infl uences shared by plasminogen activator inhibitor-1, triglycerides, and body mass index. Arterioscler Thromb Vasc Biol, 1997. 17(11): p. 2776-82.
181. Cigolini, M., et al., Relationships of plasminogen activator inhibitor-1 to anthropometry, serum insulin, triglycerides and adipose tissue fatty acids in healthy men. Atherosclero-sis, 1994. 106(2): p. 139-47.
182. Erickson, L.A., C.M. Hekman, and D.J. Loskutoff, The primary plasminogen-activator inhibitors in endothelial cells, platelets, serum, and plasma are immunologically related. Proc Natl Acad Sci U S A, 1985. 82(24): p. 8710-4.
183. Simpson, A.J., et al., The platelet and plasma pools of plasminogen activator inhibitor (PAI-1) vary independently in disease. Br J Haematol, 1990. 75(4): p. 543-8.
184. Birdane, A., et al., The plasma levels of prostanoids and plasminogen activator inhibi-tor-1 in primary and secondary thrombocytosis. Clin Appl Thromb Hemost, 2005. 11(2): p. 197-201.
185. Cancelas, J.A., A. Garcia-Avello, and L.J. Garcia-Frade, High plasma levels of plasmin-ogen activator inhibitor 1 (PAI-1) in polycythemia vera and essential thrombocythemia are associated with thrombosis. Thromb Res, 1994. 75(5): p. 513-20.

61
186. Soeki, T., et al., Plasma and platelet plasminogen activator inhibitor-1 in patients with acute myocardial infarction. Jpn Circ J, 2000. 64(8): p. 547-53.
187. Loskutoff, D.J. and F. Samad, The adipocyte and hemostatic balance in obesity: studies of PAI-1. Arterioscler Thromb Vasc Biol, 1998. 18(1): p. 1-6.
188. Alessi, M.C., et al., Plasminogen activator inhibitor 1, transforming growth factor-be-ta1, and BMI are closely associated in human adipose tissue during morbid obesity. Diabetes, 2000. 49(8): p. 1374-80.
189. Morange, P.E., et al., PAI-1 produced ex vivo by human adipose tissue is relevant to PAI-1 blood level. Arterioscler Thromb Vasc Biol, 1999. 19(5): p. 1361-5.
190. Yudkin, J.S., et al., Lack of evidence for secretion of plasminogen activator inhibitor-1 by human subcutaneous adipose tissue in vivo. Thromb Res, 1999. 96(1): p. 1-9.
191. Lindeman, J.H., et al., Human visceral adipose tissue and the plasminogen activator inhibitor type 1. Int J Obes (Lond), 2007. 31(11): p. 1674-9.
192. Ferreiro, J.L., J.A. Gomez-Hospital, and D.J. Angiolillo, Platelet abnormalities in diabe-tes mellitus. Diab Vasc Dis Res, 2010. 7(4): p. 251-9.
193. Anfossi, G., I. Russo, and M. Trovati, Platelet dysfunction in central obesity. Nutr Metab Cardiovasc Dis, 2009. 19(6): p. 440-9.
194. Tschoepe, D., et al., Large platelets circulate in an activated state in diabetes mellitus. Semin Thromb Hemost, 1991. 17(4): p. 433-8.
195. Vizioli, L., S. Muscari, and A. Muscari, The relationship of mean platelet volume with the risk and prognosis of cardiovascular diseases. Int J Clin Pract, 2009. 63(10): p. 1509-15.
196. Mingrone, G. and L. Castagneto-Gissey, Mechanisms of early improvement/resolution of type 2 diabetes after bariatric surgery. Diabetes Metab, 2009. 35(6 Pt 2): p. 518-23.
197. Vinik, A.I., et al., Platelet dysfunction in type 2 diabetes. Diabetes Care, 2001. 24(8): p. 1476-85.
198. Kakouros, N., et al., Platelet function in patients with diabetes mellitus: from a theoreti-cal to a practical perspective. Int J Endocrinol, 2011. 2011: p. 742719.
199. Singer, J., et al., Effect of intensive glycemic control on platelet reactivity in patients with long-standing uncontrolled diabetes. Thromb Res, 2014. 134(1): p. 121-4.
200. Shlomai, G., et al., High-risk type-2 diabetes mellitus patients, without prior ischemic events, have normal blood platelet functionality profi les: a cross-sectional study. Cardio-vasc Diabetol, 2015. 14: p. 80.
201. Demirtunc, R., et al., The relationship between glycemic control and platelet activity in type 2 diabetes mellitus. J Diabetes Complications, 2009. 23(2): p. 89-94.
202. Owens, A.P., 3rd and N. Mackman, The antithrombotic effects of statins. Annu Rev Med, 2014. 65: p. 433-45.
203. Papazafi ropoulou, A., et al., Effects of oral hypoglycemic agents on platelet function. J Diabetes Complications, 2015. 29(6): p. 846-51.