Embed Size (px)
DESCRIPTION
Ask Me! FY 2006-2009 The Quality of Life of Marylanders With Developmental Disabilities Receiving DDA-Funded Support Prepared for the Maryland Developmental Disabilities Administration
Citation preview

Ask Me!sm FY 2006-2009
The Quality of Life of MarylandersWith Developmental DisabilitiesReceiving DDA-Funded Support
Prepared for theMaryland Developmental Disabilities Administration
byGordon Scott Bonham, Ph.D.
Bonham Research
Judy Volkman, BASarah Sorensen, MPSThe Arc of Maryland
December 2009
ASK ME! Survey
ASK ME! Survey

AuthorsGordon Scott Bonham has been the project�’s researcher from the initial development of the original questions to thepresent. He is President of Bonham Research, a private human services research and evaluation company. His 38years of developing and analyzing surveys have included research at Towson University, the University ofLouisville, and the National Center for Health Statistics. Dr. Bonham earned his Ph.D. in sociology from theUniversity of Michigan (Ann Arbor) and has a wide range of experience in surveys, social research, and programevaluation. The social health and well being of the individual in society has been the primary subject of his research,including a number of studies involving supports to people with intellectual and other developmental disabilities. Dr. Bonham is an Emeritus Board Member of The Arc of Baltimore.
Judy Volkman is the Ask Me! Project Manager at the Arc of Maryland and is in charge of all the field workactivities. She was supported by Nolie Rife, Suzy Fletcher and Brenda Davis as regional coordinators. Ann Shipleyscheduled interviews and arranged transportation.
Sarah Sorensen is Assistant Director of The Arc of Maryland. Ms. Sorensen holds a Master�’s Degree in PolicySciences from the University of Maryland Baltimore County. In addition to her responsibilities on the Ask Me!Project, she facilitates the statewide self-advocacy group, People On the Go, and works on policy issues of concernto persons with developmental disabilities and their families.
Committed and skilled interviewers, who themselves receive support funded by the Maryland DevelopmentalDisabilities Administration, make The Ask Me! Project possible. In FY2009, 29 peer interviewers worked for TheArc of Maryland, conducting an average of 91 interviews. The interviewers have an average of 5.8 years ofexperience, with three being new to the survey in FY2009 and six having ten or more years of experience. Oneinterviewer conducted telephone interviews and keyed most of the survey data (DE). The Ask Me! FY2009interviewers, with their years of experience shown in parentheses (), include:
Alisha Wright (1)Anne Bates (6)April Carr (4)Bernadette Quinn (5)Brian Plater (8)Bridgette Pressley (11)Carolina Cano (7)Christy Scott (3)Crystal Stephens (3)Diana Warther (7)
Emerald Coleman (3)Greg Gray (6)James Devore (12)John Giles (2)Kathy Gentile (1)Linda Cooper (9)Lois Southard (1)Lori Powell (11)Marianne McNally (4, DE)Michael Carter (2)
Michael Raidt (10)Patrick Rhinehart (6)Peggy Nazelrod (4)Reta Cooper (2)Robert Heil (6)Scott Heim (11)Valerie Smith (4)Vernon DeHaven (10)Vicki Mills (9)
Ask Me! has a training manual available for organizations interested in conducting the project in other states. Themanual provides all necessary materials and information to conduct the survey. It is available at cost and includesthe survey, interview protocol and interviewer training information. All documents are also on a diskette. Toprotect the integrity of the project, The Arc of Maryland has developed a licensing agreement for entities that wish tobecome certified to use the survey. For additional information, contact Judy Volkman, The Arc of Maryland, 49 OldSolomons Island Rd., Suite 205, Annapolis, MD 21401, 888-272-3449, [email protected].
This report can be viewed or downloaded as an Adobe Acrobat file from the website of the Maryland DevelopmentalDisability Administration, http://www.dhmh.state.md.us/dda/ReportableInc/Ask09Report.pdf . It, and otherpublications listed at the end of this report, can be accessed through the website of Bonham Research,http://www.bonhamresearch.com.

Ask Me!sm Project FY2009 -- The Arc of Maryland December 2009 Page i
Ask Me!sm FY 2006-2009Executive Summary
The FY2009 Ask Me! collected information between August 2008 and June 2009 for about1,200 people with developmental disabilities 18 years and over who are supported by 45community provider agencies. Over the four years between FY2006 and 2009, Ask Me! Surveyswere conducted for about 5,000 people at 120 agencies supporting ten or more adults. Theserepresent about 13,000 people at the 155 community provider agencies that received funds fromthe Maryland Developmental Disabilities Administration (DDA). Peer interviewers directlyinterviewed 77% of the sampled people, including 19% of those classified with profoundintellectual disability. They interviewed proxies for those unable to respond for themselves.
Quality of Life Change in Maryland
The quality of life in eight domains has beenmeasured in two ways annually in Maryland frombetween FY2002 and FY2009. The first is thepercent reporting a positive quality of life, and thesecond is the average quality of life on a scale of 0-10. The increase between FY2002 and FY2009 ofthe two measures had three general patterns:
Consistent linear increase�• Rights--10.1% in positive quality of life
(see chart) and 0.6 points in the average quality of life;�• Self-Determination�–8.3% positive, 0.5 average;�• Social Inclusion�–5.9% positive, 0.5 average;�• Personal Development�–6.8% positive, 0.4 average.
Mixed linear and curvilinear increase�• Physical Well-being�–4.4% positive
linearly, 0.4 average with a plateau;�• Emotional Well-being�–4.3% positive
linearly, 0.4 average with a plateau;�• Interpersonal Relations�–7.4% positive with
peak, 0.6 average with a plateau.
No statistical pattern of change�• Material Well-being�–5.7% positive, 0.2
average, highest in FY2004 (see chart).
Quality of life remained highest throughout the eight years in the domains of Physical Well-being and Emotional Well-being. It remained lowest in the domains of Self-Determination andRights. The differences, however, decreased.
56%58%60%62%64%66%68%70%72%74%76%
FY02 FY03 FY04 FY05 FY06 FY07 FY08 FY09
Rights continuously increased between FY2002 and FY2009
No trend in Material Well-being
60%
65%
70%
75%
80%
85%
90%
FY02 FY03 FY04 FY05 FY06 FY07 FY08 FY09

Page ii December 2009 Ask Me!sm Project FY2009 -- The Arc of Maryland
People interviewed in FY2009 gave significantlymore favorable responses to six questions thanpeople interviewed in FY2008. The greatest one-year increase was in voting, from 25% to 36%, (See chart.) The second greatest increase came inchoosing house or roommates, from 57% to 62%. Choosing house or roommates also had the greatestaverage increase over the eight years of the AskMe! Survey�–2.0 percentage points per year. Thiswas followed by people helping them when theymake a mistake�–1.9 percentage points peryear�–and is it easy to say something when youhave a problem with staff�–1.8 percentage pointsper year. Together, 34 of the 48 indicator questions had significant increases in favorableresponses. No question had a significant decline over the eight years.
Person and Service Characteristics and Quality of Life
People who respond for themselves reported lower quality of life in the domains of PhysicalWell-being and Emotional Well-being than did proxies for people who could not respond forthemselves. Self respondents reported higher quality of life than did proxies in the other sixdomains and in Transportation Availability. Self and proxy reports often differ on whatcharacteristics relate to quality of life.
In the domain of Material Well-being, whichchanged least over the past eight years, both selfand proxy respondents reported higher MaterialWell-being for people who received supportedemployment services and for people who considertransportation more available (solid arrows in thechart.) Self respondents who lived in the westernor southern DDA regions, and/or whose agenciestook them places other than work or their dayprograms, reported higher Material Well-beingthan those living in the central or eastern regionsand/or who did not receive evening and weekendtrips. Self respondents with individual supportservices and community supported living arrangements reported lower Material Well-being thanthose not receiving these services (dashed arrows), possibly because they were more aware or orhad more control over their financial affairs. Proxies reported higher Material Well-being forthose with head injuries, those with greater intellectual abilities, or those receiving residentialservices than for those with other personal characteristics or services.
Questions with greatest increases
0%
10%
20%
30%
40%
50%
60%
70%
Choose housemates Vote in elections
% F
avor
able
FY02 FY03 FY04 FY05 FY06 FY07 FY08 FY09
Self and proxies agree a little on what affects Material Well-being
MaterialWell-being
Supported Employment
Intellectual Ability
Western RegionSouthern Region
Residential Services
Transportation Availability
Self
Proxy
Both
Evening/Weekend Trips
Individual Support ServicesCommunity Supported Living
Head Injury

Ask Me!sm Project FY2009 -- The Arc of Maryland December 2009 Page iii
In the domain of Rights, which has changed themost over the past eight years, both self and proxyreports show that greater perception ofTransportation Availability is related to greaterRights. (See chart.) Self respondents receivingday habilitation report lower rights than thosereceiving only other types of services. Proxiesmay not be too different in this respect, as theyreport higher Rights for the few who were insupported employment compared to those whoreceived day habilitation or no support forweekday activities. Only proxies reported greaterRights for people with more intellectual ability,and for people who lived in the western and southern regions of Maryland.
No characteristics of individuals and their services were as strongly associated with quality oflife as who responded (or the ability to respond) and the perceived availability of transportation. The latter had the strongest relationship to quality of life in six domains, and who responded hadthe strongest relationship to quality of life in two domains.
Quality of Life at Maryland Agencies
Survey data are available for 119community agencies betweenFY2006 and FY2009. PhysicalWell-being varied between 7.1 and9.8 among the agencies, with 70%between 8.2 and 9.2. (See chart.) The difference in Emotional Well-being between the highest and thelowest agency was greater than inPhysical Well-being, but 70% of theagencies were in a narrower range. Agencies varied the most in Rights(3.3 to 8.4), with six agencieshaving unfavorable scores. Theyvaried next most in Self-Determination, with four havingunfavorable scores.
Characteristics of the people agencies support, and the services agencies provide, explain theleast variation (14%) in Interpersonal Relations and the most (42%) in Rights. One-third of thevariation in Material Well-being can be explained by western and southern geographic location(higher than central and eastern location) and intellectual ability (higher at agencies supporting
Self and proxies agree a little on what affects Rights
RightsSupported Employment
Intellectual Ability
TransportationAvailability
Western Region
Southern Region
Self
Proxy
Both
Day Habilitation
Quality of life varies among agencies
3456789
10
Physica
l Well
being
Emotion
al Well
being
Mater
ial Well
being
Interp
ersonal
Relations
Social I
nclusio
n
Personal D
evelo
pment
Self-D
eterm
ination
Rights

Page iv December 2009 Ask Me!sm Project FY2009 -- The Arc of Maryland
people with greater intellectual abilities). Two-fifths of the variation in Rights can be explainedby the percent who responded for themselves (higher Rights with greater self response), southernlocation (higher Rights than in other areas), cerebral palsy (lower Rights with higherpercentages), hearing impairments (lower Rights with higher percentages), and residentialservices (lower Rights with higher percentages). The characteristics associated with the qualityof life in more than one domain were as follows:
�• Western DDA region (higher in 6 domains);�• Southern DDA region (higher in 3 domains);�• Greater intellectual ability (higher in 3 domains);�• Greater self response (higher in two domains, lower in one domain);�• Greater percent with cerebral palsy (lower in 3 domains);�• Greater percent with supported employment (higher in 2 domains);�• Greater percent with residential services (lower in 2 domains).
Survey data were collected for 108 agencies in both the FY2002-FY2005 cycle and the FY2006-FY2009 cycle. Quality of life scores by agency in the two cycles were most similar in thedomains of Interpersonal Relations and Self-Development. They were least similar in thedomain of Emotional Well-being. Material Well-being scores declined for about as manyagencies as they increased, and in only 5% of the agencies did it increase by 1.0 point or more. In contrast, average Rights scores increased for 75% of the agencies, and increased by 1.0 pointor more for 21% of the agencies.
No agency characteristic had a significant relationship with change in Material Well-being. Thelevel of Material Well-being in the second cycle was only associated with the level of MaterialWell-being in the first cycle. While southern region, intellectual abilities, supportedemployment, and behavior problems affected the first cycle�’s reporting of Material Well-being,these characteristics had no independent direct effect on the second cycle�’s reporting.
The level of Rights reported during the secondcycle was affected by the level of Rights reportedduring the first cycle, but also by five othercharacteristics. Given the same level of Rightsreported in cycle one, southern agencies and/oragencies with higher rates of self response hadhigher rights reported in the second cycle thanagencies in other DDA regions and/or agencieswith lower rates of self response. Rights startedout higher at agencies with high self response, andincreased more rapidly among those agenciesbetween cycle one and cycle two. Agencies in thesouthern region did not start out with higher Rightsthan agencies in other regions, but Rights increased faster among southern agencies over the fouryears more than at agencies in other regions. Rights increased less rapidly between the two
Agency characteristics affect change in Rights
Cycle 2Rights
% Self Response
% Cerebral Palsy
Southern RegionCycle 1Rights
% Residential Services
% Hearing Impairment

Ask Me!sm Project FY2009 -- The Arc of Maryland December 2009 Page v
cycles at agencies primarily providing residential services, those with larger percentages ofpeople with cerebral palsy, and those with larger percentages of people with hearing impairment.
Discussion and Suggestions
The increases between FY2002 and FY2008 in the quality of life of adults in Maryland withdevelopmental disabilities suggest that the Ask Me! Survey has been effective in giving a voice topeople supported by Maryland community provider agencies, and that DDA, communityagencies, and advocates are listening. DDA initially set its �‘Management by Objectives�’ goal toincrease Personal Development based on FY2002 findings. The FY2004 and FY2005 Ask Me!reports identified rights as the only domain in which significant increases had failed to occur. The FY2004 report included the recommendation:
Physical and emotional well-being are foundational to a life of quality and shouldbe maintained, but attention should now turn to increasing self-determination andrights.
The FY2005 report recommended:
Providers should focus on enhancing rights through enhancing self-determinationand personal development.
While DDA did not change its official goal, it increased its training on Self-Determination andRights. The Arc of Maryland increased its efforts to promote Self-Determination and Rights. Apparently many community agencies followed the recommendations, especially in the southernDDA region. As a result, the quality of life increased more, and more consistently during thesecond four-year cycle in Self-Determination and Rights than in the other six domains. Increases still occurred in the other domains, and seem to be continuing to increase in all butMaterial Well-being.
The increases in quality of life between FY2002 and FY2009 show that quality of life isdynamic, not static. Yet the strongest predictor of the quality of life reported for agencies wasthe quality of life reported for the agencies four years before. The Ask Me! Survey providesinformation that agencies can use in evaluating how they are contributing to the quality of life ofthe people they support and how they compare to other agencies. The survey also providesinformation to DDA to set and pursue system goals, and to individuals and families as they seeksupport for living a life of quality. Based upon the survey findings highlighted in this report, theresearcher offers the following suggestions:
Suggestion 1. Increase the emphasis that is placed on Material Well-being, without neglectingthe progress that has been made in Self-Determination and Rights. The greatest impact onMaterial Well-being potentially comes from expanding paid work opportunities throughsupported community employment.

Page vi December 2009 Ask Me!sm Project FY2009 -- The Arc of Maryland
Suggestion 2. Help people be aware of all the transportation available to them to move abouttheir community, as perceptions of transportation availability are strongly related to perceptionsof quality of life. The objective number of trips known to staff has little relation to perceptions ofavailability, but transportation is seen as more available in western and southern Maryland, atsmaller than larger agencies, and by proxies more than self respondents.
Suggestion 3. Community agencies should set specific goals to enhance quality of life indomains with relatively low scores, and research concrete strategies for achieving them. Otherwise quality of life will remain similar to the current levels for the people they support.
Suggestion 4. Educate staff and families about how the self respondents they support viewquality of life. Knowing this information could help to reduce potential bias when deciding whatmight enhance the quality of life for people unable to respond for themselves.
Suggestion 5. DDA could identify existing data on individuals and agencies that can be linkedwith the Ask Me! data to identify other factors that potentially affect quality of life.

Ask Me!sm Project FY2009 -- The Arc of Maryland December 2009 Page vii
Table of Contents
Executive Summary . . . . . . . . . . . . . . . . . . . . . . . . . . . . . . . . . . . . . . . . . . . . . . . . . . . . . . . . . . . . i
Table of Contents . . . . . . . . . . . . . . . . . . . . . . . . . . . . . . . . . . . . . . . . . . . . . . . . . . . . . . . . . . . . viiList of Figures . . . . . . . . . . . . . . . . . . . . . . . . . . . . . . . . . . . . . . . . . . . . . . . . . . . . . . . . viiiList of Tables . . . . . . . . . . . . . . . . . . . . . . . . . . . . . . . . . . . . . . . . . . . . . . . . . . . . . . . . . viii
Background . . . . . . . . . . . . . . . . . . . . . . . . . . . . . . . . . . . . . . . . . . . . . . . . . . . . . . . . . . . . . . . . . . 1
Project Description . . . . . . . . . . . . . . . . . . . . . . . . . . . . . . . . . . . . . . . . . . . . . . . . . . . . . . . . . . . . 3Sample . . . . . . . . . . . . . . . . . . . . . . . . . . . . . . . . . . . . . . . . . . . . . . . . . . . . . . . . . . . . . . . . 3Survey Procedures . . . . . . . . . . . . . . . . . . . . . . . . . . . . . . . . . . . . . . . . . . . . . . . . . . . . . . . 5Demographic Characteristics . . . . . . . . . . . . . . . . . . . . . . . . . . . . . . . . . . . . . . . . . . . . . . . 5Support Services . . . . . . . . . . . . . . . . . . . . . . . . . . . . . . . . . . . . . . . . . . . . . . . . . . . . . . . . 6
Quality of Life in Maryland: FY2002-FY2009 . . . . . . . . . . . . . . . . . . . . . . . . . . . . . . . . . . . . . . . 7Positive Quality of Life . . . . . . . . . . . . . . . . . . . . . . . . . . . . . . . . . . . . . . . . . . . . . . . . . . . 7Average Quality of Life . . . . . . . . . . . . . . . . . . . . . . . . . . . . . . . . . . . . . . . . . . . . . . . . . . . 9Program Direction - DDA . . . . . . . . . . . . . . . . . . . . . . . . . . . . . . . . . . . . . . . . . . . . . . . . 11Transportation Availability . . . . . . . . . . . . . . . . . . . . . . . . . . . . . . . . . . . . . . . . . . . . . . . 12Responses to Individual Questions . . . . . . . . . . . . . . . . . . . . . . . . . . . . . . . . . . . . . . . . . 13
Quality of Life for Individuals: FY2006-FY2009 . . . . . . . . . . . . . . . . . . . . . . . . . . . . . . . . . . . . 17Personal Characteristics . . . . . . . . . . . . . . . . . . . . . . . . . . . . . . . . . . . . . . . . . . . . . . . . . . 18Service Characteristics . . . . . . . . . . . . . . . . . . . . . . . . . . . . . . . . . . . . . . . . . . . . . . . . . . . 19Self and Proxy Differences . . . . . . . . . . . . . . . . . . . . . . . . . . . . . . . . . . . . . . . . . . . . . . . 19
Quality of Life at Agencies: FY2006-FY2009 . . . . . . . . . . . . . . . . . . . . . . . . . . . . . . . . . . . . . . 24Agency Variation . . . . . . . . . . . . . . . . . . . . . . . . . . . . . . . . . . . . . . . . . . . . . . . . . . . . . . . 24Agency Quality and Agency Characteristics . . . . . . . . . . . . . . . . . . . . . . . . . . . . . . . . . . 25Agency Change Over Time . . . . . . . . . . . . . . . . . . . . . . . . . . . . . . . . . . . . . . . . . . . . . . . 27
Summary of Previous Ask Me! Findings . . . . . . . . . . . . . . . . . . . . . . . . . . . . . . . . . . . . . . . . . . . 32Individual Characteristics . . . . . . . . . . . . . . . . . . . . . . . . . . . . . . . . . . . . . . . . . . . . . . . . 32Service Characteristics . . . . . . . . . . . . . . . . . . . . . . . . . . . . . . . . . . . . . . . . . . . . . . . . . . . 32Staff Characteristics . . . . . . . . . . . . . . . . . . . . . . . . . . . . . . . . . . . . . . . . . . . . . . . . . . . . . 33Agency Characteristics . . . . . . . . . . . . . . . . . . . . . . . . . . . . . . . . . . . . . . . . . . . . . . . . . . 33Quality of Life Measurement . . . . . . . . . . . . . . . . . . . . . . . . . . . . . . . . . . . . . . . . . . . . . . 34
Discussion . . . . . . . . . . . . . . . . . . . . . . . . . . . . . . . . . . . . . . . . . . . . . . . . . . . . . . . . . . . . . . . . . . 35Quality . . . . . . . . . . . . . . . . . . . . . . . . . . . . . . . . . . . . . . . . . . . . . . . . . . . . . . . . . . . . . . 35Quality of Life Increase in Maryland . . . . . . . . . . . . . . . . . . . . . . . . . . . . . . . . . . . . . . . 37Quality of Life Differences for Individuals . . . . . . . . . . . . . . . . . . . . . . . . . . . . . . . . . . . 38

Page viii December 2009 Ask Me!sm Project FY2009 -- The Arc of Maryland
Quality of Life Among Agencies . . . . . . . . . . . . . . . . . . . . . . . . . . . . . . . . . . . . . . . . . . . 39Suggestions for Consideration . . . . . . . . . . . . . . . . . . . . . . . . . . . . . . . . . . . . . . . . . . . . . 40
References . . . . . . . . . . . . . . . . . . . . . . . . . . . . . . . . . . . . . . . . . . . . . . . . . . . . . . . . . . . . . . . . . . 42
Appendix . . . . . . . . . . . . . . . . . . . . . . . . . . . . . . . . . . . . . . . . . . . . . . . . . . . . . . . . . . . . . . . . . . . 46Appendix A. Survey Methods . . . . . . . . . . . . . . . . . . . . . . . . . . . . . . . . . . . . . . . . . . . . 47Appendix B. Detailed Tables . . . . . . . . . . . . . . . . . . . . . . . . . . . . . . . . . . . . . . . . . . . . . 59Appendix C. Quality of Life at Maryland Provider Agencies . . . . . . . . . . . . . . . . . . . . 69
List of Figures
Figure 1. Provider Sample Frame . . . . . . . . . . . . . . . . . . . . . . . . . . . . . . . . . . . . . . . . . . . . . . . . 3Figure 2. Response of People Selected for Interview: FY2009 . . . . . . . . . . . . . . . . . . . . . . . . . . 4Figure 3. Percent of People Responding for Themselves, by Level of Intellectual Ability . . . . 4Figure 4. Percent by Characteristics . . . . . . . . . . . . . . . . . . . . . . . . . . . . . . . . . . . . . . . . . . . . . . 5Figure 5. Percent of Persons by Type of Support . . . . . . . . . . . . . . . . . . . . . . . . . . . . . . . . . . . . 6Figure 6. Percent with Positive Quality of Life by Domain and Year . . . . . . . . . . . . . . . . . . . . . 7Figure 7. Average Quality of Life by Domain and Year . . . . . . . . . . . . . . . . . . . . . . . . . . . . . . . 9Figure 8. Trend in Average Quality of Life, by Domain: FY2002-FY2009 . . . . . . . . . . . . . . . 10Figure 9. Average Availability of Transportation, by Fiscal Year . . . . . . . . . . . . . . . . . . . . . . 12Figure 10. Characteristics Affecting Transportation Availability . . . . . . . . . . . . . . . . . . . . . . . 13Figure 11. Question with More Favorable Responses in FY2009 than in FY2008 . . . . . . . . . . 14Figure 12. Person Characteristics and Quality of Life, by Domain ( coefficient) . . . . . . . . . . 17Figure 13. Average Quality of Life and Transportation Availability, by Respondent . . . . . . . 18Figure 14. Ability to Consent Questions . . . . . . . . . . . . . . . . . . . . . . . . . . . . . . . . . . . . . . . . . . 19Figure 15. Direct Effects of Person and Service Characteristics on Material Well-being and
Indirect Effects through Transportation Availability . . . . . . . . . . . . . . . . . . . . . . . . . . . 21Figure 16. Direct Effects of Person and Service Characteristics on Rights, and Indirect Effects
through Transportation Availability . . . . . . . . . . . . . . . . . . . . . . . . . . . . . . . . . . . . . . . . 22Figure 17. Average Quality of Life Among Top 20%, Middle ;70%, and Bottome 10% of
Agencies . . . . . . . . . . . . . . . . . . . . . . . . . . . . . . . . . . . . . . . . . . . . . . . . . . . . . . . . . . . . . . 24Figure 18. Percent of Agencies with Quality Extremes, by Size . . . . . . . . . . . . . . . . . . . . . . . . 25Figure 19. Relation of Agency Characteristics with Agency Quality of Life, by Domain (
coefficient) . . . . . . . . . . . . . . . . . . . . . . . . . . . . . . . . . . . . . . . . . . . . . . . . . . . . . . . . . . . . 26Figure 20. Agency Characteristics and Transportation Availability at Agencies . . . . . . . . . . . 27Figure 21. Percent of Agencies by Change in Quality of Life over Four Years and Domain . . 28Figure 22. Changes in Agency Material Well-being . . . . . . . . . . . . . . . . . . . . . . . . . . . . . . . . . 29Figure 23. Agency Change in Rights . . . . . . . . . . . . . . . . . . . . . . . . . . . . . . . . . . . . . . . . . . . . . 30Figure 24. Changes for Ask Me! Survey-2sm . . . . . . . . . . . . . . . . . . . . . . . . . . . . . . . . . . . . . . . . 36Figure A25. Cronbach�’s Alphas for Scale Reliability . . . . . . . . . . . . . . . . . . . . . . . . . . . . . . . . 56
List of Tables

Ask Me!sm Project FY2009 -- The Arc of Maryland December 2009 Page ix
Table 1. Percent Giving the Favorable Response by Question and Year . . . . . . . . . . . . . . . . . 15Table A1. People Supported by Maryland DDA, by Fiscal Year^ . . . . . . . . . . . . . . . . . . . . . . 47Table A2. Community Providers by Size and Year Selected for Interviews . . . . . . . . . . . . . . . 48Table A3. Final Field Status . . . . . . . . . . . . . . . . . . . . . . . . . . . . . . . . . . . . . . . . . . . . . . . . . . . . 53Table A4. Weight Characteristics . . . . . . . . . . . . . . . . . . . . . . . . . . . . . . . . . . . . . . . . . . . . . . . 55Table B1. Annual Trend in Quality of Life over Foura and Eightb Years . . . . . . . . . . . . . . . . . 59Table B2. Person-Level Correlation Coefficients Between Quality of Life Domains and Person
and Service Characteristics: FY2006-FY2009 . . . . . . . . . . . . . . . . . . . . . . . . . . . . . . . . 60Table B3. Standardized Multiple Regression* Coefficients ( ) of Quality of Life Domains on
Person and Support Characteristics . . . . . . . . . . . . . . . . . . . . . . . . . . . . . . . . . . . . . . . . . 63Table B4. Correlation Coefficients of Agency Quality of Life with Agency Characteristics and
Previous Quality of Life . . . . . . . . . . . . . . . . . . . . . . . . . . . . . . . . . . . . . . . . . . . . . . . . . 65Table B5. Regression of Agency Quality of Life on Person and Service Characteristics: FY2006
. . . . . . . . . . . . . . . . . . . . . . . . . . . . . . . . . . . . . . . . . . . . . . . . . . . . . . . . . . . . . . . . . . . . . 68

Ask Me!sm Project FY2009 -- The Arc of Maryland December 2009 Page 1
Background
The Ask Me! Survey has been used annually since FY2002 to collect information from aprobability sample of people receiving support from all Maryland community providers throughfunds from the Maryland Developmental Disabilities Administration (DDA). The Ask Me!Survey measures people�’s perceptions of the quality of their lives in eight domains. People�’squality of life is based upon objective circumstances mediated by the individuals�’ perceptions, values, and life experiences. Quality of life is different than satisfaction with services, and itmay be possible to provide quality services without improving people�’s overall quality of life. People may view quality of life differently, and the Ask Me! Survey allows people withdevelopmental disabilities to define quality of life for themselves. People with developmentaldisabilities helped develop the survey instrument and procedures, promote the survey, conductthe interviews, and key the data into the computer. This involvement of people withdevelopmental disabilities provides data on quality of life that are valid, reliable, and useful forprogram enhancement.
The Maryland DDA sponsors four-year cycles of the Ask Me! Survey. A random sample ofabout 30 adults is interviewed from each of about 45 agencies, sampled annually from allcommunity agencies in Maryland that support ten or more individuals. Large agenciesparticipate every year, middle-size agencies are selected to participate every other year, andsmall agencies participate once in each four-year cycle. The exclusion of very small agenciesand micro-boards, supporting fewer than ten people, results in a very small fraction of peoplewhom DDA supports in the community having no opportunity to participate. This reportpresents data from the Ask Me! Survey during the second cycle of interviews (FY2006-FY2009). It updates the agency profiles included in the last three annual reports with quality of life scoresaveraged to the middle of the four-year period. It analyzes differences among agencies surveyedduring the FY2006-FY2009 cycle, and how agencies interviewed during the FY2002-FY2005cycle have changed over the four-year interval.
Quality of life is both an important concept in program planning and in evaluating outcomes(Schalock, Bonham and Verdugo, 2008). The Ask Me! Project began in FY1998 with three pilotyears using a modified version of the Schalock and Keith (1993) Quality of Life Questionnaire. It developed the completely new Ask Me! Survey in FY2001 that reflected the questions ofMaryland consumers (People on the Go, 1996) and newer developments in the quality of lifefield (Schalock and Verdugo, 2002). The Ask Me! Project incorporated the use of peerinterviewers (Basehart, Marchand, and Bonham, 2003). Ask Me! findings have been used at theorganization and system level to guide change (Keith and Bonham, 2005), and Maryland is oneof only a few states to make comparable agency-level quality of life scores available to thepublic (Bonham, Basehart and Marchand, 2005). The Ask Me! Project involves the fourpremises of participatory action research (Whitney-Thomas, 1996): (1) people withdevelopmental disabilities identify the specific issues that are important to their quality of life,(2) people with developmental disabilities are asked directly about their own lives, (3) peoplewith developmental disabilities are the interviewers that collect information from their peers, and(4) people with developmental disabilities are empowered by the collected information.

Page 2 December 2009 Ask Me!sm Project FY2009 -- The Arc of Maryland
Data from the Ask Me! Survey is useful for quality management on three levels: state-level,agency-level, and person-level. The DDA uses the Ask Me! results to develop and measureachievement of its goals of personal development, self-determination and social inclusion as apart of the state budgetary process. The Arc of Maryland uses Ask Me! results to guide itsadvocacy and training programs. Agencies participating in the Ask Me! Survey receive summarydata, and the unidentified responses of the people they support, to help them enhance theirprograms and measure achievement of outcomes included in the quality assurance plans. Individuals and families have Ask Me! quality of life findings available as a resource in seekingthe most appropriate agency for providing support services.

1The DDA files represent authorization to provide support, not the billing for services. Some differencesmay be due to the time lag between sample selection and interviewing. People who agencies reported as deceased orno longer living in Maryland were treated as not eligible for sample selection.
Ask Me!sm Project FY2009 -- The Arc of Maryland December 2009 Page 3
Stratum 1 (350+ adults)�• 10 agencies provide 34% of supports�• 10 sampled every yearStratum 2 (150-349 adults) �• 22 agencies provide 29% of supports�• 10 sampled in FY2006 and FY2008�• 12 sampled in FY2007 and FY2009Stratum 3 (51-149 adults) �• 55 agencies provide 30% of supports�• 14 sampled in FY2006�• 12 sampled in FY2007�• 15 sampled in FY2008�• 11 sampled in FY2009Stratum 4 (10-50 adults) �• 32 agencies provide 6% of supports�• 6 sampled in FY2006�• 10 sampled in FY2007�• 10 sampled in FY2008�• 12 sampled in FY2009Stratum 5 (1-9 adults) �• 34 entities provide 0.7% of supports�• Not included in sample
Figure 1. Provider Sample Frame
Project Description
Sample
The FY2009 Ask Me! Project collected surveyinformation between August 2008 and June 2009for 1,160 people with developmental disabilitieswho are served by 45 community provideragencies. The agencies were sampled according totheir size strata, and people were randomlyselected within these agencies. (See Figure 1.) This two-stage sample frame represented 13,148people 18 years of age and over and 155community agencies funded by the MarylandDDA. Adults received support from an average of1.23 agencies, and 33 people were selected twiceat two different agencies for an effective samplesize of 1,193 when summed across agencies. (SeeAppendix Table A1 for details.) Entities instratum five that served fewer than ten adults werenot included in the sample. They provide servicesto 0.7% of the people supported with DDA funds,but half of the people they support from alsoreceive support from agencies in the other fourstrata. Additionally, about 16% of the peopleincluded in the DDA files were not included in theAsk Me! sample selection because they were lessthan 18 years of age, received only servicecoordination, received all services from one of the four state institutions, or were Ask Me!interviewers.
The survey collected information for two-thirds of the selected adults in FY2009: 52% of thetotal responded for themselves, 10% had responses from two proxies that were averaged, and 6%had information from a single proxy. (See Figure 2.) Most of the non-response came fromrefusals: 11% of the individuals declined for themselves and 3% of their guardians refused togive permission for the interview. Agencies no longer supported or lacked good contactinformation for 5% of the people that the DDA files indicated they were authorized to support,and these people could not be located through another agency or service coordinator.1 A few(2%) could not be interviewed during the survey period because of their health, they wereincarcerated, or because they understood only a language for which no translator was available.

Page 4 December 2009 Ask Me!sm Project FY2009 -- The Arc of Maryland
(A deaf interviewerconducted interviews inAmerican Sign Language.) Ask Me! interviewers couldnot make contact with anadditional 5% of the people,frequently those who werefairly independent, couldnot be interviewed at work,or could not be reached bytelephone at home. Some(5%) did not keepappointments or put offmaking appointments andmay have been tacitrefusals. The Ask Me! staffmade the decision to not pursue interviews with 1% of the people because of time, distance, orcost limitations.
Weights were added to adjust for the probability that some people could have been selectedthrough more than one provider agency, the different probabilities of an agency being selectedfor the survey, the different probabilities of a person being selected within different sizeagencies, and the different rates of non-response at different agencies. All the person-level datapresented in this report, except for response rates, were weighted to accurately reflect all theadults receiving DDA-supported community services. Data aggregated to the agency level arenot weighted, as all people within an agency had the same probability of selection. Unlessotherwise indicated, data are for the four-year period FY2006 -FY2009.
Three-fourths (77%) of the survey responses over the four years from FY2006-FY2009 camefrom the people judged bypeer interviewers as able togive informed consent andrespond for themselves. Thepercent who responded forthemselves increased from19% of those classified withprofound retardation, to 53%of those with severe, 88% ofthose with moderate, and 96%or higher among those withmild or no retardation. (SeeFigure 3.) Proxies respondedfor those who could notrespond for themselves.
Other32%
Guardian refusal
3%Agency DK
5%Health
2%
No contact5%Cannot
schedule5%Ask decision
1%
One proxy6%
Self refusal11%Two
proxies10%
Self-response
52%
Figure 2. Response of People Selected for Interview: FY2009
19%
53%
88%96% 98%
0%
20%
40%
60%
80%
100%
Profound Severe Moderate Mild None(504) (315)(1372)(1309)(679)
19%
53%
88%96% 98%
0%
20%
40%
60%
80%
100%
Profound Severe Moderate Mild None(504) (315)(1372)(1309)(679)
Figure 3. Percent of People Responding for Themselves, by Levelof Intellectual Ability

Ask Me!sm Project FY2009 -- The Arc of Maryland December 2009 Page 5
Characteristic PercentCombined number 5,054Total 100
Age18-24 1525-34 2535-44 2445-54 2255-64 1065 and over 4Missing 1
Intellectual AbilityProfound retardation 10Severe retardation 13Moderate retardation 26Mild retardation 27Borderline retardation 4No retardation 2Not reported 17
Characteristic Percent
GenderFemale 43Male 57
Other Disabilities(may have multiple)
Speech and language 27Epilepsy and seizures 20Specific learning 16Behavior problems 16Cerebral Palsy 11Orthopedic impairment 10Autism 8Mental disorder 7Deaf, hearing impairment 7Blind, vision impairment 6Neurological impairment 6Head injury 4
Figure 4. Percent by Characteristics
Survey Procedures
The Arc of Maryland employed 50 people with disabilities as peer interviewers over the fouryears of the cycle, with an average of 31 interviewing during a year. (See inside front cover forthe list of names who interviewed during FY2009.) Most worked in pairs and conductedinterviews face-to-face with the selected person or the person�’s proxy. Interviewers conductedface-to-face interviews in FY2009 with 83% of the self-respondents, and 72% of the firstproxies, at the person�’s weekday program or employment site. Interviewers conducted face-to-face interviews with 11% of the self-respondents at their home, 5% at other location, and 1%over the telephone. The interviewers conducted only a few face-to-face interviews with proxiesat the individuals�’ residence (2%) or other location (6%), and conducted 20% of first proxyinterviews by telephone. Most of the second proxy interviews were conducted by phone.
Survey protocol sought two proxies with different relationships to people who could not respondfor themselves. First preference was given to day staff, second preference to family members,and third preference to residential staff. However, only one proxy interview was obtained forone-third of the people who could not respond for themselves: one day staff for 27%, oneresidential staff for 7%, and one family member for 2%. Proxy interviews with a day staffmember and a residential staff member were obtained for 37% of the individuals who could notrespond for themselves, a day staff member and a family member for 21%, and two similar staffmembers for 5%.
DemographicCharacteristics
Of the people represented duringthe four-year period, 15% were18-24 years of age, 25% were 25-34, 24% were 35-44, 22% were45-54, and 14% were more than55 years of age. (See Figure 4.) Men outnumbered women 57%to 43%. Agencies reported thatabout half had mild or moderateretardation, although theintellectual ability for one-sixthof the people was not reported. In addition, 27% of the peoplehad speech and languagedifficulties, underscoring theimportance of allowing them torespond during the interview bypointing to facial representationsassociated with their answers ( ,

Page 6 December 2009 Ask Me!sm Project FY2009 -- The Arc of Maryland
Type of Support PercentAll 100
Day habilitation and residential 28Day habilitation, no residential 25Employment, no residential 20Employment and residential 9Residential, no day or employment 7Other services only 12
Figure 5. Percent of Persons by Type ofSupport
, ). Some peer interviewers, themselves, had speech difficulties and conducted interviewsby activating prerecorded questions on their computer. One person in five (20%) had epilepsyand seizure disorders. One in six had specific learning disabilities (16%) and behavior problems(16%).
Support Services
Agencies in the Central DDA Region, primarily the Baltimore metropolitan area, support 47% ofthe people. Agencies in the Southern DDA Region of Montgomery, Prince George�’s, Calvert,Charles and St. Mary�’s Counties support 30% of the people. Agencies in the Western DDARegion supported 13%, and the Eastern DDA Region support 11% of the people.
The majority of the people received dayhabilitation services, with 28% receiving day andresidential services and 25% receiving dayservices while living with their families or inother arrangements not reimbursed by DDA. (See Figure 5.) One in five (20%) receivedsupported employment services while living intheir own homes or with their families, whileabout half that many (9%) received bothsupported employment and residential services. One in fourteen (7%) received residentialservices without day or employment services,and another one in eight received only othertypes of services reimbursed by DDA, such as individual support services (ISS) and communitysupported living arrangements (CSLA).

Ask Me!sm Project FY2009 -- The Arc of Maryland December 2009 Page 7
Quality of Life in Maryland: FY2002-FY2009
The Ask Me! Survey produces two measures of quality of life for each domain. The first is thepercent of people reporting a positive quality of life. This is a threshold measure and providesno information about how far people are above the threshold. The second is the average qualityof life that provides information on how far people are above the threshold, but not on how manyare above the threshold. The two measures are highly related, but provide slightly differentinformation.
Positive Quality of Life
Three-fourths or more of the people reported positive quality of life in each of the eight domainsin FY2009. In the domains of Physical Well-being and Emotional Well-being, about 95% had apositive quality of life in FY2009, about 4 percentage points higher than in FY2002. (SeeFigure 6.) Quality of life increased 5-6 percentage points in the domains of Material Well-being, Interpersonal Relations, Social Inclusion, and Personal Development. The greatestincreases came in the domains of Self-Determination (8 percentage points) and Rights (10percentage points), the domains with the lowest positive quality of life in FY2002. The greatestincrease between FY2008 and FY2009 was in the domain of Self-Determination (1.5 percentagepoints). Increases also occurred between FY2008 and FY2009 in four other domains: Physical
60%
65%70%
75%80%
85%
90%95%
100%
FY2002 90.6% 90.4% 77.8% 82.6% 79.9% 78.8% 72.2% 64.0%FY2003 93.5% 92.5% 81.6% 85.4% 82.1% 81.5% 71.5% 64.9%FY2004 94.0% 93.9% 85.3% 89.1% 84.8% 85.9% 79.2% 65.9%FY2005 94.2% 92.6% 84.1% 88.1% 86.0% 83.2% 78.1% 66.9%FY2006 94.7% 94.0% 84.5% 88.6% 84.4% 83.9% 77.8% 72.1%FY2007 94.6% 93.4% 82.8% 89.1% 85.1% 83.2% 77.2% 72.7%FY2008 94.3% 94.0% 83.6% 89.0% 85.8% 84.0% 78.7% 73.4%FY2009 95.0% 94.7% 83.5% 90.0% 85.8% 84.0% 80.5% 74.1%
Physical well-being
Emotion well-being
Material well-being
Inter-personal relations
Social inclusion
Personal develop-
ment
Self determi-nation
Rights
Figure 6. Percent with Positive Quality of Life by Domain and Year

Page 8 December 2009 Ask Me!sm Project FY2009 -- The Arc of Maryland
Well-being, Emotional Well-being, Interpersonal Relations and Rights. The percentagesremained the same for Social Inclusion and Personal Development. Material Well-beingdecreased slightly between FY2008 and FY20009, although the decline was small (0.1percentage point).
The general trend since FY2002 has been an increase in positive quality of life reports in alleight domains, with the increase greater during the early years of the Ask Me! Survey than in themore recent years. During the first four-year cycle, regressions showed significant linearincreases by year in seven of the eight domains. Only in the domain of Rights did quality of lifenot increase significantly between FY2002 and FY2005. (See Appendix Table B1.) During thesecond four-year cycle, regressions showed no significant linear trend in the percentages withpositive quality of life in any of the eight domains. In tests for linear and curvilinear trends overthe full eight years, significant linear trends were found for Physical Well-being (0.4% per year),Emotional Well-being (0.4% per year), Social Inclusion (0.6% per year), Self-Determination(1.0% per year), and Rights (1.7% per year). A curvilinear trend was found for InterpersonalRelations, increasing rapidly at first (2.0% in the first year) but then with progressively smallerincreases until the last year where it decreased. No statistically significant trends were found inthe percentages of positive Material Well-being and Personal Development.

Ask Me!sm Project FY2009 -- The Arc of Maryland December 2009 Page 9
Average Quality of Life
The average (mean) domain score provides a slightly different measure of the quality of life thanthe percent with a positive score. Rights has historically received the lowest score of the eightquality of life domains, and this continued to be true in FY2009. Physical Well-being hashistorically received the highest score, and this continued to be true in FY2009. (See Figure 7.) None of the one-year changes in average quality of life between FY2008 and FY2009 werestatistically significant. However, the average quality of life has increased significantlycompared to FY2002 in seven of the eight domains. Only the domain of Material Well-beingshowed no statistical increase over the eight years in the average quality of life.
The average quality of life, like the percent with a positive quality of life increased significantlybetween FY2002 and FY2005 in seven of the eight domains, but did not increase significantlybetween FY2006 and FY2009 in any of the domains. (See Appendix Table B1.) The trend overthe full eight years in the average quality of life is the same as in the percent with a positivequality of life in the domains of Material Well-being (no trend) and Social Inclusion, Self-Determination and Rights (linear increases). The average quality of life in PersonalDevelopment also had a statistically significant linear trend, whereas the percent with positive
0123456789
10
FY2002 8.30 8.15 7.17 7.24 7.06 7.15 6.81 6.27
FY2003 8.60 8.39 7.24 7.54 7.32 7.23 6.77 6.26
FY2004 8.70 8.54 7.54 7.81 7.54 7.64 7.20 6.37
FY2005 8.75 8.49 7.50 7.65 7.47 7.35 7.12 6.44
FY2006 8.66 8.48 7.42 7.68 7.43 7.48 7.20 6.74
FY2007 8.70 8.48 7.35 7.70 7.40 7.45 7.19 6.75
FY2008 8.69 8.53 7.41 7.74 7.60 7.47 7.22 6.78
FY2009 8.68 8.58 7.37 7.85 7.57 7.58 7.34 6.88
Physical well-being
Emotion well-being
Material well-being
Inter-personal relations
Social inclusion
Personal develop-
ment
Self determi-nation
Rights
Figure 7. Average Quality of Life by Domain and Year

Page 10 December 2009 Ask Me!sm Project FY2009 -- The Arc of Maryland
Personal Development showed no trend over the eight years. (See Figure 8.) The averagePhysical Well-being, Emotional Well-being, and Interpersonal Relations had curvilinear trendswith significant quartic and cubic terms. This means that the increase was rapid during the firstfew years, leveled off or declined during the middle part of the eight-year period, and thenresumed increasing at the end of the period. While the quality of life reported by and for peoplewith developmental disabilities in Maryland may have fluctuated from year to year, the overalltrends appear positive in all domains except Material Well-being. Peoples feelings about theirMaterial Well-being (having a job, earning good money, saving money, not worrying aboutmoney, and having possessions) did not change consistently from FY2002 to FY2009.
Physical Well-being
8.08.28.48.68.8
02 03 04 05 06 07 08 09
Emotional Well-being
7.88.08.28.48.68.8
02 03 04 05 06 07 08 09Material Well-being
6.87.07.27.47.6
02 03 04 05 06 07 08 09
Interpersonal Relations
6.87.07.27.47.67.88.0
02 03 04 05 06 07 08 09
Rights
5.86.06.26.46.66.87.0
02 03 04 05 06 07 08 09
Self-determination
6.46.66.87.07.27.47.6
02 03 04 05 06 07 08 09
Social Inclusion
6.66.87.07.27.47.67.8
02 03 04 05 06 07 08 09
Personal Development
6.87.07.27.47.67.8
02 03 04 05 06 07 08 09
Figure 8. Trend in Average Quality of Life, by Domain: FY2002-FY2009

Ask Me!sm Project FY2009 -- The Arc of Maryland December 2009 Page 11
Program Direction - DDA
The DDA uses the Ask Me! data to help develop its goals, which are presented as a part of itsbudget request to the state legislature, as part of the requirements known as �“Managing forResults.�” They then use the Ask Me! data to report whether they have met the goals. DDAbegan this process in FY2004, and established its first goals as:
Goal 1. Individuals receiving community services are satisfied with their personal growth,independence and productivity.
DDA developed two specific objectives for FY2005-FY2007 based on FY2004 Ask Me! resultsand recommendations. As can be seen by referring back to Figure 6 and Figure 7, many of theresults from FY2004 turned out to be abnormally high, and DDA revised the targets for FY2008-FY2011 based upon FY2007 Ask Me! results. The objectives and targets are as follows:
Objective 1.1 By the end of fiscal year ____ the percentage of respondents on the �“Ask MeSurvey�” expressing satisfaction in the following domains will remain the same orimprove.
FY2004 Objectives FY2007 Objectives 2006 2007 2008 2009 2010 2011
Physical Well-being 94.0%* 94.0%* 94.6% 94.6%* 94.6% 94.6%Material Well-being 85.3% 85.3% 82.8%* 82.8%* 82.8% 82.8%Emotional Well-being 93.9%* 93.9% 93.4%* 93.4%* 93.4% 93.4%Interpersonal Relations 89.1% 89.1%* 89.9% 89.9%* 89.9% 89.9%Rights 65.9%* 65.9%* 72.6%* 72.6%* 72.6% 72.6%Personal Development 85.9% 85.9% 83.2%* 83.2%* 83.2% 83.2%Social Inclusion 84.8% 84.8%* 85.1%* 85.1%* 85.1% 85.1%Self-Determination 79.2% 79.2% 77.2%* 77.2%* 77.2% 77.2%
* Did meet or exceed the target
Objective 1.2 By the end of fiscal year ____ the average score on the domain of �“personaldevelopment�” will increase by 5% from the previous year and the average score on theother seven domains will remain the same or improve.
FY2004 Objectives FY2007 Objectives 2006 2007 2008 2009 2010 2011
Personal Development 7.9 8.1 7.5* 7.5* 7.6 7.7Physical Well-being 8.7* 8.7* 8.7* 8.7* 8.7 8.7Material Well-being 7.5 7.5 7.4* 7.4* 7.4 7.4Emotional Well-being 8.5* 8.5* 8.5* 8.5* 8.5 8.5Interpersonal Relations 7.8 7.8 7.7* 7.7* 7.7 7.7Rights 6.4* 6.4* 6.8* 6.8* 6.8 6.8Social Inclusion 7.5 7.5 7.6* 7.6* 7.6 7.6Self-Determination 7.2* 7.2* 7.2* 7.2* 7.2 7.2
* Did meet or exceed the target

Page 12 December 2009 Ask Me!sm Project FY2009 -- The Arc of Maryland
As can be seen, DDA met the Objective 1.1 targets in only three of the eight domains in FY2006and four in FY2007 (targets with an asterisk *). After revising the targets based upon FY2007data, DDA met Objective 1.1 targets in seven domains in FY2008 and in all eight domains inFY2009. The 5% annual increase in Personal Development was based on an original scale thatcould range from -10.0 to +10.5, with 0.0 as the neutral value. This was converted for theFY2005 report to a scale that ranged from 0.0 to 10.0, with 5.0 as the neutral value, and theoriginal 5.0% increase translates into a 2.5% increase on the new scale. DDA met four of theeight Objective 1.2 targets in FY2006 and FY2007 (when the actual are rounded to one decimal),but all eight of the FY2008 and FY2009 targets of the Objective 1.2 set in FY2007.
Transportation Availability
Transportation is not a quality of life domain. However, people�’s perceptions of the availabilityof transportation have strong relationships to the quality of life they report: the more theyperceived transportation to be available, the greater they reported their quality of life in alldomains. The Ask Me! Survey included five questions about transportation that were combinedinto a scale of perceivedtransportation availability. Unlike most quality of lifemeasures, the averageperception of the availabilityof transportation had a slight,although statisticallysignificant, decline over theeight years between FY2002and FY2009. (See Figure9.) TransportationAvailability wassubstantially correlated to alleight quality of life domains(r=.153 to r=.405).
Stepwise multiple regression found that 5% of the variation in Transportation Availabilityreported by self respondents could be explained by six characteristics of the individuals and theirservices. These can be shown in a path diagram that represents a causal model that is consistentwith the data. Solid arrows from a person or service characteristic to TransportationAvailability, show that the characteristic independently increased the reporting of TransportationAvailability. A dashed arrow shows that the characteristic decreased the TransportationAvailability that was reported. The thickness of the arrow and the size of the path coefficientindicate the relative strength of the independent effect. The color of the characteristic, arrow andcoefficient indicates whether the characteristics affected self reporting (blue), proxy reporting(red), or both (black). Path coefficients for self respondents are also shown in standard typeabove the arrow and path coefficients for proxies are shown in italics below the arrow. Thevariables to the left of the arrow (tail) affect the variable to the right of the arrow (head). The
7.01 7.11 6.98 7.10 7.03 6.97 6.97 6.86
0123456789
10
2002 2003 2004 2005 2006 2007 2008 2009
7.01 7.11 6.98 7.10 7.03 6.97 6.97 6.86
0123456789
10
2002 2003 2004 2005 2006 2007 2008 2009
Figure 9. Average Availability of Transportation, by Fiscal Year

Ask Me!sm Project FY2009 -- The Arc of Maryland December 2009 Page 13
relationships among the left-most variables are not indicated by arrows and path coefficients,since they would make the figure much too complex.
People in dayhabilitation reportedlower TransportationAvailability than thosereceiving other typesof DDA-supportedservices (dashedarrow, = -.06). (Seeblue and black textand arrows in Figure10.) Self respondentswith autism (solidarrow, =.06) andhead injuries ( =.06)reported transportationwas more availablethan did selfrespondents with other types of disabilities. Geography explained the most variation, withTransportation Availability higher in the southern ( =.12) and western ( =.15) regions than inthe central and eastern regions. The larger the agency, the less available (dashed arrow)transportation was reported to be ( = -.06). Proxies reported greater Transportation Availabilitythan did self respondents (8.03 and 6.63 respectively), and 5% of their variability in reportingcould be explained by three characteristics of the individuals for whom they reported and theirservices. Similar to self respondents, proxies in the western region reported greaterTransportation Availability than proxies in the other regions ( =.11), and the larger the agency,the less available the transportation ( = -.12, both in black text). Only proxies (red text) reportedgreater Transportation Availability when the agency provided more frequent transportation toactivities other than employment or weekday activities ( =.09).
Responses to Individual QuestionsSix of the 53 individual questions had significant increases between FY2008 and FY2009 in thepercentages who gave positive responses. All six of these also had significant increases whenthe whole eight-year period is considered. Almost all (95.8%) in FY2009 said they are never hitor hurt by staff or the people with whom they live. (See Figure 11.) This is an increase from93.0% in FY2008, and from 85.7% in FY2002. While some variation occurred from year toyear, linear regression showed that this percentage increased by an average of 1.1 points peryear. The percent who said they liked themselves increased from 78.4% in FY2008 to 82.8% inFY2009, with a regression average annual increase of 0.8 percentage points. Those who oftensaw or talked with their families increased an average of 0.8 percentage points per year to 63.5%in FY2009. In FY2009, 61.7% of the people said they choose those with whom they livedcompared to 56.5% in FY2008 and 49.5% in FY2002. This 2.0 percent per year averageincrease was greater than for any other question. Owning things increased 2.8 percentage points
TransportationAvailability
Agency SizeOther Activity Trips
Western RegionSouthern Region
AutismSelf
Proxy
Both
Head Injury
Day Habilitation
.15.-.06
.06
.06
.12
.-.06
.-.12
. 09
.11
TransportationAvailability
Agency SizeOther Activity Trips
Western RegionSouthern Region
AutismSelf
Proxy
Both
Head Injury
Day Habilitation
.15.-.06
.06
.06
.12
.-.06
.-.12
. 09
.11
TransportationAvailability
Agency SizeOther Activity Trips
Western RegionSouthern Region
AutismSelf
Proxy
Both
Head Injury
Day Habilitation
.15.-.06
.06
.06
.12
.-.06
.-.12
. 09
.11
Figure 10. Characteristics Affecting Transportation Availability

Page 14 December 2009 Ask Me!sm Project FY2009 -- The Arc of Maryland
between FY2008 andFY2009, with anaverage of 1.3percentage points overthe whole period ofFY2002 to FY2009. The greatest one-yearincrease betweenFY2008 and FY2009,10.3 percentage points,concerned voting ingovernment elections,although it onlyaveraged a 1.3percentage points peryear over the eightyears of the survey. (The FY2009 Ask Me!Survey began after the2008 presidential primaries and included the 2008 elections at the federal, state and local levels.) Although it changed only a little between FY2008 and FY2009, the question with the secondlargest average annual increase over the eight years involved people helping them when theymade a mistake (1.9 percentage points per year). Similarly, finding it easy to say somethingwhen they have problems with staff increased an average of 1.8 percentage points per year eventhough the increase between FY2008 and FY2009 might not have been statistically significant. Together, 34 of the 48 indicator questions for the eight domains had significant increases in thefavorable response over the eight years between FY2002 and FY2008. The favorable responseto the remaining 14 indicator questions remained unchanged statistically.
The percentages of the people who responded in positive manners ( 1) each year are shown foreach question in Table 1. The questions are listed in the order they appear on the questionnaire,and are grouped and identified by the quality of life domains that they measure. The averageannual changes in the percentages are shown in the last column based upon simple linearregression (b coefficient). A caret (^) indicates the change is significant at the p .01 level andan asterisk (*) indicates the change is significant at the p .001 level. Questions 3, 50, and 56 areused for quality control purposes only and are not shown.
0%
20%
40%
60%
80%
100%
Not
hit
orhu
rt
Lik
eyo
urse
lf
See
fam
ily
Cho
ose
hous
emat
es
Ow
n th
ings
Vot
e in
elec
tions
% F
avor
able
FY02 FY03 FY04 FY05 FY06 FY07 FY08 FY09
Figure 11. Question with More Favorable Responses in FY2009 thanin FY2008
Ask Me!sm Project FY2009 -- The Arc of Maryland December 2009 Page 15
Table 1. Percent Giving the Favorable Response by Question and Year
Question Fiscal Year YearlyChange2002 2003 2004 2005 2006 2007 2008 2009
Emotional Well-BeingQ1 Would you say that you are a happy person? 80.4 78.6 80.9 78.4 76.7 79.0 80.5 80.9 0.1Q2 How do you feel about your home where you live? 64.7 66.5 69.1 69.7 69.2 72.0 69.2 72.6 0.9*Q4 How safe do you feel in your neighborhood? 73.3 77.4 79.7 78.2 76.8 78.3 78.9 79.9 0.5^Q5 Do you like yourself? 73.1 78.9 77.9 78.0 79.8 78.1 78.4 82.8 0.8*Q6 Feel others treat you the same as any other person? 58.2 61.9 67.5 63.2 62.5 62.9 68.7 66.2 0.8*Q7 In general, how happy are you with your life? 67.8 67.7 73.0 71.4 71.1 71.0 74.4 74.6 0.9*
Social InclusionQ8 Do people help you to be part of your community? 68.5 72.6 76.5 76.7 73.7 74.7 76.3 74.6 0.5^Q9 Do you go to fun things in your community? 63.7 62.2 67.4 67.2 66.2 65.9 67.8 68.3 0.6^Q10 When you do to fun things, are you active? 62.1 58.7 59.7 61.5 62.6 66.1 68.2 68.9 1.4*Q11 Do you think your neighbors like you? 64.0 65.7 70.6 69.0 68.0 65.1 71.0 71.8 0.7*Q12 Friends from places other than work or home? 43.4 44.2 47.8 43.3 46.8 44.9 50.7 50.4 0.9*Q13 How often do you see these friends on weekends? 32.6 39.2 36.2 29.7 32.2 30.3 36.4 35.6 -0.1
Interpersonal RelationsQ14 People help you learn to do things for yourself? 57.1 64.0 60.3 59.6 57.3 61.9 60.1 61.2 0.1Q15 When you make a mistake, do people help you? 63.1 68.7 77.9 77.3 76.5 77.8 79.3 80.6 1.9*Q16 Do people help you reach your goals? 70.4 72.9 77.7 76.6 76.2 77.0 79.1 77.6 0.9* Q17 How often do you see or talk with your family? 53.3 58.1 59.9 60.0 58.1 60.0 59.1 63.5 0.8*Q18 How many close friends do you have? 42.6 41.1 45.6 35.5 42.8 38.7 43.7 44.8 0.2Q19 Does what you do let you look good to others? 62.6 64.9 70.1 68.6 66.8 66.1 70.2 70.5 0.7*
Personal DevelopmentQ20 Does what you make you feel important? 68.3 69.3 71.4 70.3 68.8 69.4 72.7 73.8 0.6^Q21 Are you getting training to help you get a job? 56.4 51.7 57.3 51.9 55.6 57.3 55.6 58.1 0.4Q22 Others give you a chance to be what you want? 60.0 63.8 69.6 66.0 65.7 65.1 65.9 68.7 0.0Q23 Learning things to make you a better person? 71.1 77.0 80.4 77.7 75.2 77.4 77.0 77.6 0.3Q24 Get the information you need about sexuality? 36.2 34.4 39.7 37.3 41.8 37.1 41.5 42.8 0.9*Q25 Do you get the services you need? 72.7 77.0 81.9 79.4 76.5 79.1 78.8 78.8 0.4
Self-DeterminationQ26 Did you pick who you live with? 49.5 48.9 48.7 53.0 57.8 59.4 56.5 61.7 2.0*Q27 Can you be alone when you want to? 59.0 53.0 64.8 62.9 63.7 62.4 63.2 63.2 0.8*Q28 How much choice do you have in your food? 49.9 47.1 50.8 49.2 49.7 54.1 50.7 55.4 0.8*Q29 Do you get a chance to say what you think? 53.5 52.4 57.4 56.0 54.7 57.9 61.6 62.0 1.3* Q30 Do you pay for things with your own money? 66.3 68.6 71.1 70.9 71.1 72.2 72.5 75.7 1.0*Q31 Choose your job or what you do most days? 58.2 59.2 63.8 59.7 59.4 58.1 61.2 63.4 0.3
Physical Well-BeingQ32 On your health are people concerned? 75.1 78.8 84.1 83.6 82.9 83.1 84.8 84.3 1.0*Q33 Is your health good? 71.6 69.2 76.2 74.3 75.6 71.5 75.9 76.3 0.6^Q34 Would you say your eating habits are good? 70.7 73.5 74.9 75.0 73.2 73.6 75.3 71.9 0.1Q35 Do you have regular check ups with a dentist? 74.1 79.1 76.6 77.5 74.6 78.1 77.0 75.3 0.0Q36 Get the sleep you need without being disturbed? 69.1 76.8 76.6 80.7 77.1 79.6 78.8 76.5 0.7*

Table 1. Percent Giving the Favorable Response by Question and Year
Question Fiscal Year YearlyChange2002 2003 2004 2005 2006 2007 2008 2009
Page 16 December 2009 Ask Me!sm Project FY2009 -- The Arc of Maryland
Q37 Do staff or people you live with hit or hurt you? 85.7 89.0 92.8 93.0 93.5 93.8 93.0 95.8 1.1*Material Well-Being
Q38 How many things do you own? 51.0 46.2 57.6 58.0 55.2 58.7 56.5 59.9 1.3*Q39 How often do you worry about money? 61.0 69.4 65.9 68.5 67.0 65.0 65.9 62.4 -0.2Q40 On money, do you feel that you are well off? 56.5 63.1 61.8 64.9 62.6 63.5 65.0 63.1 0.6^Q41 Do you have money each week to spend? 66.2 67.4 69.1 72.2 69.2 70.4 72.3 69.9 0.6^Q42 Do you save money? 52.4 51.6 57.5 50.2 50.9 51.9 56.2 54.4 0.2Q43 Do you have the chance to earn good money? 59.0 54.1 59.2 55.6 58.1 56.2 58.9 60.8 0.4
RightsQ44 Staff ask permission before entering your home? 57.3 58.4 58.5 61.4 60.9 65.6 67.6 66.6 1.6*Q45 Can you lock the bathroom door if you want to? 57.9 55.6 54.4 52.7 58.7 62.3 60.7 59.6 0.9* Q46 Can you talk on the telephone in private? 62.0 60.3 63.5 63.5 65.7 66.5 69.9 70.8 1.5*Q47 Can you spend time by yourself if you want? 67.4 66.6 69.9 71.0 72.4 71.4 73.2 72.7 0.9*Q48 When problem with staff, easy to say something? 54.0 56.3 55.9 58.0 61.0 60.4 63.9 67.5 1.8*Q49 How often do you vote in government elections? 23.9 23.8 22.2 24.7 27.9 25.3 25.2 35.5 1.3*
Transportation AvailabilityQ51 Transportation when you want to go somewhere? 67.5 74.2 71.8 73.2 72.6 72.6 72.4 72.7 0.3Q52 How much planning to go somewhere 30.8 28.6 24.0 26.2 25.1 26.2 26.8 26.9 -0.3Q53 If you set up a ride, can you depend on it? 70.3 72.6 75.2 76.9 71.9 72.1 71.2 75.4 0.1Q54 Do you miss things because of transportation? 50.3 52.4 50.6 51.3 51.2 52.2 51.4 49.8 -0.1Q55 Transportation problems make you feel separated? 58.5 60.8 58.6 60.1 60.7 60.5 61.5 54.8 -0.2^ Statistically significant p .01 * Statistically significant p .001

Ask Me!sm Project FY2009 -- The Arc of Maryland December 2009 Page 17
Quality of Life for Individuals: FY2006-FY2009
Thirty-four characteristics of the approximately 5,000 individuals and their services, withinterviews between FY2006 and FY2009, were tested to see if they were related to the reportingof quality of life. Generally the relationships were small, and two characteristics had nobivariate correlation with any of the eight quality of life measures: behavioral problems andorthopedic impairments. (See Appendix Table B2.) Since the characteristics could beinterrelated, forward stepwise multiple regression was used to identify which variables hadsignificant independent relationships with quality of life. Five characteristics had significantindependent association with Physical Well-being, and together explained 18% (R2=.18) of thevariability in reported Physical Well-being. The variable most strongly associated with PhysicalWell-being was Transportation Availability ( =.36), both measured by the survey. (See Figure12 and Appendix Table B3.) Next most strongly related was who responded, with selfrespondents reporting lower Physical Well-being than proxies reported ( = -.11). People livingin the western and southern DDA region had greater reported Physical Well-being than peopleliving in the central and eastern DDA regions. After controlling for the perceived availability oftransportation, more trips to weekday activities (employment or day habilitation) were associatedwith a greater favorable reporting of Physical Well-being. Only two characteristics had
Physical Emotional Material Inter- Personal Self-Characteristic Well- Well- Well- personal Social Develop- Determi- Rights
being being being Relations Inclusion ment nationTransportation Availability .36 .32 .42 .29 .24 .30 .29 .25
PersonSelf-respondent -.11 ... .15 ... .20 .21 .37 .36Intellectual ability ... ... ... .06 ... .08 .11 .14Western region .04 .05 .07 .06 .05 ... .10 .07Southern region .06 ... .08 ... ... ... .04 .07Age ... ... ... -.05 ... -.04 ... ...Head injury ... ... ... -.06 -.09 -.05 ... ...Specific learning ... ... ... ... -.05 ... ... ...
ServicesSupported employment ... ... .07 .07 ... .12 .06 .07Day habilitation ... ... ... ... ... .10 ... ...Residential support ... ... ... ... .05 ... ... ...Supported living (CSLA)... ... -.05 ... ... ... ... ...Trips to day activities .04 ... .06 ... .06 .05 ... ...Trips by other agencies ... ... ... ... ... ... -.04 ...Public transportation ... . ... -.05 ... ... ... ...
R2 .18 .11 .20 .10 .09 .14 .25 .25
Figure 12. Person Characteristics and Quality of Life, by Domain ( coefficient)

Page 18 December 2009 Ask Me!sm Project FY2009 -- The Arc of Maryland
independent relationships to Emotional Well-being, explaining 11% of its variability: transportation availability and western region. Seven characteristics explained 20% of thevariation in Material Well-being: transportation availability, who responded, western region,southern region, supported employment, and community supported living arrangements. Sevencharacteristics also had independent relationships with Interpersonal Relations, Social Inclusionand Self-Determination. Eight characteristics had independent relationships to PersonalDevelopment, but only explained 14% of its variation. In Rights, however, six characteristicsexplained 25% of the variation among people.
Personal Characteristics
Self or proxy response affected the reportedquality of life and it is not possible to separatehow much of the differences are due to theindividuals�’ abilities to understand andcommunicate from how much is due to proxiestrying to report for someone else. Selfrespondents reported statistically lower PhysicalWell-being and Emotional Well-being thanproxies reported, and higher Material Well-being, Social Inclusion, Personal Development,Self-Determination and Rights than proxiesreported. (See Figure 13.). Only in thedomains of Interpersonal Relations did theoverall level of reporting not differ statistically. The separate measure of intellectual ability didhave an independent relationship toInterpersonal Relations as determined by thestepwise regression. (Refer back to Figure 12.) Also, the greater the intellectual ability, thegreater the quality of life in the domains of Personal Development, Self-Determination andRights, independent of who reported. Who responded did not affect the reporting of MaterialWell-being once other characteristics of individulas were taken into consideration, particularlythe region of residence.
Geography significantly affected the reporting of quality of life in seven of the eight domains. People living in the western region had higher reported quality of life than those living in otherregions in all but Personal Development. Those living in the southern region also had higherreported quality of life in Physical Well-being, Material Well-being, Self-Determination andRights than those living in the central and eastern DDA regions.
People with head injuries had lower Interpersonal Relations, Social Inclusion and PersonalDevelopment than those without head injuries. Older people had lower Interpersonal Relationsand Personal Development than younger people. People with specific learning disabilities hadlower Social Inclusion than those without specific learning disabilities. None of the othercharacteristics of the individuals surveyed had independent relationships to reporting in any
Domain Self Proxy
Physical Well-being 8.49 9.32Emotional Well-being 8.41 8.91Material Well-being 7.43 7.23Interpersonal Relations 7.75 7.72Social Inclusion 7.61 7.11Personal Development 7.70 6.80Self-determination 7.71 5.66Rights 7.28 5.10
Transportation Availability 6.63 8.03
Figure 13. Average Quality of Life andTransportation Availability, by Respondent

Ask Me!sm Project FY2009 -- The Arc of Maryland December 2009 Page 19
quality of life domain: gender, autism, behavior problems, mental disorder, cerebral palsy,epilepsy and seizure disorders, other neurological impairments, orthopedic impairments, hearingimpairments, speech and language impairments, or vision impairments.
Service Characteristics
Services provided with DDA funding explain variation in reported quality of life in seven of theeight domains. Service characteristics had no effect on the reporting of Emotional Well-being. Supported employment services independently contributed to higher reported quality of life infive domains: Material Well-being, Interpersonal Relations, Personal Development, Self-Determination and Rights. In contrast, day habilitation services contributed to higher quality oflive only in the domain of Personal Development, and residential services contributed to higherreported quality of life only in the domain of Social Inclusion. People with communitysupported living arrangements (CSLA) reported lower Material Well-being than those in otherresidential situations. The more frequently agencies reported that they provided transportation toemployment or day habilitation, the higher the reported quality of life in four domains: PhysicalWell-being, Material Well-being, Social Inclusion and Personal Development. However, themore frequently they reported that other agencies provided the transportation, the lower thequality of life in Self-Determination. People who frequently used public transportation hadlower reported Interpersonal Relations than those who did not. However, the importance ofdifferent sources of transportation changes when self and proxy reports were analyzedseparately.
Having or not having individual support services or resource coordination services did not haveindependent effects on the reporting of quality of life when all respondents were combined. Neither did the number of agencies providing the services, the size of the agencies, the surveyresponse rate at the agencies, frequency of transportation to evening and weekend activities, andfrequency of family (or self) provided transportation. However, the independent contribution ofservice characteristics to reported qualityof life differed sometimes when self andproxy responses are consideredseparately.
Self and Proxy Differences
Self response had significantrelationships with six quality of lifedomains. It was associated with higherquality of life in four domains and lowerquality of life in two domains. Peerinterviewers made the decision on whohad sufficient understanding to giveinformed consent to the interview andthus be able to respond for themselves.
1. Do you understand you will be answeringquestions? (Yes, no)
2. Do you understand you can skip questions ifyou do not want to answer them? (Yes, no)
3. Do you understand you can stop the interviewat any time? (Yes, no)
4. Let me ask you a question from the interview. Would you say that you are a happy person?(Yes, sometimes, no)
5. Would you like to answer more questions?(Yes, no)
6. Do you understand that you will be answeringquestions about your life? (Yes, no)
Figure 14. Ability to Consent Questions
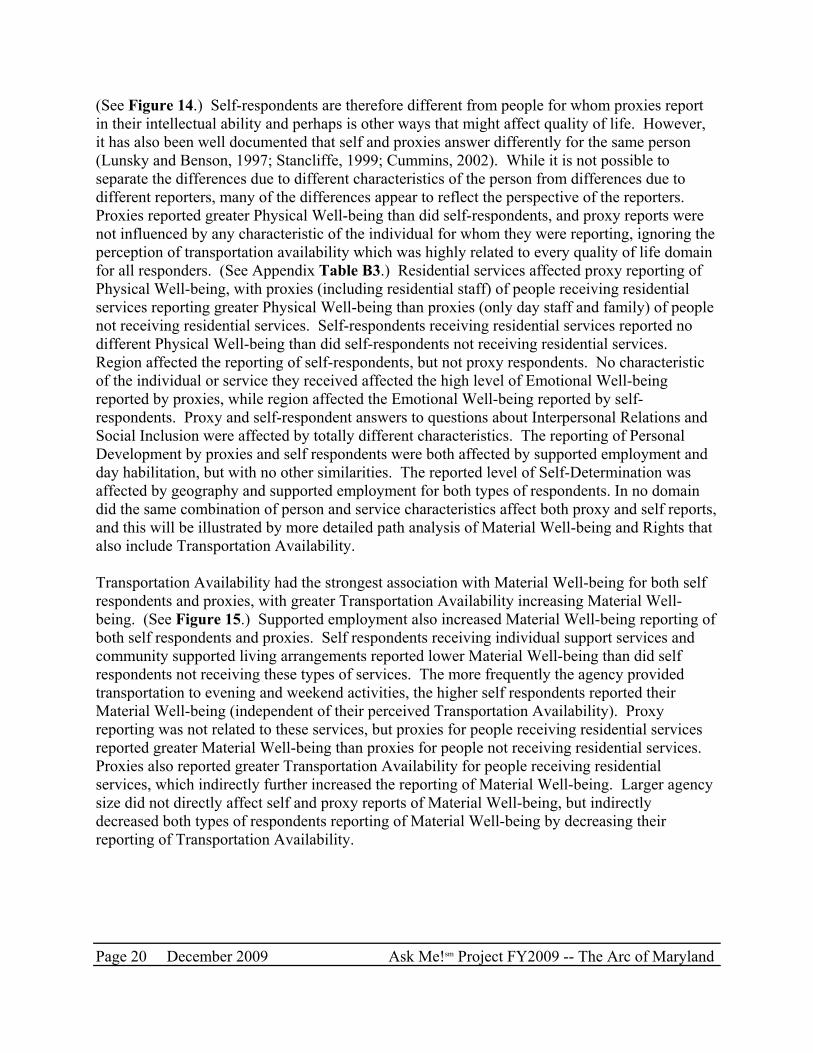
Page 20 December 2009 Ask Me!sm Project FY2009 -- The Arc of Maryland
(See Figure 14.) Self-respondents are therefore different from people for whom proxies reportin their intellectual ability and perhaps is other ways that might affect quality of life. However,it has also been well documented that self and proxies answer differently for the same person(Lunsky and Benson, 1997; Stancliffe, 1999; Cummins, 2002). While it is not possible toseparate the differences due to different characteristics of the person from differences due todifferent reporters, many of the differences appear to reflect the perspective of the reporters. Proxies reported greater Physical Well-being than did self-respondents, and proxy reports werenot influenced by any characteristic of the individual for whom they were reporting, ignoring theperception of transportation availability which was highly related to every quality of life domainfor all responders. (See Appendix Table B3.) Residential services affected proxy reporting ofPhysical Well-being, with proxies (including residential staff) of people receiving residentialservices reporting greater Physical Well-being than proxies (only day staff and family) of peoplenot receiving residential services. Self-respondents receiving residential services reported nodifferent Physical Well-being than did self-respondents not receiving residential services. Region affected the reporting of self-respondents, but not proxy respondents. No characteristicof the individual or service they received affected the high level of Emotional Well-beingreported by proxies, while region affected the Emotional Well-being reported by self-respondents. Proxy and self-respondent answers to questions about Interpersonal Relations andSocial Inclusion were affected by totally different characteristics. The reporting of PersonalDevelopment by proxies and self respondents were both affected by supported employment andday habilitation, but with no other similarities. The reported level of Self-Determination wasaffected by geography and supported employment for both types of respondents. In no domaindid the same combination of person and service characteristics affect both proxy and self reports,and this will be illustrated by more detailed path analysis of Material Well-being and Rights thatalso include Transportation Availability.
Transportation Availability had the strongest association with Material Well-being for both selfrespondents and proxies, with greater Transportation Availability increasing Material Well-being. (See Figure 15.) Supported employment also increased Material Well-being reporting ofboth self respondents and proxies. Self respondents receiving individual support services andcommunity supported living arrangements reported lower Material Well-being than did selfrespondents not receiving these types of services. The more frequently the agency providedtransportation to evening and weekend activities, the higher self respondents reported theirMaterial Well-being (independent of their perceived Transportation Availability). Proxyreporting was not related to these services, but proxies for people receiving residential servicesreported greater Material Well-being than proxies for people not receiving residential services. Proxies also reported greater Transportation Availability for people receiving residentialservices, which indirectly further increased the reporting of Material Well-being. Larger agencysize did not directly affect self and proxy reports of Material Well-being, but indirectlydecreased both types of respondents reporting of Material Well-being by decreasing theirreporting of Transportation Availability.

Ask Me!sm Project FY2009 -- The Arc of Maryland December 2009 Page 21
Residence in the western region of Maryland had a direct effect of increasing self respondents�’reports of Material Well-being, as well as indirectly increasing it through increasing their reportsof Transportation Availability. However, western residence is associated with less residentialservices, less supported employment, and more day habilitation which indirectly decreasesreporting of Material Well-being. Region did not directly influence proxy reporting of MaterialWell-being, but western location indirectly increased reporting of Material Well-being byincreasing their reporting of Transportation Availability. Southern region location indirectlyincreased proxy reporting of Material Well-being by increasing the amount of supportedemployment. Older age had no direct effect on either self or proxy reporting of Material Well-being, but indirectly increases Material Well-being by increasing reports of TransportationAvailability and residential services and indirectly decreases Material Well-being by beingassociated with more day habilitation and less supported employment. Autism has a smallindirect effect on increasing self respondents�’ reports of Material Well-being though itsassociation with greater Transportation Availability, and an indirect negative effect on proxies�’reports of Material Well-being through its association with less supported employment. Intellectual ability had a direct effect of increasing proxy reporting of Material Well-being, andindirect positive effects through association with greater supported employment. This wasdiminished by indirect negative effects through less residential services. For self respondents, alleffect of intellectual ability on Material Well-being was indirect through greater supportedemployment (positive), fewer residential services (negative), more community supported livingarrangements (negative), and fewer evening and weekend trips (negative). Head injuries did not
TransportationAvailability
IntellectualAbility
MaterialWell-being
Supported Employment
WesternRegion
SouthernRegion
Evening/Weekend Trips
.14
Self; Proxy; Both
Residential Services
.06 .07
.07
.10
.07
.42
-.05
-.08
.06.15
.14
.11
Autism
-.06
.12
.05
Individual SupportCSLA
Day Habilitation
Age
Agency Size
Head Injury
-.08-.13 .13
-.12
.27Transportation
Availability
IntellectualAbility
MaterialWell-being
Supported Employment
WesternRegion
SouthernRegion
Evening/Weekend Trips
.14
Self; Proxy; Both
Residential Services
.06 .07
.07
.10
.07
.42
-.05
-.08
.06.15
.14
.11
Autism
-.06
.12
.05
Individual SupportCSLA
Day Habilitation
Age
Agency Size
Head Injury
-.08-.13 .13
-.12
.27
Figure 15. Direct Effects of Person and Service Characteristics on Material Well-beingand Indirect Effects through Transportation Availability

Page 22 December 2009 Ask Me!sm Project FY2009 -- The Arc of Maryland
have direct effects on self respondents reporting of Material Well-being, but did have someindirect negative effects through less supported employment and more individual supportservices.
Rights had the greatest increase in quality of life between FY2002 and FY2009 among the eightdomains, and the trend suggests that this may continue. However, only TransportationAvailability affected the reporting of rights by both self respondents and proxies. The more selfand proxy respondents reported transportation to be available, the higher the level of Rights theyreported. (See Figure 16.) The only other factor that directly affected the reporting of Rights byself respondents was day habilitation services. Self respondents receiving day habilitationreported lower Rights than self respondent not receiving day habilitation. Day habilitation didnot affect proxy reporting, but proxies for people receiving supported employment servicesreported higher levels of rights than proxies for people not receiving supported employment. Supported employment was as important for proxies as Transportation Availability. Since dayhabilitation and supported employment are mutually exclusive categories of service, the maindifference between self and proxy reporting are for people who received neither day habilitation
nor supported employment services (e.g., only residential services or individual supportservices). Proxy reporting of Rights was most influenced by the intellectual ability of theindividuals for whom they were responding, with greater level of Rights reported for people withgreater intellectual ability. Proxies in the western and southern regions reported higher levels ofRights than did proxies in the central and eastern regions, while geography did not directlyinfluence the reporting of self respondents. Geography indirectly influenced the reporting ofrights by both self respondents and proxy respondents as they reported greater Transportation
TransportationAvailability
IntellectualAbility
Rights
Supported Employment
WesternRegion
SouthernRegion
.14
Self; Proxy; Both
Residential Services
.06 .11.07
.10
.17
.29
-.08
.21
.27
Autism
-.08
.12
Day Habilitation
Age
Agency Size -.08-.13
.13.21
TransportationAvailability
IntellectualAbility
Rights
Supported Employment
WesternRegion
SouthernRegion
.14
Self; Proxy; Both
Residential Services
.06 .11.07
.10
.17
.29
-.08
.21
.27
Autism
-.08
.12
Day Habilitation
Age
Agency Size -.08-.13
.13.21
Figure 16. Direct Effects of Person and Service Characteristics on Rights, and IndirectEffects through Transportation Availability

Ask Me!sm Project FY2009 -- The Arc of Maryland December 2009 Page 23
Availability if they lived in the western and southern DDA regions. Other person and servicecharacteristics that affected the reporting of Transportation Availability indirectly affected thereporting of Rights. Older age and autism indirectly increased the reporting of Rights by selfrespondents, and residential services indirectly increased the reporting of Rights by proxies. Larger agency size indirectly decreased the reporting of Rights by both self and proxyrespondents as it decreased the reported availability of transportation.

Page 24 December 2009 Ask Me!sm Project FY2009 -- The Arc of Maryland
Quality of Life at Agencies: FY2006-FY2009
Agency Variation
Surveys were conducted at 120 community agencies between FY2006 and FY2009 in the secondcycle of interviews, as compared to 116 community agencies during the first cycle of interviews. The average agency quality of life was higher in the second cycle than in the first cycle for sevenof the eight domains, with practically no change in Material Well-being. The variation amongagencies (as indicated by the standard deviation) was less in the second cycle then in the first forfive of the domains: Physical Well-being, Interpersonal Relations, Social Inclusion, PersonalDevelopment and Rights. The variation among agencies increased for Emotional Well-beingand Material Well-being, and remained the same for Self-Determination. Agencies varied leastduring the second cycle in Physical Well-being (7.03 to 9.76), and varied most in Rights (3.34 to8.41). (See Figure 17.) One-fifth of the agencies (24) had average Physical Well-being scoresabove 9.20 and one-tenth (12) had Physical Well-being scores below 7.97. The majority (70%)had average Physical Well-being scores between 7.97 and 9.20. The majority of agencies hadEmotional Well-being scores between 8.00 and 9.00, with the top one-fifth having averagescores between 9.00 and 9.57 and the bottom one-tenth has scores between 6.33 and 8.00. Material Well-being varied much more among agencies, with the middle 70% varying from 6.30to 7.95. The top 20% varied almost as much as the middle 70%, from 7.95-9.55, while the
3456789
10
Physica
l Well
-being
Emotion
al W
ell-bein
g
Mate
rial W
ell-bein
g
Inter
person
al Rela
tions
Social In
clusio
n
Person
al Dev
elopmen
t
Self-D
eterm
ination
Rights
3456789
10
Physica
l Well
-being
Emotion
al W
ell-bein
g
Mate
rial W
ell-bein
g
Inter
person
al Rela
tions
Social In
clusio
n
Person
al Dev
elopmen
t
Self-D
eterm
ination
Rights
Figure 17. Average Quality of Life Among Top 20%, Middle ;70%, and Bottome 10% ofAgencies

Ask Me!sm Project FY2009 -- The Arc of Maryland December 2009 Page 25
bottom 10% varied only from 5.38 to 6.30. Agencies had a fairly narrow range of variation inInterpersonal Relations, with 70% being between 7.08 and 8.16, 20% between 8.16 and 8.85,and 10% between 5.60 and 7.08. Social inclusion did not vary much among the top 20% (8.00-8.50) or among the middle 70'% (6.85-8.00), but varied substantially among the lowest 10%(4.13-6.85) with one agency having an average score less than the neutral value of 5.00. Greatervariation in Personal Development than in Social Inclusion occurred among agencies in the top20% (8.02-8.92) and middle 70%, (6.55-8.02), but less variation occurred among the bottom10% (6.02-6.55), and no agency had an unfavorable average response. The domain of Self-Determination had substantial variation among agencies in the top 20% (7.90-8.96), the middle70% (6.11-7.90), and the bottom 10% (4.56-6.11). Four of the agencies in the bottom 10% hadunfavorable average responses below 5.00 in the domain of Self-Determination. Six agencieshad unfavorable Rights scores (3.34-5.00) and an additional six had scores just above the neutrallevel (5.00-5.60). The middle 70% of agencies had average Rights scores between 5.60 and7.36, and the top 20% had average Rights scores of 7.36 to 8.41.
Two-fifths of the agencieswere in the top 20% ofagencies on at least twodomains. One-fifth were inthe bottom 10% on at leasttwo domains. A few were inthe top 20% and bottom10% about equally. Mostwere in the middle 70% onall, or all by one domain. Quality of life does not seemto be related in anyconsistent way to agencysize, but smaller agencieswere more likely to be at thequality extremes than larger agencies. (See Figure 18.) Among agencies supporting 10-50people, 30% were in the bottom 10% on two or more quality of life domains, and 41% were inthe top 20% on two or more domains. In contrast, none of the agencies supporting 150 or morepeople ranked in the bottom 10% on more than one quality of life domain, and 30% or fewerranked in the top 20% on more than one quality of life domain.
Agency Quality and Agency Characteristics
A number of characteristics of people and their services were associated with the quality of lifethey reported. (See Appendix Table B4.) Characteristics of the people supported by an agency,and the type of services the agency provides, likewise affect the average quality of life reportedfor the agency. These characteristics of the people and services explain as little as one-fourth ofthe agency variation in Interpersonal Relations (R2=.24) to over half of the variation in theaverage reported level of Physical Well-being and Self-Determination (R2=.57 and .51
0%10%20%30%40%50%60%70%80%
10-50 51-149 150-349 350+
Number of People Supported
Bottom 10% in 2+domainsMiddle 70% inmost domainsTop 20% in 2+domains
Figure 18. Percent of Agencies with Quality Extremes, by Size

Page 26 December 2009 Ask Me!sm Project FY2009 -- The Arc of Maryland
respectively). (See Figure 19.) The most variation that could be explained was in the domainof Physical Well-being, and most of this was explained by the reported availability oftransportation ( =.67). Only two other agency characteristics added any additional help inunderstanding the Physical Well-being reported at an agency: the intellectual abilities of thepeople supported ( = -.18) and the percent of people with autism ( =.14). Intellectual abilitywas not associated with Physical Well-being when analyzed at the individual level for either selfor proxy respondents, and probably reflects the very high Physical Well-being reported byproxies. (Refer back to Figure 12 on page 17.) Transportation Availability and four othercharacteristics explained almost half of the variation among agencies in Emotional Well-being,while none of the four other characteristics were significantly associated with Emotional Well-being at the individual level. Transportation Availability, intellectual ability and southern regionwere associated with Material Well-being at the agency level, but only southern region wasassociated with Material Well-being at the individual level. Intellectual ability was associatedwith Interpersonal Relations at the agency, and among proxies at the individual level except inthe opposite direction. Supported employment was related to Personal Development at both theagency and individual level. Transportation Availability was not associated with Rights at theAgency level, even though it was at the individual level. Higher rights were reported at agencieswith more people responding for themselves and providing more of their people with supportedemployment services, the same as observed at the individual level. Agencies supporting greater
Physical Emotional Material Inter- Social Personal Self-Characteristic Well- Well- Well- personal Inclusion Develop- Determi- Rights
being being being Relations Inclusion ment nationTransport available .67 .47 .45 .41 .36 .21 .56 ...
Person% Self-respondent ... ... ... ... ... ... .58 .34Intellectual ability -.18 ... -.23 -.22 -.30 ... ... ...Average age group ... .15 ... ... ... ... ... ...Western region ... ... ... ... ... ... .16 ...Southern region ... ... .19 ... ... ... ... ...% Autism .14 ... ... ... ... ... ... ...% Cerebral palsy ... .23 ... ... ... -.23 -.14 -.18% Head injury ... -.25 ... ... ... ... ... ...% Hearing impaired ... ... ... ... ... ... ... -.24% Mental disorder ... -.15 ... ... ... ... ... ...
Services% Support employment ... .23 ... ... ... .26 ... .30% Residential services ... ... ... ... ... ... -.27 ...% Day habilitation ... ... ... ... .19 ... ... ...% Individual support ... ... ... ... ... ... ... .26R2 .57 .48 .36 .24 .30 .22 .51 .45
Figure 19. Relation of Agency Characteristics with Agency Quality of Life, by Domain (coefficient)

Ask Me!sm Project FY2009 -- The Arc of Maryland December 2009 Page 27
percentages of people with cerebral palsy had lower reported levels of Personal Development,Self-Determination, and Rights than agencies supporting smaller percentages with cerebralpalsy, even though cerebral palsy was not found associated with quality of life at the individuallevel. Geographic region, associated with quality of life in seven of the eight domains at theindividual level, was associated with only two quality of life domains at the agency levelindependent of average reported Transportation Availability. When Transportation Availabilitywas not included in the regressions, geography was associated with quality of life in sixdomains. (See Appendix Table B5.)
Geographic region had significanteffect on the average TransportationAvailability reported at an agency. Those agencies in the southern andwestern DDA regions had greaterTransportation Availability reportedthan agencies in the central andeastern regions. (See Figure 20.) This reflects what was found at theindividual level. The individualanalysis also found differencesbetween self and proxy reporting,with proxies reportingtransportation as much moreavailable than self respondentsreported. Thus at the agency level,the greater the percent of people responding for themselves, the lower the average reported levelof Transportation Availability. The level of Transportation Availability, reported in the firstcycle for the agency, also affected the level of Transportation Availability reported in the secondcycle, but less so than the other three characteristics. Excluding the cycle one reported level ofTransportation Availability from the regression would only increase the size of the remainingthree path coefficients.
Agency Change Over Time
The Ask Me! Survey included 108 Maryland community agencies at least twice betweenFY2002 and FY2009. The 34 larger agencies had interviews during two or more years in one orboth of the cycles, and their responses during a cycle were combined for this analysis. For allagencies, the responses were adjusted to the midpoint of each cycle to eliminate any differencesthat might be due to which year during the cycle that interviews were conducted. This resultedin an effective interval of four years between interviews.
The average quality of life scores increased for the majority of agencies, irrespective of whichdomain is considered. Almost three-fourths of the agencies had increases in Emotional Well-being (72%) and Rights (73%). However, just over half (51%) had increases in Material Well-being. (See Figure 21.) About two-thirds had increases in the other seven domains. On
TransportationAvailability
Western Region
Southern Region
% Self Response
TransportationAvailability
Cycle 2Cycle 1
-.40
.25
.30.3
2
TransportationAvailability
Western Region
Southern Region
% Self Response
TransportationAvailability
Cycle 2Cycle 1
-.40
.25
.30.3
2
TransportationAvailability
Western Region
Southern Region
% Self Response
TransportationAvailability
Cycle 2Cycle 1
-.40
.25
.30.3
2
Figure 20. Agency Characteristics and TransportationAvailability at Agencies

Page 28 December 2009 Ask Me!sm Project FY2009 -- The Arc of Maryland
Emotional Well-being, 2% of the agencies experienced declines of 1.00 or more, and 4%experienced declines of 0.50-0.99. Most of the declines (22%), however, were less than 0.50and are likely due to sampling variability for small agencies where only about 30 interviewswere conducted during each cycle. Half (48%) of the agencies with increases also had smallincreases that could be due to sampling variability. Still, 18% had increases in Emotional Well-being between 0.50 and 0.99, and 6% had increases of 1.00 or more, with the greatest increase of1.50. One-fifth of the agencies had increases in the domain of Rights of 1.00 or more, and thegreatest increase was 2.30. Self-Determination scores increased similarly to Rights scores, withalmost one-fifth having increases of 1.00 or more and the greatest increase of 2.28. The largerincrease in Self-Determination and Rights compared to in Emotional Well-being may reflectboth the lower overall scores in Self-Determination and Rights to begin with, and the trainingemphasis that DDA and The Arc of Maryland placed on Self-Determination and Rights startingin the third and fourth years of cycle one after the average scores remained unchanged.
Material Well-being had no discernable trend over the eight years for Maryland as a whole, andthis is reflected at the agency level. Almost as many agencies experienced small declines of 0.00to 0.49 (25%) as experienced small increases of 0.01 to 0.49 (30%). Just about as manyexperienced large declines of 1.00 or more (7%) as experienced large increases of 1.00 or more(6%). The range of 3.92 points between the agency with the greatest decrease in Material Well-being (-1.88) and the agency with the greatest increase (2.04) was wider than in any of otherdomain except rights, where the range was 4.04 points (-1.74 to 2.30).
The average quality of life in each domain had a strong correlation with the average reported atthe same agencies during cycle one, ranging from r=.46 in Personal Development to r=.60 inRights. Adding the cycle one quality of life to the stepwise regression equations adds minimalexplained variance for the regression of Physical Well-being and changes the statisticalsignificance of some of the variables. However, the cycle one quality of life adds substantialamounts of additional explained variances to the regressions of Material Well-being andInterpersonal Relations, and substantially changes what appears to affect quality of life in thesecond cycle. (See Appendix Table B5.) Path analysis of Material Well-being and Rights withinformation from both cycle one (shown in blue) and cycle two (shown in red) show how agency
Change in Physical Emotional Material Inter- Personal Self-average well- well- well- personal Social develop- Determi-quality of life being being being relations inclusion ment nation Rights
Total 100% 100% 100% 100% 100% 100% 100% 100%-1.00 or greater 4% 2% 7% 1% 1% 4% 3% 5%-0.50 to -0.99 10% 4% 17% 10% 11% 8% 12% 5%0.00 to -0.49 27% 22% 25% 24% 20% 25% 20% 17%0.01 to 0.49 42% 48% 30% 41% 38% 32% 24% 27%0.50 to 0.99 14% 18% 15% 18% 22% 22% 24% 25%1.00 or greater 4% 6% 6% 7% 8% 10% 17% 21%
Figure 21. Percent of Agencies by Change in Quality of Life over Four Years and Domain

Ask Me!sm Project FY2009 -- The Arc of Maryland December 2009 Page 29
characteristics that are associated with quality of life in the second cycle may be different thanthose associated with quality of life in the first cycle, and show what characteristics haveaffected change in the quality of life over time.
Cause and effect, and change, can be modeled at the agency level with a path diagram. MaterialWell-being did not improve overall during the eight years of the survey, and the level of MaterialWell-being reported during the first cycle had a large effect on the level of the Material Well-being reported during the second cycle four years later ( =.36). (See Figure 22.) However, the
level of Transportation Availability reported in cycle two related to Material Well-being reportedin cycle two as did the Material Well-being reported in cycle one In other words, the moretransportation was seen as available, the more Material Well-being at the agency increasedduring the previous four years. Agencies with higher Transportation Availability in cycle onehad higher Transportation Availability reported in cycle two. Cycle one TransportationAvailability had two indirect effects on cycle two Material Well-being: 1) as it affectedTransportation Availability in cycle two, and 2) as it affected Material Well-being in cycle one. Geography did not directly affect Material Well-being in either cycle one or cycle two, but had asubstantial indirect effect on cycle two Material Well-being as perceived TransportationAvailability increased much more rapidly over the four years in western Maryland than in theother DDA regions. This positive indirect effect of location in the western region was somewhatreduced by the fact that agencies in western Maryland provided greater percentages of theirpeople with individual support services than agencies in other parts of the state, and higher levelsof individual support services were related to lower levels of Material Well-being. Supportedemployment, use of public transportation, intellectual ability, and the percent of people selected
MaterialWell-being
Intellectual Ability
Response RateMaterial
Well-being
% IndividualSupport
CYCLE 1 CYCLE 2
% Supported Employment
TransportationAvailability
.57
.28
-.19
.36
-.29
.28
.36
TransportationAvailability
Western Region
.25
-.24
.48
.50
.17
-.28
.30
-.20
% MentalDisorder
% Public Transportation
.20Material
Well-being
Intellectual Ability
Response RateMaterial
Well-being
% IndividualSupport
CYCLE 1 CYCLE 2
% Supported Employment
TransportationAvailability
.57
.28
-.19
.36
-.29
.28
.36
TransportationAvailability
Western Region
.25
-.24
.48
.50
.17
-.28
.30
-.20
% MentalDisorder
% Public Transportation
.20
Figure 22. Changes in Agency Material Well-being

Page 30 December 2009 Ask Me!sm Project FY2009 -- The Arc of Maryland
for the Ask Me! Survey who agreed to be interviewed, all directly affected the level of MaterialWell-being reported in cycle one, but did not affect changes in Material Well-being over the fouryears between cycles. Agencies with larger percentages of people with mental health disordersin cycle two had less increase (or more decrease) in Material Well-being than did agencies withsmaller percentages with mental health disorders. The path model also shows that agencies withhigher cycle one response rates and/or supported employment provided smaller percentages oftheir people with individual support services in cycle two than agencies with lower surveyresponse rates and/or supporting smaller percentages in employment. Greater intellectual abilityand/or public transportation use was associated with higher percentages receiving individualsupport services. These indirectly affected cycle two Material Well-being, as less increase (orgreater decrease) in Material Well-being occurred for agencies providing large percentages ofpeople with individual support services.
Rights changed substantially between the first and second four-year cycles of the Ask Me!Survey. However, the level of Rights reported during cycle one was the strongest predictor ofthe average level of Rights reported during cycle two ( =.47). (See Figure 23.) Four factorsaffected change in Rights at agencies, and had direct effects on the average level of Rights
reported during cycle two. The larger the percentages of people at the agencies who respondedfor themselves, the higher the level of Rights that were reported. This relationship was observedduring cycle one as well, and the percent responding for themselves in cycle two was highlyrelated to the percent responding for themselves in cycle one ( =.86). Independent of people�’sabilities to respond for themselves, rights increased less over the four years at agencies providinggreater percentages of their people with residential services. Agencies�’ residential services did
Rights
% SelfResponse
% HearingImpairmentSouthern
Region
-.21
.86
. 53
Rights.47
% SelfResponse . 17
.22
Cycle 2Cycle 1
% Epilepsy,Seizures
-.20% Cerebral
Palsy
-.45
% ResidentialServices -.19
-.15Rights
% SelfResponse
% HearingImpairmentSouthern
Region
-.21
.86
. 53
Rights.47
% SelfResponse . 17
.22
Cycle 2Cycle 1
% Epilepsy,Seizures
-.20% Cerebral
Palsy
-.45
% ResidentialServices -.19
-.15Rights
% SelfResponse
% HearingImpairmentSouthern
Region
-.21
.86
. 53
Rights.47
% SelfResponse . 17
.22
Cycle 2Cycle 1
% Epilepsy,Seizures
-.20% Cerebral
Palsy
-.45
% ResidentialServices -.19
-.15
Figure 23. Agency Change in Rights

Ask Me!sm Project FY2009 -- The Arc of Maryland December 2009 Page 31
not affect the level of reported rights in cycle one, but agencies with higher self-response incycle one were less likely to be providing residential services in cycle two, showing that selfresponse affects Rights and change in Rights occurs through multiple paths. Independent ofability to respond for themselves, the reporting of Rights increased less at agencies supportinglarger percentages of people with cerebral palsy and with hearing impairments than at agencieswith smaller percentages of people with these particular types of disabilities. Cerebral palsy andhearing impairments were not associated with the level of Rights reported in cycle one, butepilepsy and seizure disorders were. Finally, agencies in the southern region had the same levelof Rights reported during the first cycle as did agencies in other parts of the state, but Rightsincreased more rapidly among agencies in the southern region than among agencies in otherregions.

Page 32 December 2009 Ask Me!sm Project FY2009 -- The Arc of Maryland
Summary of Previous Ask Me! Findings
The Ask Me! Survey has a twelve-year history, four pilot years with agencies volunteering toparticipate, and eight years with agencies selected systematically. These twelve years of datahave produced a number of findings that are documented in reports and refereed publications.The findings are summarized below with references to where more extensive discussion can befound.
Individual Characteristics
! Demographic�–Older people report slightly less Personal Development and InterpersonalRelations than younger people, but age has no relation to other quality of life domains. Men and women do not differ in their reporting of quality of life (Bonham, Basehart andMarchand, 2005: 36).
! Intellectual Ability�–Two measures of intellectual ability relate to most quality of lifedomains. People�’s ability to answer survey questions for themselves generally providesstronger predictions than agency-reported levels of ability (Bonham, Basehart andMarchand, 2005: 36, 80-81). However, the importance of intellectual ability and third-person reporting cannot be separated for those unable to respond for themselves(Bonham, Basehart and Marchand, 2006: 18-24).
! Conditions�–A few physical conditions and impairments may relate to quality of life, butwhich ones often depends on whether the individual or proxies answer the surveyquestions (Bonham, Basehart and Marchand, 2005: 36, 80-81).
Service Characteristics
! Employment�–People with supported employment services have higher quality of life inall eight domains than people with day habilitation services when physical andintellectual abilities have been taken into account (Bonham, Basehart and Marchand,2005: 35, 80-81). Also, agencies with a large percent of consumers in supportedemployment had a higher average reported quality of life than agencies that provided fewor no consumers with employment support. This was true for six of the eight domains(all except Physical and Emotional Well-being), even after physical and intellectualabilities had been taken into account (Bonham, Basehart and Bonham, 2005: 40, 82).
! Residential�—Whether people do or do not receive residential services does not directlyrelate to their quality of life. One study suggests that the more independent theresidential situation, the higher the quality of life (Bonham, Basehart and Marchand,2000a).
! Community Supported Living�–Whether or not a person has community supported livingarrangements (CSLA) does not affect quality of life at the individual level, but agencies

Ask Me!sm Project FY2009 -- The Arc of Maryland December 2009 Page 33
with larger proportions of people in CSLA services have higher average reporting ofMaterial Well-being and Social Inclusion than other agencies (Bonham, Basehart andMarchand, 2005: 37, 43, 82),
! Other Support�–Whether people do or do not receive individual support services (ISS)does not directly relate to their quality of life (Bonham, Basehart and Marchand, 2005: 37). The characteristics and quality of these services have not been measured.
! Transportation�—People�’s perception of the availability of transportation has a largeeffect on their quality of life in all eight domains. The frequency that family and friendsprovide transportation is the only objective measure of transportation that relates to(increases) perceptions of transportation availability (Bonham, Basehart and Marchand,2004: 23). The frequency that an agency provides transportation to employment or dayprograms and to other activities directly affects one or two quality of life domains. Agencies who have many people using public transportation also have higher reportedquality of life in Material Well-being and Interpersonal Relations (Bonham, Basehart andMarchand, 2005: 82). Being able to depend on a planned ride is highly related toperceptions of Rights, and using public transportation has become more stronglyassociated with Rights over time (Bonham, Basehart and Marchand, 2007: 11).
! Service Coordination�—Whether or not people receive service coordination (servicebrokering) independent of an agency directly providing support does not show anystatistical relationship with quality of life. However, the quality of the relationship withthe service coordinator (chosen, available, listens, identifies new services) does affectquality of life (Bonham, Basehart and Marchand, 2000a).
Staff Characteristics
! Turnover�—The higher the turnover rates of direct support and first line supervisors at anagency, the lower the quality of life in several domains (Bonham, Basehart andMarchand, 2005: 42, 82; Bonham, Basehart and Marchand, 2006: 18).
! Wages�—Wages of direct support staff directly affect only Personal Development,independent of staff turnover. Wages of first line supervisors had no independent directeffect (Bonham, Basehart and Marchand, 2005: 41, 82).
! Staffing Ratio�–The larger the number of direct support staff supervised by a first levelsupervisor, the lower the Personal Development and Self-determination reported by thosesupported by the agency (Bonham, Basehart and Marchand, 2005: 41, 82).
Agency Characteristics
! Quality Assurance Plans�—Agency goals of improving Physical Well-being, PersonalDevelopment, Self-determination, and Rights resulted in increased quality of life among

Page 34 December 2009 Ask Me!sm Project FY2009 -- The Arc of Maryland
the people they support. Agency goals of improving Emotional Well-being, consumersatisfaction, or staff satisfaction resulted in decreased quality of life. Goals to improveagency processes had no direct effect on quality of life (Bonham, Basehart andMarchand, 2004: 28).
! Value Placed on Consumer Data �—The greater the participation rate in the Ask Me!Survey (both self and proxy responses), the higher the reported quality of life at anagency (Bonham, Basehart and Marchand, 2005: 41, 82). The more times agenciesattended training on Ask Me! and analyzed the data for themselves, the greater the valuethey saw in the data (Bonham, Basehart and Marchand, 2003: 48-51).
Quality of Life Measurement
! Involvement of People with Disabilities�–People with intellectual and otherdevelopmental disabilities should be involved in research affecting them at all stages ofthe process. Most important is asking individuals directly about themselves, and the AskMe! Survey has the highest reported level of self-response of surveys of people withdisabilities. This is due to the content of the survey coming directly from people withdisabilities, from peers determining their ability to respond and conducting theinterviews, and the survey process and results increasing the confidence and self-advocacy of both interviewers and respondents (Bonham, 2008b).
! Proxy Reporting�–Some people cannot understand and respond to questions forthemselves, so others are asked to provide information by proxy. Proxies do not answeras many questions as those who can respond for themselves can answer, and are no moreconsistent in their answers than self-respondents. Two proxies for the same person agreemost on Emotional Well-being and least on Self-determination. Two proxies who areboth day staff proxies agree with each other most frequently while a family proxy and astaff proxy agree the least. Self-respondents and proxies differ on the level of quality oflife they report, but not on what influenced the quality (Bonham, Basehart and Marchand,2006: 18-24; Bonham, 2006).
! Peer Interviewers�–People with disabilities can become excellent interviewers of theirpeers. The number of answers they elicit increases with their experience (Bonham et al.,1999: 8). The FY2008 interviewers averaged 5.0 years of experience. Some evidenceexists to suggest that respondents give more �“yes�” or positive answers to non-peers thanto peers (Bonham, Basehart and Marchand, 2001: p. 8).

Ask Me!sm Project FY2009 -- The Arc of Maryland December 2009 Page 35
Discussion
Quality of Life Measurement
The concept for the Ask Me! Project began in 1996 with a broad-based consortium ofkey stakeholders: Maryland Developmental Disabilities Administration (DDA), MarylandDisability Law Center, Maryland Developmental Disabilities Council, People on the Go ofMaryland, The Arc of Maryland, and the Maryland Association of Community Service. It wasbased on premises that reflect the four principles of participatory action research (Whitney-Thomas, 1996): (a) research subjects should identify the specific issues that are important tothem, (b) individuals should be asked directly about their own lives, (c) subjects should beinvolved in the collection of data, and (d) the research should be used to empower people. Afour-year pilot began in FY1998, using a modification of the Schalock and Keith Quality of LifeQuestionnaire that could be administered by interviewers with developmental disabilities. Acompletely new Ask Me! Survey was developed in FY2001 to include more of the questions self-advocates had identified as important to them, and to reflect the better understanding of the multidimensionality of the quality of life construct. International research in a number of fields hassomewhat agreed on eight dimensions to quality of life, but has not agreed on whether ahierarchy exists among them. This report focuses on selected domains based on the level of theirscores and the change in them over time, and does not assume any theoretical hierarchy amongthem.
The Ask Me! Survey has been administered to a random sample of individuals supported by aprobability sample of community agencies annually between FY2002 and FY2009 in two cycles. Each Maryland agency supporting ten or more individuals is included at least once during acycle. The largest agencies in Maryland have been able to review the change in reporting oftheir people over time, but FY2009 marks the first time that 108 Maryland agencies can analyzechange over time. This report presents the quality of life scores for individual agencies for theFY2006-FY2009 cycle. The FY2005 report contains similar data for the FY2002-FY2005 cycle. Bonham Research sent to each agency a customized and updated toolkit that included fourPowerPoint slides. The first slide showed the scores for each domain for each year of both cycleone and cycle two that the agency was included in the survey. The second slide showed theagency�’s cycle two score, averaged and adjusted to the midpoint, compared to the Marylandcycle two average, and symbols indicating the agency�’s relative standing compared to otheragencies. The third slide showed the four questions which people supported by the agencyanswered most favorably compared to the Maryland average, and the fourth slide showed thefour questions which people answered least favorably compare to the Maryland average.
The use of the same survey instrument and procedures during the eight years makes analysis ofchange over time straight forward. However, an unchanging survey cannot reflect changes inhow people define quality of life. During FY2008-FY2009, the Ask Me! Project team reviewedthe research literature, distributed surveys, and conducted focus groups with adults, transitioningyouth, parents of young children, community agencies, and DDA staff to identify importantquestions not included in the existing survey. The resulting Ask Me! Survey-2 was pretested in

Page 36 December 2009 Ask Me!sm Project FY2009 -- The Arc of Maryland
the during FY2009 for use inFY2010. Key revisions include: 1)new questions about romanticrelations and including these andquestions on friendships in adomain different from relationswith staff, 2) new questions aboutopportunities to speak forthemselves and lead others invarious situations, 3) new questionson work and the quality of worklife, and 4) replacing the questionson transportation availability withquestions on services and staffrelations. (See Figure 24.) Thedevelopment of the new surveyinstrument and how the new domain scores compare with the previous domain scores appears ina separate report (Bonham, Schneider, Volkman and Sorensen, 2009). The procedures of therevised Ask Me! Survey will change in only two ways. The first is minor and reflects moving thequestion on potential abuse to the end of the survey and requiring interviewers to report anyindication of abuse to their supervisors, who in turn are required to report it. The secondinvolves asking agencies to report the level of support needed, the place of residence, and thehours worked for pay rather than transportation and the level of intellectual ability.
The emphasis in the Ask Me! Survey on peer interviewers has resulted in higher self responsethan reported by any other survey of people with developmental disabilities (Feinstein, 2009;Perry and Felce, 2002; Research and Training Center on Community Living, 2004: Siegelman, etal., 1980). This report shows significant differences in the reporting of self respondents andproxy respondents. Some of these differences may be due to differences between people whocan and cannot understand and answer questions, but the pattern of differences suggest thatmuch of the differences are due to the perspective of proxies that are influenced by their positionor relation to the individual. It does not seem plausible that people who are unable to respondfor themselves truly have greater Physical Well-being than people able to respond forthemselves, particularly when residential staff reports greater Physical Well-being for the sameperson than do day habilitation staff. Nor does it seem plausible that people able to live withtheir families or in their own homes have fewer rights than those receiving residential servicesfrom agencies. It does not seem reasonable that a resource coordinator would only reduce thePersonal Development and Interpersonal Relations of people unable to respond for themselvesand not affect the Personal Development and Interpersonal Relations of self respondents. Still, itis important to get the perspective of staff and family rather than to gather no information on thequality of life of people unable to understand and communicate even with others who havedisabilities.
• Friendships and romantic relations separated from staff relations
•• New questions on leadership, planning,
speaking up, and saying “No”
• New questions on quality of work life
• New section on staff and services replaces old section on transportation
Figure 24. Changes for Ask Me! Survey-2sm

Ask Me!sm Project FY2009 -- The Arc of Maryland December 2009 Page 37
Quality of Life Increase in Maryland
During the time period covered by the Ask Me! Survey, the number of adults supported in thecommunity through DDA funding increased by 2,240, and the number of community agenciesincreased by 19. Most of the new community agencies supported fewer than ten people, andwere therefore not included in the survey. These smallest agencies supported only a fraction of apercent of the people with reimbursed DDA services, at least half of whom received servicesfrom larger agencies. These smallest agencies also frequently provide services for a short periodof time. One-third of the agencies supporting fewer than ten adults in FY2002 no longersupported adults with DDA funds in FY2009, and only one-tenth had grown to support ten ormore adults by FY2009. The remainder continued to support fewer than ten adults. Forty-threeagencies had started providing support after FY2002, only 30% of which had grown to supportten or more adults by FY2009.
The quality of life increased during the same period that services expanded to include morepeople. It is possible that some of the increases in quality of life resulted from extendingservices to people with higher quality of life to begin with. The percent of people responding forthemselves, and the percent living in the southern DDA region, increased during the eight yearsof the Ask Me! Survey, and self response and southern Maryland location were associated withhigher quality of life in the majority of the domains. However, the decrease in frequency of tripsto employment or day habilitation would have dampened the increase in half of the domains. Rights, not caused it. Other characteristics that affected the quality of life in half or more of thedomains did not change significantly over the time period: intellectual ability, supportedemployment, and the western region location
It seems more likely that the increases in quality of life between FY2002 and FY2009 are theresult of increased attention paid to quality of life by DDA and community agencies as a resultof the Ask Me! Survey. DDA initially set its �‘Management by Objectives�’ goal to increasePersonal Development based on FY2002 findings, and has used Ask Me! findings to measureachievement of its goal. The FY2003 Ask Me! report stated, �“Rights and self-determinationreceived the lowest average rating by people . . .and were the only domains that did not increasebetween FY2002 and FY2003.�” It recommended:
The Maryland developmental disabilities system needs to increase its attention on rightsand self-determination.
While DDA did not change its official domain of focus based upon findings, it increased itstraining on Self-Determination and Rights during FY2004. The FY2004 report noted, �“Self-determination increased only in FY2004; Rights of people did not change over the four years,�”and made its recommendation more general:
Recommendation 1: Physical and emotional well-being are foundational to a life ofquality and should be maintained, but attention should now turn to increasing self-determination and rights.

Page 38 December 2009 Ask Me!sm Project FY2009 -- The Arc of Maryland
The FY2005 report again noted. �“No change in the level of rights,�” repeated the recommendationabove and added another recommendation regarding Rights:
Recommendation 4: Providers should focus on enhancing rights through enhancing self-determination and personal development. Focusing on supported employment is aprimary way to enhance personal development, and lessons may be learned from theWestern DDA region on how to help adults, with the same level of intellectual ability andpersonal development, have a greater sense of self-determination.
The Arc of Maryland specifically increased its efforts to promote Self-Determination and Rightsduring these years based on Ask Me! findings. At the end of the first four-year cycle (FY2005),the Ask Me! Project developed and sent to each agency a Toolbox containing data specific to thepeople the agency supported. The Toolbox provided suggestions on how to use Ask Me! Data. It is updated with four PowerPoint slides, customized for the agency, each year the agency isincluded in the survey and again at the end of a four-year cycle. DDA also began requiringagencies to address how they use Ask Me! findings in their quality assurance plans. Thecontinuing increase in quality of life, particularly in the domains of Self-Determination andRights, suggests that these recommendations and efforts were effective. Three-fourths ofagencies responding to a 2008 survey said they had used the Ask Me! findings. One agency hasfound the Ask Me! information so valuable that it self-funds interviews during years when it isnot included in the statewide sample.
Quality of life increased most over the years in the domains of Rights and Self-Determination. These two domains still have room for further increases, and efforts should continue to enhancethem. However, no consistent pattern of change occurred in the domain of Material Well-being,and all the increases occurred in the FY2002-FY2004. This suggests that greater emphasis benow placed on Material Well-being. Increasing people�’s abilities to respond for themselves,increasing the perceived availability of transportation, and increasing supported employmenthave the greatest potential to increase Material Well-being.
Quality of Life Differences for Individuals
The analysis of quality of life differences for individuals is limited to association, sinceindividuals are randomly selected each year independent of any selection in prior years. Someindividuals may be selected by chance in different years, but they would not constitute a randomsample of people, as the probabilities of being selected in two or more years is dependent up thesize of the agencies that support them. Therefore, no study of change in the quality of life ofindividuals over time has been done since the initial two pilot years. However, the associationsof characteristics of individuals and their services with quality of life suggest causal effects, atleast in terms of reporting. It is very clear that self respondents and proxy respondents reportdifferently. Anything that increases the ability of people to respond for themselves will increasequality of life in at least five domains: Rights, Self-Determination, Personal Development andSocial Inclusion, and Material Well-being. Information from proxies may be valuable inunderstanding how they, particularly staff, see quality of life and what may need to be done tobring it into greater agreement with how the people they support view their quality of life. The

Ask Me!sm Project FY2009 -- The Arc of Maryland December 2009 Page 39
higher reporting of Physical Well-being by proxies, particularly residential staff, suggests theymay have too low a threshold of what constitutes Physical Well-being, or else an overlyoptimistic view of how they contribute to Physical Well-being. Quality of life was related toindividuals�’ abilities to respond for themselves in six domains during both the first and secondcycles. Quality of life was related to other measures of intellectual ability in six domains in thefirst cycle but only four in the second cycle. It appears that this external measures of intellectualability is becoming less important, and the Ask Me! Project will no longer request thisinformation from agencies in the future.
Individuals receiving supported employment had higher reported quality of life in most domainsin both cycles (6 in cycle one and 5 in cycle two). The relative importance of supportedemployment did not otherwise change between the two cycles, and was independent of all othercharacteristics, and increased when transportation availability was excluded from the analysis. These findings emphasizes the importance of a job to a life of quality, and the revised Ask Me!Survey will collect additional information on employment in cycle three.
Self respondents with developmental disabilities in the western part of Maryland reported higherquality of life than did self respondents in the central and eastern parts of the state in sevendomains during the first cycle and all eight domains during the second cycle. The perceptionthat transportation is more available in the western region, contributed indirectly to this regionaldifference. The regional difference in one domain during cycle one, and two domains duringcycle two, disappeared when perceived Transportation Availability was included. People insouthern Maryland reported higher quality of life than people in central and eastern Maryland infive domains in both cycles, similar to those in western Maryland, but the perception of greateravailability of transportation in the southern region contributed to the geographical difference. Independent of transportation availability, self respondents in the southern region reported thesame quality of life as in the central and eastern regions during the first cycle, and in only threedomains during the second cycle. A study elsewhere (Keith and Ferdinand, 2000) found thatgeographic variation in the quality of life reported by people with developmental disabilitiesreflected the geographic variation in the quality of life reported by people without developmentaldisabilities. It may be that people without disabilities in western and southern Maryland wouldalso report higher quality of life than similar people in central and eastern Maryland.
Few other characteristics of individuals and their disabilities had significant relationships withquality of life during either cycle, and none were related to quality of life in both cycles. This,along with the lessening importance of intellectual ability, suggests that all individuals canpotentially benefit from efforts to enhance quality of life.
Quality of Life Among Agencies
The average quality of life reported by people supported by agencies vary. Between one-seventhand one-half of the variation in quality of life among the agencies can be explained by theirgeographic location, the disability characteristics of the people agencies support, and the types ofservices they provide. The remaining variation is due to factors not measured for the Ask Me!Project. A good quality of life is the desired outcome for support services, and most people

Page 40 December 2009 Ask Me!sm Project FY2009 -- The Arc of Maryland
receive support from only one agency. Therefore, it would be expected that the quality ofagency services, and the staff that provide them, will affect the quality of life of the supportedindividuals. Earlier studies have shown that agency quality assurance goals and the turnover ofdirect care staff and first line supervisors affect the quality of life reported at agencies. Size ofthe agency seems to have some effect, but not in a linear manner. Those agencies that ranked inthe top 20% in multiple domains, or ranked in the bottom 10% in multiple domains, tended to beagencies supporting fewer than 150 people. No larger agency ranks in the bottom 10% in morethan one domain, but a smaller percent of larger agencies than medium and smaller agenciesrank in the top 20% in more than one domain. Perhaps policies and procedures are moreroutinized at larger than smaller agencies and they prevent problems from occurring. However,routinized policies and procedures may also hinder new or non-standard ways that quality of lifecould be enhanced. Perhaps resource coordination and CSLA are seen by staff as non-standardfor people unable to respond for themselves, and thus are seen as hindering quality of life.
In both cycles, an average of 3.8 characteristics of people and services predicted domain scoresat agencies. They predicted an average of 50% of the variation during the first cycle and 39%during the second cycle. The relationships that were significant in both cycles involvedpercentages who responded for themselves and average intellectual abilities. Much of thisconsistency was due to the stability of the quality of life at agencies over four years. However,the quality of life in seven of the eight domains increased more over the four years at agencieswith greater perceived Transportation Availability. It increased more in two domains at agencieswith greater percentages of individuals who could respond for themselves, in agencies withsmaller percentages in residential services, and at agencies in the southern region. The onlyother characteristics of the people supported, or the services provided by agencies, that affectedchange in more than one domain was cerebral palsy, which was associated with greater agencychange in one domain and less agency change in three domains. However, cerebral palsy wasnot associated with quality of life at the individual level. These findings suggests that otheragency characteristics, not available for analysis in this report, also contribute to change. Additional system-wide data could contribute to understanding changes in quality of life atagencies. More immediately, agencies should analyze how their quality of life measureschanged (or did not change) between cycle one and cycle two, and develop hypotheses aboutwhat may have contributed to the change. These can then be tested with results from the thirdcycle. Another approach is to look at agencies that scored in the top 20% in several domains,and discuss with them what they are doing that might contribute to their high reported quality oflife. Individuals and families seeking supports should also ask prospective agencies what theyare doing to enhance quality of life for those they support.
Suggestions for Consideration
The researcher offers a few suggestions for consideration that come from analyzing the qualityof life data. Others will have to determine the desirability and practicality, as research can onlylook at what happened. It cannot determine what will happen in the future, nor what shouldhappen.

Ask Me!sm Project FY2009 -- The Arc of Maryland December 2009 Page 41
Suggestion 1. Increase the emphasis that is placed on Material Well-being, without neglectingthe progress that has been made in Self-Determination and Rights. The greatest impact onMaterial Well-being potentially comes from expanding paid work opportunities throughsupported community employment.
Suggestion 2. Help people be aware of all the transportation available to them to move abouttheir community, as perceptions of transportation availability are strongly related to perceptionsof quality of life. The objective number of trips known to staff has little relation to perceptions ofavailability, but transportation is seen as more available in western and southern Maryland, atsmaller than larger agencies, and by proxies more than self respondents.
Suggestion 3. Community agencies should set specific goals to enhance quality of life indomains with relatively low scores, and research concrete strategies for achieving them. Otherwise quality of life will remain similar to the current levels for the people they support.
Suggestion 4. Educate staff and families about how the people they support who can speak forthemselves view quality of life to help reduce potential bias when deciding what might enhancethe quality of life for people unable to understand and respond for themselves.
Suggestion 5. DDA could identify existing data on individuals and agencies that can be linkedwith the Ask Me! data to identify other factors that potentially affect quality of life.

Page 42 December 2009 Ask Me!sm Project FY2009 -- The Arc of Maryland
References
Basehart, S., Marchand, C., & Bonham, G. S. (2003). A survey of quality of life designed byand for people with developmental disabilities. In Bradley, V. J., & Kimmich, M. H. Quality Enhancement in Developmental Disabilities. Baltimore, MD: Paul H. BrookesPublishing Co, 163-178.
Bonham, G. S. (2008b). Who Should Speak for Individuals with Intellectual Disabilities? Evaluating Quality of Life at Community Providers. American Evaluation Association,22nd Annual conference, Denver, CO, November.
Bonham, G. S. (2006). Proxy reports and their value. Unpublished paper, July.
Bonham, G. S., Basehart, S., & Marchand, C. B. (2006). Ask Me!sm Year FY2006: The Qualityof Life of Marylanders with Developmental Disabilities Receiving DDA-Funded Services. Annapolis, MD: The Arc of Maryland (December).
Bonham, G. S., Basehart, S., & Marchand, C. B. (2005). Ask Me!sm Year FY2005: The Qualityof Life of Marylanders with Developmental Disabilities Receiving DDA-Funded Services. Annapolis, MD: The Arc of Maryland (December).
Bonham, G. S., Basehart, S., & Marchand, C. B. (2004). Ask Me!sm Year FY2004: The Qualityof Life of Marylanders with Developmental Disabilities Receiving DDA-Funded Services. Annapolis, MD: The Arc of Maryland (December).
Bonham, G. S., Basehart, S., & Marchand, C. B. (2003). Ask Me!sm Year FY2003: The Qualityof Life of Marylanders with Developmental Disabilities Receiving DDA-Funded Services. Annapolis, MD: The Arc of Maryland (December).
Bonham, G. S., Basehart, S., & Marchand, C. B. (2001). Ask Me!sm Year FY2001: The Qualityof Life of Marylanders with Developmental Disabilities Receiving DDA-Funded Services. Annapolis, MD: The Arc of Maryland (November).
Bonham, G. S., Basehart, S., & Marchand, C. B. (2000b). Ask Me!sm Year FY2000: The Qualityof Life of Marylanders with Developmental Disabilities Receiving DDA-Funded Services. Annapolis, MD: The Arc of Maryland (December).
Bonham, G. S., Basehart, S., & Marchand, C. B. (2000a). Quality of Life of Marylanders withDevelopmental Disabilities Participating in the Robert Wood Johnson SelfDetermination Initiative: Final Report. Baltimore, MD: Bonham Research.
Bonham, G. S., Pisa, L. M., Basehart, S., Marchand, C. B., Harris, C., Heim, S., & Ingram, A. (1999). Ask Me!sm Year 2: The Quality of Life of Marylanders with Developmental

Ask Me!sm Project FY2009 -- The Arc of Maryland December 2009 Page 43
Disabilities Receiving DDA-Funded Services. Annapolis, MD: The Arc of Maryland(November).
Bonham, G. S., Schneider, J. A., Volkman, J., & Sorensen, S. (In preparation). Ask Me!sm
Survey Revision. Annapolis, MD: The Arc of Maryland
Bonham, G. S., Volkman, J., & Basehart, S. (2007). Ask Me!sm Year FY2007: The Quality ofLife of Marylanders with Developmental Disabilities Receiving DDA-Funded Services. Annapolis, MD: The Arc of Maryland (December).
Cummins, R. A. (2002). Proxy responding for subjective well-being: A review. InternationalReview of Research in Mental Retardation, 25, 183-207.
Feinstein, C. (2009). Personal communication that fewer than 50% of people selected for thePennsylvania IM4Q survey respond for themselves.
Keith, K. D., & Bonham, G. S. (2005). The use of quality of life data at the organization andsystems level. Journal of Intellectual Disability Research, 49: 799-805.
Keith, K. D., & Ferdinand, L. R.. (2000). Project to compare quality of life of Nebraskans withdevelopmental disabilities and citizens without disabilities. Governor�’s Planning Councilon Developmental Disabilities, Lincoln.
Lunsky, Y., & Benson, B. A. (1997). Reliability of ratings of consumers with mentalretardation and their staff on multiple measures of social support. American Journal onMental Retardation, 102, 280-284.
People on the Go. (1996). Signs of Quality. Annapolis, MD: The Arc of Maryland.
Perry, J., & Felce, D. (2002). Subjective and objective quality of life assessment:Responsiveness, response bias and resident:proxy concordance. Mental Retardation, 40,445-456.
Research and Training Center on Community Living. (2004). Response patterns among adultrespondents with mental retardation in the National Health Interview Survey, 1997-2002. DD Data Brief, 6(2). Institute on Community Integration (UCEDD). Retrieved March18, 2005 from the World Wide Web: www.rtc.umn.edu/nhis/databrief10/dddb62.pdf.
Schalock, R. L., Bonham, G. S. & Verdugo, M. A. (2008). The concept of quality of life inprogram planning and evaluation, Evaluation and Program Planning, 32:181-199.
Schalock, R. L.,& Keith, K. D. (1993). Quality of Life Questionnaire Manual. Hastings, NE:IDS Publishing Corporation.

Page 44 December 2009 Ask Me!sm Project FY2009 -- The Arc of Maryland
Schalock, R. L., & Verdugo, M. A. (2002). Handbook on Quality of Life for Human SupportPractitioners. Washington, DC: American Association on Mental Retardation.
Sigelman, C. K., Schoenrock, C. J., Spanhel, C. L., Hromas, S. G., Winer, J. L., Budd, E. C., &Martin, P. W. (1980). Surveying mentally retarded persons: Responsiveness andresponse validity in three samples. American Journal of Mental Deficiency, 84, 479-486.
Stancliffe, R. J. (1999). Proxy respondents and the reliability of the Quality of LifeQuestionnaire Empowerment factor. Journal of Intellectual Disability Research, 43,185-193.
Wang, M., Schalock, R. L., Verdugo, M. A., & Jenaro, C. (In press). Examining the FactorStructure and Hierarchical Nature of the Quality of Life Construct, American Journal ofIntellectual and Developmental Disabilities.
Whitney-Thomas, J. (1996). Participatory action research as an approach to enhancing qualityof life for individuals with disabilities. In R. L. Schalock & G. N. Siperstein (Eds.),Quality of life: Volume II: Application to persons with disabilities (pp. 181-197).Washington, DC: American Association on Mental Retardation.
Unreferenced Ask Me!sm Reports and Papers
Bonham, G. S. (2008a). Measuring Quality of Life - �“The Maryland Ask Me!sm Experience.�” Paper prepared for the QOL Measures International Conference, Vienna, Austria,September 15.
Bonham, G. S., Basehart, S., Schalock, R. L., Marchand, C. B., Kirchner, N., & Rumenap, J. (2004). Consumer Based Quality of Life Assessment: The Maryland Ask Me! Project. Mental Retardation, 42(5):338-355.
Bonham, G. S., Basehart, S., & Marchand, C. B. (2002). Ask Me!sm Year FY2002: The Qualityof Life of Marylanders with Developmental Disabilities Receiving DDA-Funded Services. Annapolis, MD: The Arc of Maryland (November).
Bonham, G. S., Pisa, L. M., Marchand, C. B., Harris, C., White, D. & Schalock, R. L. (1998). Ask Me!sm The Quality of Life of Marylanders with Developmental Disabilities ReceivingDDA-Funded Services. Annapolis, MD: The Arc of Maryland (February).
Bonham, G. S., Volkman, J., & Sorensen, S. (2008). Ask Me!sm Year FY2008: The Quality ofLife of Marylanders with Developmental Disabilities Receiving DDA-Funded Services. Annapolis, MD: The Arc of Maryland (December).
Schalock, R. L., & Bonham, G. S. (2003). Measuring Outcomes and Managing for Results.Evaluation and Program Planning, 26:229-235.

Ask Me!sm Project FY2009 -- The Arc of Maryland December 2009 Page 45
Schalock, R. L., Bonham, G. S. & Marchand, C. B. (2000). Consumer based quality of lifeassessment: a path model of perceived satisfaction. Evaluation and Program Planning,23:77-87.
Schalock, R. L., Verdugo, G. S., Bonham, G. S., & Val Loon, J. (2008). Enhancing personaloutcomes: Organizational strategies, guidelines and examples. Journal of Policy andPractice in Intellectual Disabilities, 5(4): 276-285.

Page 46 December 2009 Ask Me!sm Project FY2009 -- The Arc of Maryland
Appendix

Ask Me!sm Project FY2009 -- The Arc of Maryland December 2009 Page 47
Appendix A. Survey Methods
Agency Sample
The Ask Me! Survey cannot interview every person who received support through funds from theMaryland Developmental Disabilities Administration (DDA) in every year, due to time andexpense. At the start of FY2009 (July 2008), the DDA had authorized 27,860 person-providerservice combinations for 15,678 people at 169 providers. (See Table A1.) These recipients ofsupport needed to be sampled in a way that produced statewide quality of life estimates, whilealso providing reasonable estimates of the quality of life among people supported by eachcommunity provider agency in the state. A two-step sampling procedure started by assigningagencies to strata based upon agency size. The number of people supported in July 2004 formedthe basis for the initial assignment of 139 agencies to strata and to years for the FY2006-FY2009cycle. The assignment was modified slightly at the beginning of each survey year using currentDDA data. The FY2009 Ask Me! Survey frame included 155 community agencies authorized toprovide 16,327 services to 13,148 adults. It excluded state institutions and individuals for whomthe institutions provided all their services, agencies that only coordinated services, agencies orfiscal entities that provided services for fewer than ten individuals, individuals less than 18 yearsof age, and Ask Me! interviewers. About three-fourths (76%) of the adults in the sample framereceived all their support (excluding service coordination) from a single agency, and had onlyone record in the sample frame. Most of the remainder received support from two agencies andhad two records in the sample frame. The few that received support from three or more provideragencies had the same number of records in the sample frame.
Table A1. People Supported by Maryland DDA, by Fiscal Year^DDA File Sample Frame*
FY06 FY07 FY08 FY09 FY06 FY07 FY08 FY09# of Provider ID�’s 154 162 158 169 139 145 151 155# Person-Provider Records 25,201 25,343 25,715 27,860 14,991 15,025 15,700 16,327# Persons Supported 13,665 13,863 14,329 15,678 12,067 12,112 12,615 13,148 Support by 1 provider 7,305 5,990 6,311 7,207 9,203 9,244 9,544 9,987 Support by 2 providers 4,564 4,515 4,760 4,867 2,807 2,826 3,057 3,143 Support by 3 providers 1,756 3,142 3,149 3,498 54 39 14 18 Support by 4 providers 38 193 108 105 3 3 0 0 Support by 5 providers 2 23 1 1 0 0 0 0 Support by 6 providers 0 0 0 0 0 0 0 0^ The DDA files were created in July at the start of the fiscal year.* The sample frame excludes records for children, institutions, support coordination, and Ask
Me! interviewers.
Page 48 December 2009 Ask Me!sm Project FY2009 -- The Arc of Maryland
Community agencies were first assigned to strata based on the number of people supported. Stratum 1 identified the ten largest agencies, and they were included in the sample every year. Collectively they provided about one-third of the supports, and excluding them from any of theannual samples would result in an unrepresentative sample. Stratum 2 consisted of the 22 nextlargest community providers randomly assigned to either FY2006 and FY2008, or FY2007 andFY2009. They provided slightly less than one-third of the supports. Stratum 3 included theremaining agencies supporting more than 50 individuals. Fifty people from agencies in strata 1-3 were randomly selected for interview each year their agency was included. Stratum 4 includedagencies supporting 10-50 adults, all of whom were selected for interviews. Agencies in strata 3and 4 were randomly assigned to one year in the four-year cycle, with some modification to keepthem as close to a four-year interval from their participation in the first cycle as possible. Few ofthe stratum 4 agencies could be interviewed during FY2002 and FY2003 due to DDA budgetconstraints, and their token representation during the first two years may have resulted inunderestimating the quality of life during these two years, resulting in the major increase seen inFY2004. Stratum 3 agencies provide slightly less than one-third of the supports, and Stratum 4agencies provide about 6% of the supports. Stratum 5 contains the remaining agencies orentities supporting fewer than ten people. Although they represent one-fifth of the agencies (orentities receiving DDA funds), they provide only 0.7% of the supports, and half of the peoplethey support are also supported by larger agencies.
The size of most agencies remained about the same from one year to the next, but some agenciesmoved between strata during the four-year cycle due to growth, merger, or subsequentdetermination that multiple provider IDs on the DDA file really represented multiple sites of asingle provider. The number of people supported by some agencies declined over the four years,and some left the sample frame due to merging with other agencies, or by no longer supportingpeople with DDA funds. These changes in size only affected the sample if they resulted in anagency being moved between stratum 1 and stratum 2, between stratum 2 and stratum 3, orbetween stratum 4 and stratum 5. Table A2 shows the allocation of agencies among the stratafor FY2009.
Table A2. Community Providers by Size and Year Selected for Interviews
Ask Me Provider IDNumber of People Year in Sample
FY06 FY07 FY08 FY09 FY06 FY07 FY08 FY09109 Arc of Baltimore 1,050 1,039 1,048 1051 1 1 1 1112 Chimes Inc, includes Intervals 718 729 750 785 1 1 1 1314 Arc of Prince George�’s Co 428 492 499 510 1 1 1 1303 CHI Center 397 426 439 444 1 1 1 1128 Providence Center 414 404 414 423 1 1 1 1355 Abilities Network 262 323 389 417 1 0 1 1312 Arc of Montgomery Co 385 413 409 412 1 1 1 1811 Arc of Washington Co 408 441 399 394 1 1 1 1311 Melwood Horticulture 390 387 381 391 1 1 1 1915 Humanim 219 351 358 365 0 1 1 1
Strata 1 Subtotal (350+ People) 5,172 5,323 5,086 5,192 11 9 10 10

Table A2. Community Providers by Size and Year Selected for Interviews
Ask Me Provider IDNumber of People Year in Sample
FY06 FY07 FY08 FY09 FY06 FY07 FY08 FY09
Ask Me!sm Project FY2009 -- The Arc of Maryland December 2009 Page 49
104 Athelas Institute 382 355 340 342 1 1 0 1107 ACCFX Gallagher 301 306 308 318 1 1 0 1132 UCP Central Maryland 299 331 329 307 1 0 1 0121 Emerge 235 275 287 293 1 0 1 0105 Opportunity Builders 218 248 269 288 1 0 1 0156 Arc of Central Chesapeake 169 178 191 241 0 1 0 1135 Arc of Howard Co 213 225 236 239 0 1 0 1318 Center for Life Enrichment 171 205 224 234 0 1 0 1124 Arc of Northern Chesapeake 186 207 215 227 1 0 1 0108 Bello Machre 181 191 214 221 0 1 0 1328 Rehabilitation Opportunities 204 209 206 207 1 0 1 0614 Dove Pointe Inc 183 182 194 201 1 0 1 0301 Ardmore Enterprises 193 193 192 196 1 0 1 0933 UCP of Southern MD 190 187 198 187 0 1 0 1302 Arc of Southern Maryland 160 165 172 179 0 1 0 1142 NCIA CBAI 121 149 162 179 1 0 1 0919 Alliance 199 179 179 173 1 0 1 0824 Arc of Carroll Co 148 156 171 173 1 0 1 0158 Center for Progressive Learning 137 157 158 155 0 1 0 1316 Spring Dell Center 126 138 146 155 0 1 0 1129 Richcroft 104 118 146 154 1 0 0 0319 New Horizon 146 147 152 152 0 1 0 1611 Bayside Community Network 120 134 147 152 0 1 0 0827 Change, Inc 147 156 150 150 0 1 0 1
Strata 2 Subtotal (150-349 People) 3,826 4,204 4,694 5123 10 12 10 12830 Target, Inc 109 128 138 149 0 0 0 1817 Medsource Community Services 123 128 126 145 1 * * 0152 Center for Social Change 84 114 131 137 0 0 1 0325 Southern MD Vocational Industries 133 138 132 136 1 0 0 0806 Friends Aware, Inc 132 135 136 129 0 1 0 0125 Penn Mar 113 120 120 126 1 0 0 0164 Spectrum Support 107 119 127 124 1 0 0 0335 SEEC 105 111 123 124 1 0 0 0149 Creative Options 100 111 120 121 0 0 1 0951 Lower Shore Enterprises 89 104 114 121 0 0 0 1322 Lt Joseph P Kennedy Institute 109 109 112 120 0 1 0 0805 Arc of Frederick County 82 90 98 119 1 0 0 0306 CSAAC 114 116 117 118 0 1 0 0608 Somerset Community Services Inc 96 102 105 118 0 0 0 1804 Scott Key Center 104 102 111 112 0 0 1 0106 Langton Green 105 104 104 107 0 0 0 1353 Securecare Services 63 91 111 105 0 0 1 0812 Washington Co HDC 95 96 103 105 0 0 1 0308 Jewish Foundation for Group Homes 86 92 98 98 0 0 1 0309 Jubilee Association of MD 83 94 98 97 0 1 0 0120 Life 76 94 96 97 0 0 1 0

Table A2. Community Providers by Size and Year Selected for Interviews
Ask Me Provider IDNumber of People Year in Sample
FY06 FY07 FY08 FY09 FY06 FY07 FY08 FY09
Page 50 December 2009 Ask Me!sm Project FY2009 -- The Arc of Maryland
932 Treatment & Learning Ctr Inc 66 77 80 94 0 0 0 1801 Appalachian Crossroads 84 96 96 93 0 0 0 1602 Caroline Center 94 91 92 93 1 0 0 0352 Community Support Services 66 76 83 93 0 1 0 0807 Horizon Goodwill Industries 96 100 95 92 1 0 0 0621 Chesapeake Center Inc 78 89 93 92 0 0 1 0802 Community Living Inc 84 93 93 90 0 1 0 0610 Worcester Co Developmental Center 93 89 88 85 1 0 0 0117 Harford Center 54 71 75 84 0 0 1 0126 Progress Unlimited 77 80 81 83 0 0 1 0606 Delmarva Community Services 91 79 77 77 0 0 1 0119 Jewish Family Services 57 66 80 75 0 1 0 0324 Family Service Foundation Inc 82 84 77 73 0 0 0 1912 CSSD 56 59 74 73 1 0 0 0624 Bay Shore Services Inc 66 72 71 70 1 0 0 0619 Benedictine School 55 62 63 64 1 0 0 0334 Jewish Social Services Agency 45 60 56 62 1 0 0 0139 Forward Visions 60 59 60 61 0 0 1 0605 Chesterwye Center 53 60 59 61 0 0 0 1315 Rock Creek Foundation 64 63 54 61 0 1 0 0616 Chesapeake Care Resources 61 62 66 60 0 0 1 0931 UCP of PG & Montgomery Co 27 42 51 60 0 0 1 0101 Progressive Horizons 58 61 62 59 0 1 0 0815 Jeanne Bussard Center 62 65 57 59 1 0 0 0052 League for People with Disabilities 23 34 42 59 0 0 1 0065 Fidelity Resources, Inc -- 20 43 58 0 0 1 0165 Mid Atlantic Human Services Corp 24 48 56 55 0 1 0 0809 Ray of Hope Inc 54 56 52 55 0 0 1 0134 St. Peters Adult Learning 40 45 49 54 0 0 1 0351 Calmra Inc 49 53 53 53 0 0 0 1338 Charles Co Health Dept 43 57 54 52 0 0 0 1601 Kent Center Inc 47 50 53 52 1 0 0 0333 Head Injury Rehabilitation 38 48 51 51 0 0 0 1836 Star Communities 25 36 43 51 1 0 0 0
Strata 3 Subtotal (51-146 People) 4,098 4,331 4,869 4,863 14 12 15 11151 Shura 42 46 49 47 0 1 0 0123 National MS 48 64 55 47 0 0 0 1607 Epilepsy Assoc of Eastern Shore 62 57 49 46 0 0 1 0088 Maryland Community Connections -- -- 34 44 -- -- 0 1154 Kennedy Kreiger Inst 12 34 30 43 0 0 1 0323 Full Citizenship of Maryland 34 39 38 40 0 0 1 0305 Charles Co HARC 35 37 37 38 0 0 1 0321 Maryland Neighborly Networks 26 36 36 38 0 0 0 1818 Lycher Inc 44 43 36 36 0 1 0 0147 Starflight 27 34 35 36 0 1 0 0166 REM Inc 13 25 30 36 0 1 0 0

Table A2. Community Providers by Size and Year Selected for Interviews
Ask Me Provider IDNumber of People Year in Sample
FY06 FY07 FY08 FY09 FY06 FY07 FY08 FY09
Ask Me!sm Project FY2009 -- The Arc of Maryland December 2009 Page 51
327 Montgomery Co Dept of Fam Resources 46 35 37 35 1 0 0 0828 Flying Colors of Success 33 32 32 32 0 0 0 1808 Goodwill Industries Monocacy Valley 21 19 26 31 0 1 0 0064 Living Sans Frontieres, Inc -- 20 28 30 -- 1 0 0910 Linwood Children�’s Center 19 25 26 27 0 1 0 0070 Quantum Leap -- 6 20 26 -- 0 1 0952 Deaf Independent Living Association 23 23 23 25 1 0 0 0053 Innovative Services, Inc 6 18 22 25 0 1 0 0803 Council for EC&A 26 28 23 23 0 1 0 0074 Way Station -- 13 20 23 -- 0 0 1354 Ebed Enterprises 12 18 22 22 0 0 0 1330 VOCA Corporation 19 19 19 21 0 0 0 1141 Caring Hands Inc 17 20 19 19 0 1 0 0089 Work Opportunities Unlimited -- -- -- 15 -- -- -- 1069 Dominion Resource Center Inc -- 7 8 12 -- 0 0 1825 Carroll Co Bureau of Aging 8 10 12 11 0 0 1 0066 Erosun, Inc -- 9 12 11 -- 0 0 1071 ACE Helping Hands Inc -- 6 10 11 -- 0 0 1073 Dreamcatchers Community Improve -- 6 10 11 -- 0 1 0163 PACT: Helping Children 13 9 10 10 1 0 0 0050 Lifeline LLC 2 5 5 10 0 0 0 1
Strata 4 Subtotal (10-50 People) 907 1,086 944 881 6 10 10 12082 Helena�’s House -- 2 6 9 -- 0 0 0068 Comprehensive Residential Systems -- 5 5 9 -- 0 0 0081 Living Hope -- 1 5 9 -- 0 0 0090 Northstar Special Services -- -- -- 7 -- -- -- 0313 National Children�’s Center 10 7 6 6 0 0 0 0623 Shorehaven 4 5 6 6 0 0 0 0054 Calvert Co Office on Aging 3 6 6 6 0 0 0 0059 S & G Residential Services, Inc 2 4 5 6 0 0 0 0085 Freedom to Choose -- -- 2 6 -- -- 0 0051 Mary T Maryland 3 3 5 5 0 0 0 0078 Shared Support -- 1 5 5 -- 0 0 0814 Archway Station 1 2 2 5 0 0 0 0084 Bee Homes Inc -- -- 2 5 -- -- 0 0157 Maxim Health Care Services 2 1 3 4 0 0 0 0162 National Mentor Health Care 3 4 4 3 0 0 0 0072 Second Chance Services Unlimit -- 3 4 3 -- 0 0 0617 Crossroads Community 4 3 3 3 0 0 0 0079 Bethlehem House -- 2 3 3 -- 0 0 0076 Center for Community Integration -- 1 3 3 -- 0 0 0087 St Patrick Homes Inc -- -- 3 3 -- -- 0 0091 JAPEC Residential Programs -- -- -- 3 -- -- -- 0060 Hebron Assoc for Community Services 1 -- 2 2 0 0 0 0153 Netcon & Earthkins Inc (closed) 42 7 2 2 0 0 0 0146 Autum Homes (closed) 32 6 2 2 0 0 0 0

Table A2. Community Providers by Size and Year Selected for Interviews
Ask Me Provider IDNumber of People Year in Sample
FY06 FY07 FY08 FY09 FY06 FY07 FY08 FY09
Page 52 December 2009 Ask Me!sm Project FY2009 -- The Arc of Maryland
100 Service Coordination -- -- -- 2 -- -- -- 0167 Center for Neuro Rehabilitation 1 1 1 1 0 0 0 0834 Hope Homes of MD 1 1 1 1 0 0 0 0061 Joshua House 1 1 1 1 0 0 0 0075 NIAS House -- 1 1 1 -- 0 0 0077 Home Sweet Home -- 1 2 1 -- 0 0 0080 Missy�’s Choice -- 1 1 1 -- 0 0 0083 Tracy�’s Life -- 1 1 1 -- 0 0 0086 DESCO Charities -- -- 2 1 -- -- 0 0092 Social Health Services Group -- -- -- 1 -- -- -- 0145 Selfpride (closed) 26 27 22 -- 0 0 0 --813 Bethesda Lutheran Homes 8 -- -- -- 0 0 -- --168 Evershine Residential Services 5 -- -- -- 0 -- -- --058 Service Source 5 2 -- -- 0 0 -- --170 Cope Homes Inc 4 -- -- -- 0 -- -- --831 Multiple Sclerosis Society 4 -- -- -- 0 -- -- --063 Esro Holding Provider 3 -- -- -- 0 -- -- --337 Calvert Co Health Dept 1 1 -- -- 0 0 -- --950 Chesapeake Head Injury Center 1 -- -- -- 0 -- -- --062 Matts Way 1 -- -- -- 0 -- -- --
Strata 5 Subtotal 74 121 107i 126 0 0 0 0TOTAL Adult Community Provider Pairs 14,991 15,025 15,700 16,327
41 44 46 45TOTAL Adults Support in the Community 12,067 12,112 12,615 13,148001 Rosewood Center . 329 245005 Holly Center . 135 134003 Potomac Center . 50 44004 Brandenburg Center . 23 20
Strata 6 Institutions . 537 443100 Service Coordination 4,596 6,394327 Montgomery Co Dept Family Resources 443 440340 Prince George�’s Co Dept Family Services 344 337338 Charles Co Health Dept 207 263339 St. Mary�’s Co Health Dept . 118 112337 Calvert Co Health Dept 80 80
Strata 7 Service Coordination 5,788 7,627TOTAL Person Provider Pairs 25,201 25,343 25,715 27,860TOTAL People Supported by DDA 13,665 13,863 14,329 15,678* Special agency sample, not part of the Maryland sample
Person Sample and Response
SPSS software was used to randomly select 40 individuals for a primary sample, and 10additional individuals for a secondary sample, for each selected provider in strata 1-3. All of theindividuals supported by stratum 4 providers were selected. The first 40 randomly selected

Ask Me!sm Project FY2009 -- The Arc of Maryland December 2009 Page 53
individuals were placed in the primary sample and any remaining placed in the secondarysample to be used if fewer than 28 individuals at an agency responded. The numbers ofindividuals selected in FY2009, and their final status, are shown in Table A3. Individualsselected for interviews at two different agencies were interviewed only once, but their responseswere included for both agencies. Some individuals were included in the sample frame andselected for interviews, but were subsequently dropped from the sample. They were droppedbecause they were in the secondary sample that was not needed by the field staff because 28people had already responded from among the 40 primary sample persons, the person was nolonger alive or living in Maryland (the DDA files may not have been up to date or the persondied or moved between the date of selection and when the interview could be scheduled), theindividual was hired as an Ask Me! interviewer after the sample had been identified, or the DDAfile had an erroneous or missing date of birth and the individual was less than 18 years of age. The categories of response and non-response are discussed in the main text of the report.
Table A3. Final Field Status: FY2009
Final Field Status of Case FrequencySampledTwice
PercentSample Respondents
Response
1 Completed Self 883 24 48.5% 76.1%2 Completed 2 Proxies 176 6 9.7% 15.2%3 Completed 1 of 2 Proxies 101 3 5.5% 8.7%Total Response 1,160 33 63.7% 100.0%
Non-response
12 Guardian Refused 43 1 2.4%13 Person Refused 188 5 10.3%6 Unknown if still DDA 93 2 5.1%17 Contact information unavailable 104 6 5.7%15 No Contact 6 Tries 86 4 4.7%16 Cannot Schedule 84 1 4.6%19 Language, Health 30 0 1.6%20 Other Non-response 33 0 1.8%Total Non-response 661 19 36.3%
Total Sample 1,821 52 100.0%
Not inSample
5 Died, Moved, Not DDA 11 08 Less than 18 years 1 09 Ask Me Interviewer 0 010 Secondary Sample Not Needed 110 3Total Not in Sample 122 3
Total 1,943 55
Weights
Each person record received a weight that took into account the probability that the individualcould be selected through multiple agencies, the probability that their agency was selected forinclusion in the year, the probability of the person�’s selection within the agency, and the

Page 54 December 2009 Ask Me!sm Project FY2009 -- The Arc of Maryland
probability of others in the agency not responding to the survey. Weights for individuals rangedfrom 1-33, with an average of 10.9. Agencies not part of the probability sample, but whorequested and self-funded interviews for their planning purposes, had zero weights assigned totheir respondents so they did not affect the statewide estimates.
When people are selected for interviews at two provider agencies, their survey responses wereduplicated and included with both provider agencies prior to weighting. The person was countedas responding for both provider agencies in the calculation of provider-specific responseadjustments. The adjustment was made during the weighting process. People who changedproviders during the year were considered a respondent for the provider through which they wereoriginally selected. Additional people, discovered at small provider agencies in stratum four,had interviews attempted and were assigned the same probability of selection as all the otherpeople selected from that provider and added to the count of the number of people supported bythat provider.
Weights were used for all analysis included in this report. The calculation of the populationweight for an individual respondent is shown in equation (1) and the statistical weight for anindividual is shown in equation (2). The properties of these weights are shown in Table A4:
(1) wtpopulation = wtstrata * wtprovider * wtnonresponse * wtperson * wtpopadjust;(2) wtstatistical = wtpopulation * wtstatadjust;
wtpopulation = final weight for the person to produce population estimates, rounded to aninteger;
wtstrata = number of provider agencies in the stratum / number of selected provider agenciesin the stratum;
wtprovider = number of people supported by the provider / number of people in the providerselected for interviews;
wtnonresponse = number of people eligible for interviews at the provider / number of peopleinterviewed at the provider;
wtperson = 1 / number of agencies providing community support to the person;wtpopadjust = total number of people with DDA support in the community / sum of
wtpopulation prior to adjustment;wtstatadjust = number of people with data records / sum of wtpopulation.

Ask Me!sm Project FY2009 -- The Arc of Maryland December 2009 Page 55
Table A4. Weight Characteristics
YearType of Weight True
NumberSum ofWeights
MinimumWeight
MaximumWeight
AverageWeight
FY2006 Population Weight 12,067 12,559 2.00 32.00 9.60Statistical Weight 1,253 1,252 0.25 3.30 1.00
FY2007 Population Weight 12,112 12,116 1.00 38.00 9.96Statistical Weight 1,217 1,217 0.11 3.78 1.00
FY2008 Population Weight 12,615 12,559 1.00 32.00 9.72Statistical Weight 1,292 1,292 0.15 3.27 1.00
FY2009 Population Weight 13,148 13,002 1.00 33.00 11.24Statistical Weight 1,157 1,292 0.12 3.28 1.12
Personal Characteristics
One of the DDA files used to draw the sample includes sex, birth date, and 21 disabilityclassifications for each person supported. The analysis used the birth date to calculate a person�’sage as of July 1 at the beginning of the fiscal year, and grouped ages into six categories: (1) 18-24, (2) 25-34, (3) 35-44, (4) 45-54, (5) 55-64, and (6) 65 and older. Person-level analysis usedthe DDA classifications as dichotomous variables, except for intellectual ability. Since the DDAonly has a classification of �‘mental retardation�’ with no gradation, Ask Me! requested agencystaff to provide a level of retardation on the Transportation Form as a measure of intellectualability: (1) profound retardation, (2) severe retardation, (3) moderate retardation, (4) mildretardation, (5) borderline retardation, and (6) no retardation. Since some agencies did notprovide this additional information on anyone, the agency level analysis used the percent withthe DDA classification of �‘mental retardation.�’ The percentages with the DDA classification ofother disabilities were also used. The DDA assigns each agency to one or its four regions, evenif the agency provides services in more than one region. This analysis uses the FY2009 DDAassignment for the agency and for all the people selected through the agency. The DDA centralregion includes the Baltimore metropolitan area. The DDA southern region includesMontgomery and Prince George�’s counties along with the other southern Maryland counties. The western region includes Frederic, Washington and all the counties further west. The easternregion includes Cecil along with the Eastern Shore counties.
DDA Authorized Services
The second DDA file used to draw the sample includes a record for each service authorized foran agency to provide to an individual as of July 1 at the beginning of the fiscal year. This filemay not precisely reflect the supports people received at the time of their interviews, sinceservices and agencies may have changed since July 1, or the last time the DDA files wereupdated was prior to July 1. However, this analysis classified people as receiving or notreceiving six types of services based on records in this file: residential services, communitysupported living arrangements, day habilitation, supported employment, individual supportservices, and service coordination. The services were not necessarily provided by the agencythrough which they were selected for the person-level analysis. For agency-level analysis, only

Page 56 December 2009 Ask Me!sm Project FY2009 -- The Arc of Maryland
the services provided by the agency are included. The percent receiving a type of service foragency-level analysis reflects the percent of people with Ask Me! data that received the service,and this may differ slightly from the percent of all people supported by the agency who receivedthe service. This report does not include analysis of the less frequent services of behavioralsupport, family support services, and adult foster care.
Transportation
The scale of perceived transportation availability was constructed from five questions in thesurvey and can range from 0 to 10, similar to the eight quality of life scales. Staff providedobjective measures of trips on a Transportation Form sent to, and returned by, the agency. Staffrecorded the number of round trips per week for an interviewed person: 1) to employment or dayactivities by the provider through which the person was selected for interview, 2) to otheractivities by the provider through which the person was selected, 3) from other provideragencies, 4) from family, friends, or the person driving their own car, and 5) from public sources(bus, train, taxi, and paratransit). The project keyed the high end of any recorded range androunded up any recorded decimal. Therefore, a �“1" could represent �“occasionally�” as well as �“1time per week.�” Transportation was considered zero (0) if staff either recorded a zero orrecorded nothing. Staff most frequently recorded 0 or 5, so the frequencies were recoded intoand ordinal scale of none (0), 1-4 times per week (1), and 5 or more times per week (2) for mostanalysis.
Quality of Life Scales
The Ask Me! Survey contained six indicator questions for each of the eight quality of lifedomains, and five questions for the area of transportation availability. Respondents could giveone of three answers to each question. The first listed answer was favorable (�“yes,�” �“a lot,�”�“very happy,�” �“most times,�” etc.), and was keyed as 1. The second listed answer was neutral(�“sometimes,�” �“a little,�” �“OK,�” etc.), and was keyed as 2. The third listed answer wasunfavorable (�‘no,�” �“none,�” �“not happy,�” �“no times,�” etc.), and was keyed as 3. When a personanswered four or more questions for aquality of life domain, a scale scorewas calculated as 15 - (5 * averagekeyed value). Thus the scale scorewould be 0 if the person gaveunfavorable responses (3) to all thequestions in the scale, 10 if the persongave favorable responses (1) to allquestions, and 5 if the person gaveneutral responses (2) to all questions,or an equal number of favorable andunfavorable responses.
Scale reliability is generallyrepresented by Cronbach�’s alpha that
QOL Domain FY06 FY07 FY08 FY09Rights .64 .66 .57 .64Self-Determination .65 .71 .69 .66Personal Development .63 .65 .65 .64Social Inclusion .66 .66 .63 .64Interpersonal Relations .59 .62 .60 .61Material Well-being .58 .55 .61 .55Emotional Well-being .65 .65 .65 .64Physical Well-being .57 .67 .61 .54
Other ScaleTransportation Availability .62 .61 .59 .55
Figure A25. Cronbach�’s Alphas for Scale Reliability

Ask Me!sm Project FY2009 -- The Arc of Maryland December 2009 Page 57
measures how similar all the questions are that contribute to a summary scale. The higher thealpha, the better the scale. Alphas of 0.70 or higher are generally interpreted as showing goodreliability During FY2006-FY2009, the Cronbach�’s alphas for the eight quality of life domainsranged from 0.55 to 0.71, fairly good although slightly lower than ideal. (See Figure A25.)
Statistical Significance
Statistical significance for person-level analysis for this report was set at p .01, meaning lessthan one time in a hundred would a finding this large be observed just by chance. This level wasselected to differentiate very strong relationships from weak relationships that might appear to bestatistically significant only due to the large number of observations. For instance, the trends indomain scores are based on data for 9,028-10,124 individuals over the eight years, depending onthe domain. For agency-level analysis based on 119 or fewer agencies, the more traditionalp .05 level is used. Relationships that are not statistically significant at the designated level areeither shown without any symbol, or not show at all. Relationships that meet the designatedlevel of significance are identified with a caret (^), except when they are significant at thep .001 level and are identified with an asterisk (*).
Regression
Simple linear regression on years since FY2006 was used to determine how much the responsesto individual questions, and the average domain scores, had changed between FY2006-FY2009. The average annual changes for individual questions are shown in Table 1. The average annualchanges in the domain scores were used to adjust the average quality of life scores for agenciesto the midpoint of the four-year cycle. They are discussed in the next section, and the regressioncoefficients are shown in Table B1.
Forward stepwise multiple regression, with p=.05 for entry and p=.10 for deletion, was used tomeasure change in the quality of life scores between FY2002 and FY2009, and whether thechange was linear or curvilinear. The equation took the following form:
QOL = a + b1*year + b2*year2 + b3year3 where �‘a�’ is the baseline score for FY2002, �‘year�’ is the number of years since FY2002, �‘b1' isthe average annual change in the score, �‘b2' is the quadratic increase or decrease in the averageannual change, and �‘b3' is the cubic increase or decrease in the average annual change. When b3was statistically significant, a cubic curve with two inflection points was fitted to the data. When b3 was not, but b2 was statistically significant, a quadratic curve was fitted to the data. Ifonly b1 was statistically significant, a straight line was fitted to the data. (See Table B1.)
Forward stepwise multiple regression was also used to measure which characteristics ofindividuals and their services had associations with the average quality of life scores during theFY2006-FY2009 cycle independent of other characteristics. Missing data were excluded pair-wise, p=.01 was used for entry, and p=.02 was used for deletion. Only characteristics that hadbivariate correlations at p=.01 with the quality of life score were included in the regression.

Page 58 December 2009 Ask Me!sm Project FY2009 -- The Arc of Maryland
Quality of Life Score Adjustment
Appendix C shows the average quality of life for each fiscal year that an agency was selected forinterviews during the second cycle of Ask Me! (FY2006 to FY2009). The reported quality oflife has generally increased in Maryland during the cycle, so comparisons of agenciesinterviewed in different years would favor agencies interviewed at the end of the cycle overagencies interviewed at the beginning of the cycle. Therefore, Appendix C also shows theregression adjusted score for each domain as of the midpoint of the cycle, and based on thisadjusted score, whether the agency is among the top 20% of agencies, the middle 70%, or thebottom 10% of agencies on that domain. To allow meaningful comparisons, FY2006-FY2009domain scores were averaged adjusted by linear regression coefficients to the midpoint of thecycle.

Ask Me!sm Project FY2009 -- The Arc of Maryland December 2009 Page 59
Appendix B. Detailed Tables
Table B1. Annual Trend in Quality of Life over Foura and Eightb Years
2002-05 2006-09 2002-09
A B1 A B1 A B1 B2 B3
Percent Positive Quality of Life (proportion)
Physical Well-being .915 .011* .946 .001 .925 .004* - -
Emotional Well-being .913 .007 .936 .003 .918 .004* - -
Material Well-being .791 .021* .840 -.002 .832 - - -
Interpersonal Relations .835 .019* .885 .004 .836 .022* -.002^ -
Social Inclusion .801 .021* .845 .005 .821 .006* - -
Personal Development .800 .017* .836 .001 .833 - - -
Self-Determination .715 .026* .772 .009 .737 .010* - -
Rights .639 .010 .721 .007 .633 .017* -
Average Quality of Life (0-10)
Physical Well-being 8.383 .138* 8.677 .003 8.318 .331* -.082* .006^
Emotional Well-being 8.224 .116* 8.462 .036 8.152 .323* -.088* .007*
Material Well-being 7.175 .128* 7.406 -.011 7.391 - - -
Interpersonal Relations 7.361 .140* 7.661 .056 7.250 .431* -.120* .010*
Social Inclusion 7.148 .138* 7.409 .061 7.266 .049* - -
Personal Development 7.209 .097* 7.447 .033 7.289 .041* - -
Self-Determination 6.780 .136* 7.172 .045 6.880 .068* - -
Rights 6.241 .063 6.724 .043 6.209 .100* - -
^ p .01 * p .001a Year forced entry b Year, year2 and year3 entered stepwiseA = score at the start of the periodB1 = annual linear increase during the periodB2 = change in annual linear increase (quartic)B3 = change in annual linear increase (cubic)

Page 60 December 2009 Ask Me!sm Project FY2009 -- The Arc of Maryland
Table B2. Person-Level Correlation Coefficients Between Quality of Life Domains and Personand Service Characteristics: FY2006-FY2009
PhysicalWell-being
EmotionWell-being
MaterialWell-being
Inter-personalRelations
Socialinclusion
PersonalDevelop-
ment
Self-Determin
ation RightsEmotion Well-being Correlation 0.456
Sig. (2-tail) 0.000N 4599
Material Well-being Correlation 0.473 0.384Sig. (2-tail) 0.000 0.000N 4332 4334
InterpersonalRelations
Correlation 0.454 0.479 0.431Sig. (2-tail) 0.000 0.000 0.000N 4577 4749 4322
Social Inclusion Correlation 0.354 0.469 0.393 0.596Sig. (2-tail) 0.000 0.000 0.000 0.000N 4538 4759 4301 4683
PersonalDevelopment
Correlation 0.376 0.386 0.432 0.570 0.538Sig. (2-tail) 0.000 0.000 0.000 0.000 0.000N 4540 4655 4306 4648 4591
Self-Determination Correlation 0.287 0.318 0.405 0.439 0.445 0.545Sig. (2-tail) 0.000 0.000 0.000 0.000 0.000 0.000N 4548 4608 4318 4595 4563 4561
Rights Correlation 0.228 0.217 0.371 0.361 0.367 0.455 0.597Sig. (2-tail) 0.000 0.000 0.000 0.000 0.000 0.000 0.000N 4438 4443 4273 4436 4405 4405 4434
TransportationAvailability
Correlation 0.405 0.324 0.395 0.289 0.203 0.228 0.192 0.153Sig. (2-tail) 0.000 0.000 0.000 0.000 0.000 0.000 0.000 0.000N 4401 4404 4227 4396 4358 4369 4379 4358
Self response Correlation -0.214 -0.125 0.040 0.008 0.103 0.179 0.368 0.383Sig. (2-tail) 0.000 0.000 0.009 0.572 0.000 0.000 0.000 0.000N 4609 5027 4337 4763 4766 4665 4618 4452
Agency size Correlation -0.067 -0.071 -0.084 -0.063 -0.064 -0.047 -0.072 -0.072Sig. (2-tail) 0.000 0.000 0.000 0.000 0.000 0.001 0.000 0.000N 4609 5027 4337 4763 4766 4665 4618 4452
Agency responserate
Correlation 0.060 0.031 0.052 0.025 0.051 0.012 -0.033 -0.063Sig. (2-tail) 0.000 0.056 0.003 0.139 0.002 0.476 0.053 0.000N 3418 3776 3185 3546 3553 3456 3415 3283
Intellectual ability Correlation -0.115 -0.080 0.051 0.031 0.024 0.150 0.299 0.326Sig. (2-tail) 0.000 0.000 0.002 0.054 0.134 0.000 0.000 0.000N 3799 4162 3581 3933 3929 3854 3810 3661
Age group Correlation 0.015 0.040 -0.011 -0.051 0.030 -0.054 -0.016 -0.031Sig. (2-tail) 0.316 0.004 0.468 0.000 0.037 0.000 0.280 0.037N 4556 4963 4287 4706 4708 4611 4565 4399
Male Correlation 0.034 0.046 0.036 -0.015 0.006 0.022 0.016 0.014Sig. (2-tail) 0.020 0.001 0.017 0.295 0.674 0.139 0.283 0.336N 4596 5008 4325 4749 4750 4652 4605 4439
Autism Correlation 0.077 0.041 0.041 0.011 0.003 0.038 0.003 0.004Sig. (2-tail) 0.000 0.003 0.008 0.453 0.839 0.010 0.823 0.793N 4586 4998 4316 4739 4740 4642 4595 4429
Behavior problems Correlation 0.018 -0.003 0.006 -0.006 -0.025 -0.010 -0.006 -0.036Sig. (2-tail) 0.213 0.855 0.690 0.670 0.090 0.502 0.692 0.016N 4586 4998 4316 4739 4740 4642 4595 4429

Table B2. Person-Level Correlation Coefficients Between Quality of Life Domains and Personand Service Characteristics: FY2006-FY2009
PhysicalWell-being
EmotionWell-being
MaterialWell-being
Inter-personalRelations
Socialinclusion
PersonalDevelop-
ment
Self-Determin
ation Rights
Ask Me!sm Project FY2009 -- The Arc of Maryland December 2009 Page 61
Blind, visionimpairment
Correlation 0.035 0.034 -0.001 -0.009 -0.015 -0.039 -0.057 -0.074Sig. (2-tail) 0.016 0.015 0.946 0.542 0.295 0.007 0.000 0.000N 4586 4998 4316 4739 4740 4642 4595 4429
Cerebral palsy Correlation 0.041 0.051 0.009 0.020 0.030 -0.020 -0.042 -0.074Sig. (2-tail) 0.006 0.000 0.549 0.175 0.041 0.180 0.005 0.000N 4586 4998 4316 4739 4740 4642 4595 4429
Deaf, hearingimpairment
Correlation -0.012 0.025 -0.007 -0.022 0.015 0.001 -0.053 -0.057Sig. (2-tail) 0.414 0.083 0.633 0.126 0.308 0.919 0.000 0.000N 4586 4998 4316 4739 4740 4642 4595 4429
Head injury Correlation -0.001 -0.022 -0.007 -0.045 -0.081 -0.033 0.031 0.060Sig. (2-tail) 0.942 0.126 0.630 0.002 0.000 0.026 0.038 0.000N 4586 4998 4316 4739 4740 4642 4595 4429
Mental disorder Correlation -0.042 -0.045 -0.044 -0.029 -0.037 0.020 0.027 -0.002Sig. (2-tail) 0.005 0.001 0.004 0.050 0.010 0.171 0.068 0.881N 4586 4998 4316 4739 4740 4642 4595 4429
Other neurologicalimpairments
Correlation -0.009 -0.027 -0.002 0.005 -0.053 -0.019 0.023 0.034Sig. (2-tail) 0.562 0.058 0.909 0.719 0.000 0.186 0.123 0.024N 4586 4998 4316 4739 4740 4642 4595 4429
Orthopedicimpairments
Correlation 0.030 0.022 0.014 0.007 -0.006 -0.019 -0.027 -0.027Sig. (2-tail) 0.044 0.125 0.367 0.644 0.674 0.201 0.069 0.069N 4586 4998 4316 4739 4740 4642 4595 4429
Epilepsy and seizuredisorders
Correlation 0.029 0.017 -0.007 0.013 0.002 -0.002 -0.053 -0.066Sig. (2-tail) 0.053 0.239 0.668 0.381 0.876 0.877 0.000 0.000N 4586 4998 4316 4739 4740 4642 4595 4429
Specific learningdisabilities
Correlation -0.056 -0.041 -0.019 -0.021 -0.065 0.012 0.055 0.051Sig. (2-tail) 0.000 0.004 0.210 0.145 0.000 0.426 0.000 0.001N 4586 4998 4316 4739 4740 4642 4595 4429
Speech and languageimpairments
Correlation 0.056 0.016 0.012 0.034 -0.011 -0.004 -0.001 -0.014Sig. (2-tail) 0.000 0.248 0.433 0.019 0.450 0.799 0.926 0.347N 4586 4998 4316 4739 4740 4642 4595 4429
Eastern DDA region Correlation -0.071 -0.018 -0.044 -0.016 0.002 0.016 -0.026 0.001Sig. (2-tail) 0.000 0.197 0.004 0.264 0.889 0.260 0.080 0.948N 4609 5027 4337 4763 4766 4665 4618 4452
Southern DDAregion
Correlation 0.087 0.036 0.099 0.047 0.026 0.036 0.047 0.077Sig. (2-tail) 0.000 0.011 0.000 0.001 0.072 0.014 0.002 0.000N 4609 5027 4337 4763 4766 4665 4618 4452
Western DDAregion
Correlation 0.083 0.093 0.079 0.084 0.074 0.026 0.094 0.049Sig. (2-tail) 0.000 0.000 0.000 0.000 0.000 0.071 0.000 0.001N 4609 5027 4337 4763 4766 4665 4618 4452
DDA residentialservices
Correlation 0.088 0.035 0.052 -0.003 0.054 -0.032 -0.133 -0.104Sig. (2-tail) 0.000 0.012 0.001 0.833 0.000 0.027 0.000 0.000N 4599 5017 4328 4753 4756 4655 4608 4442
DDA CSLA Correlation -0.031 -0.009 -0.047 -0.000 -0.005 -0.014 0.028 0.039Sig. (2-tail) 0.036 0.505 0.002 0.992 0.736 0.344 0.055 0.009N 4599 5017 4328 4753 4756 4655 4608 4442
DDA supportedemployment
Correlation -0.021 -0.017 0.098 0.074 0.049 0.127 0.170 0.193Sig. (2-tail) 0.152 0.238 0.000 0.000 0.001 0.000 0.000 0.000N 4599 5017 4328 4753 4756 4655 4608 4442

Table B2. Person-Level Correlation Coefficients Between Quality of Life Domains and Personand Service Characteristics: FY2006-FY2009
PhysicalWell-being
EmotionWell-being
MaterialWell-being
Inter-personalRelations
Socialinclusion
PersonalDevelop-
ment
Self-Determin
ation Rights
Page 62 December 2009 Ask Me!sm Project FY2009 -- The Arc of Maryland
DDA dayhabilitation
Correlation 0.023 0.025 -0.027 -0.016 0.034 -0.042 -0.144 -0.173Sig. (2-tail) 0.115 0.080 0.073 0.259 0.017 0.004 0.000 0.000N 4599 5017 4328 4753 4756 4655 4608 4442
DDA individualsupport services
Correlation -0.034 -0.016 -0.051 -0.020 -0.049 -0.009 0.076 0.061Sig. (2-tail) 0.022 0.244 0.001 0.172 0.001 0.524 0.000 0.000N 4599 5017 4328 4753 4756 4655 4608 4442
DDA resourcecoordination
Correlation 0.037 0.020 0.000 -0.022 0.023 -0.064 -0.076 -0.086Sig. (2-tail) 0.013 0.167 0.999 0.134 0.114 0.000 0.000 0.000N 4599 5017 4328 4753 4756 4655 4608 4442
Number of agenciesproviding services
Correlation 0.024 0.024 0.010 0.022 0.021 0.014 -0.039 -0.044Sig. (2-tail) 0.102 0.091 0.492 0.133 0.148 0.344 0.009 0.003N 4599 5017 4328 4753 4756 4655 4608 4442
Transportation today activity
Correlation 0.062 0.034 0.058 0.028 0.066 0.039 -0.031 -0.064Sig. (2-tail) 0.000 0.023 0.000 0.062 0.000 0.011 0.043 0.000N 4164 4543 3922 4306 4301 4215 4175 4021
Transportation toother activities
Correlation 0.055 0.031 0.045 0.021 0.045 0.009 -0.038 -0.046Sig. (2-tail) 0.000 0.036 0.005 0.168 0.003 0.555 0.014 0.004N 4163 4542 3921 4305 4300 4213 4174 4020
Transportation fromother providers
Correlation 0.002 -0.030 -0.027 -0.033 -0.035 -0.035 -0.078 -0.055Sig. (2-tail) 0.899 0.043 0.091 0.031 0.020 0.025 0.000 0.000N 4164 4543 3922 4306 4301 4215 4175 4021
Familytransportation
Correlation 0.015 -0.002 0.042 0.043 0.005 0.056 0.096 0.111Sig. (2-tail) 0.333 0.898 0.009 0.005 0.761 0.000 0.000 0.000N 4164 4543 3922 4306 4301 4215 4175 4021
Public transportation Correlation -0.063 -0.056 -0.004 -0.039 -0.051 -0.020 0.061 0.091Sig. (2-tail) 0.000 0.000 0.799 0.010 0.001 0.194 0.000 0.000N 4164 4543 3922 4306 4301 4215 4175 4021

Ask Me!sm Project FY2009 -- The Arc of Maryland December 2009 Page 63
Table B3. Standardized Multiple Regression* Coefficients ( ) of Quality of Life Domains on Person and Support Characteristics
Person and SupportCharacteristics
Physical Well-being Emotional Well-being Material Well-being Interpersonal Relations
Self Proxy Total Self Proxy Total Self Proxy Total Self Proxy TotalTransportation availability .36 .30 .36 .30 .24 .32 .42 .27 .42 .31 .23 .29Self reporting -.11 -.20 ... -.12 .15 ... ... ...Intellectual ability .11 .06 .10 .09 .06Western DDA region .06 .11 .04 .10 .06 .08 .05 .08 .07 .13 .07 .12 .08 .13 .06 .11Southern DDA region .07 .13 .06 .11 .07 .12 .08 .12 .07 .09 .15 .07Age .05 -.05Male .04Autism .06 .05Cerebral palsy .05Head injury -.12 -.10 -.06 -.06Specific learning disabilityNumber of support agencies .05 .05Agency size -.06 -.06 -.11 -.10 .10Supported employment .06 .09 .15 .16 .07 .10 .07 .10 .07 .09Day habilitationResidential support .11 .14 .13 .08 -.09Supported living (CSLA) -.05 -.05Individual support services -.06Resource coordination -.09 -.11Trips by other provider agencies -.09 -.10Provider trips to day activity .04 .06 .07Provider trips to other activity .05 .07Trips by family and friendsPublic transportation trips -.05 -.05 -.05 -.12 -.12 -.05 -.06
R2 .15 .03 .09 .01 .18 .01 .10 .02 .06 ... .11 .03 .21 .03 .15 .08 .20 .04 .12 .03 .11 .06 .10 .02* Stepwise regression with p=.01 to enter and p=.02 to delete; variables tested with partial correlations of p=.01.

Page 64 December 2009 Ask Me!sm Project FY2009 -- The Arc of Maryland
Table B3. Standardized Multiple Regression* Coefficients ( ) of Quality of Life Domains on Person and Support Characteristics
Person and SupportCharacteristics
Personal Development Social Inclusion Self-Determination Rights
Self Proxy Total Self Proxy Total Self Proxy Total Self Proxy TotalTransportation availability .31 .22 .30 .25 .22 .24 .32 .29 .29 .29 .21 .25Self reporting .21 .13 .20 .14 .37 .29 .36 .29Intellectual ability .22 .21 .08 .08 -.06 .21 .19 .11 .12 .27 .25 .14 .14Western DDA region .06 .06 .09 .07 .05 .07 .06 .11 .24 .29 .10 .15 .08 .17 .21 .07 .10Southern DDA region .06 .11 .14 .04 .08 .08 .11 .13 .07 .09Age -.09 -.04 -.06MaleAutism .05Cerebral palsyHead injury -.06 -.05 -.10 -.09 -.09 -.08Specific learning disabilities -.07 -.07 -.05 -.06Number of support agenciesAgency size -.11 -.16 -.06 -.11 -.15 -.06 -.04Supported Employment .12 .08 .20 .20 .12 .13 .06 .15 .15 .06 .08 .21 .22 .07 .08Day habilitation .09 .15 .16 .10 .09 -.08 -.08 -.09Residential support .06 .08 .06 .05 .06 -.06Supported living (CSLA) -.10 -.12Individual support services -.11 -.12Resource coordination -.09Trips by other provider agencies -.04Provider trips to day activity .05 .06 .10 .10 .06 .06Provider trips to other activity .07Trips by family and friends .06 .05Public transportation trips
R2 .11 .02 .18 .13 .14 .06 .09 .03 .08 .03 .09 .04 .12 .02 .22 .14 .25 .17 .10 .02 .21 .17 .25 .19* Stepwise regression with p=.01 to enter and p=.02 to delete; variables tested with partial correlations of p=.01.

Ask Me!sm Project FY2009 -- The Arc of Maryland December 2009 Page 65
Table B4. Correlation Coefficients of Agency Quality of Life with Agency Characteristics andPrevious Quality of Life
PhysicalWell-being
EmotionWell-being
MaterialWell-being
Inter-personalRelations
PersonalDevelop-ment
SocialInclusion
Self-Determination Rights
Emotional Well-being
Correlation 0.740Sig. (2-tail) 0.000N 119
Material Well-being Correlation 0.694 0.575Sig. (2-tail) 0.000 0.000N 119 119
InterpersonalRelations
Correlation 0.633 0.735 0.534Sig. (2-tail) 0.000 0.000 0.000N 119 119 119
PersonalDevelopment
Correlation 0.426 0.457 0.542 0.636Sig. (2-tail) 0.000 0.000 0.000 0.000N 119 119 119 119
Social Inclusion Correlation 0.571 0.706 0.591 0.772 0.618Sig. (2-tail) 0.000 0.000 0.000 0.000 0.000N 119 119 119 119 119
Self-Determination Correlation 0.342 0.434 0.461 0.560 0.665 0.483Sig. (2-tail) 0.000 0.000 0.000 0.000 0.000 0.000N 119 119 119 119 119 119
Rights Correlation 0.16 0.21 0.36 0.42 0.56 0.27 0.80Sig. (2-tail) 0.07 0.02 0.00 0.00 0.00 0.00 0.00N 119 119 119 119 119 119 119
Physical Well-beingCycle 1
Correlation 0.515 0.501 0.441 0.377 0.179 0.290 0.139 0.062Sig. (2-tail) 0.000 0.000 0.000 0.000 0.064 0.002 0.152 0.524N 108 108 108 108 108 108 108 108
Emotional Well-being Cycle 1
Correlation 0.523 0.503 0.468 0.444 0.271 0.330 0.202 0.111Sig. (2-tail) 0.000 0.000 0.000 0.000 0.005 0.000 0.036 0.253N 108 108 108 108 108 108 108 108
Material Well-beingCycle 1
Correlation 0.413 0.357 0.530 0.385 0.391 0.404 0.176 0.195Sig. (2-tail) 0.000 0.000 0.000 0.000 0.000 0.000 0.068 0.043N 108 108 108 108 108 108 108 108
InterpersonalRelations Cycle 1
Correlation 0.311 0.350 0.411 0.535 0.337 0.436 0.285 0.299Sig. (2-tail) 0.001 0.000 0.000 0.000 0.000 0.000 0.003 0.002N 108 108 108 108 108 108 108 108
PersonalDevelopment Cycle1
Correlation 0.194 0.208 0.339 0.368 0.463 0.383 0.343 0.320Sig. (2-tail) 0.044 0.030 0.000 0.000 0.000 0.000 0.000 0.001N 108 108 108 108 108 108 108 108
Social InclusionCycle 1
Correlation 0.295 0.352 0.383 0.486 0.440 0.485 0.284 0.257Sig. (2-tail) 0.002 0.000 0.000 0.000 0.000 0.000 0.003 0.007N 108 108 108 108 108 108 108 108
Self-DeterminationCycle 1
Correlation -0.032 0.137 0.196 0.256 0.294 0.213 0.560 0.535Sig. (2-tail) 0.742 0.157 0.042 0.007 0.002 0.027 0.000 0.000N 108 108 108 108 108 108 108 108
Rights Cycle 1 Correlation -0.131 -0.043 0.110 0.173 0.261 0.073 0.500 0.595Sig. (2-tail) 0.177 0.656 0.258 0.073 0.006 0.451 0.000 0.000N 108 108 108 108 108 108 108 108
TransportationAvailability Cycle 2
Correlation 0.723 0.537 0.532 0.442 0.243 0.388 0.219 0.122Sig. (2-tail) 0.000 0.000 0.000 0.000 0.000 0.000 0.017 0.187N 119 119 119 119 119 119 119 119

Table B4. Correlation Coefficients of Agency Quality of Life with Agency Characteristics andPrevious Quality of Life
PhysicalWell-being
EmotionWell-being
MaterialWell-being
Inter-personalRelations
PersonalDevelop-ment
SocialInclusion
Self-Determination Rights
Page 66 December 2009 Ask Me!sm Project FY2009 -- The Arc of Maryland
% Responding forthemselves
Correlation -0.533 -0.369 -0.167 -0.135 0.140 -0.156 0.337 0.484Sig. (2-tail) 0.000 0.000 0.069 0.143 0.130 0.091 0.000 0.000N 119 119 119 119 119 119 119 119
Agency size Correlation -0.021 -0.005 0.019 0.031 0.035 0.020 0.058 0.069Sig. (2-tail) 0.818 0.953 0.836 0.736 0.704 0.828 0.529 0.458N 119 119 119 119 119 119 119 119
Agency responserate
Correlation 0.204 0.206 0.196 0.129 0.102 0.192 -0.059 -0.133Sig. (2-tail) 0.026 0.025 0.033 0.163 0.270 0.036 0.526 0.149N 119 119 119 119 119 119 119 119
Intellectual abilitygroup average
Correlation -0.277 -0.253 -0.028 -0.105 0.053 -0.132 0.338 0.427Sig. (2-tail) 0.003 0.007 0.772 0.269 0.580 0.165 0.000 0.000N 113 113 113 113 113 113 113 113
Age group average Correlation 0.216 0.326 0.094 0.107 0.023 0.145 0.010 -0.061Sig. (2-tail) 0.018 0.000 0.310 0.247 0.803 0.115 0.911 0.511N 119 119 119 119 119 119 119 119
% Male Correlation 0.238 0.030 0.219 0.156 0.167 0.142 0.067 0.106Sig. (2-tail) 0.009 0.746 0.017 0.089 0.070 0.123 0.469 0.250N 119 119 119 119 119 119 119 119
% Autism Correlation 0.281 0.110 0.163 0.179 0.189 0.034 0.116 0.111Sig. (2-tail) 0.002 0.235 0.076 0.051 0.040 0.715 0.208 0.231N 119 119 119 119 119 119 119 119
% Behaviorproblems
Correlation 0.168 -0.050 0.063 -0.052 0.140 -0.024 -0.010 -0.063Sig. (2-tail) 0.068 0.586 0.494 0.575 0.129 0.798 0.916 0.499N 119 119 119 119 119 119 119 119
% Blind, visionimpairment
Correlation 0.094 0.094 0.039 -0.051 -0.099 -0.014 -0.228 -0.315Sig. (2-tail) 0.308 0.308 0.674 0.582 0.284 0.878 0.013 0.000N 119 119 119 119 119 119 119 119
% Cerebral palsy Correlation 0.061 0.264 0.039 0.096 -0.250 0.164 -0.230 -0.275Sig. (2-tail) 0.508 0.004 0.674 0.298 0.006 0.074 0.012 0.002N 119 119 119 119 119 119 119 119
% Deaf, hearingimpairment
Correlation -0.015 -0.065 -0.101 -0.226 -0.043 -0.146 -0.044 -0.211Sig. (2-tail) 0.868 0.484 0.273 0.013 0.646 0.113 0.635 0.021N 119 119 119 119 119 119 119 119
% Head injury Correlation -0.135 -0.286 -0.092 -0.153 -0.125 -0.178 -0.035 0.154Sig. (2-tail) 0.142 0.002 0.319 0.096 0.175 0.053 0.709 0.095N 119 119 119 119 119 119 119 119
% Mental disorder Correlation -0.185 -0.313 -0.224 -0.076 0.097 -0.087 -0.101 0.033Sig. (2-tail) 0.044 0.001 0.014 0.413 0.292 0.348 0.275 0.719N 119 119 119 119 119 119 119 119
% Mentalretardation
Correlation 0.265 0.299 0.294 0.281 0.203 0.399 -0.103 -0.162Sig. (2-tail) 0.004 0.001 0.001 0.002 0.027 0.000 0.266 0.079N 119 119 119 119 119 119 119 119
% Otherneurologicalimpairments
Correlation -0.105 -0.167 -0.099 -0.058 -0.120 -0.083 -0.015 0.118Sig. (2-tail) 0.257 0.069 0.283 0.528 0.193 0.368 0.868 0.201N 119 119 119 119 119 119 119 119
% Orthopedicimpairments
Correlation 0.033 0.183 0.111 -0.034 -0.106 0.178 -0.093 -0.159Sig. (2-tail) 0.722 0.046 0.230 0.711 0.253 0.053 0.313 0.085N 119 119 119 119 119 119 119 119

Table B4. Correlation Coefficients of Agency Quality of Life with Agency Characteristics andPrevious Quality of Life
PhysicalWell-being
EmotionWell-being
MaterialWell-being
Inter-personalRelations
PersonalDevelop-ment
SocialInclusion
Self-Determination Rights
Ask Me!sm Project FY2009 -- The Arc of Maryland December 2009 Page 67
% Epilepsy andseizure disorders
Correlation 0.241 0.205 0.028 0.103 -0.014 0.185 -0.253 -0.336Sig. (2-tail) 0.008 0.025 0.761 0.265 0.882 0.044 0.005 0.000N 119 119 119 119 119 119 119 119
% Specific learningdisabilities
Correlation -0.249 -0.329 -0.082 -0.236 -0.005 -0.285 0.103 0.268Sig. (2-tail) 0.006 0.000 0.377 0.010 0.957 0.002 0.264 0.003N 119 119 119 119 119 119 119 119
% Speech andlanguageimpairments
Correlation 0.143 0.109 0.142 0.198 0.137 0.135 0.117 0.155Sig. (2-tail) 0.121 0.240 0.124 0.031 0.138 0.142 0.205 0.093N 119 119 119 119 119 119 119 119
Eastern DDA region Correlation -0.239 -0.044 -0.130 -0.051 0.080 0.037 -0.044 -0.018Sig. (2-tail) 0.009 0.632 0.158 0.584 0.390 0.687 0.638 0.849N 119 119 119 119 119 119 119 119
Southern DDAregion
Correlation 0.291 0.085 0.316 0.094 0.148 0.057 0.098 0.192Sig. (2-tail) 0.001 0.359 0.000 0.309 0.108 0.539 0.287 0.036N 119 119 119 119 119 119 119 119
Western DDAregion
Correlation 0.283 0.344 0.256 0.311 0.148 0.280 0.295 0.151Sig. (2-tail) 0.002 0.000 0.005 0.001 0.108 0.002 0.001 0.101N 119 119 119 119 119 119 119 119
% Residentialservices
Correlation 0.167 0.010 0.095 -0.123 -0.055 -0.073 -0.429 -0.408Sig. (2-tail) 0.070 0.914 0.307 0.184 0.553 0.428 0.000 0.000N 119 119 119 119 119 119 119 119
% CSLA services Correlation -0.063 -0.058 -0.047 0.016 0.021 -0.029 0.105 0.164Sig. (2-tail) 0.496 0.534 0.609 0.861 0.825 0.757 0.257 0.075N 119 119 119 119 119 119 119 119
% Supportedemploymentservices
Correlation 0.016 -0.006 0.159 0.171 0.267 0.060 0.339 0.392Sig. (2-tail) 0.862 0.952 0.084 0.064 0.003 0.518 0.000 0.000N 119 119 119 119 119 119 119 119
% Day habilitationservices
Correlation 0.011 0.115 0.131 0.162 0.162 0.242 0.101 0.020Sig. (2-tail) 0.902 0.213 0.157 0.079 0.079 0.008 0.274 0.826N 119 119 119 119 119 119 119 119
% Individualsupport services
Correlation -0.054 0.036 -0.185 -0.040 -0.157 -0.117 0.220 0.246Sig. (2-tail) 0.563 0.696 0.044 0.665 0.088 0.206 0.016 0.007N 119 119 119 119 119 119 119 119
% Only provider ofservices
Correlation -0.129 -0.020 -0.025 0.020 0.044 0.010 0.150 0.197Sig. (2-tail) 0.161 0.830 0.789 0.828 0.638 0.916 0.103 0.031N 119 119 119 119 119 119 119 119
% Providedtransportation 3+times a week
Correlation 0.101 0.147 0.178 0.073 0.056 0.243 0.156 0.081Sig. (2-tail) 0.280 0.114 0.055 0.433 0.547 0.008 0.092 0.385N 117 117 117 117 117 117 117 117
% Using publictransportation
Correlation -0.083 -0.214 -0.161 -0.078 -0.060 -0.201 0.108 0.245Sig. (2-tail) 0.371 0.021 0.084 0.404 0.523 0.030 0.248 0.008N 117 117 117 117 117 117 117 117

Page 68 December 2009 Ask Me!sm Project FY2009 -- The Arc of Maryland
Table B5. Regression of Agency Quality of Life on Person and Service Characteristics: FY2006-FY2009(significant coefficients at p .05)
CharacteristicPhysical
Well-beingEmotionalWell-being
MaterialWell-being
InterpersonalRelations
SocialInclusion
PersonalDevelopment
Self-Determination Rights
Cycle 1 QOL Score .18 .26 .36 .46 .34 .42 .32 .47Transportation availability .67 .61 .47 .38 .45 .36 .41 .27 .36 .29 .21 .20 .56 .51 a a% Self-respondent -.41 -.22 .22 .58 .38 .34 a .17Intellectual ability -.18 -.15 -.23 -.22 -.22 -.33 -.30 -.24 -.26 aAverage age group .15 .17 aWestern region .30 .25 .25 .43 .26 .19 .36 .16 aSouthern region .31 .29 .44 .19 a .22% Autism .18 .14 a% Cerebral palsy .19 .23 .22 -.22 -.23 -.21 -.15 -.14 -.17 -.18 a -.15% Hearing impairment -.24 a -.21% Head injury -.22 -.25 -.22 a% Mental disorder -.20 -.15 -.20 a% Specific learning disab. -.20 a% Supported employment .27 .26 .25 .30 a% Day habilitation .19 a% Residential services -.22 -.27 -.24 a -.19% Individual support -.27 -.19 .26 a% Transport 3+ per week .17 a
R2 .45 .57 .57 .34 .48 .51 .30 .36 .46 .14 .24 .41 .22 .30 .37 .18 .22 .29 .39 .51 .56 .45 a .56a Transportation Availability did not have a significant bivariate correlation and was not entered into the regression.

Ask Me!sm Project FY2009 -- The Arc of Maryland December 2009 Page 69
Appendix C. Quality of Life at Maryland Provider Agencies
General Information
The Ask Me! Survey collects information from people receiving support funded by the MarylandDevelopmental Disabilities Administration (DDA) to determine their satisfaction with the quality of theirlives. Quality of life is defined in eight domains:
Rights The expression of human rights (respect, dignity and equality) and theguarantee of legal rights (citizenship, access and due process);
Self-Determination The expression of autonomy and personal control, the pursuit of personal goalsand values, and the opportunity to make decisions;
Social Inclusion The integration into and participation in one�’s community, the expression ofvalued social roles, and the receipt of social support from community members;
Personal Development The level of education received, personal competence expressed, andperformance exhibited (includes creativity and personal expression);
Interpersonal Relations The experiencing of social interactions and relationships (with family, friends,peers) and receiving support (emotional, physical, financial, and feedback) fromfamily, friends, peers or providers;
Material Well-Being The presence of adequate financial status, employment (a job), and adequatehousing;
Emotional Well-Being The condition of being contented (satisfied, happy) having a positive self-concept, and being relatively free of stress;
Physical Well-Being The level of health experienced (physical functioning, disease symptoms, pain,fitness, energy, nutrition) and the receipt of health care.
People view quality of life differently, and the Ask Me! Survey allows people with developmentaldisabilities to define quality of life for themselves. Some general findings should be kept in mind whenlooking at average quality of life scores of individual providers:
�• Most people in Maryland with developmental disabilities report a good quality of life, particularlyin the domains of Physical and Emotional Well-being;
�• The eight quality of life domains are distinct and all are important, but different people may placedifferent importance on different domains when considering services;
�• The quality of life has generally increased in Maryland in most domains. Average scores arecomputed every four years and statistically adjusted to the midpoint of the cycle (see Bonham,Basehart and Marchand, 2005, for average scores for the first cycle);
�• The larger the provider, the more their scores contribute to the Maryland average, and therefore themore likely their scores will be similar to the Maryland average;
�• People receiving employment support report higher quality of life than people not receivingemployment support; therefore the quality of life would be expected to be higher at providers withhigh percentages of people receiving employment services.

Page 70 December 2009 Ask Me!sm Project FY2009 -- The Arc of Maryland
Definitions and Symbols
Scores can range from 0.0 (all negative) to 10.0 (all positive), with a 5.0 score indicating people gaveneutral, or as many favorable as unfavorable, answers to the indicator questions.
The average agency scores are shown for each fiscal year during which interviews were conducted, andthe numbers of people interviewed are shown in parentheses (). Surveys are conducted at large agenciesevery year, and middle sized agencies every other year, and at small agencies about once every fouryears. Year to year differences less than 1.00 may simply reflect sampling variability, but differencesmore than 1.50 are likely to reflect real change.
Agency scores relative to all other agencies can be compared only after a four-year cycle of interviewsare complete. Symbols are presented to show how an agency compared with other agencies based on theFY2006-2009 cycle. The scores were averaged, or adjusted to the midpoint of the cycle, before beingcompared as follows:
Average score in the top 20% of agencies, significantly higher than the Maryland average;Average score in the middle 70% of agencies, about the Maryland average;Average score in the bottom 10% of agencies, significantly lower than the Maryland average.
The following additional information is provided for the fiscal year of the last time surveyed:
Number of people supported: The number of people supported with DDA funds at the start of theFY2009;
Survey response rate: The percent of people with completed interviews (self or proxy)among those selected and eligible for the survey;
Self response rate: The percent of surveys completed by the selected people forthemselves;
Served by other agencies: The percent of people responding to the last time surveyed whoreceived support from at least one other agency;
Percent in residential services: The percent of people with surveys who received residential servicesfrom this agency;
Percent in CSLA: The percent of people with surveys supported by this agency incommunity supported living arrangements;
Percent in employment services: The percent of people with surveys supported by this agency withemployment services;
Percent in day habilitation: The percent of people with surveys supported by this agency with dayhabilitation services;
Percent with individual support: The percent of people with surveys supported by this agency withindividual support services.

Ask Me!sm Project FY2009 -- The Arc of Maryland December 2009 Page 71
State of Maryland Average
Inter-Physical Emotional Material Personal Personal Social Self-
Wellbeing Wellbeing Wellbeing Relations Development InclusionDetermination Rights
FY2009 (1,160) 8.68 8.58 7.37 7.85 7.58 7.57 7.34 6.88FY2008 (1,269) 8.69 8.53 7.41 7.74 7.47 7.60 7.22 6.78FY2007 (1,172) 8.70 8.48 7.35 7.70 7.45 7.40 7.19 6.75FY2006 (1,225) 8.66 8.48 7.42 7.68 7.48 7.43 7.20 6.74
FY06-09 adjust 8.68 8.52 7.39 7.74 7.50 7.50 7.24 6.79FY06-09 rank
Most recent survey year: FY2009 Respondents in residential services: 38%Weighted number of respondents: 13,148 Respondents in CSLA 12%Survey response rate: 65% Respondents in employment services: 32%Self-response rate: 81% Respondents in day habilitation services: 52%Served by multiple agencies: 23% Respondents with individual support: 12%

Page 72 December 2009 Ask Me!sm Project FY2009 -- The Arc of Maryland
Abilities Network
Inter-Physical Emotional Material Personal Personal Social Self-
Wellbeing Wellbeing Wellbeing Relations Development InclusionDetermination Rights
FY2009 (26) 8.68 8.45 7.53 7.64 7.70 7.01 8.39 7.95FY2008 (30) 8.53 8.56 7.55 7.93 7.59 7.44 8.13 7.85FY2007 (33) 7.98 8.41 6.57 7.50 7.85 7.10 7.92 6.97FY2006 (25) 8.47 7.97 6.93 7.76 7.51 7.42 7.52 7.46
FY06-09 adjust 8.38 8.36 7.10 7.70 7.68 7.24 7.98 7.52FY06-09 rank
Most recent survey year: FY2009 Respondents in residential services: 0%Number of people supported: 417 Respondents in CSLA 26%Survey response rate: 52% Respondents in employment services: 42%Self-response rate: 95% Respondents in day habilitation services: 0%Served by other agencies: 30% Respondents with individual support: 36%
ACCFX Gallagher
Inter-Physical Emotional Material Personal Personal Social Self-
Wellbeing Wellbeing Wellbeing Relations Development InclusionDetermination Rights
FY2009 (33) 8.44 8.64 7.40 7.90 7.05 7.82 6.37 5.74FY2007 (28) 9.16 8.24 7.40 8.32 7.71 7.75 7.08 6.50FY2006 (29) 8.13 8.06 6.77 7.05 6.63 6.95 6.12 5.53
FY06-09 adjust 8.57 8.32 7.18 7.77 7.14 7.52 6.53 5.93FY06-09 rank
Most recent survey year: FY2009 Respondents in residential services: 76%Number of people supported: 318 Respondents in CSLA 0%Survey response rate: 66% Respondents in employment services: 0%Self-response rate: 66% Respondents in day habilitation services: 62%Served by other agencies: 34% Respondents with individual support: 0%

Ask Me!sm Project FY2009 -- The Arc of Maryland December 2009 Page 73
Alliance
Inter-Physical Emotional Material Personal Personal Social Self-
Wellbeing Wellbeing Wellbeing Relations Development InclusionDetermination Rights
FY2008 (17) 8.82 8.45 6.65 7.96 7.18 7.13 8.08 7.57FY2006 (30) 8.36 8.61 7.37 7.92 7.82 7.01 8.11 7.13
FY06-09 adjust 8.49 8.58 7.17 7.99 7.67 7.11 8.16 7.31FY06-09 rank
Most recent survey year: FY2008 Respondents in residential services: 0%Number of people supported: 179 Respondents in CSLA 6%Survey response rate: 34% Respondents in employment services: 82%Self-response rate: 94% Respondents in day habilitation services: 24%Served by other agencies: 41% Respondents with individual support: 12%
Appalachian Crossroads
Inter-Physical Emotional Material Personal Personal Social Self-
Wellbeing Wellbeing Wellbeing Relations Development InclusionDetermination Rights
FY2009 (39) 9.27 9.39 8.34 8.62 8.62 8.56 8.60 6.97
FY06-09 adjust 9.26 9.34 8.35 8.53 8.56 8.45 8.50 6.88FY06-09 rank
Most recent survey year: FY2009 Respondents in residential services: 33%Number of people supported: 93 Respondents in CSLA 8%Survey response rate: 78% Respondents in employment services: 5%Self-response rate: 85% Respondents in day habilitation services: 72%Served by other agencies: 10% Respondents with individual support: 31%

Page 74 December 2009 Ask Me!sm Project FY2009 -- The Arc of Maryland
Arc of Baltimore
Inter-Physical Emotional Material Personal Personal Social Self-
Wellbeing Wellbeing Wellbeing Relations Development InclusionDetermination Rights
FY2009 (32) 8.14 8.28 6.71 7.44 6.95 7.54 6.66 6.78FY2008 (32) 8.32 8.08 6.70 7.34 7.76 6.66 6.16 6.29FY2007 (26) 7.82 8.06 6.02 7.20 7.31 7.28 6.44 5.90FY2006 (28) 8.61 8.13 6.83 7.36 7.28 6.78 6.71 5.90
FY06-09 adjust 8.23 8.14 6.58 7.34 7.31 7.06 6.50 6.22FY06-09 rank
Most recent survey year: FY2009 Respondents in residential services: 14%Number of people supported: 1,081 Respondents in CSLA 11%Survey response rate: 67% Respondents in employment services: 35%Self-response rate: 78% Respondents in day habilitation services: 54%Served by other agencies: 36% Respondents with individual support: 2%
Arc of Carroll County
Inter-Physical Emotional Material Personal Personal Social Self-
Wellbeing Wellbeing Wellbeing Relations Development InclusionDetermination Rights
FY2008 (38) 8.92 8.62 7.65 8.02 7.86 8.04 7.73 6.65FY2006 (45) 8.67 8.59 7.90 8.06 7.56 7.73 7.33 7.32
FY06-09 adjust 8.79 8.62 7.79 8.08 7.72 7.91 7.55 7.06FY06-09 rank
Most recent survey year: FY2008 Respondents in residential services: 11%Number of people supported: 171 Respondents in CSLA 8%Survey response rate: 76% Respondents in employment services: 8%Self-response rate: 76% Respondents in day habilitation services: 68%Served by other agencies: 37% Respondents with individual support: 24%

Ask Me!sm Project FY2009 -- The Arc of Maryland December 2009 Page 75
Arc of Central Chesapeake
Inter-Physical Emotional Material Personal Personal Social Self-
Wellbeing Wellbeing Wellbeing Relations Development InclusionDetermination Rights
FY2009 (22) 9.18 8.97 7.49 7.19 7.29 7.34 6.78 6.97FY2007 (24) 7.76 8.49 6.50 7.15 7.30 6.92 7.29 6.72FY2005 (27) 8.52 8.24 7.59 8.16 7.31 7.89 7.19 5.66
FY06-09 adjust 8.40 8.69 6.90 7.14 7.28 7.08 7.03 6.81FY06-09 rank
Most recent survey year: FY2009 Respondents in residential services: 48%Number of people supported: 241 Respondents in CSLA 36%Survey response rate: 51% Respondents in employment services: 6%Self-response rate: 76% Respondents in day habilitation services: 0%Served by other agencies: 60% Respondents with individual support: 10%
Arc of Frederick County
Inter-Physical Emotional Material Personal Personal Social Self-
Wellbeing Wellbeing Wellbeing Relations Development InclusionDetermination Rights
FY2006 (32) 8.07 8.54 6.79 7.57 7.27 7.08 7.05 7.33
FY06-09 adjust 8.08 8.58 6.78 7.66 7.32 7.18 7.15 7.43FY06-09 rank
Most recent survey year: FY2006 Respondents in residential services: 0%Number of people supported: 87 Respondents in CSLA 0%Survey response rate: 76% Respondents in employment services: 0%Self-response rate: 76% Respondents in day habilitation services: 0%Served by other agencies: 39% Respondents with individual support: 97%

Page 76 December 2009 Ask Me!sm Project FY2009 -- The Arc of Maryland
Arc of Howard County
Inter-Physical Emotional Material Personal Personal Social Self-
Wellbeing Wellbeing Wellbeing Relations Development InclusionDetermination Rights
FY2009 (29) 8.96 9.09 7.91 8.34 7.56 8.06 7.55 6.47FY2007 (34) 9.03 8.00 7.13 7.01 6.67 7.00 6.63 6.50
FY06-09 adjust 9.00 8.49 7.47 7.58 7.05 7.44 7.00 6.47FY06-09 rank
Most recent survey year: FY2009 Respondents in residential services: 35%Number of people supported: 234 Respondents in CSLA 19%Survey response rate: 58% Respondents in employment services: 27%Self-response rate: 78% Respondents in day habilitation services: 52%Served by other agencies: 19% Respondents with individual support: 8%
Arc of Montgomery County
Inter-Physical Emotional Material Personal Personal Social Self-
Wellbeing Wellbeing Wellbeing Relations Development InclusionDetermination Rights
FY2009 (36) 8.73 8.30 7.83 8.09 7.26 7.33 6.53 7.44FY2008 (35) 9.26 9.10 8.83 8.40 8.41 7.76 8.37 7.42FY2007 (23) 8.49 8.24 7.86 7.76 7.20 7.02 7.43 7.63FY2006 (29) 8.60 8.38 7.43 7.64 6.76 7.37 6.56 6.76
FY06-09 adjust 8.76 8.52 7.96 7.98 7.37 7.38 7.16 7.29FY06-09 rank
Most recent survey year: FY2008 Respondents in residential services: 57%Number of people supported: 409 Respondents in CSLA 0%Survey response rate: 70% Respondents in employment services: 20%Self-response rate: 80% Respondents in day habilitation services: 54%Served by other agencies: 46% Respondents with individual support: 3%

Ask Me!sm Project FY2009 -- The Arc of Maryland December 2009 Page 77
Arc of Northern Chesapeake
Inter-Physical Emotional Material Personal Personal Social Self-
Wellbeing Wellbeing Wellbeing Relations Development InclusionDetermination RightsFY2008 (28) 8.17 8.18 7.38 7.98 7.93 8.02 7.65 7.71FY2006 (31) 8.58 8.62 7.05 7.97 7.83 7.29 7.68 6.83
FY06-09 adjust 8.42 8.44 7.17 8.02 7.90 7.63 7.72 7.21FY06-09 rank
Most recent survey year: FY2008 Respondents in residential services: 32%Number of people supported: 215 Respondents in CSLA 11%Survey response rate: 56% Respondents in employment services: 54%Self-response rate: 100% Respondents in day habilitation services: 29%Served by other agencies: 11% Respondents with individual support: 4%
Arc of Prince George's County
Inter-Physical Emotional Material Personal Personal Social Self-
Wellbeing Wellbeing Wellbeing Relations Development InclusionDetermination Rights
FY2009 (29) 8.78 8.49 7.18 7.30 7.49 7.20 6.88 6.01FY2008 (25) 8.90 8.63 7.40 8.00 7.63 7.58 7.25 6.70FY2007 (16) 8.05 8.37 7.05 6.27 6.67 6.39 6.71 6.26FY2006 (24) 8.98 8.34 7.32 8.01 6.82 7.08 6.65 6.28
FY06-09 adjust 8.73 8.46 7.26 7.44 7.19 7.09 6.88 6.31FY06-09 rank
Most recent survey year: FY2009 Respondents in residential services: 36%Number of people supported: 510 Respondents in CSLA 10%Survey response rate: 71% Respondents in employment services: 19%Self-response rate: 63% Respondents in day habilitation services: 55%Served by other agencies: 29% Respondents with individual support: 11%

Page 78 December 2009 Ask Me!sm Project FY2009 -- The Arc of Maryland
Arc of Southern Maryland
Inter-Physical Emotional Material Personal Personal Social Self-
Wellbeing Wellbeing Wellbeing Relations Development InclusionDetermination Rights
FY2009 (30) 9.03 9.07 7.72 8.50 8.35 8.42 7.95 7.04FY2007 (33) 9.23 9.01 8.34 7.90 7.60 7.68 7.33 6.87
FY06-09 adjust 9.14 9.02 8.08 8.14 7.92 7.98 7.57 6.92FY06-09 rank
Most recent survey year: FY2009 Respondents in residential services: 52%Number of people supported: 179 Respondents in CSLA 27%Survey response rate: 60% Respondents in employment services: 28%Self-response rate: 78% Respondents in day habilitation services: 31%Served by other agencies: 33% Respondents with individual support: 0%
Arc of Washington County
Inter-Physical Emotional Material Personal Personal Social Self-
Wellbeing Wellbeing Wellbeing Relations Development InclusionDetermination Rights
FY2009 (35) 8.89 8.75 7.98 8.17 7.62 7.34 8.20 7.06FY2008 (41) 9.07 8.90 7.53 8.00 7.51 8.08 7.77 7.05FY2007 (36) 8.72 8.93 8.22 8.15 7.25 7.67 8.26 6.77FY2006 (40) 9.14 9.08 7.68 8.34 7.94 8.37 8.18 7.20
FY06-09 adjust 8.96 8.92 7.84 8.17 7.59 7.90 8.10 7.03FY06-09 rank
Most recent survey year: FY2009 Respondents in residential services: 43%Number of people supported: 394 Respondents in CSLA 17%Survey response rate: 88% Respondents in employment services: 4%Self-response rate: 81% Respondents in day habilitation services: 57%Served by other agencies: 17% Respondents with individual support: 24%

Ask Me!sm Project FY2009 -- The Arc of Maryland December 2009 Page 79
Ardmore Enterprises
Inter-Physical Emotional Material Personal Personal Social Self-
Wellbeing Wellbeing Wellbeing Relations Development InclusionDetermination Rights
FY2008 (33) 9.29 8.93 8.50 8.20 8.17 7.97 7.38 7.36FY2006 (27) 9.25 8.76 8.10 7.73 7.33 7.68 6.11 6.48
FY06-09 adjust 9.27 8.86 8.30 8.00 7.79 7.86 6.79 6.96FY06-09 rank
Most recent survey year: FY2008 Respondents in residential services: 12%Number of people supported: 192 Respondents in CSLA 0%Survey response rate: 75% Respondents in employment services: 6%Self-response rate: 52% Respondents in day habilitation services: 88%Served by other agencies: 52% Respondents with individual support: 6%
Athelas Institute
Inter-Physical Emotional Material Personal Personal Social Self-
Wellbeing Wellbeing Wellbeing Relations Development InclusionDetermination Rights
FY2009 (37) 9.01 8.45 7.08 8.24 7.69 8.11 7.01 6.68FY2007 (36) 8.82 8.77 7.47 7.88 7.89 7.84 7.04 6.45FY2006 (38) 8.94 8.80 7.43 7.88 7.77 7.73 7.48 6.77
FY06-09 adjust 8.92 8.68 7.32 7.74 7.79 7.91 7.19 6.65FY06-09 rank
Most recent survey year: FY2009 Respondents in residential services: 14%Number of people supported: 342 Respondents in CSLA 2%Survey response rate: 74% Respondents in employment services: 30%Self-response rate: 71% Respondents in day habilitation services: 65%Served by other agencies: 52% Respondents with individual support: 2%

Page 80 December 2009 Ask Me!sm Project FY2009 -- The Arc of Maryland
Bay Shore Services Inc
Inter-Physical Emotional Material Personal Personal Social Self-
Wellbeing Wellbeing Wellbeing Relations Development InclusionDetermination Rights
FY2006 (20) 7.80 7.71 6.40 7.25 6.50 6.03 6.51 5.95
FY06-09 adjust 7.81 7.76 6.39 7.34 6.56 6.14 6.61 6.04FY06-09 rank
Most recent survey year: FY2006 Respondents in residential services: 10%Number of people supported: 77 Respondents in CSLA 43%Survey response rate: 46% Respondents in employment services: 24%Self-response rate: 76% Respondents in day habilitation services: 5%Served by other agencies: 38% Respondents with individual support: 24%
Bayside Community Network
Inter-Physical Emotional Material Personal Personal Social Self-
Wellbeing Wellbeing Wellbeing Relations Development InclusionDetermination Rights
FY2007 (18) 7.73 8.31 6.14 7.50 7.54 7.39 6.97 6.76
FY06-09 adjust 7.73 8.33 6.14 7.53 7.56 7.42 7.00 6.79FY06-09 rank
Most recent survey year: FY2007 Respondents in residential services: 46%Number of people supported: 134 Respondents in CSLA 0%Survey response rate: 88% Respondents in employment services: 31%Self-response rate: 91% Respondents in day habilitation services: 66%Served by other agencies: 3% Respondents with individual support: 3%

Ask Me!sm Project FY2009 -- The Arc of Maryland December 2009 Page 81
Bello Machre
Inter-Physical Emotional Material Personal Personal Social Self-
Wellbeing Wellbeing Wellbeing Relations Development InclusionDetermination Rights
FY2009 (25) 8.41 8.47 7.11 7.27 7.67 7.01 6.03 6.75FY2007 (22) 7.51 8.09 7.22 7.74 6.25 6.93 7.17 5.74
FY06-09 adjust 7.95 8.25 7.17 7.49 6.88 6.94 6.61 6.17FY06-09 rank
Most recent survey year: FY2009 Respondents in residential services: 80%Number of people supported: 211 Respondents in CSLA 13%Survey response rate: 61% Respondents in employment services: 0%Self-response rate: 95% Respondents in day habilitation services: 0%Served by other agencies: 82% Respondents with individual support: 7%
Benedictine School
Inter-Physical Emotional Material Personal Personal Social Self-
Wellbeing Wellbeing Wellbeing Relations Development InclusionDetermination Rights
FY2006 (27) 7.99 8.40 6.37 7.81 8.36 8.24 7.12 6.34
FY06-09 adjust 8.00 8.44 6.36 7.90 8.42 8.35 7.22 6.44FY06-09 rank
Most recent survey year: FY2006 Respondents in residential services: 77%Number of people supported: 62 Respondents in CSLA 0%Survey response rate: 75% Respondents in employment services: 27%Self-response rate: 93% Respondents in day habilitation services: 77%Served by other agencies: 7% Respondents with individual support: 0%

Page 82 December 2009 Ask Me!sm Project FY2009 -- The Arc of Maryland
Calmra Inc
Inter-Physical Emotional Material Personal Personal Social Self-
Wellbeing Wellbeing Wellbeing Relations Development InclusionDetermination Rights
FY2009 (36) 9.41 9.42 7.69 8.00 7.55 7.70 6.72 5.99
FY06-09 adjust 9.40 9.38 7.70 7.91 7.49 7.59 6.62 5.89FY06-09 rank
Most recent survey year: FY2009 Respondents in residential services: 86%Number of people supported: 53 Respondents in CSLA 11%Survey response rate: 72% Respondents in employment services: 0%Self-response rate: 53% Respondents in day habilitation services: 0%Served by other agencies: 89% Respondents with individual support: 3%
Caring Hands Inc
Inter-Physical Emotional Material Personal Personal Social Self-
Wellbeing Wellbeing Wellbeing Relations Development InclusionDetermination Rights
FY2007 (14) 8.00 8.08 5.71 7.52 6.98 7.31 6.04 5.42
FY06-09 adjust 8.00 8.10 5.70 7.55 7.00 7.35 6.08 5.45FY06-09 rank
Most recent survey year: FY2007 Respondents in residential services: 100%Number of people supported: 20 Respondents in CSLA 0%Survey response rate: 88% Respondents in employment services: 0%Self-response rate: 44% Respondents in day habilitation services: 0%Served by other agencies: 87% Respondents with individual support: 0%

Ask Me!sm Project FY2009 -- The Arc of Maryland December 2009 Page 83
Caroline Center
Inter-Physical Emotional Material Personal Personal Social Self-
Wellbeing Wellbeing Wellbeing Relations Development InclusionDetermination Rights
FY2006 (28) 9.03 9.32 7.87 8.39 7.88 7.99 7.61 7.07
FY06-09 adjust 9.03 9.36 7.86 8.48 7.94 8.10 7.71 7.16FY06-09 rank
Most recent survey year: FY2006 Respondents in residential services: 48%Number of people supported: 99 Respondents in CSLA 0%Survey response rate: 81% Respondents in employment services: 0%Self-response rate: 71% Respondents in day habilitation services: 87%Served by other agencies: 19% Respondents with individual support: 13%
Carroll County Bureau of Aging
Inter-Physical Emotional Material Personal Personal Social Self-
Wellbeing Wellbeing Wellbeing Relations Development InclusionDetermination Rights
FY2008 (11) 8.86 9.58 7.23 8.27 6.97 7.95 7.46 7.35
FY06-09 adjust 8.86 9.57 7.24 8.24 6.95 7.92 7.43 7.32FY06-09 rank
Most recent survey year: FY2008 Respondents in residential services: 0%Number of people supported: 12 Respondents in CSLA 0%Survey response rate: 92% Respondents in employment services: 0%Self-response rate: 64% Respondents in day habilitation services: 0%Served by other agencies: 55% Respondents with individual support: 100%

Page 84 December 2009 Ask Me!sm Project FY2009 -- The Arc of Maryland
Center for Life Enrichment
Inter-Physical Emotional Material Personal Personal Social Self-
Wellbeing Wellbeing Wellbeing Relations Development InclusionDetermination Rights
FY2009 (28) 9.26 8.86 7.91 8.17 7.63 7.27 7.65 7.19FY2007 (26) 9.45 8.67 7.67 8.05 7.58 7.76 6.76 6.57
FY06-09 adjust 9.36 8.74 7.79 8.08 7.59 7.50 7.15 6.84FY06-09 rank
Most recent survey year: FY2009 Respondents in residential services: 0%Number of people supported: 234 Respondents in CSLA 7%Survey response rate: 56% Respondents in employment services: 47%Self-response rate: 78% Respondents in day habilitation services: 47%Served by other agencies: 34% Respondents with individual support: 17%
Center for Progressive Learning
Inter-Physical Emotional Material Personal Personal Social Self-
Wellbeing Wellbeing Wellbeing Relations Development InclusionDetermination Rights
FY2009 (31) 8.47 7.45 6.54 7.16 7.39 7.72 7.04 6.61FY2007 (35) 8.82 8.71 6.71 7.56 7.73 7.98 6.75 6.14
FY06-09 adjust 8.66 8.58 6.63 7.35 7.56 7.82 6.85 6.33FY06-09 rank
Most recent survey year: FY2009 Respondents in residential services: 100%Number of people supported: 155 Respondents in CSLA 0%Survey response rate: 62% Respondents in employment services: 0%Self-response rate: 58% Respondents in day habilitation services: 0%Served by other agencies: 77% Respondents with individual support: 0%

Ask Me!sm Project FY2009 -- The Arc of Maryland December 2009 Page 85
Center for Social Change
Inter-Physical Emotional Material Personal Personal Social Self-
Wellbeing Wellbeing Wellbeing Relations Development InclusionDetermination Rights
FY2008 (31) 9.52 8.63 7.79 8.27 8.63 8.06 7.78 7.31
FY06-09 adjust 9.51 8.61 7.79 8.24 8.61 8.03 7.75 7.28FY06-09 rank
Most recent survey year: FY2008 Respondents in residential services: 87%Number of people supported: 131 Respondents in CSLA 3%Survey response rate: 62% Respondents in employment services: 19%Self-response rate: 71% Respondents in day habilitation services: 0%Served by other agencies: 74% Respondents with individual support: 0%
Change, Inc
Inter-Physical Emotional Material Personal Personal Social Self-
Wellbeing Wellbeing Wellbeing Relations Development InclusionDetermination Rights
FY2009 (28) 9.15 9.08 6.82 7.23 6.75 6.81 6.55 5.15FY2007 (27) 9.46 9.18 6.78 8.55 7.25 7.60 7.19 6.32
FY06-09 adjust 9.30 9.12 6.80 8.19 7.36 7.74 7.11 6.28FY06-09 rank
Most recent survey year: FY2009 Respondents in residential services: 0%Number of people supported: 150 Respondents in CSLA 20%Survey response rate: 56% Respondents in employment services: 2%Self-response rate: 61% Respondents in day habilitation services: 71%Served by other agencies: 27% Respondents with individual support: 16%

Page 86 December 2009 Ask Me!sm Project FY2009 -- The Arc of Maryland
Charles County HARC
Inter-Physical Emotional Material Personal Personal Social Self-
Wellbeing Wellbeing Wellbeing Relations Development InclusionDetermination Rights
FY2008 (32) 9.33 9.34 7.84 8.09 6.96 8.02 5.97 5.65
FY06-09 adjust 9.33 9.32 7.85 8.06 6.94 7.98 5.94 5.62FY06-09 rank
Most recent survey year: FY2008 Respondents in residential services: 97%Number of people supported: 37 Respondents in CSLA 0%Survey response rate: 86% Respondents in employment services: 0%Self-response rate: 31% Respondents in day habilitation services: 0%Served by other agencies: 81% Respondents with individual support: 3%
Charles County Health Dept
Inter-Physical Emotional Material Personal Personal Social Self-
Wellbeing Wellbeing Wellbeing Relations Development InclusionDetermination Rights
FY2009 (19) 8.33 8.03 5.65 7.73 6.47 6.63 6.79 6.71
FY06-09 adjust 8.33 7.99 5.65 7.64 6.41 6.52 6.69 6.62FY06-09 rank
Most recent survey year: FY2004 Respondents in residential services: 0%Number of people supported: 46 Respondents in CSLA 0%Survey response rate: 55% Respondents in employment services: 0%Self-response rate: 50% Respondents in day habilitation services: 0%Served by other agencies: 17% Respondents with individual support: 87%

Ask Me!sm Project FY2009 -- The Arc of Maryland December 2009 Page 87
Chesapeake Care Resources
Inter-Physical Emotional Material Personal Personal Social Self-
Wellbeing Wellbeing Wellbeing Relations Development InclusionDetermination Rights
FY2008 (30) 8.32 9.12 6.98 8.14 7.13 7.89 6.30 5.96
FY06-09 adjust 8.32 9.11 6.98 8.11 7.11 7.85 6.27 5.93FY06-09 rank
Most recent survey year: FY2008 Respondents in residential services: 57%Number of people supported: 66 Respondents in CSLA 3%Survey response rate: 77% Respondents in employment services: 13%Self-response rate: 63% Respondents in day habilitation services: 83%Served by other agencies: 3% Respondents with individual support: 3%
Chesapeake Center Inc.
Inter-Physical Emotional Material Personal Personal Social Self-
Wellbeing Wellbeing Wellbeing Relations Development InclusionDetermination Rights
FY2008 (32) 8.23 8.18 7.45 7.02 6.53 6.69 7.40 7.24
FY06-09 adjust 8.23 8.16 7.46 6.99 6.51 6.65 7.37 7.21FY06-09 rank
Most recent survey year: FY2008 Respondents in residential services: 44%Number of people supported: 93 Respondents in CSLA 3%Survey response rate: 71% Respondents in employment services: 3%Self-response rate: 100% Respondents in day habilitation services: 88%Served by other agencies: 9% Respondents with individual support: 6%

Page 88 December 2009 Ask Me!sm Project FY2009 -- The Arc of Maryland
Chesterwye Center
Inter-Physical Emotional Material Personal Personal Social Self-
Wellbeing Wellbeing Wellbeing Relations Development InclusionDetermination Rights
FY2009 (34) 8.68 8.38 7.71 7.82 7.81 7.71 7.01 6.75
FY06-09 adjust 8.68 8.34 7.72 7.73 7.75 7.60 6.90 6.66FY06-09 rank
Most recent survey year: FY2004 Respondents in residential services: 35%Number of people supported: 48 Respondents in CSLA 8%Survey response rate: 70% Respondents in employment services: 10%Self-response rate: 70% Respondents in day habilitation services: 81%Served by other agencies: 3% Respondents with individual support: 79%
CHI Centers
Inter-Physical Emotional Material Personal Personal Social Self-
Wellbeing Wellbeing Wellbeing Relations Development InclusionDetermination Rights
FY2009 (40) 8.85 8.98 8.29 8.16 8.21 8.39 8.14 7.52FY2008 (31) 9.03 8.62 7.50 8.32 8.09 8.10 7.52 7.27FY2007 (26) 9.07 8.39 7.86 7.90 7.41 7.34 6.69 7.29FY2006 (26) 9.23 8.64 8.27 8.21 7.92 7.92 7.97 7.41
FY06-09 adjust 9.03 8.68 8.00 8.15 7.93 7.97 7.62 7.38FY06-09 rank
Most recent survey year: FY2009 Respondents in residential services: 21%Number of people supported: 444 Respondents in CSLA 7%Survey response rate: 80% Respondents in employment services: 19%Self-response rate: 91% Respondents in day habilitation services: 73%Served by other agencies: 49% Respondents with individual support: 4%

Ask Me!sm Project FY2009 -- The Arc of Maryland December 2009 Page 89
Chimes Inc
Inter-Physical Emotional Material Personal Personal Social Self-
Wellbeing Wellbeing Wellbeing Relations Development InclusionDetermination Rights
FY2009 (25) 8.24 8.42 6.23 7.12 6.76 6.69 6.45 5.36FY2008 (33) 8.11 8.11 6.82 7.22 6.69 7.51 7.03 6.84FY2007 (22) 8.90 7.90 6.62 7.82 7.27 6.69 5.93 5.34FY2006 (28) 8.22 8.67 7.70 7.30 6.89 7.24 7.43 6.75
FY06-09 adjust 8.35 8.28 6.91 7.36 6.89 7.08 6.79 6.18FY06-09 rank
Most recent survey year: FY2009 Respondents in residential services: 24%Number of people supported: 785 Respondents in CSLA 3%Survey response rate: 64% Respondents in employment services: 14%Self-response rate: 72% Respondents in day habilitation services: 76%Served by other agencies: 30% Respondents with individual support: 6%
Community Living Inc
Inter-Physical Emotional Material Personal Personal Social Self-
Wellbeing Wellbeing Wellbeing Relations Development InclusionDetermination Rights
FY2007 (43) 9.03 8.30 7.44 7.16 6.91 7.33 7.38 6.74
FY06-09 adjust 9.04 8.32 7.43 7.19 6.93 7.36 7.42 6.77FY06-09 rank
Most recent survey year: FY2007 Respondents in residential services: 84%Number of people supported: 93 Respondents in CSLA 0%Survey response rate: 92% Respondents in employment services: 0%Self-response rate: 61% Respondents in day habilitation services: 16%Served by other agencies: 54% Respondents with individual support: 14%

Page 90 December 2009 Ask Me!sm Project FY2009 -- The Arc of Maryland
Community Support Services
Inter-Physical Emotional Material Personal Personal Social Self-
Wellbeing Wellbeing Wellbeing Relations Development InclusionDetermination Rights
FY2007 (32) 9.47 8.98 8.32 8.47 8.90 8.10 8.54 7.63
FY06-09 adjust 9.47 9.00 8.31 8.50 8.92 8.14 8.57 7.66FY06-09 rank
Most recent survey year: FY2007 Respondents in residential services: 73%Number of people supported: 76 Respondents in CSLA 6%Survey response rate: 85% Respondents in employment services: 82%Self-response rate: 58% Respondents in day habilitation services: 9%Served by other agencies: 7% Respondents with individual support: 0%
Community Support Services for the Deaf (CSSD)
Inter-Physical Emotional Material Personal Personal Social Self-
Wellbeing Wellbeing Wellbeing Relations Development InclusionDetermination Rights
FY2006 (29) 7.82 7.09 6.18 5.75 6.34 5.72 6.72 5.16
FY06-09 adjust 7.82 7.13 6.17 5.84 6.40 5.83 6.82 5.25FY06-09 rank
Most recent survey year: FY2006 Respondents in residential services: 50%Number of people supported: 57 Respondents in CSLA 0%Survey response rate: 82% Respondents in employment services: 0%Self-response rate: 81% Respondents in day habilitation services: 0%Served by other agencies: 25% Respondents with individual support: 53%
NOTE: The American Sign Language version of the Ask Me! Survey differs from the English version,and domain scores may not be exactly comparable.

Ask Me!sm Project FY2009 -- The Arc of Maryland December 2009 Page 91
Council for EC&A
Inter-Physical Emotional Material Personal Personal Social Self-
Wellbeing Wellbeing Wellbeing Relations Development InclusionDetermination Rights
FY2007 (26) 9.49 9.20 7.84 7.83 7.48 7.97 7.97 6.97
FY06-09 adjust 9.49 9.22 7.84 7.86 7.50 8.01 8.01 7.01FY06-09 rank
Most recent survey year: FY2007 Respondents in residential services: 78%Number of people supported: 28 Respondents in CSLA 0%Survey response rate: 88% Respondents in employment services: 0%Self-response rate: 39% Respondents in day habilitation services: 0%Served by other agencies: 96% Respondents with individual support: 17%
Creative Options
Inter-Physical Emotional Material Personal Personal Social Self-
Wellbeing Wellbeing Wellbeing Relations Development InclusionDetermination Rights
FY2008 (24) 8.54 8.40 7.13 7.15 7.67 6.87 6.16 6.37
FY06-09 adjust 8.54 8.38 7.13 7.12 7.65 6.84 6.12 6.33FY06-09 rank
Most recent survey year: FY2008 Respondents in residential services: 79%Number of people supported: 120 Respondents in CSLA 0%Survey response rate: 50% Respondents in employment services: 0%Self-response rate: 83% Respondents in day habilitation services: 38%Served by other agencies: 58% Respondents with individual support: 0%

Page 92 December 2009 Ask Me!sm Project FY2009 -- The Arc of Maryland
CSAAC
Inter-Physical Emotional Material Personal Personal Social Self-
Wellbeing Wellbeing Wellbeing Relations Development InclusionDetermination Rights
FY2007 (32) 9.65 8.95 8.49 8.36 8.04 7.74 7.72 7.24
FY06-09 adjust 9.65 8.96 8.48 8.39 8.06 7.78 7.75 7.27FY06-09 rank
Most recent survey year: FY2007 Respondents in residential services: 97%Number of people supported: 116 Respondents in CSLA 0%Survey response rate: 82% Respondents in employment services: 88%Self-response rate: 59% Respondents in day habilitation services: 0%Served by other agencies: 6% Respondents with individual support: 0%
Deaf Independent Living Association
Inter-Physical Emotional Material Personal Personal Social Self-
Wellbeing Wellbeing Wellbeing Relations Development InclusionDetermination Rights
FY2006 (13) 9.17 8.99 7.36 7.27 7.53 6.97 7.95 6.63
FY06-09 adjust 9.17 9.03 7.35 7.36 7.59 7.08 8.05 6.73FY06-09 rank
Most recent survey year: FY2006 Respondents in residential services: 69%Number of people supported: 23 Respondents in CSLA 4%Survey response rate: 61% Respondents in employment services: 54%Self-response rate: 100% Respondents in day habilitation services: 0%Served by other agencies: 38% Respondents with individual support: 31%
NOTE: The American Sign Language version of the Ask Me! Survey differs from the English version,and domain scores may not be exactly comparable.

Ask Me!sm Project FY2009 -- The Arc of Maryland December 2009 Page 93
Delmarva Community Services
Inter-Physical Emotional Material Personal Personal Social Self-
Wellbeing Wellbeing Wellbeing Relations Development InclusionDetermination Rights
FY2008 (35) 8.00 8.06 6.53 7.52 6.96 7.45 6.82 6.17
FY06-09 adjust 8.00 8.04 6.54 7.49 6.94 7.41 6.79 6.14FY06-09 rank
Most recent survey year: FY2008 Respondents in residential services: 51%Number of people supported: 77 Respondents in CSLA 6%Survey response rate: 85% Respondents in employment services: 9%Self-response rate: 89% Respondents in day habilitation services: 60%Served by other agencies: 6% Respondents with individual support: 6%
Dominion Resources
Inter-Physical Emotional Material Personal Personal Social Self-
Wellbeing Wellbeing Wellbeing Relations Development InclusionDetermination Rights
FY2009 (8) 7.96 8.07 5.68 7.55 6.88 6.66 5.26 3.44
FY06-09 adjust 7.95 8.03 5.69 7.46 6.82 6.55 5.16 3.34FY06-09 rank
Most recent survey year: FY2009 Respondents in residential services: 100%Number of people supported: 12 Respondents in CSLA 0%Survey response rate: 67% Respondents in employment services: 0%Self-response rate: 63% Respondents in day habilitation services: 0%Served by other agencies: 75% Respondents with individual support: 0%

Page 94 December 2009 Ask Me!sm Project FY2009 -- The Arc of Maryland
Dove Pointe Inc
Inter-Physical Emotional Material Personal Personal Social Self-
Wellbeing Wellbeing Wellbeing Relations Development InclusionDetermination Rights
FY2008 (31) 8.87 8.53 7.71 8.38 7.50 7.50 6.13 6.45FY2006 (33) 8.52 8.48 6.79 7.01 7.55 7.73 7.26 6.61
FY06-09 adjust 8.68 8.52 7.12 7.63 7.55 7.68 6.84 6.60FY06-09 rank
Most recent survey year: FY2008 Respondents in residential services: 29%Number of people supported: 194 Respondents in CSLA 16%Survey response rate: 78% Respondents in employment services: 3%Self-response rate: 61% Respondents in day habilitation services: 84%Served by other agencies: 16% Respondents with individual support: 0%
Dreamcatchers
Inter-Physical Emotional Material Personal Personal Social Self-
Wellbeing Wellbeing Wellbeing Relations Development InclusionDetermination Rights
FY2008 (6) 8.61 8.06 9.44 7.08 7.50 7.22 7.22 6.53
FY06-09 adjust 8.61 8.04 9.45 7.05 7.48 7.19 7.19 6.50FY06-09 rank
Most recent survey year: FY2008 Respondents in residential services: 83%Number of people supported: 10 Respondents in CSLA 17%Survey response rate: 67% Respondents in employment services: 0%Self-response rate: 100% Respondents in day habilitation services: 0%Served by other agencies: 100% Respondents with individual support: 0%

Ask Me!sm Project FY2009 -- The Arc of Maryland December 2009 Page 95
Ebed Enterprises
Inter-Physical Emotional Material Personal Personal Social Self-
Wellbeing Wellbeing Wellbeing Relations Development InclusionDetermination Rights
FY2009 (16) 8.40 8.26 7.46 6.76 6.60 6.67 6.20 5.89
FY06-09 adjust 8.40 8.21 7.47 6.67 6.54 6.56 6.10 5.79FY06-09 rank
Most recent survey year: FY2009 Respondents in residential services: 94%Number of people supported: 22 Respondents in CSLA 6%Survey response rate: 73% Respondents in employment services: 0%Self-response rate: 75% Respondents in day habilitation services: 0%Served by other agencies: 69% Respondents with individual support: 0%
eMerge
Inter-Physical Emotional Material Personal Personal Social Self-
Wellbeing Wellbeing Wellbeing Relations Development InclusionDetermination Rights
FY2008 (36) 8.84 8.13 7.60 7.51 7.52 7.50 7.29 6.52FY2006 (31) 9.14 8.51 7.78 7.77 7.99 7.83 7.48 7.16
FY06-09 adjust 8.98 8.32 7.68 7.66 7.77 7.68 7.41 6.86FY06-09 rank
Most recent survey year: FY2008 Respondents in residential services: 42%Number of people supported: 287 Respondents in CSLA 19%Survey response rate: 73% Respondents in employment services: 25%Self-response rate: 78% Respondents in day habilitation services: 53%Served by other agencies: 22% Respondents with individual support: 6%

Page 96 December 2009 Ask Me!sm Project FY2009 -- The Arc of Maryland
Epilepsy Association of Eastern Shore
Inter-Physical Emotional Material Personal Personal Social Self-
Wellbeing Wellbeing Wellbeing Relations Development InclusionDetermination Rights
FY2008 (14) 8.10 8.38 8.05 7.60 8.18 8.01 7.10 6.75
FY06-09 adjust 8.10 8.37 8.05 7.57 8.16 7.98 7.07 6.72FY06-09 rank
Most recent survey year: FY2008 Respondents in residential services: 57%Number of people supported: 49 Respondents in CSLA 14%Survey response rate: 29% Respondents in employment services: 0%Self-response rate: 93% Respondents in day habilitation services: 0%Served by other agencies: 86% Respondents with individual support: 14%
Erosum Inc
Inter-Physical Emotional Material Personal Personal Social Self-
Wellbeing Wellbeing Wellbeing Relations Development InclusionDetermination Rights
FY2009 (9) 8.13 6.99 6.22 7.73 7.08 7.04 6.11 5.96
FY06-09 adjust 8.13 6.95 6.23 7.64 7.02 6.93 6.01 5.87FY06-09 rank
Most recent survey year: FY2009 Respondents in residential services: 100%Number of people supported: 11 Respondents in CSLA 0%Survey response rate: 82% Respondents in employment services: 0%Self-response rate: 67% Respondents in day habilitation services: 0%Served by other agencies: 89% Respondents with individual support: 0%

Ask Me!sm Project FY2009 -- The Arc of Maryland December 2009 Page 97
Family Service Foundation Inc
Inter-Physical Emotional Material Personal Personal Social Self-
Wellbeing Wellbeing Wellbeing Relations Development InclusionDetermination Rights
FY2009 (26) 9.11 8.50 7.09 7.55 7.53 7.53 5.86 3.96
FY06-09 adjust 9.11 8.46 7.10 7.46 7.47 7.42 5.76 3.87FY06-09 rank
Most recent survey year: FY2009 Respondents in residential services: 77%Number of people supported: 73 Respondents in CSLA 0%Survey response rate: 65% Respondents in employment services: 0%Self-response rate: 12% Respondents in day habilitation services: 88%Served by other agencies: 19% Respondents with individual support: 0%
Fidelity Resources Inc.
Inter-Physical Emotional Material Personal Personal Social Self-
Wellbeing Wellbeing Wellbeing Relations Development InclusionDetermination Rights
FY2008 (22) 8.28 8.21 6.35 7.34 8.14 7.53 8.04 7.17
FY06-09 adjust 8.28 8.19 6.35 7.31 8.12 7.49 8.01 7.14FY06-09 rank
Most recent survey year: FY2008 Respondents in residential services: 0%Number of people supported: 43 Respondents in CSLA 50%Survey response rate: 52% Respondents in employment services: 0%Self-response rate: 100 % Respondents in day habilitation services: 0%Served by other agencies: 41% Respondents with individual support: 50%

Page 98 December 2009 Ask Me!sm Project FY2009 -- The Arc of Maryland
Flying Colors of Success
Inter-Physical Emotional Material Personal Personal Social Self-
Wellbeing Wellbeing Wellbeing Relations Development InclusionDetermination Rights
FY2009 (26) 9.28 8.80 7.55 8.33 7.71 8.14 6.23 5.13
FY06-09 adjust 9.28 8.75 7.56 8.24 7.66 8.04 6.13 5.03FY06-09 rank
Most recent survey year: FY2009 Respondents in residential services: 100%Number of people supported: 32 Respondents in CSLA 0%Survey response rate: 81% Respondents in employment services: 0%Self-response rate: 38% Respondents in day habilitation services: 4%Served by other agencies: 96% Respondents with individual support: 0%
Forward Visions
Inter-Physical Emotional Material Personal Personal Social Self-
Wellbeing Wellbeing Wellbeing Relations Development InclusionDetermination Rights
FY2008 (24) 7.75 8.05 5.38 6.75 6.04 6.15 6.68 5.81
FY06-09 adjust 7.75 8.03 5.38 6.72 6.02 6.12 6.34 5.78FY06-09 rank
Most recent survey year: FY2008 Respondents in residential services: 63%Number of people supported: 60 Respondents in CSLA 17%Survey response rate: 49% Respondents in employment services: 0%Self-response rate: 71% Respondents in day habilitation services: 0%Served by other agencies: 63% Respondents with individual support: 21%

Ask Me!sm Project FY2009 -- The Arc of Maryland December 2009 Page 99
Friends Aware, Inc
Inter-Physical Emotional Material Personal Personal Social Self-
Wellbeing Wellbeing Wellbeing Relations Development InclusionDetermination Rights
FY2007 (39) 8.74 8.52 7.77 7.88 7.68 7.69 8.04 7.47
FY06-09 adjust 8.74 8.54 7.77 7.91 7.70 7.72 8.08 7.50FY06-09 rank
Most recent survey year: FY2007 Respondents in residential services: 25%Number of people supported: 135 Respondents in CSLA 13%Survey response rate: 80% Respondents in employment services: 0%Self-response rate: 80% Respondents in day habilitation services: 75%Served by other agencies: 30% Respondents with individual support: 18%
Full Citizenship of Maryland
Inter-Physical Emotional Material Personal Personal Social Self-
Wellbeing Wellbeing Wellbeing Relations Development InclusionDetermination Rights
FY2008 (28) 9.73 9.09 9.18 8.31 8.31 8.11 8.15 7.93
FY06-09 adjust 9.73 9.08 9.19 8.28 8.29 8.08 8.12 7.89FY06-09 rank
Most recent survey year: FY2008 Respondents in residential services: 89%Number of people supported: 38 Respondents in CSLA 4%Survey response rate: 78% Respondents in employment services: 79%Self-response rate: 46% Respondents in day habilitation services: 0%Served by other agencies: 18% Respondents with individual support: 0%

Page 100 December 2009 Ask Me!sm Project FY2009 -- The Arc of Maryland
Goodwill Industries of Monocacy Valley
Inter-Physical Emotional Material Personal Personal Social Self-
Wellbeing Wellbeing Wellbeing Relations Development InclusionDetermination Rights
FY2007 (14) 8.07 8.90 7.32 7.23 7.95 7.50 8.10 6.73
FY06-09 adjust 8.07 8.91 7.32 7.26 7.97 7.54 8.13 6.76FY06-09 rank
Most recent survey year: FY2007 Respondents in residential services: 0%Number of people supported: 19 Respondents in CSLA 0%Survey response rate: 178% Respondents in employment services: 14%Self-response rate: 93% Respondents in day habilitation services: 71%Served by other agencies: 57% Respondents with individual support: 21%
Harford Center
Inter-Physical Emotional Material Personal Personal Social Self-
Wellbeing Wellbeing Wellbeing Relations Development InclusionDetermination Rights
FY2008 (34) 8.09 8.12 6.89 7.64 6.93 7.52 7.08 5.85
FY06-09 adjust 8.09 8.11 6.89 7.61 6.91 7.49 7.05 5.82FY06-09 rank
Most recent survey year: FY2008 Respondents in residential services: 0%Number of people supported: 75 Respondents in CSLA 0%Survey response rate: 87% Respondents in employment services: 0%Self-response rate: 76% Respondents in day habilitation services: 100%Served by other agencies: 53% Respondents with individual support: 0%

Ask Me!sm Project FY2009 -- The Arc of Maryland December 2009 Page 101
Head Injury Rehabilitation
Inter-Physical Emotional Material Personal Personal Social Self-
Wellbeing Wellbeing Wellbeing Relations Development InclusionDetermination Rights
FY2009 (30) 7.85 7.17 6.64 6.99 7.04 6.52 6.76 8.26
FY06-09 adjust 7.85 7.12 6.65 6.90 6.98 6.41 6.66 8.17FY06-09 rank
Most recent survey year: FY2009 Respondents in residential services: 47%Number of people supported: 51 Respondents in CSLA 13%Survey response rate: 60% Respondents in employment services: 17%Self-response rate: 93% Respondents in day habilitation services: 57%Served by other agencies: 0% Respondents with individual support: 23%
Horizon Goodwill Industries
Inter-Physical Emotional Material Personal Personal Social Self-
Wellbeing Wellbeing Wellbeing Relations Development InclusionDetermination Rights
FY2006 (42) 9.34 9.30 8.31 8.37 8.07 8.13 8.26 7.25
FY06-09 adjust 9.34 9.35 8.30 8.46 8.12 8.23 8.36 7.35FY06-09 rank
Most recent survey year: FY2006 Respondents in residential services: 0%Number of people supported: 97 Respondents in CSLA 0%Survey response rate: 84% Respondents in employment services: 12%Self-response rate: 62% Respondents in day habilitation services: 81%Served by other agencies: 67% Respondents with individual support: 7%

Page 102 December 2009 Ask Me!sm Project FY2009 -- The Arc of Maryland
Humanim
Inter-Physical Emotional Material Personal Personal Social Self-
Wellbeing Wellbeing Wellbeing Relations Development InclusionDetermination Rights
FY2009 (28) 7.78 7.74 6.56 6.96 7.71 7.44 7.65 7.16FY2008 (31) 8.10 7.98 6.99 7.35 7.29 7.39 7.56 7.10FY2007 (26) 8.32 8.40 7.60 7.03 7.07 7.04 6.47 6.62
FY06-09 adjust 8.06 8.02 7.03 7.08 7.34 7.26 7.21 6.93FY06-09 rank
Most recent survey year: FY2009 Respondents in residential services: 8%Number of people supported: 365 Respondents in CSLA 19%Survey response rate: 56% Respondents in employment services: 29%Self-response rate: 95% Respondents in day habilitation services: 41%Served by other agencies: 33% Respondents with individual support: 16%
Innovative Services, Inc.
Inter-Physical Emotional Material Personal Personal Social Self-
Wellbeing Wellbeing Wellbeing Relations Development InclusionDetermination Rights
FY2007 (9) 9.54 8.67 7.62 8.36 7.76 6.96 7.04 7.03
FY06-09 adjust 9.54 8.68 7.62 8.39 7.78 7.00 7.07 7.06FY06-09 rank
Most recent survey year: FY2007 Respondents in residential services: 100%Number of people supported: 18 Respondents in CSLA 0%Survey response rate: 63% Respondents in employment services: 0%Self-response rate: 80% Respondents in day habilitation services: 0%Served by other agencies: 30% Respondents with individual support: 0%

Ask Me!sm Project FY2009 -- The Arc of Maryland December 2009 Page 103
Jeanne Bussard Center
Inter-Physical Emotional Material Personal Personal Social Self-
Wellbeing Wellbeing Wellbeing Relations Development InclusionDetermination Rights
FY2006 (33) 8.89 8.95 8.37 8.56 8.02 8.38 8.04 7.53
FY06-09 adjust 8.89 8.99 8.36 8.65 8.08 8.49 8.14 7.63FY06-09 rank
Most recent survey year: FY2006 Respondents in residential services: 0%Number of people supported: 67 Respondents in CSLA 0%Survey response rate: 68% Respondents in employment services: 3%Self-response rate: 94% Respondents in day habilitation services: 85%Served by other agencies: 55% Respondents with individual support: 12%
Jewish Family Services
Inter-Physical Emotional Material Personal Personal Social Self-
Wellbeing Wellbeing Wellbeing Relations Development InclusionDetermination Rights
FY2007 (21) 8.17 7.99 6.15 7.63 6.72 6.95 6.61 7.02
FY06-09 adjust 8.17 8.00 6.15 7.66 6.74 6.98 6.64 7.05FY06-09 rank
Most recent survey year: FY2007 Respondents in residential services: 39%Number of people supported: 66 Respondents in CSLA 36%Survey response rate: 70% Respondents in employment services: 0%Self-response rate: 86% Respondents in day habilitation services: 0%Served by other agencies: 54% Respondents with individual support: 25%

Page 104 December 2009 Ask Me!sm Project FY2009 -- The Arc of Maryland
Jewish Foundation for Group Homes
Inter-Physical Emotional Material Personal Personal Social Self-
Wellbeing Wellbeing Wellbeing Relations Development InclusionDetermination Rights
FY2008 (27) 9.04 8.55 8.38 7.93 8.42 7.68 7.50 7.96
FY06-09 adjust 9.04 8.53 8.38 7.90 8.40 7.64 7.47 7.93FY06-09 rank
Most recent survey year: FY2008 Respondents in residential services: 85%Number of people supported: 98 Respondents in CSLA 4%Survey response rate: 56% Respondents in employment services: 0%Self-response rate: 81% Respondents in day habilitation services: 0%Served by other agencies: 85% Respondents with individual support: 11%
Jewish Social Services Agency
Inter-Physical Emotional Material Personal Personal Social Self-
Wellbeing Wellbeing Wellbeing Relations Development InclusionDetermination Rights
FY2006 (26) 8.17 8.06 6.97 7.57 7.18 6.78 6.92 7.10
FY06-09 adjust 8.18 8.10 6.96 7.66 7.24 6.89 7.02 7.20FY06-09 rank
Most recent survey year: FY2006 Respondents in residential services: 0%Number of people supported: 47 Respondents in CSLA 0%Survey response rate: 64% Respondents in employment services: 85%Self-response rate: 93% Respondents in day habilitation services: 0%Served by other agencies: 15% Respondents with individual support: 15%

Ask Me!sm Project FY2009 -- The Arc of Maryland December 2009 Page 105
Jubilee Association of Maryland
Inter-Physical Emotional Material Personal Personal Social Self-
Wellbeing Wellbeing Wellbeing Relations Development InclusionDetermination Rights
FY2007 (32) 9.16 8.68 8.44 8.43 7.88 8.09 8.01 7.56
FY06-09 adjust 9.16 8.69 8.44 8.46 7.89 8.13 8.04 7.59FY06-09 rank
Most recent survey year: FY2007 Respondents in residential services: 53%Number of people supported: 94 Respondents in CSLA 47%Survey response rate: 87% Respondents in employment services: 0%Self-response rate: 76% Respondents in day habilitation services: 0%Served by other agencies: 68% Respondents with individual support: 3%
Kennedy Kreiger Institute
Inter-Physical Emotional Material Personal Personal Social Self-
Wellbeing Wellbeing Wellbeing Relations Development InclusionDetermination Rights
FY2008 (9) 9.22 8.75 7.19 7.97 6.56 8.02 7.60 5.52
FY06-09 adjust 9.22 8.74 7.19 7.94 6.54 7.98 7.57 5.49FY06-09 rank
Most recent survey year: FY2008 Respondents in residential services: 0%Number of people supported: 30 Respondents in CSLA 0%Survey response rate: 31% Respondents in employment services: 0%Self-response rate: 56% Respondents in day habilitation services: 0%Served by other agencies: 78% Respondents with individual support: 22%

Page 106 December 2009 Ask Me!sm Project FY2009 -- The Arc of Maryland
Kent Center Inc
Inter-Physical Emotional Material Personal Personal Social Self-
Wellbeing Wellbeing Wellbeing Relations Development InclusionDetermination Rights
FY2006 (25) 8.20 7.80 7.13 6.94 7.45 7.47 5.52 5.93
FY06-09 adjust 8.21 7.84 7.12 7.03 7.51 7.57 5.62 6.03FY06-09 rank
Most recent survey year: FY2006 Respondents in residential services: 52%Number of people supported: 49 Respondents in CSLA 12%Survey response rate: 52% Respondents in employment services: 44%Self-response rate: 64% Respondents in day habilitation services: 52%Served by other agencies: 0% Respondents with individual support: 12%
Langton Green
Inter-Physical Emotional Material Personal Personal Social Self-
Wellbeing Wellbeing Wellbeing Relations Development InclusionDetermination Rights
FY2009 (28) 9.36 9.48 7.59 8.25 8.15 8.00 7.05 6.63
FY06-09 adjust 9.36 9.44 7.60 8.16 8.09 7.89 6.95 6.54FY06-09 rank
Most recent survey year: FY2009 Respondents in residential services: 96%Number of people supported: 107 Respondents in CSLA 4%Survey response rate: 74% Respondents in employment services: 7%Self-response rate: 89% Respondents in day habilitation services: 0%Served by other agencies: 79% Respondents with individual support: 0%

Ask Me!sm Project FY2009 -- The Arc of Maryland December 2009 Page 107
League for People with Disabilities
Inter-Physical Emotional Material Personal Personal Social Self-
Wellbeing Wellbeing Wellbeing Relations Development InclusionDetermination Rights
FY2008 (25) 7.20 7.85 7.01 7.53 6.63 7.17 7.12 6.89
FY06-09 adjust 7.20 7.84 7.01 7.50 6.61 7.13 7.09 6.86FY06-09 rank
Most recent survey year: FY2008 Respondents in residential services: 0%Number of people supported: 42 Respondents in CSLA 0%Survey response rate: 60% Respondents in employment services: 100%Self-response rate: 100% Respondents in day habilitation services: 0%Served by other agencies: 12% Respondents with individual support: 0%
LIFE
Inter-Physical Emotional Material Personal Personal Social Self-
Wellbeing Wellbeing Wellbeing Relations Development InclusionDetermination Rights
FY2008 (28) 8.97 9.43 8.10 8.02 7.90 7.91 7.90 7.00
FY06-09 adjust 8.97 9.42 8.10 7.99 7.88 7.87 7.87 6.97FY06-09 rank
Most recent survey year: FY2008 Respondents in residential services: 93%Number of people supported: 96 Respondents in CSLA 7%Survey response rate: 58% Respondents in employment services: 0%Self-response rate: 79% Respondents in day habilitation services: 0%Served by other agencies: 71% Respondents with individual support: 0%

Page 108 December 2009 Ask Me!sm Project FY2009 -- The Arc of Maryland
Lifeline
Inter-Physical Emotional Material Personal Personal Social Self-
Wellbeing Wellbeing Wellbeing Relations Development InclusionDetermination Rights
FY2009 (8) 8.54 8.59 7.69 7.18 6.18 8.61 4.90 4.71
FY06-09 adjust 8.54 8.55 7.70 7.09 6.12 8.50 4.80 4.62FY06-09 rank
Most recent survey year: FY2009 Respondents in residential services: 100%Number of people supported: 10 Respondents in CSLA 0%Survey response rate: 89% Respondents in employment services: 0%Self-response rate: 50% Respondents in day habilitation services: 0%Served by other agencies: 12% Respondents with individual support: 0%
Linwood Children's Center
Inter-Physical Emotional Material Personal Personal Social Self-
Wellbeing Wellbeing Wellbeing Relations Development InclusionDetermination Rights
FY2007 (23) 9.64 9.43 8.13 8.18 8.04 7.63 7.81 6.94
FY06-09 adjust 9.64 9.44 8.13 8.21 8.06 7.66 7.85 6.97FY06-09 rank
Most recent survey year: FY2007 Respondents in residential services: 96%Number of people supported: 25 Respondents in CSLA 0%Survey response rate: 96% Respondents in employment services: 79%Self-response rate: 54% Respondents in day habilitation services: 4%Served by other agencies: 12% Respondents with individual support: 0%
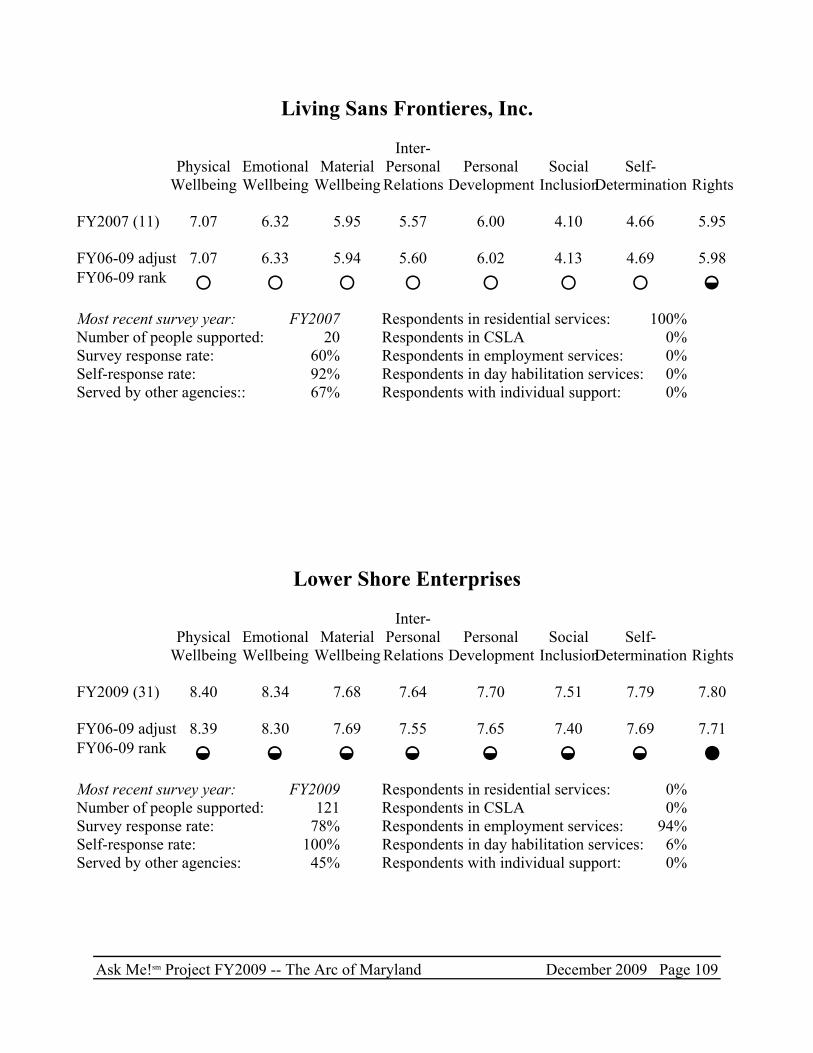
Ask Me!sm Project FY2009 -- The Arc of Maryland December 2009 Page 109
Living Sans Frontieres, Inc.
Inter-Physical Emotional Material Personal Personal Social Self-
Wellbeing Wellbeing Wellbeing Relations Development InclusionDetermination Rights
FY2007 (11) 7.07 6.32 5.95 5.57 6.00 4.10 4.66 5.95
FY06-09 adjust 7.07 6.33 5.94 5.60 6.02 4.13 4.69 5.98FY06-09 rank
Most recent survey year: FY2007 Respondents in residential services: 100%Number of people supported: 20 Respondents in CSLA 0%Survey response rate: 60% Respondents in employment services: 0%Self-response rate: 92% Respondents in day habilitation services: 0%Served by other agencies:: 67% Respondents with individual support: 0%
Lower Shore Enterprises
Inter-Physical Emotional Material Personal Personal Social Self-
Wellbeing Wellbeing Wellbeing Relations Development InclusionDetermination Rights
FY2009 (31) 8.40 8.34 7.68 7.64 7.70 7.51 7.79 7.80
FY06-09 adjust 8.39 8.30 7.69 7.55 7.65 7.40 7.69 7.71FY06-09 rank
Most recent survey year: FY2009 Respondents in residential services: 0%Number of people supported: 121 Respondents in CSLA 0%Survey response rate: 78% Respondents in employment services: 94%Self-response rate: 100% Respondents in day habilitation services: 6%Served by other agencies: 45% Respondents with individual support: 0%

Page 110 December 2009 Ask Me!sm Project FY2009 -- The Arc of Maryland
Lt Joseph P Kennedy Institute
Inter-Physical Emotional Material Personal Personal Social Self-
Wellbeing Wellbeing Wellbeing Relations Development InclusionDetermination Rights
FY2007 (13) 8.92 8.94 7.29 8.20 7.23 7.65 7.38 7.72
FY06-09 adjust 8.92 8.96 7.28 8.23 7.25 7.69 7.41 7.76FY06-09 rank
Most recent survey year: FY2007 Respondents in residential services: 20%Number of people supported: 109 Respondents in CSLA 20%Survey response rate: 31% Respondents in employment services: 33%Self-response rate: 93% Respondents in day habilitation services: 13%Served by other agencies: 67% Respondents with individual support: 33%
Lycher Inc
Inter-Physical Emotional Material Personal Personal Social Self-
Wellbeing Wellbeing Wellbeing Relations Development InclusionDetermination Rights
FY2007 (38) 9.58 9.10 7.19 7.34 6.63 7.19 6.63 5.43
FY06-09 adjust 9.58 9.12 7.19 7.37 6.65 7.22 6.67 5.47FY06-09 rank
Most recent survey year: FY2007 Respondents in residential services: 42%Number of people supported: 43 Respondents in CSLA 0%Survey response rate: 93% Respondents in employment services: 0%Self-response rate: 16% Respondents in day habilitation services: 76%Served by other agencies: 34% Respondents with individual support: 0%

Ask Me!sm Project FY2009 -- The Arc of Maryland December 2009 Page 111
Maryland Community Connections
Inter-Physical Emotional Material Personal Personal Social Self-
Wellbeing Wellbeing Wellbeing Relations Development InclusionDetermination Rights
FY2009 (28) 8.81 8.21 7.51 7.30 7.67 7.28 7.57 7.65
FY06-09 adjust 8.81 8.17 7.52 7.21 7.61 7.17 7.46 7.56FY06-09 rank
Most recent survey year: FY2009 Respondents in residential services: 0%Number of people supported: 44 Respondents in CSLA 4%Survey response rate: 65% Respondents in employment services: 86%Self-response rate: 96% Respondents in day habilitation services: 0%Served by other agencies: 25% Respondents with individual support: 11%
Maryland Neighborly Networks
Inter-Physical Emotional Material Personal Personal Social Self-
Wellbeing Wellbeing Wellbeing Relations Development InclusionDetermination Rights
FY2009 (28) 8.67 8.31 7.70 8.07 8.21 7.96 7.28 6.31
FY06-09 adjust 8.66 8.26 7.70 7.98 8.15 7.85 7.18 6.21FY06-09 rank
Most recent survey year: FY2009 Respondents in residential services: 96%Number of people supported: 38 Respondents in CSLA 4%Survey response rate: 74% Respondents in employment services: 0%Self-response rate: 96% Respondents in day habilitation services: 0%Served by other agencies: 96% Respondents with individual support: 0%

Page 112 December 2009 Ask Me!sm Project FY2009 -- The Arc of Maryland
Medsource Community
Inter-Physical Emotional Material Personal Personal Social Self-
Wellbeing Wellbeing Wellbeing Relations Development InclusionDetermination Rights
FY2009 (36) 9.38 9.22 8.59 8.14 8.00 8.13 8.08 7.15FY2008 (39) 9.38 8.89 8.25 7.38 7.59 7.46 7.26 7.05FY2007 (33) 9.72 9.28 8.31 7.95 8.06 7.90 8.45 7.40FY2006 (32) 9.47 8.82 8.15 6.93 6.60 6.63 5.78 6.14
FY06-09 adjust 9.48 9.05 8.33 7.60 7.58 7.54 7.41 6.95FY06-09 rank
Most recent survey year: FY2009 Respondents in residential services: 94%Number of people supported: 145 Respondents in CSLA 5%Survey response rate: 84% Respondents in employment services: 0%Self-response rate: 24% Respondents in day habilitation services: 0%Served by other agencies: 92% Respondents with individual support: 2%
Melwood
Inter-Physical Emotional Material Personal Personal Social Self-
Wellbeing Wellbeing Wellbeing Relations Development InclusionDetermination Rights
FY2009 (26) 7.96 7.93 7.50 7.58 7.00 7.31 7.39 6.38FY2008 (27) 9.05 9.21 8.80 8.22 7.77 8.63 8.24 7.64FY2007 (27) 9.14 8.51 7.64 7.83 7.44 7.49 7.31 6.96FY2006 (24) 8.84 8.65 8.28 8.21 8.15 8.14 7.92 7.56
FY06-09 adjust 8.81 8.59 8.07 7.96 7.61 7.92 7.72 7.18FY06-09 rank
Most recent survey year: FY2009 Respondents in residential services: 20%Number of people supported: 391 Respondents in CSLA 6%Survey response rate: 52% Respondents in employment services: 48%Self-response rate: 92% Respondents in day habilitation services: 44%Served by other agencies: 28% Respondents with individual support: 11%

Ask Me!sm Project FY2009 -- The Arc of Maryland December 2009 Page 113
Mid Atlantic Human Services Corp
Inter-Physical Emotional Material Personal Personal Social Self-
Wellbeing Wellbeing Wellbeing Relations Development InclusionDetermination Rights
FY2007 (25) 9.49 9.40 7.93 8.61 7.71 8.29 7.03 5.96
FY06-09 adjust 9.49 9.42 7.93 8.64 7.73 8.32 7.06 5.99FY06-09 rank
Most recent survey year: FY2007 Respondents in residential services: 859%Number of people supported: 48 Respondents in CSLA 11%Survey response rate: 61% Respondents in employment services: 0%Self-response rate: 19% Respondents in day habilitation services: 0%Served by other agencies: 56% Respondents with individual support: 0%
Montgomery County Department of Family Resources
Inter-Physical Emotional Material Personal Personal Social Self-
Wellbeing Wellbeing Wellbeing Relations Development InclusionDetermination Rights
FY2006 (12) 9.79 8.97 8.13 7.76 8.03 8.17 8.67 7.85
FY06-09 adjust 9.80 9.02 8.12 7.85 8.09 8.28 8.77 7.95FY06-09 rank
Most recent survey year: FY2006 Respondents in residential services: 0%Number of people supported: 49 Respondents in CSLA 0%Survey response rate: 31% Respondents in employment services: 0%Self-response rate: 62% Respondents in day habilitation services: 0%Served by other agencies: 62% Respondents with individual support: 100%

Page 114 December 2009 Ask Me!sm Project FY2009 -- The Arc of Maryland
National MS
Inter-Physical Emotional Material Personal Personal Social Self-
Wellbeing Wellbeing Wellbeing Relations Development InclusionDetermination Rights
FY2009 (14) 8.11 8.51 6.58 7.69 6.22 6.67 8.13 7.67
FY06-09 adjust 8.10 8.47 6.59 7.60 6.16 6.57 8.03 7.57FY06-09 rank
Most recent survey year: FY2009 Respondents in residential services: 0%Number of people supported: 47 Respondents in CSLA 0%Survey response rate: 36% Respondents in employment services: 0%Self-response rate: 100% Respondents in day habilitation services: 0%Served by other agencies: 0% Respondents with individual support: 100%
NCIA CBAI
Inter-Physical Emotional Material Personal Personal Social Self-
Wellbeing Wellbeing Wellbeing Relations Development InclusionDetermination Rights
FY2008 (33) 8.56 8.45 7.97 7.59 8.32 8.07 7.65 7.03FY2006 (22) 8.25 7.60 7.50 7.47 7.56 7.37 6.74 5.52
FY06-09 adjust 8.43 8.09 7.77 7.56 8.01 7.80 7.29 6.40FY06-09 rank
Most recent survey year: FY2008 Respondents in residential services: 33%Number of people supported: 162 Respondents in CSLA 0%Survey response rate: 66% Respondents in employment services: 67%Self-response rate: 91% Respondents in day habilitation services: 33%Served by other agencies: 64% Respondents with individual support: 0%

Ask Me!sm Project FY2009 -- The Arc of Maryland December 2009 Page 115
New Horizon
Inter-Physical Emotional Material Personal Personal Social Self-
Wellbeing Wellbeing Wellbeing Relations Development InclusionDetermination Rights
FY2009 (41) 9.11 9.17 7.75 8.56 8.08 8.11 7.78 6.79FY2007 (21) 8.35 8.31 6.50 7.36 8.56 8.12 8.35 7.01
FY06-09 adjust 8.84 8.81 7.32 8.09 8.22 8.06 7.93 6.82FY06-09 rank
Most recent survey year: FY2009 Respondents in residential services: 0%Number of people supported: 152 Respondents in CSLA 1%Survey response rate: 84% Respondents in employment services: 35%Self-response rate: 74% Respondents in day habilitation services: 65%Served by other agencies: 65% Respondents with individual support: 6%
Opportunity Builders
Inter-Physical Emotional Material Personal Personal Social Self-
Wellbeing Wellbeing Wellbeing Relations Development InclusionDetermination Rights
FY2008 (29) 8.56 8.60 7.44 8.03 7.95 8.17 7.32 7.08FY2006 (39) 8.94 8.58 8.62 8.20 7.81 8.26 7.76 6.54
FY06-09 adjust 8.79 8.61 8.18 8.19 7.89 8.28 7.64 6.78FY06-09 rank
Most recent survey year: FY2008 Respondents in residential services: 0%Number of people supported: 269 Respondents in CSLA 0%Survey response rate: 74% Respondents in employment services: 31%Self-response rate: 90% Respondents in day habilitation services: 62%Served by other agencies: 62% Respondents with individual support: 7%

Page 116 December 2009 Ask Me!sm Project FY2009 -- The Arc of Maryland
PACT: Helping Children with Special Needs
Inter-Physical Emotional Material Personal Personal Social Self-
Wellbeing Wellbeing Wellbeing Relations Development InclusionDetermination Rights
FY2006 (11) 7.65 8.18 6.18 7.50 7.80 7.00 7.88 7.76
FY06-09 adjust 7.66 8.22 6.17 7.59 7.86 7.11 7.98 7.85FY06-09 rank
Most recent survey year: FY2006 Respondents in residential services: 0%Number of people supported: 18* Respondents in CSLA 0%Survey response rate: 92% Respondents in employment services: 0%Self-response rate: 100% Respondents in day habilitation services: 0%Served by other agencies: 75% Respondents with individual support: 100%
* Short-term support is provided through a general grant rather than person-specific funds, and all adults supported at thetime of the survey were interviewed.
Penn Mar
Inter-Physical Emotional Material Personal Personal Social Self-
Wellbeing Wellbeing Wellbeing Relations Development InclusionDetermination Rights
FY2006 (31) 9.03 8.76 8.10 7.68 7.80 7.02 6.69 7.00
FY06-09 adjust 9.04 8.81 8.09 7.77 7.86 7.13 6.79 7.09FY06-09 rank
Most recent survey year: FY2006 Respondents in residential services: 66%Number of people supported: 118 Respondents in CSLA 9%Survey response rate: 87% Respondents in employment services: 31%Self-response rate: 69% Respondents in day habilitation services: 63%Served by other agencies: 14% Respondents with individual support: 14%

Ask Me!sm Project FY2009 -- The Arc of Maryland December 2009 Page 117
Progress Unlimited
Inter-Physical Emotional Material Personal Personal Social Self-
Wellbeing Wellbeing Wellbeing Relations Development InclusionDetermination Rights
FY2008 (39) 8.65 8.75 7.44 7.52 6.35 7.05 4.99 4.83
FY06-09 adjust 8.65 8.74 7.44 7.49 6.33 7.01 4.95 4.80FY06-09 rank
Most recent survey year: FY2008 Respondents in residential services: 100%Number of people supported: 81 Respondents in CSLA 0%Survey response rate: 78% Respondents in employment services: 0%Self-response rate: 36% Respondents in day habilitation services: 0%Served by other agencies: 74% Respondents with individual support: 0%
Progressive Horizons
Inter-Physical Emotional Material Personal Personal Social Self-
Wellbeing Wellbeing Wellbeing Relations Development InclusionDetermination Rights
FY2007 (32) 8.58 8.00 6.69 7.14 6.97 6.96 6.52 6.04
FY06-09 adjust 8.58 8.01 6.69 7.17 6.99 7.00 6.55 6.07FY06-09 rank
Most recent survey year: FY2007 Respondents in residential services: 94%Number of people supported: 61 Respondents in CSLA 6%Survey response rate: 86% Respondents in employment services: 0%Self-response rate: 67% Respondents in day habilitation services: 0%Served by other agencies: 81% Respondents with individual support: 0%

Page 118 December 2009 Ask Me!sm Project FY2009 -- The Arc of Maryland
Providence Center
Inter-Physical Emotional Material Personal Personal Social Self-
Wellbeing Wellbeing Wellbeing Relations Development InclusionDetermination Rights
FY2009 (22) 8.44 8.73 7.45 8.03 7.18 7.99 7.14 5.72FY2008 (28) 8.12 9.18 7.96 8.03 7.58 8.03 7.76 6.37FY2007 (21) 7.52 8.27 7.21 7.41 7.57 7.29 7.11 7.31FY2006 (23) 8.65 8.43 7.18 7.53 7.96 7.09 6.87 6.80
FY06-09 adjust 8.17 8.64 7.42 7.72 7.64 7.52 7.20 6.66FY06-09 rank
Most recent survey year: FY2009 Respondents in residential services: 0%Number of people supported: 423 Respondents in CSLA 0%Survey response rate: 55% Respondents in employment services: 12%Self-response rate: 93% Respondents in day habilitation services: 84%Served by other agencies: 52% Respondents with individual support: 5%
Quantum Leap
Inter-Physical Emotional Material Personal Personal Social Self-
Wellbeing Wellbeing Wellbeing Relations Development InclusionDetermination Rights
FY2008 (12) 8.07 8.75 6.50 8.06 8.56 7.61 7.52 7.58
FY06-09 adjust 8.07 8.74 6.50 8.03 8.54 7.58 7.48 7.55FY06-09 rank
Most recent survey year: FY2008 Respondents in residential services: 100%Number of people supported: 20 Respondents in CSLA 0%Survey response rate: 60% Respondents in employment services: 0%Self-response rate: 100% Respondents in day habilitation services: 0%Served by other agencies: 83% Respondents with individual support: 0%

Ask Me!sm Project FY2009 -- The Arc of Maryland December 2009 Page 119
Ray of Hope Inc
Inter-Physical Emotional Material Personal Personal Social Self-
Wellbeing Wellbeing Wellbeing Relations Development InclusionDetermination Rights
FY2008 (38) 9.13 8.83 7.90 8.27 8.16 8.07 8.19 7.28
FY06-09 adjust 9.13 8.81 7.90 8.24 8.17 8.03 8.15 7.25FY06-09 rank
Most recent survey year: FY2008 Respondents in residential services: 76%Number of people supported: 52 Respondents in CSLA 11%Survey response rate: 76% Respondents in employment services: 0%Self-response rate: 68% Respondents in day habilitation services: 0%Served by other agencies: 82% Respondents with individual support: 13%
Rehabilitation Opportunities
Inter-Physical Emotional Material Personal Personal Social Self-
Wellbeing Wellbeing Wellbeing Relations Development InclusionDetermination Rights
FY2008 (25) 8.88 8.40 8.21 7.48 7.82 7.23 8.04 7.12FY2006 (28) 8.35 7.98 7.01 7.62 7.28 7.42 6.76 6.49
FY06-09 adjust 8.59 8.20 7.52 7.59 7.54 7.37 7.36 6.81FY06-09 rank
Most recent survey year: FY2008 Respondents in residential services: 0%Number of people supported: 206 Respondents in CSLA 0%Survey response rate: 56% Respondents in employment services: 4%Self-response rate: 88% Respondents in day habilitation services: 96%Served by other agencies: 40% Respondents with individual support: 0%

Page 120 December 2009 Ask Me!sm Project FY2009 -- The Arc of Maryland
REM Inc
Inter-Physical Emotional Material Personal Personal Social Self-
Wellbeing Wellbeing Wellbeing Relations Development InclusionDetermination Rights
FY2007 (12) 8.72 8.23 7.76 7.34 6.55 7.55 5.44 4.86
FY06-09 adjust 8.72 8.24 7.76 7.37 6.57 7.59 5.48 4.89FY06-09 rank
Most recent survey year: FY2007 Respondents in residential services: 94%Number of people supported: 25 Respondents in CSLA 0%Survey response rate: 64% Respondents in employment services: 0%Self-response rate: 56% Respondents in day habilitation services: 0%Served by other agencies: 69% Respondents with individual support: 0%
Richcroft
Inter-Physical Emotional Material Personal Personal Social Self-
Wellbeing Wellbeing Wellbeing Relations Development InclusionDetermination Rights
FY2006 (29) 8.30 7.87 6.91 6.92 6.28 6.83 6.14 5.12
FY06-09 adjust 8.31 7.92 6.90 7.01 6.34 6.93 6.24 5.21FY06-09 rank
Most recent survey year: FY2006 Respondents in residential services: 82%Number of people supported: 115 Respondents in CSLA 12%Survey response rate: 76% Respondents in employment services: 0%Self-response rate: 58% Respondents in day habilitation services: 0%Served by other agencies: 82% Respondents with individual support: 6%

Ask Me!sm Project FY2009 -- The Arc of Maryland December 2009 Page 121
Rock Creek Foundation
Inter-Physical Emotional Material Personal Personal Social Self-
Wellbeing Wellbeing Wellbeing Relations Development InclusionDetermination Rights
FY2007 (24) 8.22 8.23 7.85 7.31 7.67 7.94 7.19 6.98
FY06-09 adjust 8.22 8.25 7.84 7.34 7.69 7.97 7.22 7.01FY06-09 rank
Most recent survey year: FY2007 Respondents in residential services: 72%Number of people supported: 63 Respondents in CSLA 8%Survey response rate: 54% Respondents in employment services: 20%Self-response rate: 92% Respondents in day habilitation services: 40%Served by other agencies: 16% Respondents with individual support: 4%
Scott Key Center
Inter-Physical Emotional Material Personal Personal Social Self-
Wellbeing Wellbeing Wellbeing Relations Development InclusionDetermination Rights
FY2008 (45) 9.38 9.20 8.43 8.82 7.95 8.10 8.35 7.55
FY06-09 adjust 9.38 9.19 8.43 8.79 7.93 8.07 8.32 7.52FY06-09 rank
Most recent survey year: FY2008 Respondents in residential services: 0%Number of people supported: 111 Respondents in CSLA 0%Survey response rate: 90% Respondents in employment services: 36%Self-response rate: 60% Respondents in day habilitation services: 60%Served by other agencies: 76% Respondents with individual support: 4%

Page 122 December 2009 Ask Me!sm Project FY2009 -- The Arc of Maryland
SecureCare Services
Inter-Physical Emotional Material Personal Personal Social Self-
Wellbeing Wellbeing Wellbeing Relations Development InclusionDetermination Rights
FY2008 (34) 9.14 8.87 6.87 7.73 7.16 7.75 6.93 6.81
FY06-09 adjust 9.14 8.86 6.78 7.70 7.14 7.72 6.90 6.77FY06-09 rank
Most recent survey year: FY2008 Respondents in residential services: 100%Number of people supported: 111 Respondents in CSLA 0%Survey response rate: 74% Respondents in employment services: 0%Self-response rate: 50% Respondents in day habilitation services: 0%Served by other agencies: 62% Respondents with individual support: 0%
SEEC
Inter-Physical Emotional Material Personal Personal Social Self-
Wellbeing Wellbeing Wellbeing Relations Development InclusionDetermination Rights
FY2006 (25) 9.15 8.65 6.98 7.87 7.11 7.51 6.30 6.30
FY06-09 adjust 9.16 8.70 6.97 7.96 7.17 7.62 6.40 6.39FY06-09 rank
Most recent survey year: FY2006 Respondents in residential services: 4%Number of people supported: 111 Respondents in CSLA 25%Survey response rate: 57% Respondents in employment services: 21%Self-response rate: 46% Respondents in day habilitation services: 0%Served by other agencies: 54% Respondents with individual support: 68%

Ask Me!sm Project FY2009 -- The Arc of Maryland December 2009 Page 123
Shura
Inter-Physical Emotional Material Personal Personal Social Self-
Wellbeing Wellbeing Wellbeing Relations Development InclusionDetermination Rights
FY2007 (24) 8.72 8.31 7.02 7.90 7.32 8.33 7.31 7.11
FY06-09 adjust 8.72 8.33 7.02 7.93 7.34 8.36 7.35 7.14FY06-09 rank
Most recent survey year: FY2007 Respondents in residential services: 86%Number of people supported: 46 Respondents in CSLA 14%Survey response rate: 72% Respondents in employment services: 0%Self-response rate: 100% Respondents in day habilitation services: 0%Served by other agencies: 93% Respondents with individual support: 0%
Somerset Community Services Inc
Inter-Physical Emotional Material Personal Personal Social Self-
Wellbeing Wellbeing Wellbeing Relations Development InclusionDetermination Rights
FY2009 (31) 8.67 8.59 7.19 8.33 8.89 7.94 7.52 7.18
FY06-09 adjust 8.67 8.55 7.19 8.24 8.83 7.84 7.42 7.09FY06-09 rank
Most recent survey year: FY2009 Respondents in residential services: 42%Number of people supported: 118 Respondents in CSLA 10%Survey response rate: 78% Respondents in employment services: 23%Self-response rate: 84% Respondents in day habilitation services: 71%Served by other agencies: 0% Respondents with individual support: 10%

Page 124 December 2009 Ask Me!sm Project FY2009 -- The Arc of Maryland
Southern Maryland Vocational Industries
Inter-Physical Emotional Material Personal Personal Social Self-
Wellbeing Wellbeing Wellbeing Relations Development InclusionDetermination Rights
FY2006 (32) 8.88 8.62 7.60 7.88 8.04 7.31 7.47 7.31
FY06-09 adjust 8.88 8.67 7.59 7.97 8.10 7.42 7.58 7.40FY06-09 rank
Most recent survey year: FY2006 Respondents in residential services: 44%Number of people supported: 135 Respondents in CSLA 0%Survey response rate: 75% Respondents in employment services: 47%Self-response rate: 79% Respondents in day habilitation services: 0%Served by other agencies: 38% Respondents with individual support: 9%
Spectrum Support
Inter-Physical Emotional Material Personal Personal Social Self-
Wellbeing Wellbeing Wellbeing Relations Development InclusionDetermination Rights
FY2006 (31) 8.63 7.96 7.51 7.75 7.43 7.67 7.23 7.23
FY06-09 adjust 8.63 8.01 7.50 7.84 7.49 7.78 7.33 7.32FY02-05 rank
Most recent survey year: FY2006 Respondents in residential services: 22%Number of people supported: 125 Respondents in CSLA 3%Survey response rate: 65% Respondents in employment services: 28%Self-response rate: 81% Respondents in day habilitation services: 59%Served by other agencies: 81% Respondents with individual support: 3%

Ask Me!sm Project FY2009 -- The Arc of Maryland December 2009 Page 125
Spring Dell Center
Inter-Physical Emotional Material Personal Personal Social Self-
Wellbeing Wellbeing Wellbeing Relations Development InclusionDetermination Rights
FY2009 (30) 8.57 8.84 6.82 7.70 7.11 6.97 6.44 5.37FY2007 (22) 9.01 8.70 7.94 7.84 7.23 7.56 6.62 6.12
FY06-09 adjust 8.78 8.76 7.34 7.74 7.15 7.20 6.48 5.72FY06-09 rank
Most recent survey year: FY2009 Respondents in residential services: 15%Number of people supported: 155 Respondents in CSLA 9%Survey response rate: 61% Respondents in employment services: 7%Self-response rate: 64% Respondents in day habilitation services: 85%Served by other agencies: 38% Respondents with individual support: 7%
St. Peters Adult Learning
Inter-Physical Emotional Material Personal Personal Social Self-
Wellbeing Wellbeing Wellbeing Relations Development InclusionDetermination Rights
FY2008 (30) 7.40 7.75 5.53 7.10 6.76 7.13 6.57 6.22
FY06-09 adjust 7.40 7.74 5.54 7.07 6.74 7.10 6.54 6.19FY06-09 rank
Most recent survey year: FY2008 Respondents in residential services: 0%Number of people supported: 49 Respondents in CSLA 0%Survey response rate: 63% Respondents in employment services: 47%Self-response rate: 100% Respondents in day habilitation services: 53%Served by other agencies: 17% Respondents with individual support: 0%

Page 126 December 2009 Ask Me!sm Project FY2009 -- The Arc of Maryland
Star Community
Inter-Physical Emotional Material Personal Personal Social Self-
Wellbeing Wellbeing Wellbeing Relations Development InclusionDetermination Rights
FY2006 (31) 9.25 9.23 8.90 8.33 7.65 8.18 7.31 6.27
FY06-09 adjust 9.25 9.27 8.89 8.42 7.71 8.29 7.41 6.36FY06-09 rank
Most recent survey year: FY2006 Respondents in residential services: 74%Number of people supported: 35 Respondents in CSLA 0%Survey response rate: 97% Respondents in employment services: 0%Self-response rate: 35% Respondents in day habilitation services: 97%Served by other agencies: 15% Respondents with individual support: 0%
Starflight
Inter-Physical Emotional Material Personal Personal Social Self-
Wellbeing Wellbeing Wellbeing Relations Development InclusionDetermination Rights
FY2007 (21) 8.38 7.99 5.91 6.70 6.08 6.32 4.53 4.63
FY06-09 adjust 8.39 8.00 5.91 6.73 6.10 6.36 4.56 4.66FY06-09 rank
Most recent survey year: FY2007 Respondents in residential services: 79%Number of people supported: 34 Respondents in CSLA 0%Survey response rate: 73% Respondents in employment services: 0%Self-response rate: 46% Respondents in day habilitation services: 0%Served by other agencies: 75% Respondents with individual support: 4%
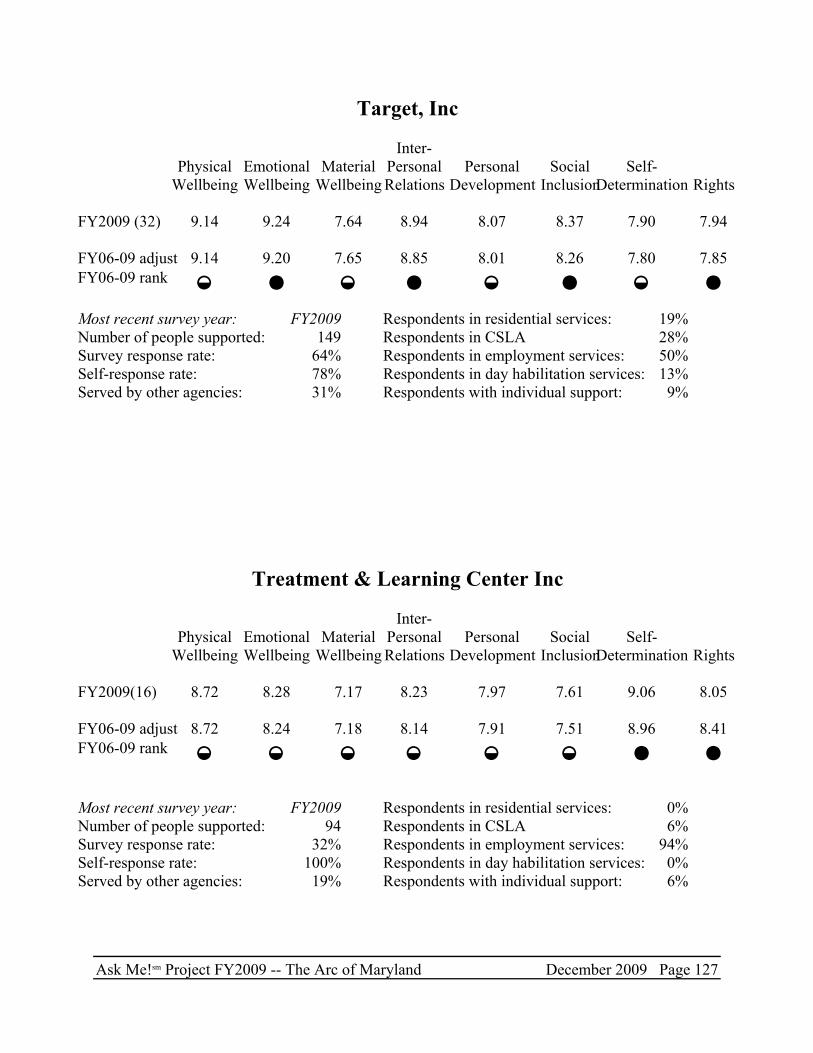
Ask Me!sm Project FY2009 -- The Arc of Maryland December 2009 Page 127
Target, Inc
Inter-Physical Emotional Material Personal Personal Social Self-
Wellbeing Wellbeing Wellbeing Relations Development InclusionDetermination Rights
FY2009 (32) 9.14 9.24 7.64 8.94 8.07 8.37 7.90 7.94
FY06-09 adjust 9.14 9.20 7.65 8.85 8.01 8.26 7.80 7.85FY06-09 rank
Most recent survey year: FY2009 Respondents in residential services: 19%Number of people supported: 149 Respondents in CSLA 28%Survey response rate: 64% Respondents in employment services: 50%Self-response rate: 78% Respondents in day habilitation services: 13%Served by other agencies: 31% Respondents with individual support: 9%
Treatment & Learning Center Inc
Inter-Physical Emotional Material Personal Personal Social Self-
Wellbeing Wellbeing Wellbeing Relations Development InclusionDetermination Rights
FY2009(16) 8.72 8.28 7.17 8.23 7.97 7.61 9.06 8.05
FY06-09 adjust 8.72 8.24 7.18 8.14 7.91 7.51 8.96 8.41FY06-09 rank
Most recent survey year: FY2009 Respondents in residential services: 0%Number of people supported: 94 Respondents in CSLA 6%Survey response rate: 32% Respondents in employment services: 94%Self-response rate: 100% Respondents in day habilitation services: 0%Served by other agencies: 19% Respondents with individual support: 6%

Page 128 December 2009 Ask Me!sm Project FY2009 -- The Arc of Maryland
UCP of Central Maryland
Inter-Physical Emotional Material Personal Personal Social Self-
Wellbeing Wellbeing Wellbeing Relations Development InclusionDetermination Rights
FY2008 (29) 8.39 8.26 6.65 7.10 6.37 7.29 5.96 5.07FY2006 (33) 9.03 8.94 7.63 8.10 7.46 7.77 7.29 6.42
FY06-09 adjust 8.73 8.66 7.24 7.69 7.01 7.59 6.73 5.84FY06-09 rank
Most recent survey year: FY2008 Respondents in residential services: 55%Number of people supported: 329 Respondents in CSLA 17%Survey response rate: 76% Respondents in employment services: 3%Self-response rate: 48% Respondents in day habilitation services: 66%Served by other agencies: 21% Respondents with individual support: 3%
UCP of Montgomery & Prince George's & Counties
Inter-Physical Emotional Material Personal Personal Social Self-
Wellbeing Wellbeing Wellbeing Relations Development InclusionDetermination Rights
FY2008 (29) 8.62 8.75 7.93 7.67 7.32 7.91 7.79 7.40
FY06-09 adjust 8.62 8.74 7.93 7.64 7.30 7.88 7.75 7.37FY06-09 rank
Most recent survey year: FY2008 Respondents in residential services: 0%Number of people supported: 51 Respondents in CSLA 3%Survey response rate: 63% Respondents in employment services: 28%Self-response rate: 97% Respondents in day habilitation services: 48%Served by other agencies: 31% Respondents with individual support: 28%

Ask Me!sm Project FY2009 -- The Arc of Maryland December 2009 Page 129
UCP of Southern Maryland
Inter-Physical Emotional Material Personal Personal Social Self-
Wellbeing Wellbeing Wellbeing Relations Development InclusionDetermination Rights
FY2009 (22) 8.37 8.64 7.56 7.34 8.02 7.30 8.12 7.78FY2007 (17) 8.21 8.76 8.01 8.66 8.10 7.91 8.61 7.45
FY06-09 adjust 8.30 8.69 7.76 7.90 8.03 7.55 8.31 7.59FY06-09 rank
Most recent survey year: FY2009 Respondents in residential services: 22%Number of people supported: 187 Respondents in CSLA 17%Survey response rate: 44% Respondents in employment services: 54%Self-response rate: 98% Respondents in day habilitation services: 0%Served by other agencies: 26% Respondents with individual support: 15%
VOCA Corporation
Inter-Physical Emotional Material Personal Personal Social Self-
Wellbeing Wellbeing Wellbeing Relations Development InclusionDetermination Rights
FY20094 (21) 9.05 8.85 8.17 7.69 8.43 7.30 7.38 6.56
FY06-09 adjust 9.04 8.81 8.18 7.60 8.37 7.19 7.28 6.46FY06-09 rank
Most recent survey year: FY2009 Respondents in residential services: 100%Number of people supported: 21 Respondents in CSLA 0%Survey response rate: 100% Respondents in employment services: 0%Self-response rate: 19% Respondents in day habilitation services: 0%Served by other agencies: 76% Respondents with individual support: 0%

Page 130 December 2009 Ask Me!sm Project FY2009 -- The Arc of Maryland
Washington Co Human Development Council
Inter-Physical Emotional Material Personal Personal Social Self-
Wellbeing Wellbeing Wellbeing Relations Development InclusionDetermination Rights
FY2008 (41) 9.63 9.35 7.84 8.11 7.27 8.06 7.37 6.88
FY06-09 adjust 9.63 9.33 7.85 8.08 7.25 8.03 7.34 6.85FY06-09 rank
Most recent survey year: FY2008 Respondents in residential services: 54%Number of people supported: 103 Respondents in CSLA 0%Survey response rate: 82% Respondents in employment services: 5%Self-response rate: 34% Respondents in day habilitation services: 68%Served by other agencies: 34% Respondents with individual support: 5%
Way Station
Inter-Physical Emotional Material Personal Personal Social Self-
Wellbeing Wellbeing Wellbeing Relations Development InclusionDetermination Rights
FY2009 (18) 9.15 8.19 7.90 8.11 8.41 7.57 8.14 7.50
FY06-09 adjust 9.15 8.15 7.91 8.02 8.35 7.46 8.04 7.41FY06-09 rank
Most recent year: FY2009 Respondents in residential services: 0%Total adults supported 18 Respondents in CSLA 0%Survey response rate: 78% Respondents in employment services: 17%Self-response rate: 72% Respondents in day habilitation services: 78%Served by other agencies: 61% Respondents with individual support: 6%

Ask Me!sm Project FY2009 -- The Arc of Maryland December 2009 Page 131
Worcester County Developmental Center
Inter-Physical Emotional Material Personal Personal Social Self-
Wellbeing Wellbeing Wellbeing Relations Development InclusionDetermination Rights
FY2006 (28) 7.74 8.71 7.07 7.74 8.12 8.13 7.82 7.17
FY06-09 adjust 7.75 8.75 7.06 7.83 8.18 8.24 7.93 7.26FY06-09 rank
Most recent year: FY2006 Respondents in residential services: 23%Total adults supported 93 Respondents in CSLA 7%Survey response rate: 66% Respondents in employment services: 3%Self-response rate: 90% Respondents in day habilitation services: 97%Served by other agencies: 13% Respondents with individual support: 0%