Embed Size (px)
Citation preview

Asia Special Report Global Markets Research24 August 2021
China: Beijing’s Volcker moment
Beijing’s unprecedented determination to contain the property sector marks a stark shift from previous policies.
Markets may have become so focused on the recent regulatory storm that they ignore the elephant in the room: Beijing’s unprecedented curbs on the property sector, which makes up one-quarter of China’s economy.
•
In a sense, this could be China’s Volcker moment, considering Beijing’s strong willingness to sacrifice some near-term GDP growth for taming home prices and diverting financial resources out of the property sector.
•
Markets should be prepared for what could be a much worse-than-expected growth slowdown, more loan and bond defaults, and potential stock market turmoil.
•
The long-term outlook for China’s property sector is still uncertain, as Beijing has not yet have developed a comprehensive, long-term plan for the sector and as these ongoing curbs may not deliver exactly what top leaders expect.
•
Research AnalystsAsia EconomicsTing Lu - [email protected]+852 2252 1306
Lisheng Wang - [email protected]+852 2252 2057
Jing Wang - [email protected]+852 2252 1011
See Appendix A-1 for analyst certification, important disclosures and the status of non-US analysts.
Production Complete: 2021-08-24 11:29 UTC

Contents
Executive summary 2Beijing’s Volcker moment and its curbs on the property sector 3Why it is different this time 4
The strategic importance of the current property curbs 8Turning off the credit tap 8Crossing the Rubicon 11
Early signs of a slowing property sector 14Developers’ deteriorating financing conditions 16
Box 1. A breakdown of property developer debt: A Q2 2021 update 20We expect the property sector to be the largest drag on growth in H2 22Appendix 1: The “systemically important” property sector 25Glossary 28
Appendix A-1 31
Nomura | Asia Special Report 24 August 2021
2

Executive summaryBeijing’s recent regulatory blitz on several sectors, including off-campus tutoring and internet platforms, has garnered investor attention. However, markets may have become so focused on the regulatory storm that they ignore the elephant in the room: Beijing’s curbs on the property sector, which makes up one-quarter of China’s economy and half of the global construction business.
In coming months, we expect China’s GDP growth to drop significantly, driven by the latest wave of Covid-19 (the delta variant), slowing exports, property tightening and the campaign to reduce carbon emissions. The property sector may once again be at centre stage, testing the nerves of both China’s government and global investors. Markets should be prepared for what could be a much worse-than-expected growth slowdown, more loan and bond defaults, and potential stock market turmoil.
In a sense, this could be China’s Volcker moment, considering Beijing’s unprecedented determination to tighten property sector policy and tame property prices. During the late 1970s, former Fed Chairman Paul Volcker made a radical move to contain inflation and, while the US economy experienced a substantial recession in 1980-82, he set the table for the long economic expansions of the 1980s and 1990s. At least at this moment, Beijing seems willing to sacrifice some growth stability for achieving these long-term targets, namely less dependence on foreign high-tech goods, achieving a higher birth rate and reducing wealth inequality.
Seasoned investors may regard the above view as an exaggeration, as they have become accustomed to the ups and downs of Beijing’s property sector policies, but things are likely to change and past behaviour cannot always be extrapolated into the future. We believe this time it’s different, as Beijing has attached national strategic importance to reining in property bubbles, directly intervening in the credit supply for the property sector, and has left little scope to dial back these curbs.
Since 2018 Beijing has faced three key property sector-related challenges: US-China tensions, the rapid decline in birth rates, and worsening wealth inequality. Beijing’s determination to roll out unprecedented property curbs is closely associated with its desire to address these challenges. Beijing has recently compromised the K-12 off-campus tutoring sector to lighten the burden on middle-class households and is now taking steps to move the largest mountain – high home prices – and these property curbs are set to have a much more significant impact on China’s economy and financial markets.
What’s the end game? The long-term outlook for China’s property sector is still uncertain, as Beijing has not yet developed a comprehensive, long-term plan for the sector, and as these ongoing curbs may not deliver exactly what top leaders expect.
Beijing appear to be finally determined to expand the property tax system from some trial programs in Shanghai and Chongqing to the whole of China for two reasons. First, home ownership is one of the major root causes of wealth inequality in China and Beijing has vowed to achieve “common prosperity”. Second, the ongoing property curbs should broadly reduce local government land sales revenues and Beijing needs to find a replacement.
Public housing is unlikely to be the white knight for stabilizing growth in the near term, as Beijing does not yet have a mature and comprehensive plan on public housing. We are unsure what the eventual impact of the public housing program will be but believe market forces will recede to some extent in coming years on the provision of urban housing for Chinese households.
Nomura | Asia Special Report 24 August 2021
3

Beijing’s Volcker moment and its curbs on the property sectorMarkets remain in a state of shock from China’s sweeping regulatory crackdown on internet platforms, fintech, video games, off-campus tutoring, ride-hailing, data privacy, food delivery, crypto miners and e-cigarettes. Nothing seems to be off limits, and global investors seem to have received and are reacting to Beijing’s message of “common prosperity”. However, investors may have become so swamped by the regulatory storm that they miss the elephant in the room: Beijing’s curbs on the property sector, which makes up one-quarter of China’s economy and half of global construction. We believe that Beijing is now much more resolved to contain the property sector and that these curbs are likely to be far more effective than previous efforts, as Beijing has directly intervened in the financial links to the property sector, home price inflation appears to be tamed, economic growth will likely take a significant hit in the near term, property taxes may finally be implemented and public housing should play a much larger role.
In a sense, this could be China’s Volcker moment, considering Beijing’s unprecedented determination to tighten property sector policy and tame property prices. During the late 1970s, former Fed Chairman Paul Volcker made a radical move to contain inflation and, while the US economy experienced a substantial recession in 1980-82 (Figure 1), he set the table for the long economic expansions of the 1980s and 1990s. Although the long-term outlook for China’s property sector is still uncertain, as Beijing has not yet developed a comprehensive, long-term plan for the sector and as these ongoing curbs may not deliver exactly what top leaders expect, markets over the near term need to be prepared for a likely marked growth slowdown, more developer defaults and home foreclosures, and perhaps some turmoil in stock markets.
Fig. 1: US: Real GDP growth vs CPI inflation
Source: WIND and Nomura Global Economics.
Fig. 2: China: Real GDP growth in year-on-year and quarter-on-quarter terms: actual data and Nomura projections
Source: WIND and Nomura Global Economics.
This time it’s different: Beijing’s determination is now unwavering, even when faced with a growth slumpSeasoned investors may regard the above view as an exaggeration, as they have become accustomed to the ups and downs of Beijing’s property sector policies, but things are likely to change and past behaviour cannot always be extrapolated into the future. We believe this time it’s different, as Beijing has attached national strategic importance to reining in property bubbles, directly intervening in the credit supply for the property sector, and has left little scope to dial back these curbs. Since 2018 Beijing has faced three key property sector-related challenges: US-China tensions, the rapid decline in the birth rate and worsening wealth inequality. Beijing’s determination to roll out unprecedented property curbs is closely associated with its desire to address these challenges. At least at this moment, Beijing seems willing to sacrifice some growth stability for achieving these long-term targets, namely less dependence on foreign high-tech goods, achieving a higher birth rate and reducing wealth inequality.
Nomura | Asia Special Report 24 August 2021
4

High home prices are the largest of “the three mountains”In China, it has been said that the cost of housing, healthcare, and education are the "three large mountains" burdening Chinese families, and surely the surging home prices of the past two decades have made housing the largest mountain of the three. Beijing has recently compromised the K-12 off-campus tutoring sector to lighten the burden on middle-class households and is now taking steps to move the largest mountain – high home prices – and the property curbs are set to have a much more significant impact on China’s economy and financial markets.
Be prepared for a sharp growth slowdownIn coming months, we expect China’s GDP growth to drop significantly, driven by the latest wave of Covid-19 (the delta variant), slowing exports, property tightening and the campaign to reduce carbon emissions (see China: Revising down H2 growth forecasts on effects from the Covid-19 delta variant, 3 August 2021). The property sector may once again be at centre stage, testing the nerves of both China’s government and global investors. Markets should be prepared for what could be a much worse-than-expected growth slowdown, more loan and bond defaults, and potential stock market turmoil.
China’s property sector is the single largest contributor to the country’s GDP. If we further add government land sales revenues paid by developers, the property market’s total contribution would comprise around 25.0% of China’s GDP. The importance of the property sector to public finance is even more significant; we estimate it accounted for 44.0% of total government revenue (TGR). The ongoing property curbs have already significantly slowed the growth of credit supply to the property sector, and we have seen early signs of weakness in major property-related indicators. We expect China’s year-on-year real GDP growth to drop from 7.9% in Q2 to 5.1% in Q3 and 4.4% in Q4, due partly to the slowdown in the property sector (Figure 2). We forecast 2022 GDP growth of 5.1% and believe risks are more skewed to the downside. Beijing might have to lower its growth target for 2022 (this year’s target is “above 6.0%”).
Public housing in not the answer, at least in the near termIn the face of the incoming growth slowdown, Beijing is very likely to ease its grip on government financing, even if it means a rise in hidden debt, to further correct some of the overly aggressive measures under the carbon emission campaign (especially after the Winter Olympic Games in February 2022) and step up monetary and fiscal easing. However, the void left by property tightening, new waves of the Covid-19 delta variant, slowing exports and the carbon emission campaign may be too large to fill. Markets now once again expect Beijing to significantly increase investment in public housing, and Beijing seems to be working on this, but we believe public housing is unlikely to offset the slowdown the in the property sector for the following reasons.
First, most local governments are financially stretched, especially as land sales revenues have shrunk thanks to the credit tightening measures imposed on the property sector. We expect Beijing to step up its fiscal support to local governments, but the annual fiscal deficit is determined once a year at the March National People’s Congress conference, and we believe Beijing is unlikely to raise fiscal deficit targets before that. Even in March next year, in view of Beijing’s conservative nature, there is little room for a significant increase in the fiscal deficit. On hidden debt born by local government financing vehicles (LGFVs), Beijing will very likely ease its recently tightened grip. If this materializes, it would, together with Beijing’s tolerance of excessive local government borrowing, likely squeeze financial flows to the high-end manufacturing sector, undermining Beijing’s aim to contain the property sector.
Second, determining where to build public housing and how to allocate printed money can be quite political and controversial, especially amid the once-in-a-decade personnel change, which is set to take place within the next one and a half years.
Third, Beijing has learned a valuable lesson from its previous attempt at using printed money to support the property sector (see China: Helicopter money for low-tier cities, 13 August 2018). In the cash-backed shantytown renovation program (SRP), RMB3.6trn of funds were printed by the People’s Bank of China (PBoC; at its peak in November 2019) via the so-called pledged supplementary lending (PSL), distributed by the China Development Bank (CDB; the largest policy bank in the world), and a majority of those funds were allocated administratively to low-tier cities as cash compensation for homes demolished in relatively less developed areas. Many developers benefited handsomely, home prices in low-tier cities jumped, debt burdens of both households and local
Nomura | Asia Special Report 24 August 2021
5

governments surged, but many of the new homes built in these low-tier cities remain empty, as buyers can only live in the larger cities where they make a living. As this cash-compensation program represented a large stimulus for the property markets, Beijing is unlikely to re-launch it.
The end game: Common prosperity, property tax and public housingIn a meeting at the Chinese Communist Party’s (CCP) Central Financial and Economic Affairs Commission on 17 August 2021, President Xi Jinping called for “regulating excessively high incomes and encouraging high-income groups and enterprises to give back more to society”. President Xi emphasized that his ruling party allowed some to “get rich first” in the early years of China’s reform and opening up, and it was time to shift towards a paradigm of “common prosperity for all”. As achieving common prosperity becomes a top “Basic National Policy”, we believe it will become increasingly difficult for Beijing to reverse its current property curbs, and we expect it to introduce a nationwide property tax in the next few years. As we discuss below, home ownership is a root cause of wealth inequality in China.
There has been another push to levy a national property tax. As the ongoing property sector curbs will likely to reduce local government revenue from the property sector, Beijing will need to find new financial sources for these local governments, and expanding the property tax from its trial programs in Shanghai and Chongqing to the whole of China is one possible solution. While we expect the nationwide imposition of a property tax, we believe the tax rate will be quite low initially and may only be levied on second or third homes. Even so, it may dent property markets further.
Public housing is a long-term solutionBy contrast, although we argue above that public housing is unlikely to be the near-term solution, regardless of whether it is sold or made available to rent, it will highly likely comprise a larger share of China’s housing market over the longer term. On many occasions in the past few years, Beijing has vowed to improve the housing situation in urban areas by speeding up the availability of affordable rental properties (targeting low-income households), especially in large cities that are experiencing net population inflows. In the guidelines issued in early July this year, the State Council pledged to provide more policy support for affordable rental housing markets, including more favorable land supply policies, easier approval processes, more fiscal subsidies and some tax waivers. At a press conference on 22 July, the State Council unveiled its plan to build 930,000 affordable rental housing units in 40 pilot cities this year and, during the 14th five-year plan (2021-25), it has stipulated that new affordable rental housing units should reach 30% of new residential homes supplied in cities with more young migrants and higher home prices.
Beijing has highlighted the role of public housing since the last decade and made some policy efforts in recent years, but so far has had limited success. As we discuss above, we believe Beijing is unlikely to introduce a massive program in the near term to offset the ongoing property curbs. However, we also believe it has become more determined than before, and top leaders are looking to public housing markets in Germany, Singapore, and Hong Kong for inspiration. Beijing does not yet have a mature and comprehensive plan on public housing, but we believe that, like the property tax, Beijing is actively organizing these plans. We are unsure what the eventual impact of the public housing program will be but believe market forces will recede to some extent in coming years on the provision of urban housing for Chinese households.
This could represent China’s “Volcker moment”During the late 1970s, the US suffered from double-digit CPI inflation and a stagnating economy. Paul Volcker, then Fed Chairman, dramatically changed how monetary policy was conducted by directly targeting money supply and pushing up interest rates to 20%. The US economy dived into a recession, the unemployment rate surged to more than 10% and the Fed was under strong pressure. However, the Fed’s strategy worked; the wage-price spirals were finally broken, inflation expectations were suppressed, and inflation was tamed, paving the way for prosperity over the subsequent two decades.
Beijing also wants to completely break purchaser expectations that home prices will continuously rise. Over the past two decades, a “home prices – credit expansion spiral” has developed and been cemented in the minds of property investors. People believe home prices will always rise, as they have funneled a majority of their savings and borrowed heavily to buy homes. Developers have seized on the surge in demand, and local governments’ have made land sales their major source of revenue. The property
Nomura | Asia Special Report 24 August 2021
6

sector has become too big to fail and, whenever economic growth has slowed, Beijing and the PBoC have always come to the rescue by providing stimulus to the property sector. This has resulted in the channeling of an increasingly higher percentage of national savings and financial resources into the property sector, squeezing investment in other sectors such as chip making, which is a focus of Beijing.
We believe Beijing is determined to embrace its own Volcker moment by breaking this “home prices – credit expansion spiral” after failing to tame the surge in home prices for the past decade. For Beijing, we believe seeking long-term economic, social, and political goals now trumps short-term growth stability, so it is determined to limit home price inflation and rein in the rapid expansion of the property sector. In coming months, China’s GDP growth may drop significantly on both the property curbs and other factors, including new Covid-19 variants, and the property sector may once again be a key focus. Markets should prepare for a likely marked growth slowdown, increased developer defaults and home foreclosures, and perhaps some stock market turmoil.
In the best case, we believe that, after several painful quarters of low economic growth, the current property curbs will allow Beijing to successfully anchor Chinese household home price expectations at a low level, reduce funding costs for the whole economy, drive more savings into R&D and high-end manufacturing and achieve high, more sustainable and more inclusive growth. However, there is no guarantee of success for this strategy and the road to prosperity could be quite bumpy.
Structure of the rest of this reportWe first discuss why this time the property tightening is likely to be different. We then look at some early signs of the property sector slowdown. As Beijing has focused on capping credit supply to the property market for this round of tightening, we provide some key updates on the funding situation for both developers and home buyers. We conclude the report by briefly discussing the near-term economic impact of the ongoing property curbs.
Nomura | Asia Special Report 24 August 2021
7

Why it is different this timeOver the past two decades, Beijing used property sector policies as a tool for Keynesian-style demand management. When the economy was overheating, Beijing introduced tightening measures on the property sector to cool the economy. By contrast, when growth dropped to worrying levels, Beijing eased those tightening measures or even rolled out property market stimulus measures to bolster economic growth. This time, however, we expect a complete departure from this behaviour. We believe markets may need to lower their expectations for an easing of property curbs (at least before spring 2022) and should prepare for a hit to the economy and financial markets from a decline in property markets.
We see three main reasons why Beijing is likely to be much more resolute in tightening its stance on property markets. First, Beijing believes the property curbs will contribute to national security, raising the birth rate and narrowing the wealth gap, all of which are strategically important. Second, as Beijing realizes many major developers are essentially highly leveraged financial intermediaries, it will likely intervene directly in the financial sector to rein in credit supply to the property sector. Third, amid the extensive rhetoric and the substantial pressure on local governments, the scope for Beijing to withdraw those curbs appears limited. Incoming personnel changes that are set to take place around the ruling party’s 20th congress may also lead to a further tightening of policy across ministries and local governments.
The strategic importance of the current property curbsSince 2018, Beijing has been faced with three major challenges that are closely linked to the property sector: US-China tensions, the rapid decline in the birth rate and increasing wealth inequality. Beijing’s determination to roll out unprecedented property curbs is closely associated with its desire to address these challenges.
The escalation of US-China tensions has contributed to China’s desire for self-relianceFor Beijing’s top leaders, the worst of the damage from the US-China trade wars, which started in spring 2018, emanated not from tariff hikes but rather the restrictions on technology transfers and exports of key high-tech components to some of China’s largest manufacturing and computing companies, such as Huawei and SMIC (China’s largest semi-conductor manufacturers). As of mid-August 2021, the blacklist, which is officially called the “entity list” of the US Department of Commerce’s Bureau of Industry and Security (BIS), includes 156 Chinese companies linked to chip-making, telecom equipment, surveillance, supercomputing and military. Beijing had thought that the Biden administration may at least stop adding more Chinese companies to the entity list in 2021, but clearly this has not been the case. As recently as 9 July 2021, the BIS added 34 Chinese entities to the entity list.
For China’s top leaders, those export restrictions were a rude awakening and undermined their existing growth strategies. They are confident that “the east is rising and the west is falling”, that the Chinese economy will overtake the US as the world’s largest within a decade, and the US will try to suppress China’s economic rise and growth potential. We believe the key national strategy is to be self-reliant on key high-tech goods such as chips, and this can only be achieved through ramping up investment in the semiconductor sector. China’s government appears set to take the lead by mobilizing its state-owned enterprises (SOEs) and state-owned research institutions, but it still needs the market to get the much more efficient private sector involved. To do this, it needs to find various ways to redistribute resources to the hard-tech sector, and the financial sector is very likely to play a key role.
For Beijing’s policymakers, to boost investment in hard tech, the major roadblock is the property sector, which has consumed too much savings and has pushed up interest rates. Since the global financial crisis, Beijing has extensively relied on the property sector to bolster the whole of China’s economy. During typical easing cycles, Beijing’s financial regulators have turned on the credit tap to home buyers and developers. These buyers and developers, in turn, hand over a majority of their proceeds to local governments, which then build infrastructure, public buildings and industrial parks. For example, at the peak of the easing cycle in Q4 2016, 54% of bank loans went to the property sector (Figure 3). If we take into account the shadow banking sector, the percentage of financial
Nomura | Asia Special Report 24 August 2021
8
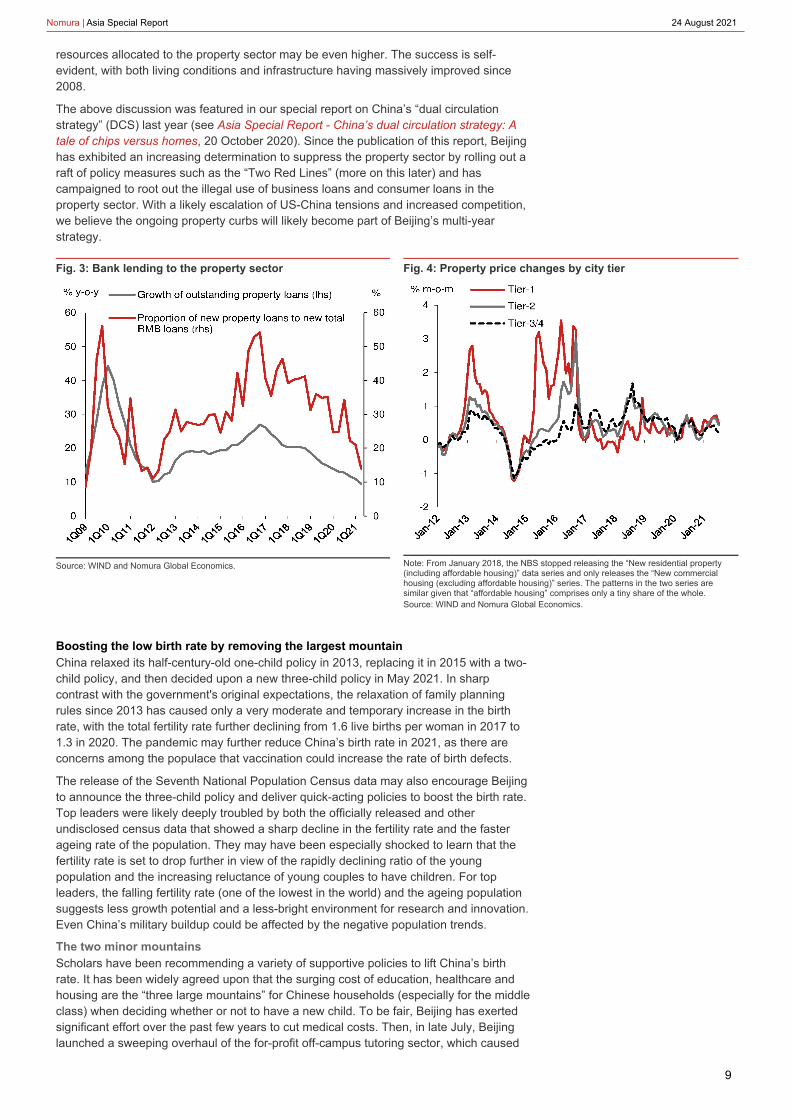
resources allocated to the property sector may be even higher. The success is self-evident, with both living conditions and infrastructure having massively improved since 2008.
The above discussion was featured in our special report on China’s “dual circulation strategy” (DCS) last year (see Asia Special Report - China’s dual circulation strategy: A tale of chips versus homes, 20 October 2020). Since the publication of this report, Beijing has exhibited an increasing determination to suppress the property sector by rolling out a raft of policy measures such as the “Two Red Lines” (more on this later) and has campaigned to root out the illegal use of business loans and consumer loans in the property sector. With a likely escalation of US-China tensions and increased competition, we believe the ongoing property curbs will likely become part of Beijing’s multi-year strategy.
Fig. 3: Bank lending to the property sector
Source: WIND and Nomura Global Economics.
Fig. 4: Property price changes by city tier
Note: From January 2018, the NBS stopped releasing the “New residential property (including affordable housing)” data series and only releases the “New commercial housing (excluding affordable housing)” series. The patterns in the two series are similar given that “affordable housing” comprises only a tiny share of the whole.Source: WIND and Nomura Global Economics.
Boosting the low birth rate by removing the largest mountainChina relaxed its half-century-old one-child policy in 2013, replacing it in 2015 with a two-child policy, and then decided upon a new three-child policy in May 2021. In sharp contrast with the government's original expectations, the relaxation of family planning rules since 2013 has caused only a very moderate and temporary increase in the birth rate, with the total fertility rate further declining from 1.6 live births per woman in 2017 to 1.3 in 2020. The pandemic may further reduce China’s birth rate in 2021, as there are concerns among the populace that vaccination could increase the rate of birth defects.
The release of the Seventh National Population Census data may also encourage Beijing to announce the three-child policy and deliver quick-acting policies to boost the birth rate. Top leaders were likely deeply troubled by both the officially released and other undisclosed census data that showed a sharp decline in the fertility rate and the faster ageing rate of the population. They may have been especially shocked to learn that the fertility rate is set to drop further in view of the rapidly declining ratio of the young population and the increasing reluctance of young couples to have children. For top leaders, the falling fertility rate (one of the lowest in the world) and the ageing population suggests less growth potential and a less-bright environment for research and innovation. Even China’s military buildup could be affected by the negative population trends.
The two minor mountainsScholars have been recommending a variety of supportive policies to lift China’s birth rate. It has been widely agreed upon that the surging cost of education, healthcare and housing are the “three large mountains” for Chinese households (especially for the middle class) when deciding whether or not to have a new child. To be fair, Beijing has exerted significant effort over the past few years to cut medical costs. Then, in late July, Beijing launched a sweeping overhaul of the for-profit off-campus tutoring sector, which caused
Nomura | Asia Special Report 24 August 2021
9

the market value of the sector to decline precipitously in just a few days. We have yet to see whether such a crackdown will truly reduce education costs and the concerns of Chinese families. Although this is not the focus of this report, it shows that Beijing is truly committed to finding ways to boost the birth rate after decades of limiting population growth.
The largest mountainHowever, healthcare and education are the two smallest of the “three large mountains”. The largest mountain, at least for the middle class in large cities, is surging housing costs. According to a comprehensive study by Li Sun of University of Leeds , “…private housing is significantly unaffordable in Chinese cities with a house price-to-annual household income ratio (HPIR) of 7.2 and rent-to-monthly household income ratio (RIR) of 34%, both of which are considerably higher than the value of affordability (HPIR ≤ 3.0, RIR ≤ 25%). Tier-1 cities have an average HPIR of 14, with Beijing (16.9), Shenzhen (15.0), Shanghai (14.2), Guangzhou (12.5) all being multitudes higher than 3.0. The average HPIR of Tier-2 cities was 7.9, and upon further analysis it was found that their geographical location is an important variable, with eastern cities’ average HPIR (9.2) being significantly higher than that of inland cities (5.5). The HPIRs of Tier-3, Tier-4 and Tier-5 cities are very similar, and slightly higher than 5. Therefore, it is reasonable to argue that although all 30 cities’ HPIRs are above 3.0, the affordability crisis is centered in the very extremely unaffordable Tier-1 and Tier-2 cities located in eastern China.”
Why are urban homes so expensive?There are many reasons why home prices are high in China. In our view, in addition to the rapid credit growth over the past two decades, Beijing’s tight controls over land supply for residential use to keep land for farming, the non-market-based distribution of urban residential land and local governments’ monopolistic behaviour of maximizing land sales revenue are the three major factors behind surging urban home prices, especially in large cities. Limiting nationwide urban residential land supply has resulted in elevated national average home prices. Administrative and less discretionary urban residential land quota allocations have resulted in exorbitant home prices in those fast-expanding large cities. Finally, as China’s local governments generally receive almost one-third of their revenues from land sales, their monopolistic pricing of residential land has led to higher home prices.
Why does the home rental market remain small?Still, as rentals appear more affordable, why are people not renting homes? There are many explanations, including the competition for wives in view of the severe gender imbalance (e.g., Wei and Zhang (2011) ). One factor is directly linked to another “mountain” – access to urban schools. Over the past two decades, Chinese local governments have extensively used property markets as a channel to redistribute household savings to government coffers. For low-tier cities, access to urban high-quality schools were linked to Hukou, which refers to the registration of an individual in the local system and could only be obtained by purchasing urban homes. For larger cities, access to particular K-12 school districts were almost entirely linked to home ownership. The excessive bundling of K-12 schools with home ownership has pushed up home prices by squeezing Chinese households’ savings to purchase urban homes and has been the major cause of exorbitant housing costs for Chinese households.
Achieving “common prosperity”The widening of income and wealth inequality, as well as limited social mobility over the past couple of decades, is well documented. It is also a consensus among scholars that housing is the single largest contributor to wealth inequality. According to Wan, Wang and Wu (2021) , housing is responsible for about 70% of total wealth inequality, and its contribution has been increasing over time. The Covid-19 pandemic has significantly strengthened this trend. Despite China’s impressive success in containing the pandemic and reviving its economy, low-income workers have suffered disproportionately, as evidenced by the 2.7% fall in migrant workers in 2020 (versus 0.9% growth in 2019). Urban home prices have risen further during the pandemic, with average home prices of Tier-1, Tier-2 and Tier-3/4 cities rising by 8.3%, 7.0% and 6.3%, respectively, from end-2019 to July 2021 (Figure 4).
We believe China’s leaders will be more concerned about the wealth inequality issue in coming years for the following reasons.
First, falling social mobility, as a result of widening wealth inequality, is sowing the •
Nomura | Asia Special Report 24 August 2021
10

seeds of discontent, especially among younger people, who have higher expectations after observing the vast amounts of wealth accumulated in cities. This kind of disenchantment and dissatisfaction is only likely to worsen with the expected slowdown in economic growth. The “lying flat” movement, which calls on young people to opt out of the struggle for workplace success and to resist the attractions of consumer fulfilment, is a direct extension of this discontent.
Second, as China's elite politicians begin preparations for the political reshuffle (which happens only once every five or even 10 years and is due in October 2022), making conspicuous attempts to address social justice issues is very important, especially as the government has proclaimed that it has already eradicated poverty and is aiming to build a more equal society of “common prosperity”.
•
Third, the escalating tensions between China and the US (and several other developed nations) have forced China’s leaders to try to increase their support from a broader portion of the domestic populace. Building a fairer and more equal society by seeking common prosperity is a natural choice for experienced political leaders facing increasingly high pressure from foreign powers.
•
As housing is responsible for more than two-thirds of China’s wealth inequality, containing the rapid rise in home prices and providing affordable housing have become key tasks for Beijing’s top leaders. For local government officials, the issue is much more complicated, as land sales account for one-third of their revenues, but the importance of this task was likely made clear after top officials in Shenzhen were sacked earlier this year due to their failure to stem skyrocketing home prices. We believe many prescient local politicians also see the change of mentality and scorecard in Beijing, especially as they need to perform well during the personnel change in 2022.
President Xi’s latest emphasis on common prosperityIn a meeting of the CCP’s Central Financial and Economic Affairs Commission on 17 August 2021, President Xi Jinping called for “regulating excessively high incomes and encouraging high-income groups and enterprises to return more to society”. President Xi emphasized that his ruling party had allowed some people to “get rich first” in the early years of China’s reform and opening period, and it was now shifting to “common prosperity for all”. As achieving common prosperity becomes a top “Basic National Policy”, we believe it will become increasingly difficult for Beijing to reverse the current property curbs. We expect Beijing to introduce a nationwide property tax in the next few years, which could dent property markets further.
Turning off the credit tapFor this round of property tightening, Beijing is not only much more determined, but we believe it is also likely to employ a completely new strategy. In the past, Beijing’s tightening has focused on three areas: 1) household qualifications for home purchases and sales, as well as qualifications for mortgage loan applications; 2) the down-payment ratio and mortgage rates; and 3) taxes imposed on property transactions. The PBoC has always maintained its monetary policies in line with those easing and tightening cycles, but the PBoC and other financial regulators rarely intervened specifically on how much developers and home buyers can borrow and how much banks (and other lenders) can lend to developers and home buyers.
Again, this time it’s different. As Beijing has realized that many major developers are essentially highly leveraged financial intermediaries, it has now directly focused on reining in credit supply to the property sector. More specifically, Beijing is taking a three-pronged approach. First, it imposed its “Three Red Lines” to restrict developer leverage. Then, at end-2020, Beijing introduced the “Two Red Lines” to cap bank lending to the property sector. This year, Beijing stepped up its crackdown on the misuse of commercial loans and consumer loans in the property sector, and further tightened the use of shadow banking channels (such as trust loans, entrusted loans and commercial paper) by developers.
The “Three Red Lines”Although China’s financial regulators have not yet made an official announcement of the “Three Red Lines” to the public, according to many reputable media reports, including the Securities Times , the rules have been in effect since September 2020 for some key developers, requiring them to achieve their targets to lower debt levels by end-June 2023.
Nomura | Asia Special Report 24 August 2021
11

In subsequent quarters, the “Three Red Lines” have been extended to a wider range of developers (including more small and medium-sized developers) and debt financing tools (including IOUs, which have been used by some developers as a channel to disguise debt).
Why Beijing is so determined to curb financing to property marketsBeijing is very concerned about the rapid rise in property sector debt for two main reasons. First, the excessively rapid accumulation of property-related debt by households and developers may trigger a systemic financial crisis if and when property prices experience a sustained decline. Second, this rapid accumulation of debt is unsustainable and crowding out funding that could instead be allocated to more sustainable and efficient uses such as investment in high-end manufacturing and household consumption.
More details on the “Three Red Lines”These “Three Red Lines” include: 1) a 70% upper debt-to-asset ratio limit after excluding advance receipts (“Red Line 1”); 2) a 100% upper net debt ratio limit (“Red Line 2”); and 3) a 100% lower cash-to-short-term-debt ratio limit (“Red Line 3”). The more red lines developers breach, the tighter regulations they will face when borrowing in subsequent years. Based on our sample of 116 listed developers using 2020 data, we estimate 61.2% of developers (=71/116) will be directly affected by the “Three Red Lines”, as they breach at least one of these lines; we further estimate that 28.4% of developers breach at least two and 12.1% breach all three. In addition, Red Line 1 is breached by 40.5% of total developers in the sample, while Red Lines 2 and 3 are breached by 23.3% and 37.9%, respectively (Figure 5).
Fig. 5: The share of listed property developers that breach different sets of Red Lines
#1 & #2 #2 & #3 #1 & #3
#1
a 70% upper limit on debt-to-
asset ratio after excluding
advance receipts
40.5 18.1
#2a 100% upper limit on net
debt ratio23.3
#3a 100% lower limit on cash-to-
short-term-debt ratio37.9 18.1
38.8
21.6
12.1
12.9
Red
LineRestrictions
% of listed property developers that breach different sets of Red Lines (among 116
listed developers)
x0 x1x2
x3
Note: Our estimates are based on financial data of listed Chinese property developers in A-share markets in 2020.Source: WIND and Nomura Global Economics.
The “Two Red Lines”At end-2020, the PBoC and the China Banking and Insurance Regulatory Commission (CBIRC) jointly announced that they would establish a concentration management system (CMS) for bank property loans (see China: Regulators set caps for banks’ property loans , 3 January 2021). Specifically, The CMS set tier-based caps for a proportion of outstanding property loans (including mortgage loans) to total RMB loans at five different bank tiers, effective 1 January 2021. Specifically, for large banks, the proportion of outstanding property and mortgage loans to total RMB loans is capped at 40.0% and 32.5%, respectively. For medium-sized banks, the proportion of outstanding property and mortgage loans to total RMB loans is capped at 27.5% and 20.0%, respectively. The caps for smaller banks are much lower.
By our calculation, the “Two Red Lines” suggest the ratio of outstanding property loans to total RMB loans is 32.0%, which is higher than the actual reading of 28.0% at end-Q2 2021. However, this does not mean the “Two Red Lines” are not binding simply because quite a few banks have already breached their respective upper limits. Since the beginning of this year, an increasing number of large cities, such as Shanghai and Wuhan, have started to tighten their mortgage policies for second homes purchases to meet the requirement set by the “Two Red Lines”. We believe some small and medium-sized banks, which have significantly increased their reliance on the property sector during 2015-18 (see China: Helicopter money for low-tier cities , 13 August 2018), may face even more difficulties in meeting the “Two Red Lines”.
Nomura | Asia Special Report 24 August 2021
12

Curbing developers’ financing through bonds and shadow banking productsThe “Two Red Lines” impose restrictions on how much commercial banks can lend to the property sector. But developers also have access to the shadow banking and bond markets, while home buyers may illegally fund their home purchase through bank loans designated for other purposes. These loopholes were effectively plugged earlier this year.
On developer bond financing, according to a 13 August 2020 report by 21st Century Business Herald , the National Association of Financial Market Institutional Investors (NAFMII, a PBoC-backed body that oversees the interbank market) issued new guidelines capping developer bond issuance at 70-90% of maturing debt, forcing developers to reduce their bonds outstanding. Before this, rolling over maturing bonds was not difficult. For offshore bond financing, the National Development and Reform Commission (NDRC) tightened its policies on developers in July 2019 by requiring their offshore bond issuance to only be used to replace their medium- to long-term debt maturing within one year.
On shadow bank financing, Beijing has further tightened policies on this channel over the past year. In May 2020, the CBIRC issued an order requiring the share of capital trust investment on a single non-standard credit asset (NSCA) be no higher than 30% of the trust company’s net assets, and the share of total NSCA investment in all assembled trust products be no higher than 50% of the total funds in these trust products. As the lion’s share of trust product funds has been allocated to the property sector and LGFVs, tighter restrictions on trust products have directly weighed on developer trust product financing.
Tightening financing via some stealthy financing channelsChina’s financial regulators have also tightened other obscure funding sources for the property sector, including misused loans, IOUs and property-related private equity funds.
Cracking down on the misuse of consumer and business loans in property marketsSince February 2021, an increasing number of local financial regulators, including those in Beijing, Shanghai and Guangdong, began inspecting for the misuse of business and consumers loans in the property sector. In a 26 March announcement this year, the PBoC, CBIRC and Ministry of Housing and Urban-Rural Development (MOHURD) jointly implemented policy measures to prevent the misuse of business loans in the property sector, including strengthening the screening of borrowers, employing “see-through rules” to track the use of business loans, and increasing the penalties for business misconduct.
The rise and fall of developer IOU financingIOUs (also known in China as OTC commercial bills) were less captured by Beijing’s regulatory framework for property sector financing and thus have been used by some developers as a channel to disguise debt on their balance sheets. For developers that breach Beijing’s “Three Red Lines” and face constraints on growing their debt, IOUs provide a channel to pass their cash-flow pressures on to upstream suppliers (e.g., suppliers of construction materials, furniture and home appliances), which usually have limited bargaining power when dealing with developers.
Developers over the past year have become increasingly reliant on IOU financing to deal with Beijing’s tightening measures in the sector. According to the Securities Times , the amount of repaid IOUs by developers totaled RMB367bn in 2020, which represents a 36.2% increase from 2019. It has been widely reported that some developers have delayed the repayment of their maturing IOUs this year, challenging the cash-flow conditions of their upstream suppliers. To fill the loophole in its regulatory framework for property sector financing, Beijing has recently extended its “Three Red Lines” to IOU financing.
Curbing financing via property-related private equity fundsIn the past, property-related private equity funds were sometimes, if not frequently, used to disguise developer debt in the form of equity investment. According to the 21st Century Business Herald quoting estimates from industry experts, the outstanding asset under management (AUM) of property-related private equity funds were around RMB2trn in 2020. According to a recent report from Bloomberg , the Asset Management Association of China (AMAC), an industry self-disciplinary body under the supervision of the China Securities Regulatory Commission (CSRC), verbally informed private equity firms that they will not be allowed to set up new funds to invest in property-related projects; applications that have already been submitted will also be denied, while existing funds would not be affected. These tightening measures, if confirmed, should exert more downward pressure on developer financing.
Nomura | Asia Special Report 24 August 2021
13

Crossing the RubiconWe see little room for Beijing to backtrack on its current round of curbs. First, Beijing has increasingly reiterated its determination at all top-level meetings and has frequently featured these curbs in major state-owned media. Second, ministries and local governments have been fully mobilized and pressured to toe the party line on property curbs. Third, the incoming personnel changes expected during the ruling party’s 20th congress may also ratchet up tightening across ministries and local governments.
Property curbs have become “Basic National Policy”As top leaders have reached consensus on tightening the property sector while building more state-sponsored public housing, reining in the private property markets has also achieved the status of “Basic National Policy”, a status reserved for only the most critical strategic policies, such as the one-child policy; these policies cannot not be easily revised.
Top-level party and government agencies have rarely missed highlighting their determination to limit property sector growth. At its recently concluded mid-year Politburo meeting, top leaders once again emphasized their motto that “housing is for living in, not for speculation” and requested “stabilizing housing prices, land prices, and expectations”. In a video conference just before this meeting, Vice Premier Han Zheng, who is also a member of the CCP standing committee, said that China will not use the property market as a vehicle for short-term economic stimulus and that local governments should strictly control financing for developers, including bank loans.
Unprecedented mobilization at both ministerial and local government levelsOther than directly restricting credit supply to the property sector, the central government has also significantly mobilized ministries and local governments. The recent mobilization is unprecedented, considering the strategic importance attached to these property curbs, the very proactive enforcement of the central government’s home prices monitoring mechanism and the competition for influence among ministries and local governments amid the once-in-a-decade personnel change. In our view, these numerous policies promulgated at the local and ministerial level will likely be quite difficult to reverse. Here, we list the property tightening measures rolled out in the past couple of months.
The PBoC’s Shanghai headquarters held a meeting on 23 July with Shanghai-based banks and/or their local branches. Following the meeting, according to the China Securities Journal , mortgage rates for first-time buyers were raised from 4.65% to 5.00%, and mortgage rates for non-first-time buyers were raised from 5.25% to 5.70%, effective 24 July (see China: Property-related policies have been tightened further, 25 July 2021). We expect Shanghai’s mortgage rate hike to be applied to other first and second-tier cities, loopholes in other cities to be closed and China’s central government to maintain or even introduce new property-related tightening measures, even though China’s economy faces a significant slowdown in coming quarters.
•
On 23 July, Shanghai’s housing authority issued a notice outlining strengthened regulations on property gifting to improve the effectiveness of restrictions on home purchases.
•
Also on 23 July, eight major property market-related policymaking bodies issued an order to further strengthen regulations on property market activities (broadly covering property development, home sales, housing renting and property management services). These regulators emphasized that they will increase the penalties for developer business misconduct, increase supervision and impose tighter regulations for developers that default on debt repayments, delay the delivery of pre-sold new homes and/or elicit other negative news or market concerns.
•
More cities have tightened their controls on home and land pricesIn addition to direct curbs on property sector financing, an increasing number of Chinese cities have stepped up efforts to contain their local housing prices, as the curb on housing prices will likely discourage households from home purchases and then weigh on developers’ new home sales and, in turn, their funding conditions. Based on our estimates, outstanding funds from new home presales accounted for 25.7% of outstanding developer financing at end-Q2 2021.
For example, Shenzhen, Ningbo and Chengdu, among a few others, have in recent months launched a new mechanism to set guidance prices for banks to follow when
Nomura | Asia Special Report 24 August 2021
14

approving mortgage loans, in an effort to directly intervene in home-sale values. Wuhan, the capital city of central China’s Hubei province, even introduced a “housing ticket” system to contain property market speculation; under this plan, only applicants that have been issued a “housing ticket” can register to buy property and only in one residential project. This is reminiscent of the food ration coupons (known as Liangpiao in Chinese) during the planned economy era in China (mainly prior to China’s reform and opening-up policies in the late-1970s).
Beijing has also intervened in land markets by launching the concentrated land supply scheme in some large pilot cities this year and imposing curbs on land prices (e.g., an upper limit of 15% for the land price premium). Through these restrictive measures on home and land prices, the central and local governments can directly control developers’ mark-ups (or profit margins) to a degree.
Nomura | Asia Special Report 24 August 2021
15

Early signs of a slowing property sectorChina’s property market is not crashing thanks to the PBoC's relatively easy monetary policy stance, which has been in place since January 2020, the fear of higher inflation, the speedy recovery of China’s economy, and a preference for better and larger homes amid the pandemic (as people spend more time at home). However, this is not a reason for complacency, as there is usually a lag between tightening measures and its consequences. We have already seen several early signs of weakness pointing to a much more significant decline in coming months. In this section we provide a short review of these early signs.
To adjust for the Covid-related base effects in 2020, we focus on annualized growth between 2019 and 2021 (annualized 2y-o-2y growth). Overall, land sales volume, the strongest leading indicator for the whole property sector and the most sensitive indicator to funding conditions of developers, weakened materially in the first seven months of this year, and its weakness has already been reflected in new home starts. Land sales value has been holding up relatively well, especially in Q2, as large cities, where land is much more expensive, started auctioning land under the new centralized land supply scheme. However, as land authorities have recently adjusted land auction rules on the centralized land supply scheme, land sales in large cities may also cool in H2.
Due to the restricted quota for mortgage loans, new home sales volumes and values have also started to weaken in recent months, with the weakness concentrated mainly in lower-tier cities. For more lagged property-related indicators, including property construction investment, homes under construction and new home completions, their resilience has largely endured through Q2, as developers need to speed up their construction to meet rising delivery pressures as a result of strong new-home presales in previous years. However, we have seen some early signs of weakening for those more lagged property-related indicators in the latest July data.
A notable deterioration in land sales volumeAmid a significant tightening of funding conditions for developers, there has been a notable contraction in land sales volumes this year (Figure 6). On a quarterly basis, annualized 2y-o-2y land sales volume growth fell from -4.9% in Q1 to -7.3% in Q2, pointing to a more significant deterioration in recent months. In July, its annualized 2y-o-2y growth rose to 0.5% from -4.3% in June, due mainly to a low base in 2019 (July 2019: -36.8% y-o-y). Overall, annualized 2y-o-2y growth of land sales in volume terms was -5.2% over the first seven months of this year; considering the already sluggish land market in 2019 (the base period for 2y-o-2y comparison), with growth in land sales volumes of -29.4% y-o-y over the first seven months of 2019, the deterioration in land market conditions this year may be even worse.
Weak land sales volume led to weak new home startsUnder the well-known “high turnover” business model for the property sector, developers quickly develop their purchased land into new home starts and further into presales of new homes, as a stealthy way to increase their leverage. Therefore, the weakness in land sales volume is quickly reflected as slow new home starts (also reported by NSB in volume terms). Specifically, the annualized 2y-o-2y growth of new home starts remained negative over the first five months of this year before rising to a small positive rate of 2.3% in June and then dropping to -6.5% in July. On a quarterly basis, annualized 2y-o-2y growth of new home starts remained sluggish at -1.2% in Q2, despite rising from -3.4% in Q1. For the first seven months, its annualized 2y-o-2y growth remained weak at -2.7%.
Nomura | Asia Special Report 24 August 2021
16

Fig. 6: Annualized 2y-o-2y growth of property-related indicators
Source: WIND and Nomura Global Economics.
Fig. 7: WIND 100-city land sales volume: 22 pilot cities under the new centralized land supply scheme
Source: WIND and Nomura Global Economics.
Land sales revenue has been holding up better as developers favor large citiesUnlike the notable deterioration in land sales volumes, land sales value (sales revenue) has exhibited strong resilience, especially in Q2. On a quarterly basis, annualized 2y-o-2y growth of land sales value rose to 7.0% in Q2 and 15.6% in July from -17.7% in Q1, taking its annualized 2y-o-2y growth in the first seven months to 3.4%. In our view, the divergence between land sales volume and land sale value suggests developers have concentrated their land purchases in large cities, due mainly to the launch of the new centralized land supply scheme, tightening of funding conditions for developers and a cooling of property markets in small cities.
The new centralized land supply scheme: A major reason for land sales divergenceIn late-February 2021, according to Guandian , a property intelligence provider, China’s Ministry of Natural Resources announced the launch of a new centralized land supply scheme in 22 pilot cities, including four Tier-1 cities and 18 Tier-2 cities. Under the new scheme, local governments are now required to release land supply, bidding no more than three batches in a year. According to land supply information from local governments, since April, 22 pilot cities have successively launched the new centralized land supply scheme.
As funding conditions for the property sector have been broadly tightened by the “Five Red Lines”, developers have responded to the new land supply scheme by concentrating their funding on bids for land in large cities, while their land purchases plans in small cities have been squeezed. The divergence between large and small cities may be quite worrying. According to city-level land sales data for the WIND 100-city sample, we estimate annualized 2y-o-2y growth in land sales volume in the 22 pilot cities jumped to 10.7% in Q2 from -14.8% in Q1, while for the remaining 78 cities in the 100-city sample, their annualized 2y-o-2y growth dropped to -6.6% from -4.0% over the same period.
This mechanism of favoring large cities and squeezing small cities stands in sharp contrast with the cash settlement of the shantytown renovation program (SRP) backed by the PBoC’s outright money printing between 2015 and 2019 (see China: Helicopter money for low-tier cities, 13 August 2018). In this program, Beijing used its administrative powers to distribute credit from the PBoC to low-tier cities, stimulating the property development in those cities. Between January 2020 and July 2021, the PBoC withdrew RMB522bn from the cash-backed SRP, taking the outstanding PSL down to RMB3.0trn from RMB3.5trn. We believe the withdrawal of this program and the concentration of developer funds in bids for land in large cities will further exacerbate the fiscal divergence between large and small cities.
Even land markets in large cities appear set to cool in H2The rising land prices from those auctions in large cities have quickly gained the attention of policymakers. On 22 July, Vice Premier Han Zheng called for increased efforts to establish a mechanism to stabilize land prices, improve the land auction system and build
Nomura | Asia Special Report 24 August 2021
17

an effective system for monitoring funds used for land purchases. The land authorities have also adjusted the auction rules of the centralized land supply scheme to cool land markets in large cities. In early August, according to Leju , a property intelligence provider, the second batch of centralized land supply in several large cities, including Tianjin, Shenzhen, Qingdao and Shanghai, has been delayed.
Moreover, according to the Economic Observer, the Ministry of Natural Resources has recently adjusted the auction rules for the centralized land supply in large cities. Specifically, the adjusted rules cap the land premium rate at 15%, and land bidding will be decided in the form of a lottery when the upper price limit is reached. In addition to auction rules, the land authorities also plan to strengthen investigations into the sources of funds for land purchases. We believe these adjusted rules in the centralized land supply scheme will materially constrain land markets in large cities.
In addition, based on city-level land sales data for the WIND 100-city sample, we estimate annualized 2y-o-2y growth of land sales volume in the 22 pilot cities slumped to -40.0% in July from 12.8% in June (Figure 7), while annualized 2y-o-2y growth in the remaining 78 cities in the 100-city sample fell less notably to -5.4% from -0.3% over the same period. This suggests a notable worsening of land market conditions in large cities.
New home sales also have started to weakenChina’s new home sales have recovered rapidly since the reopening of the economy in Q2 2020, thanks to the Covid-related monetary stimulus and rising inflation expectations. However, amid the new tier-based Red Lines on bank lending to the property sector and rising mortgage rates, new home sales have started to show early signs of weakening. Annualized 2y-o-2y new home sales growth in volume and value terms slowed from 9.9% and 19.1% in Q1, respectively to 7.0% and 11.8% in Q2, and dropped notably to 0.1% and 4.1% in July. For high-frequency data in August, based on daily new home sales for the 30-city sample collected by WIND, we estimate its annualized 2y-o-2y growth dropped to -6.1% during 1-22 August from 3.4% in July.
Evidence from the funding front suggests a visible deterioration in new home sales. According to a breakdown of monthly new bank loans data released by the PBoC, the medium- to long-term component of new household loans (mostly mortgage loans) dipped to RMB397bn in July (Figure 8), the weakest July print in the past five years. In terms of outstanding mortgage loans, their year-on-year growth dipped to 13.0% y-o-y at end-Q2 2021, after staying unchanged from end-Q4 2020 to end-Q1 2021 at 14.5%. The 13.0% print marked the lowest growth since end-Q4 2012. Accordingly, the share of outstanding mortgage loans in overall bank loans edged down to 19.7% at end-Q2 2021 from 19.8% at end-Q1 2021 and 20.0% at end-Q4 2020.
Fig. 8: New household loans: medium- to long-term
Source: WIND and Nomura Global Economics.
Fig. 9: WIND 30-city new home sales volume by city tiers
Source: WIND and Nomura Global Economics.
Weakening new home sales are more evident in lower-tier citiesAccording to city-tier level data from the WIND 30-city sample, we estimate annualized 2y-o-2y growth in new home sales volumes in Tier-3 cities was -6.0% in July (Figure 9),
Nomura | Asia Special Report 24 August 2021
18

much weaker than the 7.9% for Tier-1 cities and 7.2% for Tier-2 cities. For high-frequency data during 1-22 August, we estimate annualized 2y-o-2y growth of new home sales volumes in Tier-1, Tier-2 and Tier-3 cities at 21.2%, -10.9% and -16.3%, respectively. The continued 2y-o-2y contraction in new home sales volumes in Tier-3 cities suggests property market conditions in lower-tier cities may have significantly worsened, likely weighed on by the tapering of the PSL-backed cash settlement of the SRP and the K-shaped recovery pattern from Covid-19.
Secondary housing markets in large cities have deterioratedAmid the widely-reported more-restricted mortgage loan quotas and the faster rise in mortgage rates for existing homes, the cooling of existing home sales appears to have been more notable in recent months, especially in Shenzhen, which has forbidden all real estate agencies from releasing quotations for existing homes since February 2021. Specifically, annualized 2y-o-2y growth in existing home sales volume slumped from 20.9% in Q1 to -21.1% in Q2, and dropped further to -32.2% in July. In Beijing and Guangzhou, annualized 2y-o-2y growth of existing home sales volumes also fell in Q2, albeit less notably, to 19.2% and 17.9%, respectively, from 27.6% and 39.1% in Q1 2021. Data on existing home sales in other cities is less frequent or of low quality.
Early signs of weakness in more lagged property indicatorsAmid still-resilient new home sales, strength in the more lagged property-related indicators, including property construction investment, homes under construction and new home completions, has been largely stable in Q2 from Q1. Specifically, annualized 2y-o-2y growth in property construction investment and new home completions rose to 9.8% and 11.5% in Q2, respectively, from 8.3% and 1.7% in Q1 2021. For homes under construction, measured in year-to-date terms, annualized 2y-o-2y growth edged up to 6.3% in June from 6.2% in May. However, with weaker land and new home sales, we have seen early signs of weakness in those more lagged property indicators. In July, annualized 2y-o-2y growth in property construction investment, new home completions and home under construction slowed notably to 6.6%, 4.0% and 6.0%, respectively, from 12.9%, 24.7% and 6.3% in June.
Nomura | Asia Special Report 24 August 2021
19
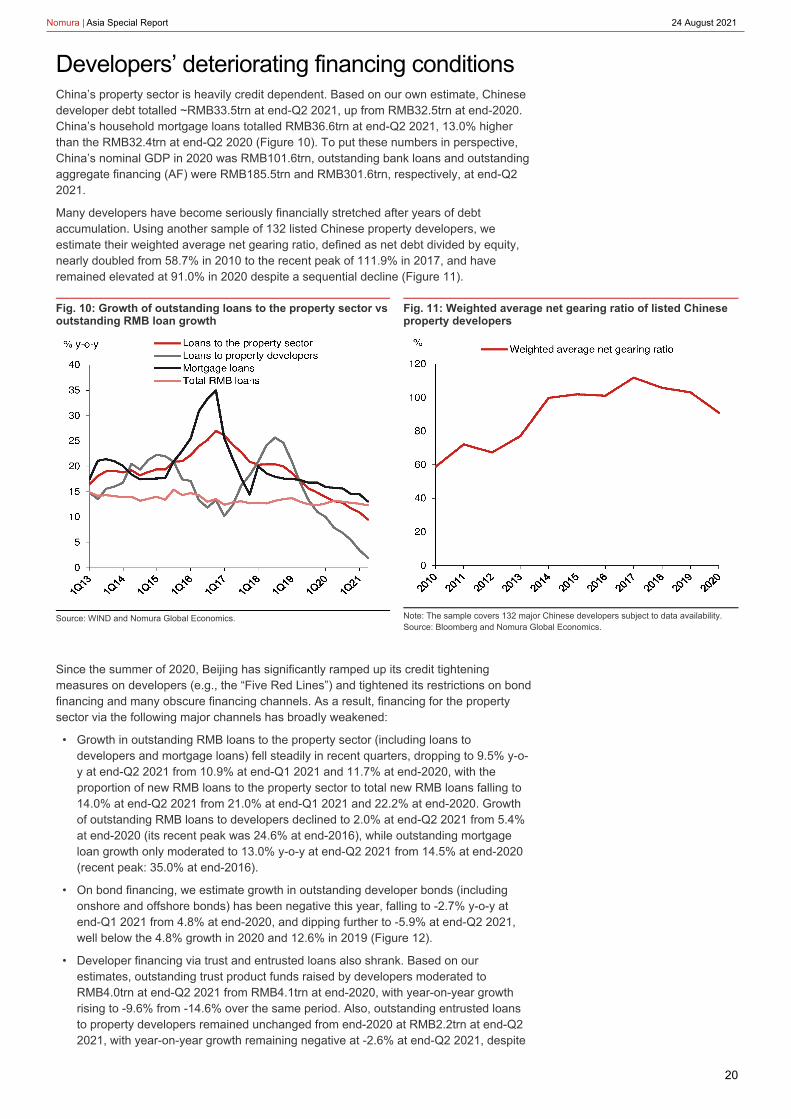
Developers’ deteriorating financing conditionsChina’s property sector is heavily credit dependent. Based on our own estimate, Chinese developer debt totalled ~RMB33.5trn at end-Q2 2021, up from RMB32.5trn at end-2020. China’s household mortgage loans totalled RMB36.6trn at end-Q2 2021, 13.0% higher than the RMB32.4trn at end-Q2 2020 (Figure 10). To put these numbers in perspective, China’s nominal GDP in 2020 was RMB101.6trn, outstanding bank loans and outstanding aggregate financing (AF) were RMB185.5trn and RMB301.6trn, respectively, at end-Q2 2021.
Many developers have become seriously financially stretched after years of debt accumulation. Using another sample of 132 listed Chinese property developers, we estimate their weighted average net gearing ratio, defined as net debt divided by equity, nearly doubled from 58.7% in 2010 to the recent peak of 111.9% in 2017, and have remained elevated at 91.0% in 2020 despite a sequential decline (Figure 11).
Fig. 10: Growth of outstanding loans to the property sector vs outstanding RMB loan growth
Source: WIND and Nomura Global Economics.
Fig. 11: Weighted average net gearing ratio of listed Chinese property developers
Note: The sample covers 132 major Chinese developers subject to data availability.Source: Bloomberg and Nomura Global Economics.
Since the summer of 2020, Beijing has significantly ramped up its credit tightening measures on developers (e.g., the “Five Red Lines”) and tightened its restrictions on bond financing and many obscure financing channels. As a result, financing for the property sector via the following major channels has broadly weakened:
Growth in outstanding RMB loans to the property sector (including loans to developers and mortgage loans) fell steadily in recent quarters, dropping to 9.5% y-o-y at end-Q2 2021 from 10.9% at end-Q1 2021 and 11.7% at end-2020, with the proportion of new RMB loans to the property sector to total new RMB loans falling to 14.0% at end-Q2 2021 from 21.0% at end-Q1 2021 and 22.2% at end-2020. Growth of outstanding RMB loans to developers declined to 2.0% at end-Q2 2021 from 5.4% at end-2020 (its recent peak was 24.6% at end-2016), while outstanding mortgage loan growth only moderated to 13.0% y-o-y at end-Q2 2021 from 14.5% at end-2020 (recent peak: 35.0% at end-2016).
•
On bond financing, we estimate growth in outstanding developer bonds (including onshore and offshore bonds) has been negative this year, falling to -2.7% y-o-y at end-Q1 2021 from 4.8% at end-2020, and dipping further to -5.9% at end-Q2 2021, well below the 4.8% growth in 2020 and 12.6% in 2019 (Figure 12).
•
Developer financing via trust and entrusted loans also shrank. Based on our estimates, outstanding trust product funds raised by developers moderated to RMB4.0trn at end-Q2 2021 from RMB4.1trn at end-2020, with year-on-year growth rising to -9.6% from -14.6% over the same period. Also, outstanding entrusted loans to property developers remained unchanged from end-2020 at RMB2.2trn at end-Q2 2021, with year-on-year growth remaining negative at -2.6% at end-Q2 2021, despite
•
Nomura | Asia Special Report 24 August 2021
20

an uptick from -3.3% at end-2020.
In our view, the tightening in financing conditions for the property sector may even be more significant than the above data suggest, as some stealthy funding channels (such as IOUs, the illegal use of business loans and commercial loans, and PSL) have also been under scrutiny. Developers extensively reliant on IOU financing, such as China Evergrande and Sichuan Languang Development, have especially felt the pinch from these measures.
Developers owed total debt of RMB33.5trn at end-Q2 2021As of end-Q2 2021, Chinese developers owed RMB33.5trn, which included RMB15.3trn from loans, RMB4.0trn from trust products, RMB2.2trn from entrusted loans, RMB2.0trn from onshore bonds, RMB1.4trn from offshore dollar bonds and RMB8.6trn from unspent money from new home presales (Figure 13; see more details from Box 1. A breakdown of property developer debt: A Q2 2021 update ). Due to the current round of tightening, year-on-year growth in developers’ total debt fell to 4.4% at end-Q2 2021 from 5.5% at end-2020, 11.0% at end-2019, and the recent peak of 25.7% at end-2017.
Fig. 12: Outstanding bond financing by property developers via onshore and offshore bond markets
Source: WIND and Nomura Global Economics.
Fig. 13: A breakdown of Chinese property developer debts by source
Source: WIND, PBoC, China Trustee Association, Bloomberg and Nomura Global Economics.
Nomura | Asia Special Report 24 August 2021
21

Box 1. A breakdown of property developer debt: A Q2 2021 updateBased on our estimates, as of end-Q2 2021, Chinese developers owed RMB33.5trn. We provide a breakdown of property developer debt at end-Q2 2021 as follows (Figure 14):
RMB loans: RMB15.3trn (accounting for 45.8% of total developer debt). Based on the PBoC’s data, property developers in China owed banks an aggregate RMB15.3trn in formal bank loans as of end-Q2 2021. However, year-on-year growth in outstanding RMB loans to developers (property-related RMB loans excluding mortgage loans) dropped to 2.0% at end-Q2 2021 from its recent peak of 24.6% at end-2018.
•
Trust product funds: RMB4.0trn (11.9%). The China Trustee Association’s official statistics put outstanding property trust product funds at RMB2.1trn, or 13.0% of the total RMB16.0trn in total trust product funds at end-Q2 2021. However, we believe this figure is likely to be understated, as some trust products that were invested in the property sector may not have disclosed the actual use of funds or intentionally made this information less transparent, to circumvent financial regulations. We estimate developers’ actual borrowings from trust companies may be around RMB4.0trn as of end-Q2 2021 (down from RMB4.1trn at end-2020), or around one-quarter of total proceeds from trust products.
•
Entrusted loans: RMB2.2trn (6.5%). For the outstanding RMB10.9trn in entrusted loans at end-Q2 2021, we conservatively estimate around 20%, or around RMB2.2trn, were borrowed by developers.
•
Bonds: RMB3.4trn (10.0%). Developers had RMB3.4trn in outstanding bonds at end-Q2 2021, with RMB2.0trn from onshore bonds and USD214bn (equivalent to RMB1.4trn) from offshore dollar bonds. The year-on-year growth in outstanding bonds issued by developers slumped to -5.9% at end-Q2 2021 from 4.8% at end-2020 (its recent peak: 21.3% at end-2017), with growth in outstanding onshore bonds and outstanding offshore dollar bonds (converted into RMB terms) both falling to -5.5% and -6.5%, respectively, from 5.1% and 4.3% over the same period.
•
Unspent money from new home presales: RMB8.6trn (25.7%). In addition to the numerous types of debt listed above, we believe there is a significant amount of hidden debt. Between January 2000 and June 2021, property developers sold 21.3bn sqm of new homes, but only completed construction of 15.8bn sqm. Assuming these undelivered homes were, on average, 50% complete at a construction cost of around RMB3129 per sqm, we estimate Chinese developers would need to spend around RMB8.6trn to complete the construction of homes they have sold but not yet completed, more than triple 2016’s level (RMB2.3trn). This RMB8.6trn of unspent money could be viewed as a short- to medium-term liquidity facility for developers under the presales mechanism.
•
There are definitely other obscure financing channels yet to be covered by the official statistics, such as IOU financing mentioned before, and their outstanding amounts are likely to be non-negligible, especially for a few property leaders such as Evergrande.
Fig. 14: Outstanding debts of property developers via different channels
H1 2021 2020 2019 2018 2017 2016 2015
RMB trn 15.3 15.1 14.4 12.9 10.4 8.8 7.7
% y-o-y 2.0 5.4 11.0 24.6 18.2 13.3 17.4
RMB trn 4.0 4.1 4.8 4.7 4.0 2.5 2.3
% y-o-y -9.6 -14.6 0.6 17.7 59.7 11.0 -1.7
RMB trn 2.2 2.2 2.3 2.5 2.8 2.6 2.2
% y-o-y -2.6 -3.3 -7.6 -11.5 6.0 20.7 17.2
RMB trn 2.0 2.0 1.9 1.9 1.7 1.5 0.7
% y-o-y -5.5 5.1 0.5 13.7 12.2 113.5 277.4
RMB trn 1.4 1.4 1.4 1.0 0.7 0.5 0.4
% y-o-y -6.5 4.3 35.2 37.9 48.8 18.3 14.1
RMB trn 8.6 7.6 6.1 4.6 3.2 2.3 1.5
% y-o-y 26.5 25.0 30.7 43.9 43.4 51.3 25.9
RMB trn 33.5 32.5 30.8 27.7 22.9 18.2 14.8
% y-o-y 4.4 5.5 11.0 21.3 25.7 22.8 18.4
Onshore bonds
Offshore dollar
bonds
Unspent money from
home presales
Total
Financing channels UnitDebts of property developers (period-end level)
RMB loans
Trust products
Entrusted loans
Source: WIND, PBoC, China Trustee Association, Bloomberg and Nomura Global Economics.
Nomura | Asia Special Report 24 August 2021
22

Refinancing pressures for developers remain a concernMaturing developer bonds (including both onshore and offshore bonds) peaked in Q1 this year at RMB363bn, with RMB260bn for onshore bonds and RMB103bn for offshore bonds, and these will likely remain elevated in coming quarters, despite a sequential decline (Figure 15). We forecast average quarterly maturing developer bonds of RMB202bn from Q3 2021 to Q4 2022, compared with RMB234bn in 2020 and RMB200bn in 2019. Refinancing pressure will likely be lower in onshore bond markets than offshore markets. We forecast a decline in average quarterly maturing bonds in onshore markets to RMB113bn during Q3 2021-Q4 2022 from RMB160bn in 2020 (Figure 16), against an increase in offshore markets to USD13.8bn from USD10.9bn over the same period (Figure 17).
Fig. 15: Property developer total bond financing: Issuance, repayment and net financing
Note: Total bond financing includes the financing via both onshore and offshore bond marketsSource: WIND, Bloomberg and Nomura Global Economics.
Fig. 16: Property developer onshore bond financing: Issuance, repayment and net financing
Source: WIND and Nomura Global Economics.
We see credit risks rising for the property sectorDespite the sequential decline in bond repayments, the risk of developer bonds defaulting has been rising, as evidenced by the defaults of China Fortune Land Development (CFLD) and Sichuan Languang Development, in addition to the negative news on China Evergrande.
Based on our estimates using deal-level bond data from WIND and Bloomberg , developer bond defaults – via onshore and offshore markets combined – rose sharply in recent quarters, from RMB5.5bn in Q4 2020 to RMB15.5bn, RMB15.5bn and RMB21.5bn, in Q1, Q2 and quarter-to-date Q3 2021 (as of mid-August), respectively, while total corporate bond defaults rose from RMB99.3bn in Q4 2020 to RMB105.8bn in Q1 2021, and then dropped to RMB54.4bn in Q2 2021 and RMB45.7bn in quarter-to-date Q3 (Figure 18). As a result, the share of developer bond defaults in total defaults surged from 5.5% in Q4 2020 to 47.1% in quarter-to-date Q3 2021; on an annual basis, the ratio jumped from 4.4% in 2019 to 10.9% in 2020 and 25.5% in year-to-date 2021.
Because of worsening prospects in China’s property sector, we expect credit defaults by developers to increase, with risks skewed more to bonds issued by small and medium-sized developers with heavy exposure to low-tier cities in inland and North China.
Nomura | Asia Special Report 24 August 2021
23

Fig. 17: Property developer offshore corporate dollar bond (OCDB) financing: Issuance, repayment and net financing
Source: Bloomberg and Nomura Global Economics.
Fig. 18: Total corporate bond defaults and the share of those by property developers
Note: Total corporate bond defaults include defaults in both onshore and offshore bond markets. The 3Q21 print refers to data available as of mid-August 2021.Source: WIND, Bloomberg and Nomura Global Economics.
Nomura | Asia Special Report 24 August 2021
24

We expect the property sector to be the largest drag on growth in H2China’s property sector is the single largest contributor to China’s GDP. Based on 2020 data, we estimate the property sector contributed 12.3% to China’s GDP under our narrow measure, and 16.4% under our broad measure. If we add government land sales revenues paid by developers, the property sector's total contribution amounts to around a quarter of China’s GDP (see Appendix 1: The “systemically important” property sector for more details on our estimates). The property sector’s importance to government revenue is even more significant; we estimate the property sector contributed 24.0% to total tax revenue in 2020 and, on a broader basis, it contributed 44.0% to total government revenue.
Amid the stringent “Five Red Lines”, tighter policies by local governments on the housing sector (see China: Property-related policies have been tightened further, 25 July 2021) and the notable weakness in leading indicators (such as land sales volume), we believe a sharp downturn in the property sector in H2 is inevitable. On the direct impact, we focus on new home sales volumes and property construction investment (in real terms), which account for 5% and 11% of China’s GDP, respectively, based on our estimates.
For new home sales volumes, we expect annualized 2y-o-2y growth to drop from 8.1% in H1 to -3.0% in H2, taking year-on-year growth from 27.7% in H1 to -15.5% in H2. As a result, the 43.2pp drop in new home sales volumes could reduce China’s real GDP growth by around 2.2pp in H2 from H1. Note, due to the extremely low base, year-on-year real GDP growth was 12.7% in H1.
For property construction investment, we expect annualized 2y-o-2y growth in nominal terms to drop from 9.2% in H1 to 4.5% in H2, taking year-on-year growth from 19.4% in H1 to -0.7% in H2. In view of rising raw material prices, we estimate a drop in real property construction investment year-on-year growth from H1 to H2 of around 20pp, which could reduce China’s real GDP growth by another 2.2pp (= 20pp * 11%) in H2 from H1.
Together, the slowdown in new home sales volumes and property construction investment (in real terms) may directly weigh on real GDP growth in H2 from H1 by a combined 4.4pp. As we expect China’s real GDP growth to slow by 8.0pp to 4.7% y-o-y in H2 from 12.7% in H1, more than half (~55%) of this slowdown would be a result of the cooling property sector. However, if we consider the indirect impact from upstream and downstream sectors for the property sector, including the production and sale of construction materials, furniture and home appliances, and financial services for property-related loans (e.g., mortgage and other corporate loans for property investment), the drag on overall growth may even be larger.
The void left by the property sector is just too large to be filledA review of China’s major economic indicators suggests that its economic recovery in Q2 from Q1 this year was broadly based across major demand-side factors. Specifically, annualized 2y-o-2y growth in exports, retail sales, property construction investment, manufacturing investment and infrastructure investment rose to 14.4%, 4.6%, 9.8%, 4.6% and 3.7% in Q2 (Figure 19), respectively, from 13.4%, 4.1%, 8.3%, -1.5% and 3.0% in Q1. However, as we expect the delta variant, slowing exports, property tightening and the campaign to reduce carbon emissions to result in a notable slowdown in H2, manufacturing and infrastructure investment have become the main potential offsets to the upcoming slowdown in H2.
Manufacturing investment may remain solid but will still likely face headwindsAs one of the key elements of the dual circulation strategy (see Asia Special Report - China’s dual circulation strategy: A tale of chips versus homes, 20 October 2020), Beijing aims to divert more funding away from the property sector and into high-end manufacturing, and this is also a major reason why the expected sharp downturn in the property sector appears inevitable. We have seen increasing evidence showing more funding is being diverted into the manufacturing sector. According to the PBoC, growth in outstanding medium- and long-term bank loans to the manufacturing sector reached 41.6% y-o-y at end-June 2021, 16.9pp above the pace at end-June 2020, which marked the fourth consecutive month of an above 40% pace. By contrast, growth in outstanding bank loans to the property sector had already dropped to 9.5% y-o-y at end-June, its
Nomura | Asia Special Report 24 August 2021
25

slowest pace since Q4 2004, when the PBoC first released the series.
However, the void left by the property sector is just too large to be filled. Despite the rapid expansion in recent months, the share of outstanding medium- and long-term bank loans to the manufacturing sector in total outstanding medium- and long-term bank loans and outstanding overall bank loans remained quite low at 3.2% and 4.8%, respectively, at end-February 2021 (latest data available). By contrast, the share of outstanding bank loans to the property sector in outstanding overall bank loans remained elevated at 28.4% at end-March and 28.0% at end-June 2021 (latest data available). Therefore, it is unlikely manufacturing investment will be able to fill the void left by the cooling property sector in a relatively short period.
Other headwindsAmid rising raw material prices, annualized 2y-o-2y growth in industrial profits surged to 20.6% in H1 this year, which should be positive for manufacturing investment. However, the surge in industrial profit growth was mainly concentrated in upstream sectors, including mining/processing of ferrous and non-ferrous metals and related raw materials, as well as the manufacture of chemical products, while profit growth in downstream industries and small businesses has been somewhat squeezed. The mixed impact from rising raw material prices on upstream and downstream sectors may limit the potential upside in manufacturing investment.
Second, as we expect exports to weaken notably in H2, slowing exports bodes poorly for manufacturing investment, especially in the export-oriented manufacturing sector. Lastly, US-China relations remain quite uncertain. The US government has continued to implement bans and other restrictions on the export of high-tech products (especially chips) to China amid trade tensions. Manufacturers may remain cautious about their investment plans.
The upside for infrastructure investment appeared limitedThe funding of infrastructure investment is derived mainly from three sources: fiscal expenditure, government bond issuance and local government revenues from land sales. With slower-than-usual fiscal expenditure and government bond issuance, annualized 2y-o-2y growth in infrastructure investment remained mediocre over the first seven months of this year at 2.7%, mainly supported by still-strong local government revenue from land sales (with annualized 2y-o-2y growth of 12.8% over the same period). As we expect Beijing to fully tap the remaining RMB4.3trn of its net bond financing quota for the final five months of this year and fiscal expenditure to speed up in coming months to counter the expected slowdown, infrastructure investment may increase in coming months. However, as we expect property market conditions to worsen notably, a likely slump in local government revenue from land sales suggests the potential upside for infrastructure investment is likely to be limited. In fact, the sharp slowdown in volume sales of capital durable goods in recent months, including excavators (Figure 20) and heavy-duty trucks, also bodes poorly for infrastructure investment in H2.
Fig. 19: Annualized 2y-o-2y growth of major activity indicators
Source: WIND and Nomura Global Economics.
Fig. 20: Growth in excavator sales volume: y-o-y and annualized 2y-o-2y
Source: WIND and Nomura Global Economics.
Nomura | Asia Special Report 24 August 2021
26

Nomura | Asia Special Report 24 August 2021
27

Appendix 1: The “systemically important” property sectorChina’s property sector has already become a huge sector that is “systemically important” to the overall economy and financial system. Based on our estimates using 2020 data, the property sector contributed 12.3% to China’s GDP under our narrow measure, and 16.2% under our broad measure. Its importance to government revenue is even more significant. We estimate the property sector contributed 24.0% to total tax revenue in 2020, and on a broader basis, it contributed 44.0% to total government revenue (TGR), thanks to its sizeable contribution to government revenue from land sales.
The property sector contributed 16.4% to China’s GDP in 2020According to the National Bureau of Statistics (NBS), headline nominal GDP from the property-related services sector was RMB7.5trn in 2020, which equates to about 7.3% (= RMB7.5trn / RMB101.6trn) of headline GDP. However, this number merely captures the value-added by developers and other providers of property-related services. The property sector's actual contribution is likely to be much larger, as it is closely linked with construction, production of raw materials, retail sales and financial services. We provide both narrow and broader measures of the total value-added by the property sector.
Narrow measure: Headline value-added from the property sector, plus value added from the property-related construction sector.
•
Broad measure: In addition to net property investment and sales, our broad measure includes value-added in related sectors, such as the production and sale of construction materials, furniture and home appliances, and financial services for property-related loans (e.g., mortgage and other corporate loans for property investment) and other products.
•
Our narrow measure suggests the property sector contributed 12.3% to GDPBased on 2020 data, the value-added from the construction sector was RMB7.3trn (7.2% of nominal GDP), with around 70% coming from property-related construction, instalment and decoration. We estimate the share of property-related construction in total construction using sectoral output data. In addition to property-related construction, infrastructure-related construction, such as roads, railways, mines and pipelines, makes up the remainder. Thus, based on our narrow measure, the property sector contributed 12.3% to headline nominal GDP, with 7.3% from property-related services and 5.0% (=7.2% * 70%) from property-related construction. The 12.3% estimate for 2020 is higher than our earlier estimate of 12.1% for 2019 (see Asia Special Report - China’s dual circulation strategy: A tale of chips versus homes, 20 October 2020) and 11.2% for 2017 (see China’s property sector: Winter is coming, 15 November 2018).
… and our broad measure suggests the property sector contributed 16.4% to GDPThe three sectors closely related to the property sector – home appliances, furniture, and construction & decoration materials – contributed 6.3%, 1.2% and 1.3%, respectively, to overall retail sales by retailers above the designated size based on 2020 data. Conservatively assuming 50% of these sales were driven by home sales, we estimate the property sector contributed 4.4% to total consumption. As private consumption accounted for 37.7% of GDP in 2020 based on the expenditure approach, we estimate the property sector contributed 1.7% (=4.4% * 37.7%) to China’s headline GDP via its upstream and downstream sectors (i.e., home appliances, furniture, and construction & decoration materials).
On property-related financial services, we assume the property sector contributed 28.4% to value-added in the financial services sector in 2020, based on the share of outstanding property-related loans (including mortgage loans and loans to developers) in total loans. Because the financial services sector accounted for 8.3% of nominal GDP in 2020, we estimate the contribution from the property-related financial services to GDP was 2.4% in 2020 (=8.3% * 28.4%).
In sum, our broad measure suggests the property sector contributed 16.4% to overall GDP, with 7.3% from property-related services, 5.0% from property-related construction, 1.7% from its upstream and downstream sectors and 2.4% from property-related financial services. Its overall contribution to GDP in 2020 (16.4%) was even higher than in 2019 (16.2%) and in 2017 (15.5%).
24.0% of tax revenues came from the property sector
Nomura | Asia Special Report 24 August 2021
28

To estimate the property sector’s contribution to tax revenue, we first select nine types of taxes that have a close relationship with the sector and assign them to one of two categories (i.e., property sector-specific taxes, and general taxes), depending on whether the tax is paid mainly by property-related entities (developers, holders and buyers).
More specifically, property sector-specific taxes include land appreciation taxes, farmland occupation taxes, urban and township land use taxes, property taxes and deed taxes, and we assume all revenues are paid by property-related entities, while general taxes refer to those that are broadly applicable to all sectors, including corporate income taxes, individual income taxes, value-added taxes and stamp taxes. We also assume the property sector’s contribution to these tax categories is proportional to their contribution to headline GDP (16.4% based on our broad measure). We estimate the property sector contributed 24.0% to overall tax revenues in 2020 (Figure 21), higher than the 23.7% in 2019 and 22.4% in 2017.
Fig. 21: Contribution from the property sector to tax revenues in 2020
(RMB bn) (%) (RMB bn) (%)
Land appreciation tax 646.8 100.0 646.8 4.2
Farmland occupation tax 125.8 100.0 125.8 0.8
Urban and township land use tax 205.8 100.0 205.8 1.3
Property tax 284.2 100.0 284.2 1.8
Deed tax 706.1 100.0 706.1 4.6
Corporate income tax 3642.4 16.4 597.4 3.8
Individual income tax 1156.8 16.4 189.7 1.2
VAT 5679.1 16.4 931.4 5.9
Stamp tax 308.7 16.4 50.6 0.3
Total 3737.8 24.0
Property-
sector-
specific tax
General tax
Category Tax type Revenues in 2020
Contribution from the
property sector to the
revenues of the specific tax
category
Revenues
contributed by the
property sector
Contribution from the
property sector to the
overall tax revenues
Source: WIND, MOF and Nomura Global Economics.
Notably, the property sector contributed to 44.0% of total government revenueLand sales directly contributed RMB8.4trn in revenue to local governments in 2020, equivalent to 30.8% of their total revenues, which we estimate at RMB27.3trn in 2020, including RMB10.0trn from fiscal revenue, RMB8.3trn from tax rebates and transfer payments from the central government, and the remaining RMB9.0trn from revenue from local government managed funds (Figure 22). If we define revenue from fiscal budget and government managed funds (including both central and local government managed funds) as total government revenue (TGR), the property sector contributed 44.0% to TGR in 2020, based on our estimates (Figure 23). This share should be much higher for local governments, as all revenue from land sales belongs to local government managed funds.
Nomura | Asia Special Report 24 August 2021
29

Fig. 22: A breakdown of key funding sources for local governments
Source: WIND and Nomura Global Economics.
Fig. 23: The breakdown of total government revenue in 2020: property-related and non-property-related
Source: WIND and Nomura Global Economics.
Nomura | Asia Special Report 24 August 2021
30

Glossary
AF: Aggregate financing
AMAC: Asset Management Association of China
AUM: Asset under management
CBIRC: China Banking and Insurance Regulatory Commission
CCP: Chinese Communist Party
CDB: China Development Bank
CMS: Concentration management system
CSRC: China Securities Regulatory Commission
DCS: Dual Circulation Strategy
FAI: Fixed asset investment
IOU: I owe you; a written promise to pay back money owed
IP: Industrial production
K-12: Kindergarten through twelfth grade
LGFV: Local government financing vehicle
MOHURD: Ministry of Housing and Urban-Rural Development
NAFMII: National Association of Financial Market Institutional Investors
NBS: National Bureau of Statistics
NDRC: National Development and Reform Commission
NSCA: Non-standard credit asset
OCDB: Offshore corporate dollar bond
OTC: Over-the-counter
PBoC: People’s Bank of China
PSL: Pledged supplementary lending
SOE: State-owned enterprise
SRP: Shantytown renovation program
TGR: Total government revenue
Nomura | Asia Special Report 24 August 2021
31
Appendix A-1
Analyst Certification
I, Ting Lu, hereby certify (1) that the views expressed in this Research report accurately reflect my personal views about any or all of the subject securities or issuers referred to in this Research report, (2) no part of my compensation was, is or will be directly or indirectly related to the specific recommendations or views expressed in this Research report and (3) no part of my compensation is tied to any specific investment banking transactions performed by Nomura Securities International, Inc., Nomura International plc or any other Nomura Group company.
Important Disclosures
Online availability of research and conflict-of-interest disclosuresNomura Group research is available on www.nomuranow.com/research, Bloomberg, Capital IQ, Factset, Reuters and ThomsonOne.Important disclosures may be read at http://go.nomuranow.com/research/globalresearchportal/pages/disclosures/disclosures.aspx or requested from Nomura Securities International, Inc. If you have any difficulties with the website, please email [email protected] for help. The analysts responsible for preparing this report have received compensation based upon various factors including the firm's total revenues, a portion of which is generated by Investment Banking activities. Unless otherwise noted, the non-US analysts listed at the front of this report are not registered/qualified as research analysts under FINRA rules, may not be associated persons of NSI, and may not be subject to FINRA Rule 2241 restrictions on communications with covered companies, public appearances, and trading securities held by a research analyst account. Nomura Global Financial Products Inc. (NGFP) Nomura Derivative Products Inc. (NDP) and Nomura International plc. (NIplc) are registered with the Commodities Futures Trading Commission and the National Futures Association (NFA) as swap dealers. NGFP, NDPI, and NIplc are generally engaged in the trading of swaps and other derivative products, any of which may be the subject of this report. DisclaimersThis publication contains material that has been prepared by the Nomura Group entity identified on page 1 and, if applicable, with the contributions of one or more Nomura Group entities whose employees and their respective affiliations are specified on page 1 or identified elsewhere in this publication. The term "Nomura Group" used herein refers to Nomura Holdings, Inc. and its affiliates and subsidiaries including: (a) Nomura Securities Co., Ltd. ('NSC') Tokyo, Japan, (b) Nomura Financial Products Europe GmbH (‘NFPE’), Germany, (c) Nomura International plc ('NIplc'), UK, (d) Nomura Securities International, Inc. ('NSI'), New York, US, (e) Nomura International (Hong Kong) Ltd. (‘NIHK’), Hong Kong, (f) Nomura Financial Investment (Korea) Co., Ltd. (‘NFIK’), Korea (Information on Nomura analysts registered with the Korea Financial Investment Association ('KOFIA') can be found on the KOFIA Intranet at http://dis.kofia.or.kr, (g) Nomura Singapore Ltd. (‘NSL’), Singapore (Registration number 197201440E, regulated by the Monetary Authority of Singapore) (h) Nomura Australia Ltd. (‘NAL’), Australia (ABN 48 003 032 513), regulated by the Australian Securities and Investment Commission ('ASIC') and holder of an Australian financial services licence number 246412, (i) Nomura Securities Malaysia Sdn. Bhd. (‘NSM’), Malaysia, (j) NIHK, Taipei Branch (‘NITB’), Taiwan, (k) Nomura Financial Advisory and Securities (India) Private Limited (‘NFASL’), Mumbai, India (Registered Address: Ceejay House, Level 11, Plot F, Shivsagar Estate, Dr. Annie Besant Road, Worli, Mumbai- 400 018, India; Tel: 91 22 4037 4037, Fax: 91 22 4037 4111; CIN No: U74140MH2007PTC169116, SEBI Registration No. for Stock Broking activities : INZ000255633; SEBI Registration No. for Merchant Banking : INM000011419; SEBI Registration No. for Research: INH000001014. ‘CNS Thailand’ next to an analyst’s name on the front page of a research report indicates that the analyst is employed by Capital Nomura Securities Public Company Limited (‘CNS’) to provide research assistance services to NSL under an agreement between CNS and NSL. ‘NSFSPL’ next to an employee’s name on the front page of a research report indicates that the individual is employed by Nomura Structured Finance Services Private Limited to provide assistance to certain Nomura entities under inter-company agreements. 'Verdhana' next to an individual's name on the front page of a research report indicates that the individual is employed by PT Verdhana Sekuritas Indonesia ('Verdhana') to provide research assistance to NIHK under a research partnership agreement and neither Verdhana nor such individual is licensed outside of Indonesia. For the avoidance of doubt and for the purpose of disclosure, Nomura Orient International Securities Co., Ltd (“NOI”), a joint venture amongst Nomura Group, Orient International (Holding) Co., Ltd and Shanghai Huangpu Investment Holding (Group) Co., Ltd is excluded from the definition of Nomura Group. An individual name printed next to NOI on the front page of a research report indicates that individual is employed by NOI to provide research assistance to NIHK under a research partnership agreement and neither NOI or such individual is licensed outside of Mainland China, PRC.THIS MATERIAL IS: (I) FOR YOUR PRIVATE INFORMATION, AND WE ARE NOT SOLICITING ANY ACTION BASED UPON IT; (II) NOT TO BE CONSTRUED AS AN OFFER TO SELL OR A SOLICITATION OF AN OFFER TO BUY ANY SECURITIES IN ANY JURISDICTION WHERE SUCH OFFER OR SOLICITATION WOULD BE ILLEGAL; AND (III) OTHER THAN DISCLOSURES RELATING TO THE NOMURA GROUP, BASED UPON INFORMATION FROM SOURCES THAT WE CONSIDER RELIABLE, BUT HAS NOT BEEN INDEPENDENTLY VERIFIED BY NOMURA GROUP.Other than disclosures relating to the Nomura Group, the Nomura Group does not warrant, represent or undertake, express or implied, that the document is fair, accurate, complete, correct, reliable or fit for any particular purpose or merchantable, and to the maximum extent permissible by law and/or regulation, does not accept liability (in negligence or otherwise, and in whole or in part) for any act (or decision not to act) resulting from use of this document and related data. To the maximum extent permissible by law and/or regulation, all warranties and other assurances by the Nomura Group are hereby excluded and the Nomura Group shall have no liability (in negligence or otherwise, and in whole or in part) for
Nomura | Asia Special Report 24 August 2021
32

any loss howsoever arising from the use, misuse, or distribution of this material or the information contained in this material or otherwise arising in connection therewith.Opinions or estimates expressed are current opinions as of the original publication date appearing on this material and the information, including the opinions and estimates contained herein, are subject to change without notice. The Nomura Group, however, expressly disclaims any obligation, and therefore is under no duty, to update or revise this document. Any comments or statements made herein are those of the author(s) and may differ from views held by other parties within Nomura Group. Clients should consider whether any advice or recommendation in this report is suitable for their particular circumstances and, if appropriate, seek professional advice, including tax advice. The Nomura Group does not provide tax advice.The Nomura Group, and/or its officers, directors, employees and affiliates, may, to the extent permitted by applicable law and/or regulation, deal as principal, agent, or otherwise, or have long or short positions in, or buy or sell, the securities, commodities or instruments, or options or other derivative instruments based thereon, of issuers or securities mentioned herein. The Nomura Group companies may also act as market maker or liquidity provider (within the meaning of applicable regulations in the UK) in the financial instruments of the issuer. Where the activity of market maker is carried out in accordance with the definition given to it by specific laws and regulations of the US or other jurisdictions, this will be separately disclosed within the specific issuer disclosures.This document may contain information obtained from third parties, including, but not limited to, ratings from credit ratings agencies such as Standard & Poor’s. The Nomura Group hereby expressly disclaims all representations, warranties or undertakings of originality, fairness, accuracy, completeness, correctness, merchantability or fitness for a particular purpose with respect to any of the information obtained from third parties contained in this material or otherwise arising in connection therewith, and shall not be liable (in negligence or otherwise, and in whole or in part) for any direct, indirect, incidental, exemplary, compensatory, punitive, special or consequential damages, costs, expenses, legal fees, or losses (including lost income or profits and opportunity costs) in connection with any use or misuse of any of the information obtained from third parties contained in this material or otherwise arising in connection therewith. Reproduction and distribution of third-party content in any form is prohibited except with the prior written permission of the related third-party. Third-party content providers do not, express or implied, guarantee the fairness, accuracy, completeness, correctness, timeliness or availability of any information, including ratings, and are not in any way responsible for any errors or omissions (negligent or otherwise), regardless of the cause, or for the results obtained from the use or misuse of such content. Third-party content providers give no express or implied warranties, including, but not limited to, any warranties of merchantability or fitness for a particular purpose or use. Third-party content providers shall not be liable (in negligence or otherwise, and in whole or in part) for any direct, indirect, incidental, exemplary, compensatory, punitive, special or consequential damages, costs, expenses, legal fees, or losses (including lost income or profits and opportunity costs) in connection with any use or misuse of their content, including ratings. Credit ratings are statements of opinions and are not statements of fact or recommendations to purchase hold or sell securities. They do not address the suitability of securities or the suitability of securities for investment purposes, and should not be relied on as investment advice.Any MSCI sourced information in this document is the exclusive property of MSCI Inc. (‘MSCI’). Without prior written permission of MSCI, this information and any other MSCI intellectual property may not be duplicated, reproduced, re-disseminated, redistributed or used, in whole or in part, for any purpose whatsoever, including creating any financial products and any indices. This information is provided on an "as is" basis. The user assumes the entire risk of any use made of this information. MSCI, its affiliates and any third party involved in, or related to, computing or compiling the information hereby expressly disclaim all representations, warranties or undertakings of originality, fairness, accuracy, completeness, correctness, merchantability or fitness for a particular purpose with respect to any of this material or the information contained in this material or otherwise arising in connection therewith. Without limiting any of the foregoing, in no event shall MSCI, any of its affiliates or any third party involved in, or related to, computing or compiling the information have any liability (in negligence or otherwise, and in whole or in part) for any damages of any kind. MSCI and the MSCI indexes are services marks of MSCI and its affiliates.The intellectual property rights and any other rights, in Russell/Nomura Japan Equity Index belong to Nomura Securities Co., Ltd. ("Nomura") and Frank Russell Company ("Russell"). Nomura and Russell do not guarantee fairness, accuracy, completeness, correctness, reliability, usefulness, marketability, merchantability or fitness of the Index, and do not account for business activities or services that any index user and/or its affiliates undertakes with the use of the Index.Investors should consider this document as only a single factor in making their investment decision and, as such, the report should not be viewed as identifying or suggesting all risks, direct or indirect, that may be associated with any investment decision. Nomura Group produces a number of different types of research product including, among others, fundamental analysis and quantitative analysis; recommendations contained in one type of research product may differ from recommendations contained in other types of research product, whether as a result of differing time horizons, methodologies or otherwise. The Nomura Group publishes research product in a number of different ways including the posting of product on the Nomura Group portals and/or distribution directly to clients. Different groups of clients may receive different products and services from the research department depending on their individual requirements.Figures presented herein may refer to past performance or simulations based on past performance which are not reliable indicators of future or likely performance. Where the information contains an expectation, projection or indication of future performance and business prospects, such forecasts may not be a reliable indicator of future or likely performance. Moreover, simulations are based on models and simplifying assumptions which may oversimplify and not reflect the future distribution of returns. Any figure, strategy or index created and published for illustrative purposes within this document is not intended for “use” as a “benchmark” as defined by the European Benchmark Regulation.Certain securities are subject to fluctuations in exchange rates that could have an adverse effect on the value or price of, or income derived from, the investment.With respect to Fixed Income Research: Recommendations fall into two categories: tactical, which typically last up to three months; or strategic, which typically last from 6-12 months. However, trade recommendations may be reviewed at any time as circumstances change. ‘Stop loss’ levels for trades are also provided; which, if hit, closes the trade recommendation automatically. Prices and yields shown in recommendations are taken at the time of submission for publication and are based on either indicative Bloomberg, Reuters or Nomura prices and yields at that time. The prices and yields shown are not necessarily those at which the trade recommendation can be implemented.The securities described herein may not have been registered under the US Securities Act of 1933 (the ‘1933 Act’), and, in such case, may not be offered or sold in the US or to US persons unless they have been registered under the 1933 Act, or except in compliance with an exemption
Nomura | Asia Special Report 24 August 2021
33
from the registration requirements of the 1933 Act. Unless governing law permits otherwise, any transaction should be executed via a Nomura entity in your home jurisdiction.This document has been approved for distribution in the UK as investment research by NIplc. NIplc is authorised by the Prudential Regulation Authority and regulated by the Financial Conduct Authority and the Prudential Regulation Authority. NIplc is a member of the London Stock Exchange. This document does not constitute a personal recommendation within the meaning of applicable regulations in the UK, or take into account the particular investment objectives, financial situations, or needs of individual investors. This document is intended only for investors who are 'eligible counterparties' or 'professional clients' for the purposes of applicable regulations in the UK, and may not, therefore, be redistributed to persons who are 'retail clients' for such purposes.This document has been approved for distribution in the European Economic Area as investment research by Nomura Financial Products Europe GmbH (“NFPE”). NFPE is a company organized as a limited liability company under German law registered in the Commercial Register of the Court of Frankfurt/Main under HRB 110223. NFPE is authorized and regulated by the German Federal Financial Supervisory Authority (BaFin).This document has been approved by NIHK, which is regulated by the Hong Kong Securities and Futures Commission, for distribution in Hong Kong by NIHK. This document is intended only for investors who are 'professional investors' for the purposes of applicable regulations in Hong Kong and may not, therefore, be redistributed to persons who are not 'professional investors' for such purposes.This document has been approved for distribution in Australia by NAL, which is authorized and regulated in Australia by the ASIC.This document has also been approved for distribution in Malaysia by NSM.In Singapore, this document has been distributed by NSL, an exempt financial adviser as defined under the Financial Advisers Act (Chapter 110), among other things, and regulated by the Monetary Authority of Singapore. NSL may distribute this document produced by its foreign affiliates pursuant to an arrangement under Regulation 32C of the Financial Advisers Regulations. Where the recipient of this document is not an accredited, expert or institutional investor as defined by the Securities and Futures Act (Chapter 289), NSL accepts legal responsibility for the contents of this document in respect of such recipient only to the extent required by law. Recipients of this document in Singapore should contact NSL in respect of matters arising from, or in connection with, this document. THIS DOCUMENT IS INTENDED FOR GENERAL CIRCULATION. IT DOES NOT TAKE INTO ACCOUNT THE SPECIFIC INVESTMENT OBJECTIVES, FINANCIAL SITUATION OR PARTICULAR NEEDS OF ANY PARTICULAR PERSON. RECIPIENTS SHOULD TAKE INTO ACCOUNT THEIR SPECIFIC INVESTMENT OBJECTIVES, FINANCIAL SITUATION OR PARTICULAR NEEDS BEFORE MAKING A COMMITMENT TO PURCHASE ANY SECURITIES, INCLUDING SEEKING ADVICE FROM AN INDEPENDENT FINANCIAL ADVISER REGARDING THE SUITABILITY OF THE INVESTMENT, UNDER A SEPARATE ENGAGEMENT, AS THE RECIPIENT DEEMS FIT.Unless prohibited by the provisions of Regulation S of the 1933 Act, this material is distributed in the US, by NSI, a US-registered broker-dealer, which accepts responsibility for its contents in accordance with the provisions of Rule 15a-6, under the US Securities Exchange Act of 1934. The entity that prepared this document permits its separately operated affiliates within the Nomura Group to make copies of such documents available to their clients.This document has not been approved for distribution to persons other than ‘Authorised Persons’, ‘Exempt Persons’ or ‘Institutions’ (as defined by the Capital Markets Authority) in the Kingdom of Saudi Arabia (‘Saudi Arabia’) or a ’Market Counterparty’ or a 'Professional Client' (as defined by the Dubai Financial Services Authority) in the United Arab Emirates (‘UAE’) or a ‘Market Counterparty’ or a ‘Business Customer’ (as defined by the Qatar Financial Centre Regulatory Authority) in the State of Qatar (‘Qatar’) by Nomura Saudi Arabia, NIplc or any other member of the Nomura Group, as the case may be. Neither this document nor any copy thereof may be taken or transmitted or distributed, directly or indirectly, by any person other than those authorised to do so into Saudi Arabia or in the UAE or in Qatar or to any person other than ‘Authorised Persons’, ‘Exempt Persons’ or ‘Institutions’ located in Saudi Arabia or a ’Market Counterparty’ or a 'Professional Client' in the UAE or a ‘Market Counterparty’ or a ‘Business Customer’ in Qatar. Any failure to comply with these restrictions may constitute a violation of the laws of the UAE or Saudi Arabia or Qatar.For report with reference of TAIWAN public companies or authored by Taiwan based research analyst:THIS DOCUMENT IS SOLELY FOR REFERENCE ONLY. You should independently evaluate the investment risks and are solely responsible for your investment decisions. NO PORTION OF THE REPORT MAY BE REPRODUCED OR QUOTED BY THE PRESS OR ANY OTHER PERSON WITHOUT WRITTEN AUTHORIZATION FROM NOMURA GROUP. Pursuant to Operational Regulations Governing Securities Firms Recommending Trades in Securities to Customers and/or other applicable laws or regulations in Taiwan, you are prohibited to provide the reports to others (including but not limited to related parties, affiliated companies and any other third parties) or engage in any activities in connection with the reports which may involve conflicts of interests. INFORMATION ON SECURITIES / INSTRUMENTS NOT EXECUTABLE BY NOMURA INTERNATIONAL (HONG KONG) LTD., TAIPEI BRANCH IS FOR INFORMATIONAL PURPOSES ONLY AND IS NOT BE CONSTRUED AS A RECOMMENDATION OR A SOLICITATION TO TRADE IN SUCH SECURITIES / INSTRUMENTS.This material may not be distributed in Indonesia or passed on within the territory of the Republic of Indonesia or to persons who are Indonesian citizens (wherever they are domiciled or located) or entities of or residents in Indonesia in a manner which constitutes a public offering under the laws of the Republic of Indonesia. The securities mentioned in this document may not be offered or sold in Indonesia or to persons who are citizens of Indonesia (wherever they are domiciled or located) or entities of or residents in Indonesia in a manner which constitutes a public offering under the laws of the Republic of Indonesia.This document is prepared by Nomura Group or its subsidiary or affiliate (collectively, “Offshore Issuers”) that is not licensed in the People’s Republic of China (“PRC”, excluding Hong Kong, Macau and Taiwan, for the purpose of this document) to provide securities research and this research report is not approved or intended to be circulated in the PRC. The A-share related analysis (if any) is not produced for any persons located or incorporated in the PRC. The recipients should not rely on any information contained in the research report in making investment decisions and Offshore Issuers take no responsibility in this regard.NO PART OF THIS MATERIAL MAY BE (I) COPIED, PHOTOCOPIED, REPRODUCED OR DUPLICATED IN ANY FORM, BY ANY MEANS; OR (II) REDISSEMINATED, REPUBLISHED OR REDISTRIBUTED WITHOUT THE PRIOR WRITTEN CONSENT OF A MEMBER OF THE NOMURA GROUP. If this document has been distributed by electronic transmission, such as e-mail, then such transmission cannot be guaranteed to be secure or error-free as information could be intercepted, corrupted, lost, destroyed, arrive late or incomplete, or contain
Nomura | Asia Special Report 24 August 2021
34

viruses. The sender therefore does not accept liability (in negligence or otherwise, and in whole or in part) for any errors or omissions in the contents of this document, which may arise as a result of electronic transmission. If verification is required, please request a hard-copy version. Nomura Securities Co., Ltd. Financial instruments firm registered with the Kanto Local Finance Bureau (registration No. 142)Member associations: Japan Securities Dealers Association; Japan Investment Advisers Association; The Financial Futures Association of Japan; and Type II Financial Instruments Firms Association. The Nomura Group manages conflicts with respect to the production of research through its compliance policies and procedures (including, but not limited to, Conflicts of Interest, Chinese Wall and Confidentiality policies) as well as through the maintenance of Chinese Walls and employee training.Additional information regarding the methodologies or models used in the production of any investment recommendations contained within this document is available upon request by contacting the Research Analysts of Nomura listed on the front page. Disclosures information is available upon request and disclosure information is available at the Nomura Disclosure web page: http://go.nomuranow.com/research/globalresearchportal/pages/disclosures/disclosures.aspxCopyright © 2021 Nomura International (Hong Kong) Ltd. All rights reserved.
Nomura | Asia Special Report 24 August 2021
35